Exploring Methods for Predicting Important Utterances Contributing to Meeting Summarization

Faculty of Science and Technology, Seikei University, 3-3-1, Kichijoji Kitamachi, Musashino Shi, Tokyo 180-8633, Japan
*
Author to whom correspondence should be addressed.
Multimodal Technol. Interact. 2019, 3(3), 50; https://doi.org/10.3390/mti3030050
Submission received: 28 May 2019
/
Revised: 3 July 2019
/
Accepted: 4 July 2019
/
Published: 6 July 2019
(This article belongs to the Special Issue Multimodal Conversational Interaction and Interfaces)
Abstract
:Meeting minutes are useful, but creating meeting summaries are a time consuming task. Aiming at supporting such task, this paper proposes prediction models for important utterances that should be included in the meeting summary by using multimodal and multiparty features. We will tackle this issue from two approaches: Handcrafted feature models and deep neural network models. The best handcrafted feature model achieved 0.707 in F-measure, and the best deep-learning based verbal and nonverbal model (V-NV model) achieved 0.827 in F-measure. Based on the V-NV model, we implemented a meeting browser, and conducted a user study. The results showed that the proposed meeting browser better contributes to the understanding of the content of the discussion and the participant roles in the discussion than the conventional text-based browser.
1. Introduction
Face-to-face meetings are a useful and effective way for a group of people to make decisions and create new ideas. To share what has been discussed and decided, we need to record the important points of a meeting in the form of minutes. For this purpose, we often create meeting minutes. However, writing such minutes is time-consuming and requires experience. Moreover, summarizing the discussion points while participating in the meeting increases the cognitive load on the participants. Therefore, automatic meeting summarization would allow us to remove the extra task of recording meeting minutes during or after a meeting.
Some previous studies on automatic meeting summarization applied text summarization techniques to meeting transcriptions to extract important sentences for inclusion in meeting summaries [1,2,3]. Other studies applied a multimodal approach by combining prosodic information with the text features [2]. When a person is speaking at a high volume, this may be accompanied by larger bodily activity values. Such co-occurring behaviors may be perceived as salient and coherent characteristics of important utterances. This is not only the case for group meetings; many studies on multimodal interaction have asserted the usefulness of multimodal features [4,5]. Moreover, a group meeting involves multiparty communication, where social dynamics in group discussions are also important aspects to be considered in creating a summary. For example, utterances highly attended by others may be accepted by the group as an important idea or opinion. Therefore, a group meeting is a multimodal multiparty interaction, and thus, it is necessary to consider the co-occurrence of not only behaviors exhibited by a participant but also those taking place among the participants. However, few studies have considered the correlation or co-occurrence between different modalities among different participants.
Based on the discussion above, this paper proposes prediction models for important utterances in group discussions using multimodal and multiparty features. We will tackle this task using two approaches. The first approach is a traditional multimodal interaction analysis, where we first define a list of audio and visual features that are expected to be useful according to previous studies and choose useful features using a simple linear regression model or t-test. Multimodal and/or multiparty features can be defined by combining single modal features. In this approach, we can clearly discuss which features, and their combinations, are more predictive than others. We call these features hand-crafted features.
However, it is nontrivial to design hand-crafted features that can differentiate the important utterances of others. It takes time and effort to identify useful features from the many possible co-occurring behaviors among speech, gestures, and facial expressions. Moreover, in multiparty conversations, it is necessary to consider the co-occurrence of not only behaviors exhibit by a participant but also those taking place between the participants. Therefore, it requires considerable effort to test all possible combinations of data stream from different modalities and different participants to identify useful multimodal features.
Thus, reducing the cost and effort required for feature selection is one the most critical issues in multimodal interaction sensing. Deep learning is a promising approach in addressing this issue, and some successful feature learning algorithms have been proposed, such as RBM (Restricted Boltzmann machine) [6] and autoencoder [7,8,9]. In recent years, feature learning algorithms such as deep belief network (DBN) and Deep Boltzmann Machine (DBM) have been applied to the learning of multimodal features in emotion recognition [10]. A deep convolutional neural network (DCNN) [5] is another representative deep learning model, and it is known that convolutional layers in DCNN can learn discriminative feature representation from the raw input [11,12]. In a study of emotion recognition using multimodal data, Zang et al. [13] employed DCNN to automatically learn an audio-visual feature representation from the raw audio and visual information. However, these approaches have not been applied to multimodal multiparty interactions. As a good challenge to applying deep learning to multimodal interaction, Nojavanasghari et al. [14] employed a deep neural network (DNN) to predict persuasiveness. They demonstrated a promising performance of the DNN, but some of the features were hand-crafted.
In this study, we will create models using both approaches and compare the model performances. We will also discuss whether these two approaches have some common prediction features. Then, by applying the best performance model, we will build a discussion summarization and visualization system that shows whether the proposed model is more useful for the users to determine the social dynamics between the participants as well as the conversation content.
Thus, this study addresses the following questions:
- Are multimodal and multiparty features useful in predicting important utterances?
- Which model performs best: Hand-crafted or deep learning?
- Is the proposed model more suitable for selecting important utterances in visualizing the summary of group discussion videos?
The remainder of this paper is organized as follows. In Section 2, we review previous studies of multiparty interactions, especially those covering text and meeting summarization. Section 3 explains the group meeting corpus that we use for our analysis. By employing two approaches, namely, hand-crafted feature and deep learning, Section 4 proposes nonverbal models and Section 5 proposes verbal models. Then, in Section 6, first we evaluate the models created from these two approaches, then we fuse the best verbal model with the best nonverbal model for further improvement. In Section 7, we present a multimodal meeting browser that incorporates the best performance model, and report the results of a user study. In Section 8, we discuss future directions.
2. Related Work
2.1. Multimodal Multiparty Corpus Studies
In multimodal interaction studies, different types of group meeting corpora have been collected. The AMI Meeting corpus [15] was designed to collect group discussions in which each participant was assigned a different role and required to make decisions as a group in product design meetings. The ISL corpus [16] collected audio and transcriptions of over 100 meetings with different scenarios. In a series of studies, Sanchez-Cortes et al. [17] collected the ELEA corpus in which the participants performed a winter survival task. Aiming at collecting collaborative behaviors, the Team Entrainment Corpus [18] collected participants’ behaviors while playing collaborative board games. The MULTISIMO [19] corpus also targeted collaborative interactions such as discussing answers of quizzes. The corpus described above are task oriented, i.e., data was collected in a limited situation for a specific purpose. In contrast, non-task-oriented corpora focused on natural conversation without any specific purpose. The ICSI corpus [20] collected speech and its transcription and various meta data in natural meeting settings. The D64 corpus [21] also collected natural daily conversations in an apartment room using various sensors such as motion capture, video cameras, and microphones.
There have also been many studies that use these corpora. Many such studies attempted to estimate the characteristics of individual participants using audio, visual, and multimodal features. Some studies proposed models for predicting influential persons in group interactions [22,23]. Based on the influence model, Dong et al. [24] predicted the functional roles of participants, such as orienter, seeker, and giver [25]. Studies with similar motivation proposed models for estimating dominance in group discussions [26,27,28,29]. In their series of studies, Sanchez-Cortes et al. [17] also proposed a model for predicting emergent leadership, and found that dominance and leadership were highly correlated. Audio-visual nonverbal features were also used for predicting self-reported personality traits [30,31], as well as personality impressions from external observers [4]. These features were also used for characterizing behavioral patterns in group interaction [32]. Whereas the goal of these studies is to predict the characteristics of individual participants, the purpose of this study is to detect important utterances that contribute to group discussions.
2.2. Text, Speech, and Meeting Summarization
Text summarization involves two approaches: Extractive [33] and abstractive summarization. The basic idea of extractive summarization is to distinguish between the informative and uninformative dialogue units in meetings, and to concatenate the informative ones to produce a summary. There are two ways to identify informative sentences. One option is a vector space model in which sentences are represented as word vectors that are commonly weighted based on tf-idf. The cosine similarity between two sentences is used for judging relevance and redundancy [34]. As a more sophisticated approach, latent semantic analysis (LSA) is applied to project sentence representation in the LSA space [35]. Summarizations of text-based e-mail conversations and discussions have employed this approach [36,37]. In more recent studies, the deep learning approach, including embedding representation, was employed in text summarization, and achieved better performance [33,38,39,40]. The second option for extractive summarization is a feature-based approach, where supervised machine learning techniques are exploited to train a classifier, which judges each sentence as informative or not informative. Many extractive summarization studies have employed this approach. Recent studies in text summarization employed neural network approaches to learn feature representations, and achieved comparable performance to the models using hand-crafted features [41]. In contrast, abstractive summarization generates summaries rather than selecting sentences and ordering them. Wang and Cardie [42] introduced a template-based approach. In this approach, human-authored summaries were clustered and represented using word-graph models, and the ranked graph paths were used as templates to produce a summary. Singla et al. [43] proposed an automatic template selection method using cosine similarity on different levels of language representation. Murray [44] formulated the graph-based summary generation task as the Markov Decision Process (MDP), and proposed a model that learned a policy for selecting words in the word-graph. As a neural network approach, Zhao et al. [45] proposed a hierarchical encoder based on recurrent networks to learn the high-level semantic representation of meeting conversations. They also proposed a decoder network using reinforcement learning to generate meeting summaries.
In speech summarization, the first step is to extract an interval of speech from an audio stream as a unit of analysis. Text summarization techniques are then applied to the linguistic information in this unit. However, not all of the linguistic features used in text summarization are available in speech. Instead, prosodic features, such as speech energy, pitch, and speech duration, can be used as speech-specific features. Maskey and Hirschberg [46] combined prosodic information with lexical information to summarize voicemail, and obtained promising results for improving the quality of the summary.
The earliest research on meeting summarization by targeting spoken dialogues applied text summarization techniques to speech transcripts. Waibel et al. [47] adopted the vector space model for summarizing meetings. More recent work in the feature-based approach added features extracted from a speech signal such as pitch and energy [48,49]. The benefit of prosodic features has been revealed through speech summarization, even when speech recognition accuracy is not perfect [46,50]. In addition to prosodic features, it was observed that acoustic features such as MFCC and speech duration contributed to improving meeting summarization [51,52]. Murray et al. [49,53] incorporated speech-specific features, including prosodic information, to train a classifier that identifies informative utterances. Murray and Carenini [1] added conversational features specifically related to multiparty interaction such as the dominance of participants and turn-taking using the AMI meeting corpus dataset [15].
However, these studies did not use visual features to select informative utterances to be included in meeting extracts. There have been very few studies that utilize videos and other multimedia sources in meeting summarization. Erol et al. [54] proposed a method for detecting important segments of a recorded meeting based on activity analysis, which simply measured audio amplitude and luminance difference between two video frames as well as text analysis using tf-idf. More recently, Li et al. [55] proposed an extractive multi-modal summarization method that selects salient sentences by considering the images, audio, and videos related to a specific topic. However, they did not address the issue of meeting summarization. As more relevant research, [56] focused on detecting segments of high-interest, which is similar to what [57] defined as hot-spots, from audio-visual cues in meetings. However, it may also be that the participants carefully and quietly listen to what they think is important. Moreover, [56] annotated group interest level as ground-truth, which is clearly different from what we will annotate: Judging whether each utterance should be included in the meeting summary.
2.3. Deep Learning and Multimodal Fearures
According to the discussion above, defining useful multimodal and multiparty features is one of the most important issues in predicting meeting extracts. However, examining the co-occurrence of all possible combinations of behaviors such as speech, gestures, facial expressions, and language to identify useful multimodal and multiparty features is unrealistic. Therefore, reducing the cost and effort required for feature selection is necessary.
To solve such a problem, this study employs a neural network approach and compares model performance between the models using handcrafted features and deep neural network models. Neural network approaches enable us to automatically acquire feature representation from raw data. Pan et al. [25] reported that in saliency prediction for images, end-to-end CNN performed better than models using hand-crafted features. This approach was also demonstrated to be useful for learning audio features from a raw speech signal [11,12].
Based on these techniques, in sentiment analysis and emotion recognition, multimodal fusion models have been proposed by concatenating audio and visual features learned by CNN [5,13]. Nojavanasghari et al. [14] applied this approach to social media videos to estimate persuasiveness from audio and visual features learned using a deep neural network. Wang et al. [58] and Poria et al. [59] employed LSTM to classify emotional polarities in microblogs. Such a model had the advantage of modeling the linguistic context. Our deep-learning based models take a similar approach to Shen and Huang [60] and Poria et al. [61] who extracted audio, visual, and textual features using CNNs and concatenated those features for final sentiment classification.
2.4. User Studies on Meeting Summarization
There have been some user studies that evaluated summarization systems. Murray et al. [62] implemented a system for browsing meeting summaries, and conducted a user study in which the subjects compared three types of summaries: System-generated abstractive summaries, human-authored abstractive summaries, and human-authored extractive summaries. They reported that the subjects preferred human-authored/system-generated abstractive summaries rather than extractive ones. In a user study by Hsueh and Moore [63], it was found that decision focused summaries were useful for the users to find relevant information and understand the decisions efficiently. Tucker and Whittaker [64] proposed an interactive compression (IC) system, which allows users to change the degree of summarization. They evaluated characteristics of the IC system based on quantitative and qualitative analyses, and reported that the users could efficiently find information they needed and they preferred the IC system.
As described above, previous user studies on summarization mainly focused on the efficiency of finding information. In this study, we evaluate our meeting browsing system in terms of not only finding information but also understanding the participants’ roles in conversation.
3. MATRICS Corpus
To analyze human behavior in a face-to-face conversation, we first conducted a corpus collection experiment. The corpus is called the MATRICS (MultimodAl (Task-oriented) gRoup dIsCuSsion) corpus (Figure 1). In constructing the MATRICS corpus, we investigated multimodal corpus collected by previous studies. We designed experiments based on the survey results and collected data by corpus collection experiments. After that, we defined utterances to the corpus, which was the unit of analysis, and identified important utterances contributing to the summary of the discussion from the defined utterances.
3.1. Corpus Collection Experiment
The important utterances contributing to the meeting summary are assumed to be utterances that propose new ideas, summarize opinions, and agree or disagree with the current topic. A task-oriented discussion can observe such utterances more frequently than a non-task-oriented discussion. Therefore, in this study, we decided to record a group behavior for task-oriented discussions.
3.1.1. Participants
We recruited 36 Japanese university students (24 male and 12 female), with an average age of 20.7 (SD = 1.70), in the experiment as conversation participants. Four people made one group and a total of nine groups were formed. The participants did not know each other.
3.1.2. Experimental environment and tasks
We set up a 4.5 × 4.5 m experimental space enclosed by curtains. At the center of this space, we placed a 1.2 × 1.2 m table, with one participant sitting on each of its side. A snapshot of the experiment is shown in Figure 1, and the layout of the data collection environment is illustrated in Figure 2.
The participants were notified that experts would evaluate their behavior after the experiment, so that they would take these tasks seriously. They were also instructed that one member of their group would report the discussion results for one minute as a group representative. A timer was placed on each of the two poles so that the participants could see the remaining time. The timers rang at the start and end of the discussion to notify the participants. At the end of all sessions, the participants were paid 3000 yen.
The task given to a conversation group was to discuss and make decisions on a topic. Each group had three discussion sessions. These topics were familiar with university students, and created by investigating the frequently used tasks in group discussions in hiring processes. To cancel out the effect of task order, it was randomized. Following are the three discussion tasks used in the experiment.
- Booth planning for a school festival: The participants were instructed to discuss and create a plan for a small booth intended to sell food or drinks at a school festival. The participants were given a map that indicated the location of other booths, as well as possible places for opening their own booth. They also had a document that showed data for the distribution of visitors’ ages and the number of visitors by time. The participants were instructed to review these documents for five minutes before starting the discussion. Then, based on the data shown in the documents, they were allowed to discuss where to open their booth and the type of goods they would sell, within 20 min.
- Travel planning for foreign friends: The participants were instructed to create a two-day travel plan for foreign friends visiting Japan on a vacation. The discussion time allowed was 20 min, and there was no time granted to think individually.
- Celebrity guest selection: The participants were asked to pretend that they were the executive committee members for a school festival, and were choosing a celebrity guest for the festival. Their discussion task was to decide the ranked order of 15 celebrities by considering cost and audience attraction. For the first five minutes, each participant was requested to read the instructions and decide alone (that is, without interacting with other members) the celebrity order. Subsequently, the participants were engaged in a discussion to determine the ranked order as a group.
In this study, we analyzed the corpus for “Booth planning for a school festival” (booth planning) and “Travel planning for foreign friends” (travel planning). The number of meetings were eight for each task, thus 16 in total.
3.2. Analyzed Data
In the experiment, we used various sensors, such as motion sensors, inertial measurement units (IMU), Kinect sensors, and eye trackers, alongside video cameras and headset microphones. We also asked the subjects to fill in the NEO-FFI [65] questionnaire, to evaluate their personality traits. The details of the collected data are described in [66]. The following describes the data that we analyzed in this study.
- Head acceleration: An IMU (ATR-Promotions: WAA-010) was attached to the back of each participant’s head, more specifically, to each participant’s cap. These sensors can measure head acceleration and angular velocity in the x, y, and z coordinates at 30 fps. The measured data were sent to a server machine through Bluetooth, which received and saved the data with a timestamp. By applying the angular velocity of the three axes to equation , we calculated the head composite angular velocity of each participant. Here, , and are the angular velocities for each frame for the axes, respectively.
- Video: Two video cameras (SONY HDR-CX630V) were set to record an overview of the communication from opposite directions. In addition, four web cameras (Logicool HD Pro Webcam C920t) were placed in the center of the table to record close-up front face images of each participant. The images had a resolution of 1280 × 720 and frame rate of 30 fps. The distance between a web camera and each participant was approximately 1 m. We obtained head position and rotation data by applying the close-up face images to a vision-based face tracker (FaceAPI: https://www.seeingmachines.com/). We used head pose data to create a face direction classification model that estimated four directions of the face (forward participant, right participant, left participant, and his/her memo). The classification accuracy of the model was 89.6%. We used this model to classify the head-gaze direction. The classification results were double-checked manually and corrected if necessary.
- Audio: All participants wore a hands-free headset microphone (Audio-technica HYP-190H) to record speech data individually. The speech input from each microphone was sent to a PC via an audio interface, and recorded in four channels using a recording software. The sampling rate of the WAV format was 44.1 kHz. In addition, using the Praat (Praat: http://www.fon.hum.uva.nl/praat/) audio analysis tool, the speech intensity and pitch were computed every 10 ms during an utterance and the speech rate was measured for each utterance.
- Transcription: Utterance transcription was obtained through an ASR for automatically detected utterances, and manually segmented utterances were transcribed manually. The utterance segmentation methods will be explained in Section 3.3 in more detail.
All audio and visual data were synchronized using the start buzzer, and various sensing data were synchronized using the timestamp assigned to each record. The accuracy of the timestamp was guaranteed by synchronizing all computers that received sensor data through access to a unique NTP server in the same local network.
3.3. Analysis Units
In this study, we used utterance as analysis unit, and using different ways of segmenting the datastream, we created two datasets: Automatically detected utterances and manually segmented utterances.
3.3.1. Automatically detected utterances
Speech intervals as utterances were detected automatically using a voice activity detector (VAD) included in the Julius (Julius: http://julius.osdn.jp/en_index.php) speech recognition system, which segments audio data based on the amplitude and number of zero-crossing points in the audio stream. When more than 300 ms of silence was observed between two speech intervals, it was identified as the end of the current utterance and the subsequent speech was regarded as a new utterance. Furthermore, the detected speech intervals were recognized by an automatic speech recognition (Google Speech API v2: https://www.google.com/speech-api/v2/) (ASR) system, and the outputs were used as the utterance transcription. The motivation for employing this method is that our ultimate goal is to automatically produce a discussion summary without any human labor. For this purpose, we need a dataset created using automatic speech detection and transcription. There are many cases in which the automatic data creation is not accurate. For example, a double consonant is pronounced at the start of the utterance or the voice amplitude gradually decreases at the end of the utterance. Furthermore, if ASR is applied to an incorrect speech interval, the recognition result would be even more inaccurate. Therefore, these automatically detected utterances were used to investigate the performance degradation when meeting summaries are generated automatically.
3.3.2. Manually segmented utterances
To obtain ideally segmented language data, a human annotator identified speech segments using an annotation tool (ELAN: https://tla.mpi.nl/tools/tla-tools/elan/) while checking the speech waveform. The same criteria for utterance detection as those in automatic utterance detection were applied; when a silence interval of 300 ms or more occurred before and after a given speech interval, it was recognized as an utterance boundary. Subsequently, each utterance interval was transcribed manually by a human annotator. This dataset was used to verify the correctness of the proposed method without, or by minimizing, utterance segmentation and transcription errors.
3.4. Annotating Important Utterances to be Included in a Meeting Summary
The study aims to select important utterances to be included in extractive summaries. To employ a machine learning approach, we need a gold standard of extract-worthiness to be used in training the models. We asked multiple annotators to judge whether each utterance should be included in the meeting summary. Note that we simply instructed the annotators “to select utterances to be included in the meeting summary” and gave no more detailed instructions. In text summarization studies, such simple instruction was used in asking human subjects to create an extractive summary. We adopted a similar procedure to create the gold standard by using human annotators. In addition, we assumed that the annotators observed various aspects of a group interaction in identifying important utterances; not only the utterance content but also nonverbal behaviors exchanged among the participants. Thus, we thought that relying on the annotators’ intuition would be better than providing a detailed annotation scheme.
The annotators were seven undergraduate and graduate students majoring in information science (five males and two females), with an average age of 22.2. They were not the participants of the corpus collection experiment, and did not have any experience of creating a meeting summary.
We asked the annotators to watch meeting videos using the ELAN video annotation tool, in which the automatically annotated utterance segments in Section 3.3.1 were shown in annotation tracks. There were four tracks, each of which indicated the speech track of each participant. The annotators could observe the whole interaction and play utterance segments individually. They were also allowed to watch the video multiple times. Each annotator watched 16 videos and judged 15,513 utterance segments in total. The video contained the face images and overview images of the participants in the meeting. The order of viewing video was randomized. Figure 3 shows a snapshot of the annotation tool that the annotators worked on.
After completion of the annotation, we made 21 pairs from seven annotators, and calculated the inter-rater agreement using Cohen’s kappa. We then selected five annotators who had higher agreement with each other (Kappa > 0.4; moderate agreement). For further analysis, we used the annotations by these five annotators.
We calculated the agreement ratio of the judgments among the five reliable annotators. For further analysis, we used the utterances identified as important by three out of the five annotators (i.e., the majority of annotators) as a positive instance. Table 1 shows the numbers of positive and negative instances. The number of negative cases was almost twice that of positive cases.
In the annotations of the important utterances above, we used automatically detected utterances, and the results were applied to manually segmented utterances. The speech intervals of these two datasets were almost the same, but automatic utterance detection tends to produce a shorter speech segment. For instance, the automatic segmentation program recognized breathing as a silence and judged it as an utterance boundary. Thus, we asked the annotators to work on the automatically detected utterances and applied the annotations to the manually segmented utterance. Figure 4 shows this procedure. More specifically, when there were one or more important utterances that temporally overlapped with a manually annotated utterance, that utterance was judged as important. If there was no overlapped utterance to manually annotated one, the utterances were excluded from the analysis. As a result, the number of manually annotated utterances was 8939, and the number of important/not-important utterances is shown in Table 2.
4. Nonverbal Models for Important Utterance Prediction
Although various methods have been proposed for detecting important utterances, none of them have taken into account the co-occurrence and correlation of social signals displayed by multiple participants. In this section, we propose two approaches for creating important utterance detection models.
One approach is a conventional machine learning in which features are manually defined. To choose useful features, researchers are required to have a deep understanding of communication. In this study, we define features based on our observation of the MATRICS corpus. We also introduce an algorithm to find the co-occurrence between different signals and to use them as features.
The other approach is deep learning. Deep learning models have achieved high performance in various domains. CNN achieved good performance in image processing and LSTM in text processing. However, in multimodal multiparty communication, we need more discussion to find an effective network structure and representation of input data. Thus, this study aims to contribute to the research on multimodal multiparty conversations by exploring network structures and data representation that capture the co-occurrence of multiple participants’ multimodal behaviors.
4.1. Defining Hand-Crafted Features
In the hand-crafted feature approach, it is important to observe the collected corpus to find the predictive features. In our observation, we find that important utterances are characterized not only by the behaviors of the speaker but also by those of other participants. We also find that important utterances are accompanied by meaningful behavior co-occurrence between multiple participants. For example, when other participants gaze at the speaker, they also display nods to the speaker.
In addition, important utterances are expressed differently depending on the communicative skills of the participants. A participant with high communicative skills speaks while observing other participants, and frequently gives feedback such as acknowledgments and nodding to other participants. On the other hand, a participant less communicative does not display such behaviors. As there is a strong correlation between the number of utterances and the evaluation results of communication skills of human observers, we use the number of utterances as an approximate value of the level of communication skill. The participant who speaks most frequently is referred to as the “Rank1” participant, and the one who speaks least frequently is referred to as the “Rank4” participant.
Based on the observation above, we define features for nonverbal information in three categories:
- SP/OT: Features for speaker and other participants.
- PR: Features with respect to the ranked order of utterance frequency.
- CO: Features for behavior co-occurrence patterns.
In this paper, we define the participant who produces a given speech interval as the “speaker” of that speech interval, and the remaining participants as “others”. Note that if multiple speech intervals overlap with each other, the speaker’s behaviors in one speech interval are also counted as those of “others” in the other speech intervals. In the following sections, we will describe these categories.
4.1.1. Features for Speaker and Other Participants’ Behaviors (SP/OT)
We define audio/visual features for a speaker (SP) during speaking, and for others who are not the speaker of that speech (OT). Table 3 shows the 38 features defined.
The defined features are described below in detail.
Features for visual attention: the following six features are extracted using face direction obtained from video data.
- Number of attention shifts: The number of attention shifts of the participant during his/her speech. This feature is normalized by utterance duration. The feature value for others is defined as the average number of attention shifts of the other participants.
- Amount of attention received from participants: Frequency of receiving attention from at least two participants in the group during the speech. The feature value for others is computed as the average amount of received attention of other participants.
- Proportion of attention to others: The ratio of the time during which the speaker gazes at any other participant. It is defined only for the speaker.
- Proportion of attention to speaker: The average value of the percentage of time during which the speaker is gazed at, calculated for the other three participants. This feature is defined only for other participants.
- Proportion of attention to Rank1/2/3/4: The ratio of the time during which the participant gazes at the Rank 1/2/3/4 participant.
- Proportion of attention to his/her memo: The ratio of the time during which the participant gazes at his/her notes.
Head motion: the average, variance, and maximum values of the current speaker’s composite head angular velocity are computed per utterance. For the feature value for others, the sum of the composite head angular velocity values of the other three participants is calculated for each frame. Then, average, variance, and maximum values of the summed composite head angular velocity are computed per utterance and used as feature values. Thus, we define the six head motion features.
Speech information: As prosodic features, the average, variance, and maximum values of the speaker’s speech intensity and pitch are calculated for each utterance. The same features are also calculated by summing up the speech intensities of the other three participants. The speech intensity and pitch are measured every 10 ms during a speech interval. In addition, the speech duration, pauses between speech intervals, speech rate approximated by the number of syllables, and the position of the utterance (proportion of the elapsed time of the utterance to the whole discussion length) are defined only for a speaker. Thus, there are 16 features in total in this category.
4.1.2. Features with Respect to the Ranked Order of Utterance Frequency (PR)
After ranking each participant by the number of utterances, we define the same features as SP/OT features. For example, by focusing on Rank1 participant, we define features for Rank1 as the speaker and those as the others. The total number of defined features is 144, which is broken down into 20 features (= 7 attentions + 3 head motions + 10 speeches) for each rank as a speaker and 16 features (= 7 attentions + 3 head motions + 6 speeches) as the others. As it is meaningless to define the “Proportion of attention to Rank1” for Rank1, the number of attention features defined for each rank participant is two less than the SP/OT features.
4.1.3. Features for Behavior Co-Occurrence Patterns (CO)
Using the co-occurrence patterns of multiple nonverbal behaviors is expected to improve the model performance. We explore the useful co-occurrence patterns of multiple nonverbal behaviors using the multidimensional motif-discovery algorithm proposed by Vahdatpour [67]. This algorithm targets discretized sequential data and extracts frequent co-occurrence behavior patterns as motifs. Thus, this algorithm enables us to find meaningful co-occurrence patterns that are salient in group discussions. Moreover, this algorithm is robust for noisy input because it can avoid picking up infrequent co-occurrence patterns caused by sensing errors. We use the following features as the constituents of co-occurrence patterns. To discretize the data, we split the multimodal data into 33-ms intervals, and assign or compute the feature values for each time interval.
- Visual attention: Looking at Rank1, Rank2, Rank3, or Rank4, or looking down at his/her memo.
- Binary judgment of head motion: To binarize the head movement data, the composite head angular velocities are divided into two clusters—moving and not moving. We use the EM algorithm for clustering.
- Speaking state: If a given participant is currently speaking, that time frame is labeled as a speaking state.
We define the following seven features: Four for visual attention, two for binary judgment of head motion, and one for marking the speaking state. These features are annotated for each participant, ranked in order of utterance frequency.
As a result of applying the multi-dimensional motif-discovery algorithm to the above features, 125 co-occurrence patterns are obtained. For example, the algorithm finds a pattern “Rank3Uttr + Rank1LaRank3 + Rank4LaRank3”: Rank1 looks at Rank3 (Rank1LaRank3) and Rank4 also looks at Rank3 (Rank4LaRank3), while Rank3 is speaking (Rank3Uttr). As another example, a pattern “Rank1LaRank4 + Rank2LaRank4 + Rank3LaRank4” indicates that all participants except Rank4 are looking at Rank4. These patterns suggest that the participants’ attentions are concentrated on a specific participant. If we obtain the co-occurrence pattern without applying the multi-dimensional motif-discovery algorithm, the number of patterns should be . Therefore, the motif-discovery algorithm finds the most salient 125 co-occurrence patterns efficiently.
Note that co-occurrence patterns are analyzed for each 33-ms interval. To use them as utterance-based features, we calculate the proportion of occurrences of these 125 patterns for each utterance. We also use the 28 elements constructing the co-occurrence patterns as individual features. Thus, 153 features are defined in total.
4.1.4. Feature Selection by Statistical Tests
In previous sections (Section 4.1.1, Section 4.1.2 and Section 4.1.3), we defined 335 (= SP/OT (38) + PR (144) + CO (153)) features. To select useful features from them, we examine each feature using a t-test to investigate whether the average value of a given feature is different between the important utterances and those not important. In addition to the t-value, we adopt Cohen’s d effect size, which is a standardized measure for evaluating the effect size of a t-test result without being affected by the data size. We select features as useful feature for estimation if the t-test result is statistically significant at 5% level and Cohen’s d is greater than 0.2. As a result, 96 features are selected as shown in Table 4. Table 5 shows some selected features with high Cohen’s d.
From Table 5, most of the top features with respect to Cohen’s d are speech information, and the features for head motion and attention direction are relatively few. In addition, in the SP/OT and PR features, the utterance duration of the speaker and the average of speech intensity of others have the highest Cohen’s d.
As for speaker behavior features in the SP/OT category, the top three features are speech duration (0.83), speech rate (−0.34), and amount of attention received from participants (0.31). The number in bracket indicates Cohen’s d. On the contrary, for other behavior features, the top three features are average of speech intensity (−0.76), proportion of attention to his/her note (0.76), and maximum of speech intensity (−0.51). These results suggest that a speaker of an important utterance speaks longer and slowly, and the situation is watched by several others. In addition, other participants listen to the utterance quietly while paying attention to his/her note.
For PR features, features with higher Cohen’s d differ depending on the order of the participants, both as the speaker and others. Although the speech rate slows down when the Rank1 participant gives important utterances, this does not occur for the Rank4 participant. In contrast, the Rank4 participant, who makes important utterances, is often watched by two or more others, but not by the Rank1 participant. This result suggests that the behaviors in speaking important utterances and those in listening are different depending on the participants’ communicative skills.
For CO features, the co-occurrence patterns with higher Cohen’s d contain “Rank 3 participants uttered.” It is difficult to recognize from the corpus observation that the utterance from a Rank3 participant is likely to contribute to the determination of unimportant utterance. Thus, this is an advantage of the algorithm to detect such characteristic patterns.
4.2. Deep Neural Networks
To construct a neural network that can learn the co-occurrence between multiple signals that multiple people express, in this study, we built a multimodal neural network model, as shown in Figure 5. This network first learns the co-occurrence signals among multiple participants, and then correlates the signals from different modalities by fusing the features.
First, we construct unimodal models, which are networks based on single-modality data. The unimodal models, which target nonverbal information, aim to learn the correlation and co-occurrence relation between the speaker and other participants’ behaviors. Then, the outputs of the unimodal models are integrated and used as input to create multimodal models whose output is a binary classification; whether the input is an important utterance or not. In the following sections, we describe unimodal and multimodal models.
4.2.1. Structure of Nonverbal Unimodal Models
The following three types of networks are created as nonverbal unimodal models (Figure 6).
- 3D-CNN
- 2D-CNN
- AlexNet-based CNN
These networks are trained to judge whether an input vector fed to the network should be selected as an important utterance to be included in a meeting summary.
3D-CNN: 3D-CNN aims to model face-to-face communication by introducing a 3D convolution layer and a 3D pooling layer. By using 3D convolution [68], it becomes possible to simultaneously consider behavioral data presented by multiple participants using a 3D kernel. More specifically, the behavior data of a participant is expressed as 2D data, and such data for four participants are arranged three-dimensionally and convoluted with a 3D kernel. Through this computation, the behavior co-occurrence among the conversation participants can be learnt. Note that the input data from four participants are stacked according to the relative spatial relation to the person who produces the speech interval. As each participant sits on each side of a square table, we order the participants’ data in a clockwise fashion, starting with the participant who speaks at a given speech interval.
Table 6 shows the details of the 3D-CNN network. The network consists of two 3D convolutional layers, a 3D pooling layer, two fully connected layers, and a softmax layer for classification. The input size of the input layer, the kernel size of the convolutional layer, and the filter size of the pooling layer depend on the modality of the input data; the details will be described later. The number of kernels in the convolutional layer for C1 and C2 layers is 32. The number of units in the fully connected layers for FC1 and FC2 layers is 128. ReLU is used as an activation function for C1, C2 and FC1, FC2. The dropout rate is 0.25 between the P1 layer and the FC1 layer, 0.5 between FC1 and FC2, and 0.5 between FC2 and the softmax layer.
Overfitting is a major problem in DNNs, especially when the dataset is not very large. The MATRICS corpus used in this study is not very large compared to the shared datasets used in computer vision studies. To avoid overfitting the models, we exploit lightweight convolutional neural networks. Pan et al. [10] proposed this strategy for predicting salient areas in images.
2D-CNN: 2D-CNN replaces the 3D convolution layer and 3D pooling layer introduced in 3D-CNN with a 2D convolution layer and a 2D pooling layer. In 2D-CNN, behavioral data are convolved independently for each conversation participant by using a 2D kernel. The details of the network are shown in Table 6. Most of the network configurations are the same as those for 3D-CNN.
AlexNet-based CNN: This network is based on AlexNet [69], which has demonstrated good performance in computer vision tasks. The network consists of five convolutional layers—three of which are followed by pooling layers—and two fully connected layers, with a final softmax layer. The details of the network are shown in Table 6.
4.2.2. Nonverbal Unimodal Models
The data input to the nonverbal network models are head motion spectrogram, speech spectrogram, speech intensity, and head pose. The data are normalized using min–max normalization for each modality. As the sampling rate varies depending on the sensing data, the size of the input vector varies depending on the modality. In addition, speech duration is set to 15 s for all inputs by adding blank data for shorter utterances. Therefore, the width of the input vector is sampling rate × 15. The details of representation of each input vector are described below.
Speech spectrogram model (SS model): Speech audio with a sampling rate of 44.1 kHz is recorded from the headset microphone attached to each participant, and a spectrogram is created from the speech. The window width of the Fourier transform is approximately 1.5 s (216 = 65,536 frames) and the slide width is 1 frame. Therefore, the maximum measurable frequency is approximately 22 kHz. After the Fourier transformation, the data are downsampled to 50 fps. Next, the frequency measured at 22 kHz resolution is divided into 32 bins. Then, the sums of the intensities of the frequencies at each bin are taken as the data points.
Table 7 shows the input vector size supplied to the network, the kernel size in the convolutional layer, and the pooling size in the pooling layer. The speech spectrograms are input to the 3D-SCNN network as the tensor of size: 750 (utterance duration = 50 fps × 15 s = 750) × 32 (quantization resolution) × 4 (number of participants) × 1 (number of channels). For 2D-CNN and AlexNet-based CNN, the input is modified as the tensor of size: 750 (utterance duration = 50 fps × 15 s = 750) × 32 (quantization resolution) × 4 (number of channels). In other words, in networks that introduce a 3D convolution layer, participants are treated as elements of convolution, and in those in which a 2D convolution layer is introduced, discussion participants are treated as a channel. The kernel size of the convolutional layers is 5 × 3 × 4 for 3D-SCNN and 5 × 3 for 2D-SCNN and AlexNet. The size of the pooling feature map is 2 × 2 × 1, 2 × 2, and 2 × 1 for 3D-SCNN, 2D-SCNN, and AlexNet, respectively.
Head motion spectrogram model (HS model): By applying FFT, a sequence of composite head angular velocity data is represented as a spectrogram based on time, frequency, and amplitude. The window width of the Fourier transform is 30 frames and the slide width is 1 frame. A spectrogram is created for each of the four discussion participants.
Similar to the head motion model, a spectrogram is created for each of the four discussion participants for each utterance. Therefore, the size is 450 (speech duration = 30 fps × 15 s) × 15 (frequency resolution) × 4 (number of participants) × 1 (number of channels). The kernel size and pooling size for the convolutional operation are listed in Table 7.
Speech intensity (SI model): For each utterance, the speech intensity is measured at 100 fps using a speech analysis tool, and input to the network as an image of size 1500 (speech duration = 100 fps × 15 s) × 1 × 4 (number of participants) × 1 (number of channels). Table 7 shows the kernel size and pooling size for convolution operation.
Head pose (HP model): The head poses are recognized by processing the close-up facial images, which are recorded by a webcam using a vision-based face tracker. The face tracker computes the head position and rotation in the x, y, and z coordinates at 30 fps. Therefore, each data point is transformed into an image of size 450 (speech duration = 30 fps × 15 s) × 3 (x, y, and z axes) × 4 (number of participants) × 2 (number of channels: position and rotation). Table 7 shows the kernel size and pooling size for the convolution operation.
4.2.3. Nonverbal Multimodal Model
We integrated unimodal models to create a nonverbal fusion model (NV fusion model) as illustrated in Figure 5. The NV fusion model integrates all nonverbal unimodal models. The integrated unimodal models are frozen. In integrating the models, the softmax layer of each model is discarded, and output vectors from the fully connected layer are concatenated. Then, this concatenated vector is given as the input of the fusion model. Therefore, the number of dimensions of the vector input to the NV fusion model is 512 (= 128 × 4). The fusion network comprises two fully connected layers followed by a softmax layer. The number of neurons in each fully connected layer is 256. Dropout is not used in the fusion models.
5. Verbal Models
Similar to the nonverbal models, we defined two kinds of verbal models based on hand-crafted features and deep learning. Although these models are not novel ideas, we created them to fuse with nonverbal models proposed in Section 4 and to improve our final model. Thus, we implemented verbal models proposed in previous studies [2,70].
5.1. Verbal Hand-Crafted Features
The following two hand-crafted feature sets were defined:
- Hand-crafted verbal features (HC_V): we defined 12 linguistic features by referring to a study of the meeting summarization by [2]. We used the following features: Number of words, number of nouns, number of new nouns, average/variance/maximum/minimum of tf-idf, cosine similarity between the entire meeting and the target utterance, cosine similarity between the five preceding utterances and the target utterance, and number of frequently appearing unigrams, bigrams, and trigrams in the utterance.
- Bag-Of-Words (BOW) features: Bag of words to represent an utterance.
5.2. Verbal Model using Deep Learning (V Model)
The input of the verbal model (V model) is the linguistic information of an utterance. Thus, the 3D convolution used for considering behaviors by multiple participants is not suitable, and a 2D convolution is used instead. An overview of the V model is shown in Figure 7. The V model was created by referring to [70].
First, the transcribed text of an utterance is divided into words. We use the Mecab (Mecab: http://taku910.github.io/mecab/) morphological analyzer and the NEologd (NEologd: https://github.com/neologd/mecab-ipadic-neologd) dictionary, which includes entities for new words. Then, each word is represented as a vector using the Skip-gram model, which is trained using sentences in Wikipedia articles. The trained word embedding represents a word as a 200-dimensional vector. In addition, in morphological analysis, one of the 19 types of a part-of-speech tag is assigned to each word, and represented as a 19-dimensional one-hot vector. These two vectors are concatenated, and each word is represented as a 219-dimensional vector. In training the model, the utterance length is set to 28 words, because 28 is the maximum number of words in an utterance observed in the corpus. Blank word vectors are added to the representation of utterances shorter than 28 words. Therefore, the size of the input data is 28 (number of words) × 219 (word vector (200) + part-of-speech vector (19)) × 1 (number of channels).
The detailed network settings are shown in Table 8. The network configurations are similar to those of 2D-CNN of the nonverbal model.
6. Model Evaluation (and Verbal-Nonverbal Fusion Models)
In Section 4 and Section 5 aiming at predicting important utterances, we proposed nonverbal models and verbal models from two approaches: Defining hand-crafted features and employing DNN. This section evaluates these models to propose verbal-nonverbal fusion models, and discusses their characteristics.
6.1. Overview of Evaluation Method
All created models were binary classification models, which classify whether the input utterance is important enough to be included in the meeting summary. The performance of the models was evaluated using the leave-one-group-out cross-validation method. As this method evaluates a model using group data that were not used for training, the model performance for unknown data was appropriately evaluated. Equal numbers of positive and negative examples were used in the training data by under-sampling. We did not apply resampling for the test data. We aggregated TP, TN, FP, and FN for all folds, and then computed the performance measures using the total number. We used precision, recall, f-measure, and accuracy as the evaluation metrics to evaluate the models.
While the total number of utterances in the corpus was 15,513, the ASR program output the speech transcript only for 5269 utterances. Therefore, all models with linguistic information were trained using these 5269 utterances. In model evaluation, if the transcript of the input utterance was missing, the best-performing nonverbal model was applied to such input. This evaluation procedure is based on our motivation to develop a fully automatic summarization system. We assumed that in practical usage, an input with missing linguistic information should be judged by nonverbal models.
As a naive baseline model, we employed the longest-utterances method which simply selects long utterances as important ones.
- LU: In order to define the longest utterances in each meeting, we sorted utterances by their duration, and then set up a threshold where the F-measure was the highest. As a result, 44% utterances in order of length were selected as important utterances.
6.2. Evaluation of Hand-Crafted Feature Models
To investigate which types of features are more useful, we examined the following seven combinations of feature sets proposed in Section 4.1. We employed random forest as the learning scheme.
- SP/OT: SP/OT features only
- PR: PR features only
- CO: CO features only
- SP/OT + PR: Union of SP/OT and PR features
- SP/OT + CO: Union of SP/OT and CO features
- PR + CO: Union of PR and CO features
- NV-ALL: Union of SP/OT, PR, and CO features
In addition, by combining hand-crafted verbal features (HC_V, BOW) described in Section 5.1, we trained the following three models using random forest.
- HC_V: HC_V features only
- BOW: BOW features only
- V_ALL: Union of HC_V and BOW features
Table 9 shows the performance of all hand-crafted feature models. The best and second-best performance models for each evaluation metric were marked with bold and underline, respectively. As shown in the table, SP/OT, SP/OT+PR, SP/OT+CO, and NV_ALL were superior to other models including the baseline in all evaluation metrics. This shows that features for speaker and others were good predictors. Moreover, SP/OT performed best in Recall, F-Measure, and Accuracy. Thus, we decided to use the SP/OT model as the best handcrafted nonverbal model for the rest of the analysis. The SP/OT+CO model was the best in Precision and slightly higher than SP/OT in Precision. This suggests that the CO features complement the SP/OT features. Note that among verbal models, V_ALL is the best in all evaluation metrics.
Based on the discussion above, with the best hand-crafted nonverbal feature set (SP/OT), we created three verbal and nonverbal fusion models.
- HC_V-SP/OT: Early fusion model of the best hand-crafted nonverbal model (SP/OT) and HC_V.
- BOW-SP/OT: Early fusion model of SP/OT and BOW.
- V_ALL-SP/OT: Early fusion model of SP/OT, HC_V, and BOW.
Table 10 shows the performances of verbal and nonverbal fusion models and the best nonverbal model. Among three verbal and nonverbal fusion models, the HC_V-SP/OT performed best in all evaluation metrics. In hand-crafted feature, fusing verbal and nonverbal information did not contribute to improve recall, f-measure, and accuracy.
6.3. Evaluation of Deep Learning Models
First, we compared the performances of the models created by combining three types of network structures (2D-CNN, AlexNet-based CNN, and 3D-CNN) and four types of input data (HS, SS, SI, and HP) and their fusion model (NV). All networks were trained using a stochastic gradient descent (SGD) with AdaDelta and the mini-batch size was set to 32. The number of epochs was 30.
The results are shown in Table 11. The best performance model for each input data is marked in bold. For example, for HS models, the Precision was 0.598 for 2D-CNN, 0.657 for AlexNet-based CNN, and 0.668 for 3D-CNN. Thus, 3D-CNN performed best and 0.688 was marked in bold.
As shown in Table 11, 3D-CNN outperformed other network structures in most input data and evaluation metrics. This result suggests that 3D-CNN successfully captured meaningful relations between signals by considering participants as the third dimension in convolution. Moreover, 3D-CNN performed best for all input data. This is a meaningful result in terms of summarizing the meeting based on the detected important utterances. Thus, we conclude that 3D-CNN is the best network structure for our research purpose.
Based on the discussion above, we created the V-NV model by fusing the features from the V model and those from the NV model learned by 3D-CNN architecture. Table 12 shows the performances of the V-NV model and models learned by 3D-CNN architecture. The V-NV model was created by the same fashion in the NV model described in Section 4.2.3. Note that the number of dimensions of the vector input to the V-NV model is 640 (=128 × 5) since the input is a concatenation of the output vectors from 5 unimodal models: HS, SS, SI, HP, and V. The best performance model for each evaluation metric is marked in bold. The NV model performed best in Recall and F-measure, and the V-NV model performed best in Precision and Accuracy. These results suggest that the NV model detected important utterances in a more recall-oriented manner. On the other hand, the V-NV model cared more about classifying the utterances accurately. Note that the NV model outperformed all unimodal models in all evaluation metrics. While it has already been known that multimodal fusion is effective in traditional machine learning [71], we confirmed that this is also true in deep learning.
6.4. Comparison between Two Approaches
This subsection compares the model performance between the two approaches. Table 13 shows the best performing models for each approach based on the discussion in previous sections. The table shows the performance of LU, which is a naive baseline model, hand-crafted feature models (V_ALL, SP/OT, HC_V-NV), and deep learning models (the NV model, in which 3D-CNN was employed; the V model, which is a deep learning-based verbal model; and the V-NV model, which integrated all 3D-CNN-based nonverbal unimodal models and the V model). The best- and second-best-performance models for each evaluation metric were marked in bold and underline, respectively.
Comparing the nonverbal information models based on the hand-crafted features (SP/OT) and those based on deep learning (NV), NV was superior to SP/OT for all evaluation metrics. Likewise, the V model was superior to V_ALL, and V-NV was superior to HC_V-NC_NV. V-NV model performed best for all metrics, and all the differences were statistically significant in ANOVA and a post-hoc test (see Appendix). These results suggest that the feature expression learned using deep learning exceeds the manually defined features.
6.5. Performance using Manually Segmented and Transcribed Data
So far, we have evaluated the models using automatically detected utterances. To show the top performance of our models using ideal input data, this section evaluates the models using manually segmented and transcribed data. The procedure is completely identical to that described in previous sections, except for verbal information models. As there was no missing transcription, verbal information models judged all the input. In addition, as the maximum number of words in the manually transcribed utterance was 48, the size of the input vector of verbal information models in deep learning was changed to 48 × 219 × 1. In LU model, the top 60% of the longest utterances were selected as important ones according to the definition in Section 6.1.
Table 14 shows the model evaluation results. It is clear that the V-NV model performed best for all metrics, and the second-best model was NV. Moreover, ANOVA and a post-hoc test showed that the V-NV model was superior to all models in precision, F-measure, and accuracy (see Appendix) (In post-hoc test for recall rate, we could not prove that V-NV was significantly superior to GS. This is because the GS model is extremely recall-oriented. Moreover, in our research purpose, F-measure is much more important than the recall rate.) This indicates that fusing language information and nonverbal information yields the best performance if no segmentation/transcription error is included in the language data.
6.6. Discussion
6.6.1. Characteristics of Deep Learning Models
This section discusses the characteristics of deep learning models. The characteristics of hand-crafted features have already been discussed when we selected useful features in Section 4.1.4.
Characteristics of the verbal model
We investigated what types of utterances the V model more correctly detects as an important utterance or correctly rejects as not-important utterance compared to nonverbal models.
We converted each utterance in the corpus into a combinations of part-of-speech tags, and counted the combinations where TP of the V model was higher than that of the NV model (Table 15). As shown in Table 15, we found that such part-of-speech lists frequently contained one or more nouns and particles. In addition, part-of-speech tags that can serve as a predicate (e.g., verb) were frequently observed.
Conversely, when we looked at the negative examples (not-important utterances) that the V model successfully rejected, many of them included filler words such as “well” and “ah,” and interjections (Table 16). They were acknowledgments and approvals of others’ utterances, or mumbling to herself/himself. These utterances seemed not to be intended to communicate propositional content to other participants.
Characteristics of the nonverbal model
By observing cases where the nonverbal information model can estimate important utterances with higher performance than the verbal information model, we investigated the characteristics of important utterances captured by the nonverbal information model.
First, there were 450 positive cases that the NV model correctly detected, while the V model failed to detect. The average speech spectrogram and head motion images for these cases are shown in Figure 8. In such cases, the speaker’s speech spectrogram contained frequency ranges with higher amplitude (marked with brighter colors), indicating that the person was speaking. However, no such range appeared in other participants’ speech spectrograms. This means that one person spoke, while other participants were quiet. Likewise, in the head motion spectrogram, the speaker’s head motion had frequency ranges with brighter colors, indicating that the head motion was more active. On the other hand, the head motions of other participants were less active. These observations suggest that the NV fusion model successfully detects important utterances that were fully attended, and other participants listened quietly.
On the other hand, there were 503 negative cases that the NV model correctly detected and the V model failed to detect. In such cases, both the speaker’s and other participants’ spectrograms had frequency ranges with higher amplitude, indicating that both the speaker and other participants produced speech sound. The same trend was observed in the head motion spectrogram. These observations suggest that the NV fusion model successfully rejected non-important utterances when everyone was speaking and actively moving.
In Section 4.1.4, for selecting hand-crafted features, we discussed that a speaker of an important utterance spoke longer and slowly, and the situation was watched by several others. In addition, other participants listened to the utterance quietly while paying attention to their note. Based on these findings, we can conclude that the deep learning model captured nonverbal features similar to the carefully selected hand-crafted features.
6.6.2. Toward Meeting Summarization
We aim to generate a summary using the proposed model in the last step of this study. In extractive summarization, summaries are produced by identifying important statements and ordering them. Therefore, the summary length is changed according to the number of statements judged as important. To select an arbitrary number of utterances as meeting extracts, previous studies estimated the importance or saliency of a given utterance using machine learning and statistical techniques [48,72]. However, this paper proposes binary classification models, which do not estimate the degree of importance of each utterance as meeting extract.
To produce an arbitrary length of summaries, we used the probability obtained from the softmax function as the threshold to select an arbitrary number of meeting extracts. As the justification of this idea, we computed the correlation coefficient between the degree of importance of a given utterance and the score obtained from the softmax function of the V-NV fusion model. As the degree of importance, we used the agreement ratio; 0 (no one judged the utterance as important) to 1.0 (all five annotators agreed on selecting the utterance). As a result, a strong correlation was found between them (Pearson’s r = 0.77, p < 0.01). This suggests that our model allows to generate an arbitrary length of summary by changing the probability threshold in the softmax function.
7. Multimodal Meeting Browser
This section presents a multimodal meeting browser that implements the V-NV model. In addition to video and audio playing functionality, this browser can visualize the utterances and highlight the important utterances estimated by the model. As our estimation model detects important utterances based on multimodal and multiparty information, we expect that the multimodal meeting browser can support the users in understanding the role of each participant of the meeting as well as its contents. Furthermore, we examine whether the multimodal meeting browser is efficient in browsing the discussion.
7.1. System Design
To support the user in understanding the content, as well as role of each participant, of the meeting, we implement two main functions in the multimodal meeting browser: (1) Suggesting and visualizing the important utterances based on the estimated important utterances, and (2) displaying the video of the meeting to perceive its atmosphere. Figure 9 shows a snapshot of the browser.
Utterance visualization: A timeline of utterances (A in Figure 9) is placed at the bottom of the browser. Each utterance is visualized as a white block on the timeline with elapsed time. A video can be played at any point of the timeline.
Indicating the speaker and the content: By superimposing a semitransparent yellow rectangle (B) on the current speaker’s face image, the speaker is easily identified. Furthermore, the transcription of the current utterance is shown in area J. These functions support the user in understanding which participant spoke what utterance.
Visualization of important utterances: By moving the slider (C) on the right part of the browser, the users can adjust the number of utterances shown on the timeline. As discussed in Section 6.6.2, the probability obtained from the softmax function is used as the threshold to select an arbitrary number of meeting extracts. The user can change the threshold by moving the slider up and down. When the user moves the slider up, more important (but fewer) utterances are shown on the timeline. Figure 10 shows the browser when the slider is operated. In Figure 10a, all utterances are displayed (the slider is at the bottom), and in Figure 10b, only the important utterances are displayed (the slider is at the top).
Other features: The browser has many other functions. The user can play back and pause the discussion video shown in area E by using the button F. The time scale of the timeline can be changed by sliding the timeline zoom slider G. The playback position is changed by moving the playback position change slider I. In addition, by clicking on the utterance, the transcription of the utterance is displayed in J area (the utterance transcription display area).
Figure 11 shows the system components of the multimodal meeting browser. The inputs of the browser are a meeting video and a text file that records the start/end time of utterance, degree of importance estimated by the model, and transcription for each line. The system reads it and creates an object of each utterance to be placed on the GUI. The user can access the utterance object at any time via the slider on the GUI and adjust the amount of utterance displayed.
7.2. Conducting User Experiment
7.2.1. Hypotheses and conditions
We conducted an experiment to investigate whether the proposed multimodal meeting browser is useful for browsing a group meeting. We examined the following three hypotheses.
- H1: The multimodal meeting browser allows the users to understand the content of the discussion better than the text-based meeting browser.
- H2: The multimodal meeting browser allows the users to understand the role of each participant better than the text-based meeting browser.
- H3: The users’ impression on the multimodal browser is better than that on the text-based browsers.
As the conventional text-based browser, we implemented a browser that focuses on the utterance content. We called this the text-based browser. A snapshot of the text-based browser is shown in Figure 12. The utterances of each participant are marked in different colors (blue, red, green, and yellow). Similar to the multimodal meeting browser, the text-based browser suggests the important utterances based on the estimation results of the model. Similar to the multimodal meeting browser, the number of utterances shown on the browser is changed by moving the slider.
We also implemented a simple browser that did not have any summarization function. This browser is similar to a movie player, where only media playing and seeking functions are implemented. In using this browser, the subjects need to browse the whole discussion to perform the task. Therefore, we expect that the results obtained from the subjects using this browser are not affected by the important utterance estimation model or the browser functions. We use the summaries created by the subjects using this browser as the reference summaries.
7.2.2. Task
While observing the meeting videos using a browser, the subjects work on two tasks: creating a meeting summary and judging the participants’ roles. After browsing the video, the subjects are asked to answer a questionnaire for subjective evaluation about the browser.
For the meeting summarization task, the subjects are instructed to create a 180−200 character summary in Japanese. They are also instructed that the summary should be comprehensible for the readers to capture the whole discussion.
For the participant role judgment task, the subjects are asked to choose one person who is the best fit among the four participants for the description of a participant role. The list of descriptions for all participant roles is shown in Table 17. These statements are extracted from the definition of functional roles in the discussion proposed by [24].
The third task is answering a questionnaire after browsing the meeting. From the questionnaire, we collect the subject’s impression to the browser. We use the eight questions used in [63], such as “perceived ease of use” and “ease of search,” and add one item “usefulness of the browser.” The list of questions is shown in Table 18.
7.2.3. Procedure
Fifteen subjects (8 males and 7 females) participated in the experiment. The average age was 21.3 (SD = 1.12). We had six combinations (= three types of bowsers x two videos discussing different topics). Each subject participated in two sessions, in each of which he/she watched a different video with a different browser. The assignment of subjects was based on the Latin square design, and five subjects were assigned to each combination.
Before the experiment, the subjects awee explained the three types of browsers and had a training session to learn how to use the browsers.
When using the multimodal meeting browser or text-based browser, the subjects were required to complete the task (summarization and participant role judgment) in 15 min. In using the simple browser, the time limit was set to 40 min to give enough time to complete the task. Therefore, if the quality of summary using the multimodal meeting browser or the text-based browser was equal to that using the simple browser, it is proved that the function of visualizing the important utterances effectively supports the subjects in creating a summary. The subjects were paid for completing all tasks.
7.3. Results
H1: the multimodal meeting browser allows the users to understand the content of the discussion better than the text-based meeting browser.
To test this hypothesis, we compared the multimodal meeting browser and text-based bowser with respect to the quality of summaries that subjects created using these browsers. For this purpose, we used the summaries that the subjects produced by using a simple browser as reference summaries, and computed ROUGE scores for summaries using the multimodal meeting browser () and those using the text-based browser (). Figure 13 shows recall, precision, and f-measure values for ROUGE-1, 2, L, and SU4 scores. As shown in the graphs, for all ROUGE scores, was better than . This indicates that visualizing important utterances with multimodal contents is more useful in improving the user’s understanding of the discussion than only displaying the text information. Thus, H1 is supported.
H2: the multimodal meeting browser allows the users to understand the role of each participant better than the text-based meeting browser.
To test this hypothesis, we analyzed the results of the participant role judgment task. First, we computed the ratios that a person was selected for each description. For example, if a person was chosen from three out of five subjects for a given description, the ratio is 0.6. These ratios were calculated for all participants for all descriptions. Then, using these values, we computed Spearman’s rank correlation between the multimodal meeting browser and the simple browser, as well as the text-based browser and the simple browser. The results are shown in Table 17.
The values shown in the table are the average of the correlations of two topics. The average correlations higher than 0.8, which is a strong correlation, are shown in bold. As shown in the table, strong correlations are more frequently observed between the judgments using the multimodal meeting browser and those using the simple browser, compared to the correlations between the text-based browser and a simple browser. Suppose that the subjects who use the simple browser observe the discussion as long as they need and most correctly evaluate the participant roles. Thus, the subjects more correctly evaluate the participant roles using the multimodal meeting browser than that using the text-based browser.
For individual roles, people can find the Attacker and Protagonist more correctly using the multimodal meeting browser than the text-based browser. On the other hand, the text-based browser is more suitable for finding the Supporter. However, for the Orienter and Gate keeper, clear results were not found. These results suggest that the multimodal browser is useful in finding a person who proactively claims his/her opinions. By contrast, the text-based browser more suitably finds a person who does not actively participate in the interaction and is more agreeable and supportive. Therefore, hypothesis H2 is partially supported.
H3: users’ impression on the multimodal browser is better than that on the conventional browsers.
Finally, we analyzed the subjects’ impression to the browsers. We asked eight questions on a 5-point Likert scale to the subjects after browsing the discussion. The average value and the results of the t-test that examines the difference of the average score between the multimodal meeting browser and the text-based browser are shown in Table 18.
As shown in the table, the subjects have a better impression on the multimodal meeting browser than the text-based browser for all aspects. The difference is statistically significant in “general task comprehension,” “task success,” and “usefulness of the browser,” and the difference in “ease of use” has a trend toward significant. Therefore, the subjects perceived that the multimodal meeting browser was easier to use, easy to understand the task, and more useful than the conventional text-based browser.
8. Conclusions and General Discussion
By focusing on the co-occurrence of multiple social signals among multiple participants, this study proposed a verbal-nonverbal model to detect important utterances contributing to a meeting summary. In Section 4, Section 5 and Section 6, we created prediction models by employing two approaches–a handcrafted feature and deep learning–and compared the model performance in Section 6. The best handcrafted feature model achieved 0.707 in F-measure, and the deep-learning based verbal and nonverbal model (V-NV model) achieved 0.827 in F-measure when using manually segmented utterances.
Then, we implemented a meeting browser using our best performance model (V-NV model), and conducted a user study. The results of the experiment showed that the proposed meeting browser contributed to a better understanding the content of the discussion and the role of participants in the discussion than the conventional text-based browser. It was also suggested that the proposed browser helps the user to observe the participants who are actively speaking, but is not very helpful in detecting participants who support the others and do not actively participate in the discussion.
As future directions, first, we need to add more modalities. In the MATRICS corpus, we collected eye gaze and body motion data, but these data were not used in training the models. Combining these data with those used in this study will contribute to exploring meaningful co-occurrence patterns. For example, this study only used head-gaze. It is expected that by combining head-gaze and eye-gaze data, more accurate prediction may be possible. It is also necessary to improve the structure of deep neural network by employing a attention mechanism and other state-of-the-art techniques of deep learning. It is also necessary to improve the V model because our current V model is simple. It would be beneficial to incorporate state-of-the-art NLP techniques such as a hierarchical encoder [45] and transformer [73] into our prediction model. Finally, intriguingly, our meeting browser was useful in observing participants with some specific roles, but not for those with other roles. To tackle this problem, we need to create models to detect different types of important utterances and display them distinguishably on the meeting browser.
Author Contributions
Conceptualization, F.N. and Y.I.N.; Methodology, F.N.; Software, F.N. Validation, F.N. and Y.I.N.; Formal analysis, F.N.; Investigation, F.N. and Y.I.N.; Resources, Y.I.N.; Data curation, F.N.; Writing—original draft, F.N. and Y.I.N. Writing—review and editing, F.N. and Y.I.N.; Visualization, F.N.; Supervision, Y.I.N.; Project administration, Y.I.N.; Funding acquisition, Y.I.N.
Funding
This research was funded by JST CREST, grant number JPMJCR14E3.
Acknowledgments
This study was partially supported by RIKEN AIP.
Conflicts of Interest
The authors declare no conflict of interest. The funders had no role in the design of the study; in the collection, analyses, or interpretation of data; in the writing of the manuscript, or in the decision to publish the results.
Appendix A
Table A1 shows the results of ANOVA and a post-hoc test for automatically detected utterances (Table 13) and Table A2 shows the results for manually segmented utterances (Table 14).

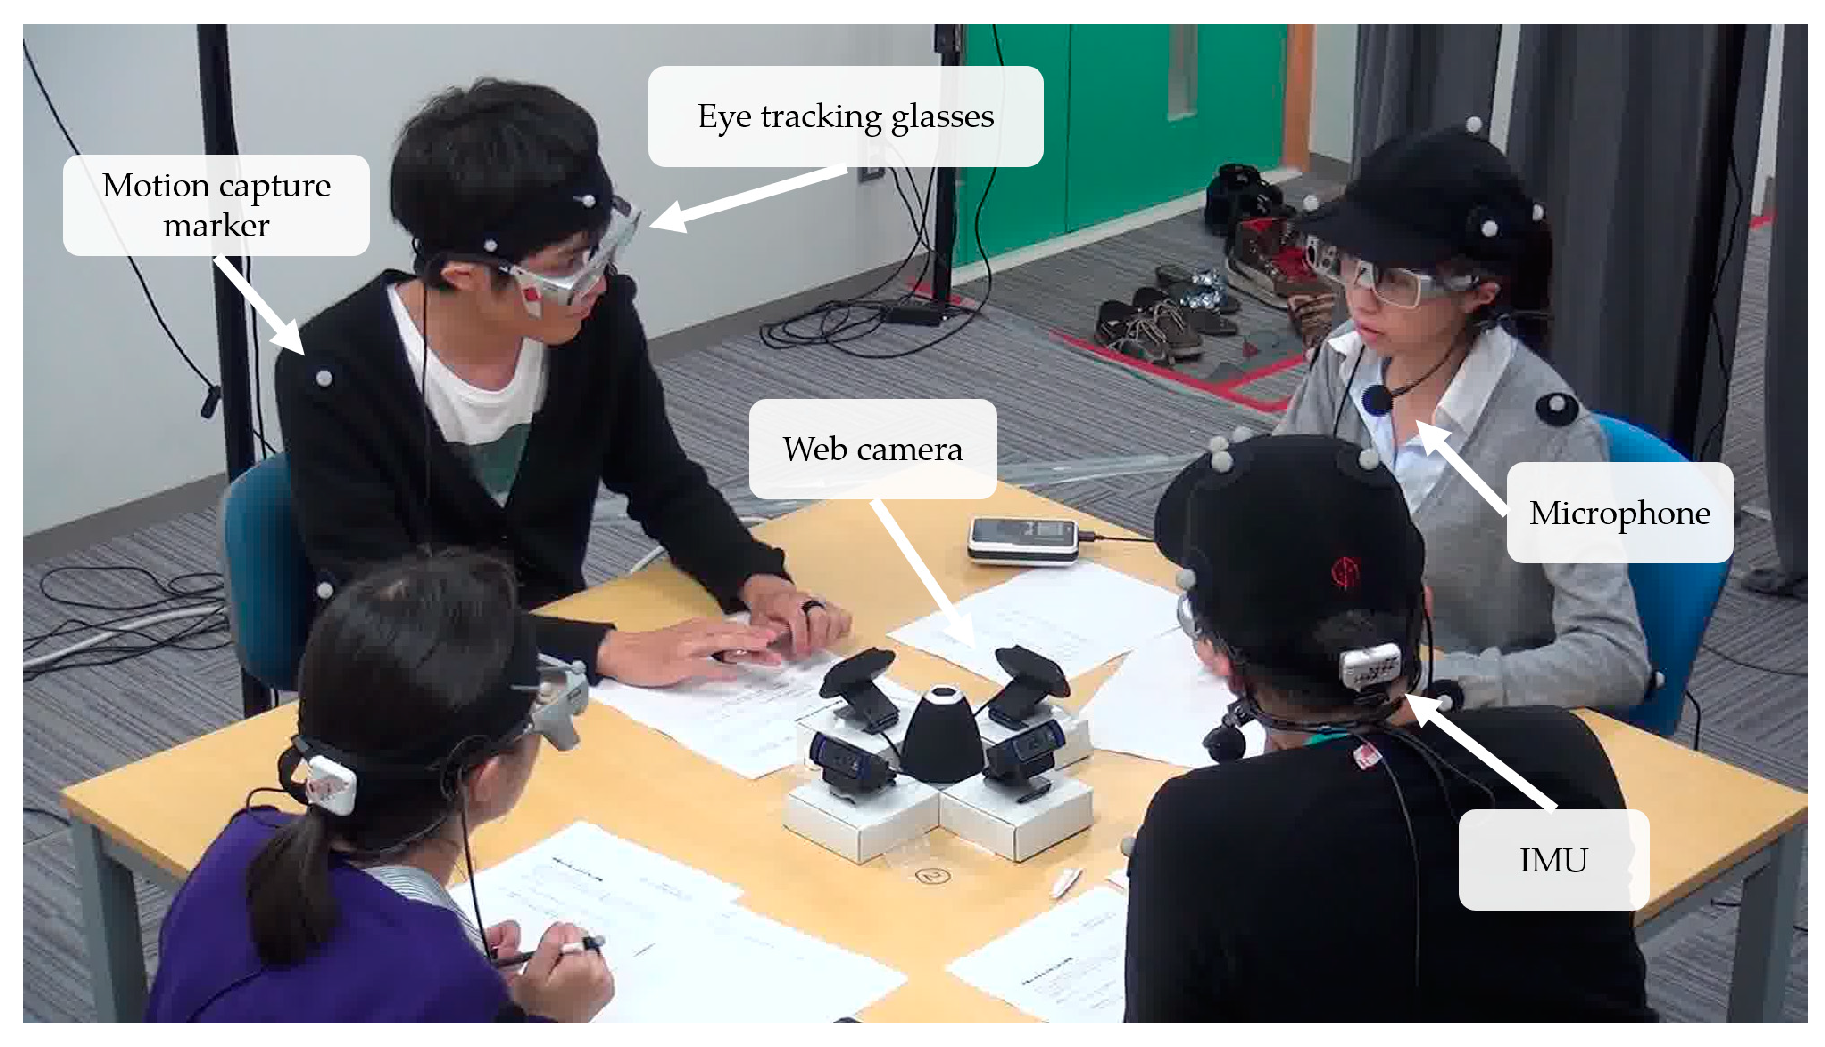
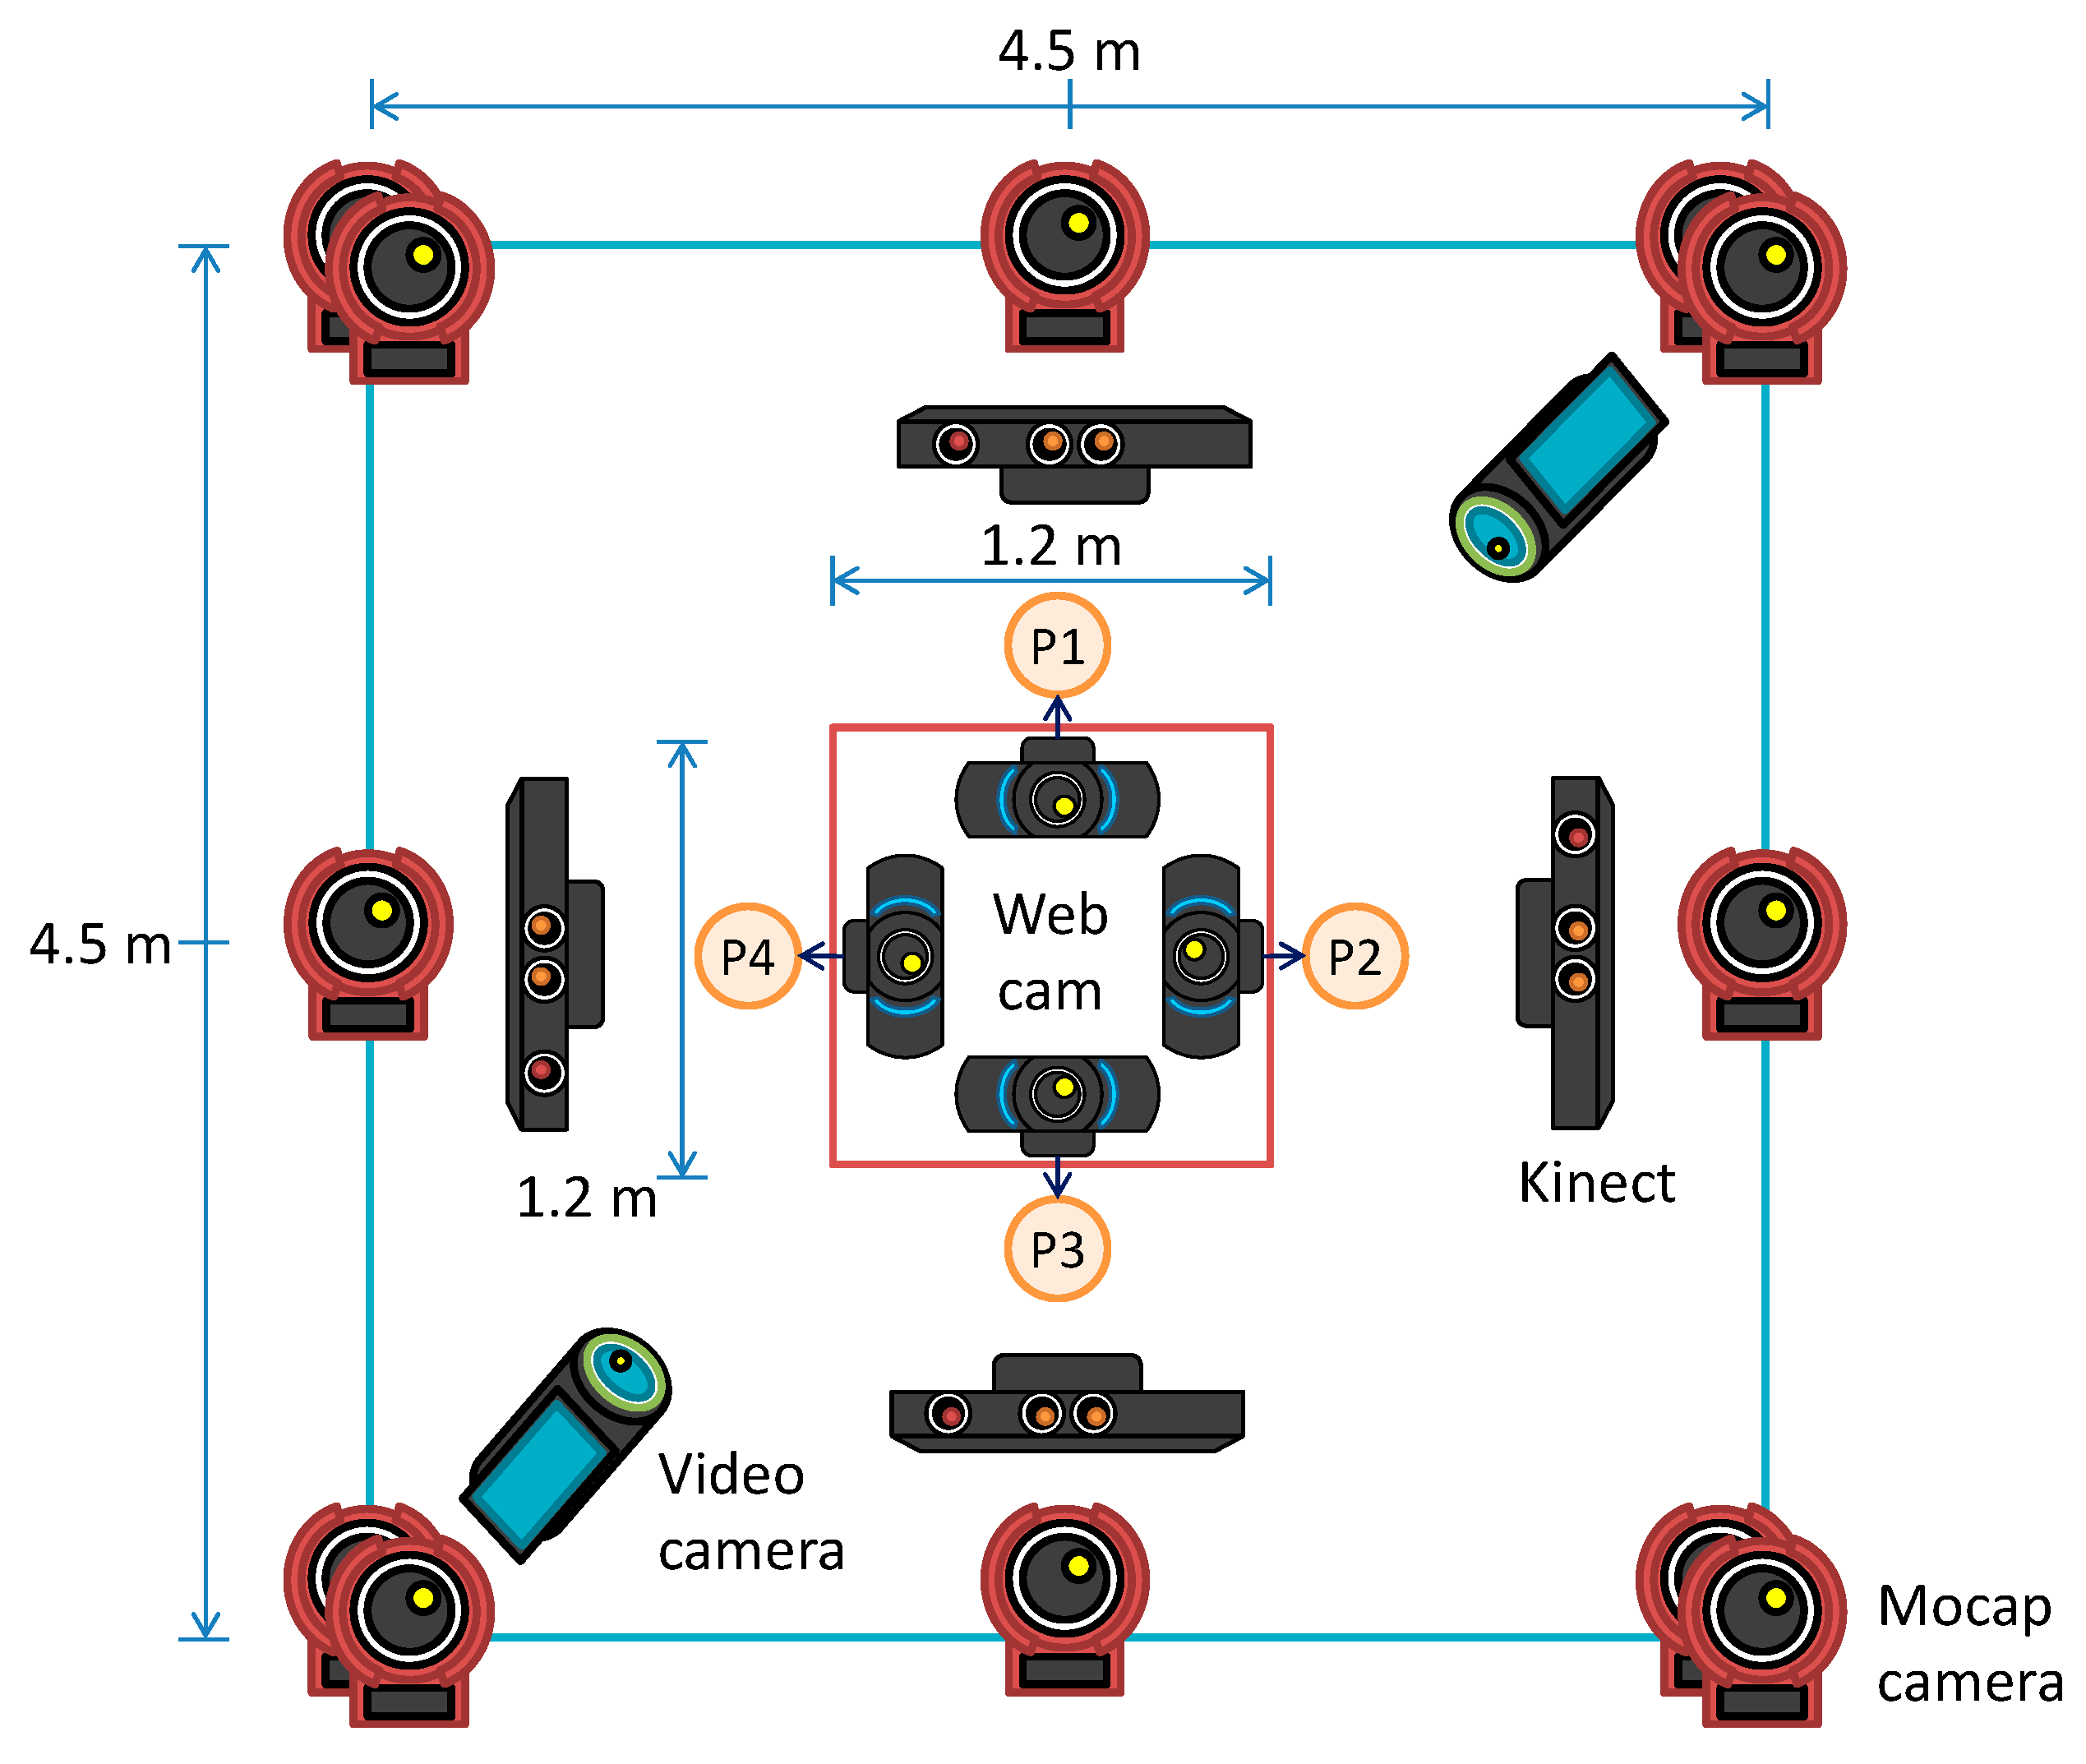
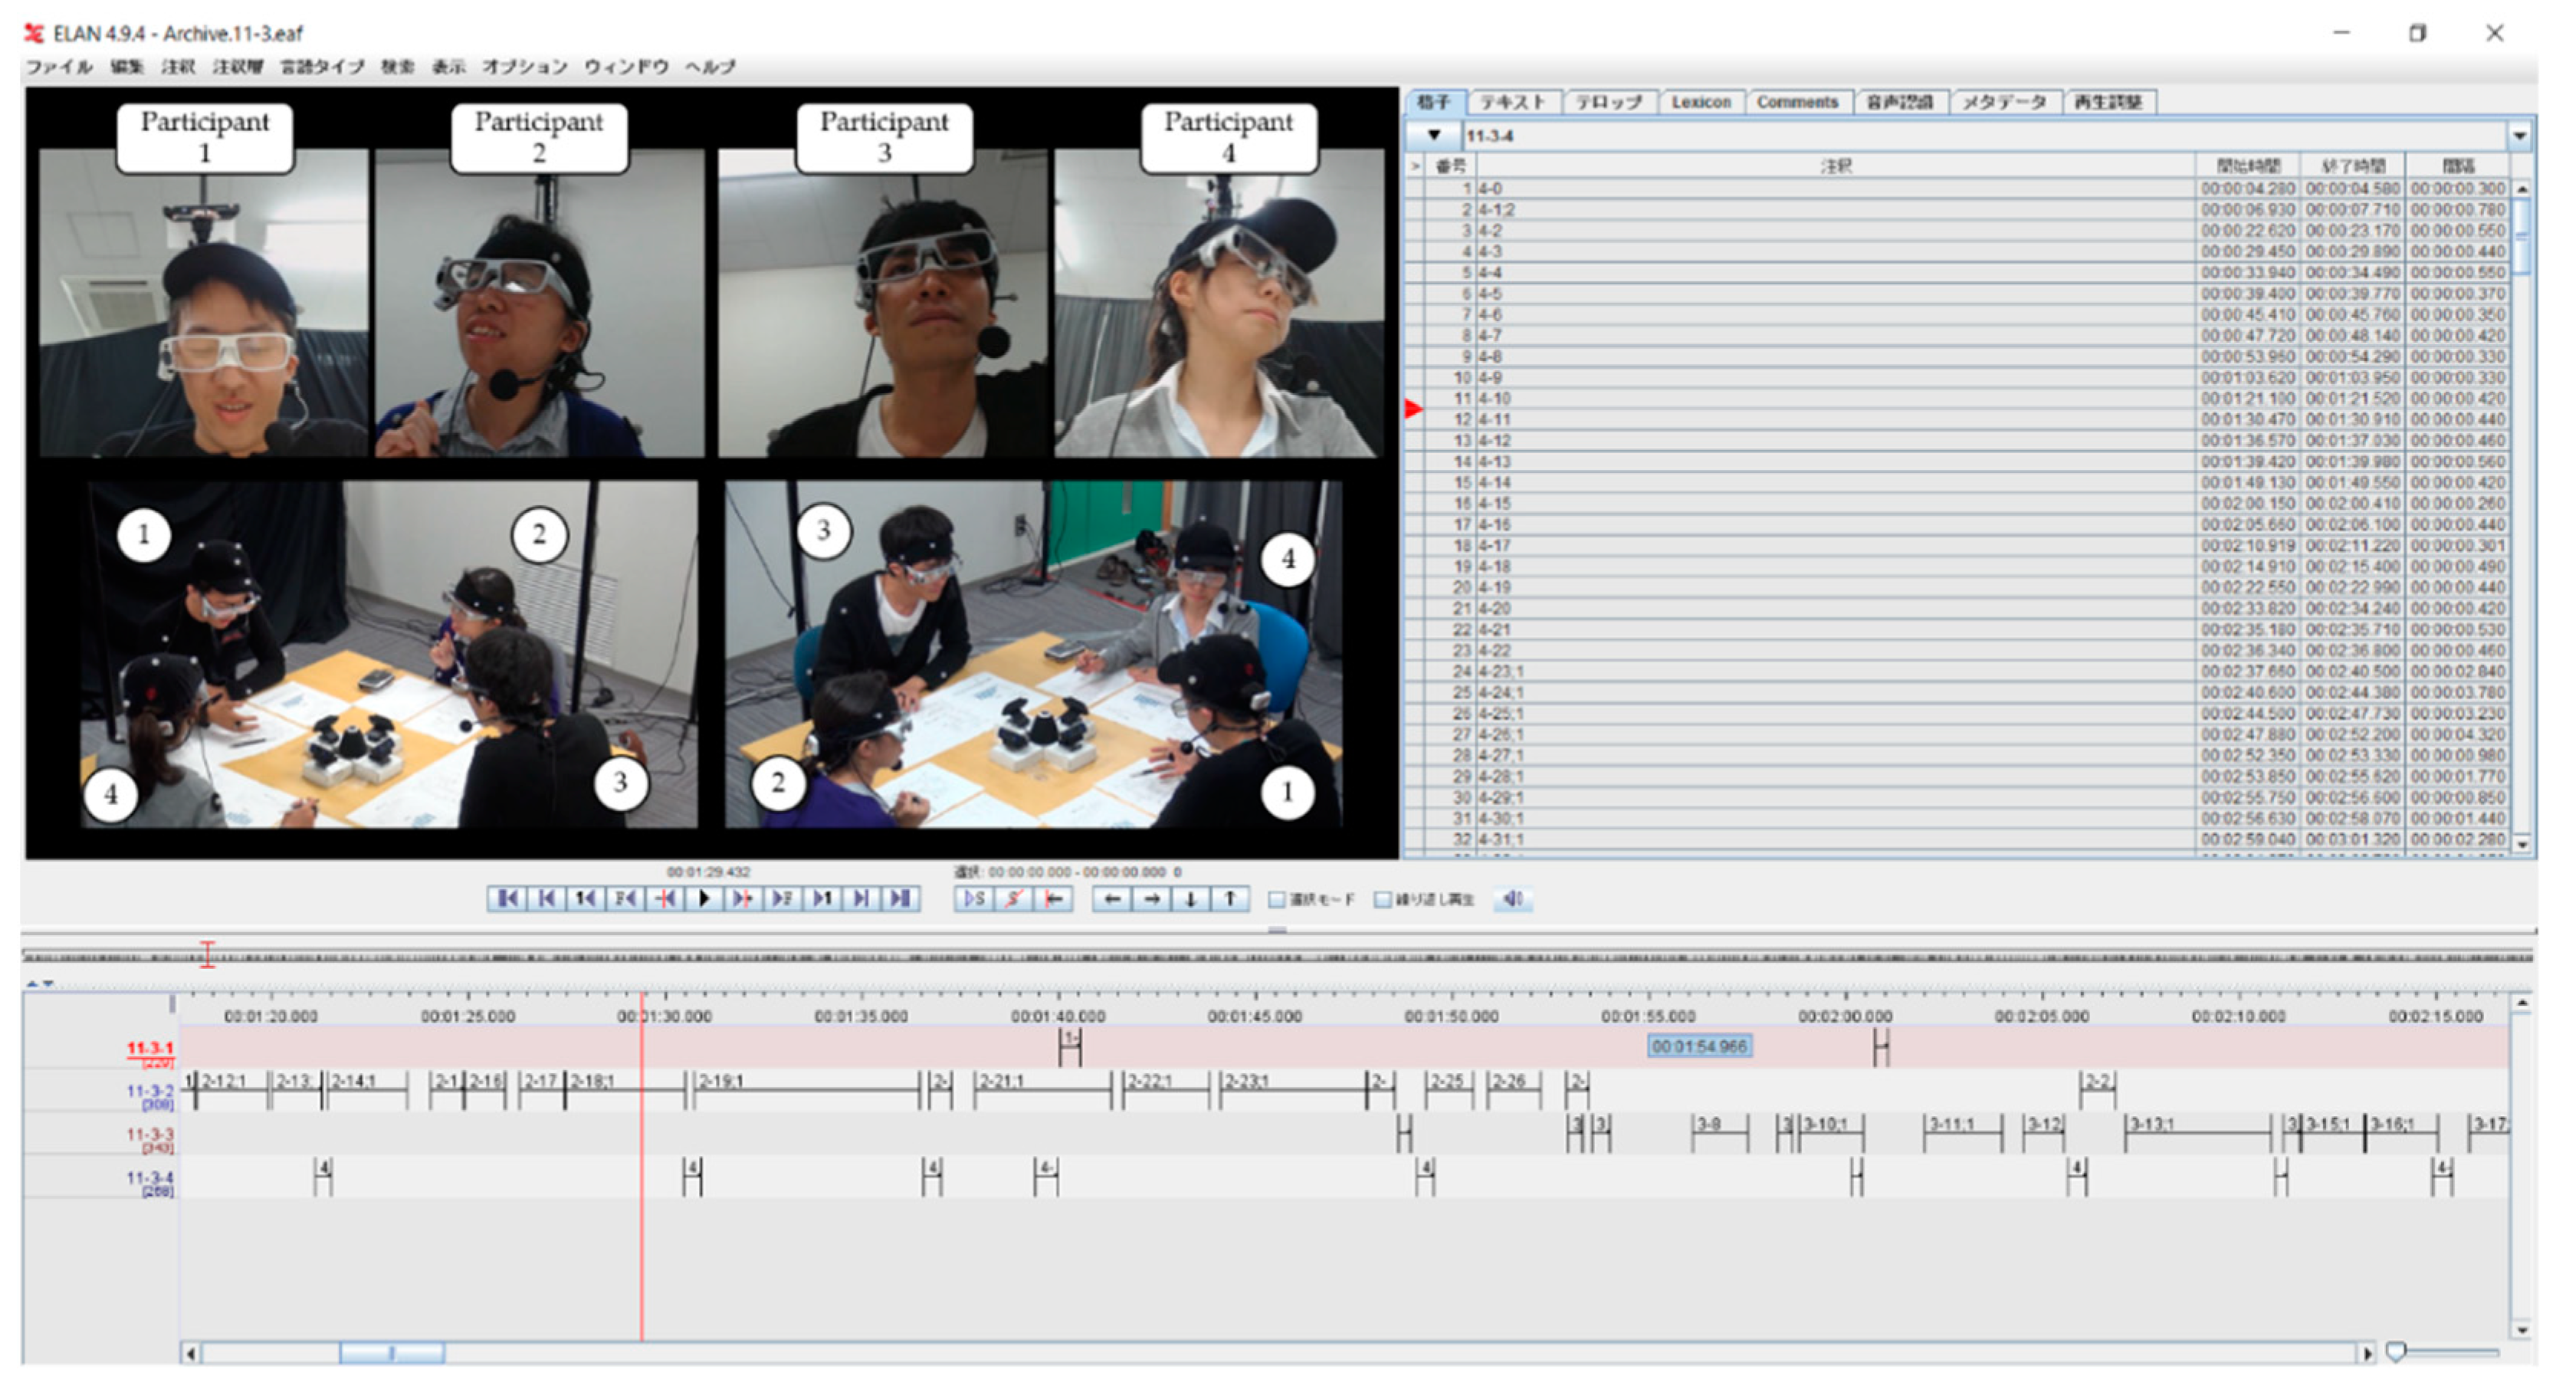
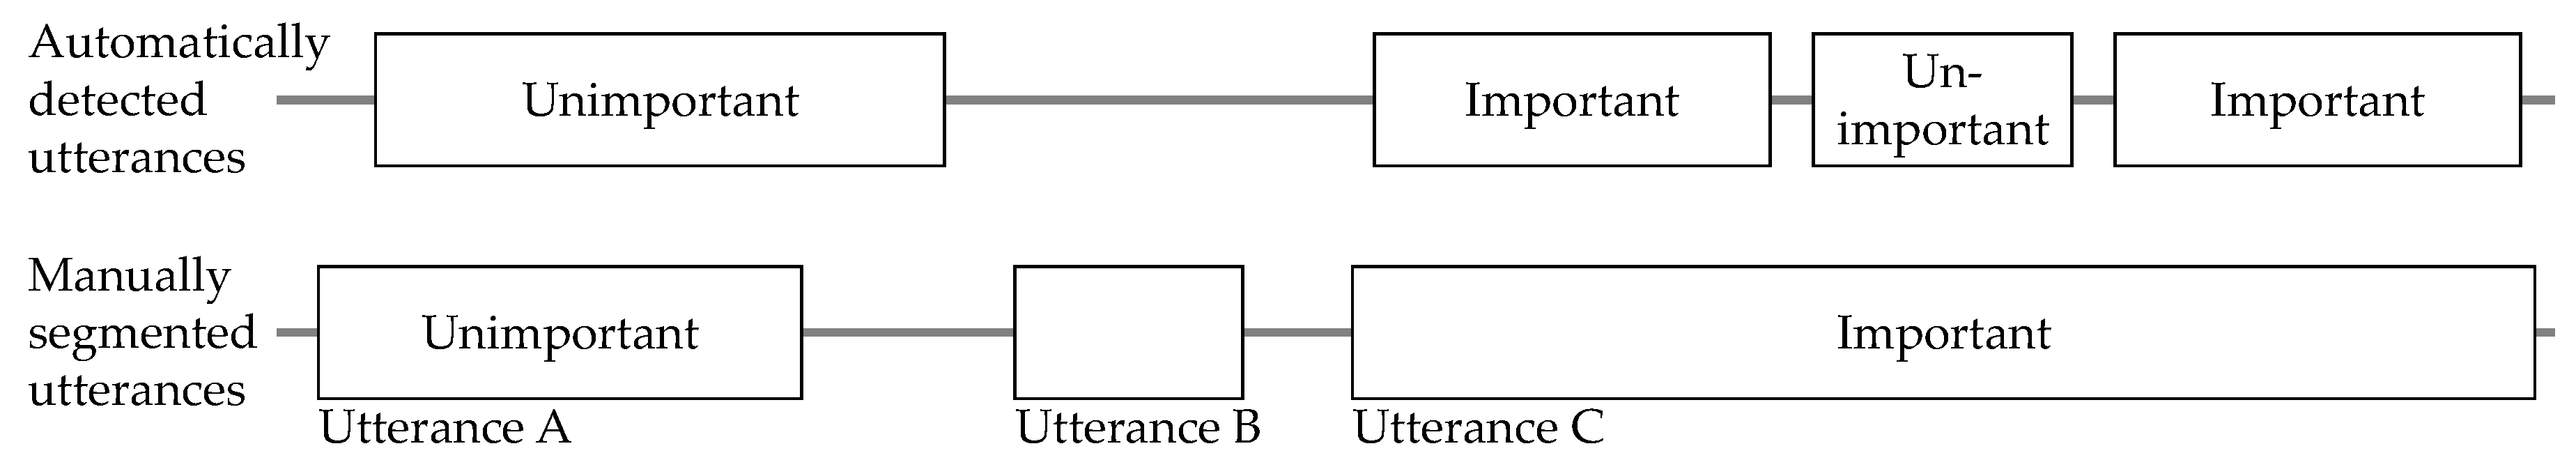
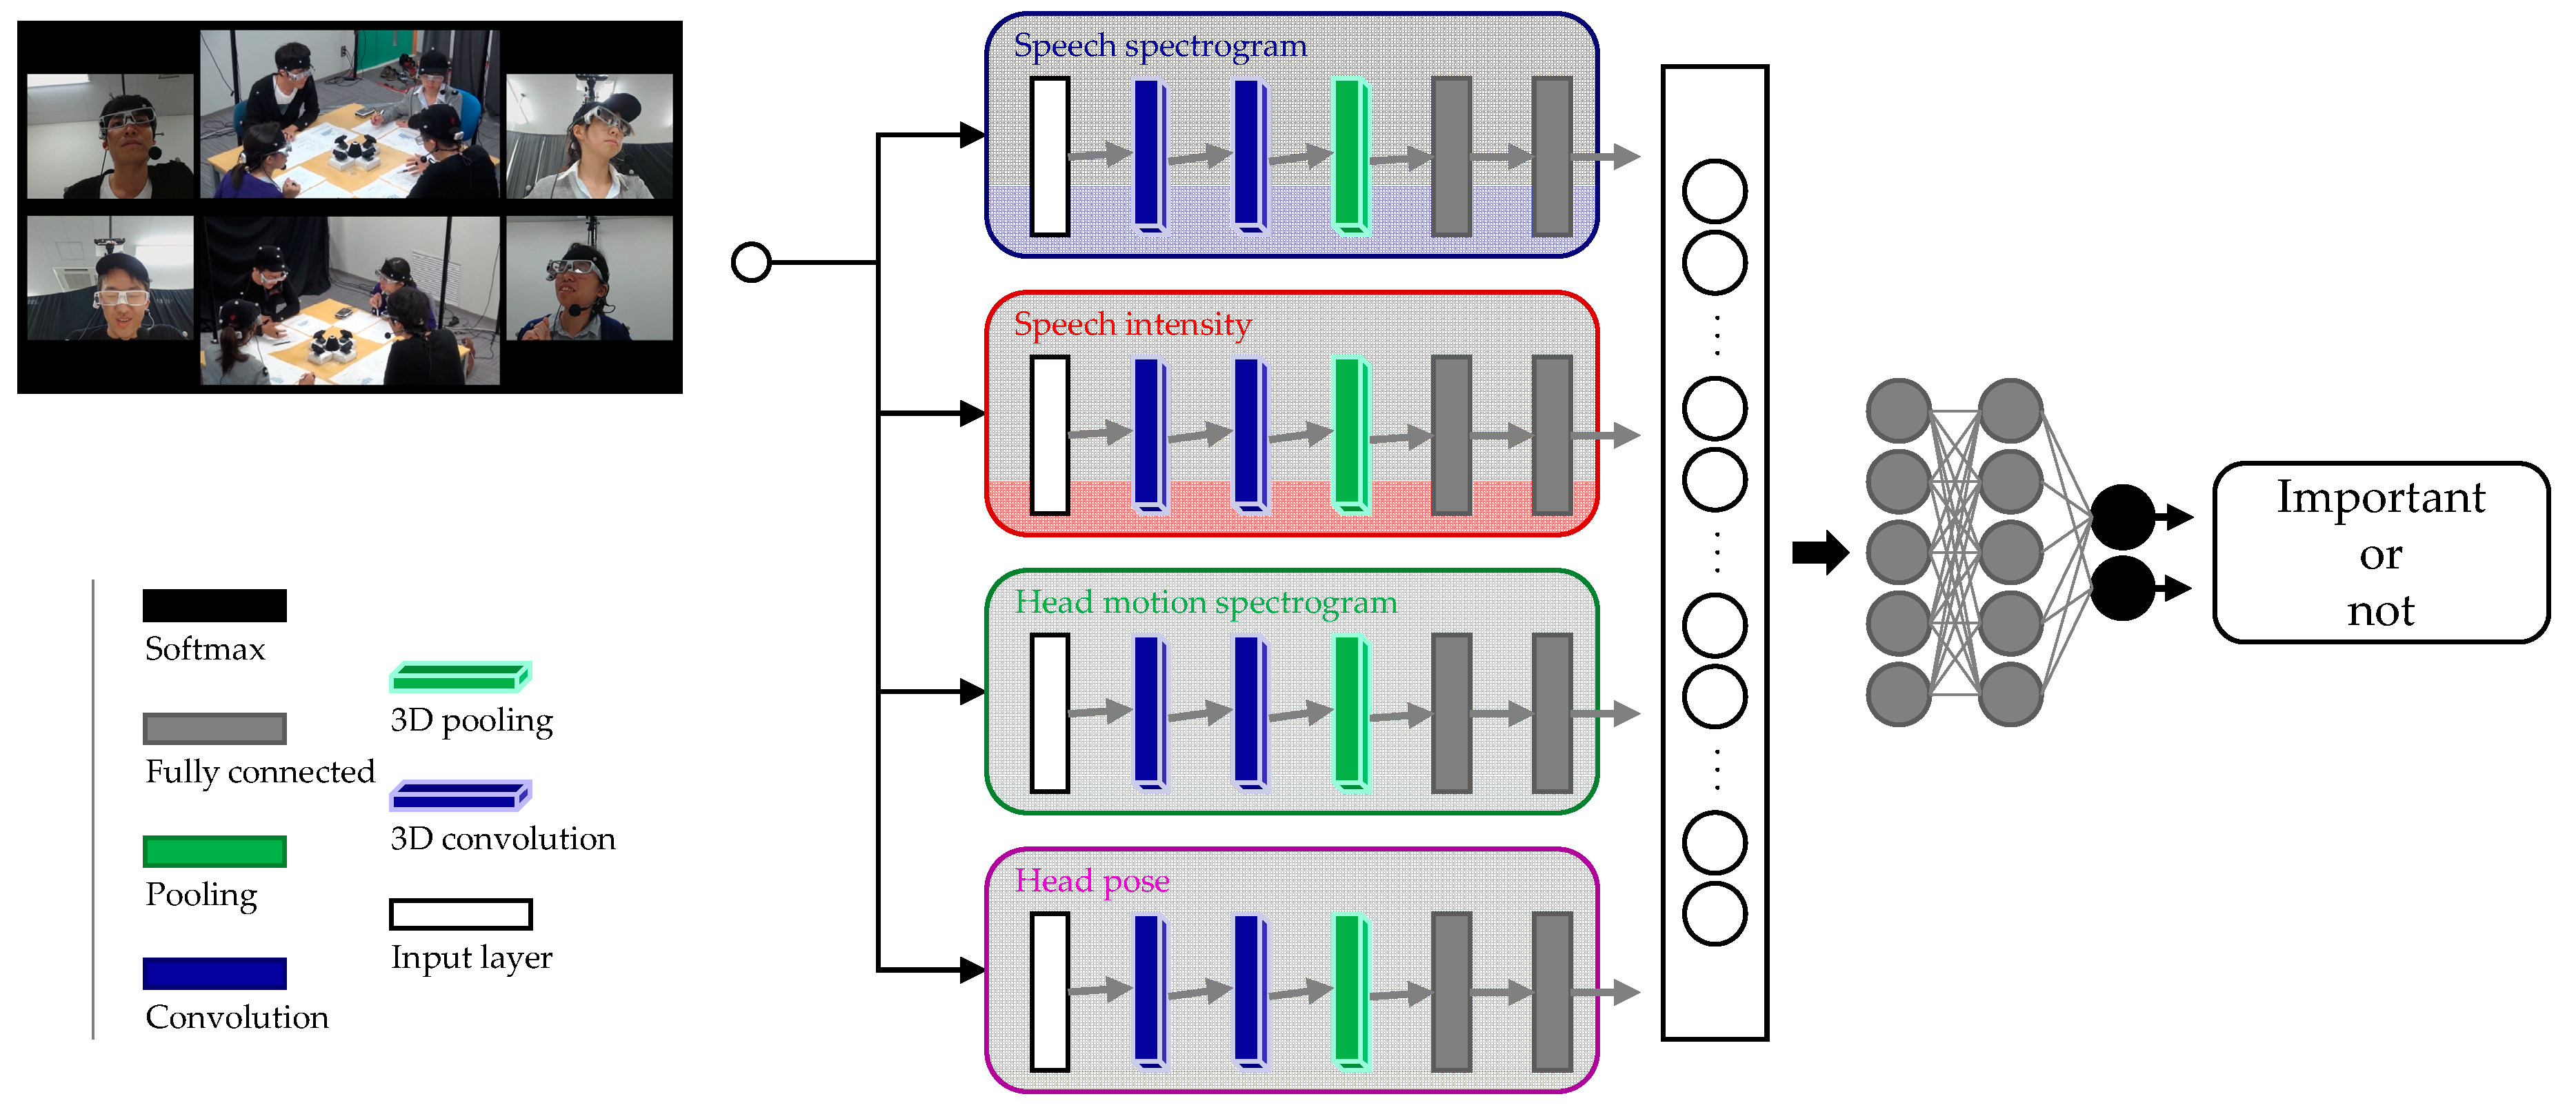
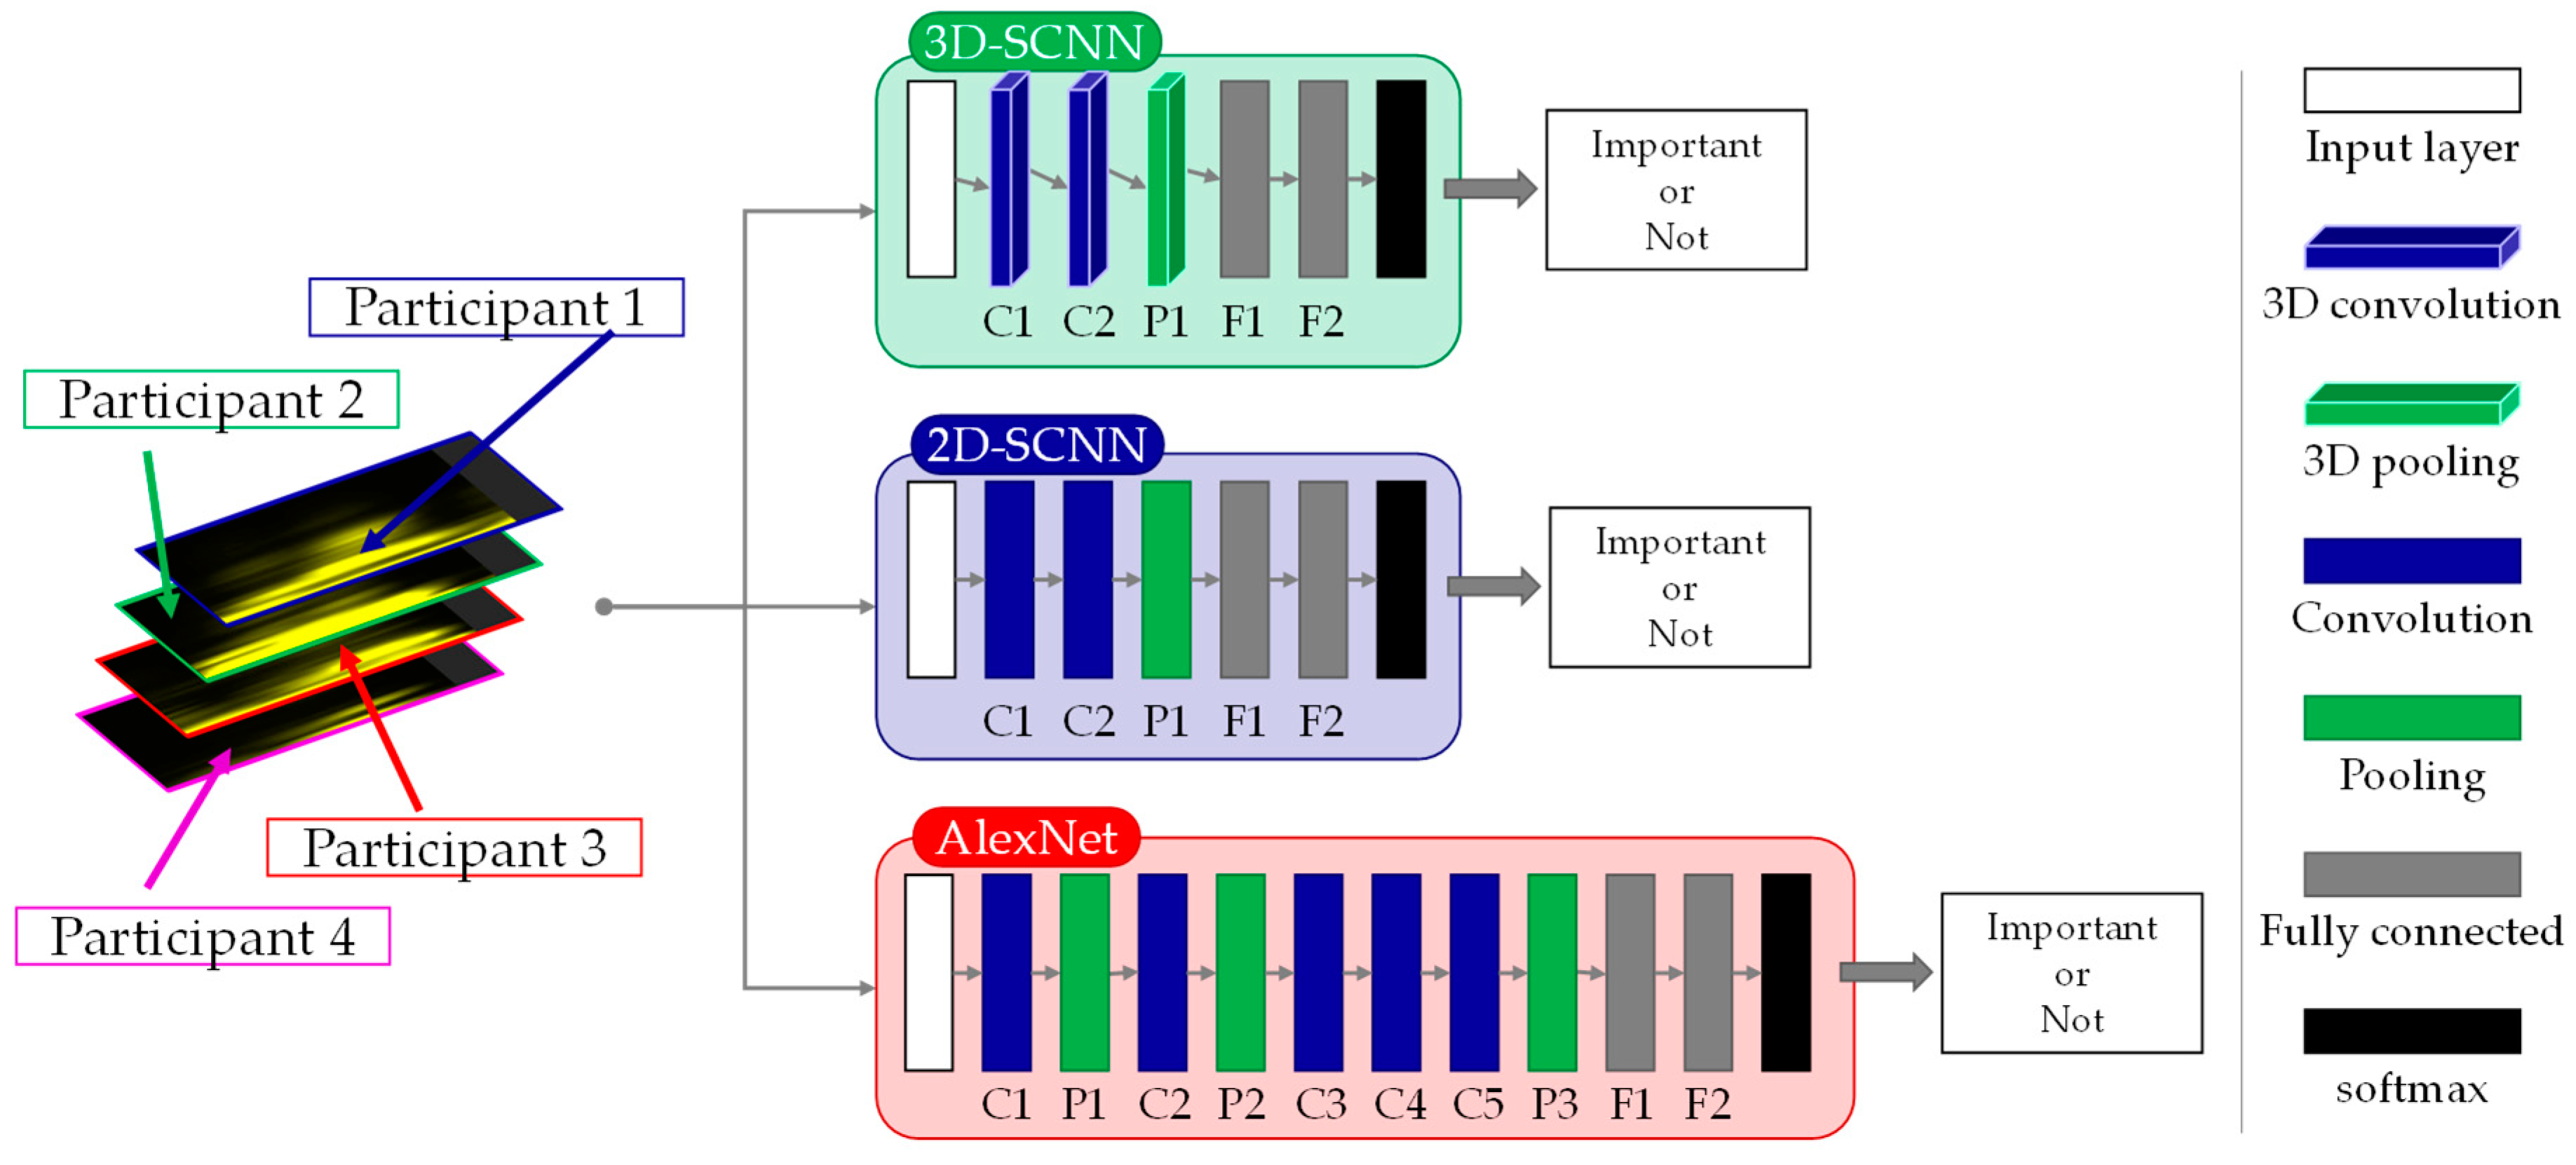
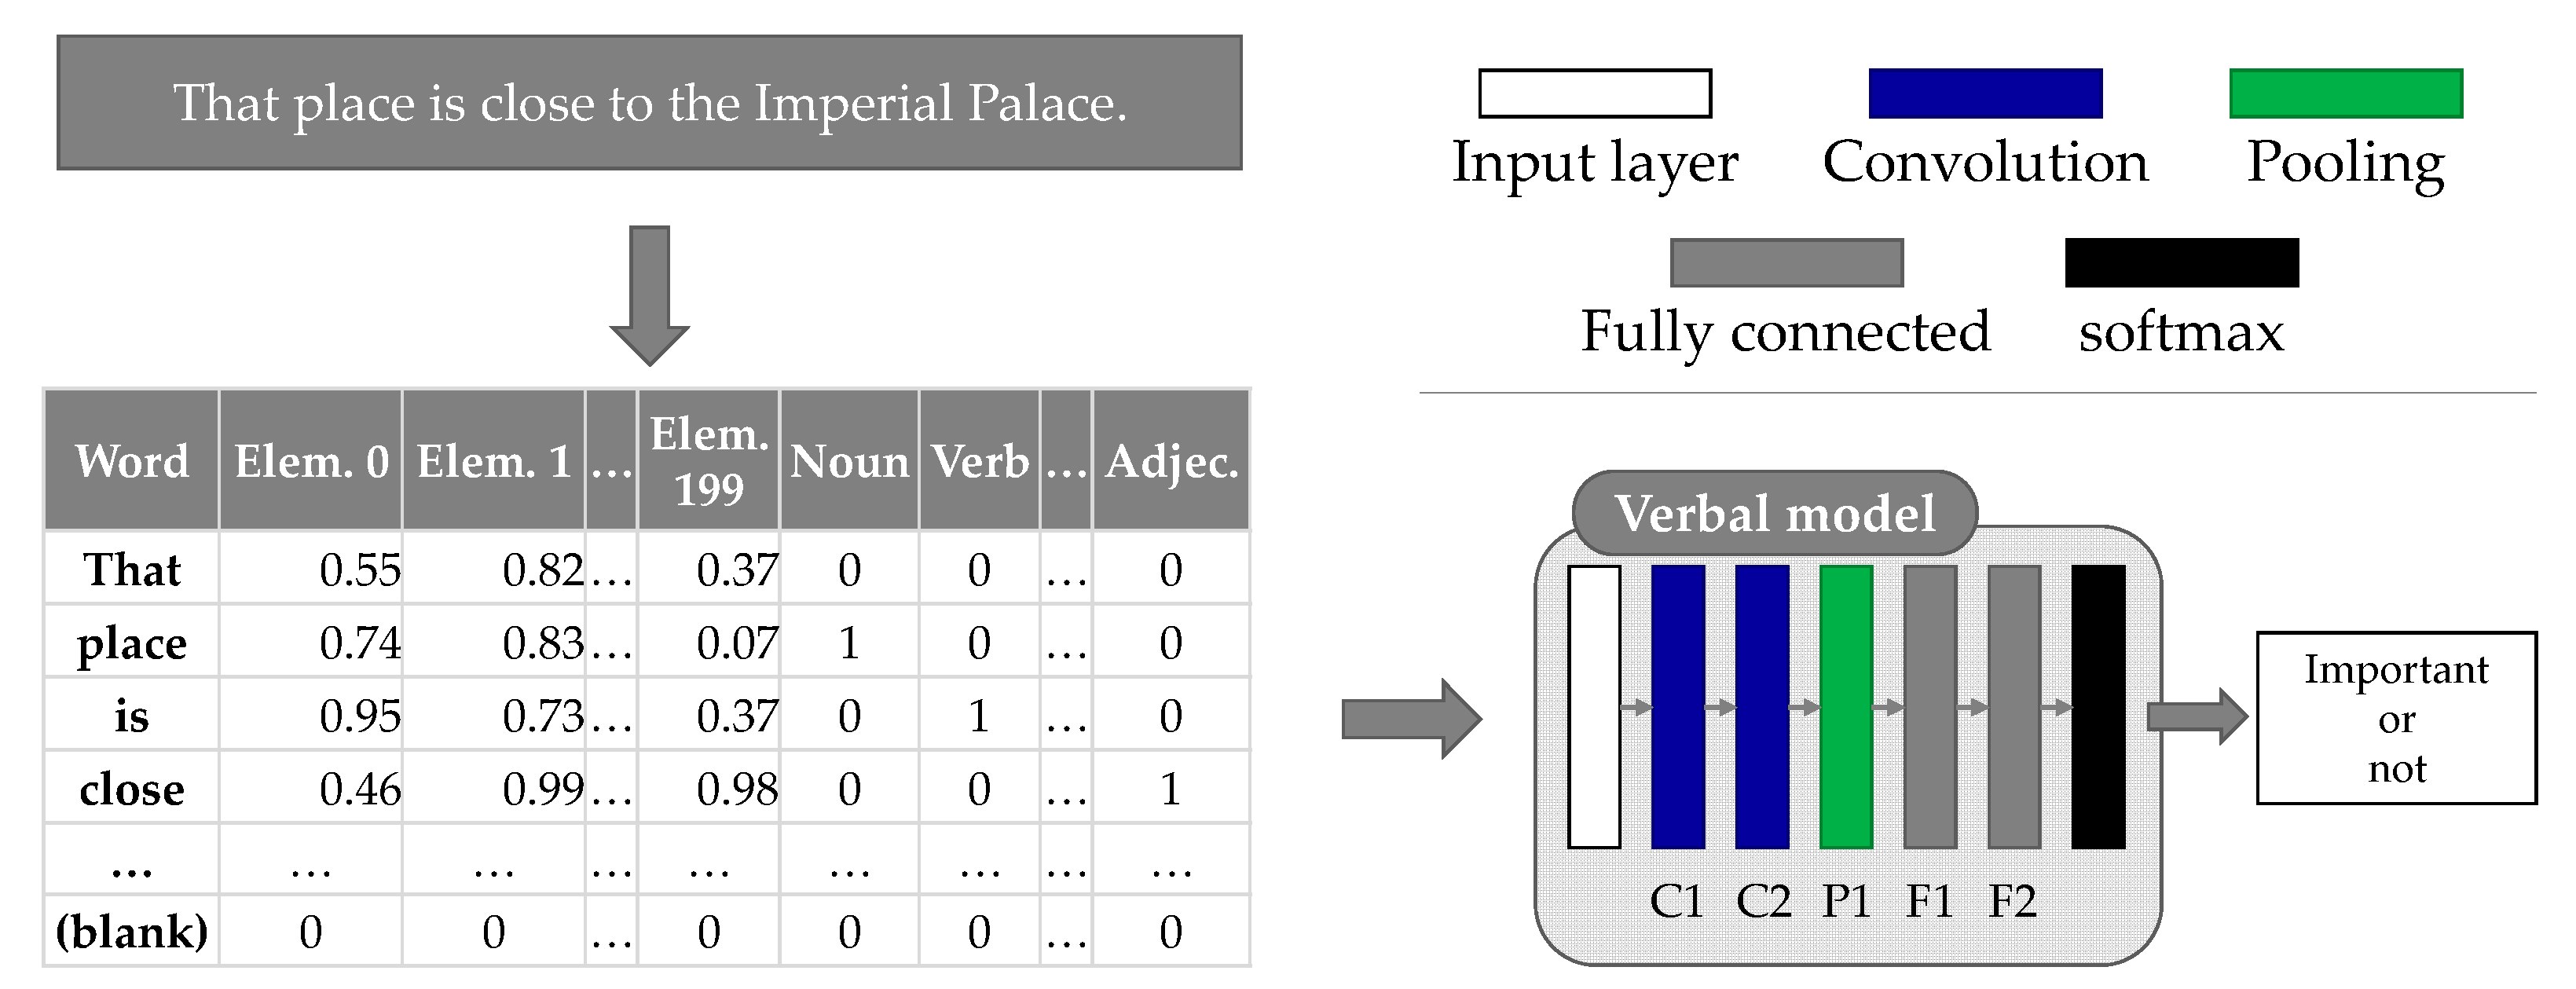
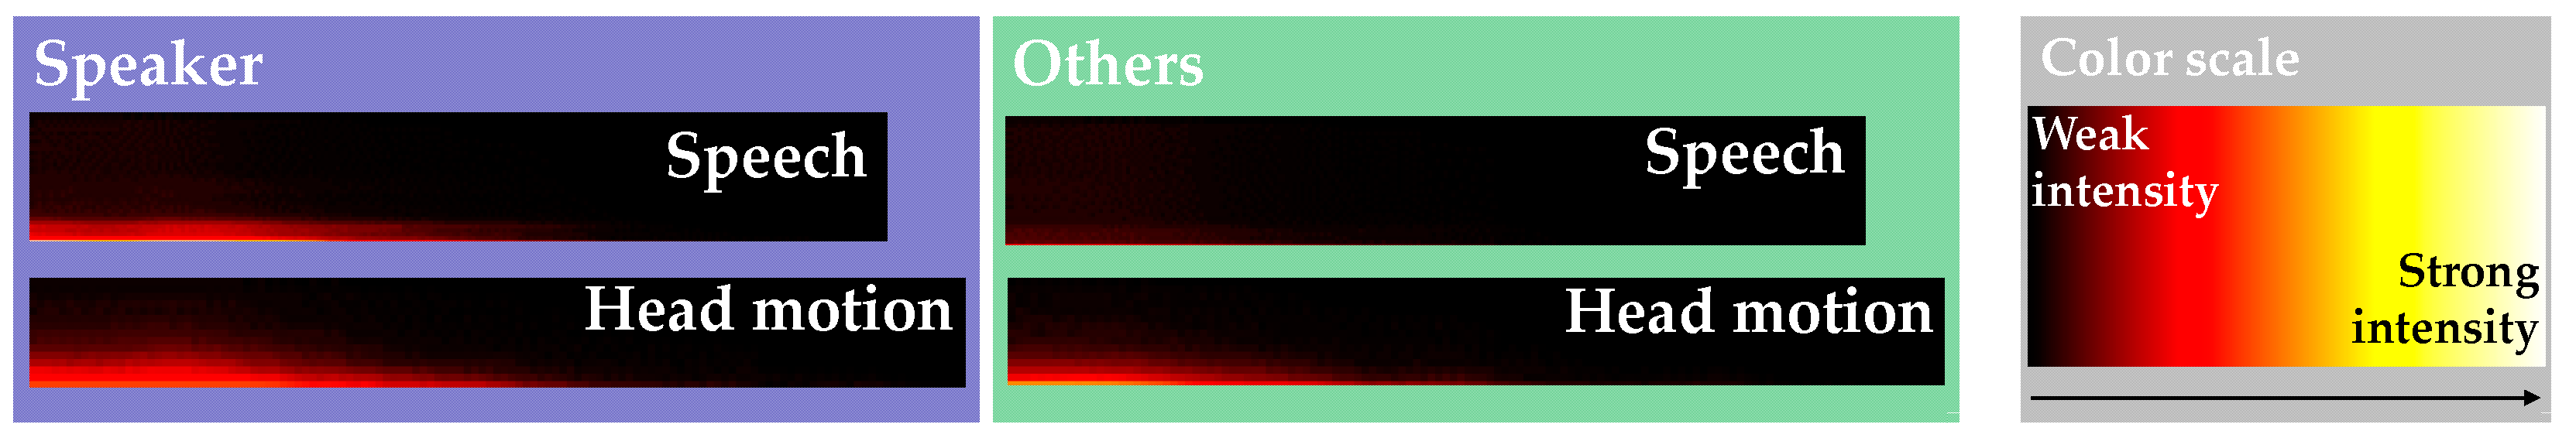
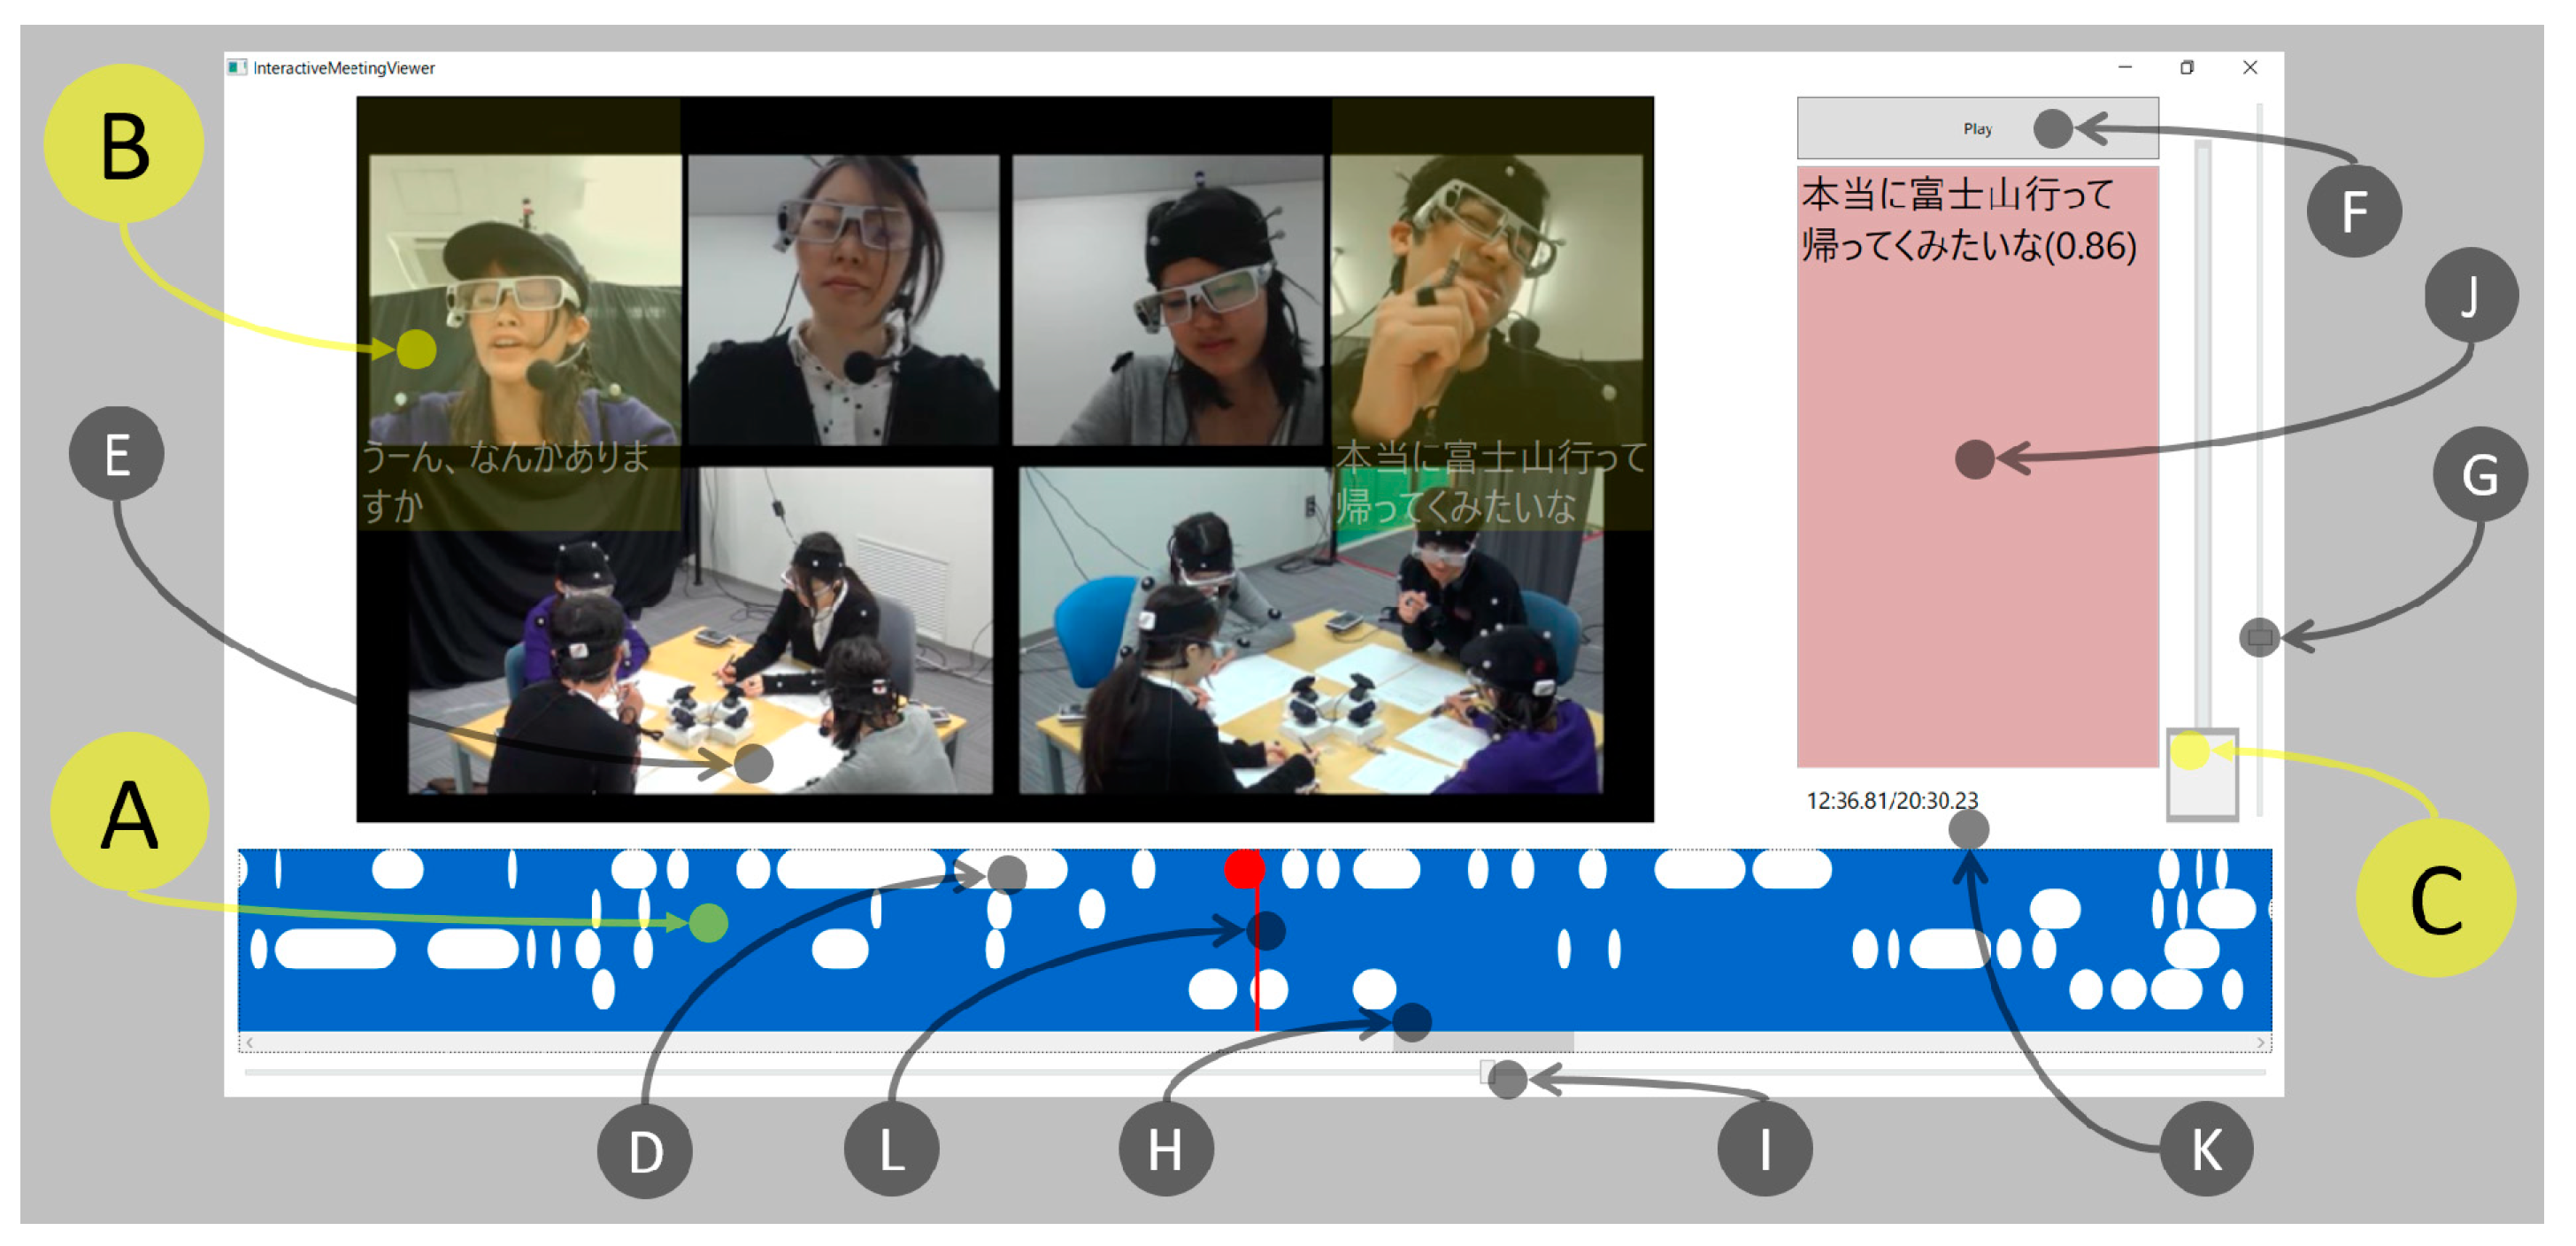
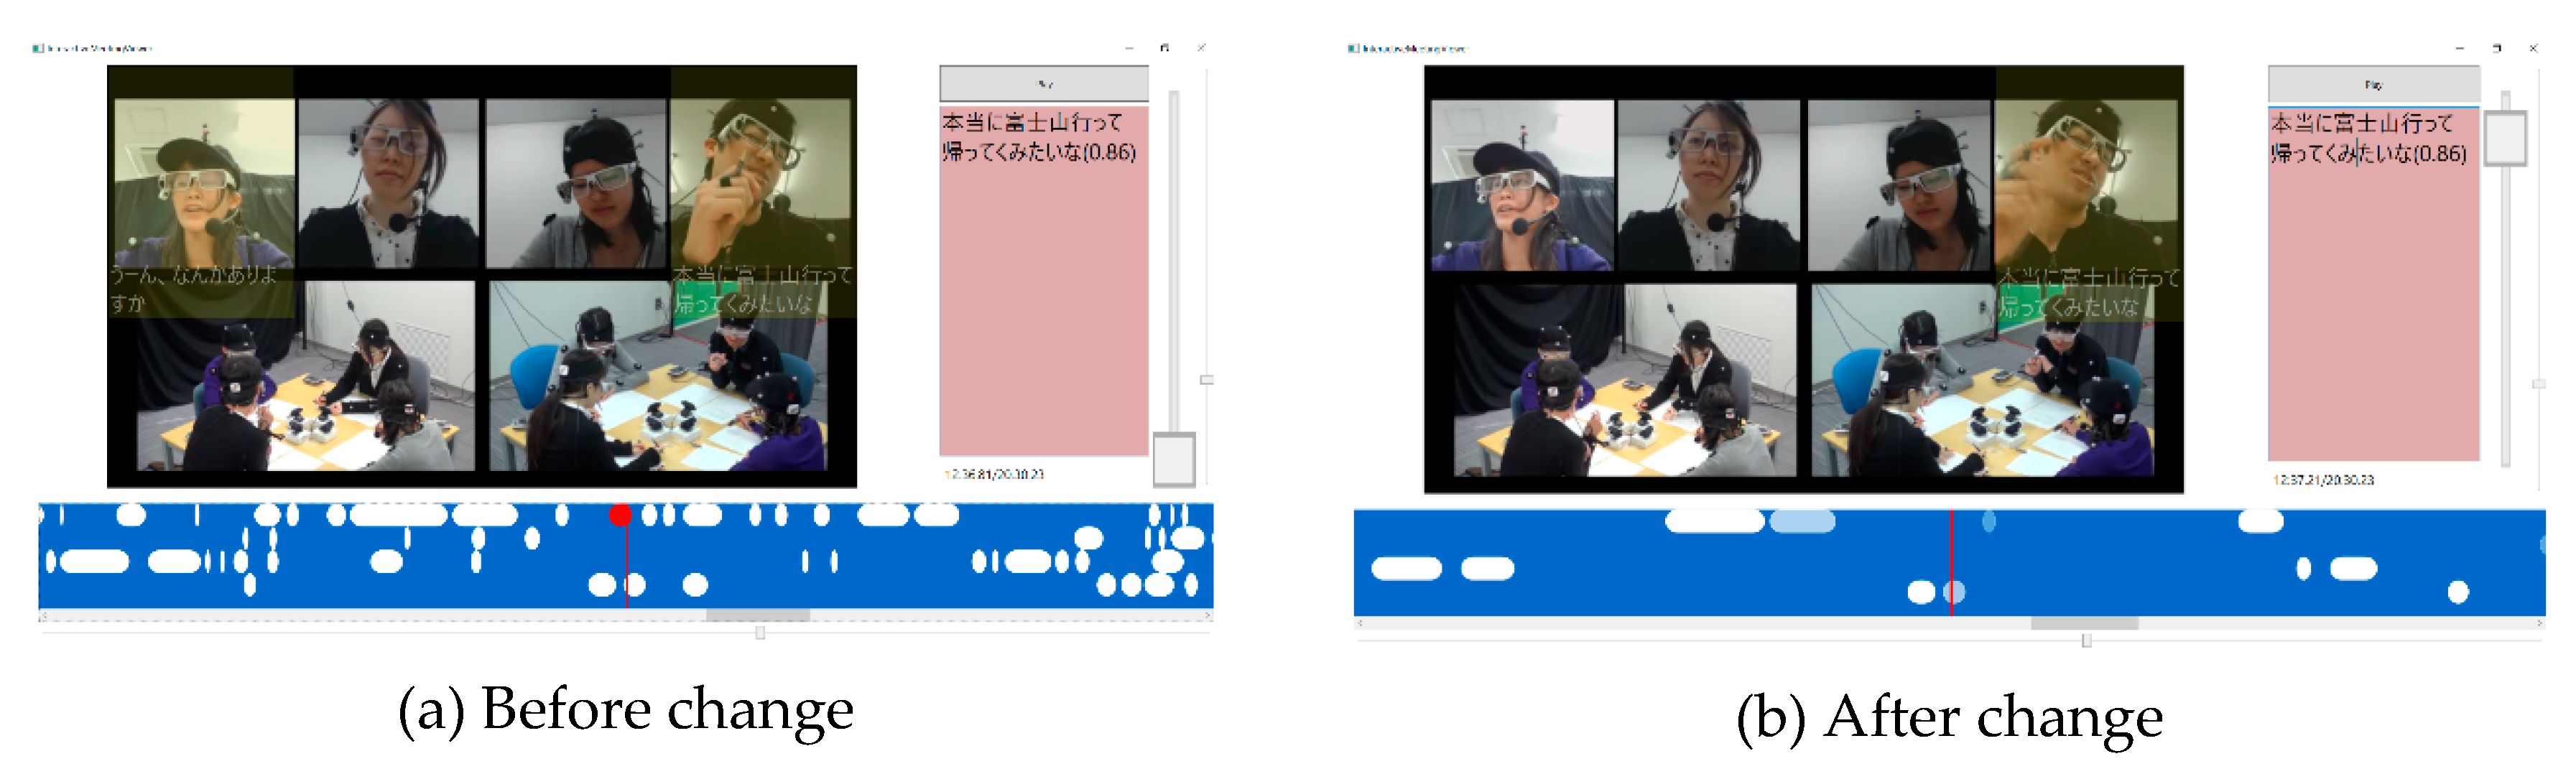
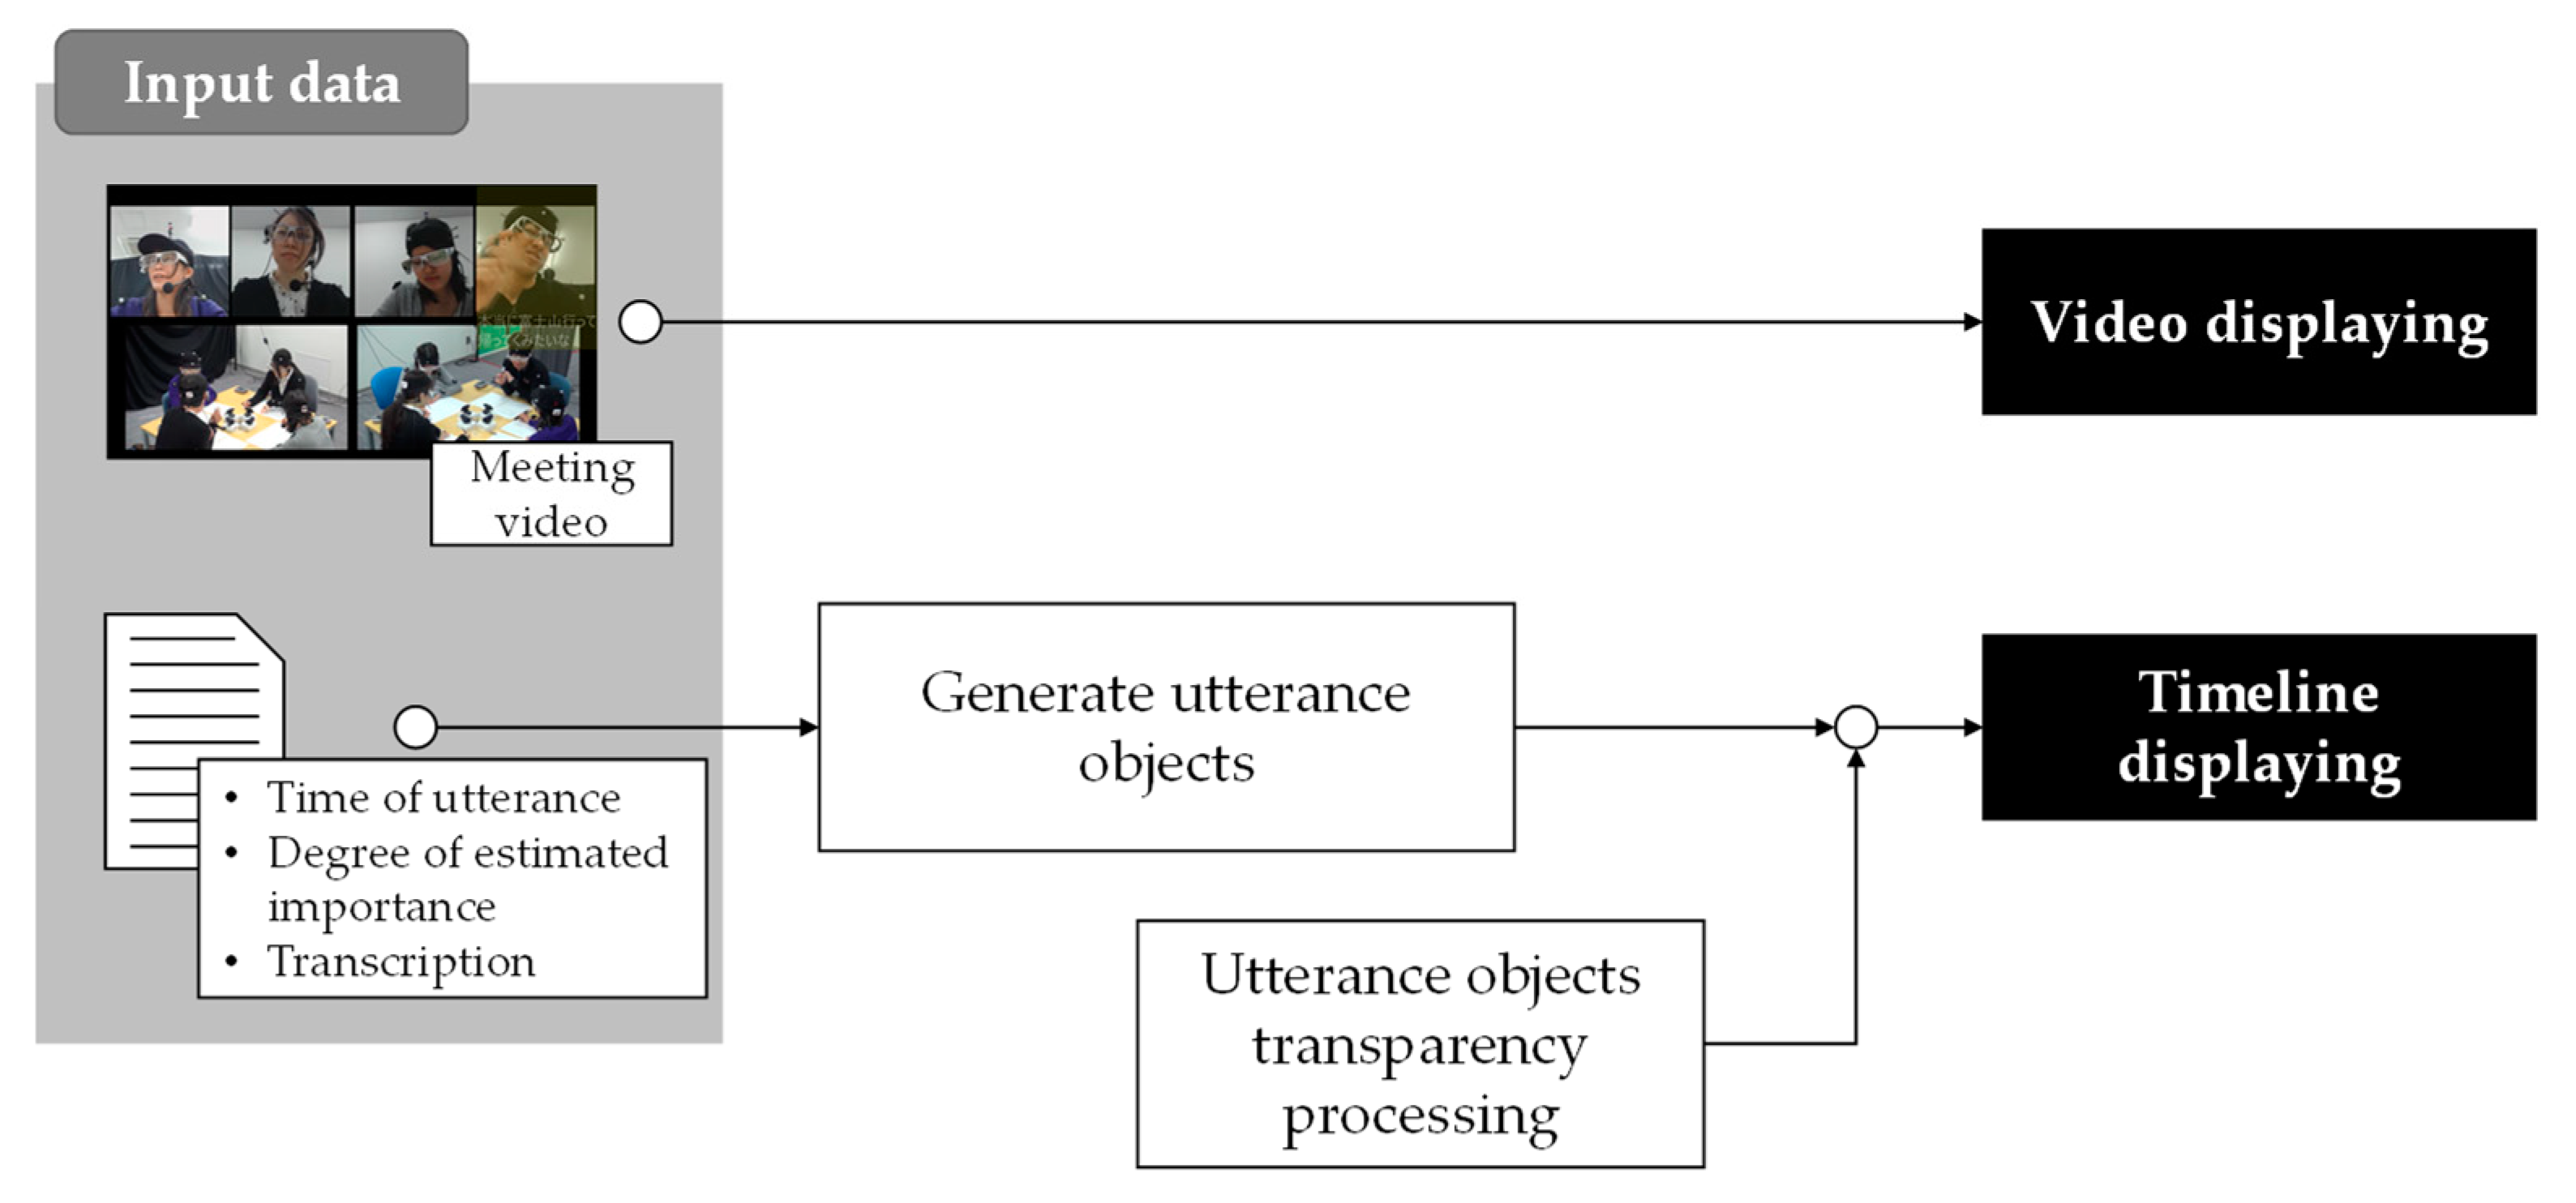
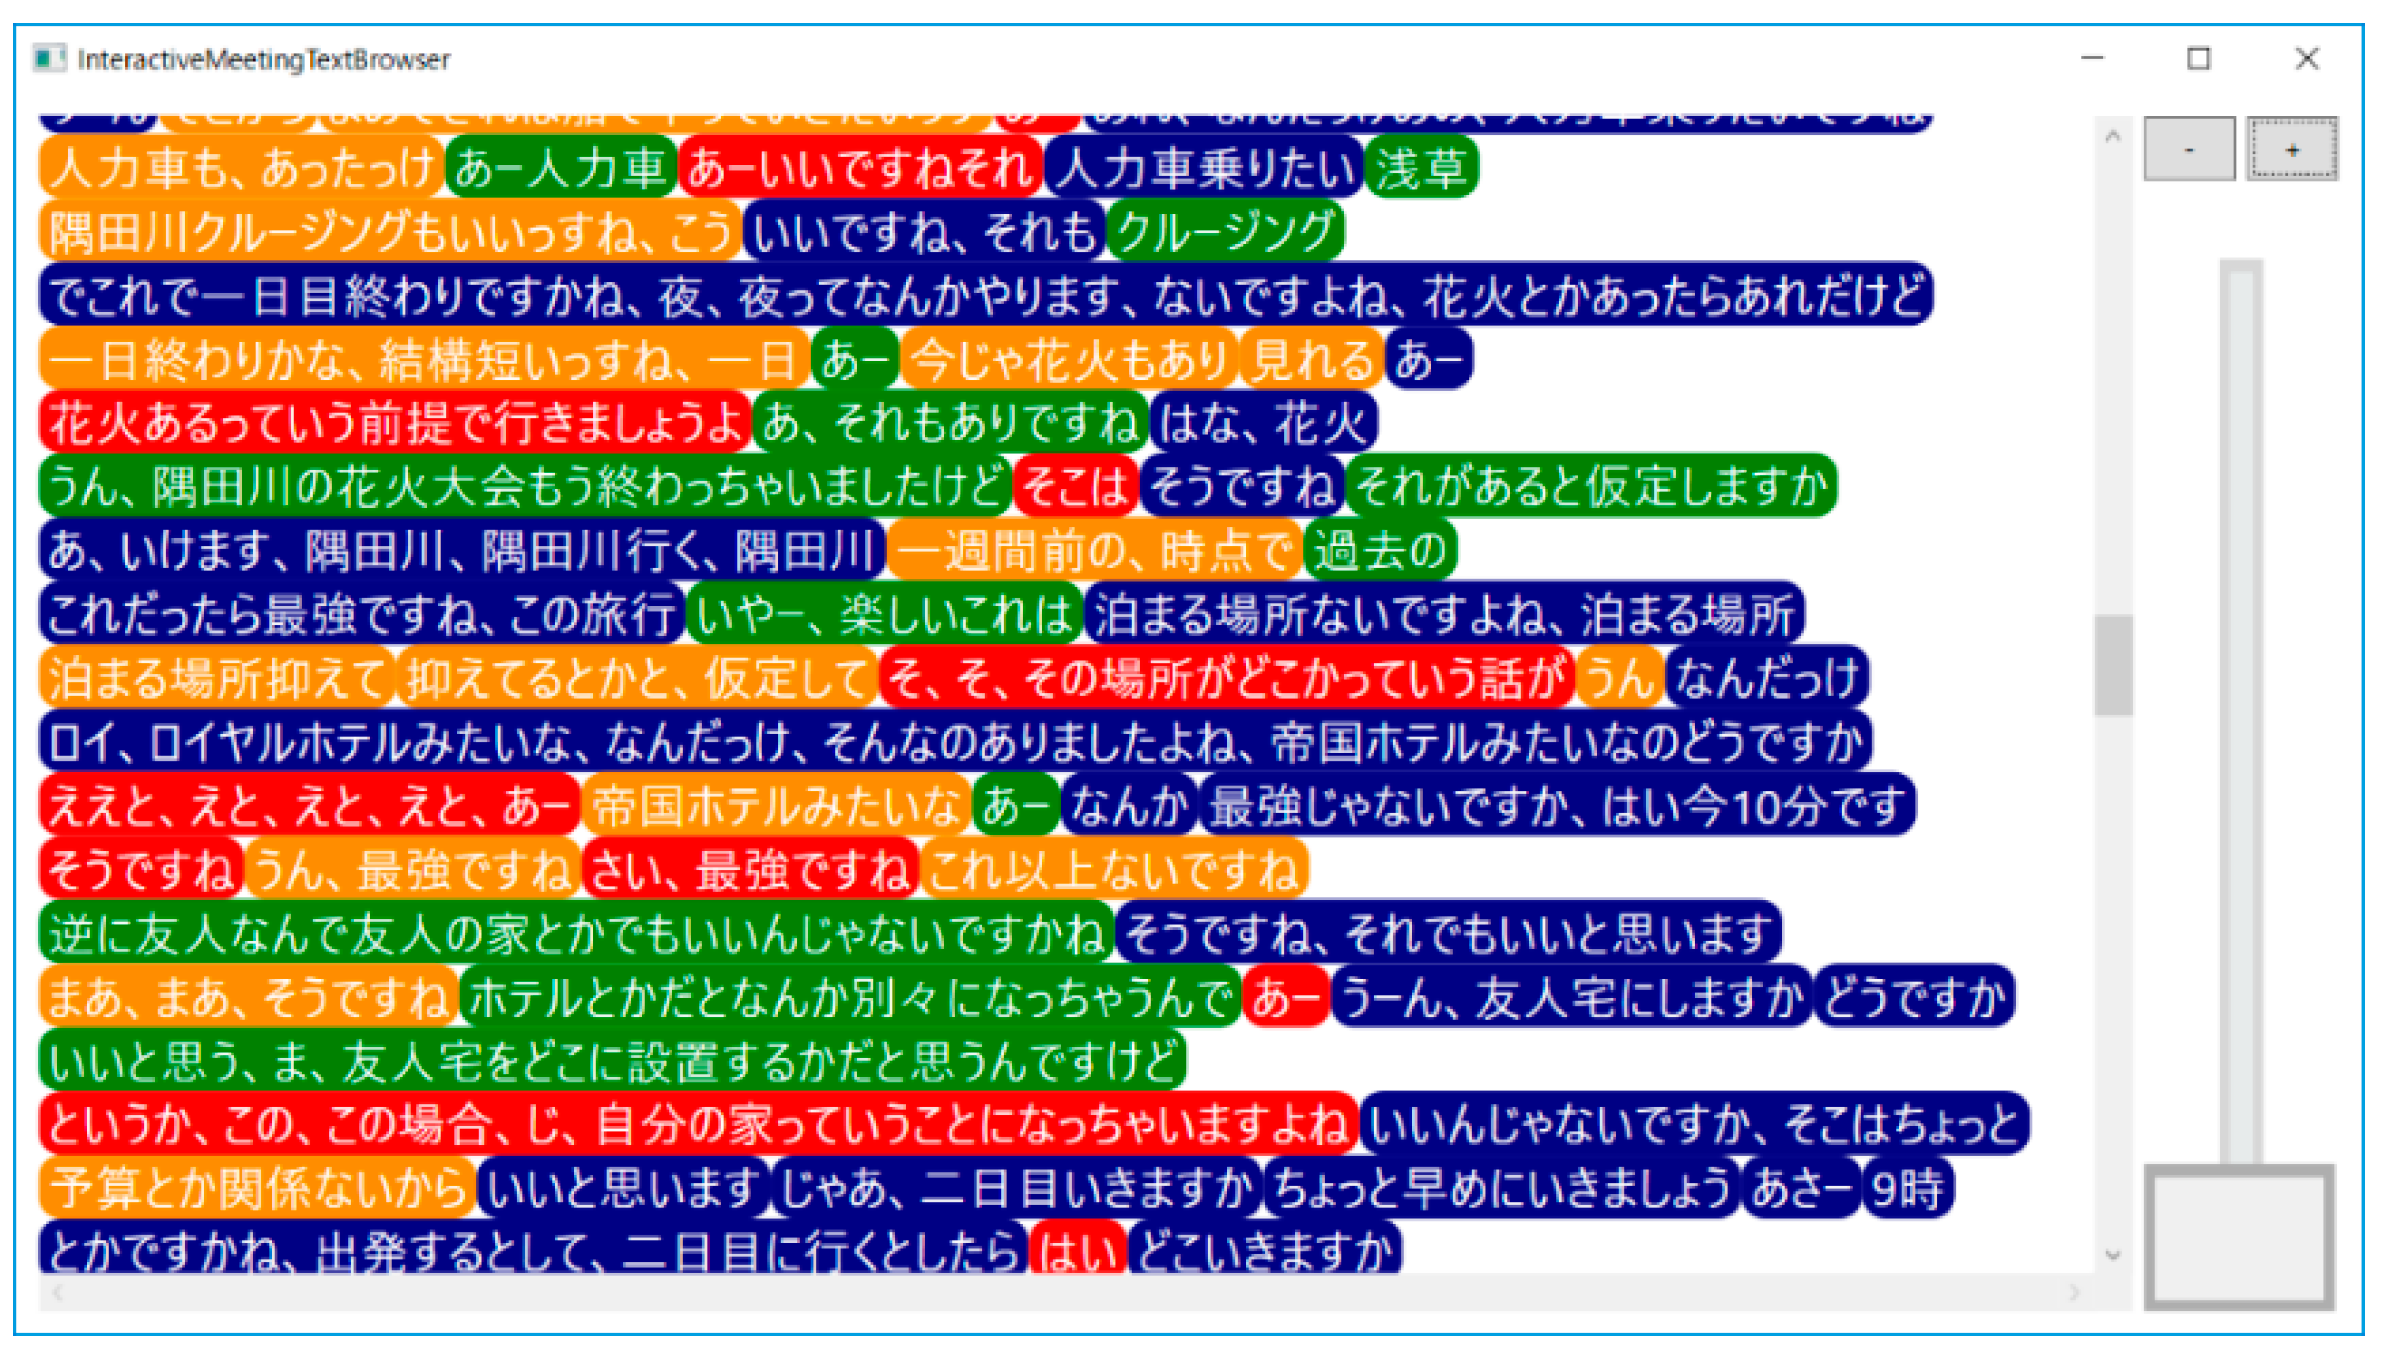
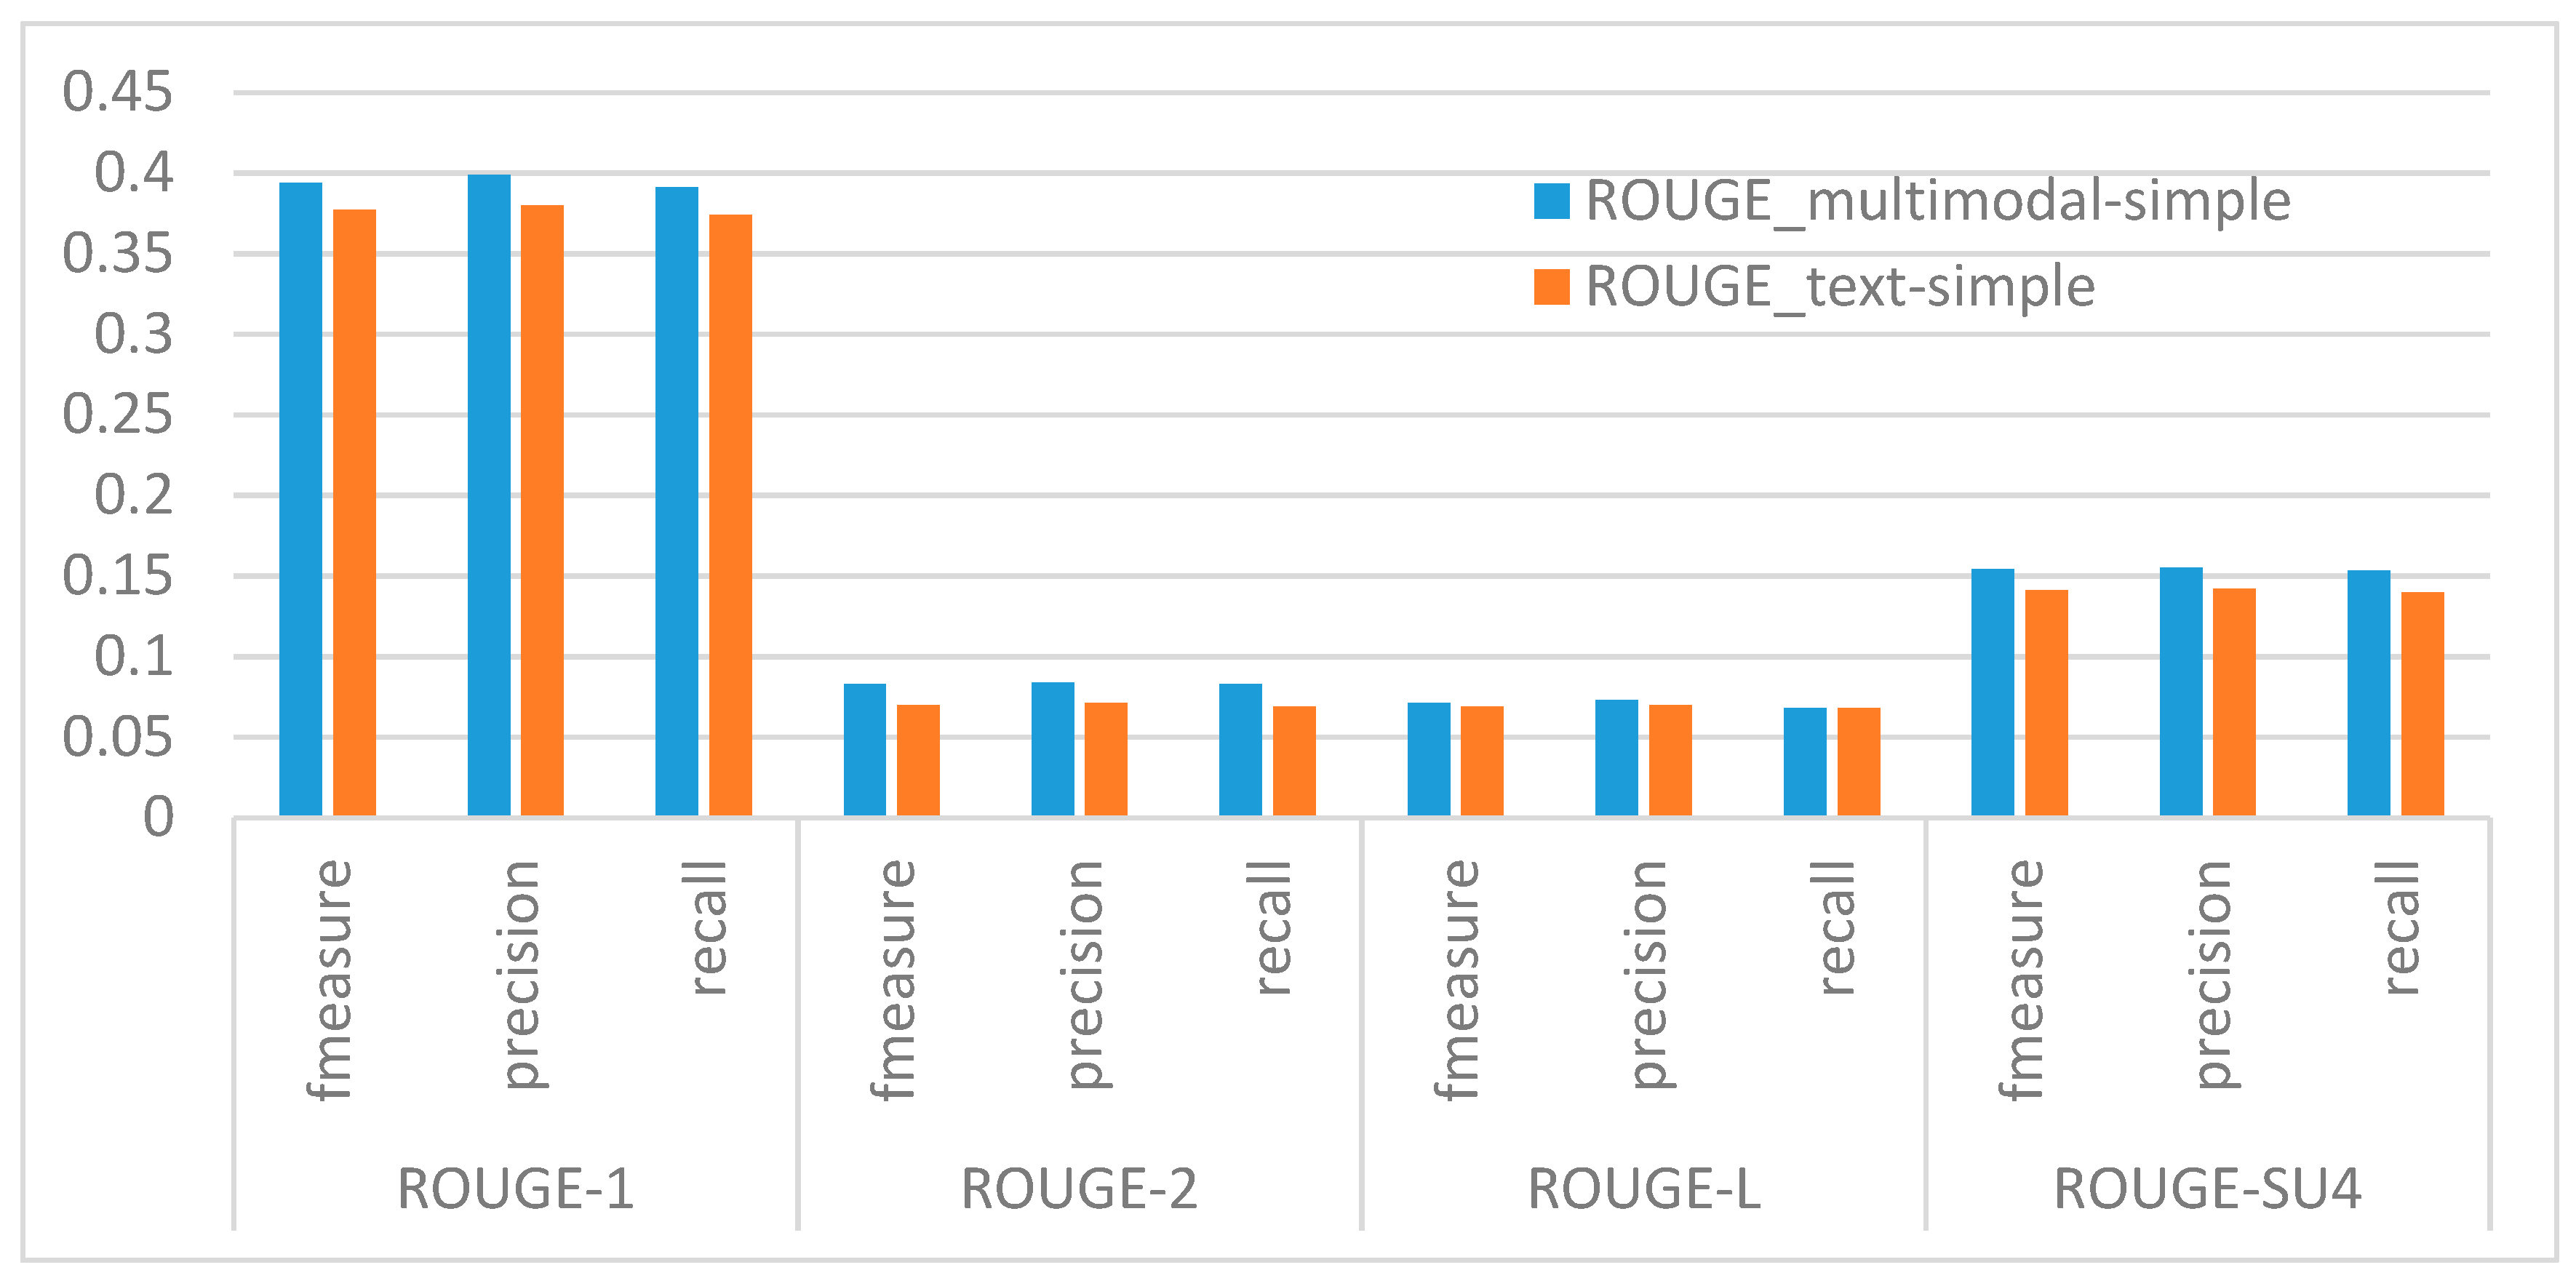
Table A1.
ANOVA test for automatically detected utterances.
| Metric | Test | Result | |
|---|---|---|---|
| Prec | ANOVA | F(1.608, 24.123) = 19.687 (p<.05) | |
| Post-hoc test | Proposed models vs. baseline |
| |
| Handcrafted feature vs. deep learning |
| ||
| Rec | ANOVA | F(2.326, 34.893) = 40.803 (p < 0.05) | |
| Post-hoc test | Proposed models vs. baseline |
| |
| Handcrafted feature vs. deep learning |
| ||
| F1 | ANOVA | F(1.453, 21.794) = 36.295 (p < 0.05) | |
| Post-hoc test | Proposed models vs. baseline |
| |
| Handcrafted feature vs. deep learning |
| ||
| Acc | ANOVA | F(1.726, 25.887) = 29.378 (p < 0.05) | |
| Post-hoc test | Proposed models vs. baseline |
| |
| Handcrafted feature vs. deep learning |
| ||
Table A2.
ANOVA test for manually segmented utterances.
| Metric | Test | Result | |
|---|---|---|---|
| Prec | ANOVA | F(2.457, 36.858) = 19.869 (p<.05) | |
| Post-hoc test | Proposed models vs. baseline |
| |
| Handcrafted feature vs. deep learning |
| ||
| Rec | ANOVA | F(2.834, 42.51) = 12.691 (p < 0.05) | |
| Post-hoc test | Proposed models vs. baseline |
| |
| Handcrafted feature vs. deep learning |
| ||
| F1 | ANOVA | F(2.147, 32.202) = 18.524 (p < 0.05) | |
| Post-hoc test | Proposed models vs. baseline |
| |
| Handcrafted feature vs. deep learning |
| ||
| Acc | ANOVA | F(2.539, 38.086) = 23.908 (p < 0.05) | |
| Post-hoc test | Proposed models vs. baseline |
| |
| Handcrafted feature vs. deep learning |
| ||
References
- Murray, G.; Carenini, G. Summarizing Spoken and Written Conversations. In Proceedings of the Conference on Empirical Methods in Natural Language Processing, Honolulu, HI, USA, 25–27 October 2008; Association for Computational Linguistics: Stroudsburg, PA, USA, 2008; pp. 773–782. [Google Scholar]
- Xie, S.; Hakkani-Tur, D.; Favre, B.; Liu, Y. Integrating prosodic features in extractive meeting summarization. In Proceedings of the IEEE Workshop on Speech Recognition and Understanding (ASRU), Merano, Italy, 13 November–17 December 2009; pp. 387–391. [Google Scholar]
- Wang, L.; Cardie, C. Focused Meeting Summarization via Unsupervised Relation Extraction. In Proceedings of the 13th Annual Meeting of the Special Interest Group on Discourse and Dialogue, Seoul, Korea, 5–6 July 2012; Association for Computational Linguistics: Stroudsburg, PA, USA, 2012; pp. 304–313. [Google Scholar]
- Aran, O.; Gatica-Perez, D. One of a Kind: Inferring Personality Impressions in Meetings. In Proceedings of the 15th ACM on International Conference on Multimodal Interaction, Sydney, Australia, 9–13 December 2013; ACM: New York, NY, USA, 2013; pp. 11–18. [Google Scholar]
- Nicolaou, M.A.; Gunes, H.; Pantic, M. Continuous Prediction of Spontaneous Affect from Multiple Cues and Modalities in Valence-Arousal Space. IEEE Trans. Affect. Comput. 2011, 2, 92–105. [Google Scholar] [CrossRef]
- Hinton, G.E.; Osindero, S.; Teh, Y.-W. A Fast Learning Algorithm for Deep Belief Nets. Neural Comput. 2006, 18, 1527–1554. [Google Scholar] [CrossRef] [PubMed]
- Le, Q.V. Building high-level features using large scale unsupervised learning. In Proceedings of the 2013 IEEE International Conference on Acoustics, Speech and Signal Processing, Vancouver, BC, Canada, 26–31 May 2013; pp. 8595–8598. [Google Scholar]
- Hinton, G.E.; Salakhutdinov, R.R. Reducing the dimensionality of data with neural networks. Science 2006, 313, 504–507. [Google Scholar] [CrossRef] [PubMed]
- Bengio, Y.; Lamblin, P.; Popovici, D.; Larochelle, H. Greedy Layer-wise Training of Deep Networks. In Proceedings of the 19th International Conference on Neural Information Processing Systems, Vancouver, BC, Canada, 4–7 December 2006; MIT Press: Cambridge, MA, USA, 2006; pp. 153–160. [Google Scholar]
- Pan, J.; Sayrol, E.; Giro-I-Nieto, X.; McGuinness, K.; O’Connor, N.E. Shallow and Deep Convolutional Networks for Saliency Prediction. In Proceedings of the 2016 IEEE Conference on Computer Vision and Pattern Recognition (CVPR), Las Vegas, NV, USA, 26 June–1 July 2016; pp. 598–606. [Google Scholar]
- Sainath, T.N.; Weiss, R.J.; Senior, A.W.; Wilson, K.W.; Vinyals, O. Learning the speech front-end with raw waveform CLDNNs. In Proceedings of the INTERSPEECH-2015, Dresden, Germany, 6–10 September 2015; pp. 1–5. [Google Scholar]
- Golik, P.; Tüske, Z.; Schlüter, R.; Ney, H. Convolutional neural networks for acoustic modeling of raw time signal in LVCSR. In Proceedings of the INTERSPEECH-2015, Dresden, Germany, 6–10 September 2015; pp. 26–30. [Google Scholar]
- Zhang, S.; Zhang, S.; Huang, T.; Gao, W. Multimodal Deep Convolutional Neural Network for Audio-Visual Emotion Recognition. In Proceedings of the 2016 ACM on International Conference on Multimedia Retrieval, New York, NY, USA, 6–9 June 2016; ACM: New York, NY, USA, 2016; pp. 281–284. [Google Scholar]
- Nojavanasghari, B.; Gopinath, D.; Koushik, J.; Baltrušaitis, T.; Morency, L.-P. Deep Multimodal Fusion for Persuasiveness Prediction. In Proceedings of the 18th ACM International Conference on Multimodal Interaction, Tokyo, Japan, 12–16 November 2016; ACM: New York, NY, USA, 2016; pp. 284–288. [Google Scholar]
- Carletta, J.; Ashby, S.; Bourban, S.; Flynn, M.; Guillemot, M.; Hain, T.; Kadlec, J.; Karaiskos, V.; Kraaij, W.; Kronenthal, M.; et al. The AMI Meeting Corpus: A Pre-announcement. In Proceedings of the Second International Conference on Machine Learning for Multimodal Interaction, Edinburgh, UK, 11–13 July 2005; Springer-Verlag: Berlin, Heidelberg, 2006; pp. 28–39. [Google Scholar] [Green Version]
- Susanne, B.; Victoria, M.; Hua, Y. The ISL meeting corpus: The impact of meeting type on speech style. In Proceedings of the International Conference on Spoken Language Processing, Denver, CO, USA, 16–20 September 2002; pp. 301–304. [Google Scholar]
- Sanchez-Cortes, D.; Aran, O.; Jayagopi, D.B.; Schmid Mast, M.; Gatica-Perez, D. Emergent leaders through looking and speaking: From audio-visual data to multimodal recognition. J. Multimodal User Interfaces 2013, 7, 39–53. [Google Scholar] [CrossRef]
- Litman, D.; Paletz, S.; Rahimi, Z.; Allegretti, S.; Rice, C. The Teams Corpus and Entrainment in Multi-Party Spoken Dialogues. In Proceedings of the 2016 Conference on Empirical Methods in Natural Language Processing, Austin, TX, USA, 1–4 November 2016; Association for Computational Linguistics: Stroudsburg, PA, USA, 2016; pp. 1421–1431. [Google Scholar]
- Koutsombogera, M.; Vogel, C. Modeling Collaborative Multimodal Behavior in Group Dialogues: The MULTISIMO Corpus. In Proceedings of the Eleventh International Conference on Language Resources and Evaluation (LREC 2018), Miyazaki, Japan, 5–7 May 2018; Chair, N.C., Choukri, K., Cieri, C., Declerck, T., Goggi, S., Hasida, K., Isahara, H., Maegaard, B., Mariani, J., Mazo, H., et al., Eds.; European Language Resources Association (ELRA): Paris, France, 2018. [Google Scholar]
- Janin, A.; Baron, D.; Edwards, J.; Ellis, D.; Gelbart, D.; Morgan, N.; Peskin, B.; Pfau, T.; Shriberg, E.; Stolcke, A.; et al. The ICSI Meeting Corpus. In Proceedings of the 2003 IEEE International Conference on Acoustics, Speech, and Signal Processing (ICASSP ’03), Hong Kong, China, 6–10 April 2003; Volume 1, pp. I-364–I-367. [Google Scholar]
- Oertel, C.; Cummins, F.; Edlund, J.; Wagner, P.; Campbell, N. D64: A corpus of richly recorded conversational interaction. J. Multimodal User Interfaces 2013, 7, 19–28. [Google Scholar] [CrossRef]
- Otsuka, K.; Yamato, J.; Takemae, Y.; Murase, H. Quantifying Interpersonal Influence in Face-to-face Conversations Based on Visual Attention Patterns. In Proceedings of the CHI’06 Extended Abstracts on Human Factors in Computing Systems, Montreal, QC, Canada, 22–27 April 2006; ACM: New York, NY, USA, 2006; pp. 1175–1180. [Google Scholar]
- Basu, S.; Choudhury, T.; Clarkson, B.; Pentland, A. Towards measuring human interactions in conversational settings. In Proceedings of the IEEE Int’l Workshop on Cues in Communication (CUES 2001) at CVPR 2001, Kauai, HI, USA, 9 December 2001. [Google Scholar]
- Dong, W.; Lepri, B.; Cappelletti, A.; Pentland, A.S.; Pianesi, F.; Zancanaro, M. Using the Influence Model to Recognize Functional Roles in Meetings. In Proceedings of the 9th International Conference on Multimodal Interfaces, Nagoya, Japan, 12–15 November 2007; ACM: New York, NY, USA, 2007; pp. 271–278. [Google Scholar]
- Bales, R.F. Personality and Interpersonal Behavior; Holt, Rinehart & Winston: Oxford, UK, 1970. [Google Scholar]
- Rienks, R.; Zhang, D.; Gatica-Perez, D.; Post, W. Detection and Application of Influence Rankings in Small Group Meetings. In Proceedings of the 8th International Conference on Multimodal Interfaces, Banff, AB, Canada, 13 November 2006; ACM: New York, NY, USA, 2006; pp. 257–264. [Google Scholar]
- Hung, H.; Jayagopi, D.B.; Ba, S.; Odobez, J.-M.; Gatica-Perez, D. Investigating Automatic Dominance Estimation in Groups from Visual Attention and Speaking Activity. In Proceedings of the 10th International Conference on Multimodal Interfaces, Chania, Greece, 20–22 October 2008; ACM: New York, NY, USA, 2008; pp. 233–236. [Google Scholar]
- Jayagopi, D.B.; Hung, H.; Yeo, C.; Gatica-Perez, D. Modeling Dominance in Group Conversations Using Nonverbal Activity Cues. IEEE Trans. Audio Speech Lang. Process. 2009, 17, 501–513. [Google Scholar] [CrossRef] [Green Version]
- Escalera, S.; Pujol, O.; Radeva, P.; Vitrià, J.; Anguera, M.T. Automatic Detection of Dominance and Expected Interest. EURASIP J. Adv. Signal Process. 2010, 2010, 491819. [Google Scholar] [CrossRef] [Green Version]
- Lepri, B.; Subramanian, R.; Kalimeri, K.; Staiano, J.; Pianesi, F.; Sebe, N. Connecting Meeting Behavior with Extraversion—A Systematic Study. IEEE Trans. Affect. Comput. 2012, 3, 443–455. [Google Scholar] [CrossRef]
- Staiano, J.; Lepri, B.; Subramanian, R.; Sebe, N.; Pianesi, F. Automatic Modeling of Personality States in Small Group Interactions. In Proceedings of the 19th ACM International Conference on Multimedia, Scottsdale, AZ, USA, 28 November–1 December 2011; ACM: New York, NY, USA, 2011; pp. 989–992. [Google Scholar]
- Jayagopi, D.; Sanchez-Cortes, D.; Otsuka, K.; Yamato, J.; Gatica-Perez, D. Linking Speaking and Looking Behavior Patterns with Group Composition, Perception, and Performance. In Proceedings of the 14th ACM International Conference on Multimodal Interaction, Santa Monica, CA, USA, 22–26 October 2012; ACM: New York, NY, USA, 2012; pp. 433–440. [Google Scholar]
- Radev, D.R.; Jing, H.; Styś, M.; Tam, D. Centroid-based Summarization of Multiple Documents. Inf. Process. Manag. 2004, 40, 919–938. [Google Scholar] [CrossRef]
- Carbonell, J.; Goldstein, J. The Use of MMR, Diversity-based Reranking for Reordering Documents and Producing Summaries. In Proceedings of the 21st Annual International ACM SIGIR Conference on Research and Development in Information Retrieval, Melbourne, ustralia, 24–28 August 1998; ACM: New York, NY, USA, 1998; pp. 335–336. [Google Scholar]
- Gong, Y.; Liu, X. Generic Text Summarization Using Relevance Measure and Latent Semantic Analysis. In Proceedings of the 24th Annual International ACM SIGIR Conference on Research and Development in Information Retrieval, New Orleans, LA, USA, 9–12 Septembe 2001; ACM: New York, NY, USA, 2001; pp. 19–25. [Google Scholar]
- Carenini, G.; Murray, G.; Ng, R. Methods for Mining and Summarizing Text Conversations; Synthesis Lectures on Data Management; Morgan & Claypool Publishers LLC: Williston, VT, USA, 2011; Volume 3, pp. 1–130. [Google Scholar]
- Wan, S.; McKeown, K. Generating Overview Summaries of Ongoing Email Thread Discussions. In Proceedings of the 20th International Conference on Computational Linguistics, Geneva, Switzerland, 23–27 August 2004; Association for Computational Linguistics: Stroudsburg, PA, USA, 2004. [Google Scholar]
- Isonuma, M.; Fujino, T.; Mori, J.; Matsuo, Y.; Sakata, I. Extractive Summarization Using Multi-Task Learning with Document Classification. In Proceedings of the 2017 Conference on Empirical Methods in Natural Language Processing, Copenhagen, Denmark, 7–11 September 2017; Association for Computational Linguistics: Copenhagen, Denmark, 2017; pp. 2101–2110. [Google Scholar]
- Cao, Z.; Wei, F.; Dong, L.; Li, S.; Zhou, M. Ranking with Recursive Neural Networks and Its Application to Multi-document Summarization. In Proceedings of the Twenty-Ninth AAAI Conference on Artificial Intelligence, Austin, TX, USA, 20–30 January 2015; AAAI Press: Menlo Park, CA, USA, 2015; pp. 2153–2159. [Google Scholar]
- Joulin, A.; Grave, E.; Bojanowski, P.; Mikolov, T. Bag of Tricks for Efficient Text Classification. In Proceedings of the 15th Conference of the European Chapter of the Association for Computational Linguistics, Valencia, Spain, 3–7 April 2017; Volume 2: Short Papers. Association for Computational Linguistics: Stroudsburg, PA, USA, 2017; pp. 427–431. [Google Scholar]
- Cheng, J.; Lapata, M. Neural Summarization by Extracting Sentences and Words. In Proceedings of the 54th Annual Meeting of the Association for Computational Linguistics, Berlin, Germany, 7–12 August 2016; Volume 1: Long Papers. Association for Computational Linguistics: Stroudsburg, PA, USA, 2016; pp. 484–494. [Google Scholar]
- Wang, L.; Cardie, C. Domain-Independent Abstract Generation for Focused Meeting Summarization. In Proceedings of the 51st Annual Meeting of the Association for Computational Linguistics, Sofia, Bulgaria, 4–9 August 2013; Volume 1: Long Papers. Association for Computational Linguistics: Stroudsburg, PA, USA, 2013; pp. 1395–1405. [Google Scholar]
- Singla, K.; Stepanov, E.; Bayer, A.O.; Carenini, G.; Riccardi, G. Automatic Community Creation for Abstractive Spoken Conversations Summarization. In Proceedings of the Workshop on New Frontiers in Summarization, Copenhagen, Denmark, 7 September 2017; Association for Computational Linguistics: Stroudsburg, PA, USA, 2017; pp. 43–47. [Google Scholar]
- Murray, G. Abstractive Meeting Summarization as a Markov Decision Process. In Proceedings of the Advances in Artificial Intelligence, Abbotsford, BC, Canada, 2–5 June 2015; Barbosa, D., Milios, E., Eds.; Springer: Cham, Switzerland, 2015; pp. 212–219. [Google Scholar]
- Zhao, Z.; Pan, H.; Fan, C.; Liu, Y.; Li, L.; Yang, M.; Cai, D. Abstractive Meeting Summarization via Hierarchical Adaptive Segmental Network Learning. In Proceedings of theWorld Wide Web Conference, San Francisco, CA, USA, 13–17 May 2019; ACM: New York, NY, USA, 2019; pp. 3455–3461. [Google Scholar]
- Maskey, S.; Hirschberg, J. Comparing lexical, acoustic/prosodic, structural and discourse features for speech summarization. In Proceedings of the INTERSPEECH-2005, Lisbon, Portugal, 4–8 September 2005; pp. 621–624. [Google Scholar]
- Waibel, A.; Bett, M.; Finke, M.; Stiefelhagen, R. Meeting browser: Tracking and summarizing meetings. In Proceedings of the DARPA Broadcast News Workshop, Pittsburgh, PA, USA, 8–11 February 1998; pp. 281–286. [Google Scholar]
- Galley, M. A Skip-chain Conditional Random Field for Ranking Meeting Utterances by Importance. In Proceedings of the 2006 Conference on Empirical Methods in Natural Language Processing, Sydney, Australia, 22–23 July 2006; Association for Computational Linguistics: Stroudsburg, PA, USA, 2006; pp. 364–372. [Google Scholar]
- Murray, G.; Renals, S.; Carletta, J. Extractive Summarization of Meeting Recordings. In Proceedings of the INTERSPEECH-2005, Lisbon, Portugal, 4–8 September 2005; pp. 593–596. [Google Scholar]
- Koumpis, K.; Renals, S. Automatic Summarization of Voicemail Messages Using Lexical and Prosodic Features. ACM Trans. Speech Lang. Process. 2005, 2. [Google Scholar] [CrossRef]
- Murray, G. Using Speech-Specific Characteristics for Automatic Speech Summarizatio. Ph.D. Thesis, University of Edinburgh, Edinburgh, Scotland, 2007. [Google Scholar]
- Zhu, X.; Penn, G.; Rudzicz, F. Summarizing Multiple Spoken Documents: Finding Evidence from Untranscribed Audio. In Proceedings of the Joint Conference of the 47th Annual Meeting of the ACL and the 4th International Joint Conference on Natural Language Processing of the AFNLP, Singapore, 2–7August 2009; Association for Computational Linguistics: Stroudsburg, PA, USA, 2009; Volume 2, pp. 549–557. [Google Scholar]
- Murray, G.; Renals, S.; Carletta, J.; Moore, J. Evaluating automatic summaries of meeting recordings. In Proceedings of the ACL Workshop on Intrinsic and Extrinsic Evaluation Measures for Machine Translation and/or Summarization, Ann Arbor, MI, USA, 29 June 2005; pp. 33–40. [Google Scholar]
- Erol, B.; Lee, D.S.; Hull, J. Multimodal summarization of meeting recordings. In Proceedings of the 2003 International Conference on Multimedia and Expo, ICME’03, Baltimore, MD, USA, 6–9 July 2003; Voume 3, pp. 25–28. [Google Scholar]
- Li, H.; Zhu, J.; Ma, C.; Zhang, J.; Zong, C. Multi-modal Summarization for Asynchronous Collection of Text, Image, Audio and Video. In Proceedings of the 2017 Conference on Empirical Methods in Natural Language Processing, Copenhagen, Denmark, 7–11 September 2017; Association for Computational Linguistics: Stroudsburg, PA, USA, 2017; pp. 1092–1102. [Google Scholar]
- Gatica-Perez, D.; McCowan, I.A.; Zhang, D.; Bengio, S. Detecting Group Interest-level in Meetings. In Proceedings of the IEEE International Conference on Acoustics, Speech, and Signal Processing (ICASSP), Philadelphia, PA, USA, 23 March 2005. [Google Scholar]
- Wrede, B.; Shriberg, E. Spotting “Hot Spots” in Meetings: Human Judgments and Prosodic Cues. In Proceedings of the 8th European Conference on Speech Communication and Technology (EUROSPEECH 2003—INTERSPEECH 2003), Geneva, Switzerland, 1–4 September 2003; pp. 2805–2808. [Google Scholar]
- Wang, X.; Liu, Y.; Sun, C.; Wang, B.; Wang, X. Predicting Polarities of Tweets by Composing Word Embeddings with Long Short-Term Memory. In Proceedings of the 53rd Annual Meeting of the Association for Computational Linguistics and the 7th International Joint Conference on Natural Language Processing, Beijing, China, 27 July–31 July 2015; Volume 1: Long Papers. Association for Computational Linguistics: Stroudsburg, PA, USA, 2015; pp. 1343–1353. [Google Scholar]
- Poria, S.; Cambria, E.; Hazarika, D.; Majumder, N.; Zadeh, A.; Morency, L.-P. Context-Dependent Sentiment Analysis in User-Generated Videos. In Proceedings of the 55th Annual Meeting of the Association for Computational Linguistics, Vancouver, BC, Canada, 30 July–4 August 2017; Volume 1: Long Papers. Association for Computational Linguistics: Stroudsburg, PA, USA, 2017; pp. 873–883. [Google Scholar]
- Shen, Y.; Huang, X. Attention-Based Convolutional Neural Network for Semantic Relation Extraction. In Proceedings of the COLING 2016, the 26th International Conference on Computational Linguistics: Technical Papers, Osaka, Japan, 11–16 December 2016; pp. 2526–2536. [Google Scholar]
- Poria, S.; Cambria, E.; Gelbukh, A.F. Deep Convolutional Neural Network Textual Features and Multiple Kernel Learning for Utterance-level Multimodal Sentiment Analysis. In Proceedings of the 2015 Conference on Empirical Methods in Natural Language Processing, Lisbon, Portugal, 17–21 September 2015; pp. 2539–2544. [Google Scholar]
- Murray, G.; Carenini, G.; Ng, R. Generating and Validating Abstracts of Meeting Conversations: A User Study. In Proceedings of the 6th International Natural Language Generation Conference, Trim Castle, Ireland, 7–9 July 2010. [Google Scholar]
- Hsueh, P.-Y.; Moore, J.D. Improving Meeting Summarization by Focusing on User Needs: A Task-oriented Evaluation. In Proceedings of the 14th International Conference on Intelligent User Interfaces, Sanibel Island, FL, USA, 8–11 February 2009; ACM: New York, NY, USA, 2009; pp. 17–26. [Google Scholar]
- Tucker, S.; Whittaker, S. Have a Say over What You See: Evaluating Interactive Compression Techniques. In Proceedings of the 14th International Conference on Intelligent User Interfaces, Sanibel Island, FL, USA, 8–11 February 2009; ACM: New York, NY, USA, 2009; pp. 37–46. [Google Scholar]
- Costa, P.T.; McCrae, R.R. Revised NEO Personality Inventory (NEO PI-R) and NEO Five-Factor Inventory (NEO-FFI); Psychological Assessment Resources: Lutz, FL, USA, 1992. [Google Scholar]
- Nihei, F.; Nakano, Y.I.; Hayashi, Y.; Hung, H.-H.; Okada, S. Predicting Influential Statements in Group Discussions Using Speech and Head Motion Information. In Proceedings of the 16th International Conference on Multimodal Interaction, Istanbul, Turkey, 12–14 November 2014; ACM: New York, NY, USA, 2014; pp. 136–143. [Google Scholar]
- Vahdatpour, A.; Amini, N.; Sarrafzadeh, M. Toward Unsupervised Activity Discovery Using Multi-dimensional Motif Detection in Time Series. In Proceedings of the 21st International Joint Conference on Artificail Intelligence, Pasadena, CA, USA, 11–17 July 2009; Morgan Kaufmann Publishers Inc.: San Francisco, CA, USA, 2009; pp. 1261–1266. [Google Scholar]
- Fan, Y.; Lu, X.; Li, D.; Liu, Y. Video-based Emotion Recognition Using CNN-RNN and C3D Hybrid Networks. In Proceedings of the 18th ACM International Conference on Multimodal Interaction, Tokyo, Japan, 12–16 November 2016; ACM: New York, NY, USA, 2016; pp. 445–450. [Google Scholar]
- Krizhevsky, A.; Sutskever, I.; Hinton, G.E. ImageNet Classification with Deep Convolutional Neural Networks. In Proceedings of the 25th International Conference on Neural Information Processing Systems, Lake Tahoe, NV, USA, 3–6 December 2012; Curran Associates Inc.: Red Hook, NY, USA, 2012; pp. 1097–1105. [Google Scholar]
- Poria, S.; Chaturvedi, I.; Cambria, E.; Hussain, A. Convolutional MKL Based Multimodal Emotion Recognition and Sentiment Analysis. In Proceedings of the 2016 IEEE 16th International Conference on Data Mining (ICDM), Barcelona, Spain, 12–15 December 2016; pp. 439–448. [Google Scholar]
- Nguyen, L.S.; Frauendorfer, D.; Mast, M.S.; Gatica-Perez, D. Hire me: Computational Inference of Hirability in Employment Interviews Based on Nonverbal Behavior. IEEE Trans. Multimed. 2014, 16, 1018–1031. [Google Scholar] [CrossRef]
- Cao, Z.; Wei, F.; Li, S.; Li, W.; Zhou, M.; Wang, H. Learning Summary Prior Representation for Extractive Summarization. In Proceedings of the 53rd Annual Meeting of the Association for Computational Linguistics and the 7th International Joint Conference on Natural Language Processing, Beijing, China, 27 July–31 July 2015; Volume 2: Short Papers. Association for Computational Linguistics: Stroudsburg, PA, USA, 2015; pp. 829–833. [Google Scholar]
- Devlin, J.; Chang, M.-W.; Lee, K.; Toutanova, K. BERT: Pre-training of Deep Bidirectional Transformers for Language Understanding. In Proceedings of the 2019 Conference of the North {A}merican Chapter of the Association for Computational Linguistics: Human Language Technologies, Minneapolis, MN, USA, 2–7 June 2019; Volume 1: Long and Short Papers. Association for Computational Linguistics: Stroudsburg, PA, USA, 2019; pp. 4171–4186. [Google Scholar]
Figure 1.
Snapshot of conversation.

Figure 2.
Layout of the data collection environment.

Figure 3.
Snapshot of important utterances identification tasks.

Figure 4.
Adaptation of the judgements. As a manually annotated utterance A overlaps with only one automatically detected utterance, which is an unimportant utterance, utterance A is identified as an unimportant utterance. As a manually annotated utterance B does not overlap with any automatically detected utterance, utterance B is excluded from the analysis. There are three automatically detected utterances that temporally overlap the manually recognized utterance C, and at least one important utterance is included in them. In such a case, utterance C is identified as an important utterance.

Figure 5.
Proposed multimodal network.

Figure 6.
Unimodal models for nonverbal information.

Figure 7.
Verbal model.

Figure 8.
Activity of speech and head motion.

Figure 9.
A multimodal meeting browser.

Figure 10.
A multimodal meeting browser: User can change the number of important utterances shown on the timeline by moving the slider.
Figure 10.
A multimodal meeting browser: User can change the number of important utterances shown on the timeline by moving the slider.

Figure 11.
System components of the multimodal meeting browser.

Figure 12.
Overview of the text-based browser.

Figure 13.
ROUGE comparisons.

Table 1.
Number of positive and negative cases (automatically detected utterances).
| Type of Utterance | Number of Utterance |
|---|---|
| Important utterance (positive) | 5268 |
| Unimportant utterance (negative) | 10,245 |
| total | 15,513 |
Table 2.
Number of positive and negative cases (manually segmented utterances).
| Type of Utterance | Number of Utterances |
|---|---|
| Important utterance (positive) | 3789 |
| Unimportant utterance (negative) | 5150 |
| Total | 8939 |
Table 3.
SP/OT features.
| Category | Speaker | Others |
|---|---|---|
| Visual attention |
|
|
| Head motion |
|
|
| Speech |
|
|
| Total | 21 (= 8 for attention + 3 for head motion + 10 for speech) | 17 (= 8 for attention + 3 for head motions + 6 for speech) |
Table 4.
Number of features that satisfied two conditions. The number in brackets indicates the number of feature before selection.
Table 4.
Number of features that satisfied two conditions. The number in brackets indicates the number of feature before selection.
| Feature Category | Num. of Features Satisfied Two Conditions |
|---|---|
| SP/OT (38 features) | 13 |
| PR (144 features) | 38 |
| CO (153 features) | 45 |
| Total | 96 |
Table 5.
Top features with Cohen’s d.
| Category | Examples | |
|---|---|---|
| SP/OT | Speaker feature | Others feature |
|
| |
| PR | Speaker feature | Others feature |
|
| |
| CO | Component of co-occurrence pattern | Co-occurrence pattern |
|
| |
Table 6.
Structure of nonverbal networks.
| Layer | 2D-CNN | 3D-CNN | AlexNet-Based CNN | |
|---|---|---|---|---|
| Input layer | Size | Depends on modality | Depends on modality | Depends on modality |
| Convolution layer | Kernel size | Depends on modality | Depends on modality | Depends on modality |
| Num. of kernel | C1: 32, C2: 32 | C1: 32, C2: 32 | C1: 24, C2: 64, C3: 96, C4: 96, C5: 64 | |
| Activation function | ReLU | ReLU | ReLU | |
| Pooling layer | Filter size | Depends on modality | Depends on modality | Depends on modality |
| Fully connected layer | Num. of neurons | FC1: 128, FC2: 128 | FC1: 128, FC2: 128 | FC1: 256, FC2: 256 |
| Activation function | ReLU | ReLU | ReLU | |
| Drop out | P1-FC1: 0.25, FC1-FC2: 0.5, FC2-softmax:0.5 | P1-FC1: 0.25, FC1-FC2: 0.5, FC2-softmax:0.5 | FC1-FC2: 0.5, FC2-softmax:0.5 | |
Table 7.
Sizes of input data.
| Input | Input Vector Size | Convolution Kernel Size | Pooling Filter Size |
|---|---|---|---|
| SS | 750, 32, 4, 1 | 5, 3, 4 | 2, 2, 1 |
| HS | 450, 15, 4, 1 | 3, 3, 4 | 2, 2, 1 |
| SI | 1500, 1, 4, 1 | 10, 1, 4 | 2, 2, 1 |
| HP | 450, 3, 4, 2 | 3, 3, 4 | 2, 2, 1 |
Table 8.
Detailed configuration of the verbal model.
| Layer | Configuration | |
|---|---|---|
| Input size | 28, 219, 1 | |
| Convolution layer | Kernel size | 3, 219 |
| Num. of kernel | C1: 32, C2: 32 | |
| Activation function | C1: ReLU, C2: ReLU | |
| Pooling layer | Filter size | 2, 1 |
| Fully connected layer | Num. of neuron | FC1: 128, FC2: 128 |
| Activation function | FC1: ReLU, FC2: ReLU | |
| Drop out | P1-FC1: 0.25, FC1-FC2: 0.5, FC2-softmax:0.5 | |
Table 9.
Performances of hand-crafted feature models.
| Category | Model | Precision | Recall | F-Measure | Accuracy |
|---|---|---|---|---|---|
| Baseline | LU | 0.552 | 0.715 | 0.623 | 0.707 |
| Verbal models | HC_V | 0.634 | 0.566 | 0.598 | 0.742 |
| BOW | 0.638 | 0.533 | 0.581 | 0.739 | |
| V_ALL | 0.644 | 0.572 | 0.606 | 0.747 | |
| Nonverbal models | SP/OT | 0.668 | 0.750 | 0.707 | 0.789 |
| PR | 0.655 | 0.703 | 0.678 | 0.773 | |
| CO | 0.599 | 0.678 | 0.636 | 0.736 | |
| SP/OT+PR | 0.668 | 0.732 | 0.698 | 0.785 | |
| SP/OT+CO | 0.670 | 0.744 | 0.705 | 0.788 | |
| PR+CO | 0.656 | 0.698 | 0.676 | 0.773 | |
| NV-ALL | 0.669 | 0.720 | 0.694 | 0.784 |
Table 10.
Performances of hand-crafted feature verbal-nonverbal models.
| Category | Model | Precision | Recall | F-Measure | Accuracy |
|---|---|---|---|---|---|
| Baseline | LU | 0.552 | 0.715 | 0.623 | 0.707 |
| Best nonverbal model | SP/OT | 0.668 | 0.750 | 0.707 | 0.789 |
| Verbal and nonverbal models | HC_V-SP/OT | 0.680 | 0.619 | 0.648 | 0.772 |
| BOW-SP/OT | 0.658 | 0.568 | 0.610 | 0.753 | |
| V_ALL-SP/OT | 0.665 | 0.584 | 0.622 | 0.759 |
Table 11.
Comparison of nonverbal neural network models.
| Network Structure | Model | Precision | Recall | F-Measure | Accuracy |
|---|---|---|---|---|---|
| Baseline | LU | 0.552 | 0.715 | 0.623 | 0.707 |
| 2D-CNN | HS | 0.598 | 0.714 | 0.651 | 0.740 |
| SS | 0.703 | 0.781 | 0.740 | 0.814 | |
| SI | 0.654 | 0.771 | 0.708 | 0.784 | |
| HP | 0.555 | 0.638 | 0.594 | 0.703 | |
| NV | 0.670 | 0.789 | 0.725 | 0.797 | |
| AlexNet-based CNN | HS | 0.657 | 0.630 | 0.643 | 0.763 |
| SS | 0.702 | 0.789 | 0.743 | 0.814 | |
| SI | 0.703 | 0.749 | 0.726 | 0.808 | |
| HP | 0.618 | 0.640 | 0.629 | 0.744 | |
| NV | 0.709 | 0.830 | 0.765 | 0.827 | |
| 3D-CNN | HS | 0.668 | 0.666 | 0.667 | 0.774 |
| SS | 0.695 | 0.821 | 0.753 | 0.817 | |
| SI | 0.696 | 0.797 | 0.743 | 0.813 | |
| HP | 0.601 | 0.696 | 0.645 | 0.740 | |
| NV | 0.732 | 0.842 | 0.783 | 0.841 | |
| Verbal model | V | 0.731 | 0.750 | 0.741 | 0.822 |
Table 12.
Comparison of nonverbal neural network models.
| Network Structure | Model | Precision | Recall | F-measure | Accuracy |
|---|---|---|---|---|---|
| Baselines | LU | 0.552 | 0.715 | 0.623 | 0.707 |
| 3D-CNN | HS | 0.668 | 0.666 | 0.667 | 0.774 |
| SS | 0.695 | 0.821 | 0.753 | 0.817 | |
| SI | 0.696 | 0.797 | 0.743 | 0.813 | |
| HP | 0.601 | 0.696 | 0.645 | 0.740 | |
| NV | 0.732 | 0.842 | 0.783 | 0.841 | |
| Verbal and nonverbal fusion model | V-NV | 0.761 | 0.786 | 0.773 | 0.843 |
Table 13.
Comparison between the two approaches.
| Category | Models | Precision | Recall | F-Measure | Accuracy |
|---|---|---|---|---|---|
| Baseline | LU | 0.552 | 0.715 | 0.623 | 0.707 |
| Models based on hand-crafted feature | V_ALL | 0.644 | 0.572 | 0.606 | 0.747 |
| SP/OT | 0.668 | 0.750 | 0.707 | 0.789 | |
| HC_V-SP/OT | 0.680 | 0.619 | 0.648 | 0.772 | |
| Models based on deep learning | V | 0.731 | 0.750 | 0.741 | 0.822 |
| NV | 0.732 | 0.842 | 0.783 | 0.841 | |
| V-NV | 0.761 | 0.786 | 0.773 | 0.843 |
Table 14.
Performance of manually segmented models. Models with the best and second-best performance for each metric are marked in bold and underline, respectively.
Table 14.
Performance of manually segmented models. Models with the best and second-best performance for each metric are marked in bold and underline, respectively.
| Category | Model | Precision | Recall | F-Measure | Accuracy |
|---|---|---|---|---|---|
| Baseline | LU | 0.585 | 0.828 | 0.686 | 0.678 |
| Models based on hand-crafted feature | V_ALL | 0.686 | 0.728 | 0.707 | 0.744 |
| SP/OT | 0.729 | 0.720 | 0.725 | 0.767 | |
| HC_V-NV | 0.743 | 0.757 | 0.750 | 0.785 | |
| Models based on deep learning | V | 0.765 | 0.806 | 0.785 | 0.813 |
| NV | 0.777 | 0.844 | 0.809 | 0.831 | |
| V-NV | 0.807 | 0.847 | 0.827 | 0.850 |
Table 15.
Part-of-speech (POS) tuples that are accurately predicted as POSITIVE case by the V model. P, V, N, AUX, C, and Adv. indicate particle, verb, noun, auxiliary verb, conjunction, and adverb, respectively.
Table 15.
Part-of-speech (POS) tuples that are accurately predicted as POSITIVE case by the V model. P, V, N, AUX, C, and Adv. indicate particle, verb, noun, auxiliary verb, conjunction, and adverb, respectively.
| Num. of Words | Tuple of POS Tag | Specific Example |
|---|---|---|
| 3 | P, V, N | Visit Tsukiji, Tsukiji/it/te |
| P, C, N | Well then, Tokyo. ja/Tokyo/de | |
| 4 | P*2, N*2 | Pancake or fried chicken. panke-ki/ka/karaage/ka |
| 5 | P, AUX, V, N*2 | Do we go to the Imperial Palace? ko-kyo/iku/n/desu/ka? |
Table 16.
POS tuples that were accurately predicted as NEGATIVE case by the V model. Int., F, and Adj. indicate interjection, filler, and adjective, respectively.
Table 16.
POS tuples that were accurately predicted as NEGATIVE case by the V model. Int., F, and Adj. indicate interjection, filler, and adjective, respectively.
| Num. of Words | Tuple of POS Tag | Specific Example |
|---|---|---|
| 1 | Int., F, N, Adv. V, C, Adj. | um (Aa). right (So-desune). zoo (Do-butsuen). |
| 2 | Int., N | Mount Fuji, I see. Fujisan/naruhodo |
| 3 | Int., P, N | Um, popcorn. A/poppuko-n/ka |
| 4 | P, AUX., N*2 | That sounds good. yosa/ge/desu/kedo |
Table 17.
Correlation between multimodal browser and simple browser, and that between text browser and simple browser.
Table 17.
Correlation between multimodal browser and simple browser, and that between text browser and simple browser.
| Category | Role Description | Cor (Simple, Multimodal) | Cor (Simple, Text) |
|---|---|---|---|
| Orienter | A person who orients the group by introducing the agenda | 0.91 | 0.82 |
| A person who defines goals and procedures | 0.82 | 1.00 | |
| A person who keeps the group focused and on track and summarizes the most important arguments and group decisions | 0.82 | 0.57 | |
| Giver | A person who provides factual information and answers to questions | −0.14 | 0.86 |
| A person who states his/her beliefs and attitudes about an idea | 0.39 | 0.00 | |
| A person who expresses personal values and offers factual information | 0.82 | 0.28 | |
| Seeker | A person who requests information | 0.67 | 0.17 |
| A person who requests clarifications | 0.66 | 0.66 | |
| Follower | A person who does not actively participate in the interaction | 0.38 | 0.91 |
| Attacker | A person who deflates the status of others | −0.44 | −0.17 |
| A person who expresses disapproval | 0.92 | 0.56 | |
| A person who attacks the group or the problem | 0.00 | 0.30 | |
| Gate Keeper | A person who is the moderator within the group | 0.25 | −0.24 |
| A person who encourages and facilitates the participation | 0.82 | 0.82 | |
| A person who regulates the flow of communication | 0.82 | 0.66 | |
| Protagonist | A person who takes the floor | 0.82 | 0.38 |
| A person who drives the conversation | 0.75 | 0.66 | |
| A person who assumes a personal perspective and asserts her/his authority | 0.44 | −0.22 | |
| Supporter | A person who shows a cooperative attitude, manifesting understanding, attention, and acceptance to others | −0.67 | 0.50 |
| A person who provides technical and relational support. | 0.03 | 0.69 | |
| Neutral Role | A person who passively accepts the ideas of others. | 0.38 | 0.30 |
| A person who serves as an audience in a group discussion. | 0.67 | 0.61 |
Table 18.
Usability comparison between multimodal browser and text browser.
| Questionnaire Item | Multimodal | Text | t-test |
|---|---|---|---|
| Ease of use | 4.1 | 3.1 | t(18) = 1.945, p < 0.1 |
| Ease of search | 3.7 | 3.1 | t(18) = 0.868, n.s. |
| Efficiency in finding all relevant information | 4.0 | 3.5 | t(18) = 0.921, n.s. |
| General task comprehension | 4.3 | 3.4 | t(18) = 2.242, p < 0.05 |
| Task success | 3.7 | 2.7 | t(18) = 2.224, p < 0.05 |
| Task difficulty | 3.0 | 2.6 | t(18) = 0.802, n.s. |
| Perceived pressure | 2.7 | 2.5 | t(18) = 0.418, n.s. |
| Usefulness of the browser | 4.5 | 3.5 | t(18) = 2.301, p < 0.05 |
© 2019 by the authors. Licensee MDPI, Basel, Switzerland. This article is an open access article distributed under the terms and conditions of the Creative Commons Attribution (CC BY) license (http://creativecommons.org/licenses/by/4.0/).
Share and Cite
MDPI and ACS Style
Nihei, F.; Nakano, Y.I. Exploring Methods for Predicting Important Utterances Contributing to Meeting Summarization. Multimodal Technol. Interact. 2019, 3, 50. https://doi.org/10.3390/mti3030050
AMA Style
Nihei F, Nakano YI. Exploring Methods for Predicting Important Utterances Contributing to Meeting Summarization. Multimodal Technologies and Interaction. 2019; 3(3):50. https://doi.org/10.3390/mti3030050
Chicago/Turabian StyleNihei, Fumio, and Yukiko I. Nakano. 2019. "Exploring Methods for Predicting Important Utterances Contributing to Meeting Summarization" Multimodal Technologies and Interaction 3, no. 3: 50. https://doi.org/10.3390/mti3030050