


Evaluation of the Feasibility of In Vitro Metabolic Interruption of Trimethylamine with Resveratrol Butyrate Esters and Its Purified Monomers

 , ,
, ,  , and
, and
Abstract
: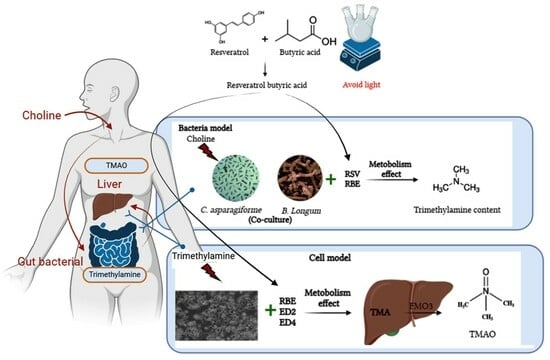
1. Introduction
2. Results
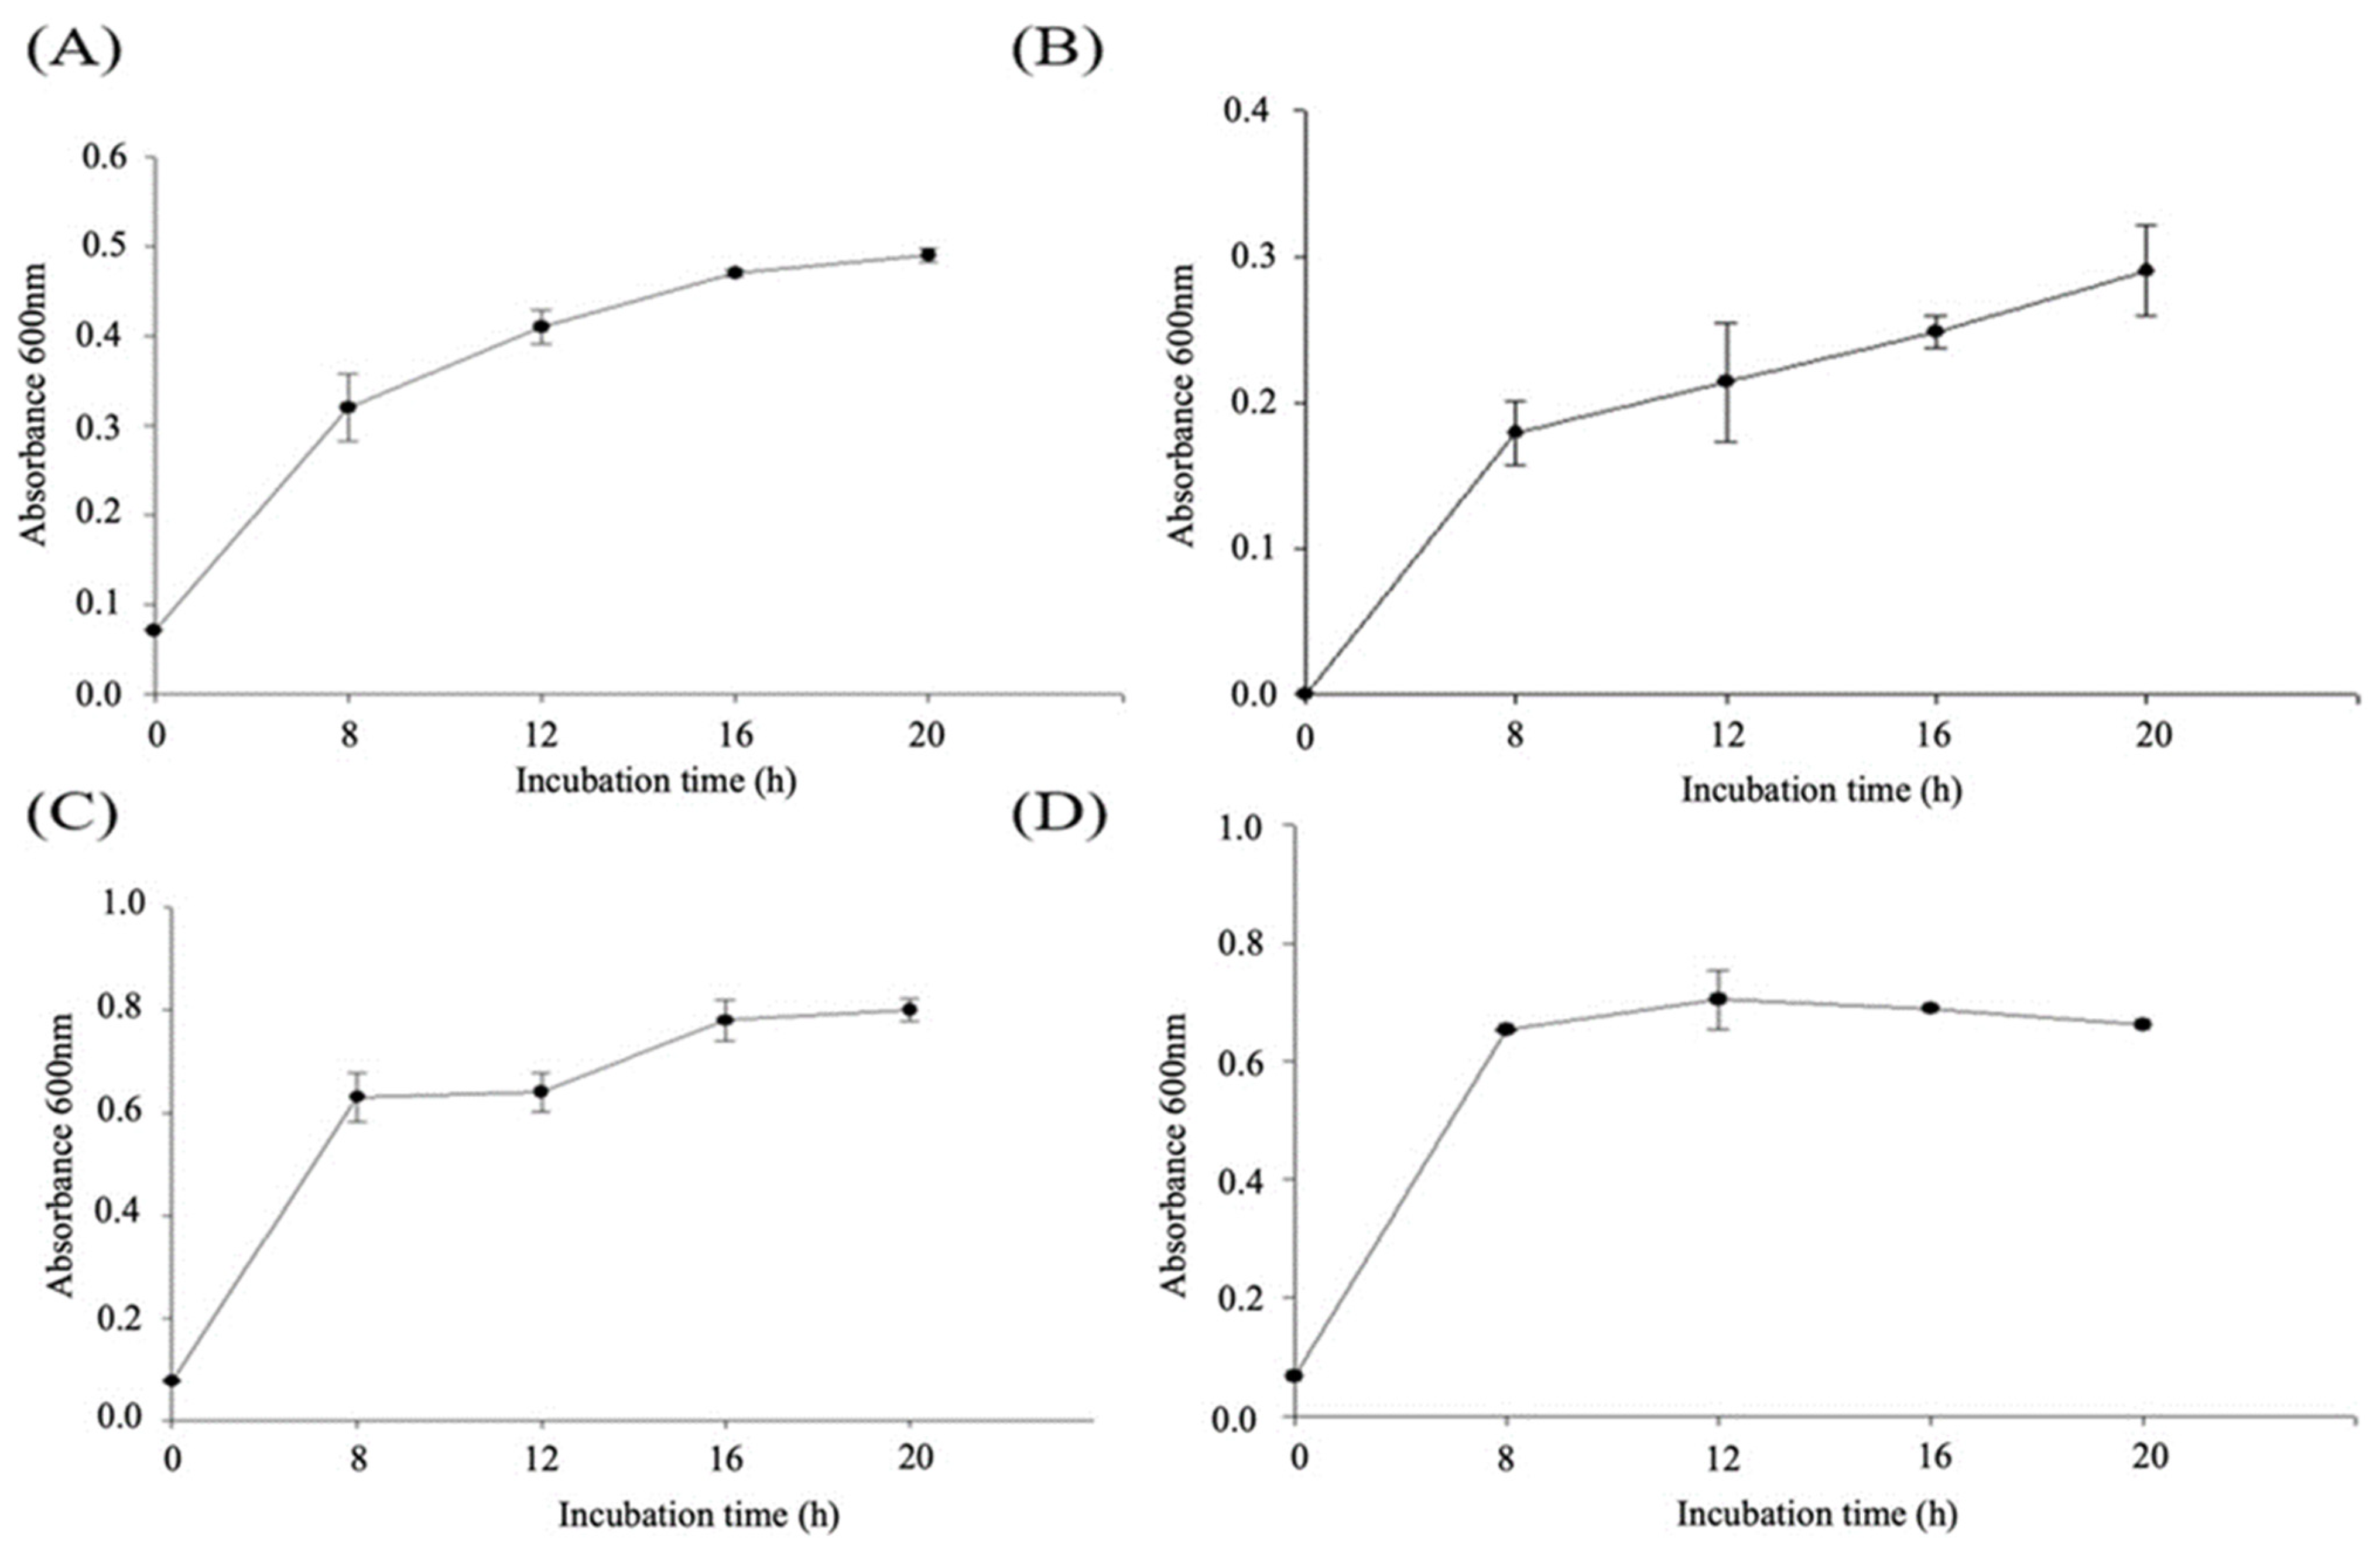
2.1. Effects of the Mixed Medium on the Growth Curves of C. asparagiforme and B. longum
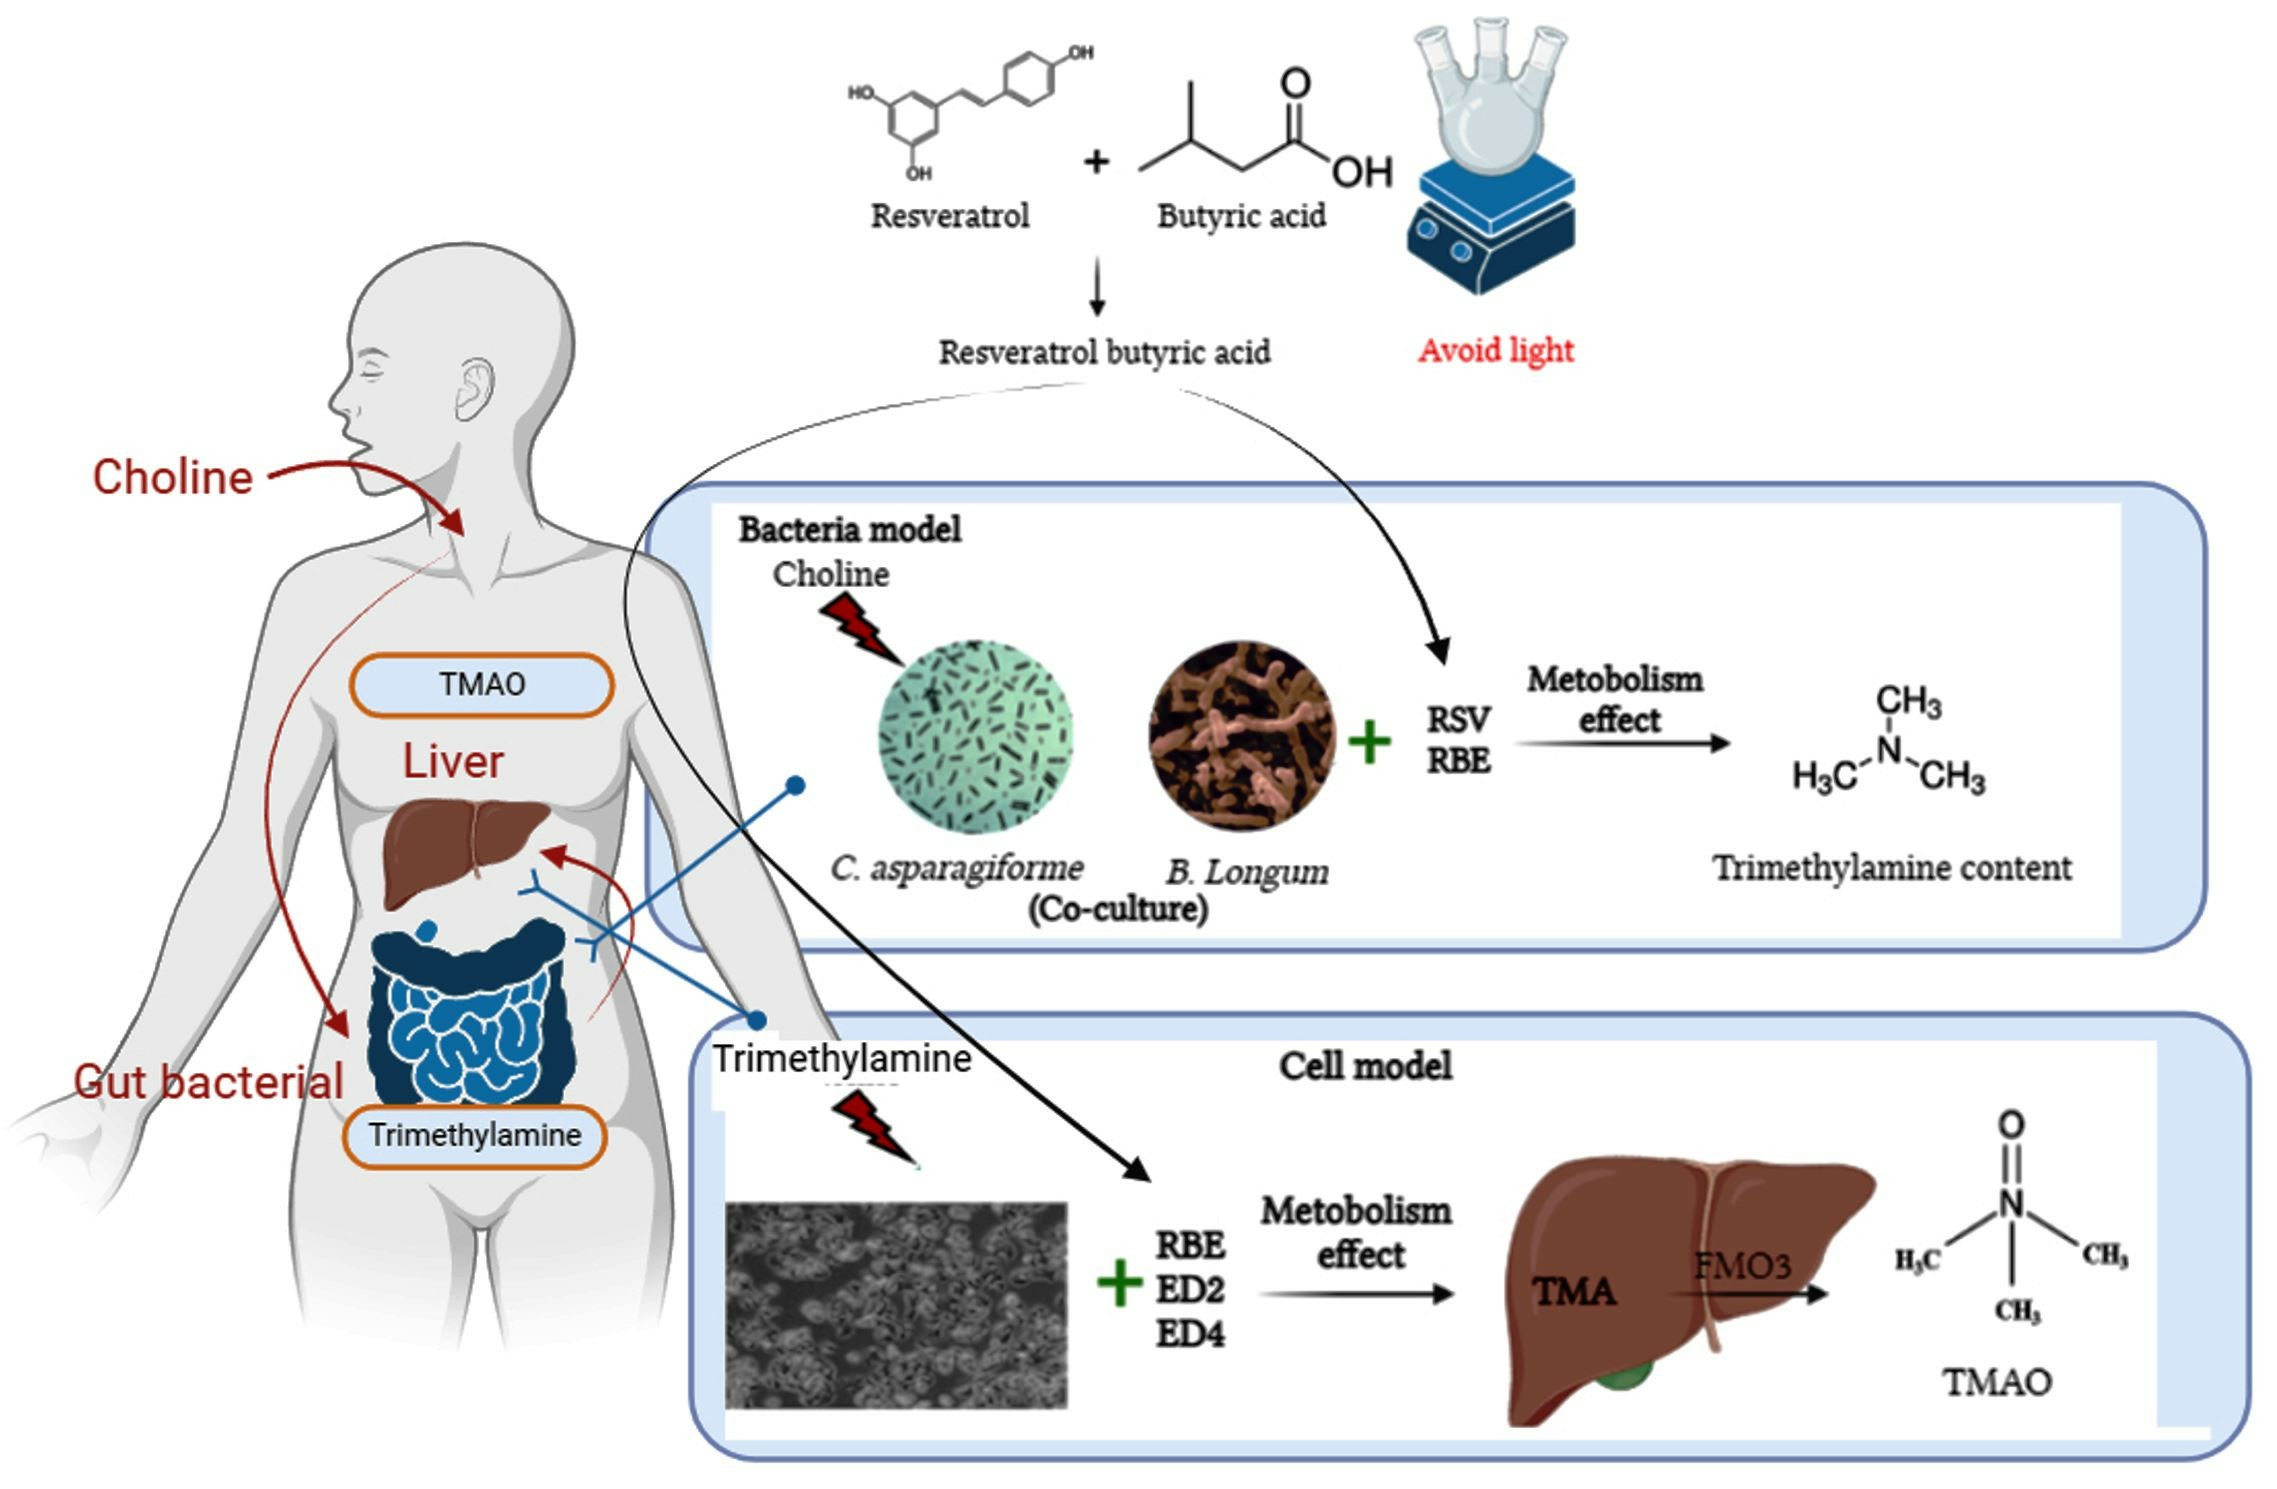
2.2. Effects of Choline, RSV, and RBE Added to Medium against the Growth Curves of C. asparagiforme and B. longum
2.3. Effect of Single Culture and Co-Culture on TMA Content Arising from Metabolized Choline
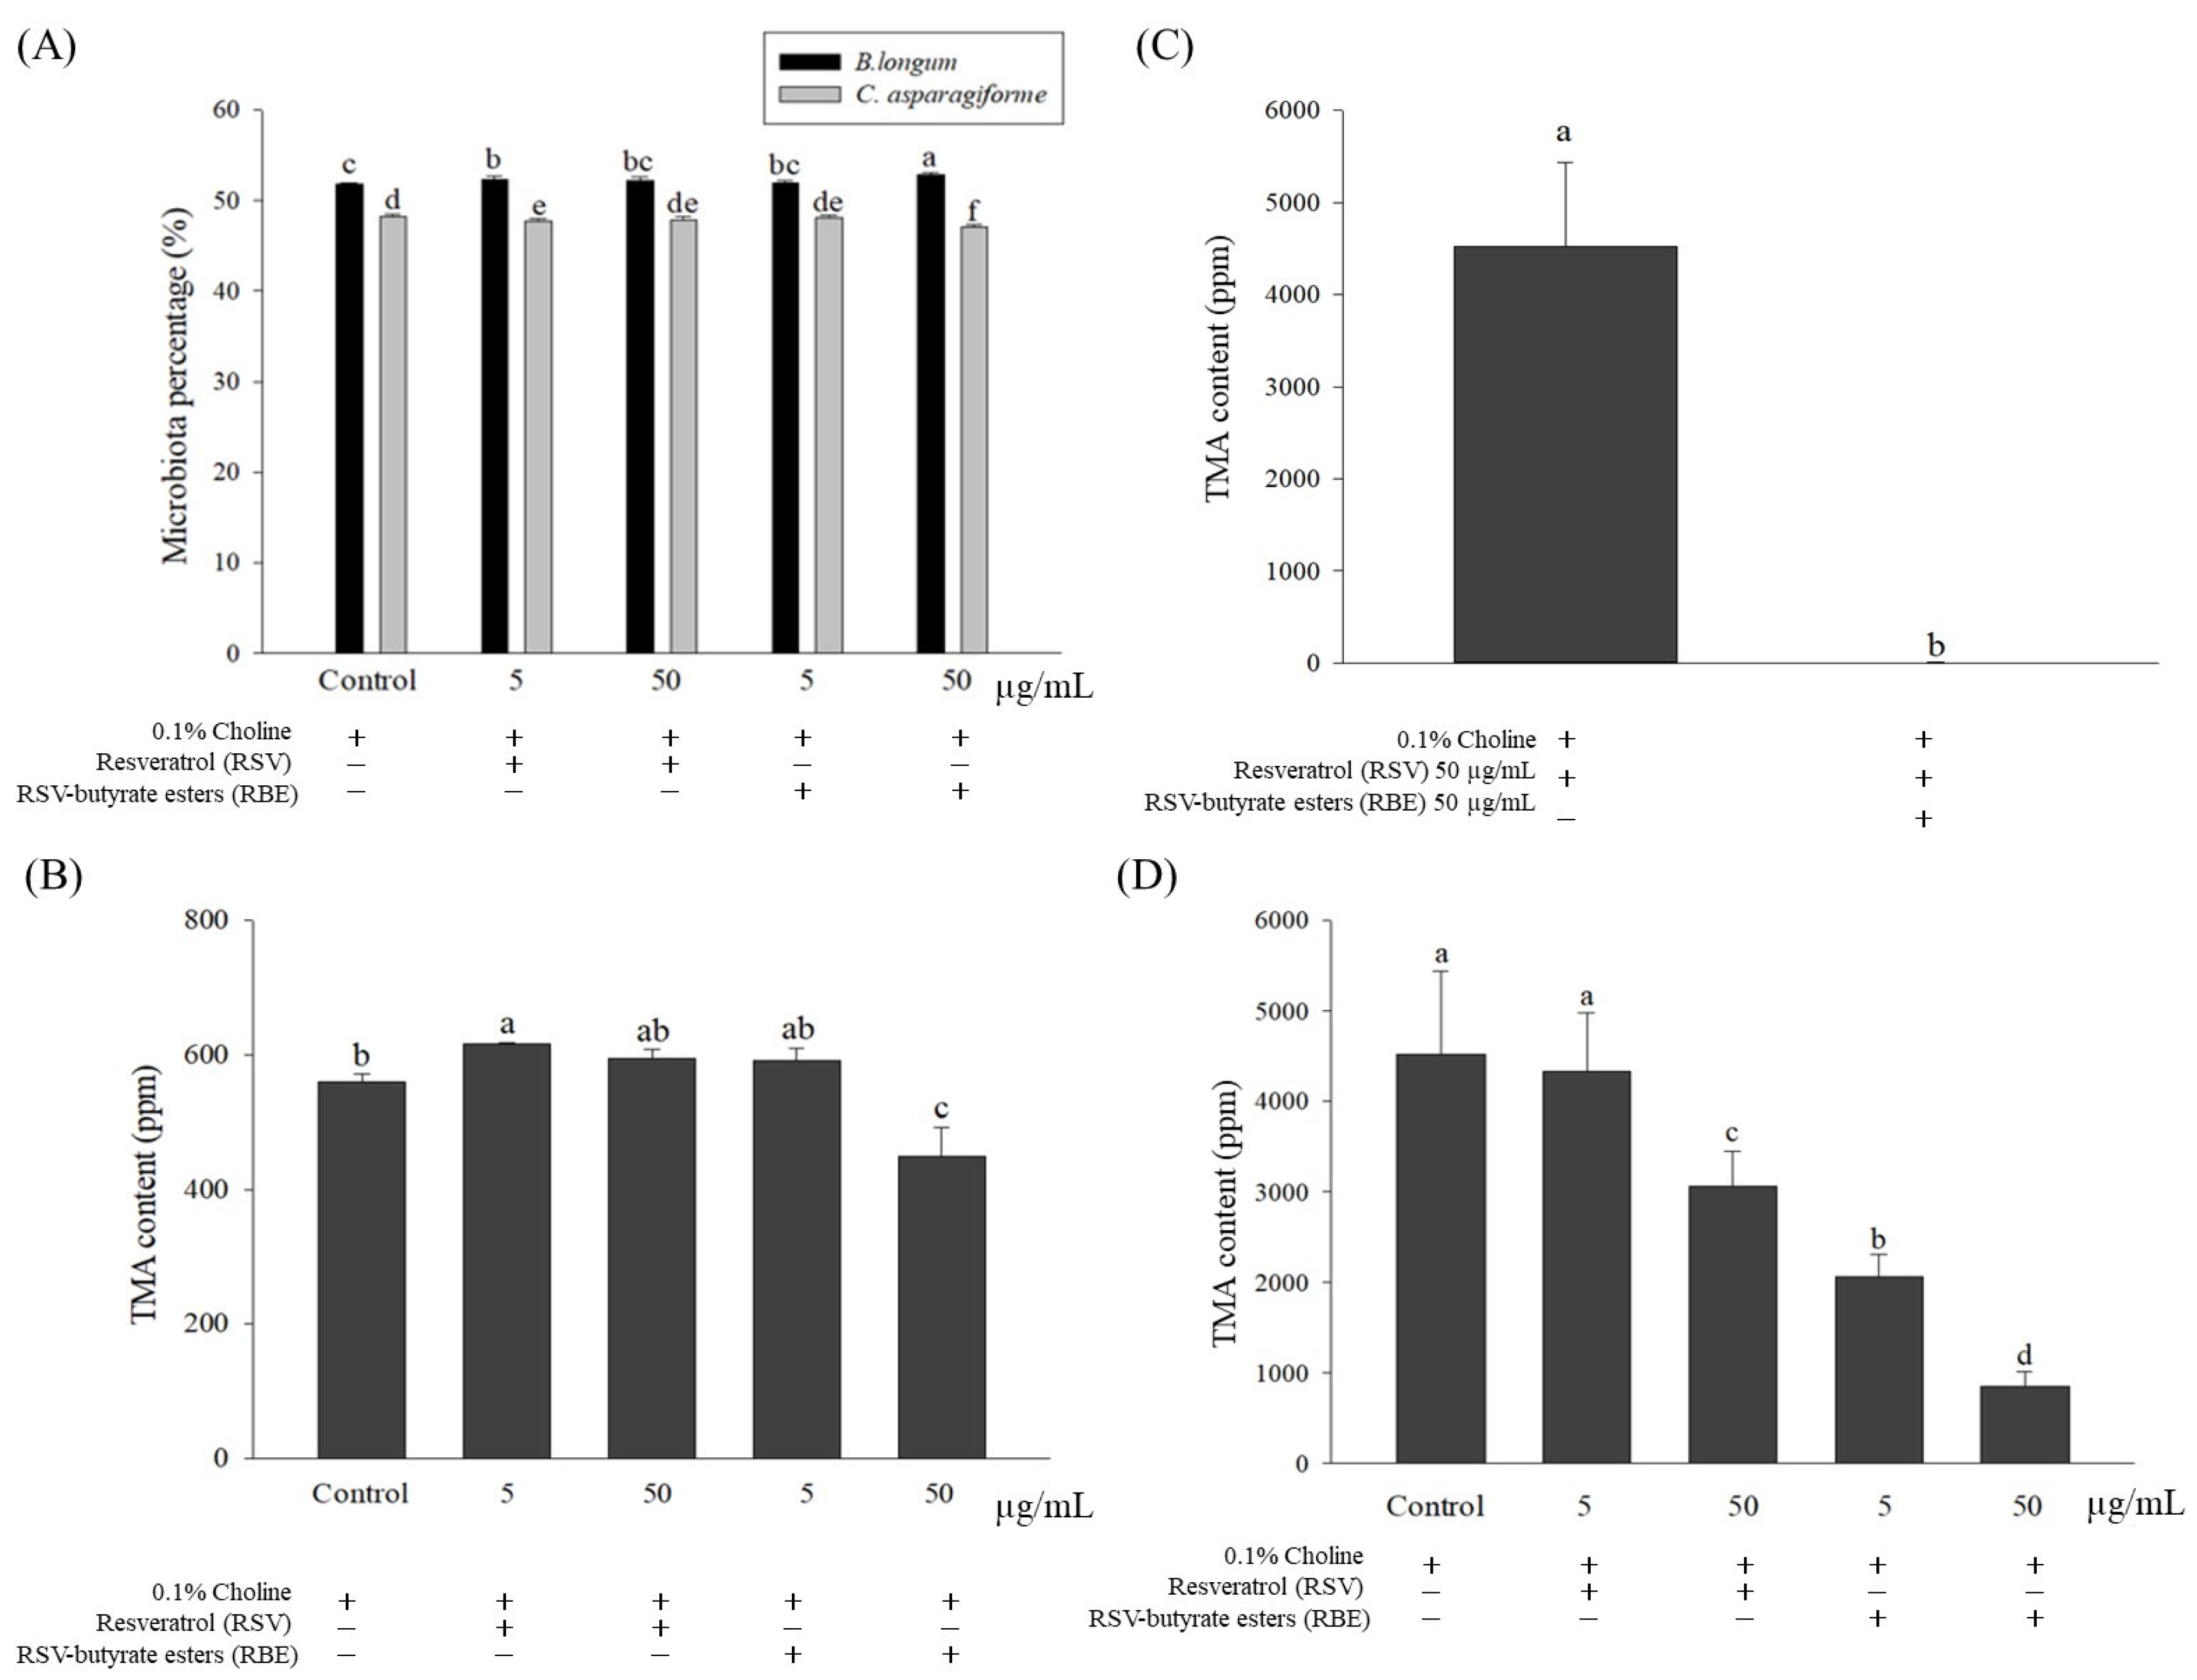
2.4. Evaluation of the Optimum Concentrations of Various Samples for the Effects of RBE and Its Ester Derivatives ED2 and ED4 on HepG2 Cell Lines’ Viability
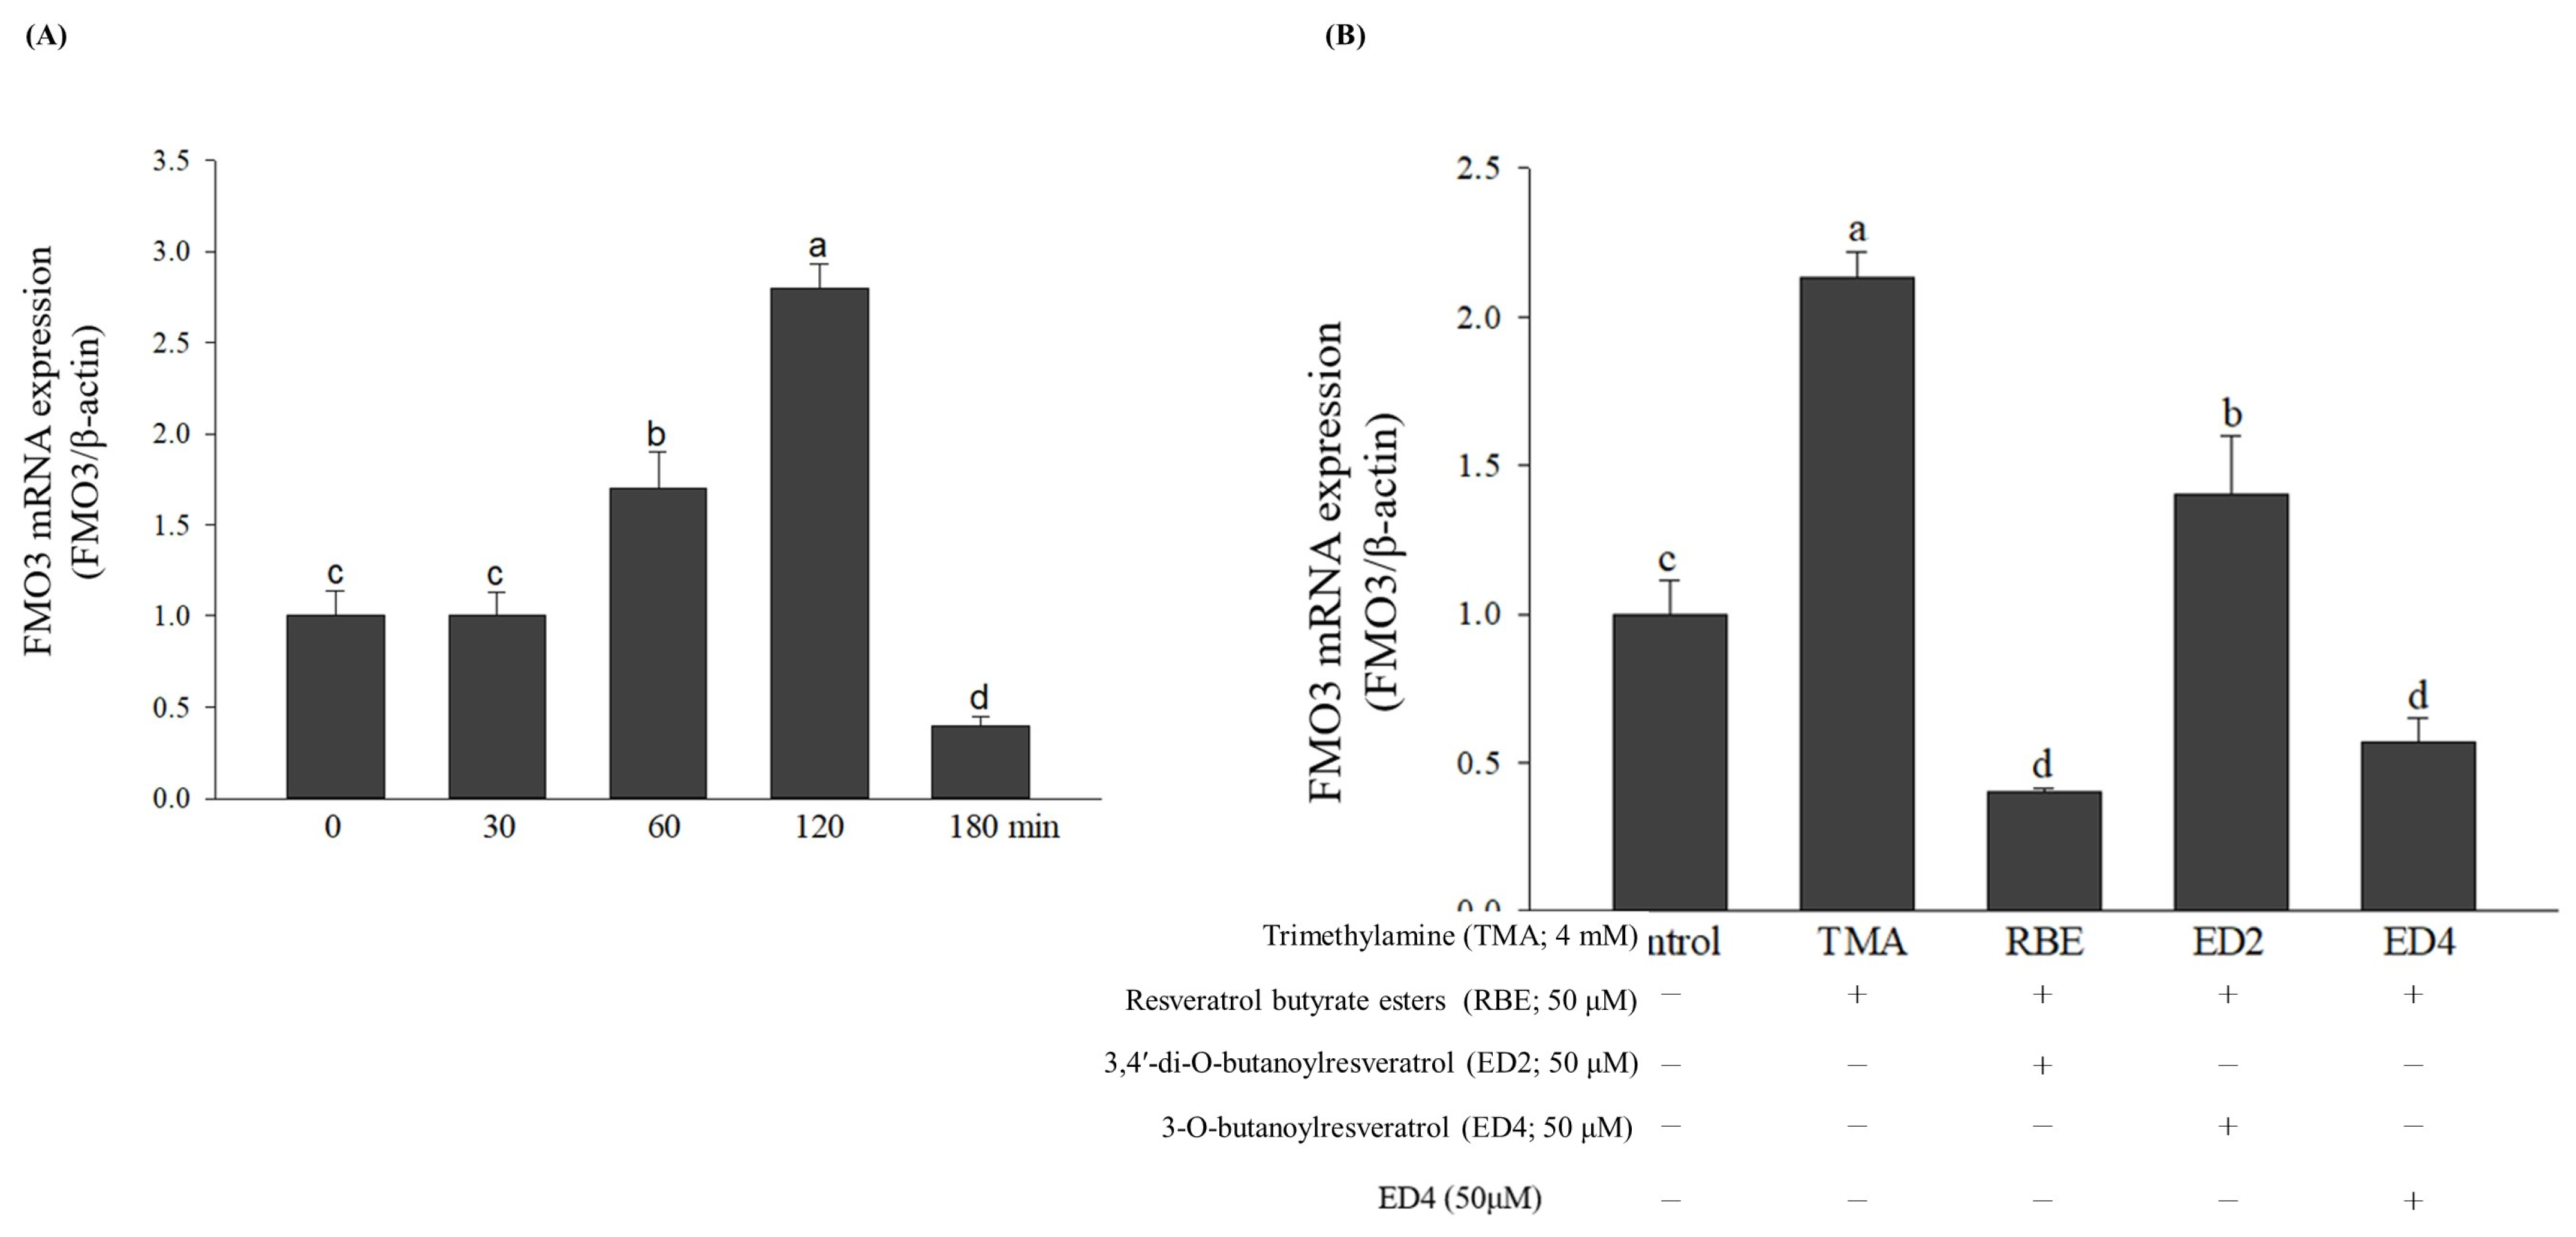
2.5. Effects of Various Treatments on FMO3 mRNA and Its Gene Expressions, Which Regulate TMA Metabolism in HepG2 Cell Lines
3. Discussion
4. Materials and Methods
4.1. Materials
4.2. Activation and Cultivation of Bacteria
4.3. Choline, RSV, and RBE Addition and Bacterial Culture
4.4. Determination of Trimethylamine (TMA) and Trimethylamine-N-Oxide (TMAO) Contents in Bacterial Co-Cultured Medium
4.5. HepG2 Cell Line Culture and Its Viability Assay
4.6. Determination of TMAO Content in Cell Line Media
4.7. Expression Analysis of Relevant Metabolic Genes in Cell Lines
4.7.1. Determination of Total RNA Content
4.7.2. Total RNA Reverse Complement to DNA
4.7.3. Real-Time Polymerase Chain Reaction (RT-PCR)
4.8. Statistical Analysis
5. Conclusions
Author Contributions
Funding
Institutional Review Board Statement
Informed Consent Statement
Data Availability Statement
Acknowledgments
Conflicts of Interest
Appendix A

| Program | Temperature (°C) | Time (s) | Cycle |
|---|---|---|---|
| 1 | 95 | 60 | 1 |
| 95 | 15 | ||
| 2 | 49 | 60 | 40 |
| 95 | 10 | ||
| 3 | 65 | 60 | 1 |
| 97 | 1 |
| Gene | Primer Sequence (5′-3′) | Reference (NCBI GenBank) |
|---|---|---|
| β-actin | F-CATCCGCAAAGACCTGTACG R-CCTGCTTGCTGATCCACATC | KR_710455.1 |
| FMO3 | F-CTCCCAGCAAGCATTCTGTG R-CATCAAGGAAGGGGTAGGCA | KR_712216.1 |

References
- Guasti, L.; Galliazzo, S.; Molaro, M.; Visconti, E.; Pennella, B.; Gaudio, G.V.; Lupi, A.; Grandi, A.M.; Squizzato, A. TMAO as a Biomarker of Cardiovascular Events: A Systematic Review and Meta-Analysis. Intern. Emerg. Med. 2021, 16, 201–207. [Google Scholar] [CrossRef] [PubMed]
- Roncal, C.; Martínez-Aguilar, E.; Orbe, J.; Ravassa, S.; Fernandez-Montero, A.; Saenz-Pipaon, G.; Ugarte, A.; Estella-Hermoso de Mendoza, A.; Rodriguez, J.A.; Fernández-Alonso, S.; et al. Trimethylamine-N-Oxide (TMAO) Predicts Cardiovascular Mortality in Peripheral Artery Disease. Sci. Rep. 2019, 9, 15580. [Google Scholar] [CrossRef] [PubMed]
- Wiedeman, A.M.; Barr, S.I.; Green, T.J.; Xu, Z.; Innis, S.M.; Kitts, D.D. Dietary Choline Intake: Current State of Knowledge Across the Life Cycle. Nutrients 2018, 10, 1513. [Google Scholar] [CrossRef]
- Shi, W.; Mersfelder, J.; Hille, R. The Interaction of Trimethylamine Dehydrogenase and Electron-Transferring Flavoprotein. J. Biol. Chem. 2005, 280, 20239–20246. [Google Scholar] [CrossRef]
- Zhang, Y.; Wang, Y.; Ke, B.; Du, J. TMAO: How Gut Microbiota Contributes to Heart Failure. Transl. Res. 2021, 228, 109–125. [Google Scholar] [CrossRef]
- Trøseid, M.; Andersen, G.Ø.; Broch, K.; Hov, J.R. The Gut Microbiome in Coronary Artery Disease and Heart Failure: Current Knowledge and Future Directions. eBioMedicine 2020, 52, 102649. [Google Scholar] [CrossRef]
- Romano, K.A.; Vivas, E.I.; Amador-Noguez, D.; Rey, F.E. Intestinal Microbiota Composition Modulates Choline Bioavailability from Diet and Accumulation of the Proatherogenic Metabolite Trimethylamine-N-Oxide. MBio 2015, 6, e02481. [Google Scholar] [CrossRef]
- Zhu, Y.; Jameson, E.; Crosatti, M.; Schäfer, H.; Rajakumar, K.; Bugg, T.D.H.; Chen, Y. Carnitine Metabolism to Trimethylamine by an Unusual Rieske-Type Oxygenase from Human Microbiota. Proc. Natl. Acad. Sci. USA 2014, 111, 4268–4273. [Google Scholar] [CrossRef] [PubMed]
- Chen, J.; Chen, X.; Ho, C.L. Recent Development of Probiotic Bifidobacteria for Treating Human Diseases. Front. Bioeng. Biotechnol. 2021, 9, 770248. [Google Scholar] [CrossRef] [PubMed]
- Bird, J.K.; Raederstorff, D.; Weber, P.; Steinert, R.E. Cardiovascular and Antiobesity Effects of Resveratrol Mediated through the Gut Microbiota. Adv. Nutr. 2017, 8, 839–849. [Google Scholar] [CrossRef]
- Ememe, M.U.; Sackey, A.K.B.; Ayo, J.O.; Ememe, M.U.; Sackey, A.K.B.; Ayo, J.O. Evaluation of Resveratrol Supplementation on Laboratory Animals, Cats, Pigs, Horses, Dogs, Cattle, and Birds. In Resveratrol–Adding Life to Years, Not Adding Years to Life; IntechOpen: Rijeka, Croatia, 2018. [Google Scholar] [CrossRef]
- Weiskirchen, S.; Weiskirchen, R. Resveratrol: How Much Wine Do You Have to Drink to Stay Healthy? Adv. Nutr. 2016, 7, 706. [Google Scholar] [CrossRef] [PubMed]
- Inchingolo, A.D.; Malcangi, G.; Inchingolo, A.M.; Piras, F.; Settanni, V.; Garofoli, G.; Palmieri, G.; Ceci, S.; Patano, A.; DeLeonardis, N.; et al. Benefits and Implications of Resveratrol Supplementation on Microbiota Modulations: A Systematic Review of the Literature. Int. J. Mol. Sci. 2022, 23, 4027. [Google Scholar] [CrossRef] [PubMed]
- Shih, M.-K.; Tain, Y.-L.; Cheng, C.-M.; Hsu, C.-N.; Chen, Y.-W.; Huang, H.-T.; Chang, C.-I.; Hou, C.-Y. Separation and Identification of Resveratrol Butyrate Ester Complexes and Their Bioactivity in HepG2 Cell Models. Int. J. Mol. Sci. 2021, 22, 13539. [Google Scholar] [CrossRef] [PubMed]
- Brockmueller, A.; Sameri, S.; Liskova, A.; Zhai, K.; Varghese, E.; Samuel, S.M.; Büsselberg, D.; Kubatka, P.; Shakibaei, M. Resveratrol’s Anti-Cancer Effects through the Modulation of Tumor Glucose Metabolism. Cancers 2021, 13, 188. [Google Scholar] [CrossRef] [PubMed]
- Frémont, L. Minireview: Biological Effects of Resveratrol. Life Sci. 2000, 66, 663–673. [Google Scholar] [CrossRef] [PubMed]
- Chen, M.; Yi, L.; Zhang, Y.; Zhou, X.; Ran, L.; Yang, J.; Zhu, J.; Zhang, Q.; Mi, M. Resveratrol Attenuates Trimethylamine-N-Oxide (TMAO)-Induced Atherosclerosis by Regulating TMAO Synthesis and Bile Acid Metabolism via Remodeling of the Gut Microbiota. MBio 2016, 7, e02210–e2215. [Google Scholar] [CrossRef]
- Gutiérrez-Escobar, R.; Aliaño-González, M.J.; Cantos-Villar, E. Wine Polyphenol Content and Its Influence on Wine Quality and Properties: A Review. Molecules 2021, 26, 718. [Google Scholar] [CrossRef] [PubMed]
- Drabińska, N.; Jarocka-Cyrta, E. Crosstalk between Resveratrol and Gut Barrier: A Review. Int. J. Mol. Sci. 2022, 23, 15279. [Google Scholar] [CrossRef]
- Bhattacharya, S.; Perris, A.; Jawed, J.J.; Hoda, M. Therapeutic Role of Resveratrol against Hepatocellular Carcinoma: A Review on Its Molecular Mechanisms of Action. Pharmacol. Res.-Mod. Chin. Med. 2023, 6, 100233. [Google Scholar] [CrossRef]
- Tamargo, A.; de Llano, D.G.; Cueva, C.; del Hierro, J.N.; Martin, D.; Molinero, N.; Bartolomé, B.; Victoria Moreno-Arribas, M. Deciphering the Interactions between Lipids and Red Wine Polyphenols through the Gastrointestinal Tract. Food Res. Int. 2023, 165, 112524. [Google Scholar] [CrossRef]
- Luo, B.; Wen, Y.; Ye, F.; Wu, Y.; Li, N.; Farid, M.S.; Chen, Z.; El-Seedi, H.R.; Zhao, C. Bioactive Phytochemicals and Their Potential Roles in Modulating Gut Microbiota. J. Agric. Food Res. 2023, 12, 100583. [Google Scholar] [CrossRef]
- Qiao, Y.; Sun, J.; Xia, S.; Tang, X.; Shi, Y.; Le, G. Effects of Resveratrol on Gut Microbiota and Fat Storage in a Mouse Model with High-Fat-Induced Obesity. Food Funct. 2014, 5, 1241–1249. [Google Scholar] [CrossRef] [PubMed]
- Hsu, C.N.; Hou, C.Y.; Chang-Chien, G.P.; Lin, S.; Chan, J.Y.H.; Lee, C.T.; Tain, Y.L. Maternal Resveratrol Therapy Protected Adult Rat Offspring against Hypertension Programmed by Combined Exposures to Asymmetric Dimethylarginine and Trimethylamine-N-Oxide. J. Nutr. Biochem. 2021, 93, 108630. [Google Scholar] [CrossRef] [PubMed]
- Gątarek, P.; Kałużna-Czaplińska, J. Trimethylamine N-Oxide (TMAO) in Human Health. EXCLI J. 2021, 20, 301. [Google Scholar] [CrossRef]
- Taesuwan, S.; Cho, C.E.; Malysheva, O.V.; Bender, E.; King, J.H.; Yan, J.; Thalacker-Mercer, A.E.; Caudill, M.A. The Metabolic Fate of Isotopically Labeled Trimethylamine-N-Oxide (TMAO) in Humans. J. Nutr. Biochem. 2017, 45, 77–82. [Google Scholar] [CrossRef] [PubMed]
- Wang, Z.; Klipfell, E.; Bennett, B.J.; Koeth, R.; Levison, B.S.; Dugar, B.; Feldstein, A.E.; Britt, E.B.; Fu, X.; Chung, Y.-M.M.; et al. Gut Flora Metabolism of Phosphatidylcholine Promotes Cardiovascular Disease. Nature 2011, 472, 57–63. [Google Scholar] [CrossRef]
- Janeiro, M.H.; Ramírez, M.J.; Milagro, F.I.; Martínez, J.A.; Solas, M. Implication of Trimethylamine N-Oxide (TMAO) in Disease: Potential Biomarker or New Therapeutic Target. Nutrients 2018, 10, 1398. [Google Scholar] [CrossRef] [PubMed]
- Cashman, J.R.; Xiong, Y.; Lin, J.; Verhagen, H.; VanPoppel, G.; VanBladeren, P.J.; Larsen-Su, S.; Williams, D.E. In Vitro and in Vivo Inhibition of Human Flavin-Containing Monooxygenase Form 3 (FMO3) in the Presence of Dietary Indoles. Biochem. Pharmacol. 1999, 58, 1047–1055. [Google Scholar] [CrossRef] [PubMed]
- Butler, E.J.; Fenwick, G.R. Trimethylamine and Fishy Taint in Eggs. World’s Poult. Sci. J. 2019, 40, 38–51. [Google Scholar] [CrossRef]
- Iglesias-Carres, L.; Hughes, M.D.; Steele, C.N.; Ponder, M.A.; Davy, K.P.; Neilson, A.P. Use of Dietary Phytochemicals for Inhibition of Trimethylamine N-Oxide Formation. J. Nutr. Biochem. 2021, 91, 108600. [Google Scholar] [CrossRef]
- Shih, M.-K.; Tain, Y.-L.; Chen, Y.-W.; Hsu, W.-H.; Yeh, Y.-T.; Chang, S.K.C.; Liao, J.-X.; Hou, C.-Y. Resveratrol Butyrate Esters Inhibit Obesity Caused by Perinatal Exposure to Bisphenol a in Female Offspring Rats. Molecules 2021, 26, 4010. [Google Scholar] [CrossRef] [PubMed]
- Tain, Y.-L.; Chang, S.K.C.; Liao, J.-X.; Chen, Y.-W.; Huang, H.-T.; Li, Y.-L.; Hou, C.-Y. Synthesis of Short-Chain-Fatty-Acid Resveratrol Esters and Their Antioxidant Properties. Antioxidants 2021, 10, 420. [Google Scholar] [CrossRef] [PubMed]
- Tain, Y.-L.; Jheng, L.-C.; Chang, S.K.C.; Chen, Y.-W.; Huang, L.-T.; Liao, J.-X.; Hou, C.-Y. Synthesis and Characterization of Novel Resveratrol Butyrate Esters That Have the Ability to Prevent Fat Accumulation in a Liver Cell Culture Model. Molecules 2020, 25, 4199. [Google Scholar] [CrossRef] [PubMed]
- Liao, J.-X.; Chen, Y.-W.; Shih, M.-K.; Tain, Y.-L.; Yeh, Y.-T.; Chiu, M.-H.; Chang, S.K.C.; Hou, C.-Y. Resveratrol Butyrate Esters Inhibit BPA-Induced Liver Damage in Male Offspring Rats by Modulating Antioxidant Capacity and Gut Microbiota. Int. J. Mol. Sci. 2021, 22, 5273. [Google Scholar] [CrossRef]
- Hsu, C.N.; Hou, C.Y.; Chang, C.I.; Tain, Y.L. Resveratrol Butyrate Ester Protects Adenine-Treated Rats against Hypertension and Kidney Disease by Regulating the Gut-Kidney Axis. Antioxidants 2021, 11, 83. [Google Scholar] [CrossRef] [PubMed]
- Hsu, C.N.; Yu, H.R.; Lin, I.C.; Tiao, M.M.; Huang, L.T.; Hou, C.Y.; Chang-Chien, G.P.; Lin, S.; Tain, Y.L. Sodium Butyrate Modulates Blood Pressure and Gut Microbiota in Maternal Tryptophan-Free Diet-Induced Hypertension Rat Offspring. J. Nutr. Biochem. 2022, 108, 109090. [Google Scholar] [CrossRef]
- Shih, M.-K.; Hsieh, S.-L.; Huang, Y.-W.; Patel, A.K.; Dong, C.; Hou, C.-Y. Resveratrol Butyrate Esters Inhibit Lipid Biosynthesis in 3T3-L1 Cells by AMP-Activated Protein Kinase Phosphorylation. J. Food Sci. Technol. 2022, 60, 1015–1025 . [Google Scholar] [CrossRef]
- Zhang, J.; Chaluvadi, M.R.; Reddy, R.; Motika, M.S.; Richardson, T.A.; Cashman, J.R.; Morgan, E.T. Hepatic Flavin-Containing Monooxygenase Gene Regulation in Different Mouse Inflammation Models. Drug Metab. Dispos. 2009, 37, 462. [Google Scholar] [CrossRef]
- Rudraiah, S.; Rohrer, P.R.; Gurevich, I.; Goedken, M.J.; Rasmussen, T.; Hines, R.N.; Manautou, J.E. Tolerance to Acetaminophen Hepatotoxicity in the Mouse Model of Autoprotection Is Associated with Induction of Flavin-Containing Monooxygenase-3 (FMO3) in Hepatocytes. Toxicol. Sci. 2014, 141, 263–277. [Google Scholar] [CrossRef]
- Cashman, J.R.; Zhang, J. Interindividual Differences of Human Flavin-Containing Monooxygenase 3: Genetic Polymorphisms and Functional Variation. Drug Metab. Dispos. 2002, 30, 1043–1052. [Google Scholar] [CrossRef]
- O’Connor, M.A.; Koza-Taylor, P.; Campion, S.N.; Aleksunes, L.M.; Gu, X.; Enayetallah, A.E.; Lawton, M.P.; Manautou, J.E. Analysis of Changes in Hepatic Gene Expression in a Murine Model of Tolerance to Acetaminophen Hepatotoxicity (Autoprotection). Toxicol. Appl. Pharmacol. 2014, 274, 156–167. [Google Scholar] [CrossRef] [PubMed]
- Papandreou, C.; Moré, M.; Bellamine, A. Trimethylamine N-Oxide in Relation to Cardiometabolic Health-Cause or Effect? Nutrients 2020, 12, 1330. [Google Scholar] [CrossRef] [PubMed]
- Krueger, E.S.; Lloyd, T.S.; Tessem, J.S. The Accumulation and Molecular Effects of Trimethylamine N-Oxide on Metabolic Tissues: It’s Not All Bad. Nutrients 2021, 13, 2873. [Google Scholar] [CrossRef]
- Jameson, E.; Quareshy, M.; Chen, Y. Methodological Considerations for the Identification of Choline and Carnitine-Degrading Bacteria in the Gut. Methods 2018, 149, 42–48. [Google Scholar] [CrossRef] [PubMed]
- Bennett, B.J.; Vallim, T.Q.D.A.; Wang, Z.; Shih, D.M.; Meng, Y.; Gregory, J.; Allayee, H.; Lee, R.; Graham, M.; Crooke, R.; et al. Trimethylamine-N-Oxide, a Metabolite Associated with Atherosclerosis, Exhibits Complex Genetic and Dietary Regulation. Cell Metab. 2013, 17, 49–60. [Google Scholar] [CrossRef] [PubMed]
- Chen, Y.; Weng, Z.; Liu, Q.; Shao, W.; Guo, W.; Chen, C.; Jiao, L.; Wang, Q.; Lu, Q.; Sun, H.; et al. FMO3 and Its Metabolite TMAO Contribute to the Formation of Gallstones. Biochim. Biophys. Acta-Mol. Basis Dis. 2019, 1865, 2576–2585. [Google Scholar] [CrossRef]
- Lu, M.; Yang, Y.; Xu, Y.; Wang, X.; Li, B.; Le, G.; Xie, Y. Dietary Methionine Restriction Alleviates Choline-Induced Tri-Methylamine-N-Oxide (TMAO) Elevation by Manipulating Gut Microbiota in Mice. Nutrients 2023, 15, 206. [Google Scholar] [CrossRef]
- Schugar, R.C.; Shih, D.M.; Warrier, M.; Helsley, R.N.; Burrows, A.; Ferguson, D.; Brown, A.L.; Gromovsky, A.D.; Heine, M.; Chatterjee, A.; et al. The TMAO-Producing Enzyme Flavin-Containing Monooxygenase 3 (FMO3) Regulates Obesity and the Beiging of White Adipose Tissue. Cell Rep. 2017, 19, 2451. [Google Scholar] [CrossRef]
- Shanmugham, M.; Bellanger, S.; Leo, C.H. Gut-Derived Metabolite, Trimethylamine-N-Oxide (TMAO) in Cardio-Metabolic Diseases: Detection, Mechanism, and Potential Therapeutics. Pharmaceuticals 2023, 16, 504. [Google Scholar] [CrossRef]
- Griffin, L.E.; Djuric, Z.; Angiletta, C.J.; Mitchell, C.M.; Baugh, M.E.; Davy, K.P.; Neilson, A.P. A Mediterranean Diet Does Not Alter Plasma Trimethylamine N-Oxide Concentrations in Healthy Adults at Risk for Colon Cancer. Food Funct. 2019, 10, 2138–2147. [Google Scholar] [CrossRef]
- Arias, N.; Arboleya, S.; Allison, J.; Kaliszewska, A.; Higarza, S.G.; Gueimonde, M.; Arias, J.L. The Relationship between Choline Bioavailability from Diet, Intestinal Microbiota Composition, and Its Modulation of Human Diseases. Nutrients 2020, 12, 2340. [Google Scholar] [CrossRef]
- Chen, K.; Zheng, X.; Feng, M.; Li, D.; Zhang, H. Gut Microbiota-Dependent Metabolite Trimethylamine N-Oxide Contributes to Cardiac Dysfunction in Western Diet-Induced Obese Mice. Front. Physiol. 2017, 8, 139. [Google Scholar] [CrossRef] [PubMed]
- Li, Q.; Wu, T.; Liu, R.; Zhang, M.; Wang, R. Soluble Dietary Fiber Reduces Trimethylamine Metabolism via Gut Microbiota and Co-Regulates Host AMPK Pathways. Mol. Nutr. Food Res. 2017, 61, 1700473. [Google Scholar] [CrossRef]
- Benítez-Páez, A.; Kjølbæk, L.; Gómez del Pulgar, E.M.; Brahe, L.K.; Astrup, A.; Matysik, S.; Schött, H.-F.; Krautbauer, S.; Liebisch, G.; Boberska, J.; et al. A Multi-Omics Approach to Unraveling the Microbiome-Mediated Effects of Arabinoxylan Oligosaccharides in Overweight Humans. mSystems 2019, 4, 1–16. [Google Scholar] [CrossRef] [PubMed]
- Chen, A.C.; Fang, T.J.; Ho, H.H.; Chen, J.F.; Kuo, Y.W.; Huang, Y.Y.; Tsai, S.Y.; Wu, S.F.; Lin, H.C.; Yeh, Y.T. A Multi-Strain Probiotic Blend Reshaped Obesity-Related Gut Dysbiosis and Improved Lipid Metabolism in Obese Children. Front. Nutr. 2022, 9, 922993. [Google Scholar] [CrossRef]
- Liao, C.A.; Huang, C.H.; Ho, H.H.; Chen, J.F.; Kuo, Y.W.; Lin, J.H.; Tsai, S.Y.; Tsai, H.Y.; Yeh, Y.T. A Combined Supplement of Probiotic Strains AP-32, Bv-77, and CP-9 Increased Akkermansia Mucinphila and Reduced Non-Esterified Fatty Acids and Energy Metabolism in HFD-Induced Obese Rats. Nutrients 2022, 14, 527. [Google Scholar] [CrossRef] [PubMed]
- Tsao, S.P.; Nurrahma, B.A.; Kumar, R.; Wu, C.H.; Yeh, T.H.; Chiu, C.C.; Lee, Y.P.; Liao, Y.C.; Huang, C.H.; Yeh, Y.T.; et al. Probiotic Enhancement of Antioxidant Capacity and Alterations of Gut Microbiota Composition in 6-Hydroxydopamin-Induced Parkinson’s Disease Rats. Antioxidants 2021, 10, 1823. [Google Scholar] [CrossRef]
- Qiu, L.; Yang, D.; Tao, X.; Yu, J.; Xiong, H.; Wei, H. Enterobacter Aerogenes ZDY01 Attenuates Choline-Induced Trimethylamine N-Oxide Levels by Remodeling Gut Microbiota in Mice. J. Microbiol. Biotechnol. 2017, 27, 1491–1499. [Google Scholar] [CrossRef]
- Miao, J.; Ling, A.V.; Manthena, P.V.; Gearing, M.E.; Graham, M.J.; Crooke, R.M.; Croce, K.J.; Esquejo, R.M.; Clish, C.B.; Vicent, D.; et al. Flavin-Containing Monooxygenase 3 as a Potential Player in Diabetes-Associated Atherosclerosis. Nat. Commun. 2015, 6, 6498. [Google Scholar] [CrossRef]
- Mohan, R.; Namsolleck, P.; Lawson, P.A.; Osterhoff, M.; Collins, M.D.; Alpert, C.A.; Blaut, M. Clostridium Asparagiforme Sp. Nov., Isolated from a Human Faecal Sample. Syst. Appl. Microbiol. 2006, 29, 292–299. [Google Scholar] [CrossRef]
- Yasmin, I.; Saeed, M.; Pasha, I.; Zia, M.A. Development of Whey Protein Concentrate-Pectin-Alginate Based Delivery System to Improve Survival of B. Longum BL-05 in Simulated Gastrointestinal Conditions. Probiotics Antimicrob. Proteins 2019, 11, 413–426. [Google Scholar] [CrossRef] [PubMed]
- Bryant, M.P. Commentary on the Hungate Technique for Culture of Anaerobic Bacteria. Am. J. Clin. Nutr. 1972, 25, 1324–1328. [Google Scholar] [CrossRef] [PubMed]
- Hungate, R.E. Chapter IV A Roll Tube Method for Cultivation of Strict Anaerobes. Methods Microbiol. 1969, 3, 117–132. [Google Scholar] [CrossRef]
- Hsu, C.N.; Chang-Chien, G.P.; Lin, S.; Hou, C.Y.; Lu, P.C.; Tain, Y.L. Association of Trimethylamine, Trimethylamine N-Oxide, and Dimethylamine with Cardiovascular Risk in Children with Chronic Kidney Disease. J. Clin. Med. 2020, 9, 336. [Google Scholar] [CrossRef]
- Huang, P.H.; Fu, L.C.; Huang, C.S.; Wang, Y.T.; Wu, M.C. The Uptake of Oligogalacturonide and Its Effect on Growth Inhibition, Lactate Dehydrogenase Activity and Galactin-3 Release of Human Cancer Cells. Food Chem. 2012, 132, 1987–1995. [Google Scholar] [CrossRef]


| Bacterial Strain | Choline (%) | Control | Resveratrol (RSV; µg/mL) | RSV-Butyrate Esters (RBE; µg/mL) | ||||
|---|---|---|---|---|---|---|---|---|
| 5 | 50 | 100 | 5 | 50 | 100 | |||
| C. asparagiforme | 0 | 0.30 ± 0.03 Ba | 0.32 ± 0.02 Ba | 0.27 ± 0.06 Bb | 0.32 ± 0.01 Ba | 0.28 ± 0.01 Cb | 0.29 ± 0.01 Bb | 0.07 ± 0.01 Cc |
| 0.1 | 0.28 ± 0.00 Ba | 0.25 ± 0.01 Ba | 0.24 ± 0.00 Bb | 0.21 ± 0.02 Cc | 0.23 ± 0.01 Cc | 0.11 ± 0.00 Cd | 0.07 ± 0.00 Cd | |
| 0.5 | 0.10 ± 0.00 Ca | 0.09 ± 0.00 Ca | 0.09 ± 0.00 Ca | 0.11 ± 0.00 Da | 0.08 ± 0.00 Da | 0.07 ± 0.00 Ca | 0.07 ± 0.00 Ca | |
| 1 | 0.08 ± 0.00 Ca | 0.08 ± 0.00 Ca | 0.09 ± 0.01 Ca | 0.10 ± 0.00 Da | 0.08 ± 0.00 Da | 0.07 ± 0.00 Ca | 0.06 ± 0.00 Ca | |
| B. longum | 0 | 0.57 ± 0.01 Ab | 0.55 ± 0.00 Ab | 0.53 ± 0.03 Ab | 0.46 ± 0.02 Ac | 0.64 ± 0.05 Aa | 0.56 ± 0.02 Ab | 0.52 ± 0.02 Ab |
| 0.1 | 0.55 ± 0.01 Aa | 0.57 ± 0.00 Aa | 0.48 ± 0.01 Ac | 0.49 ± 0.03 Ac | 0.57 ± 0.02 Ba | 0.53 ± 0.01 Ab | 0.56 ± 0.03 Aa | |
| 0.5 | 0.55 ± 0.01 Aa | 0.54 ± 0.01 Aa | 0.50 ± 0.02 Ab | 0.45 ± 0.02 Ac | 0.55 ± 0.02 Ba | 0.51 ± 0.01 Ab | 0.51 ± 0.01 Ab | |
| 1 | 0.51 ± 0.01 Aa | 0.53 ± 0.01 Aa | 0.49 ± 0.03 Aab | 0.43 ± 0.03 Ac | 0.54 ± 0.03 Ba | 0.52 ± 0.01 Aa | 0.47 ± 0.02 Bb | |
Disclaimer/Publisher’s Note: The statements, opinions and data contained in all publications are solely those of the individual author(s) and contributor(s) and not of MDPI and/or the editor(s). MDPI and/or the editor(s) disclaim responsibility for any injury to people or property resulting from any ideas, methods, instructions or products referred to in the content. |
© 2024 by the authors. Licensee MDPI, Basel, Switzerland. This article is an open access article distributed under the terms and conditions of the Creative Commons Attribution (CC BY) license (https://creativecommons.org/licenses/by/4.0/).
Share and Cite
Huang, P.-H.; Chen, D.-Q.; Chen, Y.-W.; Shih, M.-K.; Lee, B.-H.; Tain, Y.-L.; Hsieh, C.-W.; Hou, C.-Y. Evaluation of the Feasibility of In Vitro Metabolic Interruption of Trimethylamine with Resveratrol Butyrate Esters and Its Purified Monomers. Molecules 2024, 29, 429. https://doi.org/10.3390/molecules29020429
Huang P-H, Chen D-Q, Chen Y-W, Shih M-K, Lee B-H, Tain Y-L, Hsieh C-W, Hou C-Y. Evaluation of the Feasibility of In Vitro Metabolic Interruption of Trimethylamine with Resveratrol Butyrate Esters and Its Purified Monomers. Molecules. 2024; 29(2):429. https://doi.org/10.3390/molecules29020429
Chicago/Turabian StyleHuang, Ping-Hsiu, De-Quan Chen, Yu-Wei Chen, Ming-Kuei Shih, Bao-Hong Lee, You-Lin Tain, Chang-Wei Hsieh, and Chih-Yao Hou. 2024. "Evaluation of the Feasibility of In Vitro Metabolic Interruption of Trimethylamine with Resveratrol Butyrate Esters and Its Purified Monomers" Molecules 29, no. 2: 429. https://doi.org/10.3390/molecules29020429