Article

Theoretical Exploration of Properties of Iron–Silicon Interface Constructed by Depositing Fe on Si(111)-(7×7)

1
Institute of Advanced Study, Chengdu University, Chengdu 610106, China
2
School of Pharmacy, Chengdu University, Chengdu 610106, China
3
State Key Laboratory of Nonlinear Mechanics, Institute of Mechanics, Chinese Academy of Sciences, Beijing 100190, China
*
Author to whom correspondence should be addressed.
Molecules 2023, 28(20), 7181; https://doi.org/10.3390/molecules28207181
Submission received: 15 September 2023 / Revised: 10 October 2023 / Accepted: 18 October 2023 / Published: 19 October 2023
(This article belongs to the Section Computational and Theoretical Chemistry)

Abstract

:
Exploring the properties of magnetic metal on the semiconductor surface is of great significance for the application of magnetic recording materials. Herein, DFT calculations are carried out to explore the properties of the iron–silicon interface structures (nFe/DASF) formed by depositing n Fe atoms on the reconstructed Si(111)-(7×7) surface (DASF). The stable nFe/DASF structures are studied in the cases of the adsorption and permeation of Fe atoms on the DASF. In both cases, Fe atoms are not very dispersed and prefer binding with Si atoms rather than the adsorbed Fe atoms, because the Fe-Si interaction is stronger than the Fe-Fe interaction. As the n value increases, the average binding energy (Eb_ave) of Fe generally firstly becomes more negative and then becomes less negative, with the presence of a 7Fe wheel as a stable geometry on the upmost surface. The presence of the 7Fe wheel is attributed to the enhanced Fe-Si interaction in this wheel compared to other geometries. CO adsorption occurs at the central Fe site of the 7Fe wheel which is greatly influenced by the surrounding Si atoms but is little influenced by the additional Fe atoms in the interlayer.

1. Introduction

Metal–semiconductor interfaces, formed by the deposition of metallic atoms or nanoparticles on the semiconductor surface, have attracted much attention due to their practical importance in modern integrated circuit devices. Silicon is an important base material for metal–semiconductor interfaces [1,2] and is widely used in the fabrication of microelectronics, benefiting from the great improvement in the mechanical properties of silicon material at the surface contact scale from the implantation of silicon with different ions [3,4,5,6]. Based on well-developed Si-based technology, magnetic materials prepared by depositing magnetic metal on silicon [7,8] are also finding practical applications in the field of magnetic recording. The properties of magnetic recording materials depend on achieving controllable growth of individual magnetic domain clusters on the silicon [9,10,11,12]. Therefore, it is of significance to study the properties of the metal–semiconductor interfaces in the initial growth of magnetic clusters, but studies on this are lacking.
Iron is the most common 3d ferromagnetic metal and exhibits high spin polarization. Many studies have focused on the interface structure formed during the process of Fe deposition on the silicon substrate and have demonstrated that the mechanical properties of silicon-based iron magnetic materials can be improved by controlling the nature of the Fe/Si(111) interface structure [13,14,15]. In order to control the quality of the iron–silicon interface, it is necessary to properly control the initial process of Fe deposition. Miranda et al. [16] studied the initial stages of Fe growth on Si(111)-(7×7) and concluded that an amorphous layer with composition and density of states close to those of FeSi was formed, in agreement with reports of FeSi formation [17]. Eguchi et al. [18] performed an atomic-scale investigation of the initial stage of growth and interface formation of Fe on a H-terminated Si(111)-(1×1) surface and found the presence of a (111)-oriented body-centered-cubic (bcc) Fe cluster structure on the substrate surface. It should be noted that growth of the pure Fe or the amorphous layer required a sufficient thickness deposited, making it difficult to obtain a clear structure of the Fe/Si(111) interface at the initial stage of Fe growth. Thibaudau et al. [19] investigated the interaction of iron pentacarbonyl (Fe(CO)5) and ferrocene (Fe(C5H5)2) with Si(111)-(7×7), and found that exposure to Fe(CO)5 leads to the growth of much higher quality iron silicide by controlling the dissociative adsorption of Fe(CO)5 in which the CO easily desorbs leaving only the iron atom on the surface after a complete dissociation of the molecule, compared to the case of exposure to Fe(C5H5)2 where silicide carbide is formed. There are also many reports on the interaction between the gaseous molecule and Si(111)-(7×7) without a metal element [20,21,22]. Here, we have some questions as follows: (a) Are the deposited Fe atoms atomically dispersed or clustered on the silicon substrate? (b) What is the most stable structure of nFe/Si(111)-(7×7) (where n is the number of Fe atoms on Si(111)-(7×7)) at the initial stages of Fe deposition on Si(111)-(7×7)? (c) How do the electronic properties of nFe/Si(111)-(7×7) change as the number of deposited Fe atoms increases? (d) What are the reactivities of the Fe atoms on nFe/Si(111)-(7×7)? Such knowledge is a basis for a deeper understanding of the properties of the iron–silicon interface, but remains unclear.
To answer these open questions, in this work we theoretically investigated the Fe-coverage-dependent properties of an iron–silicon interface structure in the early stages of Fe growth on Si(111)-(7×7). The well-reconstructed Si(111)-(7×7) substrate is a dimer-adatom-stacking-fault (DASF) model. The structures of nFe/DASF are constructed by depositing Fe atoms one by one onto the DASF substrate, to clarify whether the deposited Fe atoms are atomically dispersed or clustered on the silicon. The permeation of the Fe atom from the top surface to the second and third layers is explored, and, accordingly, we placed each Fe atom on the different layers to find the most stable structures of nFe/DASF at different n values. We then obtained the electronic properties and reactivities of the nFe/DASF models and explored the dependence of these properties on the Fe content. The theoretical knowledge provides us with a good understanding of the iron–silicon interface.

2. Results and Discussion

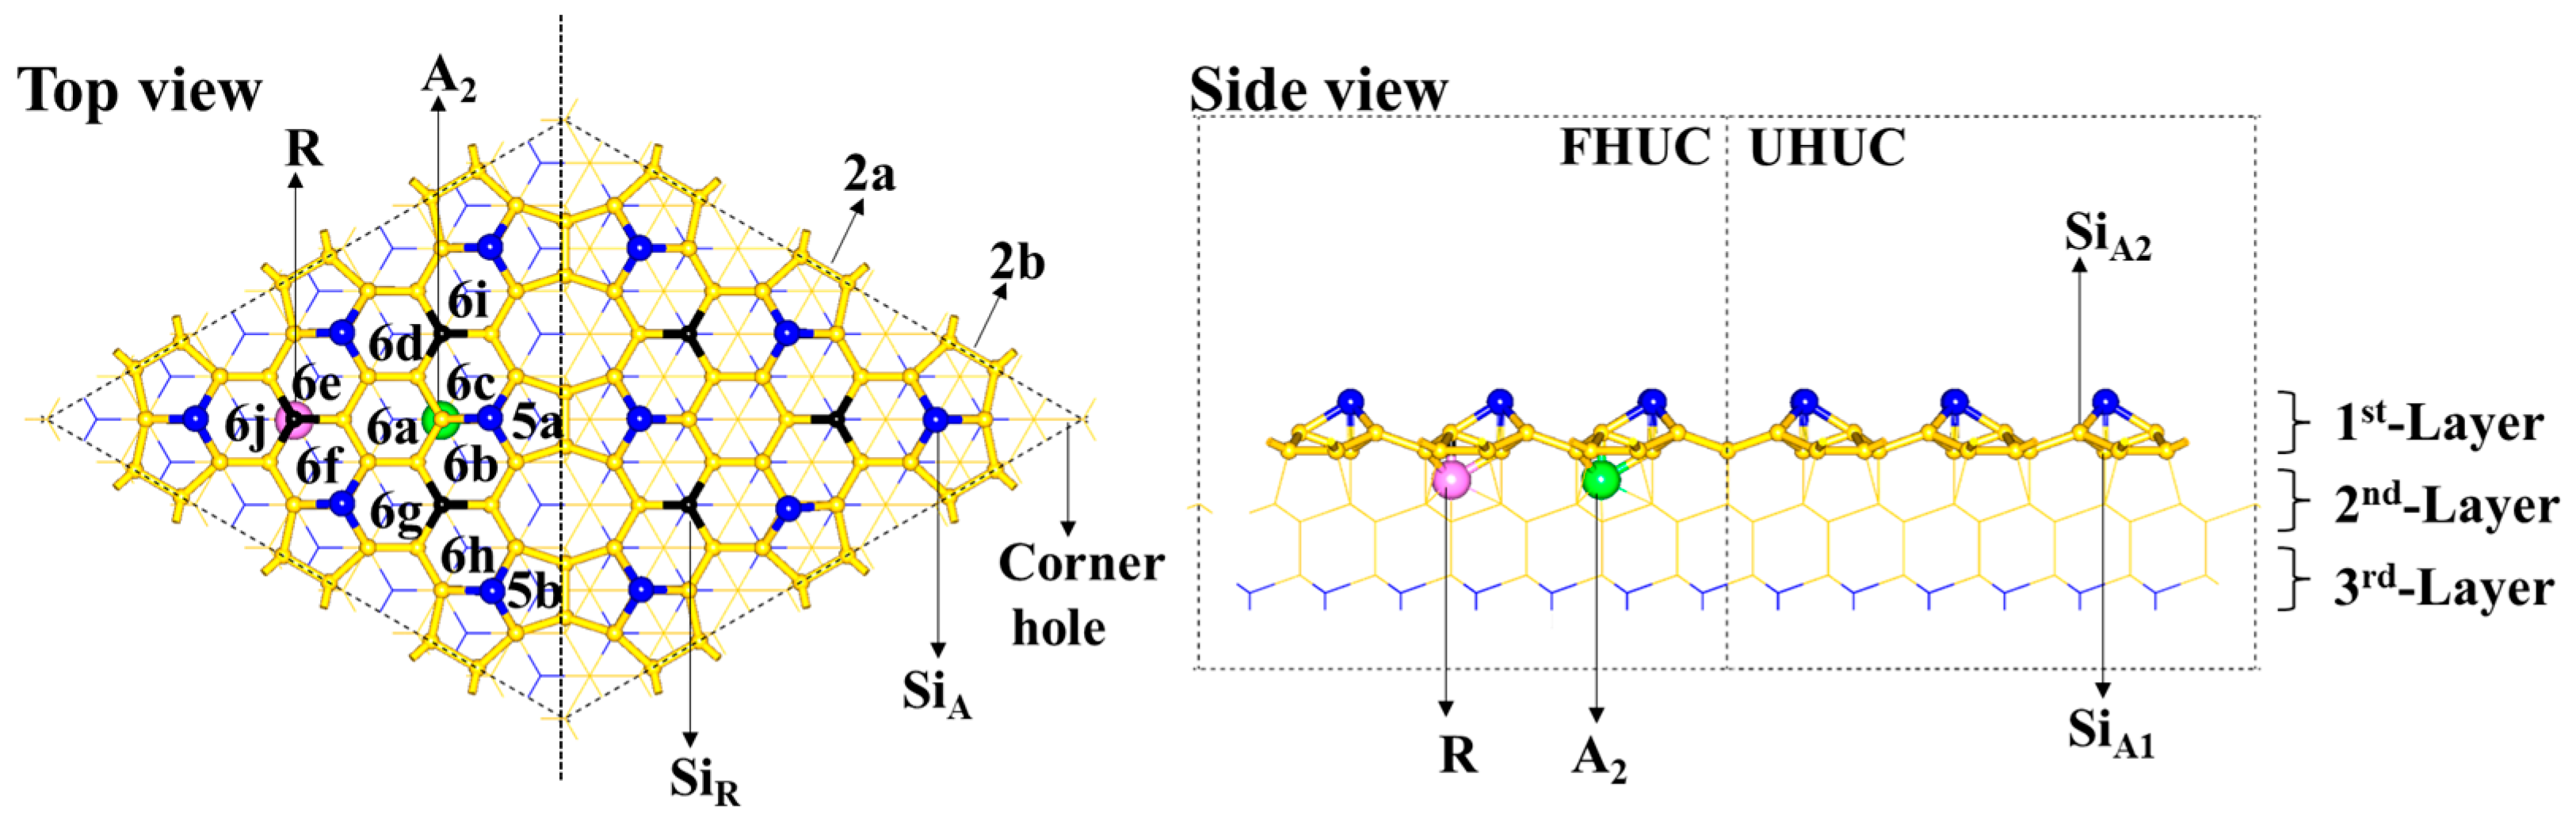
2.1. The DASF Surface Structure

The DASF model consists of a faulted half-unit cell (FHUC) and an unfaulted half-unit cell (UHUC), as is shown in Scheme 1. Within each unit cell, there are three rest atoms (represented by SiR) and six adatoms (represented by SiA). The SiR atoms are 0.81 Å lower than the SiA atoms. The SiR and SiA atoms differ in their coordination environment. The coordination number of the SiR atom is three and the average Si–Si bond length is 2.41 Å. The coordination number of the SiA atom is four (coordinated with one SiA1 atom and three SiA2 atoms) and the average Si–Si bond length is 2.48 Å. Both the SiA1 and SiA2 atoms are four-coordinated but differ in the coordination environment, which is close to a tetrahedron for SiA1 but greatly distorted from a tetrahedron for SiA2. The SiA adatom is nonequivalent sp3 hybridized and strongly polarized. On the DASF surface, there are two kinds of five-membered rings (represented by 5a and 5b, respectively) and three kinds of six-membered Si rings (represented by 6a for the first kind, 6b~6g for the second kind, and 6h~6j for the third kind, respectively), according to symmetry. The main structural difference between the two cells is that the third layer Si atoms (blue lines) are located just below the center of these six-membered Si rings in the FHUC, whereas the second layer Si atoms (yellow lines) are located just below the center of these six-membered Si rings in the UHUC. In addition, there is a hole in the corner of the cell. Along the contacted edge of the two half-unit cells are dimers consisting of two Si atoms on the surface, which are represented by 2a and 2b with lengths of 2.43 Å and 2.46 Å, respectively.

2.2. The Adsorption of Fe Atoms on the Upmost Surface

For a single Fe atom in the FHUC region, the binding energy (Eb) is −4.05 eV at the 6a site, −4.23 eV at the 6b site, and −3.99 eV at the 5a, 5b, and 6h sites. It indicates that the Fe atom is adsorbed at the 6b site, as shown by the S1 model in Scheme 2. In the S1 model, the distance between the Fe and SiA atoms is 0.12 Å shorter than that between the Fe and SiR atoms (2.28 Å vs. 2.40 Å). Similarly, in the UHUC region, the Fe atom is more stable at the 6b site than at any other site; the distance between the Fe and SiA atoms is closer to that between the Fe and SiR atoms (2.33 Å and 2.30 Å, respectively). However, the Eb value for the Fe atom at the 6b site in the FHUC region is more negative by 0.25 eV than that in the UHUC region (−4.23 eV vs. −3.98 eV). The result shows that the Fe atom prefers the 6b site in the FHUC region rather than that in the UHUC region, consistent with the experimental result by Thibaudau et al. [19] that the dissociated Fe(CO)5 leaves the Fe atom in the FHUC region where the SiR atoms are the intrinsic sites for dissociative adsorption of Fe(CO)5. Next, we focused on the adsorption of more Fe atoms in the FHUC region.
By keeping the first Fe atom at the 6b site and moving the second Fe atom from one site to another, we studied the adsorption of the second Fe atom and accessed the system stability according to the Eb_ave value. The Eb_ave value is −4.25 eV at the 6a site, −4.41 eV at the 6c site, −4.20 eV at the 6d site, −4.08 eV at the 6e site, −4.08 eV at the 6f site, −4.22 eV at the 6g site, −4.24 eV at the 6h site, −4.18 eV at the 6i site, −4.07 eV at the 6j site, and −4.40 eV at the 5a site for the second Fe atom. We also explored the adsorption positions around or above the first Fe atom to check the possibility of the Fe–Fe bond formation and found that the Eb_ave values range from −3.75 eV to −4.03 eV. The result indicates that the second Fe atom prefers the 6c site (Scheme 2 S2); the Fe-Si interaction is stronger than the Fe-Fe interaction because there is no Fe–Fe bond formed. Because the difference in the Eb_ave values between the cases with and without the Fe–Fe bond formation is large, we will not discuss the case of Fe adsorption with the Fe–Fe bond formation when the number of Fe atoms is not very large.
Similarly, the geometry for the coadsorption of three Fe atoms is optimized by keeping two Fe atoms at the 6b and 6c sites, and testing the adsorption of the third Fe atom at each six-membered Si ring. In this case, the coadsorption of three Fe atoms is the most stable with the Eb_ave value of −4.59 eV, where they form a minimum triangular pattern by being distributed, respectively, at the 6b, 6c, and 6a sites, as shown by the S3 model in Scheme 2. In the S3 model, the distance between the Fe atoms at the 6b and 6c sites is 3.694 Å, and that between the Fe atoms at the 6a and 6b (or 6c) sites is greater at 4.022 Å. Also, we expanded the Fe positions to those five-membered Si rings. It may be possible to find a stable coadsorption of the three Fe atoms by placing two of them, respectively, at the 6b and 5a sites, since the Eb_ave for only two Fe atoms adsorbed at the 6b and 5a sites is just 0.01 eV higher than the most stable adsorption at the 6b and 6c sites. In this case, however, we found that the Eb_ave value for three Fe atoms, respectively, at the 6b, 5a, and 6c sites becomes less negative by 0.02 eV than that for three Fe atoms, respectively, at the 6b, 6c, and 6a sites. Thus, three Fe atoms adsorbed, respectively, at the 6b, 6c, and 6a sites lead to the S3 model as the most stable geometry.
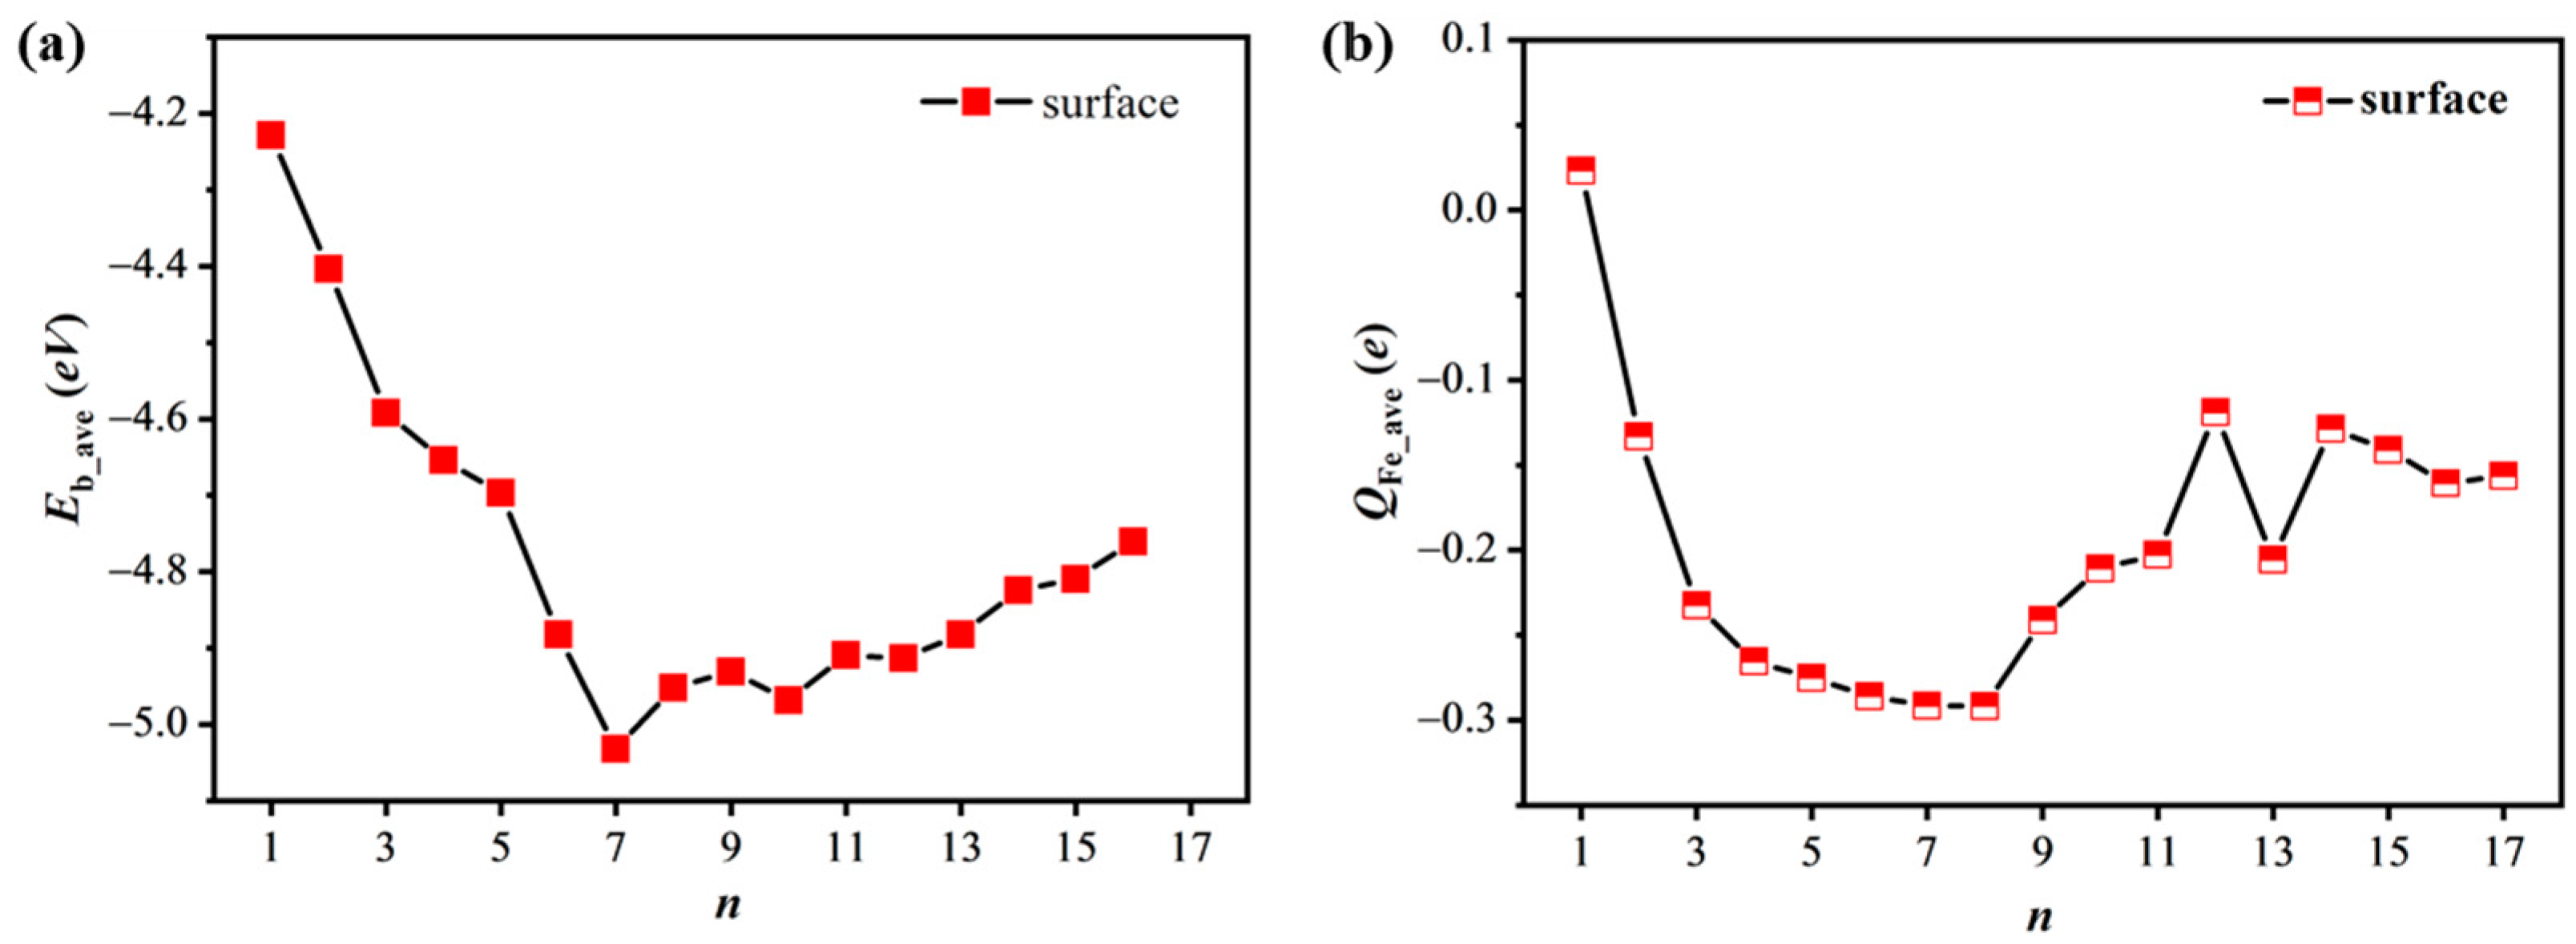
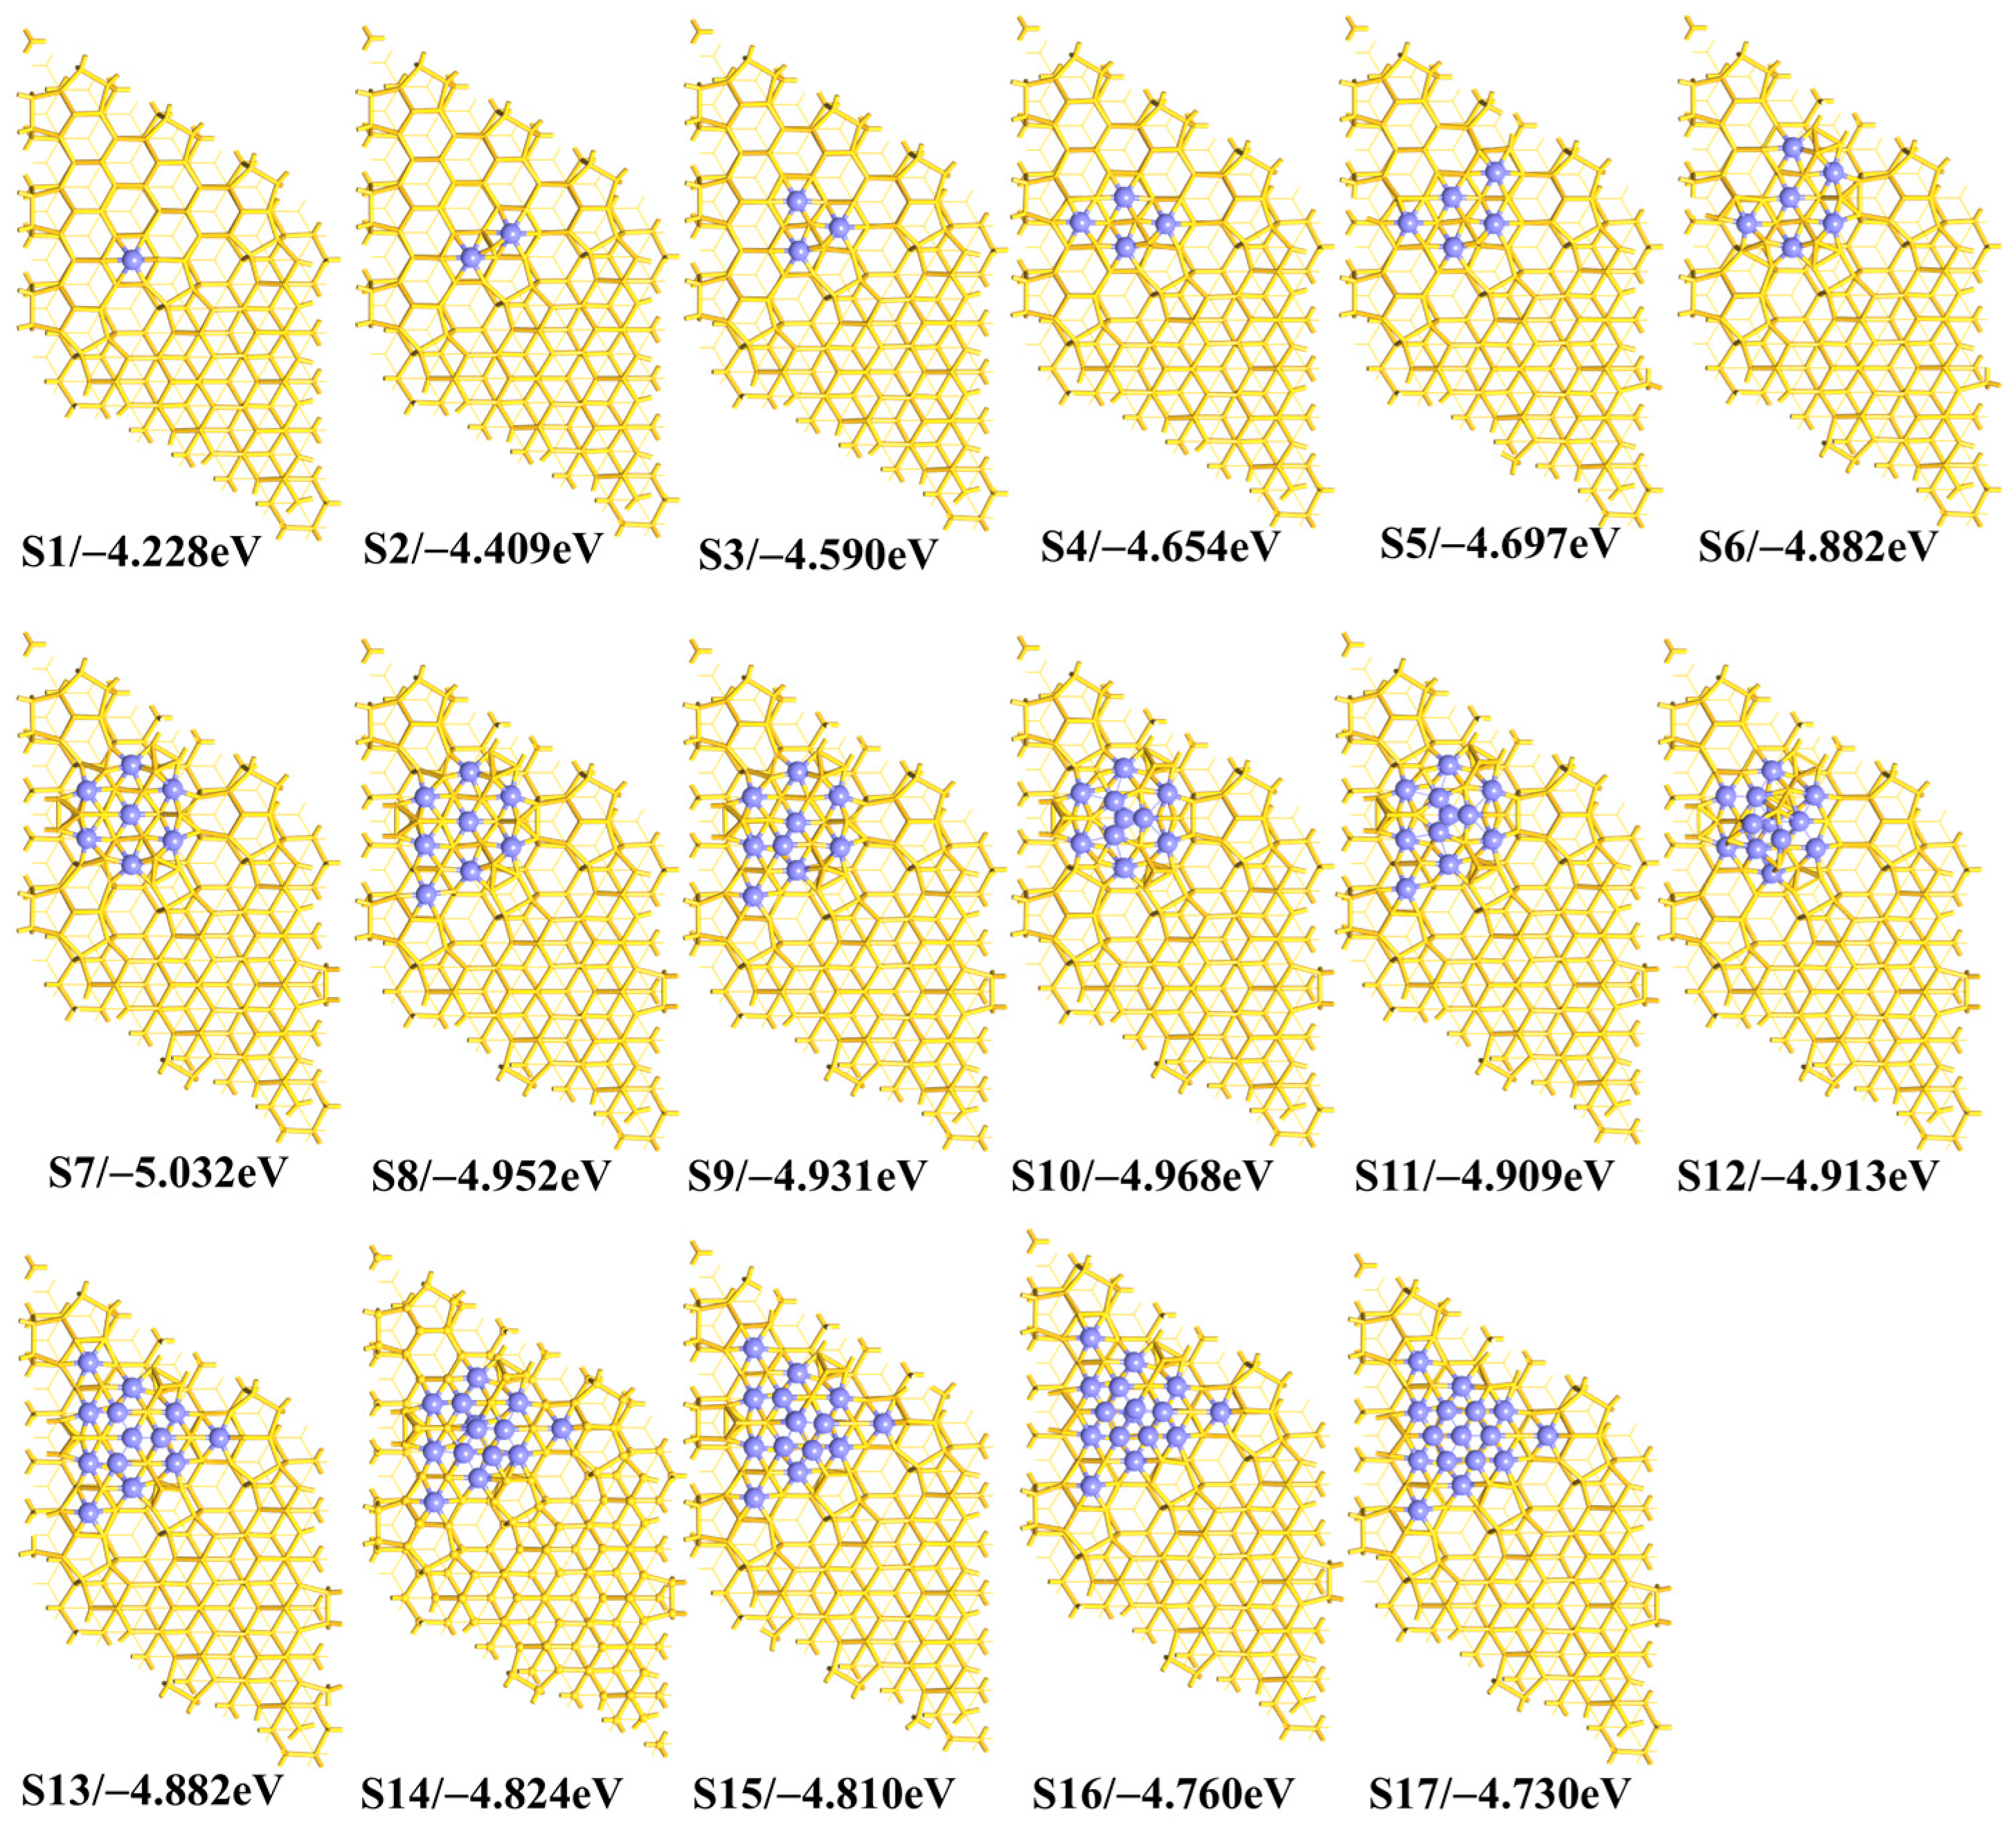
As the number n is further increased, the Eb_ave value becomes more negative until it reaches the minimum value of −5.032 eV when there are seven Fe atoms on the surface (Scheme 2 S7), as shown in Figure 1a and Table S1 of the Supplementary Materials. The fourth and fifth Fe atoms are adsorbed at the 6d and 6g sites, respectively. The sixth and seventh Fe atoms are adsorbed at the 6e and 6s sites, respectively. We concluded that the Fe atoms prefer to stay at the six-membered ring sites close to each other on the surface. In this way, the seven Fe atoms form a wheel-like 7Fe geometry, with one Fe atom at the center and the other six atoms around the center. The presence of the wheel-like 7Fe geometry is related to the location of the first free Fe atoms, according to the energetically preferred path of these Fe atoms. Since the triangular pattern makes the system stable, as demonstrated theoretically by the case of coadsorption of three Fe atoms in the early part of this work, more triangular structures are generated by these seven Fe atoms through forming the wheel-like 7Fe geometry.
Compared to the n = 7 case, the Eb_ave value becomes less negative as the number n increases. The eighth Fe atom is just beside the wheel (Scheme 2 S8) but the ninth Fe atom is above the wheel (Scheme 2 S9). When there are ten Fe atoms on the surface, the last three Fe atoms are all above the wheel (Scheme 2 S10). As the number n increases from 8 to 13, the Eb_ave value presents a slight oscillation. In the n = 13 case, all the six-membered ring sites are covered by Fe atoms, as is shown by Scheme 2 S13. As the number n increases from 13 to 17, the Eb_ave value becomes less negative, because of the formation of fewer Fe–Si bonds but more Fe–Fe bonds. A general trend of the Eb_ave ~ n variation thus is clear, that the Eb_ave value first increases and then decreases, and reaches the minimum value at n = 7, from which we conclude that the S7 model is more stable than the others in the case of Fe adsorption only on the surface.
Here, we wish to discuss the reason(s) for the trend of the Eb_ave ~ n variation. In the case of a single Fe atom (Scheme 2 S1), the Fe atom is positively charged by 0.023 e, which is consistent with common sense in that the Fe atom has slightly lower electronegativity than the silicon atom. In the cases of n > 1, however, these nFe atoms are negatively charged in the most stable geometries, because there are some Si atoms shared by these Fe atoms which limits the charge transfer from Fe to Si but facilitates the reversed charge transfer. The result is in agreement with the experimental result [17] that the electronic binding energy of the Fe becomes smaller after the deposition of Fe on DASF. As shown in Figure 1b, the average Bader charge (QFe_ave) of Fe atoms becomes more negative from the cases n = 1 (Scheme 2 S1) to n = 7 (Scheme 2 S7) and then less negative as the number n increases to 12. This trend of the QFe_ave ~ n variation is very similar to that of the Eb_ave ~ n variation. The charge transfer is strongest at n = 7. In the S7 case, the Bader charge of the central Fe atom is −0.387 e, which is much more negative than the QFe_ave value of −0.276 e for the other six Fe atoms, because the central Fe atom is surrounded by fewer second-order neighboring Si atoms. However, the further increased Fe atoms interact weakly with the model. Note that the QFe_ave value in the case of n = 12 (Scheme 2 S12) is less negative than in the cases of n = 11 and n = 13 (Scheme 2 S11 and S13), because there are more Fe–Fe bonds presented at n = 12. These results suggest that what makes the wheel-like 7Fe geometry relatively stable is structurally due to the greater number of triangular structures formed by the Fe atoms than in the cases of n < 7 and electronically due to the stronger charge transfer from Si to Fe atoms than the cases of n > 7.

2.3. The Determining Factor(s) for Stabilizing the Wheel-like 7Fe Geometry

As is discussed above, the wheel-like 7Fe geometry has more triangular structures than other geometries generated by these seven Fe atoms. Next, it is important to study the stability of the minimum triangular structure at n = 3 (Scheme 2 S3) to understand the determining factor(s) for stabilizing the wheel-like 7Fe geometry.
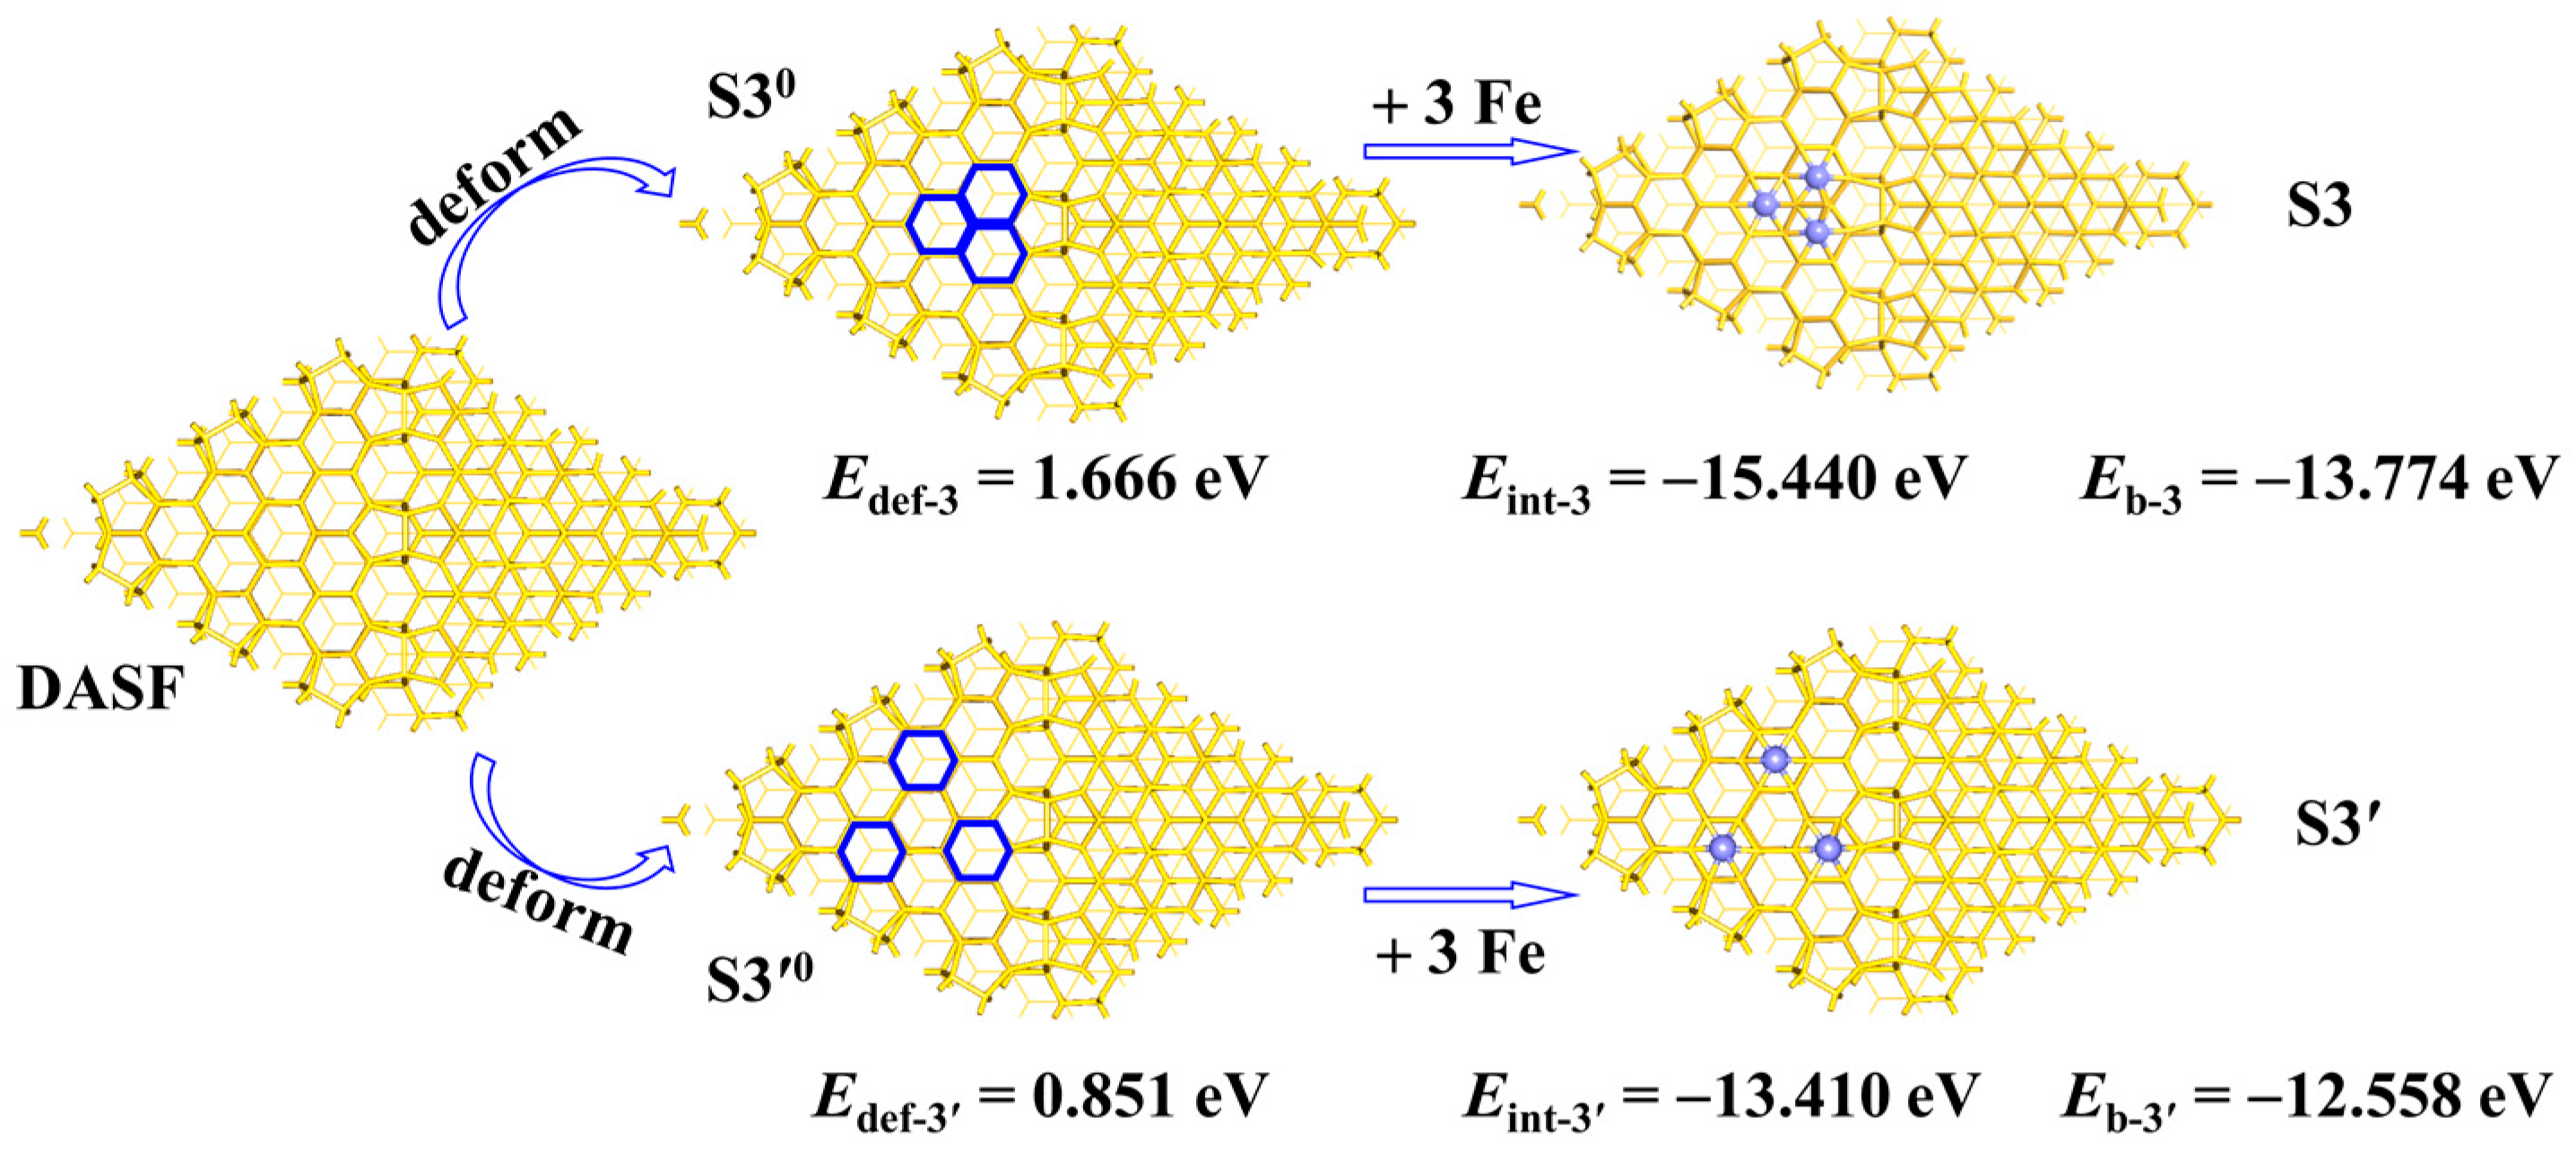
In Scheme 3, we assumed a procedure to generate the S3 structure and compared it with the formation process of the larger triangular structure S3′. The S3 structure is 1.216 eV more stable than the S3′ structure, as indicated by the difference between the Eb-3 and Eb-3′ values. Similar methods are often used to investigate the interaction between two moieties in a system [23,24]. In the procedure to generate the S3 structure, the DASF surface is first distorted to the structure S30 taken to be same as that in S3; the destabilization energy Edef-3 in this step is defined by the equation Edef-3 = ES30EDASF, where the subscript ‘‘def’’ means that the DASF geometry is deformed like that in the S30 model; ES30 is the total energy of the structure S30; and EDASF is the total energy of the DASF substrate. Lastly, three Fe atoms are added to the S30 structure, affording the S3 structure; in this step, the stabilization energy Eint-3 is defined by the equation Eint-3 = ES3 − (ES30 + 3 EFe), where EFe is the total energy of the Fe atom. Obviously, the sum of Edef-3 and Eint-3 is equal to the value of the Eb-3 value. Similarly, for the procedure to generate the S3 structure, the DASF surface is first distorted to the structure S3′0 taken to be same as that in S3′. The destabilization energy Edef-3 in this step is defined by the equation Edef-3 = ES30EDASF, where the subscript ‘‘def’’ means that the DASF geometry is deformed like that in the S3′0 model; ES30 is the total energy of the structure S3′0. Finally, three Fe atoms are added to the S3′0 structure, with the formation of the S3′ structure; in this step, the stabilization energy Eint-3 is defined by the equation Eint-3′ = ES3 − (ES30 + 3 EFe). The sum of Edef-3 and Eint-3 is equal to the value of the Eb-3 value.
The result shows that the Eint-3 value in the S3 case is considerably more negative by 2.030 eV than the Eint-3′ value in the S3′ case (−15.440 eV vs. −13.410 eV), meaning that the Fe-Si interaction is stronger in the S3 geometry than in the S3′ geometry. The QFe_ave value of the 3Fe atoms is −0.232 e in the S3 geometry but 0.024 e in the S3′ geometry, indicating that the charge transfer between the Fe and Si atoms is stronger in the S3 geometry than in the S3′ geometry, supporting the change in the Eint values. The Edef-3 value is much more positive by 0.81 eV than the Edef-3′ value (1.661 eV eV vs. 0.851 eV). This is reasonable because the large deformation is usually caused by the strong interaction. From the S3 case to the S3′ case, the decreased Edef value (0.81 eV) from the S30 geometry to the S3′0 geometry is much smaller than the increased Eint value (2.03 eV), showing that the Eint term plays a more important role in stabilizing the S3 geometry than does the S3′ geometry. It is indirectly proved that the system would become stable when the Fe atoms are clustered but without the presence of Fe–Fe bonds when the number of Fe atoms is not too large.
Therefore, the presence of a 7Fe wheel in the adsorption of Fe atoms is attributed to the enhanced Fe-Si interaction compared to the other geometries with the Fe atoms more dispersed.

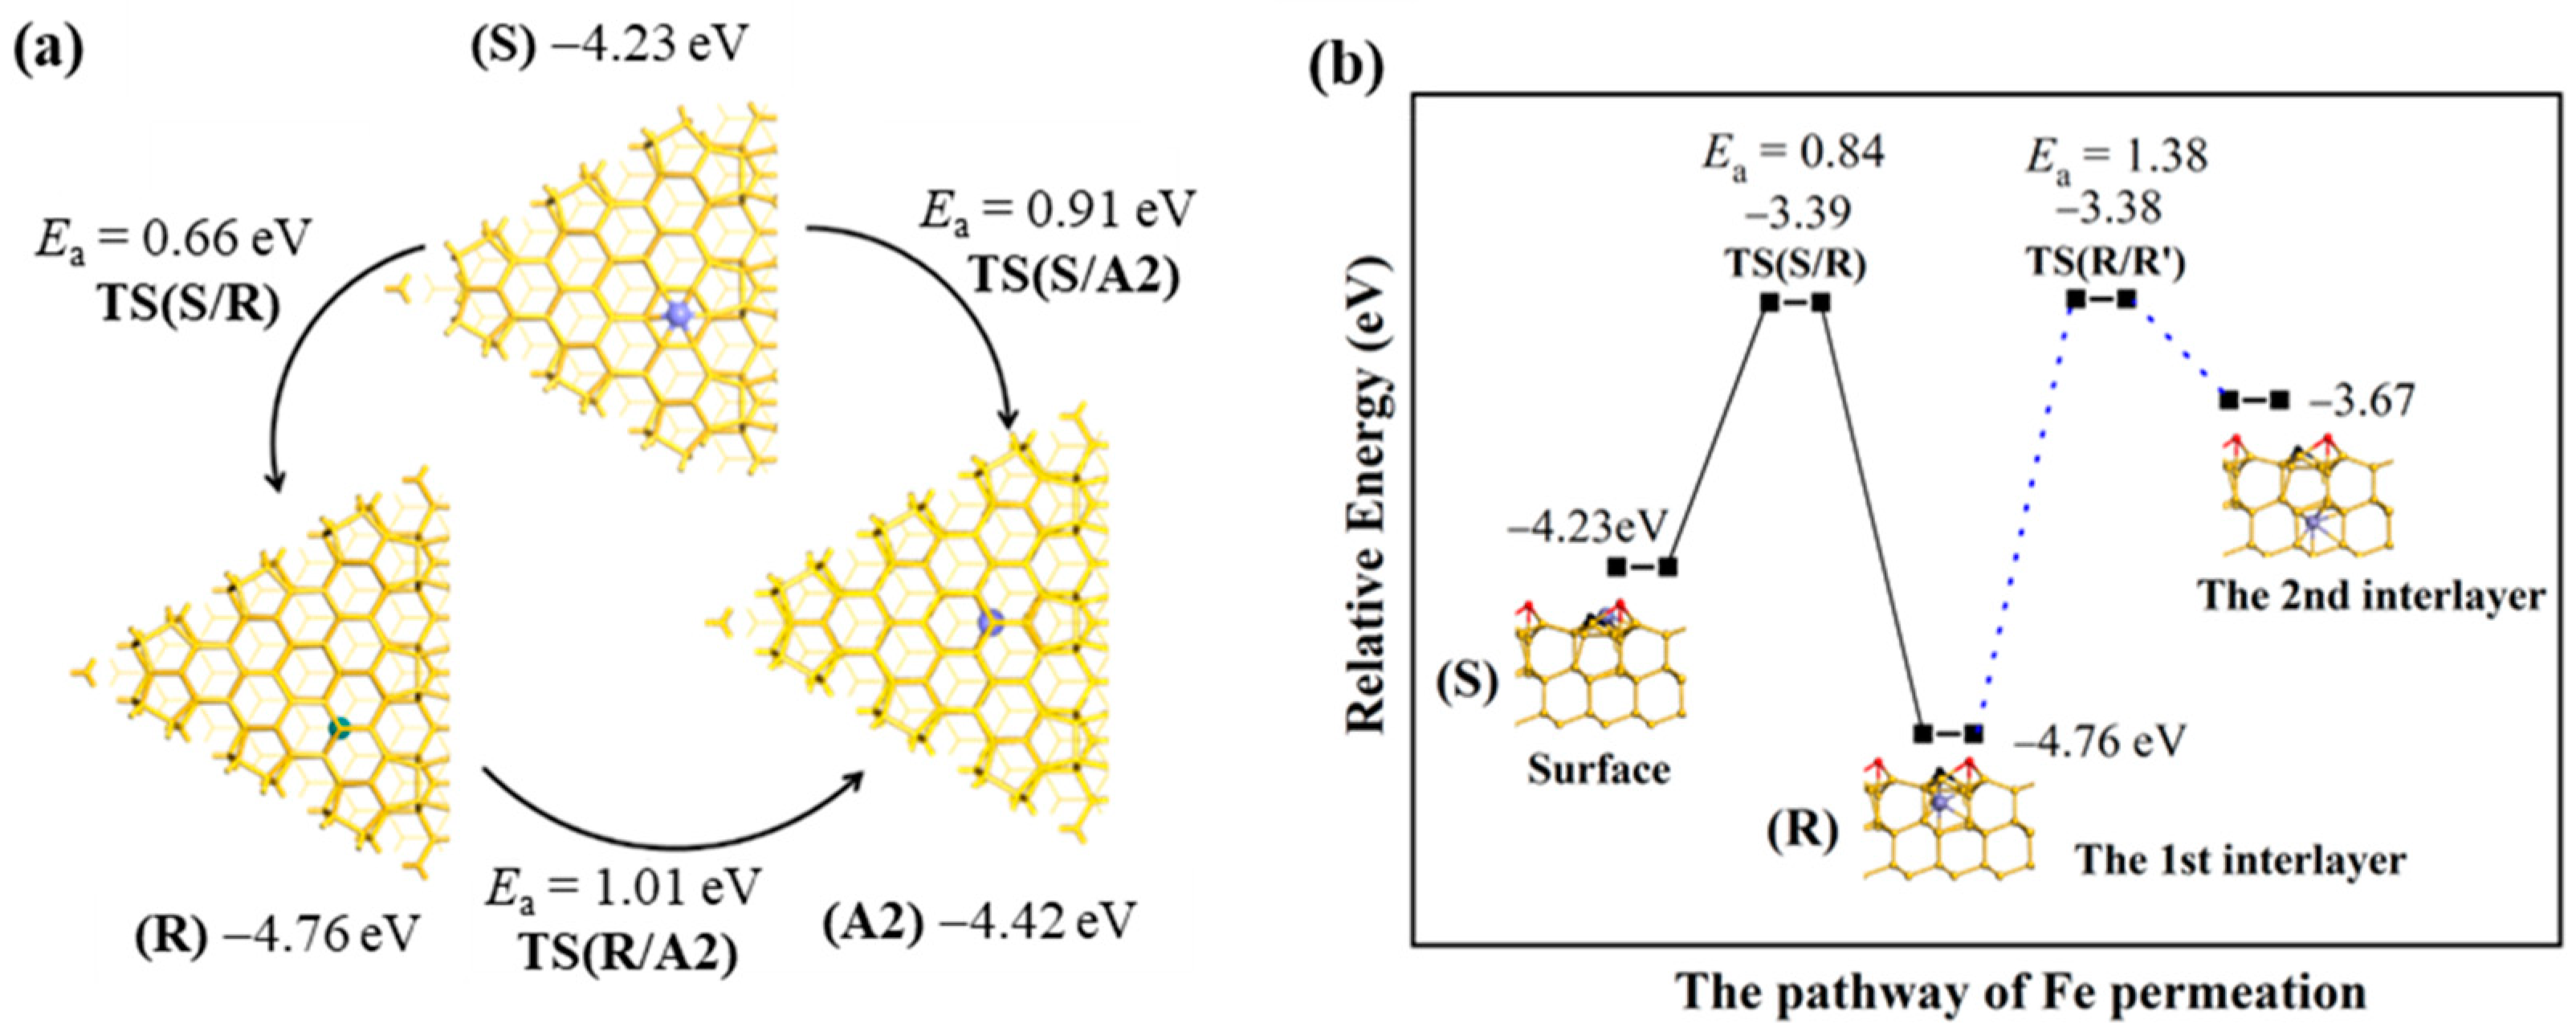
2.4. The Permeation of Fe Atoms into the Interlayer

The thermodynamic stability of Fe located in the interlayer is first compared. Below the SiR and SiA2 atoms are large enough spaces for Fe exitance, but with the binding energy of −4.76 eV and −4.42 eV, respectively. The difference between these two values is mainly resulting from the difference in the coordination environment that the SiR atom is three-coordinated while the SiA2 atom is four-coordinated. Thus, the Fe atom is energetically more stable just below the SiR atom than below the SiA2 atom. Then, the kinetic stability of Fe located in the interlayer is considered, as is shown in Figure 2a. The activation barrier (Ea) of the SR step is 0.66 eV for the Fe atom on the surface permeating to position R just below the SiR atom through the transition state TS(S/R), which is smaller than the 0.91 eV of the SA2 step for the Fe atom on the surface permeating to position A2 just below the SiA2 atom through TS(S/A2), indicating that the surface Fe atom shifts to position R more easily than to position A2. The Ea value of the RA2 step is 1.01 eV for the Fe atom just below the SiR atom moving to position A2 through TS(R/A2); this step is endothermic by 0.32 eV. Since the total energy of TS(R/A2) is 0.43 eV lower than that of TS(S/A2), the surface Fe kinetically prefers to move first to position R and then to position A2 (SRA2) rather than directly to position A2 (RA2). Thermodynamically, the Fe atom at position R is more stable than at position A2. As is shown in Figure 2b, further permeation into the deep layer is difficult due to the large Ea value of 1.38 eV and endothermicity of 1.09 eV, so the thickness for Fe deposition is about 0.6 nm. These results suggested that the Fe atom at position R is thermodynamically and kinetically stable. Next, we expanded the discussion to the location of Fe atoms permeating freely into the first interlayer.
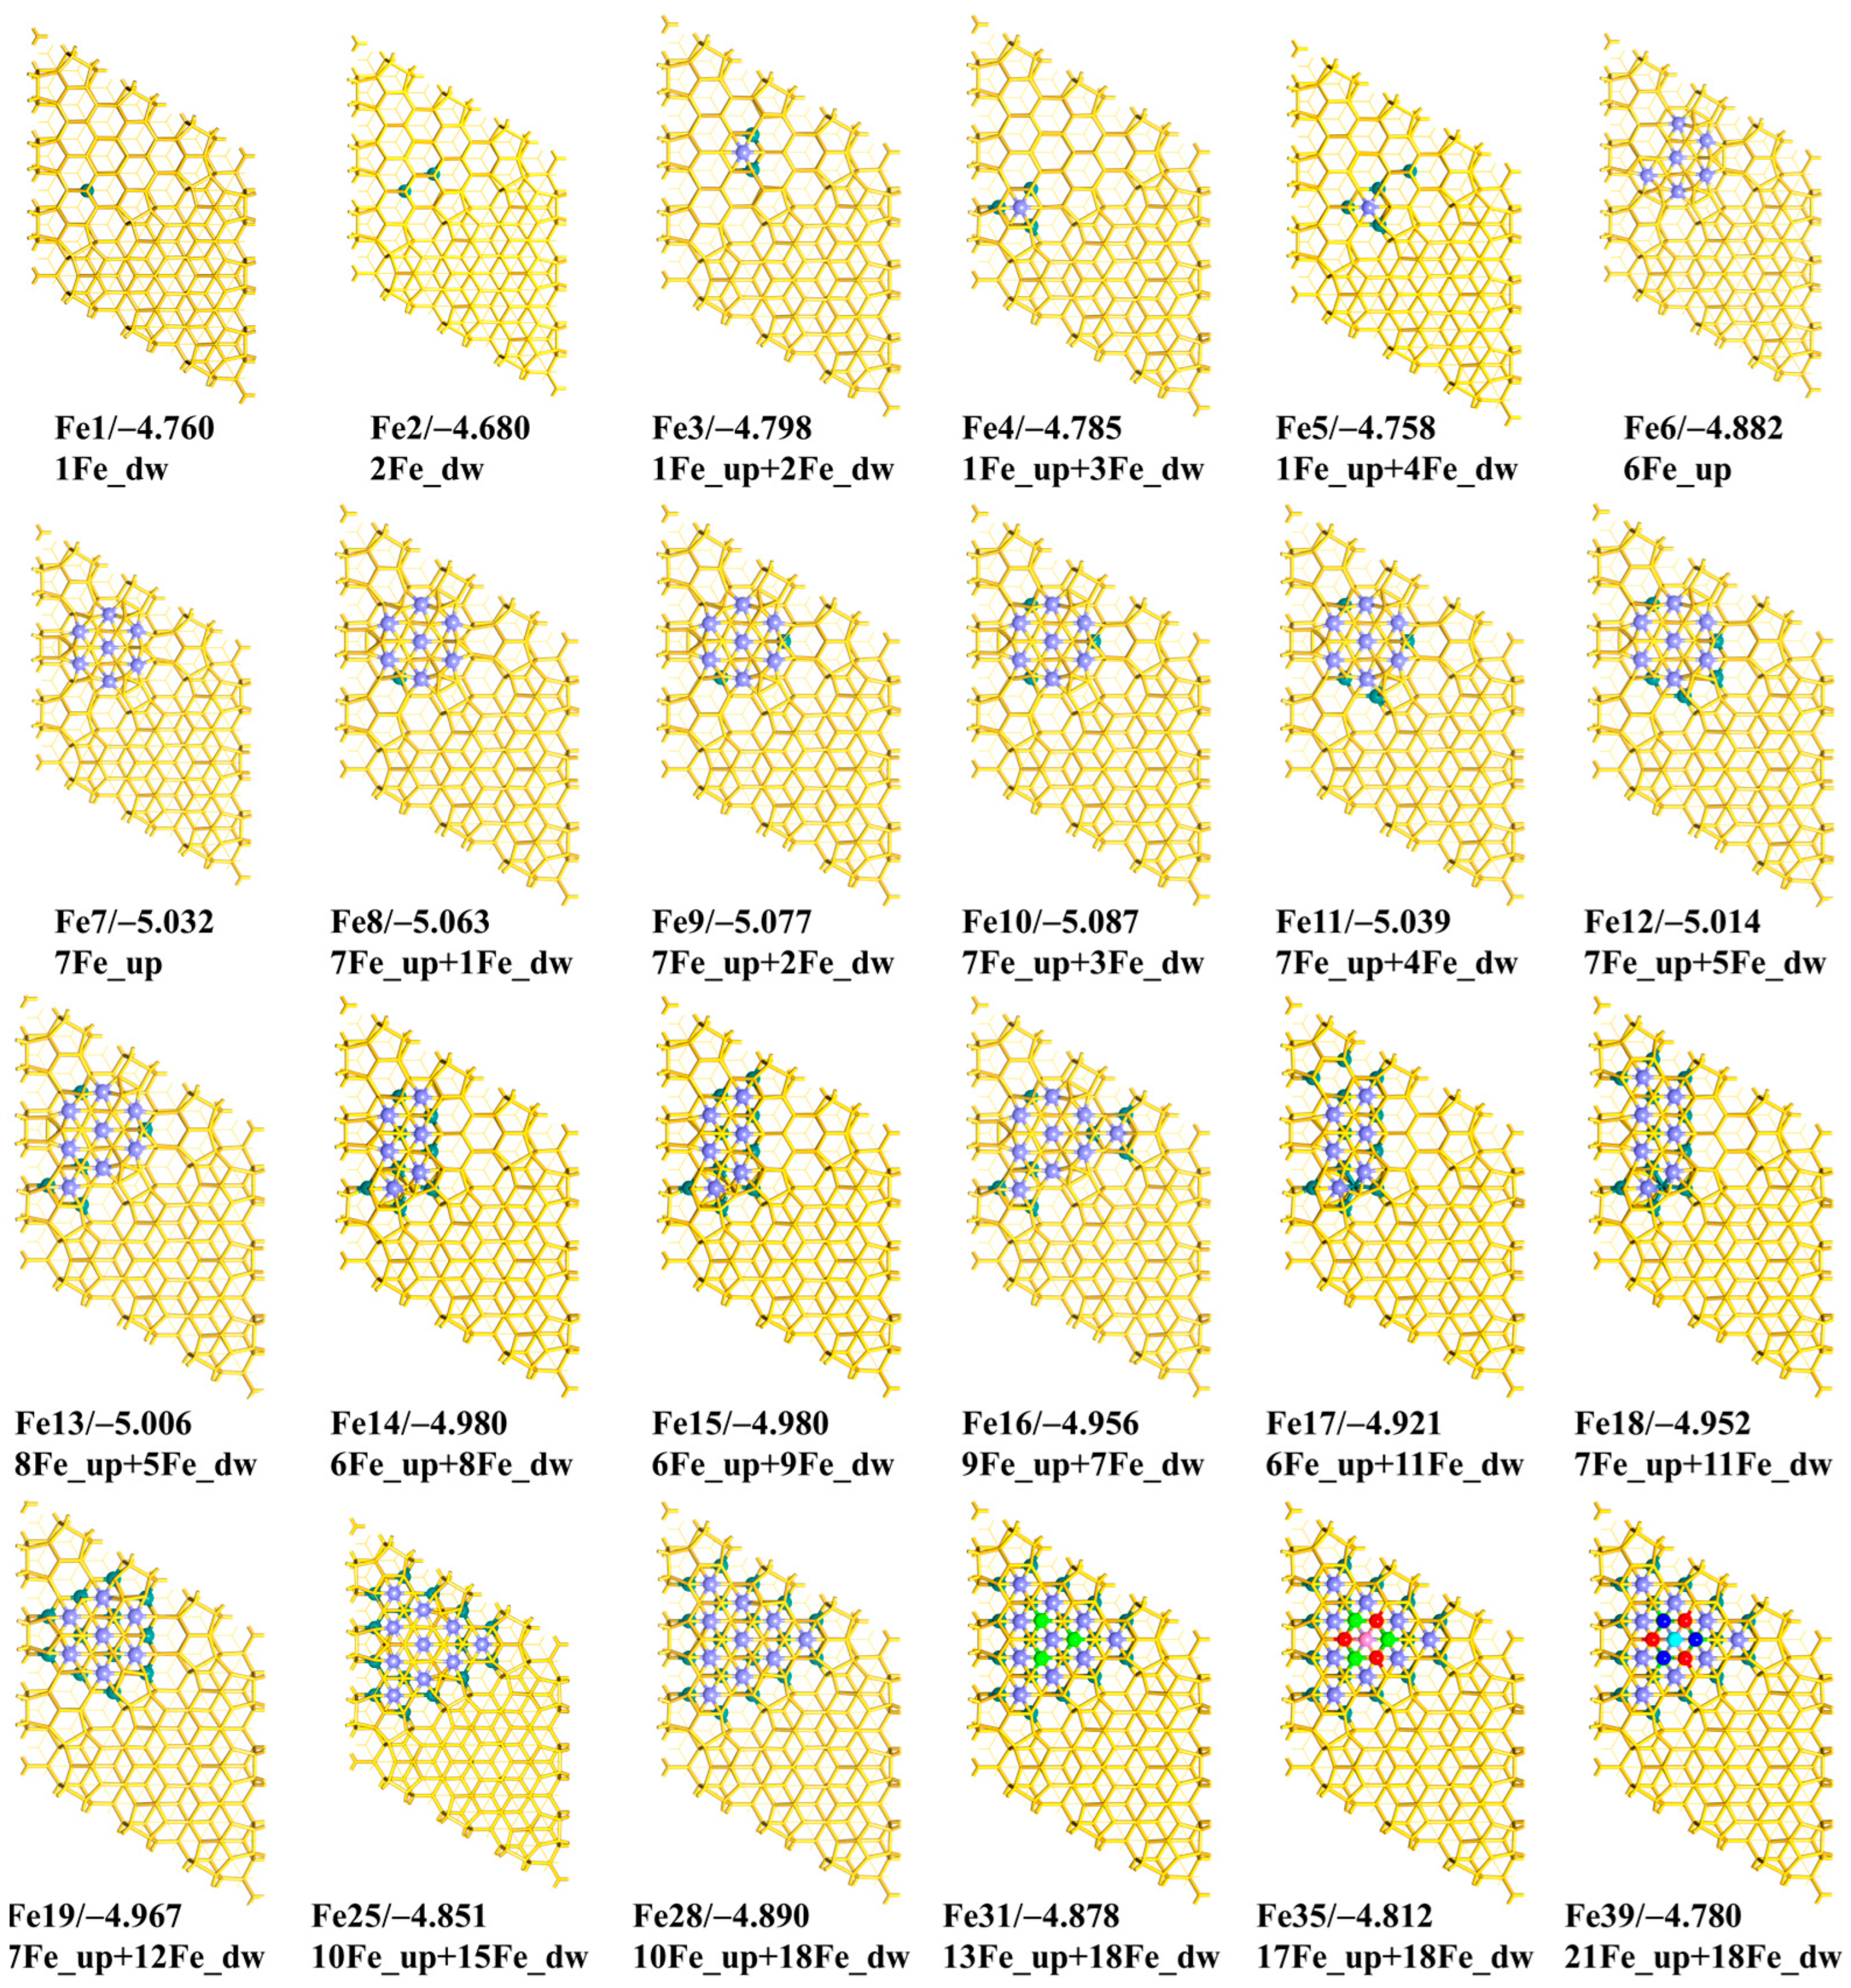
As is shown in Scheme 4, the most stable structures of nFe deposition are found with x Fe atoms deposited to the upmost surface (represented by xFe_up) and y Fe atoms permeating into the first interlayer (represented by yFe_dw) (n = x + y). When n = 2, the most stable geometry has one Fe atom at position R and the other Fe atom at position A2 (Scheme 4 Fe1 and Fe2). Because a single Fe atom is the most stable at one of the R positions, we thus checked the other R positions for the second Fe atom when the first Fe atom does not move but found that the Eb_ave value in this case will decrease slightly (by 0.01 eV). When n = 3, 4, and 5 (Scheme 4 Fe3, Fe4, and Fe5, respectively), there is only one Fe atom adsorbed on the six-membered ring. When n = 6 and 7 (Scheme 4 Fe6 and Fe7), all the Fe atoms are adsorbed on the surface. In particular, the most stable geometry at n = 7 (Scheme 4 Fe7) is the same as the wheel 7Fe geometry above (Scheme 2 S7), even when the Fe atoms are considered to penetrate freely from the surface into the interlayer. In the cases from n = 7 to 
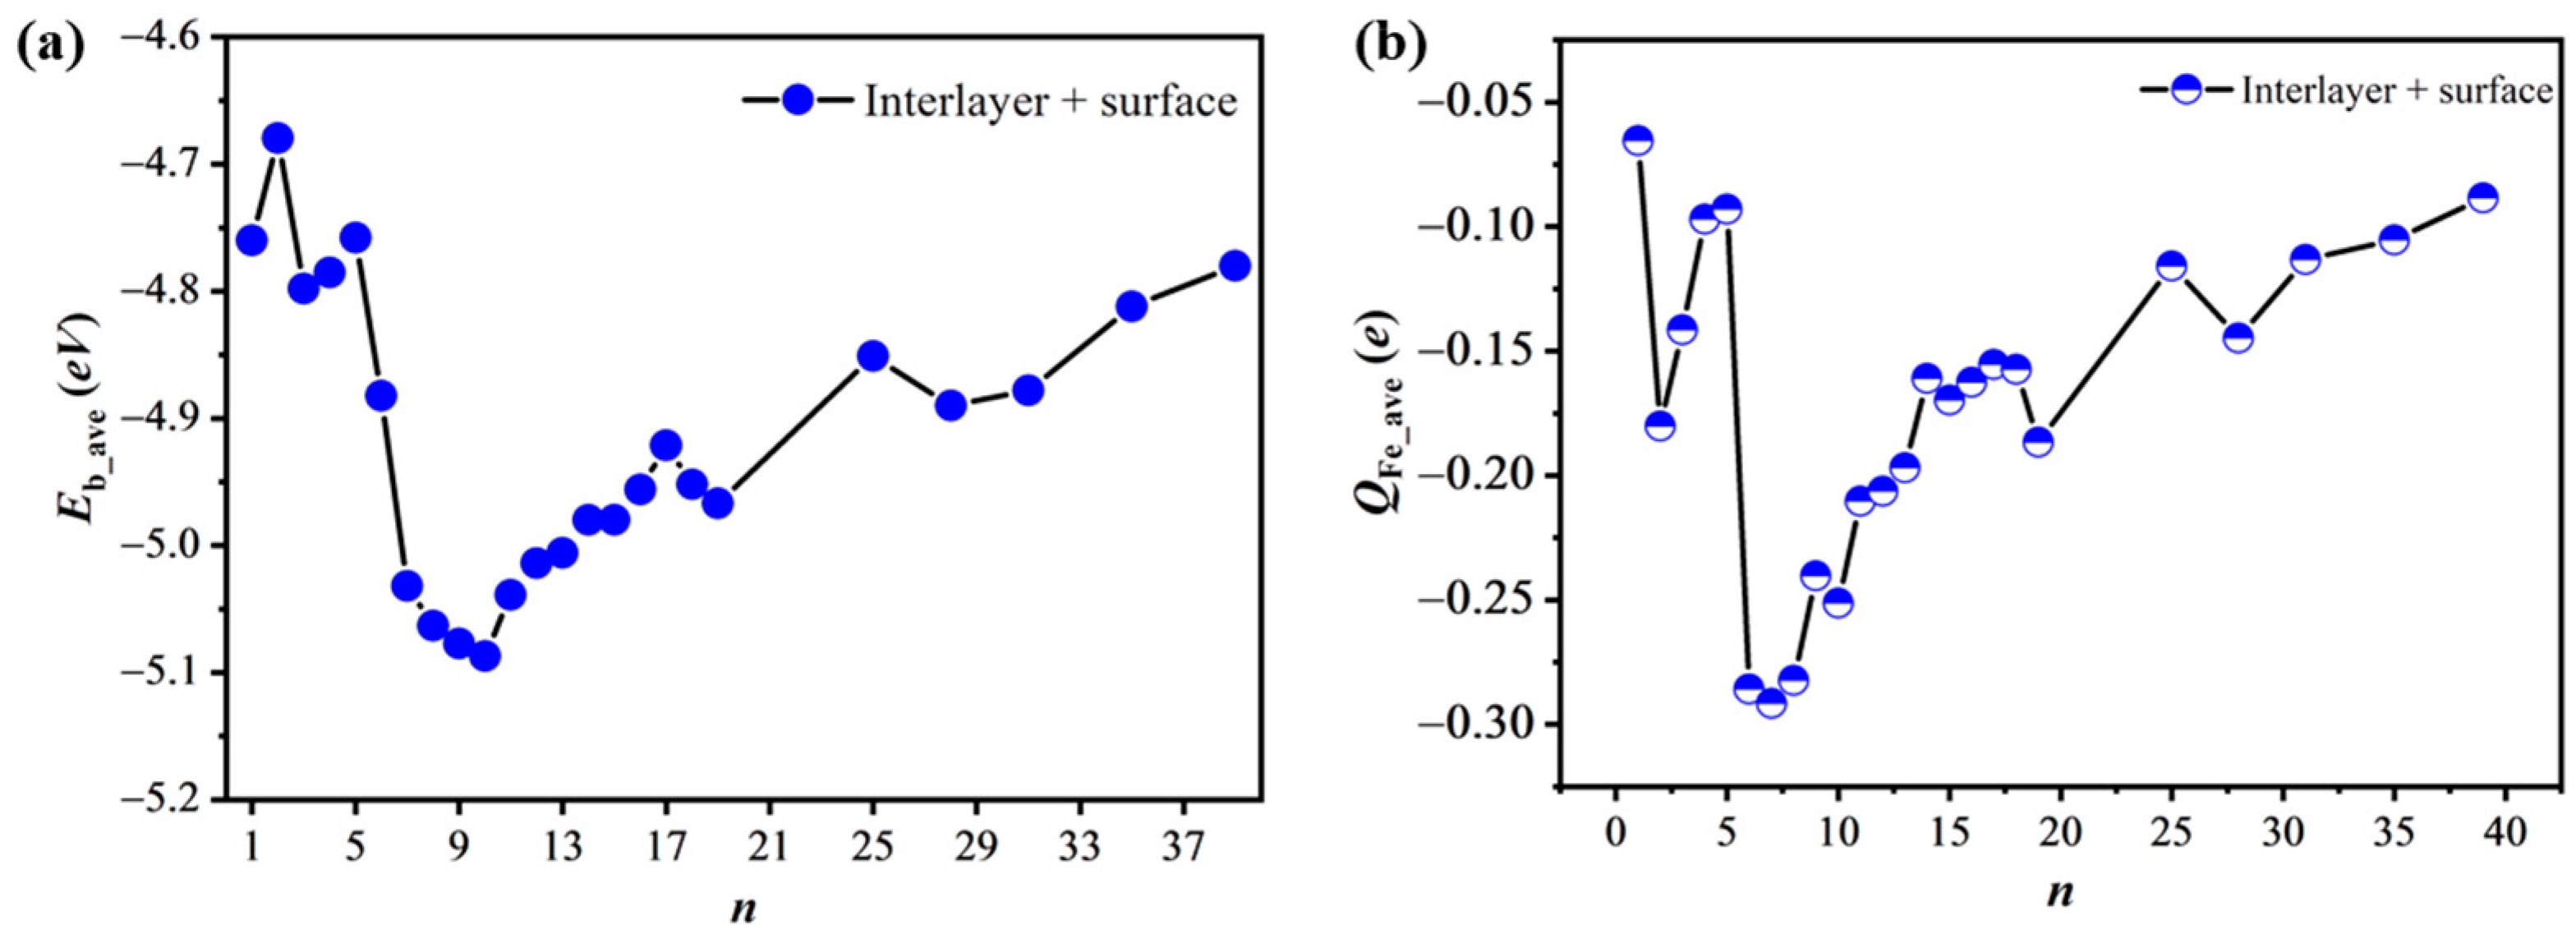
n = 13, the most stable geometry still appears to be the wheel 7Fe structure. As shown in Figure 3a and Table S2 of the Supplementary Materials, the Eb_ave value first becomes more negative and then less negative, and reaches the minimum −5.09 eV at n = 10 (Scheme 4 Fe10). Until the number n increases to 28 (Scheme 4 Fe28), all the positions in the interlayer are occupied by 18 Fe atoms and all the positions on the six-membered rings are adsorbed by the remaining 10 Fe atoms. To further increase the n value, the Eb_ave value become much smaller than at n = 28, due to the formation of Fe–Fe bonds, as shown by the Fe31, Fe35, and Fe39 models in Scheme 4. These results show that the Fe10 model is more stable than the others in the case that the Fe atom permeates freely from the surface to the interlayer.
Although we have obtained the geometries of nFe/DASF with the most negative Eb_ave values, there are limitations in a real experiment at finite temperatures. The influence of the entropy effect and phononic contributions to the free energy, which we have not considered in this work, might change the relative stabilities of geometries with and without Fe permeation, because the differences in Eb_ave values between two models are not very large. For example, the difference in the Eb_ave values between the Fe7 and Fe10 models is just 0.055 eV. When considering such an influence, these energy differences will become smaller and the relative stability of them might be altered. Therefore, it is difficult to conclude which phase(s) would occur or coexist in a real situation at finite temperatures, and it is not clear whether Fe diffuses into the surface or not with the present approach.
In the case of Fe permeation, the Eb_ave ~ n variation is generally similar to the trend of the QFe_ave ~ n variation (Figure 3b), suggesting that the bonding interaction is the main determining factor for the trends. The QFe_ave value of two Fe atoms (Scheme 4 Fe2) is −0.18 e, which is 0.11 e more negative than the −0.07 e for the single Fe atom (Scheme 4 Fe1). The spin densities of the two Fe atoms are 1.58 μB and −0.69 μB, which are much smaller than the 1.74 μB for the single Fe atom, suggesting that the spin-pairing interaction between the Fe and Si atoms is stronger in Fe2 than in Fe1. From n = 3 to n = 17, the QFe_ave value first becomes more negative and then less negative with the minimum value presented at n = 7, as shown in Figure 3b. Although the Eb_ave value at n = 10 (Scheme 4 Fe10) is 0.055 eV more negative than that at n = 7 (Scheme 4 Fe7), the QFe_ave value is 0.04 e less negative at n = 10 than that at n = 7. The average spin density at n = 10 is 0.06 μB, which is smaller than the 0.15 μB at n = 7, indicating that the spin-pairing interaction between the Fe atoms and Si atoms is stronger at n =10 than at n = 7. In the Fe10 model, the Bader charge of the central Fe of the “7Fe wheel” is −0.348 e; the QFe_ave value of the six Fe atoms along the ring of the “7Fe wheel” is −0.288 e and that of the three Fe atoms below the “7Fe wheel” is −0.145 e. In the cases from the S7 model (Scheme 2) to the Fe10 model (Scheme 4), the Bader charge of the central Fe of the “7Fe wheel” becomes less negative by 0.039 e while the QFe_ave value for the six Fe atoms along the ring of the “7Fe wheel” becomes more negative by 0.012 e. From these results, it can be predicted that the reactivities of the two models are similar, as we will discuss below, because these differences are not very large.
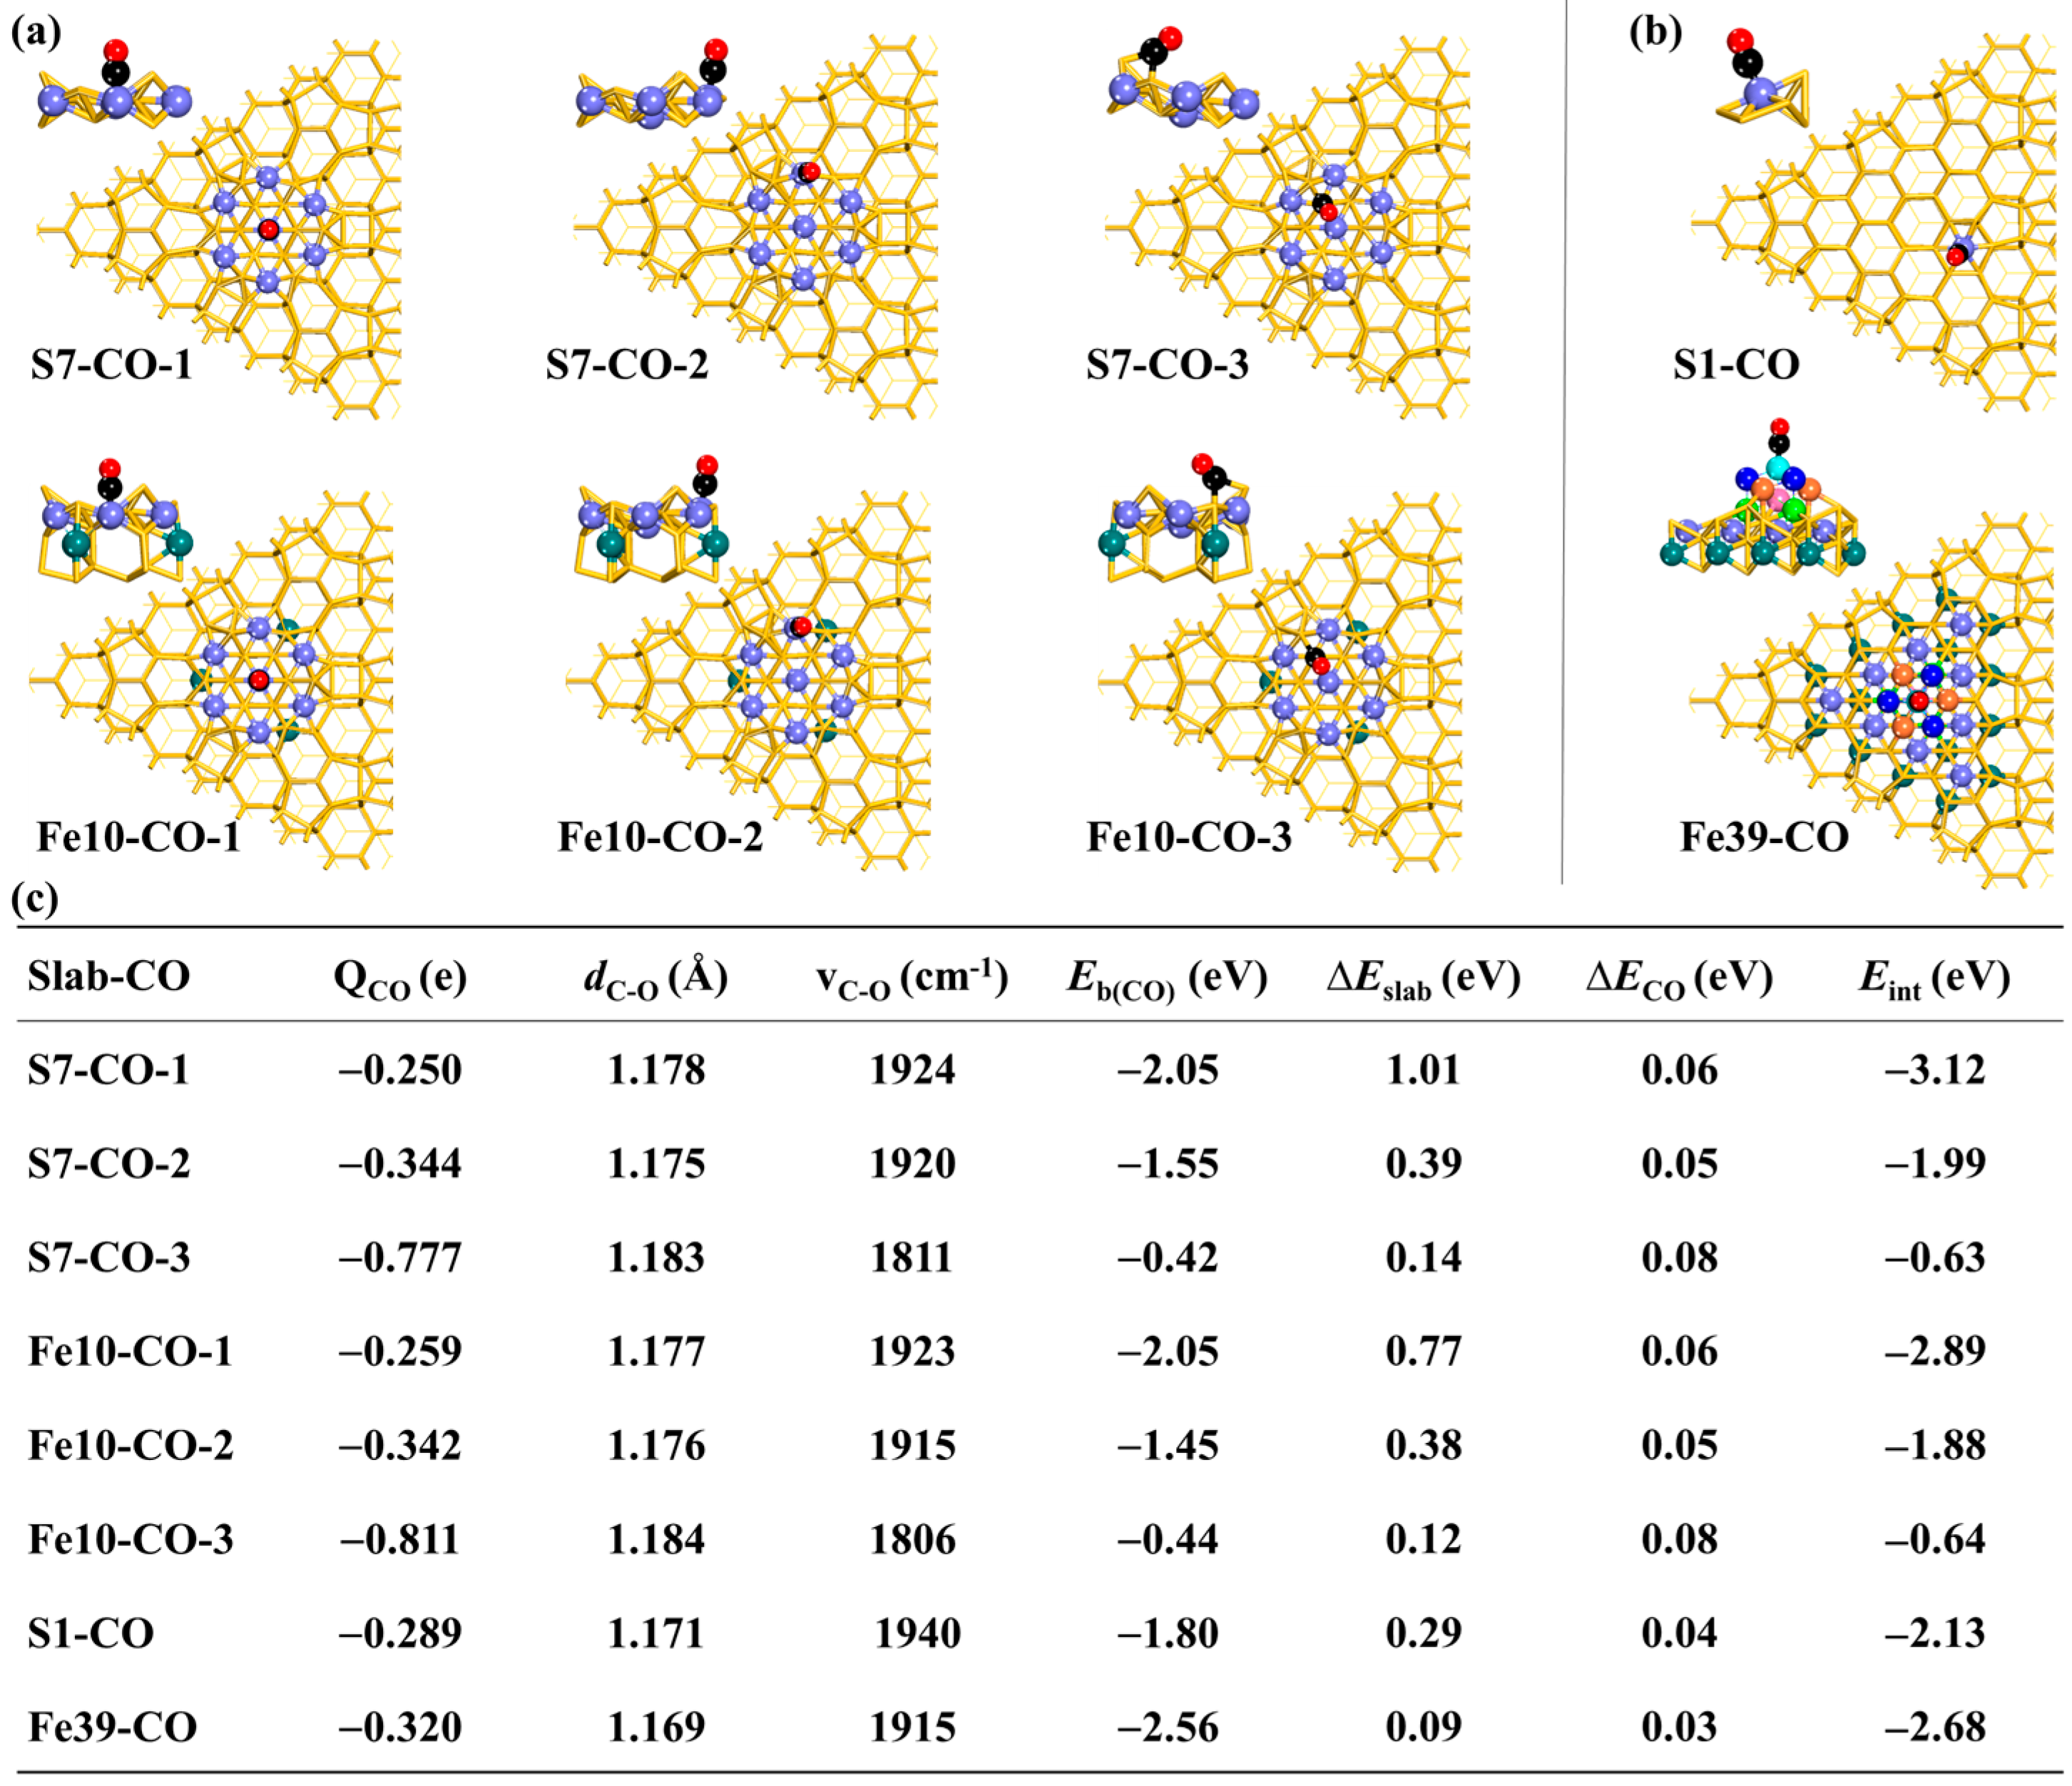
2.5. CO Adsorption

The surface reactivity of nFe/DASF is explored taking CO adsorption to them as an example, because CO adsorption is often studied to evaluate the surface reactivity of many materials. Koo et al. [25] carried out experiments and theoretical calculations about CO adsorption on the DASF without Fe atoms, and reported that the adsorption of CO molecules occurs on the SiA atoms. However, the interaction of CO with the Fe atoms on the DASF surface remains unclear. We studied the adsorption of CO on the models of S7 in Scheme 2 and Fe10 in Scheme 4, because they are more stable than other geometries. As shown in Scheme 5, the geometries and energies of the CO adsorption on the S7 and Fe10 models are parallel to those of the CO adsorption on the S1 and Fe39 models for easy comparison. Generally, the CO adsorption at the central Fe site of both the S7 and Fe10 models is stronger than in the S1 model, but is weaker than in the Fe39 model where CO does not interact with Si atoms, suggesting that the CO adsorption in the nFe/DASF model is greatly influenced by the surrounding Si atoms. The influence of Si atoms on CO adsorption is discussed in detail below.
In the S7 case, the CO molecule binds to the central Fe site of the “7Fe wheel”, according to the S7-CO-1 geometry, with a binding energy (Eb(CO)) of −2.05 eV. The CO adsorption becomes weak when it binds with the Fe atom along the ring of the “7Fe wheel”, as is shown by the S7-CO-2 geometry with an Eb(CO) value of −1.55 eV. Compared with S7-CO-1 and S7-CO-2, the CO adsorption in S7-CO-3 is much weaker. There is a C–Fe bond but no C–Si bond formed in S7-CO-1 and S7-CO-2, whereas S7-CO-3 has a C–Si bond but no C–Fe bond. In S7-CO-3, the C atom of CO binds to two Si atoms, where the C–Si distances are 1.917 Å (with the adatom Si) and 2.224 Å (with the other Si), very close to the result by Shong et al. [26]. In the cases from S7-CO-1 to S7-CO-3, the C–O distance (dC-O) lengthens moderately from 1.178 Å to 1.183 Å and the C−O stretching frequency (vCO) decreases from 1924 cm−1 to 1811 cm−1. Therefore, the CO molecule prefers the Fe atom to the Si atom in the S7 model.
When going from S7-CO-1 to S7-CO-2 and to S7-CO-3, the deformation energy of the CO (∆ECO) changes little; however, the deformation energy of the model (∆Eslab) decreases greatly. The interaction energy (Eint) between the model and the CO molecule becomes less negative from −3.12 eV to −1.99 eV and to −0.63 eV, suggesting that the charge transfer between the model and the CO molecule is expected to be weaker in the order of S7-CO-1 > S7-CO-2 > S7-CO-3. The Bader charge (QCO) of CO is negative and becomes more negative from −0.250 e in S7-CO-1 to −0.344 e in S7-CO-2 and to −0.777 e in S7-CO-3, which is because the central Fe atom compared to the other Fe atoms is much more negatively charged (as is discussed in Section 2.1) and its d orbitals thus are occupied by more electrons than the other Fe atoms, suppressing its ability to accept electrons but promoting its ability to donate electrons. The charge of −0.777 e for CO in S7-CO-3 is mainly contributed by the charge transfer from the Si atom to the CO molecule.
The CO adsorption on the Fe10 model is very similar to the S7 model, whether from the aspect of the Eb(CO) term or from the aspects of the QCO, dC-O, and vCO terms. The result shows that the adsorption of CO is little influenced by the permeation of three additional Fe atoms into the interlay, which is reasonable because each of the Fe atoms shares only one Si atom with the central Fe atom of the “7Fe wheel” and no Fe–Fe bond is formed between them. The ∆ECO values are very similar for both models but the Fe10 model deforms less than the S7 model, which is consistent with the more negative Eb_ave value in the Fe10 model than in the S7 model (−5.087 eV vs. −5.032 eV), as well as the distribution of the electron density in these two models.

3. Methods and Materials

Spin-polarized DFT calculations are carried out by using the plane wave based pseudo-potential code in VASP [27,28]. The projector augmented wave method is used to calculate the electron–ion interaction [29,30]. The Perdew–Burke–Ernzerhof formalism is adopted to calculate the electron exchange-correlation energy [31]. The Kohn–Sham one-electron states in a plane wave basis set expanded up to 400 eV are employed with electron smearing with σ = 0.2 eV. The geometry optimization is converged with energy difference lower than 10−4 eV and forces smaller than 0.05 eV/Å. The Bader charge is calculated using the program developed by the Henkelman group [32].
The lattice parameters are calculated using the Si bulk crystal structure and its reciprocal space is sampled with a 15 × 15 × 15 k-point grid generated automatically using the Monkhorst–Pack method. The optimized bulk Si–Si bond is 2.36 Å in length. The DASF substrate is simulated with a Si(111) slab with a super cell of p(7×7), which contains seven layers of Si in the Z direction and 298 Si atoms. The bottom of the DASF substrate is passivated with one layer of 49 hydrogen atoms after optimizing the Si–H bonds, because hydrogen-termination of Si dangling bonds is one of the most common and useful methods of producing a chemically passivated surface [33,34,35,36,37]. During the optimization of the positions of Fe atoms, two bottom layers of Si together with the hydrogen atoms are fixed to model the bulk lattice properties, while the other Si atoms and Fe atoms are relaxed. The vacuum layer between periodically repeated slabs is set to be 15 Å to avoid interactions between slabs. The Brillouin zone is sampled with the Gamma-point.
The averaged binding energy (Eb_ave) is calculated according to the equations Eb_ave = (EnFe/DASFEDASFnEFe)/n. The term EnFe/DASF is the total energies of the optimized DASF substrate with the adsorbed n Fe atoms in their equilibrium geometry; EDASF is the total energy of the optimized DASF substrate, and EFe is the total energy of the Fe atom in the gas phase. All these energies are obtained in zero-temperature, static ground-state calculations, meaning that the entropy effect and phononic contributions to the free energy are not considered. The averaged Bader charge Qave of the Fe atoms is calculated according to the equation Qave = QnFe/n, where QnFe represents the total Bader charge of the n Fe atoms on DASF.

4. Conclusions

In this work, the spin-polarized DFT method was employed to investigate the initial structure nFe/DASF of the iron–silicon interface formed by the deposition of Fe atoms on the reconstructed Si(111)-(7×7) surface (named DASF). The stability of Fe atoms on the model was evaluated by averaged binding energies of Fe atoms. Two types of Fe growth were considered. One was that all the Fe atoms are adsorbed on the surface; the other was that Fe atoms freely permeate from the surface to the interlayer. In both cases, Fe atoms prefer to bind with Si atoms first rather than the adsorbed Fe atoms, because the Fe-Si interaction is stronger than the Fe-Fe interaction. In the first case, when increasing the n value, the average binding energy (Eb_ave) generally becomes first more negative and then less negative, and reaches the minimum at n = 7 taking on a wheel-like 7Fe geometry. In the second case, a minimum Eb_ave value is presented at n = 10, with the additional three Fe atoms just below the 7Fe wheel. The variation in Eb_ave ~ n is similar to that of the averaged Bader charge against the n value, indicating that the bonding interaction determines the trends for the most part. The presence of the 7Fe wheel in both cases is mainly attributed to the enhanced Fe-Si interaction in the 7Fe wheel over the other geometries with the Fe atoms more dispersed. Because the central Fe site in both models of S7 and Fe10 is richer in electron density compared to other sites, CO adsorption occurs at the central Fe site of the 7Fe wheel, which is greatly influenced by the surrounding Si atoms but is little influenced by the additional Fe atoms in the interlayer. This work reveals the stability of the iron–silicon interface structure in the early stages of Fe growth on DASF. Also, the important properties such as the charge distribution and CO adsorption presented here are valuable for understanding and predicting the reactivity of the iron–silicon interface.

Supplementary Materials

The following supporting information can be downloaded at: https://www.mdpi.com/article/10.3390/molecules28207181/s1, Table S1: The total energy (EnFe/DASF) and the averaged binding energy (Eb_ave) for the “Sn” models with all the Fe atoms on the DASF surface; Table S2: The total energy (EnFe/DASF) and the averaged binding energy (Eb_ave) for the “Fen” models with Fe permeation on the DASF surface; Coordinate files.

Author Contributions

Conceptualization, J.-Q.Y. and Y.-P.Z.; methodology, J.-Q.Y. and Q.P.; software, Q.P.; validation, J.-Q.Y., Y.-P.Z., Y.Y., Z.-H.W. and J.-Q.Z.; formal analysis, J.-Q.Y. and Y.-P.Z.; investigation, J.-Q.Y. and Y.-P.Z.; data curation, J.-Q.Y.; writing—original draft preparation, J.-Q.Y. and Y.-P.Z.; writing—review and editing, J.-Q.Y., Y.-P.Z., Y.Y., Z.-H.W., J.-Q.Z. and Q.P.; visualization, J.-Q.Y. and Y.-P.Z.; supervision, J.-Q.Y.; project administration, J.-Q.Y.; funding acquisition, J.-Q.Y. All authors have read and agreed to the published version of the manuscript.

Funding

This research was funded by the Natural Science Foundation of China (No. 22302021), the Natural Science Foundation of Sichuan Province (No. 2023NSFSC1080), and the Talent Program of Chengdu University (No. 2081923010).

Institutional Review Board Statement

Not applicable.

Informed Consent Statement

Not applicable.

Data Availability Statement

Not applicable.

Acknowledgments

The authors are grateful for support from Synfuels China Co., Ltd., Beijing and Chengdu University, Chengdu, China.

Conflicts of Interest

The authors declare no conflict of interest.

Sample Availability

Samples of the models are available from the authors.

References

  1. Varadwaj, K.S.K.; Seo, K.; In, J.; Mohanty, P.; Park, J.; Kim, B. Phase-controlled growth of metastable Fe5Si3 nanowires by a vapor transport method. J. Am. Chem. Soc. 2007, 129, 8594–8599. [Google Scholar] [CrossRef]
  2. He, Z.; Xiong, S.; Wu, S.; Zhu, X.; Meng, M.; Wu, X. Strong facet-induced and light-controlled room-temperature ferromagnetism in semiconducting β-FeSi2 nanocubes. J. Am. Chem. Soc. 2015, 137, 11419–11424. [Google Scholar] [CrossRef] [PubMed]
  3. Hirayama, H.; Okamoto, H.; Takayanagi, K. Growth of high-density small Ag islands on the Si(111) 7×7 surface with adatom defects. Phys. Rev. B 1999, 60, 14260. [Google Scholar] [CrossRef]
  4. Molodtsov, S.L.; Laubschat, C.; Kaindl, G.; Shikin, A.M.; Adamchuk, V.K. Formation and chemical structure of the Au/Si(111) interface. Phys. Rev. B 1991, 44, 8850. [Google Scholar] [CrossRef]
  5. Wu, Y.; Zhou, Y.; Zhou, C.; Zhan, H.; Kang, J. Atomic structure and formation mechanism of identically sized Au clusters grown on Si(111)-(7×7) surface. J. Chem. Phys. 2010, 133, 124706. [Google Scholar] [CrossRef] [PubMed]
  6. Xu, Z.H.; Park, Y.B.; Li, X.D. Nano/micro-mechanical and tribological characterization of Ar, C, N, and Ne ion-implanted Si. J. Mater. Res. 2010, 25, 880–889. [Google Scholar] [CrossRef]
  7. Gruyters, M. Growth and structure of Fe, Co and Ni films on hydrogen-terminated Si(111) surfaces. Surf. Sci. 2002, 515, 53–60. [Google Scholar] [CrossRef]
  8. Evans, M.M.R.; Glueckstein, J.C.; Nogami, J. Epitaxial growth of manganese on silicon: Volmer-Weber growth on the Si(111) surface. Phys. Rev. B 1996, 53, 4000–4004. [Google Scholar] [CrossRef]
  9. Ding, W.; Ju, D.; Guo, Y.; Tanaka, K.; Komori, F. Formation of linearly linked Fe clusters on Si(111)-7×7-C2H5OH surface. Nanoscale Res. Lett. 2014, 9, 377. [Google Scholar] [CrossRef] [PubMed]
  10. Zilani, M.A.K.; Sun, Y.Y.; Xu, H.; Liu, L.; Feng, Y.P.; Wang, X.S.; Wee, A.T.S. Reactive Co magic cluster formation on Si(111)-(7×7). Phys. Rev. B 2005, 72, 193402. [Google Scholar] [CrossRef]
  11. Wolf, S.; Sante, D.D.; Schwemmer, T.; Thomale, R.; Rachel, S. Triplet superconductivity from nonlocal Coulomb repulsion in an atomic Sn layer deposited onto a Si(111) substrate. Phys. Rev. Lett. 2022, 128, 167002. [Google Scholar] [CrossRef] [PubMed]
  12. Hubert, A.; Schäfer, R. Magnetic Domains: The Analysis of Magnetic Microstructures; Springer: Berlin/Heidelberg, Germany, 2009. [Google Scholar]
  13. Nunes, B.; Magalhães, S.; Franco, N.; Alves, E.; Cola, R. Microstructure and nanomechanical properties of Fe+ implanted silicon. Appl. Surf. Sci. 2013, 284, 533–539. [Google Scholar] [CrossRef]
  14. Sun, C.M.; Tsang, H.K.; Wong, S.P.; Cheung, W.Y.; Ke, N.; Hark, S.K. Rapid thermal annealing of ion beam synthesized beta-FeSi2 nanoparticles in Si. Appl. Phys. Lett. 2008, 92, 211902. [Google Scholar] [CrossRef]
  15. Goroshko, D.L.; Galkin, N.G.; Fomin, D.V.; Gouralnik, A.S.; Vavanova, S.V. An investigation of the electrical and optical properties of thin iron layers grown on the epitaxial Si(111)-(2×2)–Fe phase and on an Si(111)7×7 surface. J. Phys. Condens. Matter 2009, 21, 435801. [Google Scholar] [CrossRef] [PubMed]
  16. Alvarez, J.; de Parga, A.L.V.; Hinarejos, J.J.; de la Figuera, J.; Michel, E.C.; Ocal, C.; Miranda, R. Initial stages of the growth of Fe on Si(111)7×7. Phys. Rev. B 1993, 47, 16048. [Google Scholar] [CrossRef]
  17. Ufuktepe, Y.; Onellion, M. Electronic structure of Fe overlayers on Si(111). Solid State Commun. 1990, 76, 191–194. [Google Scholar] [CrossRef]
  18. Kawaguchi, R.; Eguchi, T.; Suto, S. Atomistic investigation on the initial stage of growth and interface formation of Fe on H-terminated Si(111)-(1×1) surface. Surf. Sci. 2019, 686, 52–57. [Google Scholar] [CrossRef]
  19. Thibaudau, F.; Masson, L.; Chemam, A.; Roche, J.R.; Salvan, F. Scanning tunneling microscopy study of Fe(CO)5 and Fe(C5H5)2 adsorption on Si(111)7×7 and B/Si(111)√3 × √3. J. Vac. Sci. Technol. A 1998, 16, 2967–2973. [Google Scholar] [CrossRef]
  20. Sakamoto, K.; Harada, M.; Kondo, D. Bonding state of the C-60 molecule adsorbed on a Si(111)-(7×7) surface. Phys. Rev. B 1998, 58, 13951–13956. [Google Scholar] [CrossRef]
  21. Seo, E.; Eom, D.; Shin, E.-H.; Kim, H.; Koo, J.-Y. Thermal dissociation of CO molecules and carbon incorporation on the Si(111)-(7×7) surface. Surf. Sci. 2020, 696, 121589. [Google Scholar] [CrossRef]
  22. Brommer, K.D.; Galvan, M.; Dal Pino, A., Jr.; Joannopoulos, J.D. Theory of adsorption of atoms and molecules on Si(111)-(7×7). Surf. Sci. 1994, 314, 57–70. [Google Scholar] [CrossRef]
  23. Yin, J.; Ehara, M.; Sakaki, S. Single atom alloys vs. phase separated alloys in Cu, Ag, and Au atoms with Ni(111) and Ni, Pd, and Pt atoms with Cu(111): A theoretical exploration. Phys. Chem. Chem. Phys. 2022, 24, 10420. [Google Scholar] [CrossRef]
  24. Yin, J.; Wang, S.; Xu, D.; You, Y.; Liu, X.; Peng, Q. Surface modification of Fe5C2 by binding silica-1 based ligand: A theoretical explanation of enhanced C2 oxygenate selectivity. Mol. Catal. 2023, 547, 113333. [Google Scholar] [CrossRef]
  25. Seo, E.; Eom, D.; Hyun, J.M.; Koo, J.Y. Adsorption of CO molecules on the Si(111)-(7×7) surface. Surf. Sci. 2017, 656, 33–38. [Google Scholar] [CrossRef]
  26. Shong, B. Adsorption of carbon monoxide on the Si(111)-(7×7) surface. Appl. Surf. Sci. 2017, 405, 209–214. [Google Scholar] [CrossRef]
  27. Kresse, G.; Furthmüller, J. Efficiency of ab-initio total energy calculations for metals and semiconductors using a plane-wave basis set. Comput. Mater. Sci. 1996, 6, 15–50. [Google Scholar] [CrossRef]
  28. Kresse, G.; Furthmüller, J. Efficient iterative schemes for ab initio total-energy calculations using a plane-wave basis set. Phys. Rev. B 1996, 54, 11169–11186. [Google Scholar] [CrossRef]
  29. Blochl, P.E. Projector augmented-wave method. Phys. Rev. B 1994, 50, 17953–17979. [Google Scholar] [CrossRef]
  30. Kresse, G. From ultrasoft pseudopotentials to the projector augmented-wave method. Phys. Rev. B 1999, 59, 1758–1775. [Google Scholar] [CrossRef]
  31. Perdew, J.P.; Burke, K.; Ernzerhof, M. Generalized gradient approximation made simple. Phys. Rev. Lett. 1996, 77, 3865–3868. [Google Scholar] [CrossRef]
  32. Henkelman, G.; Arnaldsson, A.; Jonsson, H.A. Fast and robust algorithm for Bader decomposition of charge density. Comput. Mater. Sci. 2006, 36, 354–360. [Google Scholar] [CrossRef]
  33. Osiecki, J.R.; Suto, S.; Chutia, A. Periodic corner holes on the Si(111)-7×7 surface can trap silver atoms. Nat. Commun. 2022, 13, 2973. [Google Scholar] [CrossRef] [PubMed]
  34. Higashi, G.S.; Chabal, Y.J.; Trucks, G.W.; Raghavachari, K. Ideal hydrogen termination of the Si(111) surface. Appl. Phys. Lett. 1990, 56, 656–658. [Google Scholar] [CrossRef]
  35. Higashi, G.S.; Becker, R.S.; Chabal, Y.J.; Becker, A.J. Comparison of Si(111) surfaces prepared using aqueous solutions of NH4 versus HF. Appl. Phys. Lett. 1990, 58, 1656–1658. [Google Scholar] [CrossRef]
  36. Dumas, P.; Chabal, Y.J.; Higashi, G.S. Coupling of an adsorbate vibration to a substrate surface phonon: H on Si(111). Phys. Rev. Lett. 1990, 65, 1124–1127. [Google Scholar] [CrossRef] [PubMed]
  37. Gallego, S.; Avila, J.; Martin, M.; Blase, X.; Taleb, A.; Dumas, P.; Asensio, M.C. Electronic structure of the ideally H-terminated Si(111)-(1×1) surface. Phys. Rev. B 2000, 61, 12628–12631. [Google Scholar] [CrossRef]
Scheme 1. Top and side views of the DASF model and the adsorption sites for Fe in the model. The symbols SiA and SiR represent the Si adatom (blue spheres) and the Si rest atom (black spheres), respectively. The blue lines are for the Si atoms at the bottom of the model and the other Si atoms use the yellow spheres/lines. Each SiA atom binds with one SiA1 and three SiA2 atoms. In the first layer, the possible adsorption sites are denoted by the symbols 6a~6j (six-membered Si rings) and 5a~5b (five-membered Si rings). The interlayer position just below the SiR atom is denoted by the symbol R and the position just below the SiA2 atom is denoted by the symbol A2.
Molecules 28 07181 sch001
Scheme 2. Geometries with the averaged binding energy (Eb_ave) of the adsorbed Fe atoms on the FHUC. The blue color indicates Fe and the yellow color indicates Si.
Molecules 28 07181 sch002
Figure 1. Variations of the averaged binding energy (Eb_ave, eV) (a) and the averaged Bader charge (QFe_ave, e) of Fe atoms (b) against the number n for Fe atoms in the case that Fe atoms are on the surface of FHUC.
Molecules 28 07181 g001
Scheme 3. Energy changes along the assumed procedure to form the different structures of 3Fe/DASF (S3 and S3′) from DASF and 3Fe atoms. The positions of all the atoms in S30 and S3′0 are taken to be the same as those in S3 and S3′, respectively. The blue balls indicate the Fe atoms, the blue hexagons show the deformed adsorption site, and the yellow color indicates Si.
Molecules 28 07181 sch003
Figure 2. (a) The transition S→R of an Fe atom from the surface to position R just below SiR through the transition state TS(S/R), the transition S→A2 of an Fe atom from the surface to position A2 just below SiA2 through TS(S/A2), and the transition R→A2 of an Fe atom from position R to position A2 through TS(R/A2). (b) Energetic profiles of Fe atoms permeating from the surface to the first and second interlayers.
Molecules 28 07181 g002
Scheme 4. Geometries with averaged binding energy (Eb_ave, eV) of Fe deposited on the FHUC in the case that the Fe atom permeates freely into the first interlayer (Fe-dw: dark green). The Fe atoms in the different layers are labeled in different colors, shown by Fe-up1 in purple, Fe-up2 in green, Fe-up3 in red, Fe-up4 in pink, Fe-up5 in blue, and Fe-up6 in cyan.
Molecules 28 07181 sch004
Figure 3. Variation of the averaged binding energy (Eb_ave, eV) (a) and the averaged Bader charge (QFe_ave, e) of Fe atoms (b) against the number n for Fe atoms in the case that Fe atoms freely permeate from the surface to the first interlayer in the FHUC area.
Molecules 28 07181 g003
Scheme 5. Geometries and energies of the adsorptions of one CO molecule on the slab models of nFe/DASF. The geometries of the CO adsorbed on the models of S7 and Fe10 (a), and on the models of S1 and Fe39 (b). The corresponding binding energy (Eb, eV), Bader change (Q, e), C−O distance (dC-O, Å), and C−O stretching frequencies (vCO, cm−1), as well as the deformation energies (∆Eslab and ∆ECO) of the slab models and CO molecule, and the interaction energies (Eint) between the slab model and CO molecule (c). All the energies are in eV. The C and O atoms of CO are in black and red colors, respectively.
Molecules 28 07181 sch005
Disclaimer/Publisher’s Note: The statements, opinions and data contained in all publications are solely those of the individual author(s) and contributor(s) and not of MDPI and/or the editor(s). MDPI and/or the editor(s) disclaim responsibility for any injury to people or property resulting from any ideas, methods, instructions or products referred to in the content.

