

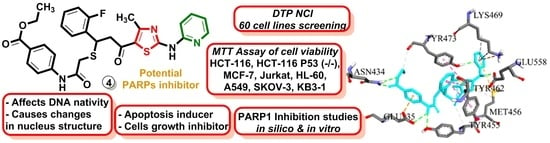
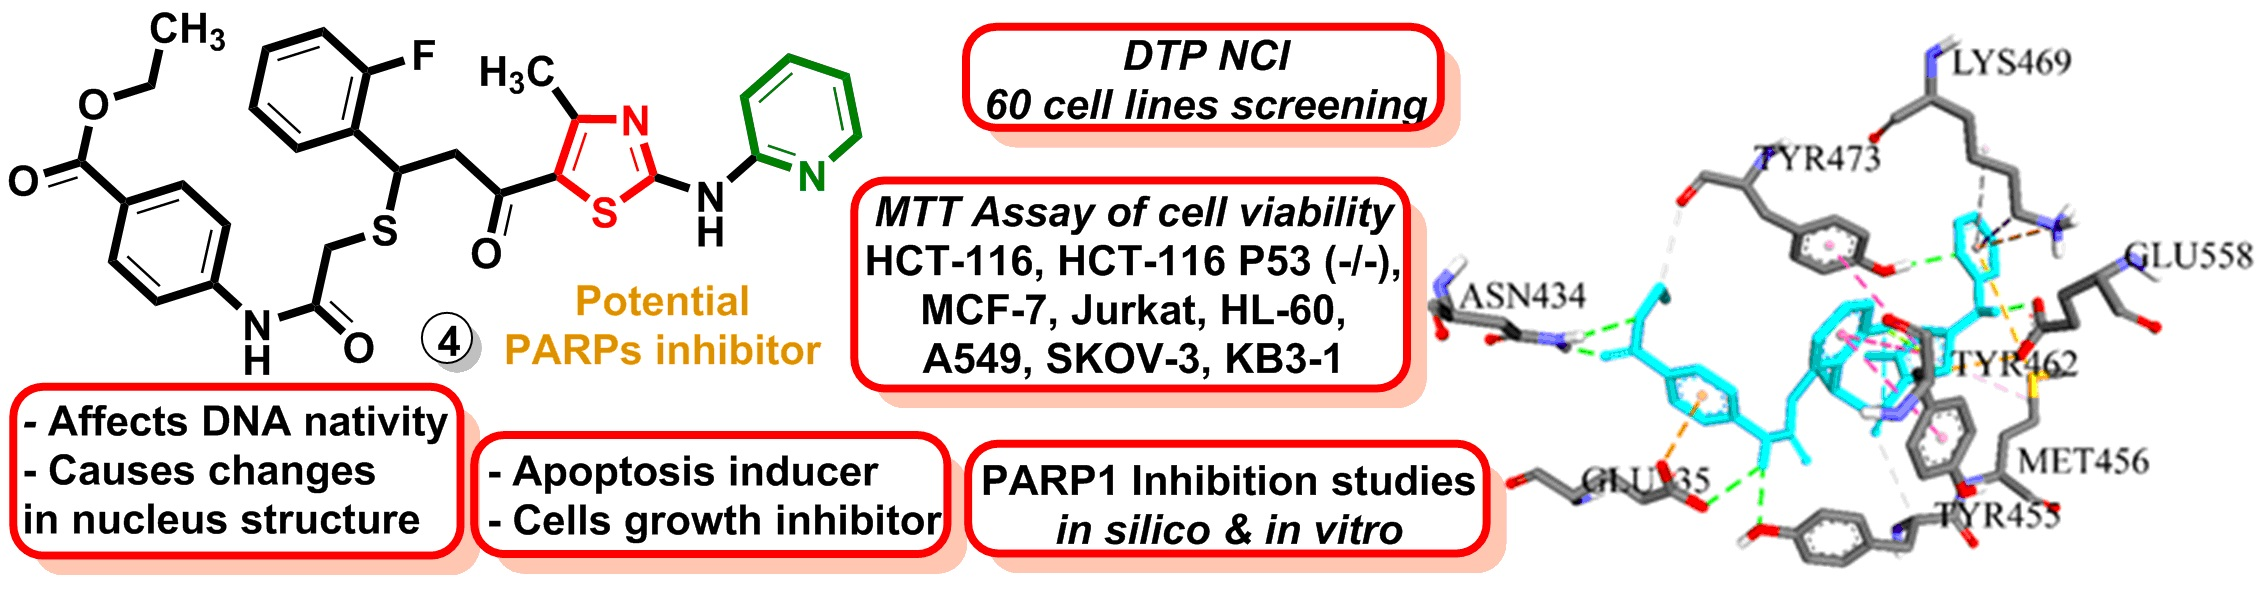
Development of Novel Pyridine-Thiazole Hybrid Molecules as Potential Anticancer Agents

 ,
,  , ,
, ,  , , , , ,
Abstract
:
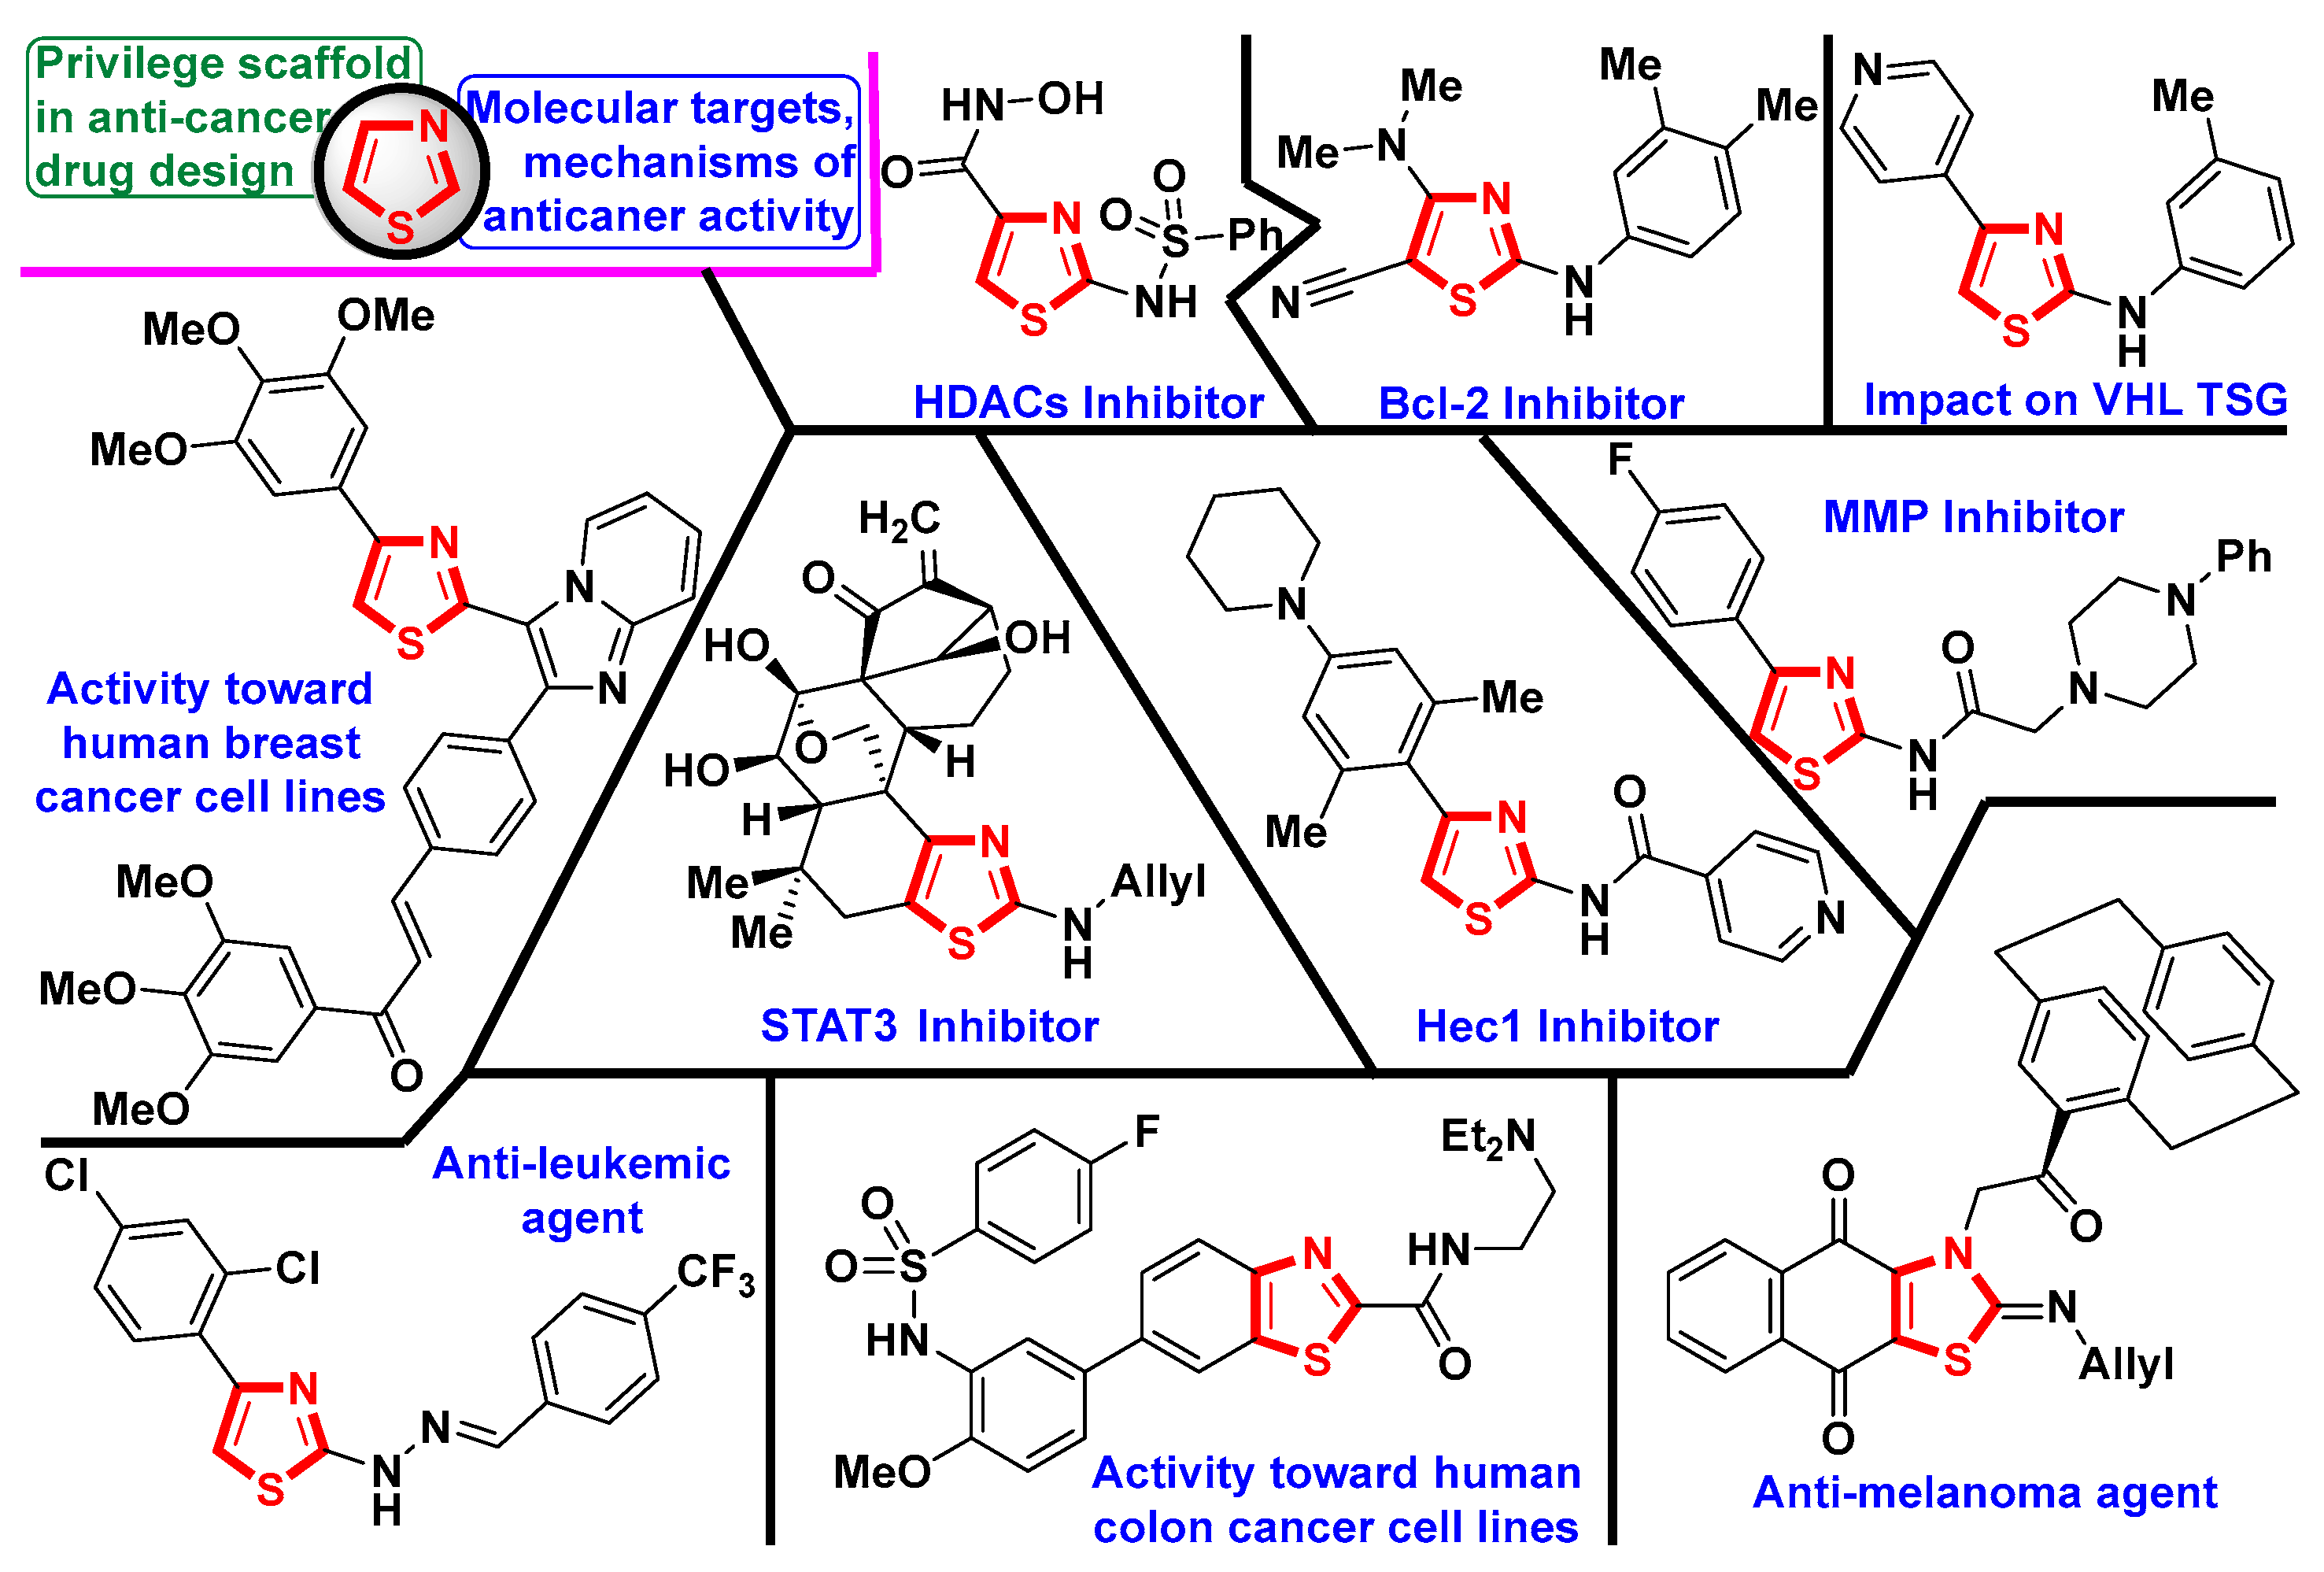
1. Introduction
2. Results
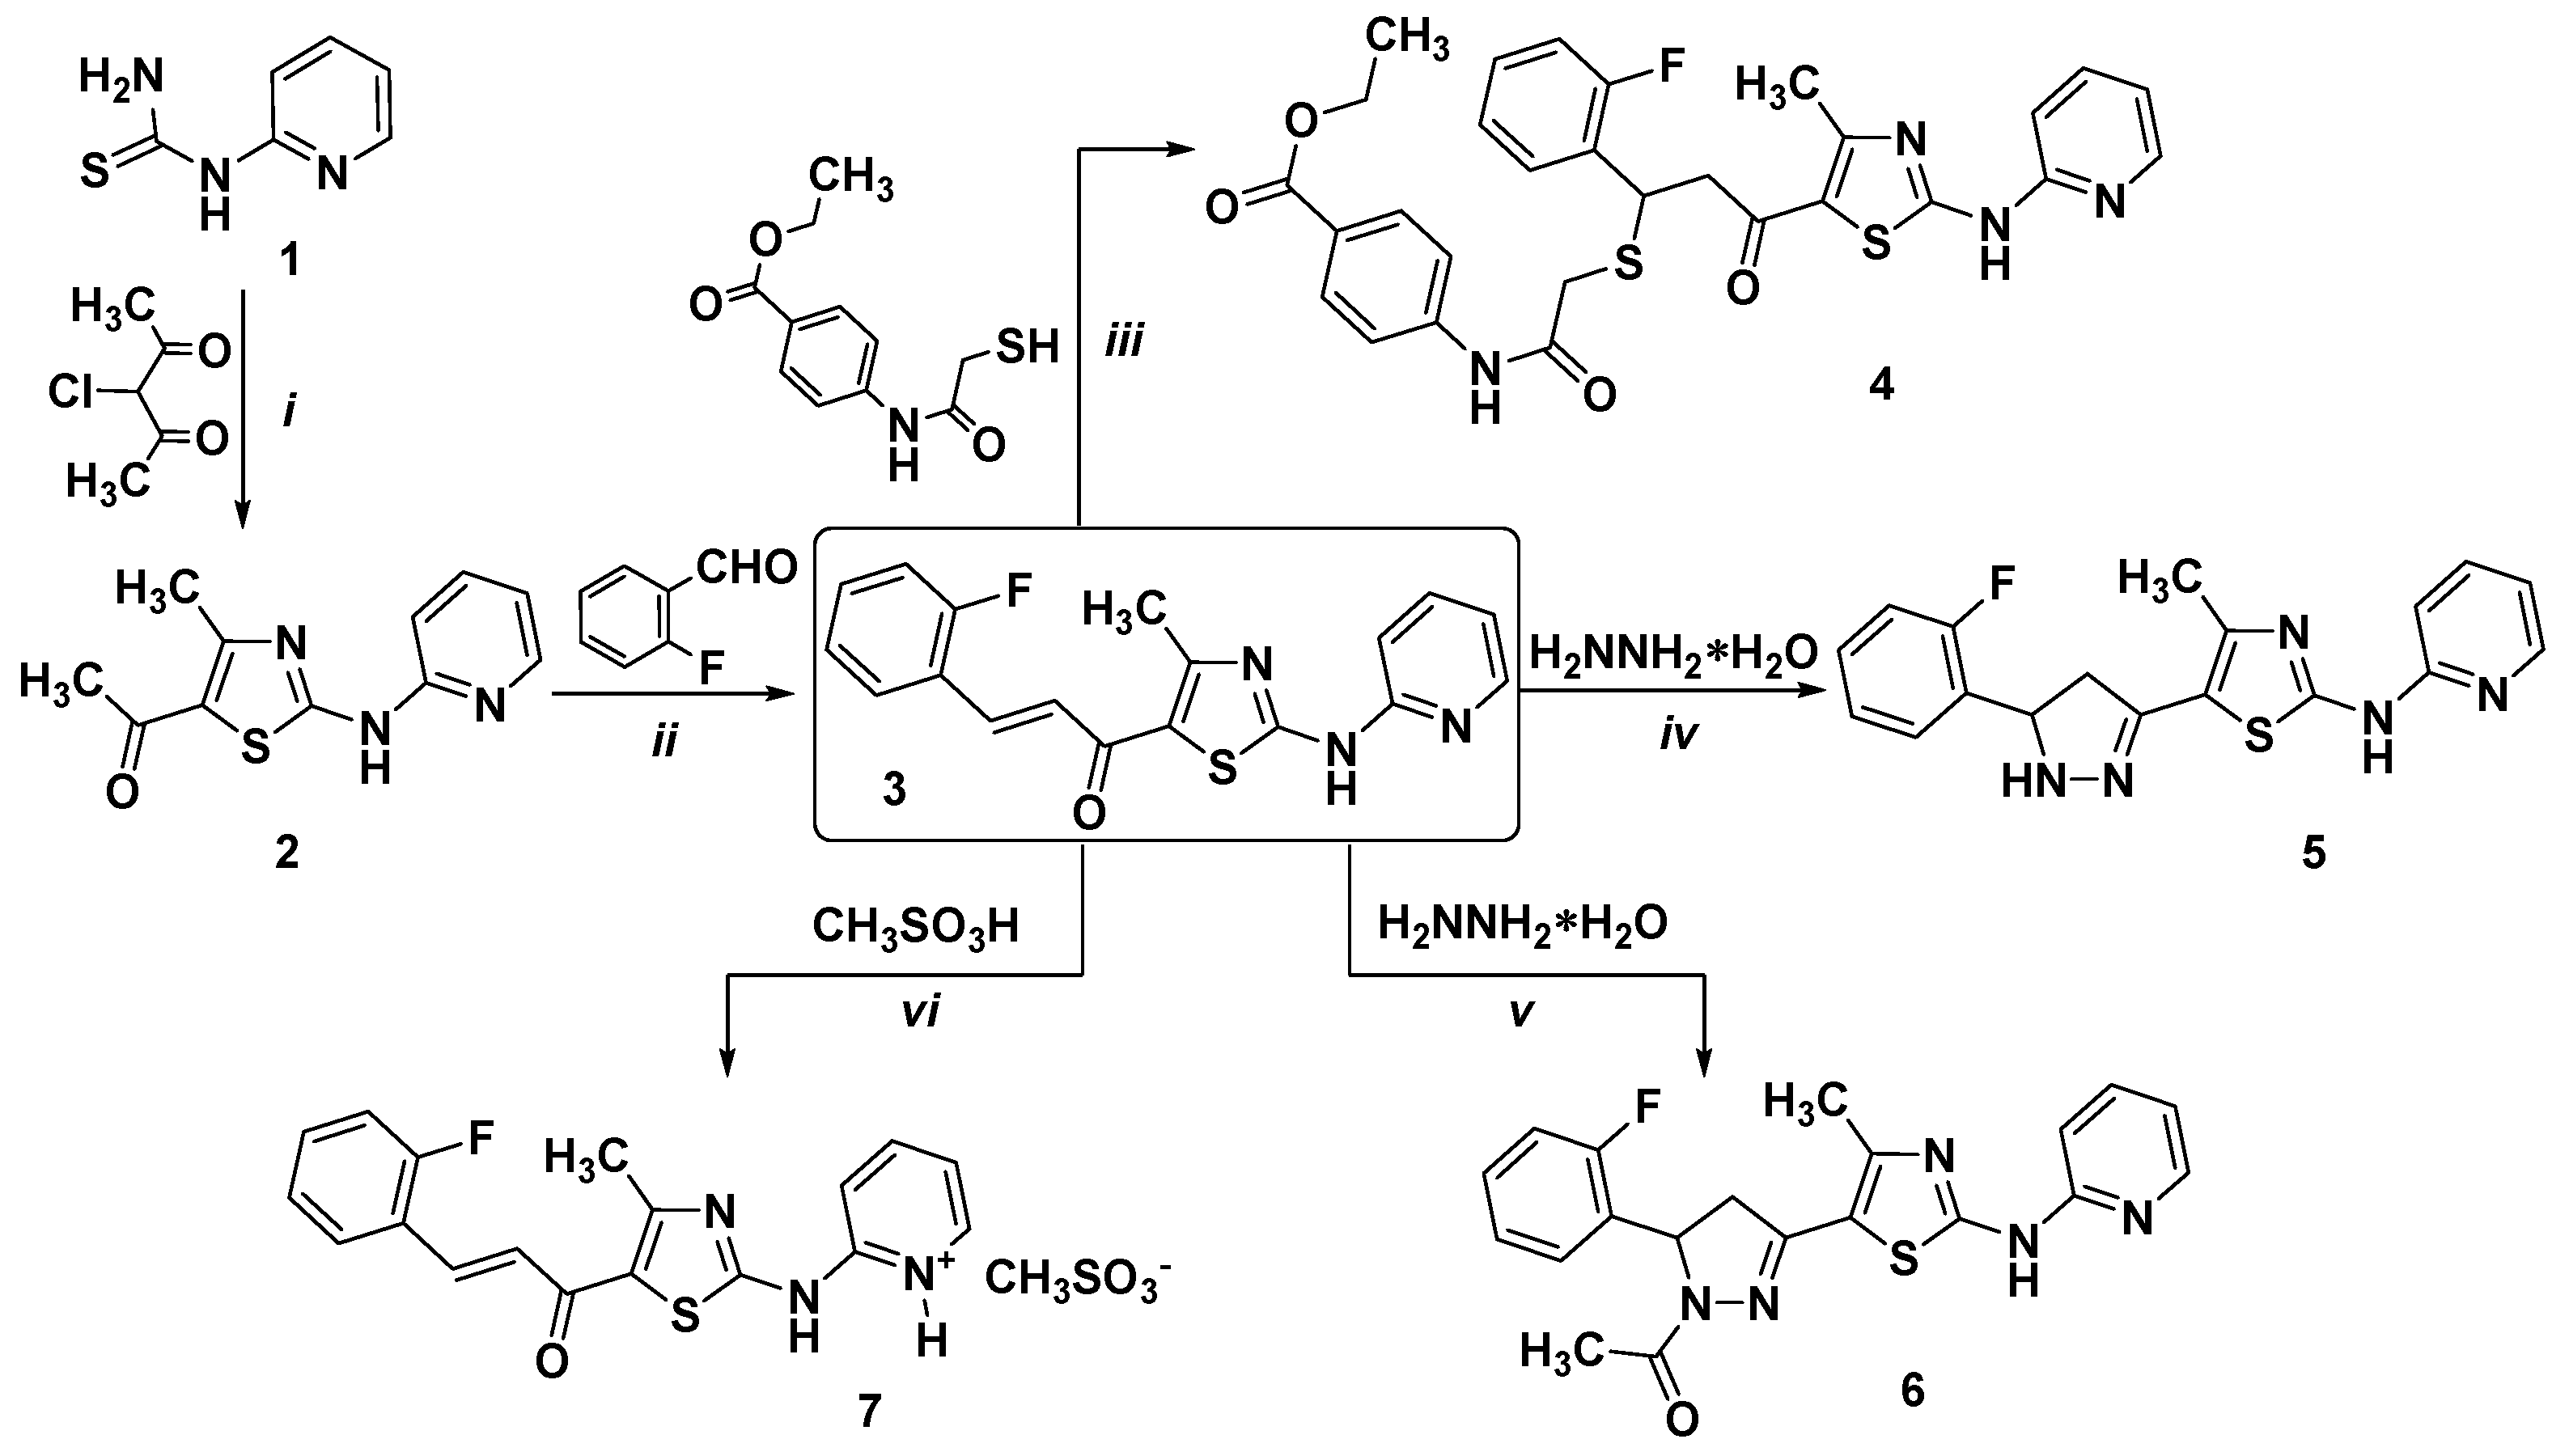
2.1. Chemistry
2.2. Biological Evaluations
2.2.1. In Vitro Study of the Anticancer Activity in 60 Lines under the NCI DTP Screening
2.2.2. Application of MTT Assay for Measurement of Viability of HCT-116, HCT-116 p53 (−/−), MCF-7, Jurkat, HL-60, A549, SK-OV-3, and KB3-1 Cell Lines
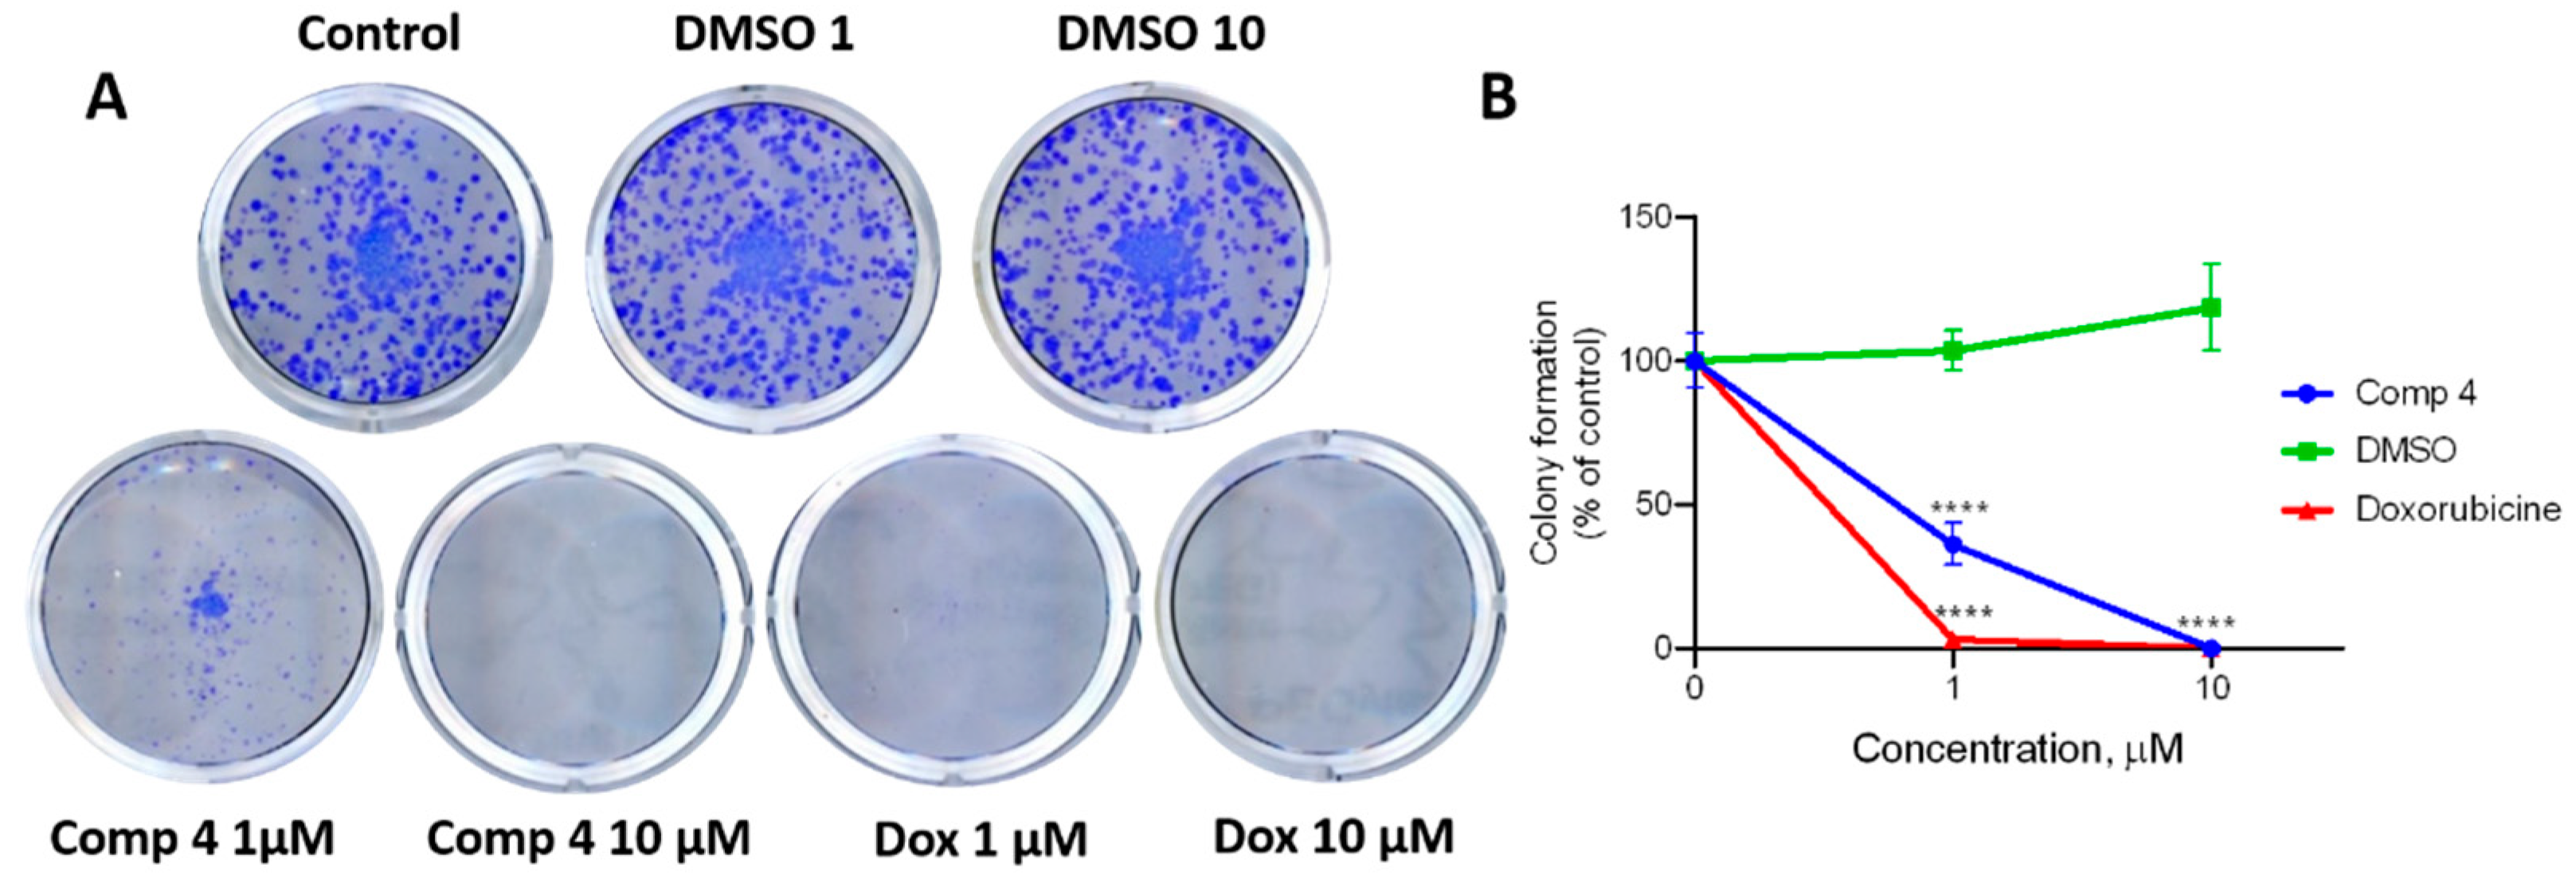
2.2.3. Application of Clonogenic Assay for Measurement of Single Cell Growth Inhibition
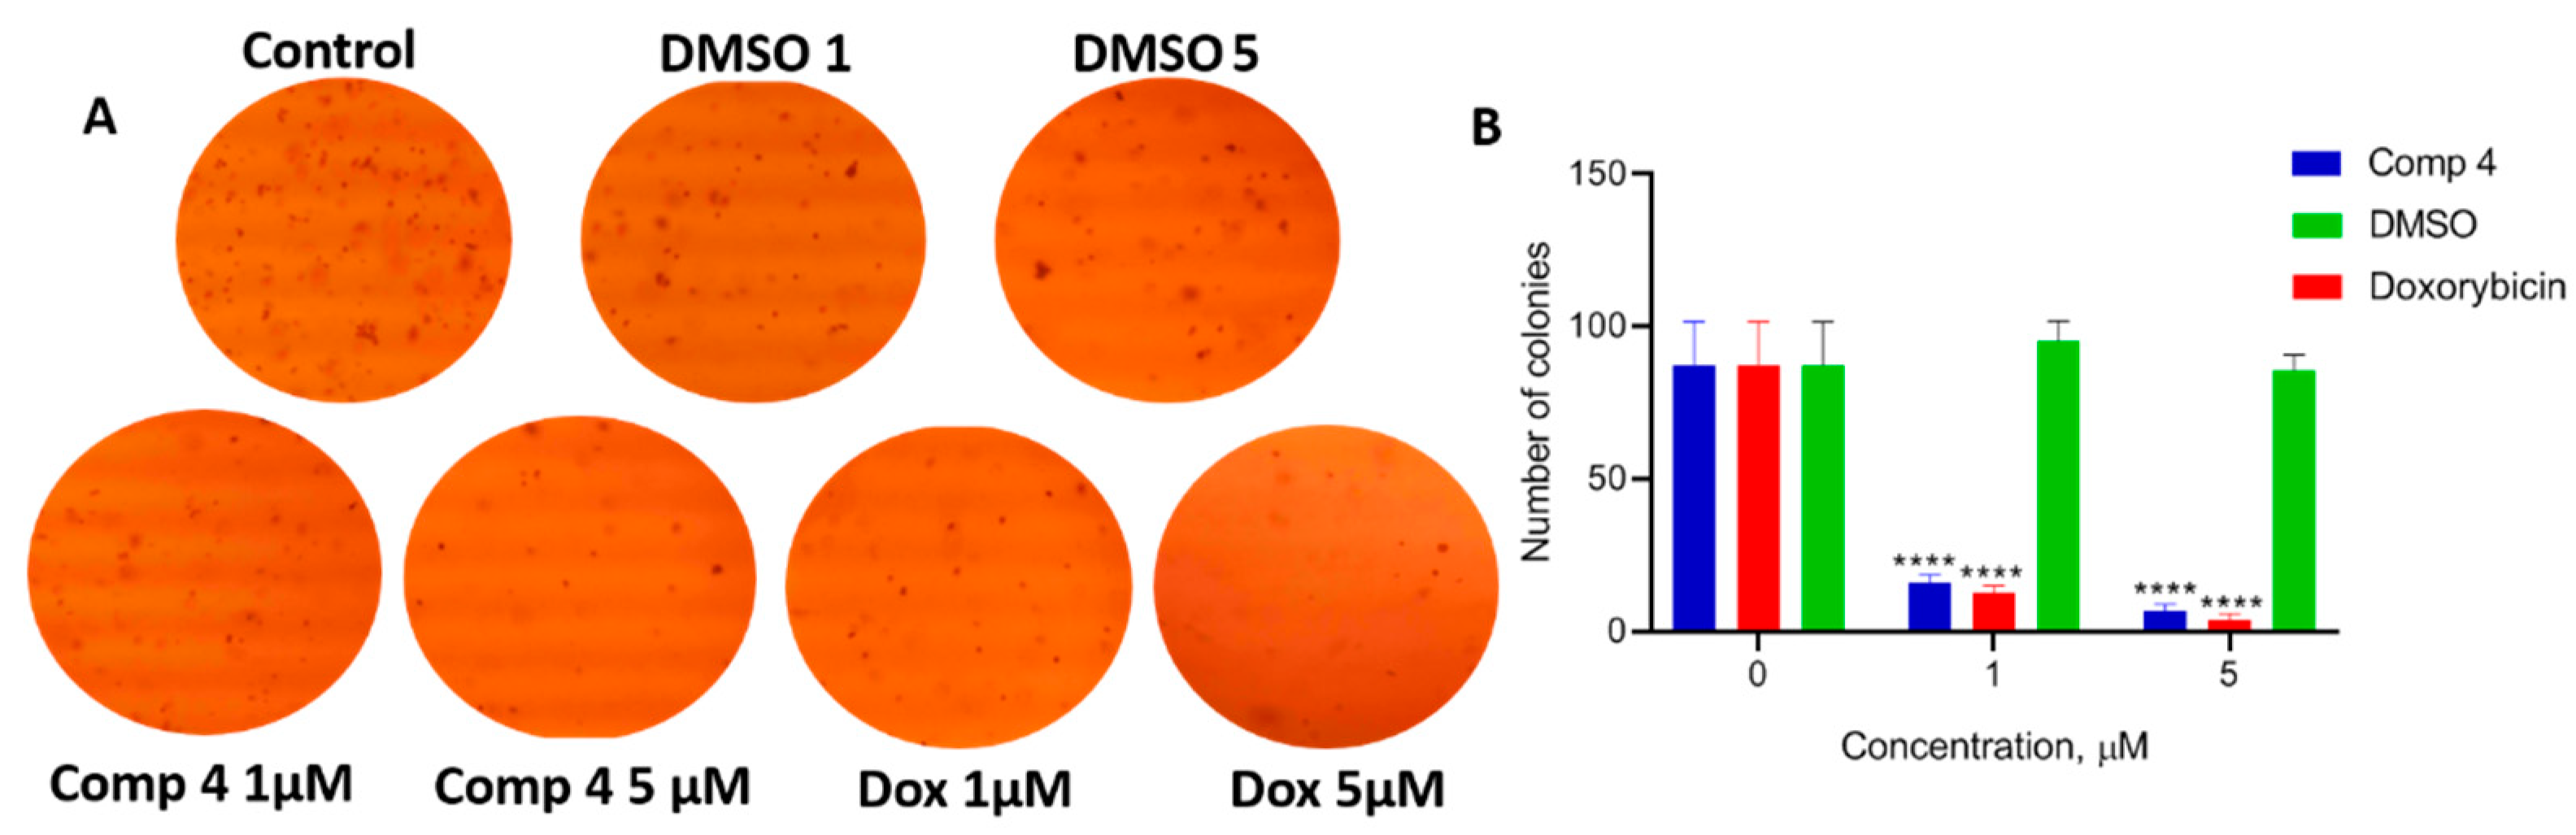
2.2.4. Application of Soft Agar Assay for Evaluation of the Inhibition of Tumorigenicity In Vitro
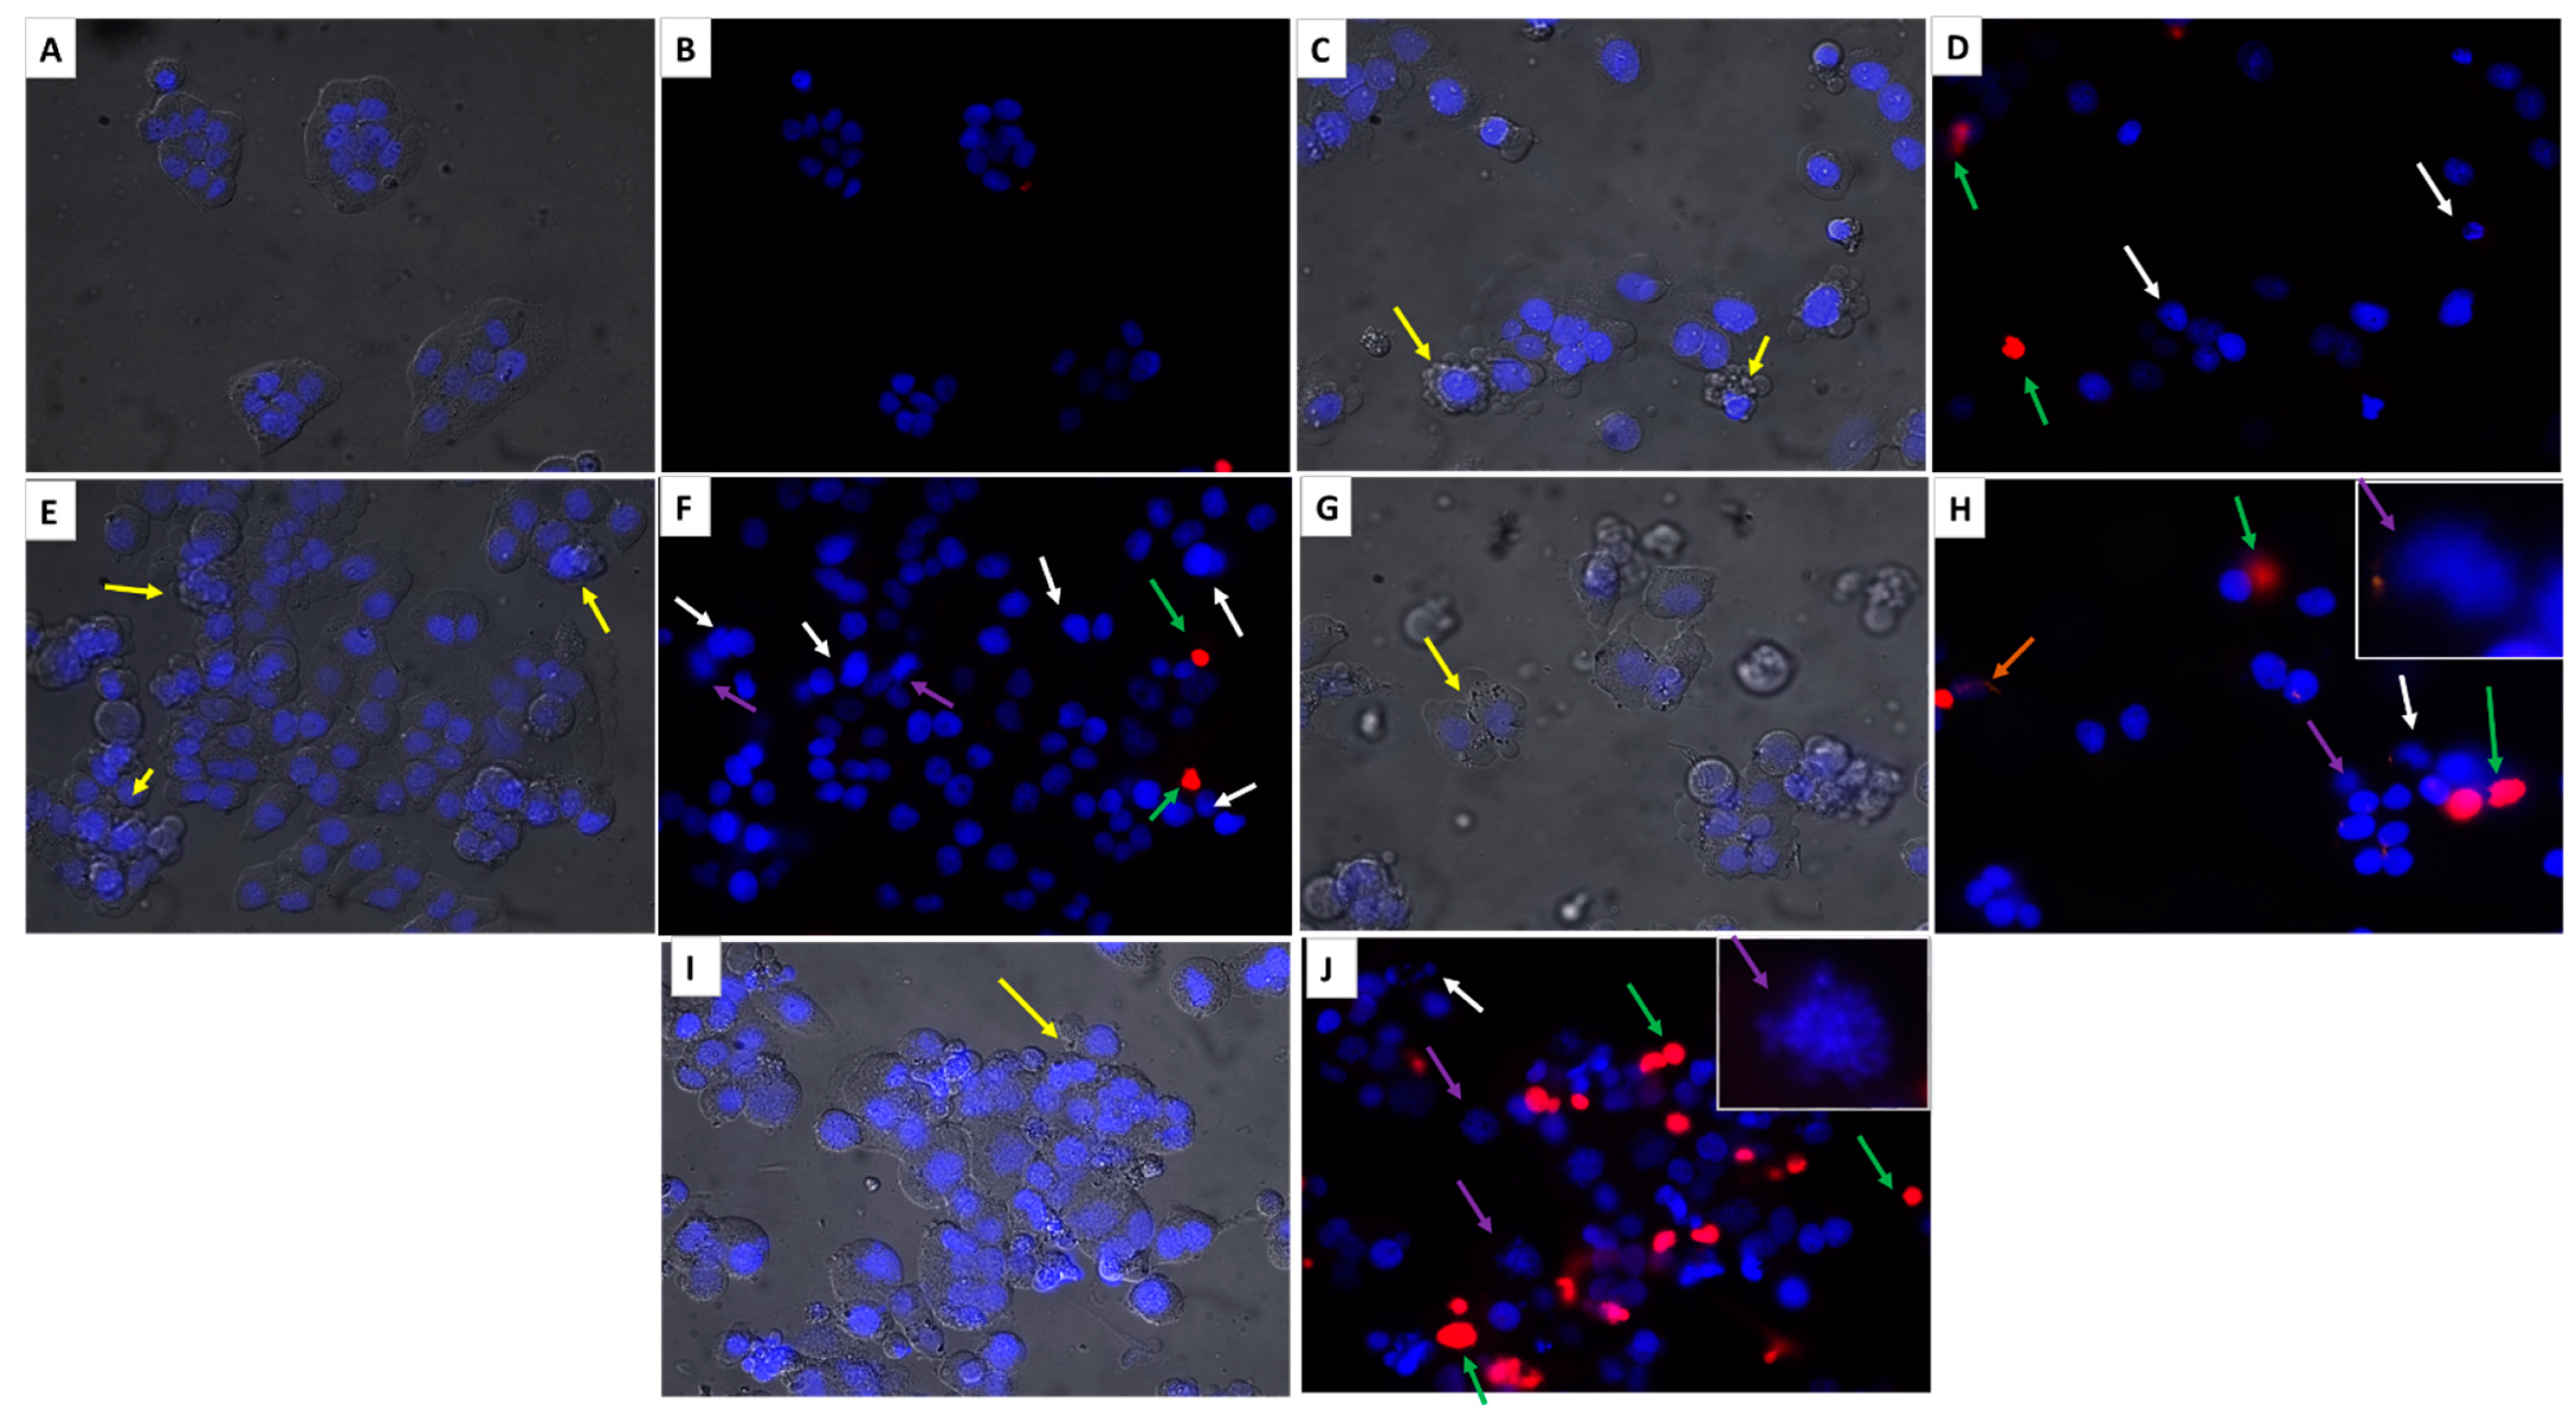
2.2.5. Cytomorphological Changes Induced by Novel Hybrid Pyridine-Thiazole Derivatives
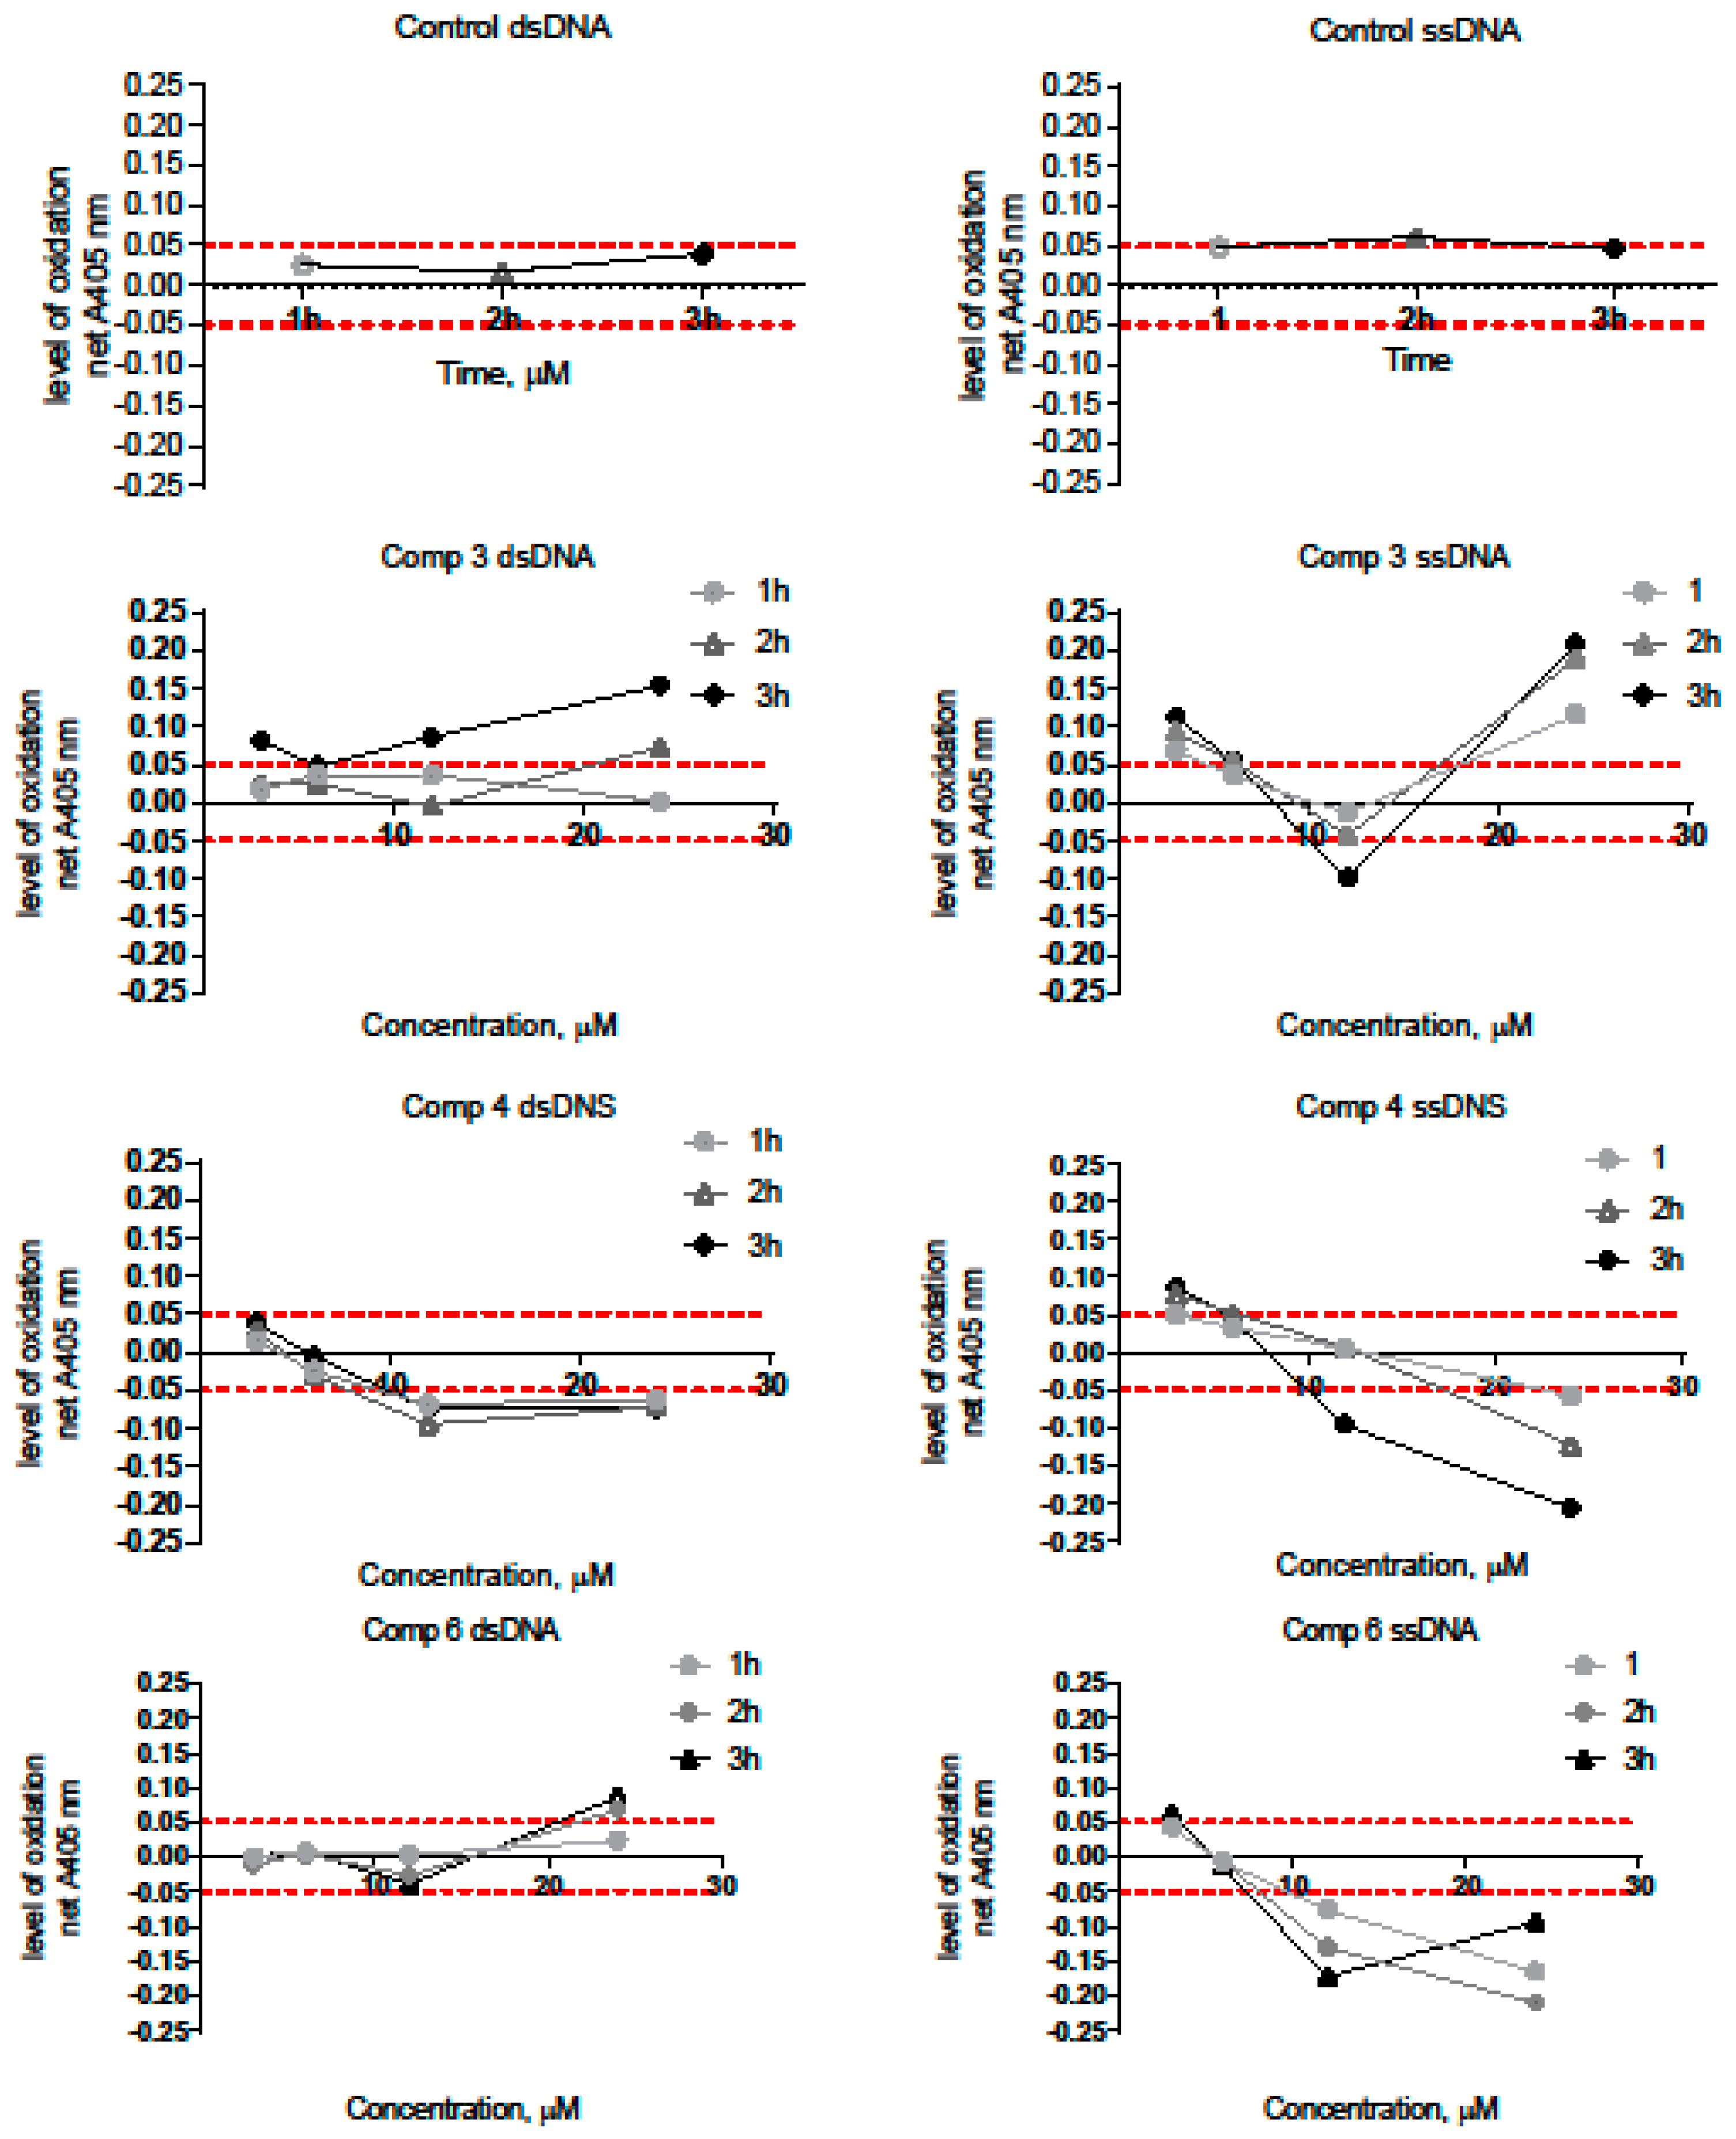
2.2.6. DNA Binding by Novel Hybrid Pyridine-Thiazole Derivatives
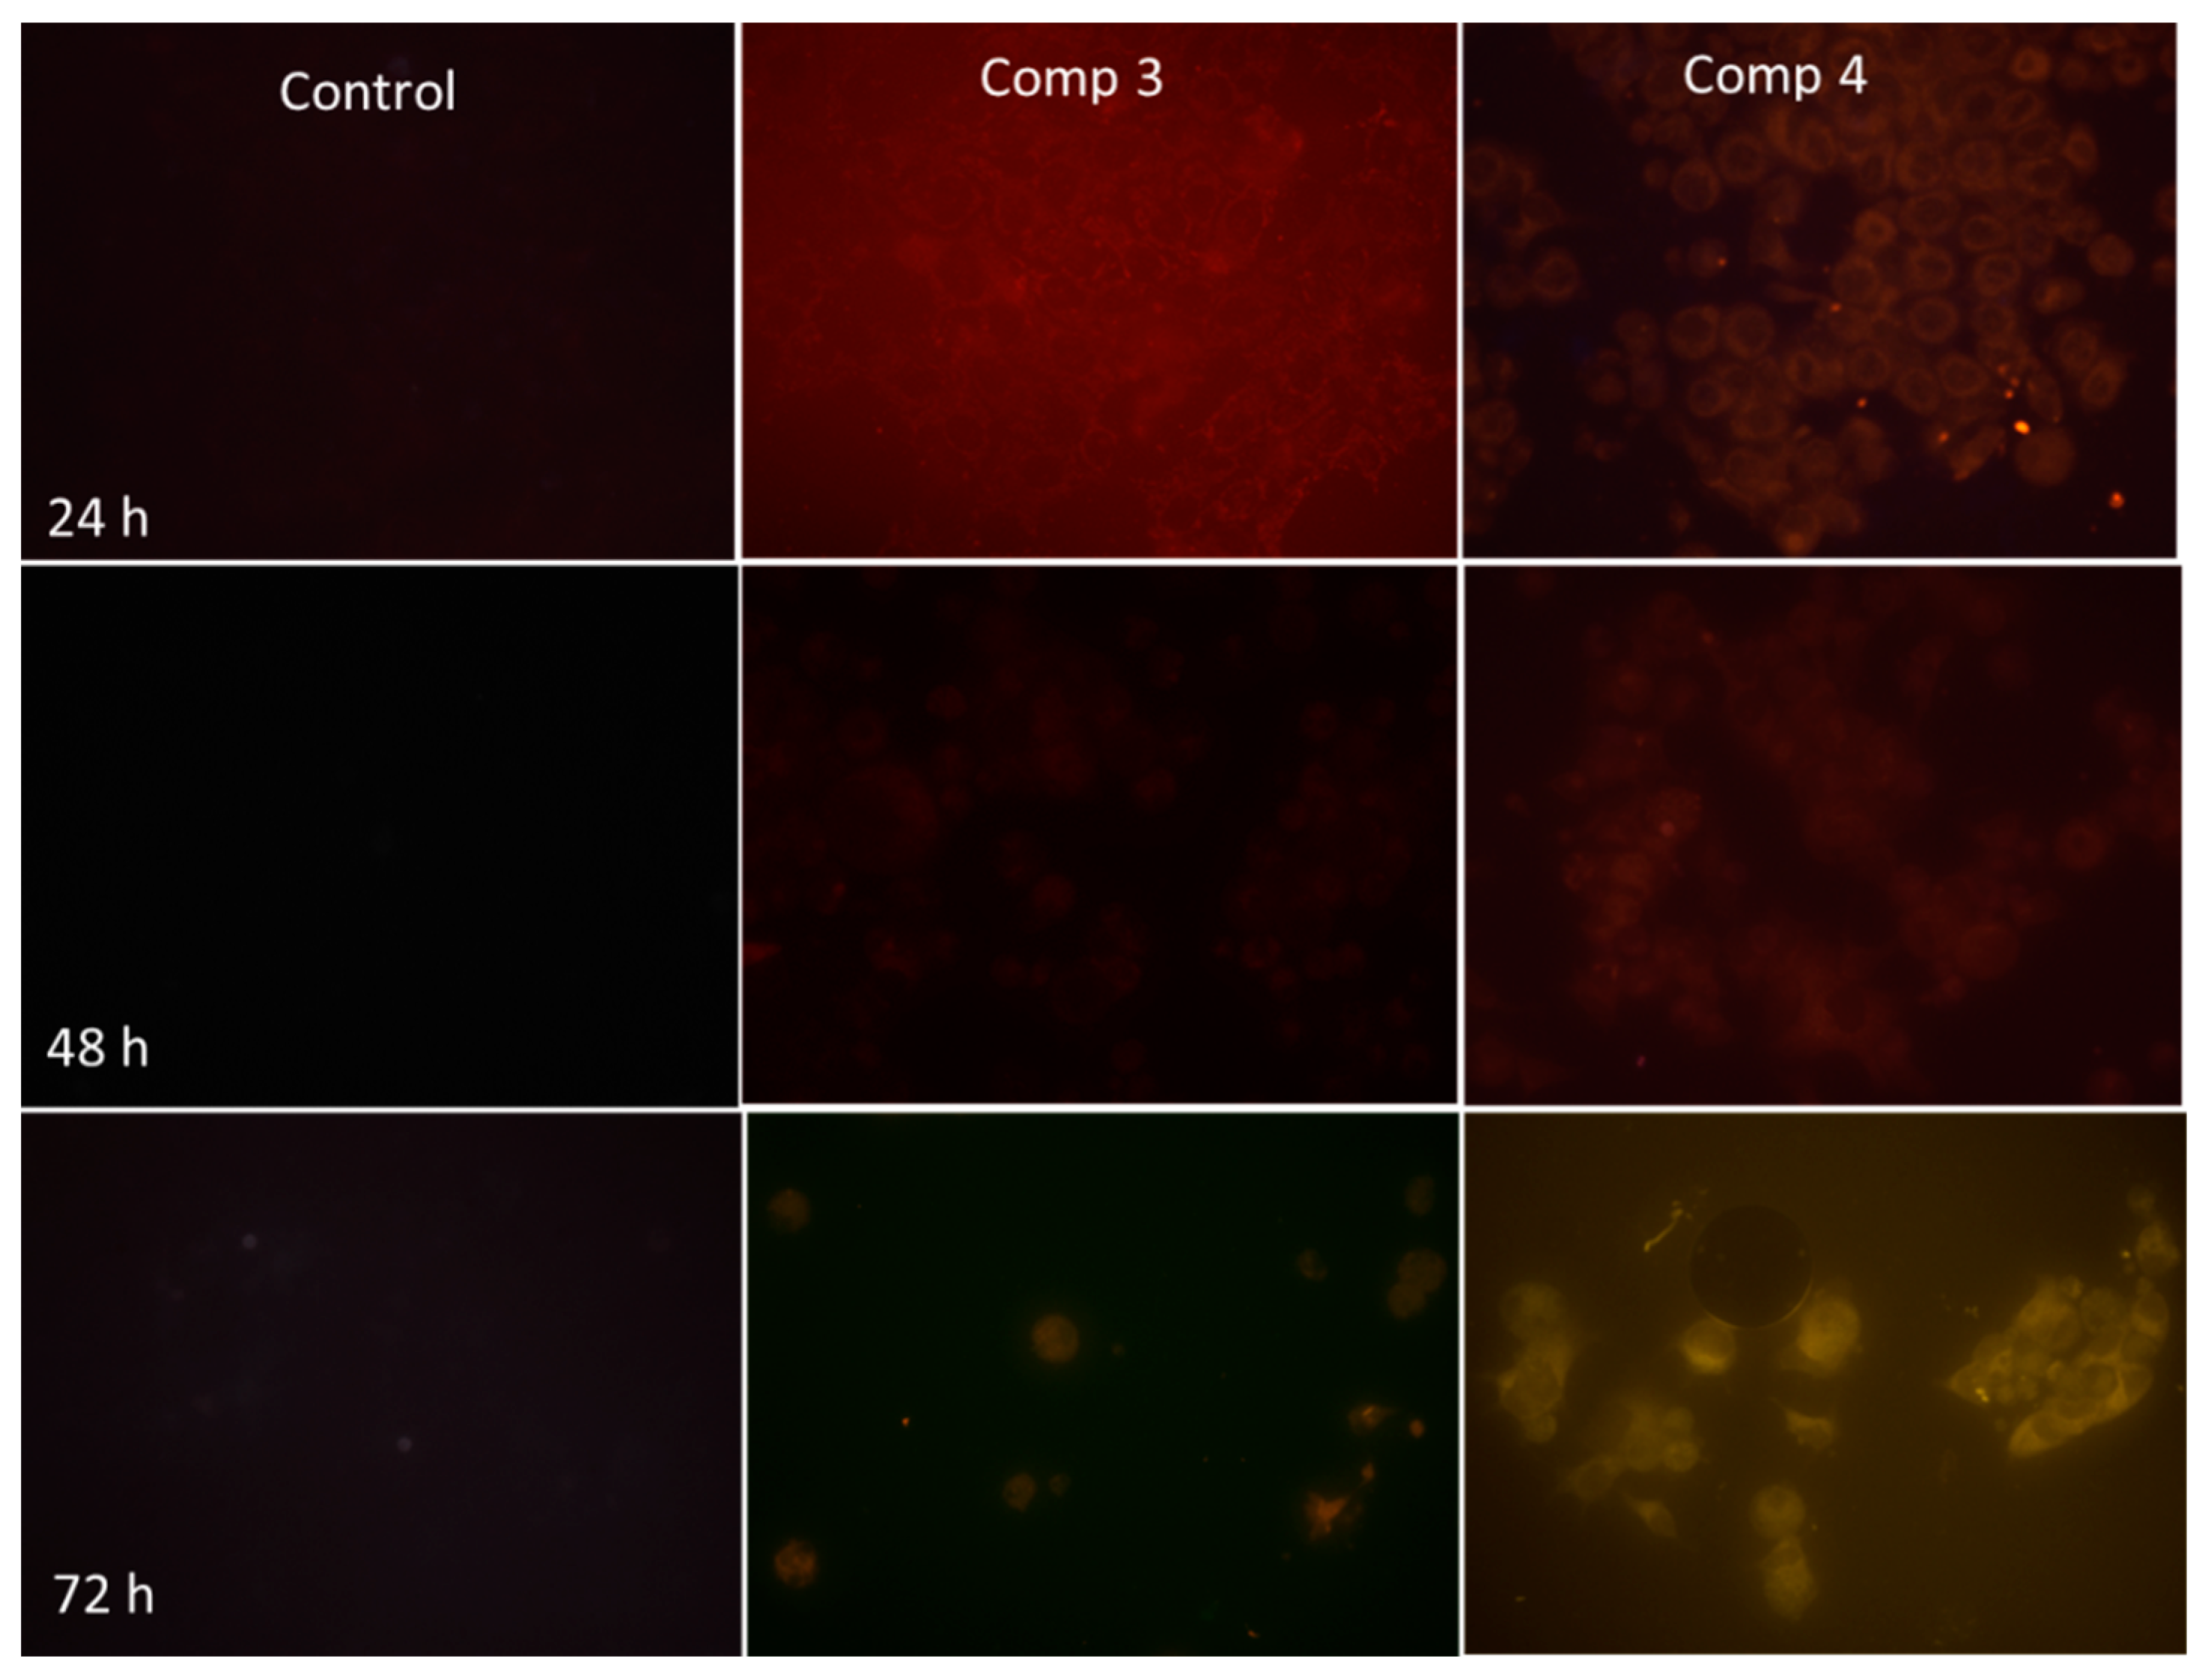
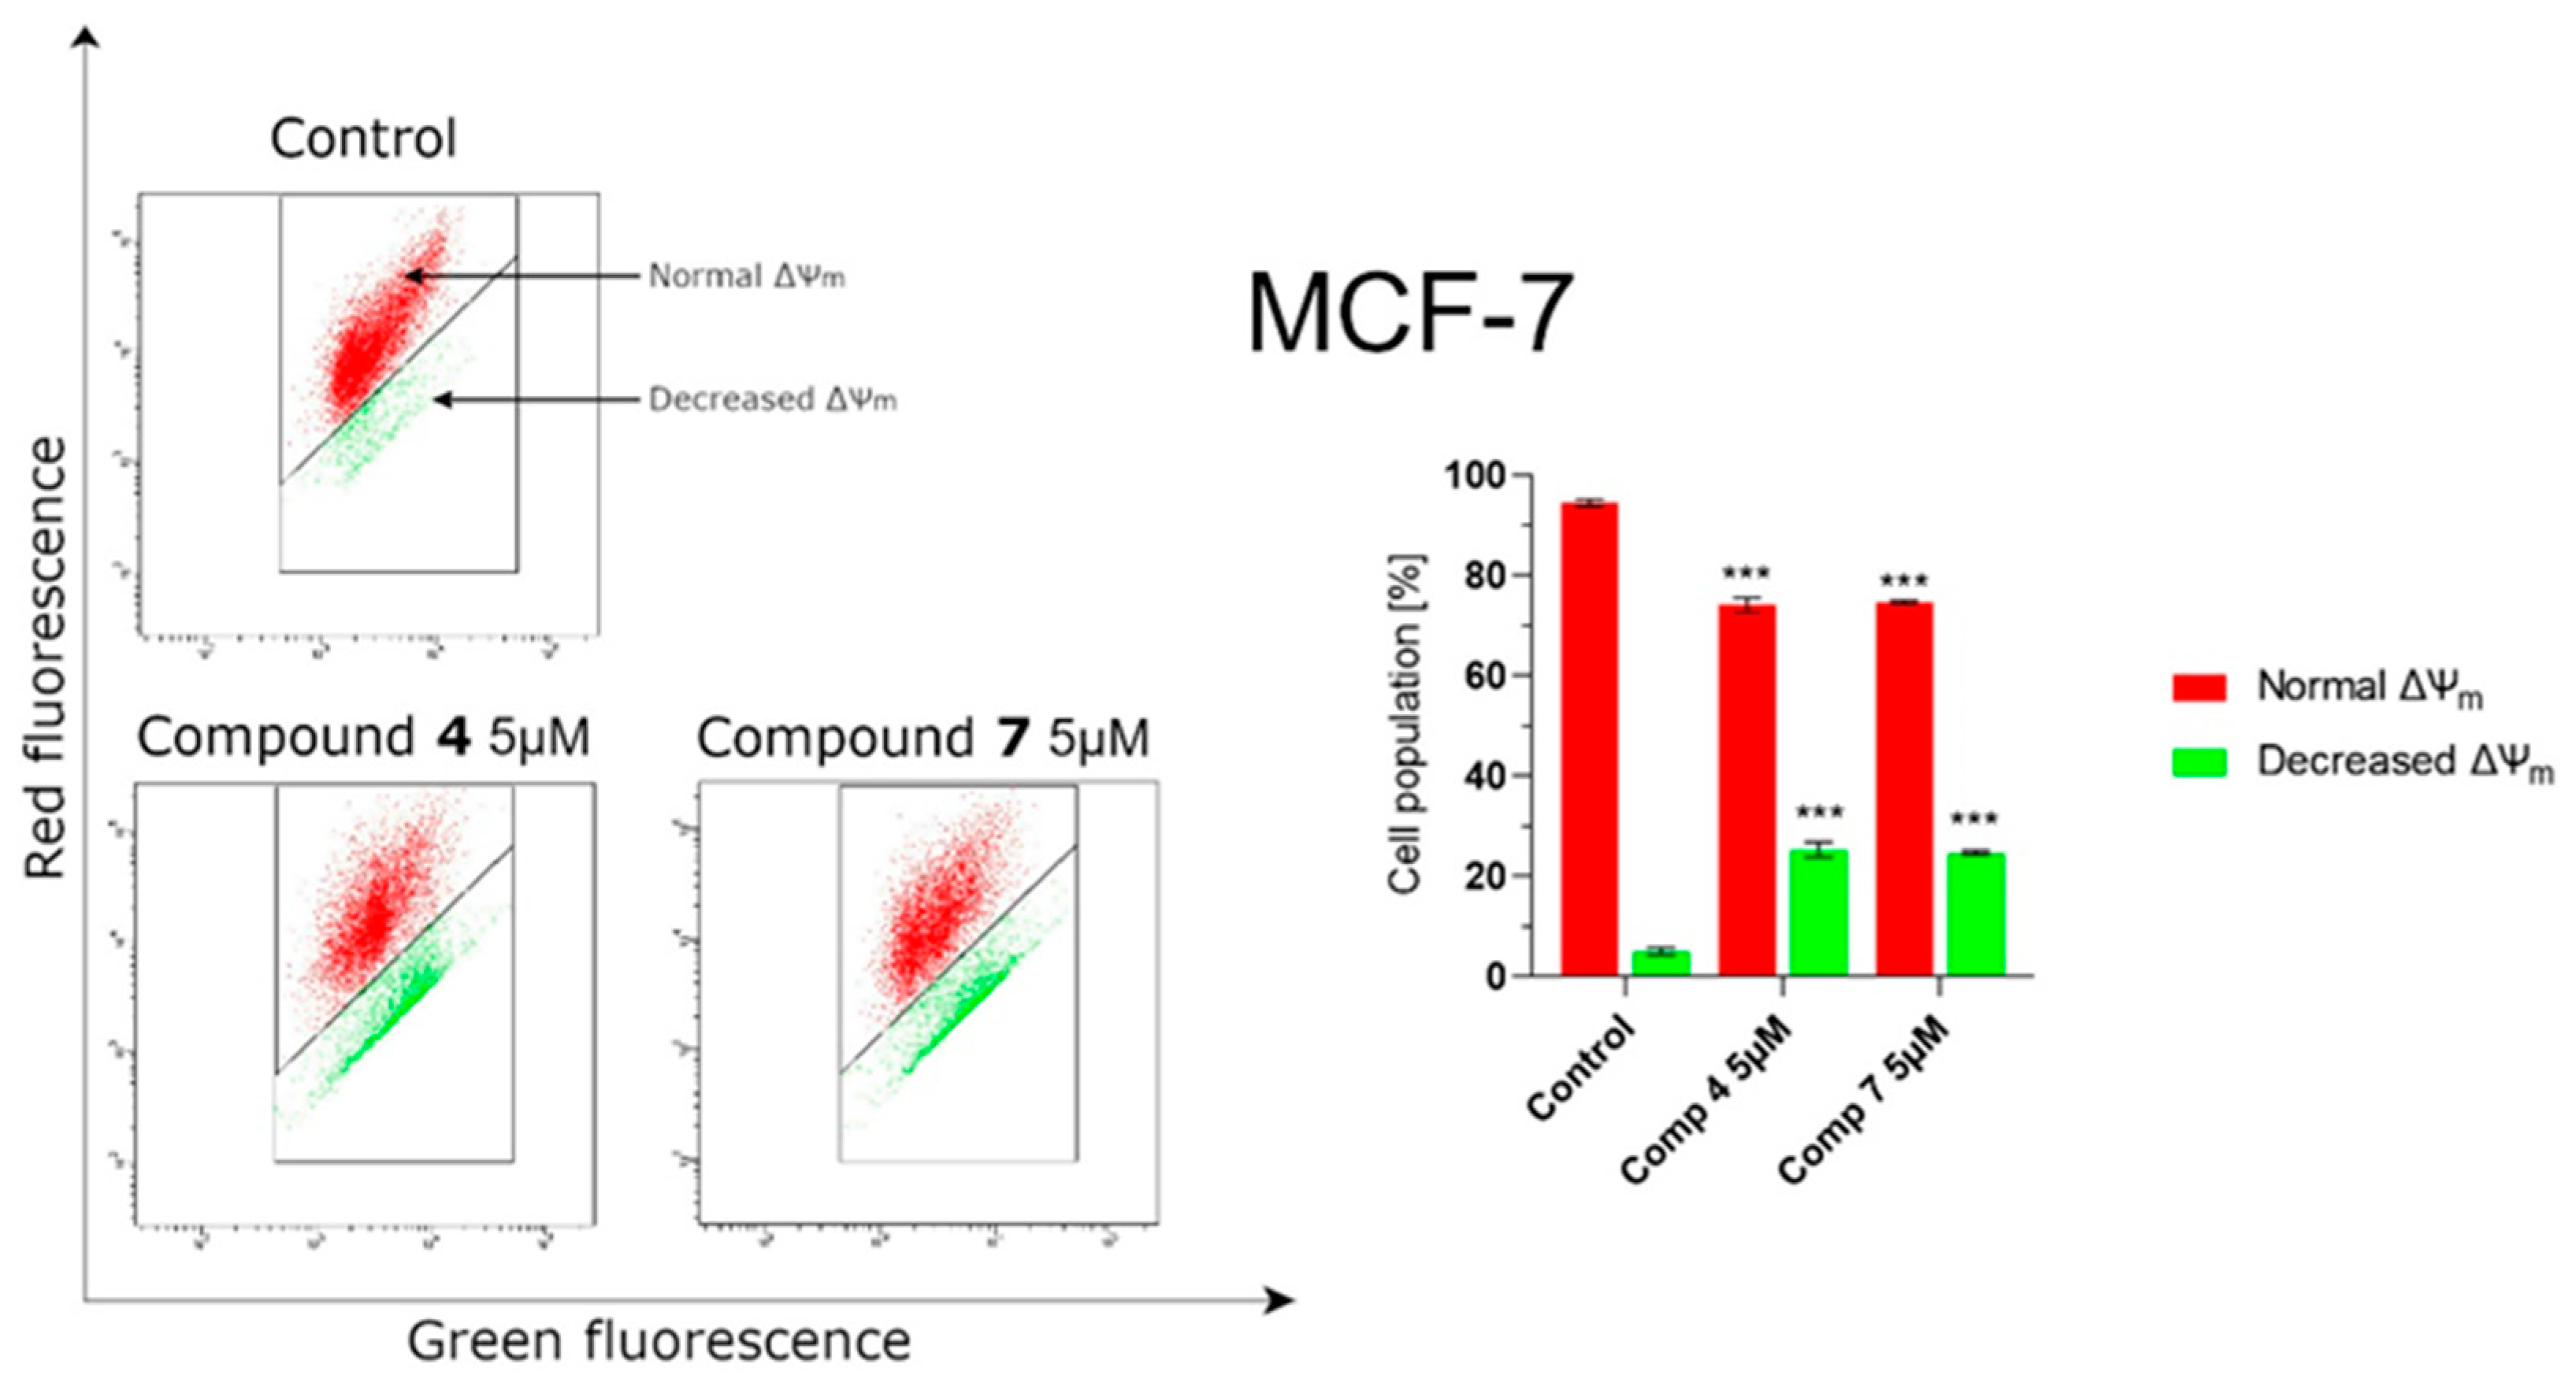
2.2.7. Novel Pyridine-Thiazole Hybrid Molecules Induce Apoptosis by Decreasing Mitochondrial Membrane Potential
2.2.8. PARP1 Inhibition in Treated Tumor Cells
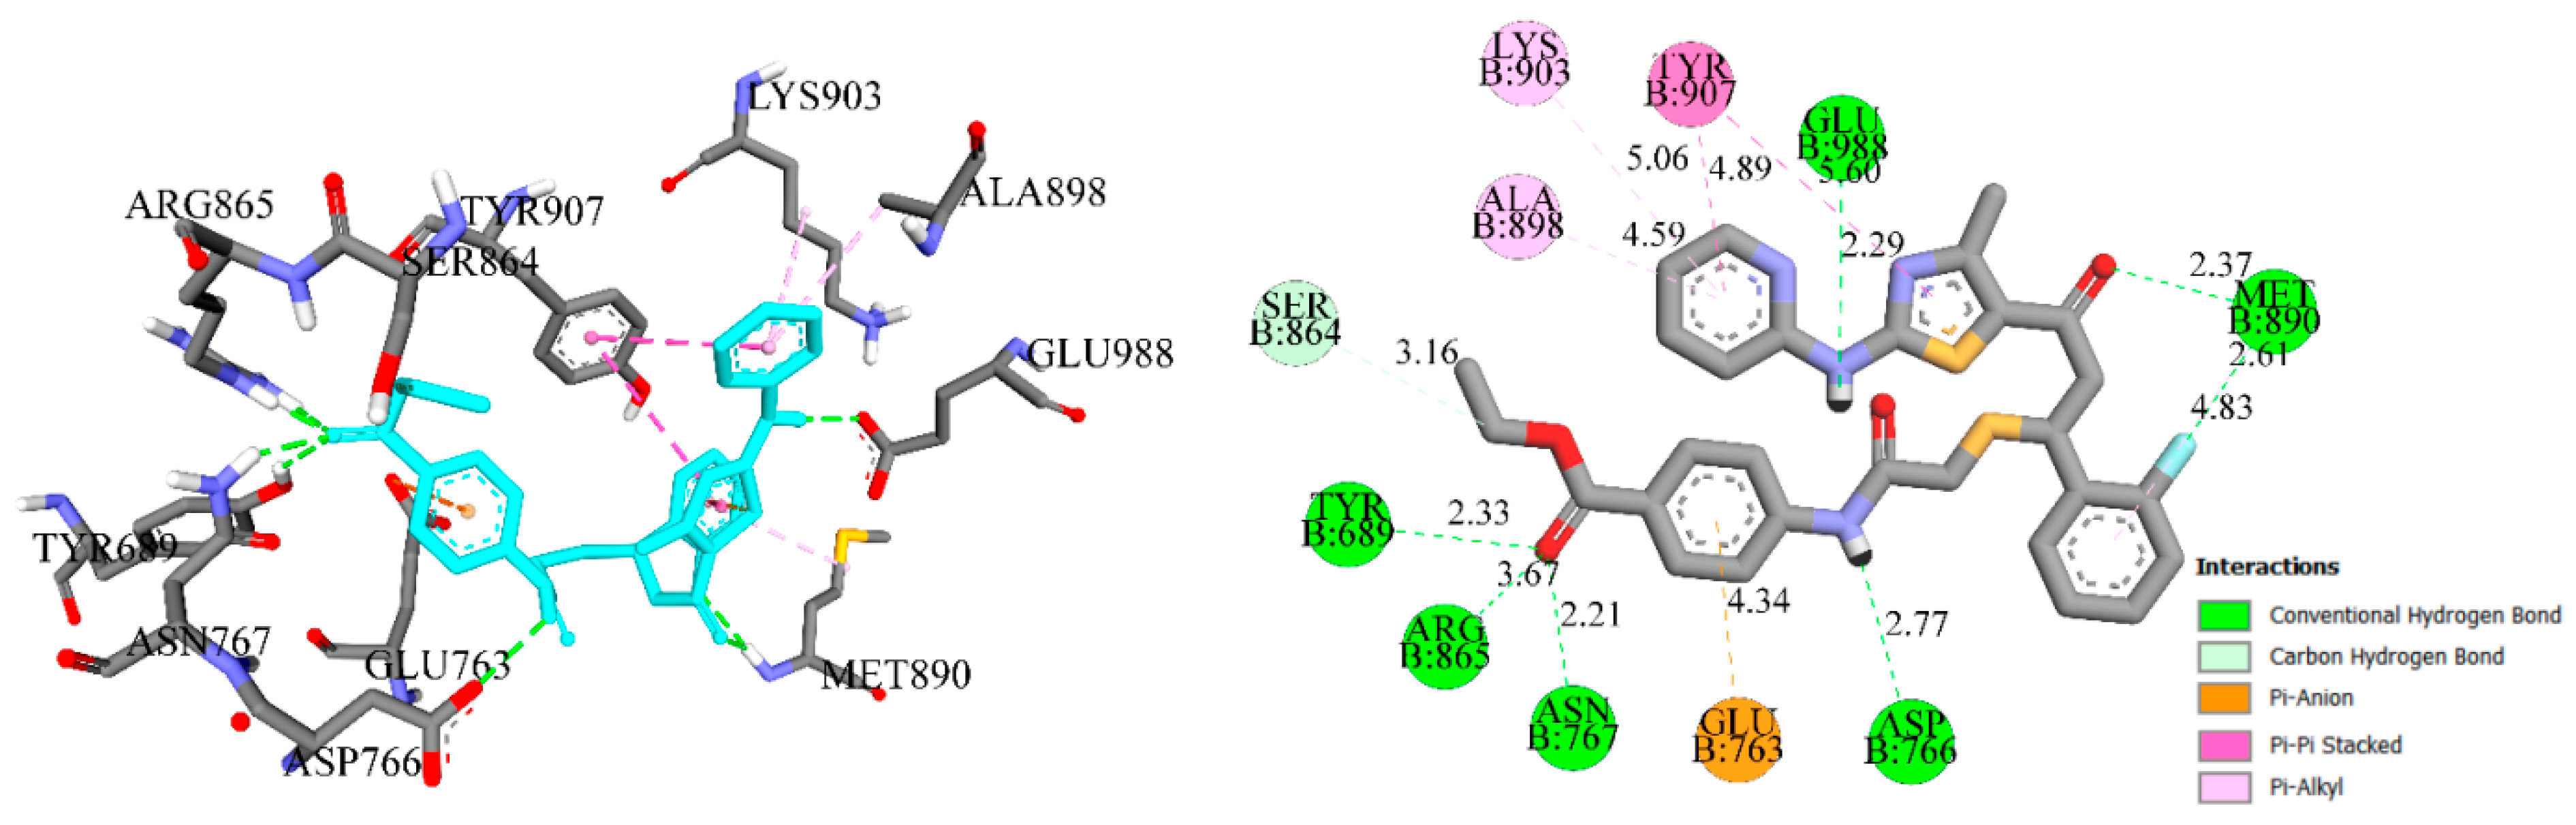
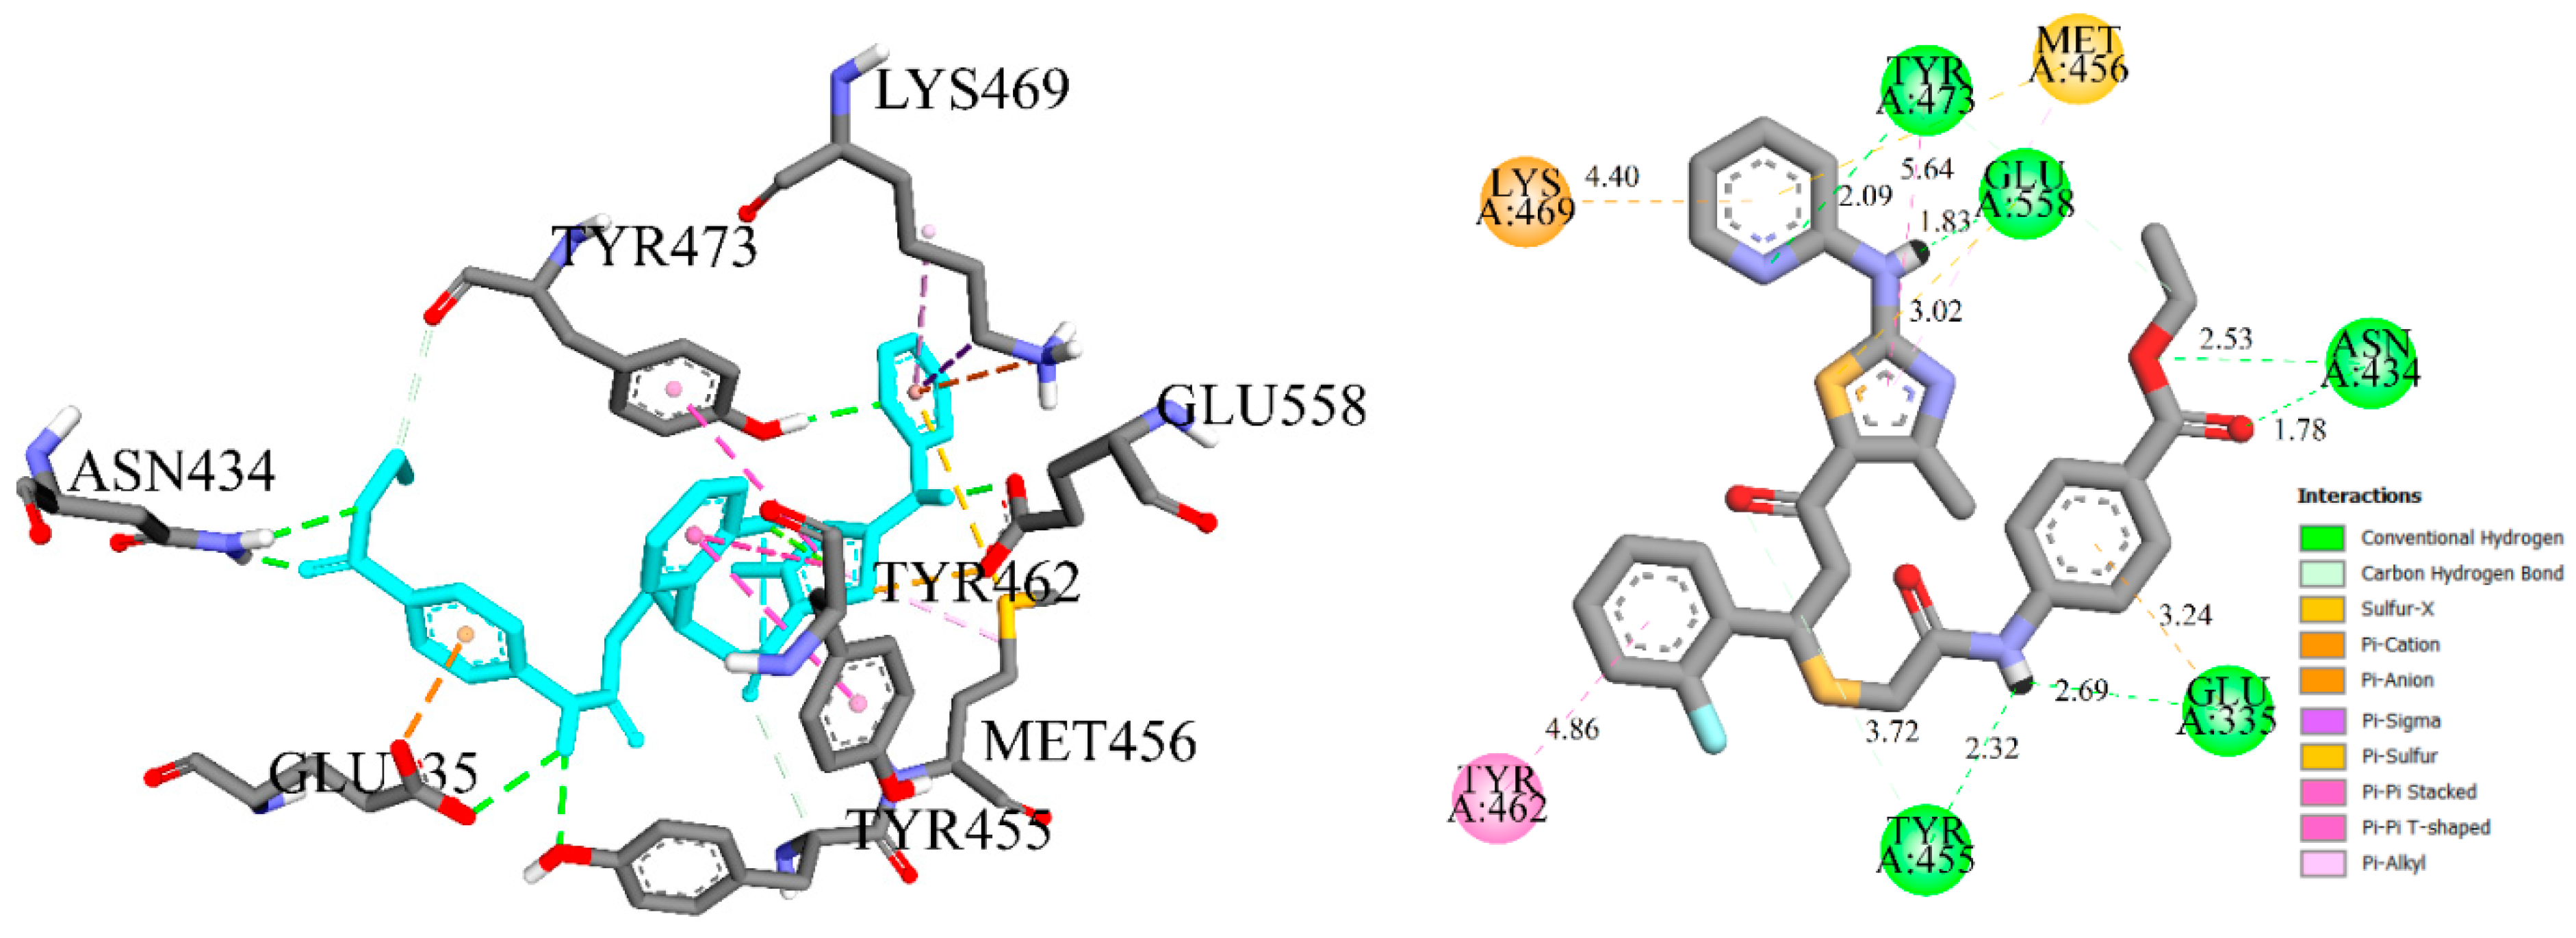
2.2.9. Molecular Docking Simulations
3. Materials and Methods
3.1. General Information
3.2. Synthesis of 1-[4-Methyl-2-(2-pyridylamino)thiazol-5-yl]ethanone (2)
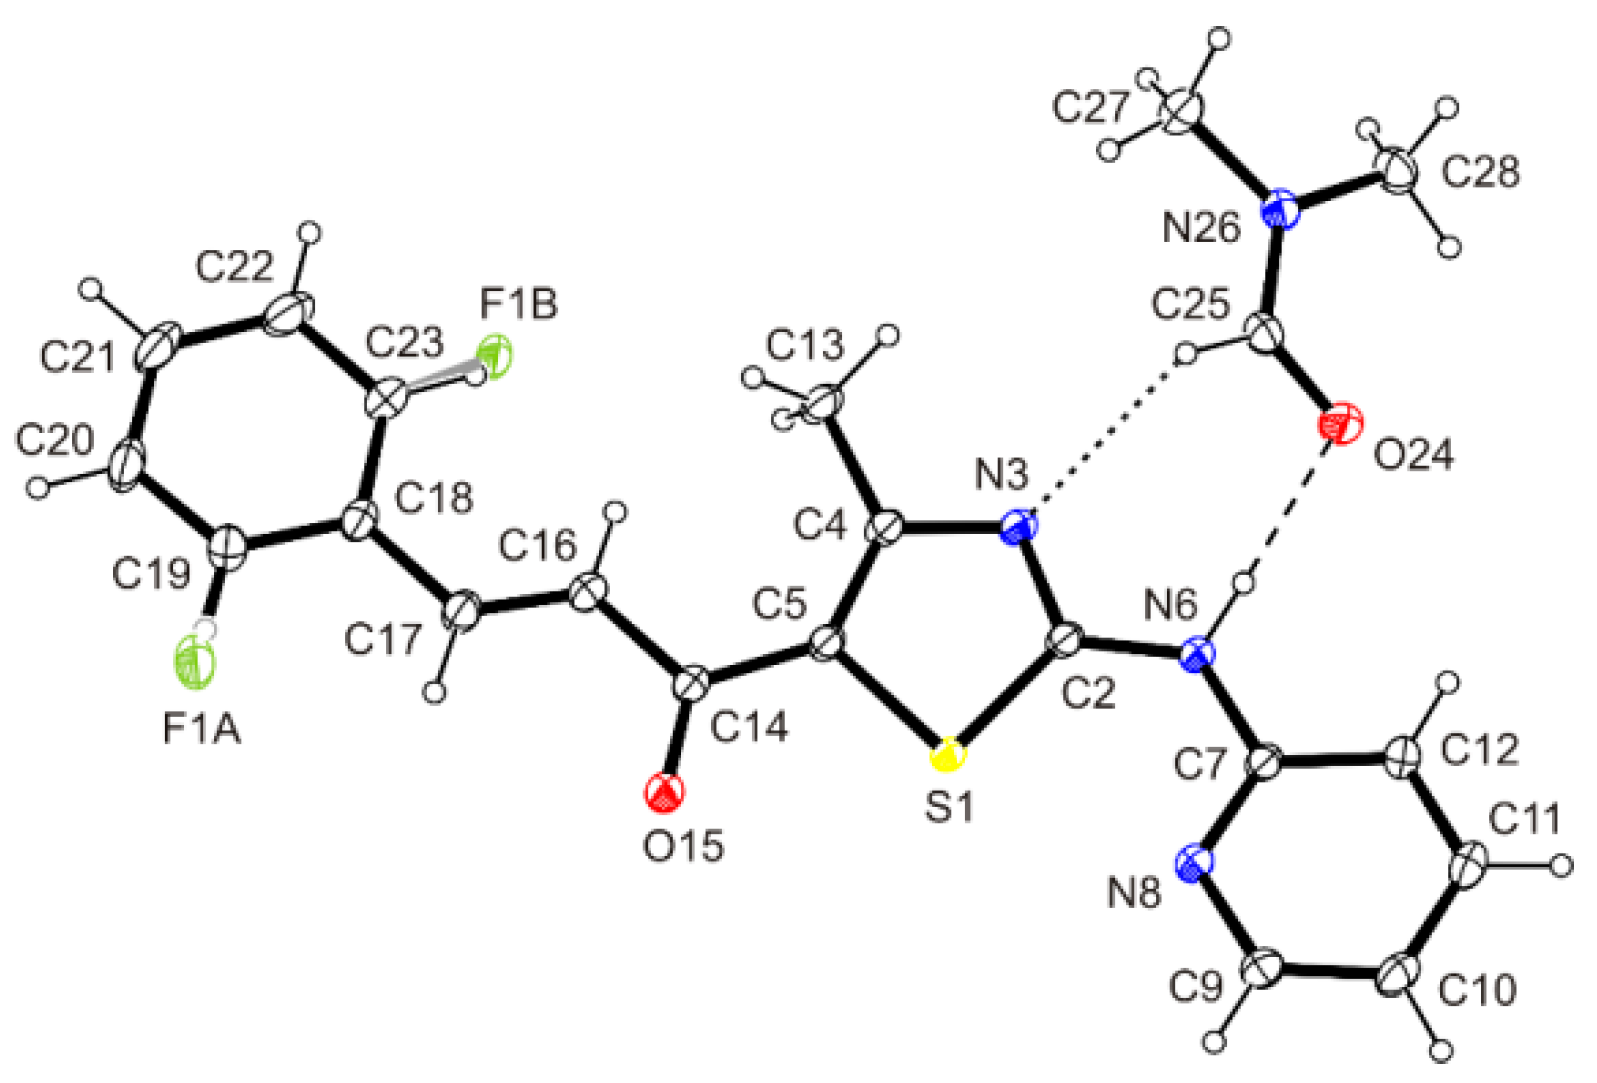
3.3. Synthesis of (E)-3-(2-Fluorophenyl)-1-[4-methyl-2-(2-pyridylamino)-thiazol-5-yl]-2-propen-1-one (3)
3.4. Synthesis of Ethyl 4-[[2-[1-(2-Fluorophenyl)-3-[4-methyl-2-(2-pyridylamino)thiazol-5-yl]-3-oxopropyl]sulfanylacetyl]amino]benzoate (4)
3.5. Synthesis of {5-[5-(2-Fluorophenyl)-4,5-dihydro-1H-pyrazol-3-yl]-4-methylthiazol-2-yl}-(pyridin-2-yl)-amine (5)
3.6. Synthesis of 1-{5-(2-Fluorophenyl)-3-[4-methyl-2-(2-pyridylamino)-thiazol-5-yl]-4,5-dihydropyrazol-1-yl}-ethanone (6)
3.7. Synthesis of (E)-3-(2-Fluorophenyl)-1-[4-methyl-2-(pyridin-1-ium-2-ylamino)thiazol-5-yl]-2-propen-1-one Methanesulfonate (7)
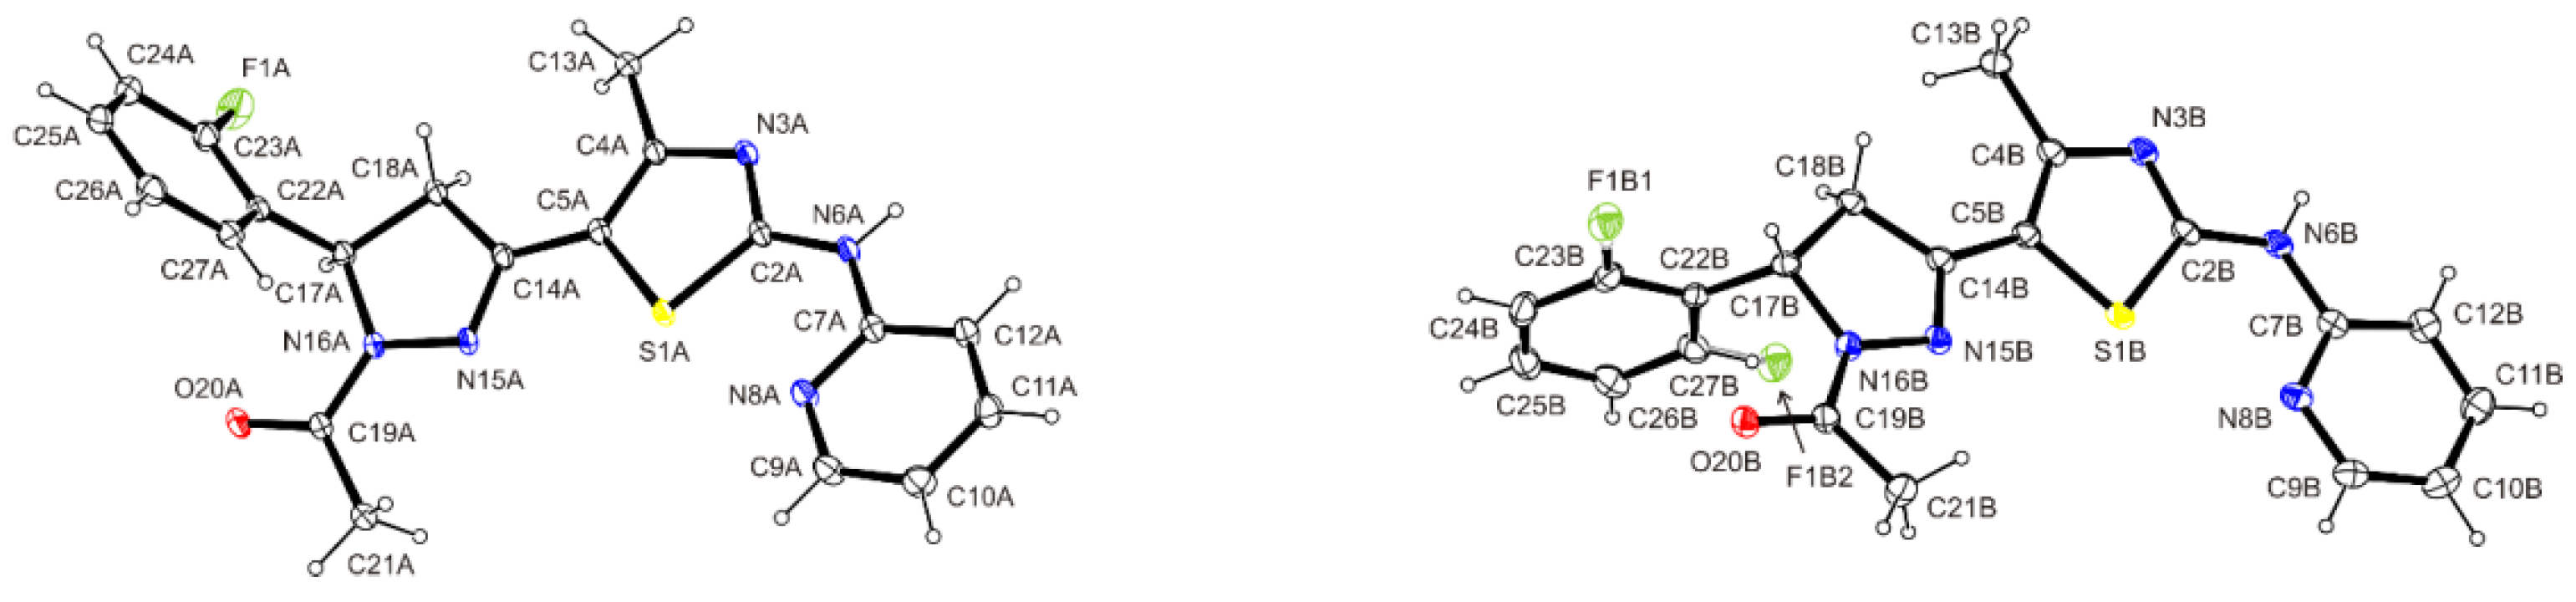
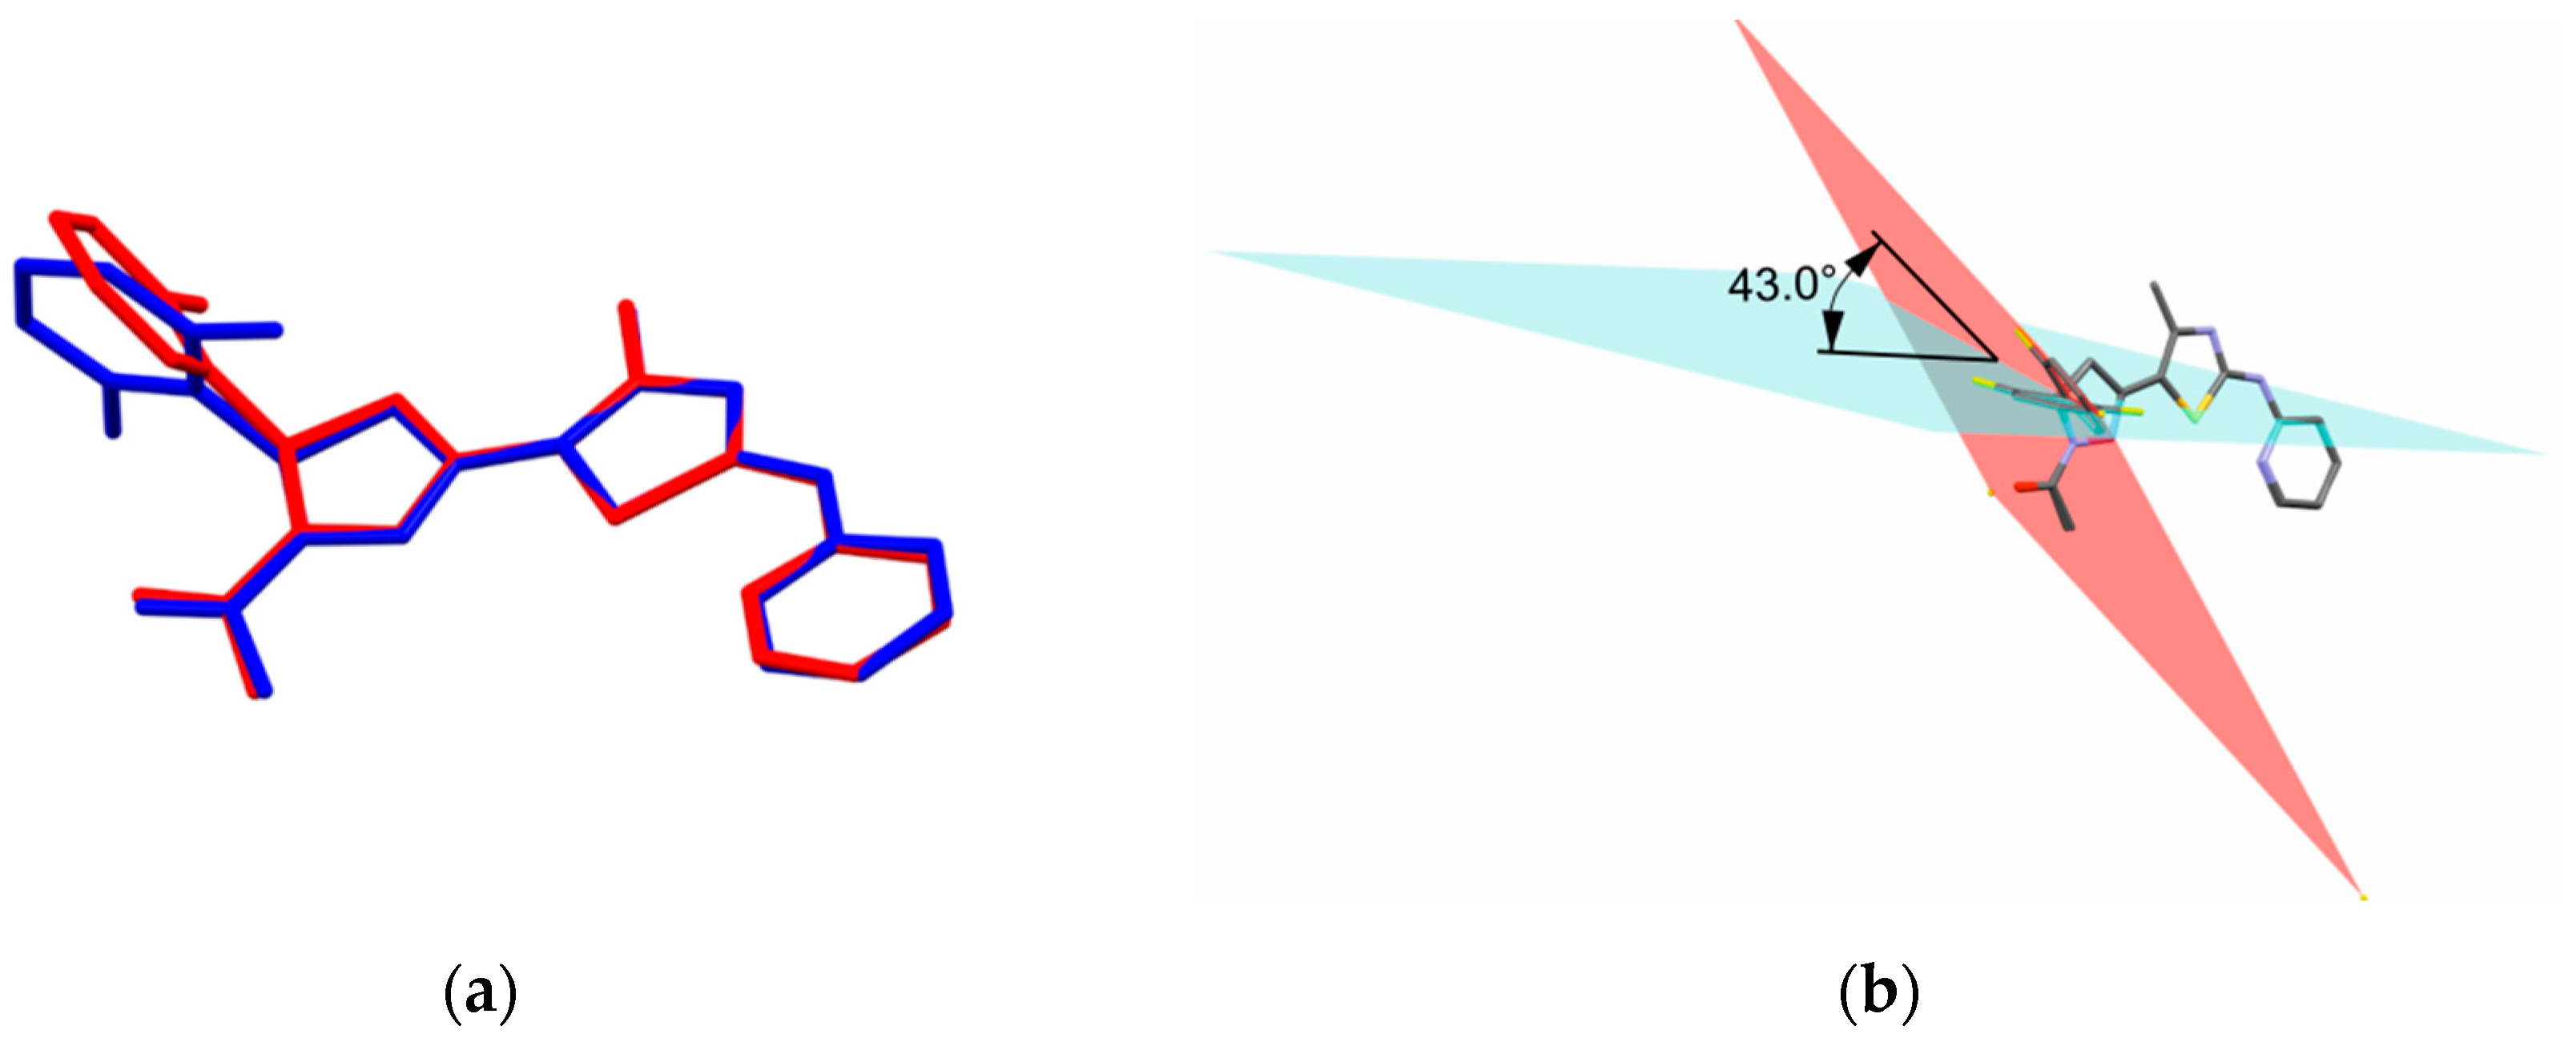
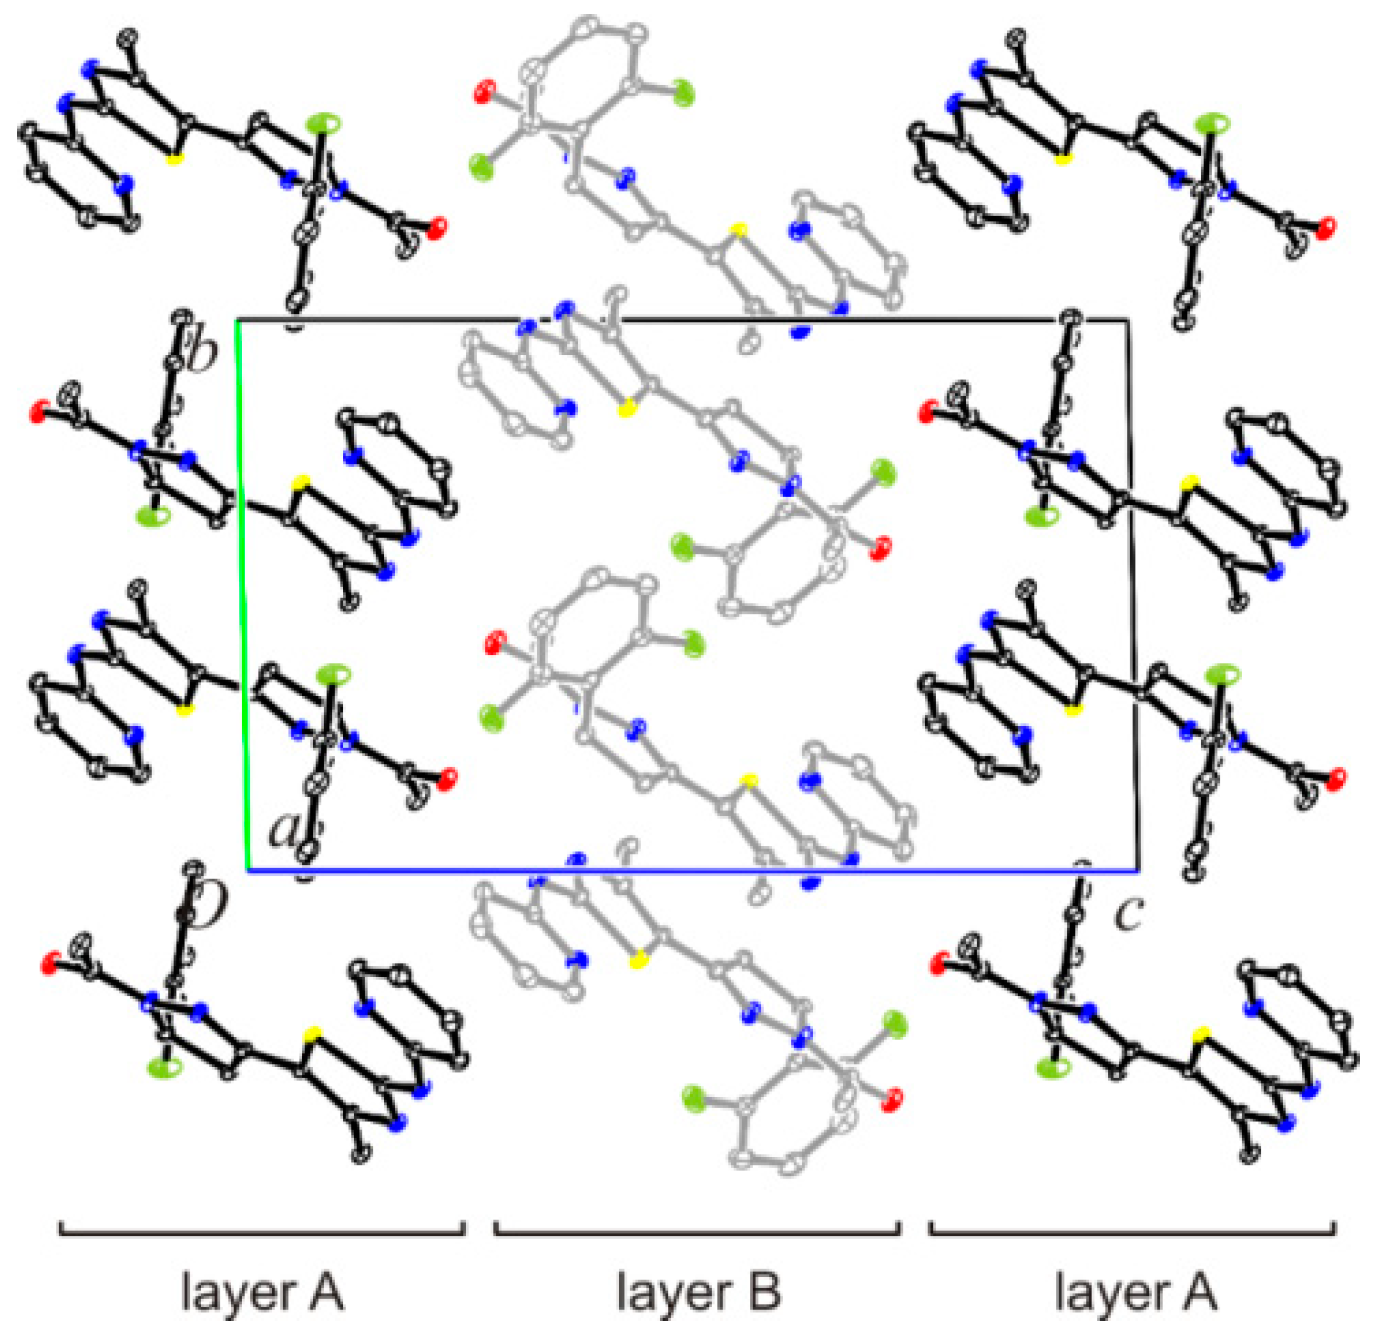
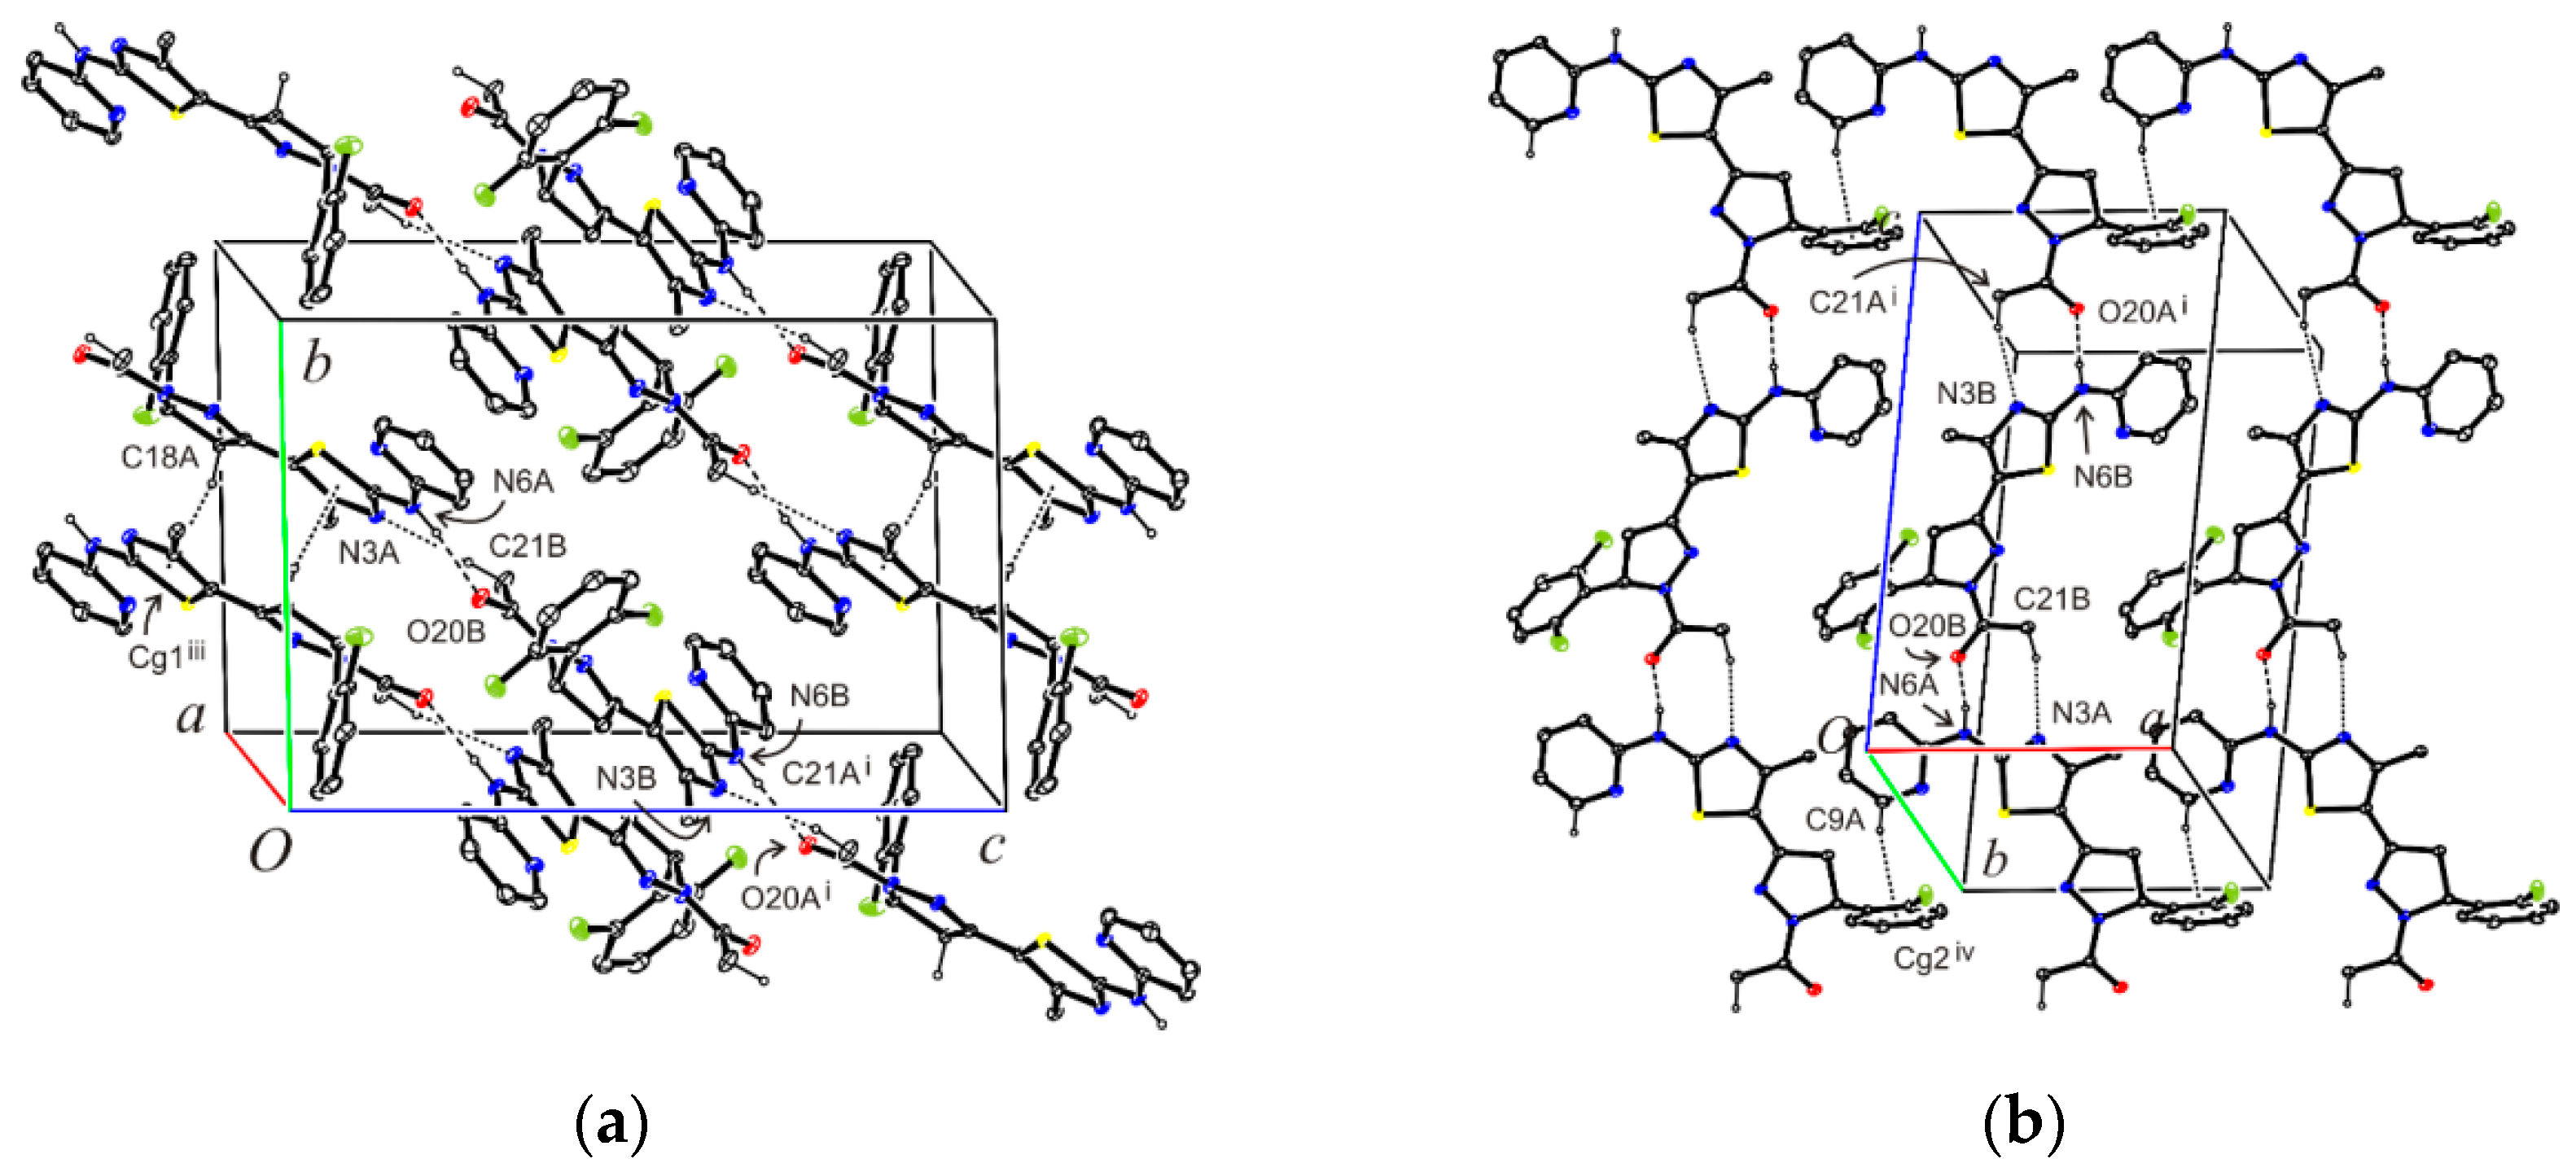
3.8. Crystal Structure Determination of (E)-3-(2-Fluorophenyl)-1-[4-methyl-2-(2-pyridylamino)-thiazol-5-yl]-2-propen-1-one Dimethylaminoformamide Solvate (3*DMF) and 1-{5-(2-fluorophenyl)-3-[4-methyl-2-(2-pyridylamino)-thiazol-5-yl]-4,5-dihydropyrazol-1-yl}-ethanone (6)
3.9. In Vitro Evaluation of the Anticancer Activity According to the DTP NCI Protocol
3.10. Application of MTT Assay for Measuring Cells Viability
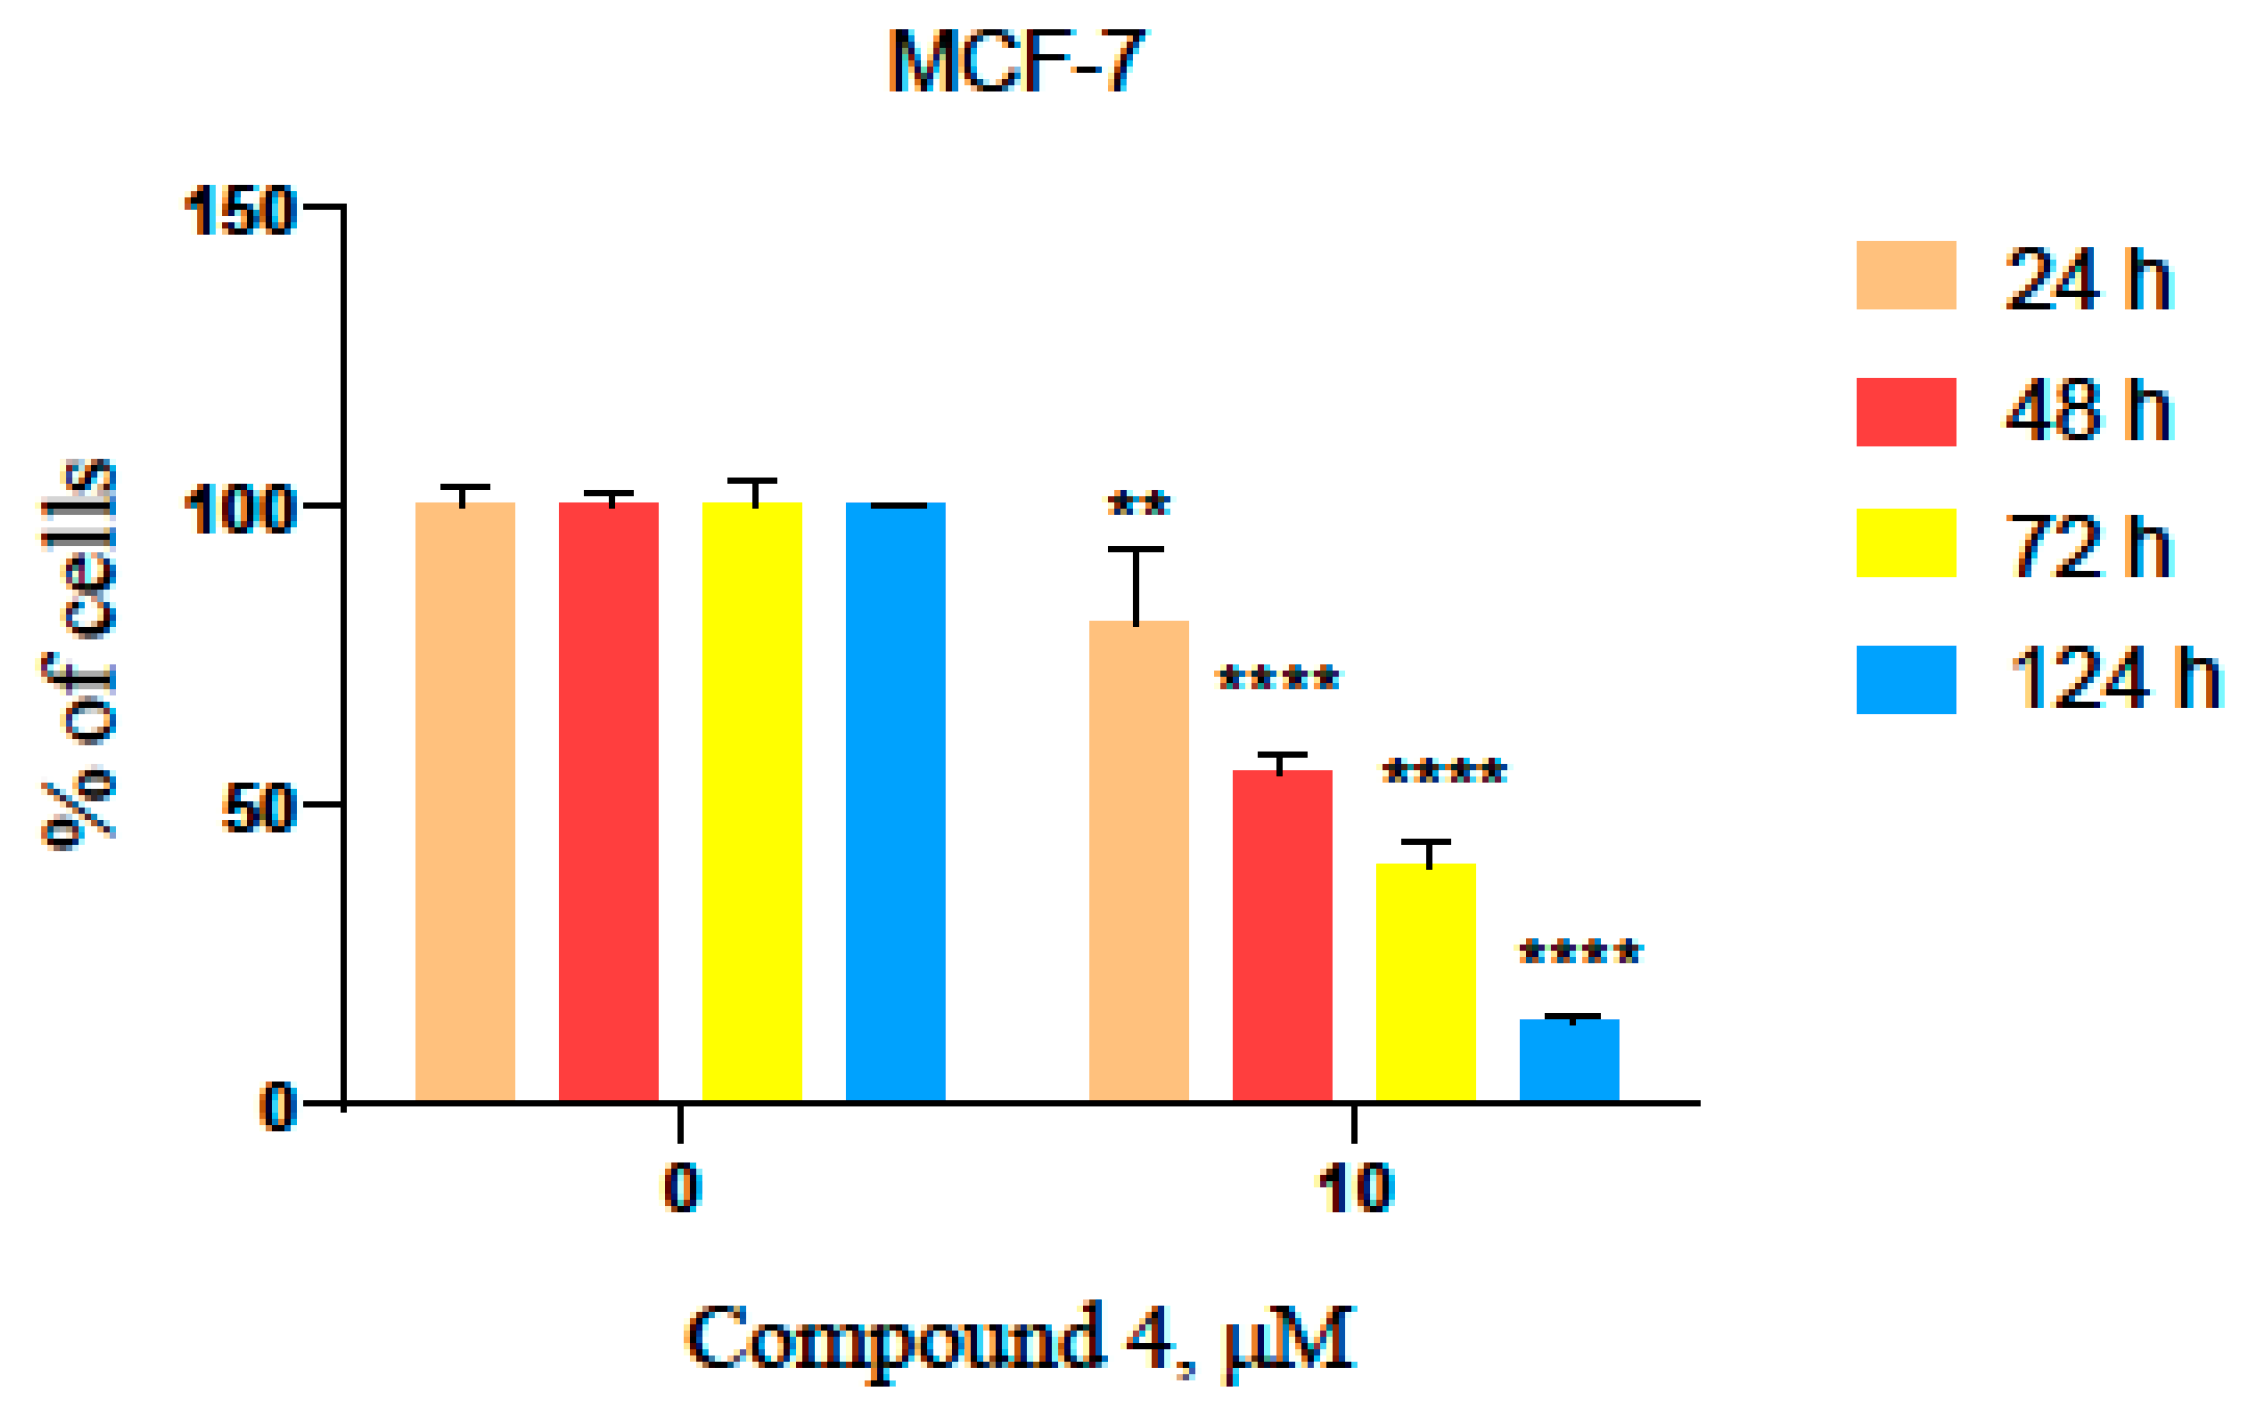
3.11. Time-Dependent Viability Test in the MCF-7 Cell Line
3.12. Clonogenic Assay
3.13. Soft Agar Drug Sensitivity Assay
3.14. Application of Fluorescent Microscopy for Investigation of Morphological Changes in the KB3-1 Cells
3.15. Spectroscopic Assay for Measuring the Ability of Compounds to Act on DNA
− A405 nm of the Control (time, min) − A405 mm of the Control (zero min)
3.16. Annexin V Binding Assay
3.17. Determination of Mitochondrial Membrane Potential (MMP)
3.18. PARP-1 Inhibition In Vitro
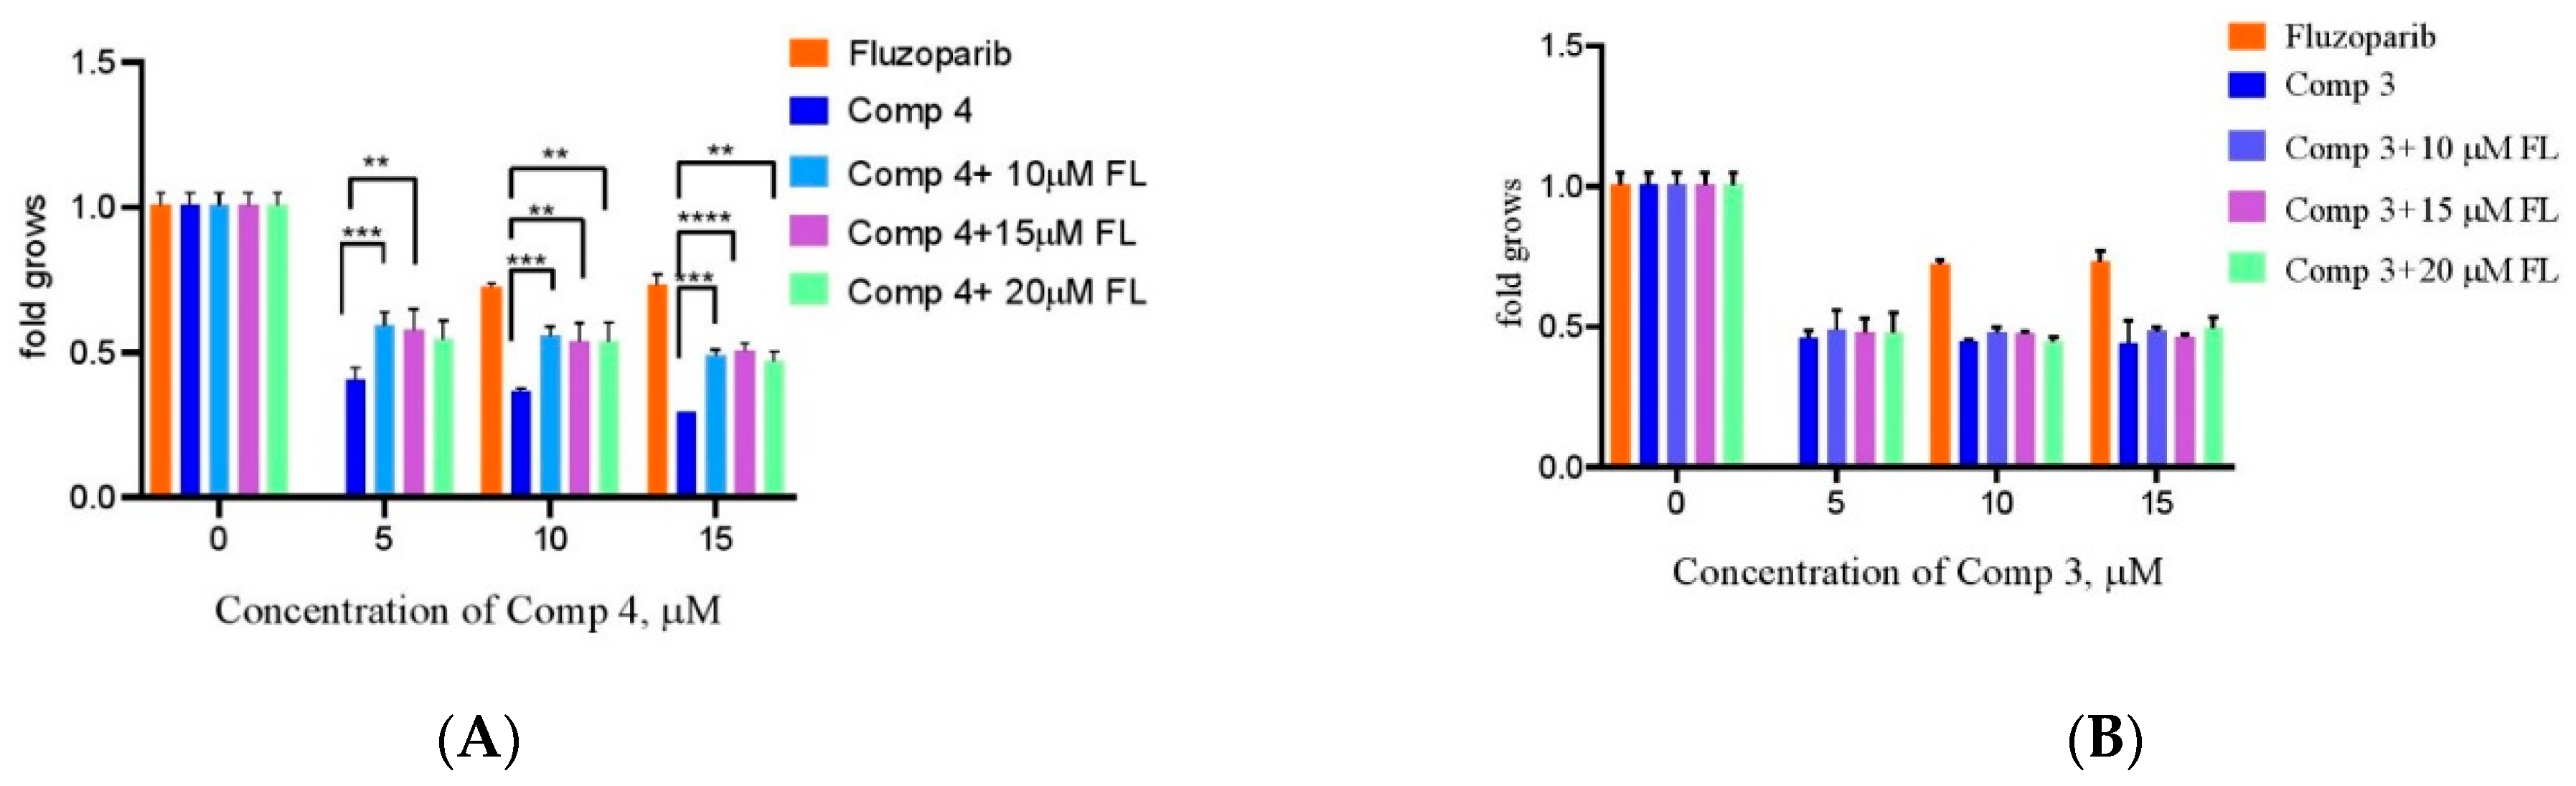
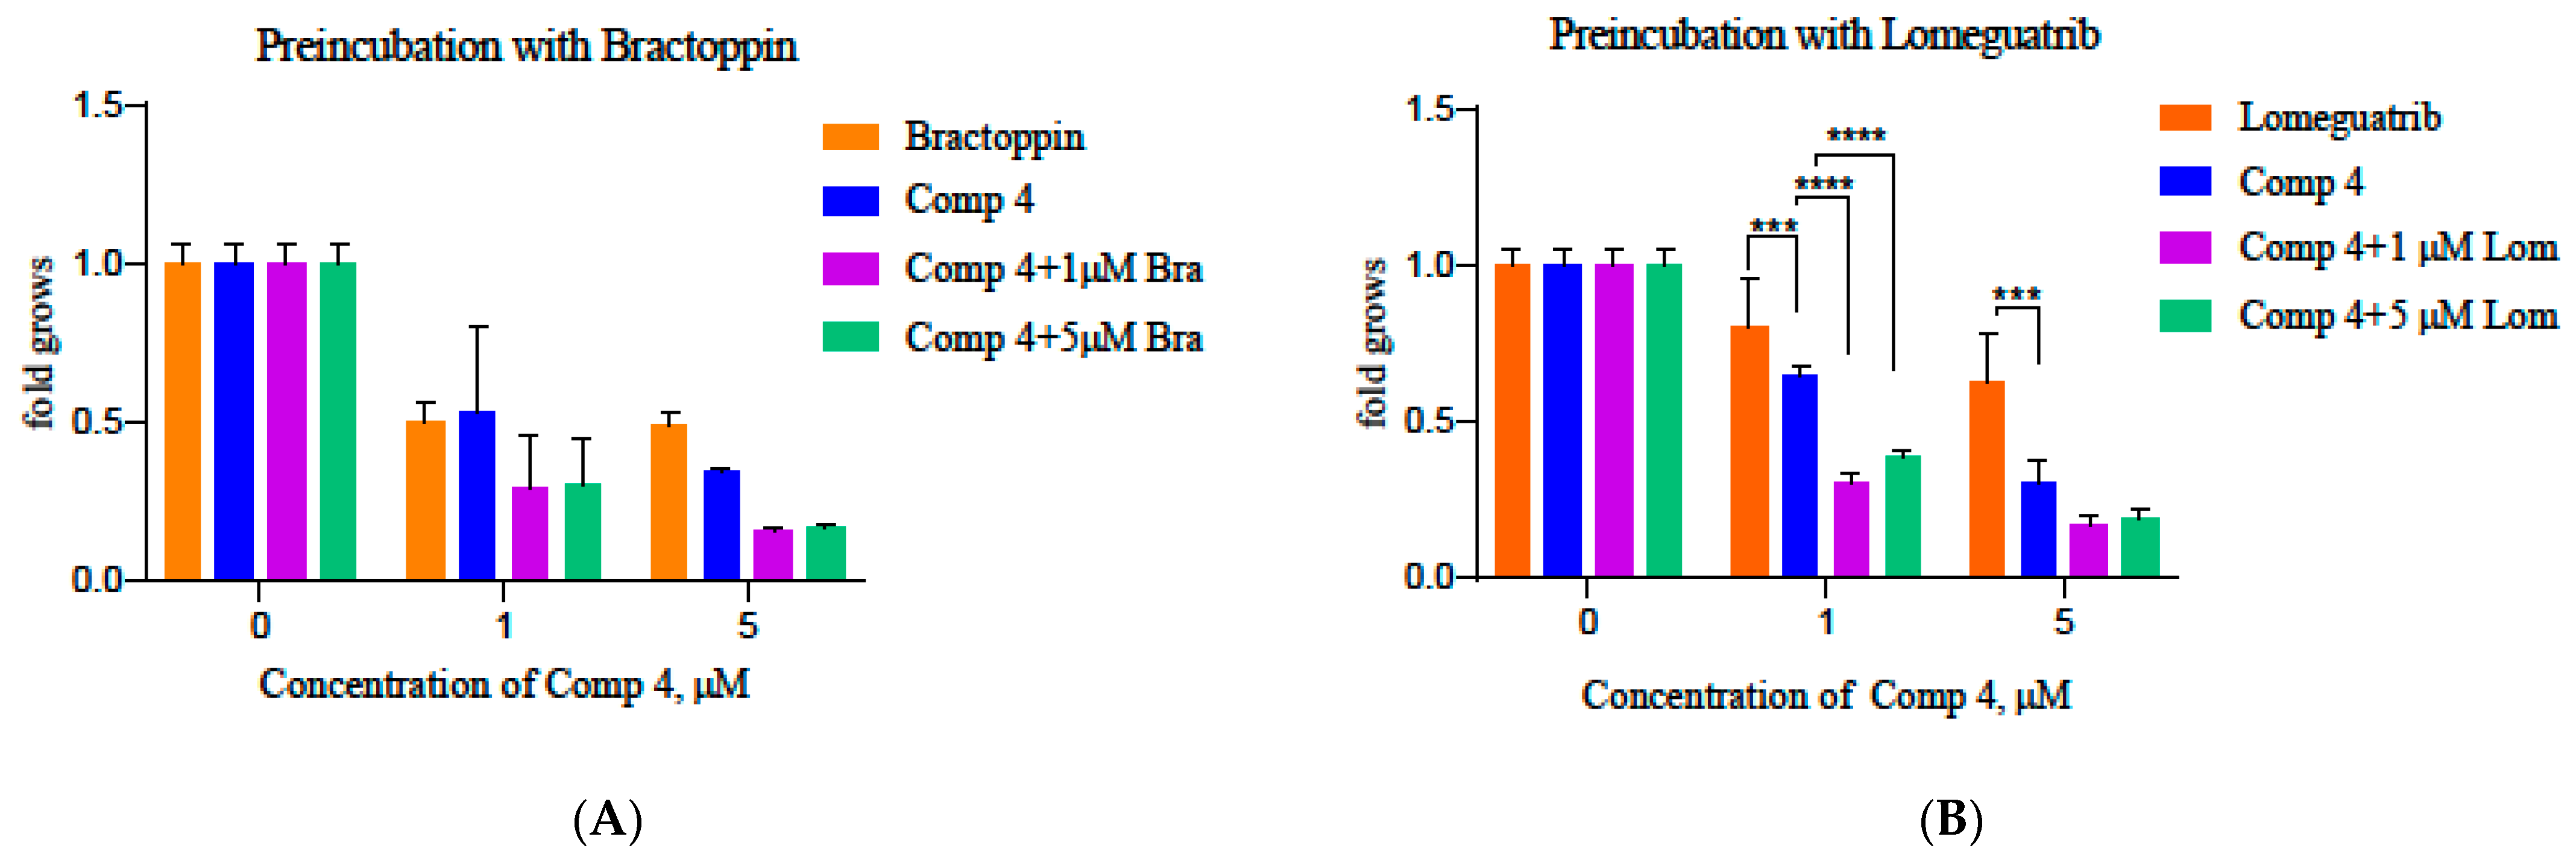
3.19. Study of Chemical Synthetic Lethality for Breast cAncer: New Synthesized PARP1 Inhibitor 4 Combined with BRCA1 and MGMT Inhibitors
3.20. Statistical Data Analysis
3.21. Molecular Docking Studies
4. Conclusions
Supplementary Materials
Author Contributions
Funding
Institutional Review Board Statement
Informed Consent Statement
Data Availability Statement
Acknowledgments
Conflicts of Interest
Sample Availability
References
- Topatana, W.; Juengpanich, S.; Li, S.; Cao, J.; Hu, J.; Lee, J.; Suliyanto, K.; Ma, D.; Zhang, B.; Chen, M.; et al. Advances in synthetic lethality for cancer therapy: Cellular mechanism and clinical translation. J. Hematol. Oncol. 2020, 13, 18. [Google Scholar] [CrossRef] [PubMed]
- Pan, P.; Capistrano, R.; De Potter, A.; Vandeborne, L.; Bouche, G. An Open Access Database of Licensed Cancer Drugs. Front. Pharmacol. 2021, 12, 627574. [Google Scholar] [CrossRef]
- Arkin, M. Protein-protein interactions and cancer: Small molecules going in for the kill. Curr. Opin. Chem. Biol. 2005, 9, 317–324. [Google Scholar] [CrossRef]
- Whitesell, L.; Mimnaugh, E.G.; De Costa, B.; Myers, C.E.; Neckers, L.M. Inhibition of heat shock protein HSP90-pp60v-src heteroprotein complex formation by benzoquinone ansamycins: Essential role for stress proteins in oncogenic transformation. Proc. Natl. Acad. Sci. USA 1994, 91, 8324–8328. [Google Scholar] [CrossRef] [PubMed]
- Lin, J.H. Pharmacokinetics of biotech drugs: Peptides, proteins and monoclonal antibodies. Curr. Drug Metab. 2009, 10, 661–691. [Google Scholar] [CrossRef]
- Esteva, F.J. Monoclonal antibodies, small molecules, and vaccines in the treatment of breast cancer. Oncologist 2004, 9, 4–9. [Google Scholar] [CrossRef] [PubMed]
- Basile, L.; Pignatello, R.; Passirani, C. Active targeting strategies for anticancer drug nanocarriers. Curr. Drug Deliv. 2012, 9, 255–268. [Google Scholar] [CrossRef]
- Gomha, S.M.; Farghaly, T.A.; Alqurashi, N.T.; Abdou, H.Y.; Mousa, E.K. Synthesis, molecular docking and anticancer evaluation of new arylazothiazoles. Curr. Org. Synth. 2017, 14, 620–631. [Google Scholar] [CrossRef]
- Ibrar, A.; Tehseen, Y.; Khan, I.; Hameed, A.; Saeed, A.; Furtmann, N.; Bajorath, J.; Iqbal, J. Coumarin-thiazole and -oxadiazole derivatives: Synthesis, bioactivity and docking studies for aldose/aldehyde reductase inhibitors. Bioorganic Chem. 2016, 68, 177–186. [Google Scholar] [CrossRef] [PubMed]
- Ge, L.; Hu, Q.; Shi, M.; Yang, H.; Zhu, G. Design and discovery of novel thiazole derivatives as potential MMP inhibitors to protect against acute lung injury in sepsis rats via attenuation of inflammation and apoptotic oxidative stress. RSC Adv. 2017, 7, 32909–32922. [Google Scholar] [CrossRef] [Green Version]
- Patel, S.; Patle, R.; Parameswaran, P.; Jain, A.; Shard, A. Design, computational studies, synthesis and biological evaluation of thiazole-based molecules as anticancer agents. Eur. J. Pharm. Sci. 2019, 134, 20–30. [Google Scholar] [CrossRef]
- Anh, D.T.; Hai, P.T.; Park, E.J.; Jun, H.W.; Kang, J.S.; Kwon, J.H.; Anh, V.T.; Han, S.B.; Nam, N.H. Exploration of certain 1,3-oxazole-and 1,3-thiazole-based hydroxamic acids as histone deacetylase inhibitors and antitumor agents. Bioorganic Chem. 2020, 101, 103988. [Google Scholar] [CrossRef] [PubMed]
- Shen, X.; Zhao, L.; Chen, P.; Gong, Y.; Liu, D.; Zhang, X.; Dai, L.; Sun, Q.; Lou, J.; Jin, Z.; et al. A thiazole-derived oridonin analogue exhibits antitumor activity by directly and allosterically inhibiting STAT3. J. Biol. Chem. 2019, 294, 17471–17486. [Google Scholar] [CrossRef]
- Hu, C.M.; Zhu, J.; Guo, X.E.; Chen, W.; Qiu, X.L.; Ngo, B.; Chien, R.; Wang, Y.V.; Tsai, C.Y.; Wu, G.; et al. Novel small molecules disrupting Hec1/Nek2 interaction ablate tumor progression by triggering Nek2 degradation through a death-trap mechanism. Oncogene 2015, 34, 1220–1230. [Google Scholar] [CrossRef] [PubMed]
- Hay, M.P.; Turcotte, S.; Flanagan, J.U.; Bonnet, M.; Chan, D.A.; Sutphin, P.D.; Nguyen, P.; Giaccia, A.J.; Denny, W.A. 4-Pyridylanilinothiazoles that selectively target von Hippel− Lindau deficient renal cell carcinoma cells by inducing autophagic cell death. J. Med. Chem. 2010, 53, 787–797. [Google Scholar] [CrossRef]
- De Santana, T.I.; Barbosa, M.O.; Gomes, P.A.T.M.; da Cruz, A.C.N.; da Silva, T.G.; Leite, A.C.L. Synthesis, anticancer activity and mechanism of action of new thiazole derivatives. Eur. J. Med. Chem. 2018, 144, 874–886. [Google Scholar] [CrossRef]
- Aly, A.A.; Bräse, S.; Hassan, A.A.; Mohamed, N.K.; El-Haleem, L.E.A.; Nieger, M.; Morsy, N.M.; Alshammari, M.B.; Ibrahim, M.A.; Abdelhafez, E.M. Design, synthesis, and molecular docking of paracyclophanyl-thiazole hybrids as novel CDK1 inhibitors and apoptosis inducing anti-melanoma agents. Molecules 2020, 25, 5569. [Google Scholar] [CrossRef] [PubMed]
- Suma, V.R.; Sreenivasulu, R.; Rao, M.V.B.; Subramanyam, M.; Ahsan, M.J.; Alluri, R.; Rao, K.R.M. Design, synthesis, and biological evaluation of chalcone-linked thiazole-imidazopyridine derivatives as anticancer agents. Med. Chem. Res. 2020, 29, 1643–1654. [Google Scholar] [CrossRef]
- Xie, X.X.; Li, H.; Wang, J.; Mao, S.; Xin, M.H.; Lu, S.M.; Mei, Q.B.; Zhang, S.Q. Synthesis and anticancer effects evaluation of 1-alkyl-3-(6-(2-methoxy-3-sulfonylaminopyridin-5-yl)benzo[d]thiazol-2-yl)urea as anticancer agents with low toxicity. Bioorganic Med. Chem. 2015, 23, 6477–6485. [Google Scholar] [CrossRef]
- McCormack, P.L.; Keam, S.J. Dasatinib: A review of its use in the treatment of chronic myeloid leukaemia and Philadelphia chromosome-positive acute lymphoblastic leukaemia. Drugs 2011, 71, 1771–1795. [Google Scholar] [CrossRef]
- Ballantyne, A.D.; Garnock-Jones, K.P. Dabrafenib: First global approval. Drugs 2013, 73, 1367–1376. [Google Scholar] [CrossRef]
- Lessene, G.; Czabotar, P.E.; Sleebs, B.E.; Zobel, K.; Lowes, K.N.; Adams, J.M.; Baell, J.B.; Colman, P.M.; Deshayes, K.; Fairbrother, W.J.; et al. Structure-guided design of a selective BCL-XL inhibitor. Nat. Chem. Biol. 2013, 9, 390–397. [Google Scholar] [CrossRef] [PubMed]
- Cheng, X.; Yoshida, H.; Raoofi, D.; Saleh, S.; Alborzinia, H.; Wenke, F.; Göhring, A.; Reuter, S.; Mah, N.; Fuchs, H.; et al. Ethyl 2-((4-Chlorophenyl)amino)thiazole-4-carboxylate and derivatives are potent inducers of Oct3/4. J. Med. Chem. 2015, 58, 5742–5750. [Google Scholar] [CrossRef] [PubMed]
- Ndagi, U.; Abdullahi, M.; Hamza, A.N.; Soliman, M.E. An analogue of a kinase inhibitor exhibits subjective characteristics that contribute to its inhibitory activities as a potential anti-cancer candidate: Insights through computational biomolecular modelling of UM-164 binding with lyn protein. RSC Adv. 2020, 10, 145–161. [Google Scholar] [CrossRef] [PubMed]
- Lesyk, R. Drug design: 4-thiazolidinones applications. Part 1. Synthetic routes to the drug-like molecules. J. Med. Sci. 2020, 89, e406. [Google Scholar] [CrossRef]
- Lesyk, R. Drug design: 4-thiazolidinones applications. Part 2. Pharmacological profiles. J. Med. Sci. 2020, 89, e407. [Google Scholar] [CrossRef]
- Gupta, A.; Mishra, P.; Kashaw, S.K.; Jatav, V.; Stables, J.P. Synthesis and anticonvulsant activity of some novel 3-aryl amino/amino-4-aryl-5-imino-Δ2-1,2,4-thiadiazoline. Eur. J. Med. Chem. 2008, 43, 749–754. [Google Scholar] [CrossRef]
- Lozynskyi, A.V.; Yushyn, I.M.; Konechnyi, Y.T.; Roman, O.M.; Matiykiv, O.V.; Smaliukh, O.V.; Mosula, L.M.; Polovkovych, S.V.; Lesyk, R.B. Synthesis and evaluation of biological activity of 1-[2-amino-4-methylthiazol-5-yl]-3-arylpropenones. Biopolym. Cell 2021, 37, 389–399. [Google Scholar] [CrossRef]
- Kulkarni, S.E.; Mane, R.A.; Ingle, D.B. Reactions of o-aminothiophenol, guanidine, thiourea, hydrazine hydrate, and hydroxylamine with acryloylthiazoles and microbial activities of the reaction products. Indian J. Chem. 1986, 25B, 452–455. [Google Scholar] [CrossRef]
- Groom, C.R.; Bruno, I.J.; Lightfoot, M.P.; Ward, S.C. The Cambridge Structural Database. Acta Cryst. B 2016, 72, 171–179. [Google Scholar] [CrossRef]
- Allen, F.H.; Kennard, O.; Watson, D.G.; Brammer, L.; Orpen, A.G.; Taylor, R. Tables of bond lengths determined by X-ray and neutron diffraction. Part 1. Bond lengths in organic compounds. J. Chem. Soc. Perkin Trans. 1987, 2, S1–S19. [Google Scholar] [CrossRef]
- Monks, A.; Scudiero, D.; Skehan, P.; Shoemaker, R.; Paull, K.; Vistica, D.; Hose, C.; Langley, J.; Cronise, P.; Vaigro-Wolff, A.; et al. Feasibility of a high-flux anticancer drug screen using a diverse panel of cultured human tumor cell lines. J. Nat. Cancer Inst. 1991, 83, 757–766. [Google Scholar] [CrossRef] [PubMed]
- Boyd, M.R.; Paull, K.D. Some practical considerations and applications of the national cancer institute in vitro anticancer drug discovery screen. Drug Dev. Res. 1995, 34, 91–109. [Google Scholar] [CrossRef]
- Boyd, M.R. Cancer Drug Discovery and Development; Teicher, B.A., Ed.; Humana Press: Totowa, NJ, USA, 1997; Volume 2, pp. 23–43. [Google Scholar]
- Shoemaker, R.H. The NCI60 human tumour cell line anticancer drug screen. Nat. Rev. Cancer 2006, 6, 813–823. [Google Scholar] [CrossRef]
- Rostom, S.A.F. Synthesis and in vitro antitumor evaluation of some indeno[1,2-c]pyrazol(in)es substituted with sulfonamide, sulfonylurea(-thiourea) pharmacophores, and some derived thiazole ring systems. Bioorganic Med. Chem. 2006, 14, 6475–6485. [Google Scholar] [CrossRef]
- Franken, N.A.; Rodermond, H.M.; Stap, J.; Haveman, J.; van Bree, C. Clonogenic assay of cells in vitro. Nat. Protoc. 2006, 1, 2315–2319. [Google Scholar] [CrossRef]
- Anderson, S.N.; Towne, D.L.; Burns, D.J.; Warrior, U. A high-throughput soft agar assay for identification of anticancer compound. J. Biomol. Screen. 2007, 12, 938–945. [Google Scholar] [CrossRef]
- Horibata, S.; Vo, T.V.; Subramanian, V.; Thompson, P.R.; Coonrod, S.A. Utilization of the Soft Agar Colony Formation Assay to Identify Inhibitors of Tumorigenicity in Breast Cancer Cells. J. Vis. Exp. 2015, 99, e52727. [Google Scholar] [CrossRef] [PubMed]
- Wani, K.D.; Kitture, R.; Ahmed, A.; Choudhari, A.S.; Koppikar, S.J.; Kale, S.N.; Kaul-Ghanekar, R. Synthesis, Characterization and In Vitro Study of Curcumin-Functionalized Citric Acid-Capped Magnetic (CCF) Nanoparticles as Drug Delivery Agents in Cancer. J. Bionanosci. 2011, 5, 59–65. [Google Scholar] [CrossRef]
- Garas, A.; Webba, E.; Pillaya, V.; MacPheea, D.; Denny, W.; Zeller, H.; Cottona, R. A novel and simple method of screening compounds for interaction with DNA: A validation study. Mutat Res. 2009, 678, 20–29. [Google Scholar] [CrossRef]
- Gornowicz, A.; Bielawska, A.; Czarnomysy, R.; Gabryel-Porowska, H.; Muszyńska, A.; Bielawski, K. The combined treatment with novel platinum (II) complex and anti-MUC1 increases apoptotic response in MDA-MB-231 breast cancer cells. Mol. Cell Biochem. 2015, 408, 103–113. [Google Scholar] [CrossRef] [PubMed]
- Czarnomysy, R.; Radomska, D.; Muszyńska, A.; Hermanowicz, J.M.; Prokop, I.; Bielawska, A.; Bielawski, K. Evaluation of the Anticancer Activities of Novel Transition Metal Complexes with Berenil and Nitroimidazole. Molecules 2020, 25, 2860. [Google Scholar] [CrossRef] [PubMed]
- Dunn, D.; Husten, J.; Ator, M.A.; Chatterjee, S. Novel poly(ADP-ribose) polymerase-1 inhibitors. Bioorganic Med. Chem. Lett. 2012, 22, 222–224. [Google Scholar] [CrossRef] [PubMed]
- Chadha, N.; Jaggi, A.S.; Silakari, O. Structure-based design of new poly (ADP-ribose) polymerase (PARP-1) inhibitors. Mol. Divers. 2017, 21, 655–660. [Google Scholar] [CrossRef]
- Zhang, W.-T.; Ruan, J.-L.; Wu, P.-F.; Jiang, F.-C.; Zhang, L.-N.; Fang, W.; Chen, X.-L.; Wang, Y.; Cao, B.-S.; Chen, G.-Y.; et al. Design, Synthesis, and Cytoprotective Effect of 2-Aminothiazole Analogues as Potent Poly(ADP-Ribose) Polymerase-1 Inhibitors. J. Med. Chem. 2009, 52, 718–725. [Google Scholar] [CrossRef]
- Zandarashvili, L.; Langelier, M.F.; Velagapudi, U.K.; Hancock, M.A.; Steffen, J.D.; Billur, R.; Hannan, Z.M.; Wicks, A.J.; Krastev, D.B.; Pettitt, S.J.; et al. Structural basis for allosteric PARP-1 retention on DNA breaks. Science 2020, 3, 368. [Google Scholar] [CrossRef]
- Senhaji Mouhri, Z.; Goodfellow, E.; Jean-Claude, B. A type I combi-targeting approach for the design of molecules with enhanced potency against BRCA1/2 mutant- and O6-methylguanine-DNA methyltransferase (mgmt)-expressing tumour cells. BMC Cancer 2017, 17, 540. [Google Scholar] [CrossRef]
- Wang, H.-L.; Ma, X.; Guan, X.-Y.; Song, C.; Li, G.-B.; Yu, Y.-M.; Yang, L.-L. Potential synthetic lethality for breast cancer: A selective sirtuin 2 inhibitor combined with a multiple kinase inhibitor sorafenib. Pharmacol. Res. 2022, 177, 106050. [Google Scholar] [CrossRef]
- Ryan, K.; Bolaňos, B.; Smith, M.; Palde, P.B.; Cuenca, P.D.; Van Arsdale, T.L.; Niessen, S.; Zhang, L.; Behenna, D.; Ornelas, M.A.; et al. Dissecting the molecular determinants of clinical PARP1 inhibitor selectivity for tankyrase1. J. Biol. Chem. 2021, 296, 100251. [Google Scholar] [CrossRef]
- Aoyagi-Scharber, M.; Gardberg, A.S.; Yip, B.K.; Wang, B.; Shen, Y.; Fitzpatrick, P.A. Structural basis for the inhibition of poly(ADP-ribose) polymerases 1 and 2 by BMN 673, a potent inhibitor derived from dihydropyridophthalazinone. Acta Crystallogr. F Struct. Biol. Commun. 2014, 70 Pt 9, 1143–1149. [Google Scholar] [CrossRef] [Green Version]
- Sandhu, D.; Antolin, A.A.; Cox, A.R.; Jones, A.M. Identification of different side effects between PARP inhibitors and their polypharmacological multi-target rationale. Br. J. Clin. Pharmacol. 2022, 88, 742–752. [Google Scholar] [CrossRef] [PubMed]
- Finiuk, N.; Kryshchyshyn-Dylevych, A.; Holota, S.; Klyuchivska, O.; Kozytskiy, A.; Karpenko, O.; Manko, N.; Ivasechko, I.; Stoika, R.; Lesyk, R. Novel hybrid pyrrolidinedione-thiazolidinones as potential anticancer agents: Synthesis and biological evaluation. Eur. J. Med. Chem. 2022, 238, 114422. [Google Scholar] [CrossRef] [PubMed]
- Rigaku Oxford Diffraction. CrysAlis, PRO; Version 1.171.40.67a; Rigaku Oxford Diffraction: Yarnton, UK, 2019. [Google Scholar]
- Sheldrick, G. SHELXT—Integrated space-group and crystal-structure determination. Acta Crystallogr. A 2015, 71, 3–8. [Google Scholar] [CrossRef] [PubMed]
- Sheldrick, G. Crystal structure refinement with SHELXL. Acta Crystallogr. C 2015, 71, 3–8. [Google Scholar] [CrossRef] [PubMed]
- Farrugia, L.J. WinGX and ORTEP for Windows: An update. J. Appl. Crystallogr. 2012, 45, 849–854. [Google Scholar] [CrossRef]
- Dolomanov, O.V.; Bourhis, L.J.; Gildea, R.J.; Howard, J.A.K.; Puschmann, H. OLEX2: A complete structure solution, refinement and analysis program. J. Appl. Crystallogr. 2009, 42, 339–341. [Google Scholar] [CrossRef]
- Spek, A. Structure validation in chemical crystallography. Acta Crystallogr. D 2009, 65, 148–155. [Google Scholar] [CrossRef] [PubMed]
- Finiuk, N.S.; Ivasechko, I.I.; Klyuchivska, O.Y.; Ostapiuk, Y.V.; Hreniukh, V.P.; Shalai, Y.R.; Matiychuk, V.S.; Obushak, M.D.; Babsky, A.M.; Stoika, R.S. Apoptosis induction in human leukemia cells by novel 2-amino-5-benzylthiazole derivatives. Ukr. Biochem. J. 2019, 91, 29–39. [Google Scholar] [CrossRef]
- Nile, D.L.; Rae, C.; Hyndman, I.J.; Mairs, R.J. An evaluation in vitro of PARP-1 inhibitors, rucaparib and olaparib, as radiosensitisers for the treatment of neuroblastoma. BMC Cancer 2016, 16, 621. [Google Scholar] [CrossRef]
- Prud’homme, G.J.; Glinka, Y.; Toulina, A.; Ace, O.; Subramaniam, V.; Jothy, S. Breast Cancer Stem-Like Cells Are Inhibited by a Non-Toxic Aryl Hydrocarbon Receptor Agonist. PLoS ONE 2010, 5, e13831. [Google Scholar] [CrossRef]
- Kryshchyshyn-Dylevych, A.; Radko, L.; Finiuk, N.; Garazd, M.; Kashchak, N.; Posyniak, A.; Niemczuk, K.; Stoika, R.; Lesyk, R. Synthesis of novel indole-thiazolidinone hybrid structures as promising scaffold with anticancer potential. Bioorganic Med. Chem. 2021, 50, 116453. [Google Scholar] [CrossRef]
- Luo, J.; Dai, X.; Hu, H.; Chen, J.; Zhao, L.; Yang, C.; Sun, J.; Zhang, L.; Wang, Q.; Xu, S.; et al. Fluzoparib increases radiation sensitivity of non-small cell lung cancer (NSCLC) cells without BRCA1/2 mutation, a novel PARP1 inhibitor undergoing clinical trials. J. Cancer Res. Clin. Oncol. 2020, 146, 721–737. [Google Scholar] [CrossRef]
- Clemons, M.; Kelly, J.; Watson, A.J.; Howell, A.; McElhinney, R.S.; McMurry, T.B.; Margison, G.P. O6-(4-bromothenyl)guanine reverses temozolomide resistance in human breast tumour MCF-7 cells and xenografts. Br. J. Cancer 2005, 93, 1152–1156. [Google Scholar] [CrossRef]
- Periasamy, J.; Kurdekar, V.; Jasti, S.; Nijaguna, M.B.; Boggaram, S.; Hurakadli, M.A.; Raina, D.; Kurup, L.M.; Chintha, C.; Manjunath, K.; et al. Targeting Phosphopeptide Recognition by the Human BRCA1 Tandem BRCT Domain to Interrupt BRCA1-Dependent Signaling. Cell Chem. Biol. 2018, 25, 677–690. [Google Scholar] [CrossRef]
- Protein Data Bank. Available online: https://www.rcsb.org/structure/7KK4 (accessed on 15 August 2022).
- Protein Data Bank. Available online: https://www.rcsb.org/structure/4PJV (accessed on 15 August 2022).
- Morris, G.M.; Goodsell, D.S.; Halliday, R.S.; Huey, R.; Hart, W.E.; Belew, R.K.; Olson, A.J. Automated docking using a Lamarckian genetic algorithm and an empirical binding free energy function. J. Comput. Chem. 1998, 19, 1639–1662. [Google Scholar] [CrossRef]
- Dias, R.; de Azevedo, W.F., Jr. Molecular docking algorithms. Curr. Drug Targets 2008, 9, 1040–1047. [Google Scholar] [CrossRef]
- Yusuf, D.; Davis, A.M.; Kleywegt, G.J.; Schmitt, S. An alternative method for the evaluation of docking performance: RSR vs. RMSD. J. Chem. Inf. Model. 2008, 48, 1411–1422. [Google Scholar] [CrossRef]


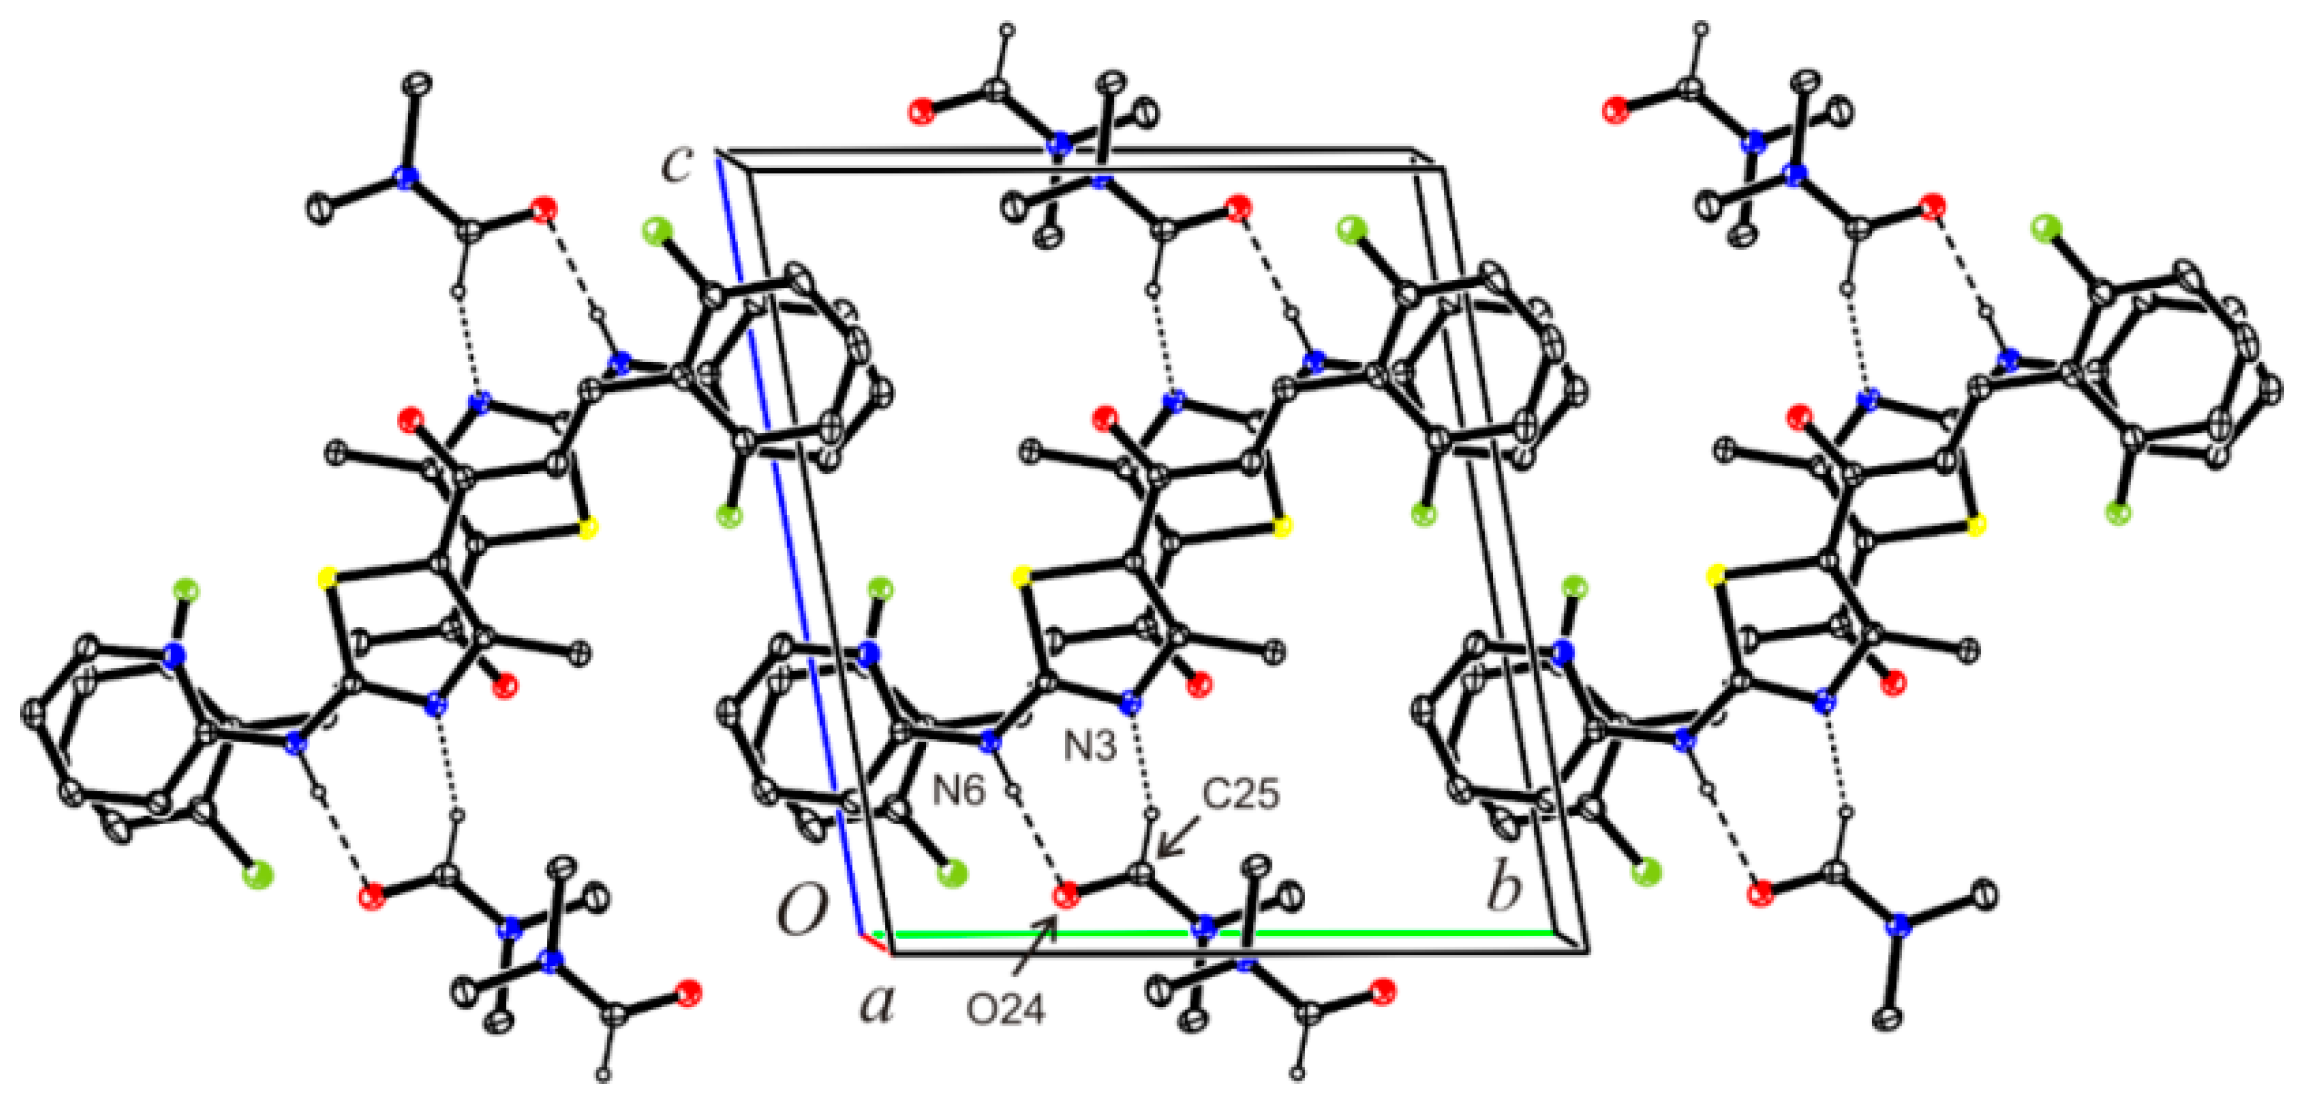
| D—H···A | D—H | H···A | D···A | D—H···A |
|---|---|---|---|---|
| N6―H6···O24 | 0.878(18) | 1.966(18) | 2.8418(15) | 175.1(15) |
| C16―H16···F1B | 0.95 | 2.12 | 2.806(7) | 128 |
| C25―H25···N3 | 0.95 | 2.56 | 3.2011(18) | 125 |
| D—H···A | D—H | H···A | D···A | ∠ D—H···A |
|---|---|---|---|---|
| N6A―H6A···O20B | 0.88(2) | 1.90(2) | 2.7621(16) | 168(2) |
| N6B―H6B···O20A i | 0.85(2) | 1.93(2) | 2.7784(16) | 176(2) |
| C21B―H21B···N3A | 0.98 | 2.53 | 3.490(2) | 165 |
| C21A―H21E···N3B ii | 0.98 | 2.55 | 3.489(2) | 161 |
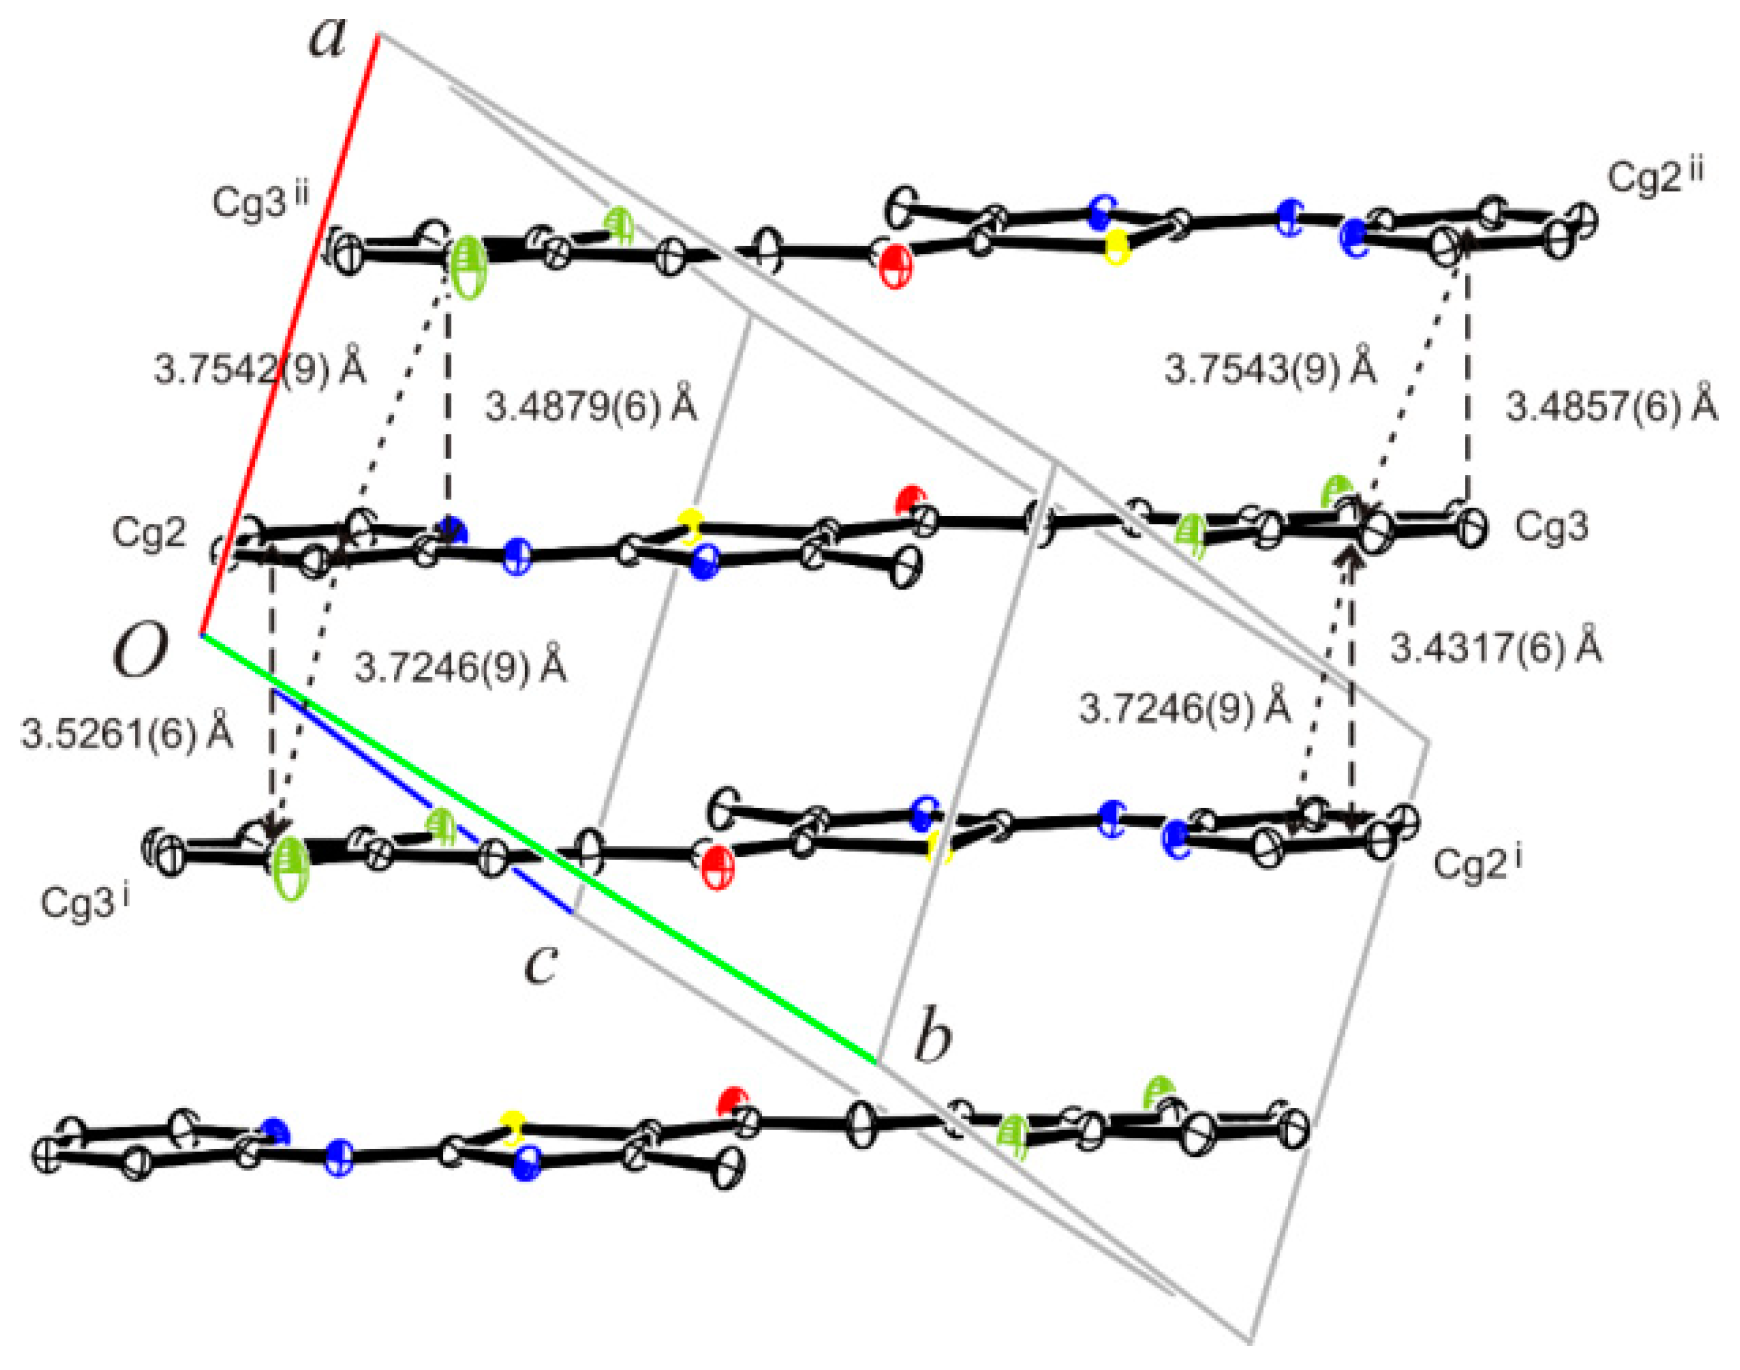
| C—H···Cg | C—H | H···Cg | C···Cg | ∠ C—H···Cg |
| C9A―H9A···Cg1 iii | 0.95 | 2.86 | 3.6228(16) | 138 |
| C18A―H18C···Cg2 iv | 0.99 | 2.70 | 3.4533(15) | 133 |
| Comp. | Mean Growth, % | Range of Growth, % | Most Sensitive Cell Lines/Growth % | Positive Cytostatic Effect 1 | Positive Cytotoxic Effect 2 |
|---|---|---|---|---|---|
| 4 | −2.78 | −76.78–41.12 | NCI-H460 (Non-Small Cell Lung Cancer)/−40.69 NCI-H522 (Non-Small Cell Lung Cancer)/−22.73 Colo 205 (Colon Cancer)/−34.08 HCT-15 (Colon Cancer)/−42.04 HT29 (Colon Cancer)/−28.32 KM12 (Colon Cancer)/−59.82 SF-539 (CNS Cancer)/−27.26 U251 (CNS Cancer)/−70.41 LOX IMVI (Melanoma)/−76.78 SK Mel-2 (Melanoma)/−31.22 | 35/60 | 25/60 |
| 5 | 50.64 | −18.90–118.83 | CCRF-CEM (Leukemia)/19.12 HL-60(TB) (Leukemia)/4.96 K-562 (Leukemia)/15.13 SR (Leukemia)/12.44 NCI-H522 (Non-Small Cell Lung Cancer)/−18.90 MDA-MB-435 (Melanoma)/−17.91 MDA-MB-468 (Brest Cancer)/−13.74 | 25/60 | 3/60 |
| 6 | 51.48 | 12.53–95.32 | K-562 (Leukemia)/15.62 SR (Leukemia)/12.53 SK Mel-5 (Melanoma)/17.75 T-47D (Brest Cancer)/14.27 | 32/59 | 0/59 |
| Disease | Cell Line | GI50, μM | SI |
|---|---|---|---|
| Leukemia | CCRF-CEM | 18.6 | 1.70 |
| HL-60(TB) | 21.4 | 1.48 | |
| K-562 | 30.4 | 1.04 | |
| MOLT-4 | 32.2 | 0.98 | |
| RPMI-8226 | 8.29 | 3.82 | |
| SR | 24.1 | 1.32 | |
| MG_MID | 22.5 | 1.41 | |
| Non-Small Cell Lung Cancer | A549/ATCC | 75.7 | 0.42 |
| EKVX | 19.0 | 1.67 | |
| HOP-62 | 37.5 | 0.85 | |
| HOP-92 | 12.5 | 2.54 | |
| NCI-H226 | 2.52 | 12.6 | |
| NCI-H23 | 22.7 | 1.40 | |
| NCI-H322M | 25.4 | 1.25 | |
| NCI-H460 | 31.2 | 1.02 | |
| NCI-H522 | 21.6 | 1.45 | |
| MG_MID | 27.6 | 1.14 | |
| Colon Cancer | COLO 205 | >100 | 0.32 |
| HCC-2998 | 23.1 | 1.37 | |
| HCT-116 | 23.0 | 1.38 | |
| HCT-15 | 25.8 | 1.23 | |
| HT29 | 58.3 | 0.54 | |
| KM12 | 55.6 | 0.57 | |
| SW-629 | 75.3 | 0.42 | |
| MG_MID | 51.6 | 0.61 | |
| CNS Cancer | SF-268 | 43.1 | 0.74 |
| SF-295 | 32.2 | 0.98 | |
| SF-539 | 32.5 | 0.98 | |
| SNB-19 | 36.9 | 0.86 | |
| SNB-75 | 3.58 | 8.85 | |
| U251 | 47.8 | 0.66 | |
| MG_MID | 32.7 | 0.97 | |
| Melanoma | LOX IMVI | 0.312 | 101.6 |
| MALME-3M | 25.4 | 1.25 | |
| M14 | 19.4 | 1.63 | |
| MDA-MB-435 | 26.3 | 1.21 | |
| SK-MEL-2 | 44.9 | 0.71 | |
| SK-MEL-28 | 38.7 | 0.82 | |
| SK_MEL-5 | 18.6 | 1.70 | |
| UACC-257 | 38.4 | 0.83 | |
| UACC-62 | 16.1 | 1.97 | |
| MG_MID | 25.3 | 1.25 | |
| Ovarian Cancer | IGROV-1 | 12.1 | 2.62 |
| OVCAR-3 | 31.7 | 1.00 | |
| OVCAR-4 | 66.1 | 0.48 | |
| OVCAR-5 | 74.4 | 0.43 | |
| OVCAR-8 | 53.6 | 0.59 | |
| NCI/ADR-RES | 24.1 | 1.32 | |
| SK-OV-3 | 26.0 | 1.22 | |
| MG_MID | 41.1 | 0.77 | |
| Renal Cancer | 786-0 | 24.8 | 1.28 |
| A498 | 69.2 | 0.33 | |
| ACHN | 45.6 | 0.70 | |
| CAKI-1 | 11.5 | 2.76 | |
| RXF 393 | 2.59 | 12.2 | |
| SN12C | 28.0 | 1.13 | |
| TK-10 | 82.3 | 0.39 | |
| UO-31 | 3.19 | 9.94 | |
| MG_MID | 33.4 | 0.95 | |
| Prostate Cancer | PC-3 | 23.8 | 1.33 |
| DU-145 | 67.2 | 0.47 | |
| MG_MID | 45.5 | 0.70 | |
| Breast Cancer | MCF-7 | 15.4 | 2.06 |
| MDA-MB-231/ATCC | 19.3 | 1.64 | |
| HS 578T | 14.9 | 2.13 | |
| BT-549 | 14.7 | 2.16 | |
| T-47D | 18.0 | 1.76 | |
| MDA-MB-468 | 4.24 | 7.48 | |
| MG_MID | 14.4 | 2.20 | |
| MG_MID | 31.7 |
| Comp./Cell Line | 1 | 2 | 3 | 4 | 5 | 6 | 7 | Doxorubicin |
|---|---|---|---|---|---|---|---|---|
| HCT-116 | >50 | >50 | 2.90 ± 1.03 | 6.11 ± 0.24 | >50 | >50 | 7.27 ± 0.27 | 0.90 ± 0.09 |
| HCT-116 p53 (−/−) | >50 | >50 | 2.81± 0.16 | 3.43 ± 0.90 | 34.54 ± 1.02 | 29.12 ± 1.45 | N/D | 1.19 ± 1.30 |
| MCF-7 | >50 | >50 | 1.86 ± 0.90 | 2.79 ± 1.31 | >50 | 45.37 ± 2.20 | 4.30 ± 0.98 | 1.04 ± 0.80 |
| Jurkat | >50 | >50 | 5.20 ± 0.10 | 5.36 ± 0.16 | >50 | >100 | N/D | 1.17 ± 0.12 |
| HL-60 | N/D | N/D | 0.57 ± 0.35 | N/D | N/D | N/D | >10 | 0.38 ± 0.50 |
| A549 | >50 | >50 | 4.56 ± 0.22 | 8.05 ± 0.24 | 33.13 ± 1.32 | 63.35 ± 3.81 | N/D | 2.00 ± 0.35 |
| SK-OV-3 | >50 | >50 | >50 | 7.87 ± 0.23 | >50 | 39.59 ± 2.37 | N/D | 3.20 ± 0.10 |
| KB3-1 | >50 | 38.01 ± 1.90 | 7.42 ± 0.22 | 7.63 ± 0.38 | 13.08 ± 0.52 | 24.88 ± 0.74 | 3.96 ± 1.23 | 4.00 ± 1.30 |
| J774.2 | >50 | >50 | >50 | >50 | >50 | >50 | N/D | 1.74 ± 1.10 |
| HEK-293 | N/D | N/D | >50 | >50 | 45.36 ± 2.26 | N/D | N/D | 1.29 ± 0.87 |
| HaCaT | >50 | >50 | >50 | >50 | >50 | >50 | N/D | >10 |
| BALB-3T3 | N/D | N/D | 7.18 ± 0.21 | 7.79 ± 0.38 | 34.16 ± 1.70 | N/D | N/D | 3.18 ± 0.25 |
| Compound | PARP1 (PDB 7KK4) | PARP2 (PDB 4PJV) | ||
|---|---|---|---|---|
| Binding Energy | Inhibition Constant Ki, nM | Binding Energy | Inhibition Constant Ki, nM | |
| 3 | −7.84 | 1790 | −8.08 | 1190 |
| 4 | −9.95 | 50.82 | −9.19 | 33.94 |
| 5 | −8.75 | 384.91 | −8.93 | 283.37 |
| 6 | −9.32 | 147.71 | −8.70 | 421.20 |
| Fluzoparib | −11.88 | 1.97 | −10.90 | 10.25 |
| Olaparib | −12.72 | 0.473 | −11.39 | 4.46 |
| Talazoparib | −9.51 | 107.62 | −9.98 | 48.61 |
Publisher’s Note: MDPI stays neutral with regard to jurisdictional claims in published maps and institutional affiliations. |
© 2022 by the authors. Licensee MDPI, Basel, Switzerland. This article is an open access article distributed under the terms and conditions of the Creative Commons Attribution (CC BY) license (https://creativecommons.org/licenses/by/4.0/).
Share and Cite
Ivasechko, I.; Yushyn, I.; Roszczenko, P.; Senkiv, J.; Finiuk, N.; Lesyk, D.; Holota, S.; Czarnomysy, R.; Klyuchivska, O.; Khyluk, D.; et al. Development of Novel Pyridine-Thiazole Hybrid Molecules as Potential Anticancer Agents. Molecules 2022, 27, 6219. https://doi.org/10.3390/molecules27196219
Ivasechko I, Yushyn I, Roszczenko P, Senkiv J, Finiuk N, Lesyk D, Holota S, Czarnomysy R, Klyuchivska O, Khyluk D, et al. Development of Novel Pyridine-Thiazole Hybrid Molecules as Potential Anticancer Agents. Molecules. 2022; 27(19):6219. https://doi.org/10.3390/molecules27196219
Chicago/Turabian StyleIvasechko, Iryna, Ihor Yushyn, Piotr Roszczenko, Julia Senkiv, Nataliya Finiuk, Danylo Lesyk, Serhii Holota, Robert Czarnomysy, Olga Klyuchivska, Dmytro Khyluk, and et al. 2022. "Development of Novel Pyridine-Thiazole Hybrid Molecules as Potential Anticancer Agents" Molecules 27, no. 19: 6219. https://doi.org/10.3390/molecules27196219