Article

Response Surface Methodology (RSM)-Based Optimization of Ultrasound-Assisted Extraction of Sennoside A, Sennoside B, Aloe-Emodin, Emodin, and Chrysophanol from Senna alexandrina (Aerial Parts): HPLC-UV and Antioxidant Analysis

1
Department of Pharmacognosy, College of Pharmacy, King Saud University, P.O. Box 22452, Riyadh 11495, Saudi Arabia
2
College of Pharmacy, King Saud University, Riyadh 11451, Saudi Arabia
*
Authors to whom correspondence should be addressed.
Molecules 2022, 27(1), 298; https://doi.org/10.3390/molecules27010298
Submission received: 30 November 2021 / Revised: 24 December 2021 / Accepted: 30 December 2021 / Published: 4 January 2022

Abstract

:
In this study, ultrasound-assisted extraction conditions were optimized to maximize the yields of sennoside A, sennoside B, aloe-emodin, emodin, and chrysophanol from S. alexandrina (aerial parts). The three UAE factors, extraction temperature (S1), extraction time (S2), and liquid to solid ratio (S3), were optimized using response surface methodology (RSM). A Box–Behnken design was used for experimental design and phytoconstituent analysis was performed using high-performance liquid chromatography-UV. The optimal extraction conditions were found to be a 64.2 °C extraction temperature, 52.1 min extraction time, and 25.2 mL/g liquid to solid ratio. The experimental values of sennoside A, sennoside B, aloe-emodin, emodin, and chrysophanol (2.237, 12.792, 2.457, 0.261, and 1.529%, respectively) agreed with those predicted (2.152, 12.031, 2.331, 0.214, and 1.411%, respectively) by RSM models, thus demonstrating the appropriateness of the model used and the accomplishment of RSM in optimizing the extraction conditions. Excellent antioxidant properties were exhibited by S. alexandrina methanol extract obtained using the optimized extraction conditions with a DPPH assay (IC50 = 59.7 ± 1.93, µg/mL) and ABTS method (47.2 ± 1.40, µg/mL) compared to standard ascorbic acid.

1. Introduction

Leguminosae is one of the most widespread plant families in the world, containing the genus Senna, which includes hundreds of plant species [1] such as Senna alexandrina, which is commonly known as Senna makkai or Cassia angustifolia. This species is native to Saudi Arabia, Egypt, and Yemen [2]. It is widely used in folk medicine for several purposes including as a purgative, antipyretic, laxative, and diuretic [3]. Several other proven and relevant biological activities such as anti-allergic, anti-inflammatory, antioxidant, antibacterial, antimicrobial, analgesic, antiparasitic, insecticidal, antitumor, hepatoprotective, and antifungal properties have been reported for several species of Senna [4]. The medicinal properties of Senna can be attributed mainly to the presence of anthraquinone glycosides, especially sennosides A and B [5], which act as pro-drugs for the laxative-acting anthrones and anthraquinones [6]. Sennosides A–D are mainly responsible for the purgative action of Senna [7], as intestinal bacteria metabolize sennosides to rheinanthrone, which acts as a direct purgative in the intestine [8]. Sennosides have been registered as one of the leading natural pharmaceutical preparations due to their important properties [9]. The content of sennosides A and B in raw materials determine their price and acceptability on the market [10]. Other important phytochemical constituents present in S. alexandrina include emodin, aloe-emodin, and chrysophanol, all of which have been reported to have strong antioxidant properties [11,12].
Extraction is an important means of isolating, identifying, and applying valuable chemical compounds from natural plants [13,14]. There are many extraction methods, including water extraction, maceration extraction, and solid-phase microextraction. Typically, these traditional extraction methods are very slow, costly, and inefficient. However, several new extraction methods have been discovered during recent years. In particular, ultrasound-assisted extraction (UAE) is considered superior for natural product extraction and has been used to extract compounds from various sources. Its main advantages are its lower cost and higher efficiency compared to traditional extraction methods [15]. UAE is based on the principle of acoustic cavitation, which is capable of damaging the cell walls of the plant matrix, thereby favoring the release of bioactive compounds [16]. This technology can be applied to obtain different phytochemicals, of which phenolic compounds are a particularly notable example. These have important applications in various fields of industry, particularly the food and pharmaceutical industries, thanks to their antimicrobial, anti-inflammatory, and anticancer properties, and primarily their antioxidant capabilities [17].
However, how to optimize extraction conditions to maximize compound yields remains challenging. In this study, we investigated the optimal extraction conditions for UAE of sennoside A, sennoside B, emodin, aloe emodin, and chrysophanol (Figure 1) through response surface methodology (RSM). RSM, which was first introduced by Box and Wilson in 1951 [18], is a collection of statistical and mathematical techniques that have been successfully used to develop, improve, and optimize processes [19,20]. RSM can be used to evaluate the effects of multiple factors and their interactions with one or more response variables [21,22]. Different RSM methods, such as the Box–Behnken design (BBD), central composite design (CCD), and three-level full factorial design (TFFD), have been widely used [23].
Several studies have previously been conducted for the extraction and quantification of active Senna constituents. However, the extraction optimization of important phytoconstituents sennoside A, sennoside B, aloe-emodin, emodin, and chrysophanol from Senna has not previously been undertaken. On this basis, we aimed to study the effects of different UAE extraction variables (extraction temperature, extraction time, and solid to liquid ratio) on the concentrations of sennoside A, sennoside B, aloe-emodin, emodin, and chrysophanol using RSM. In addition, we also aimed to develop a validated HPLC method for the concurrent analysis of sennoside A, sennoside B, aloe-emodin, emodin, and chrysophanol in optimized S. alexandrina samples.

2. Results

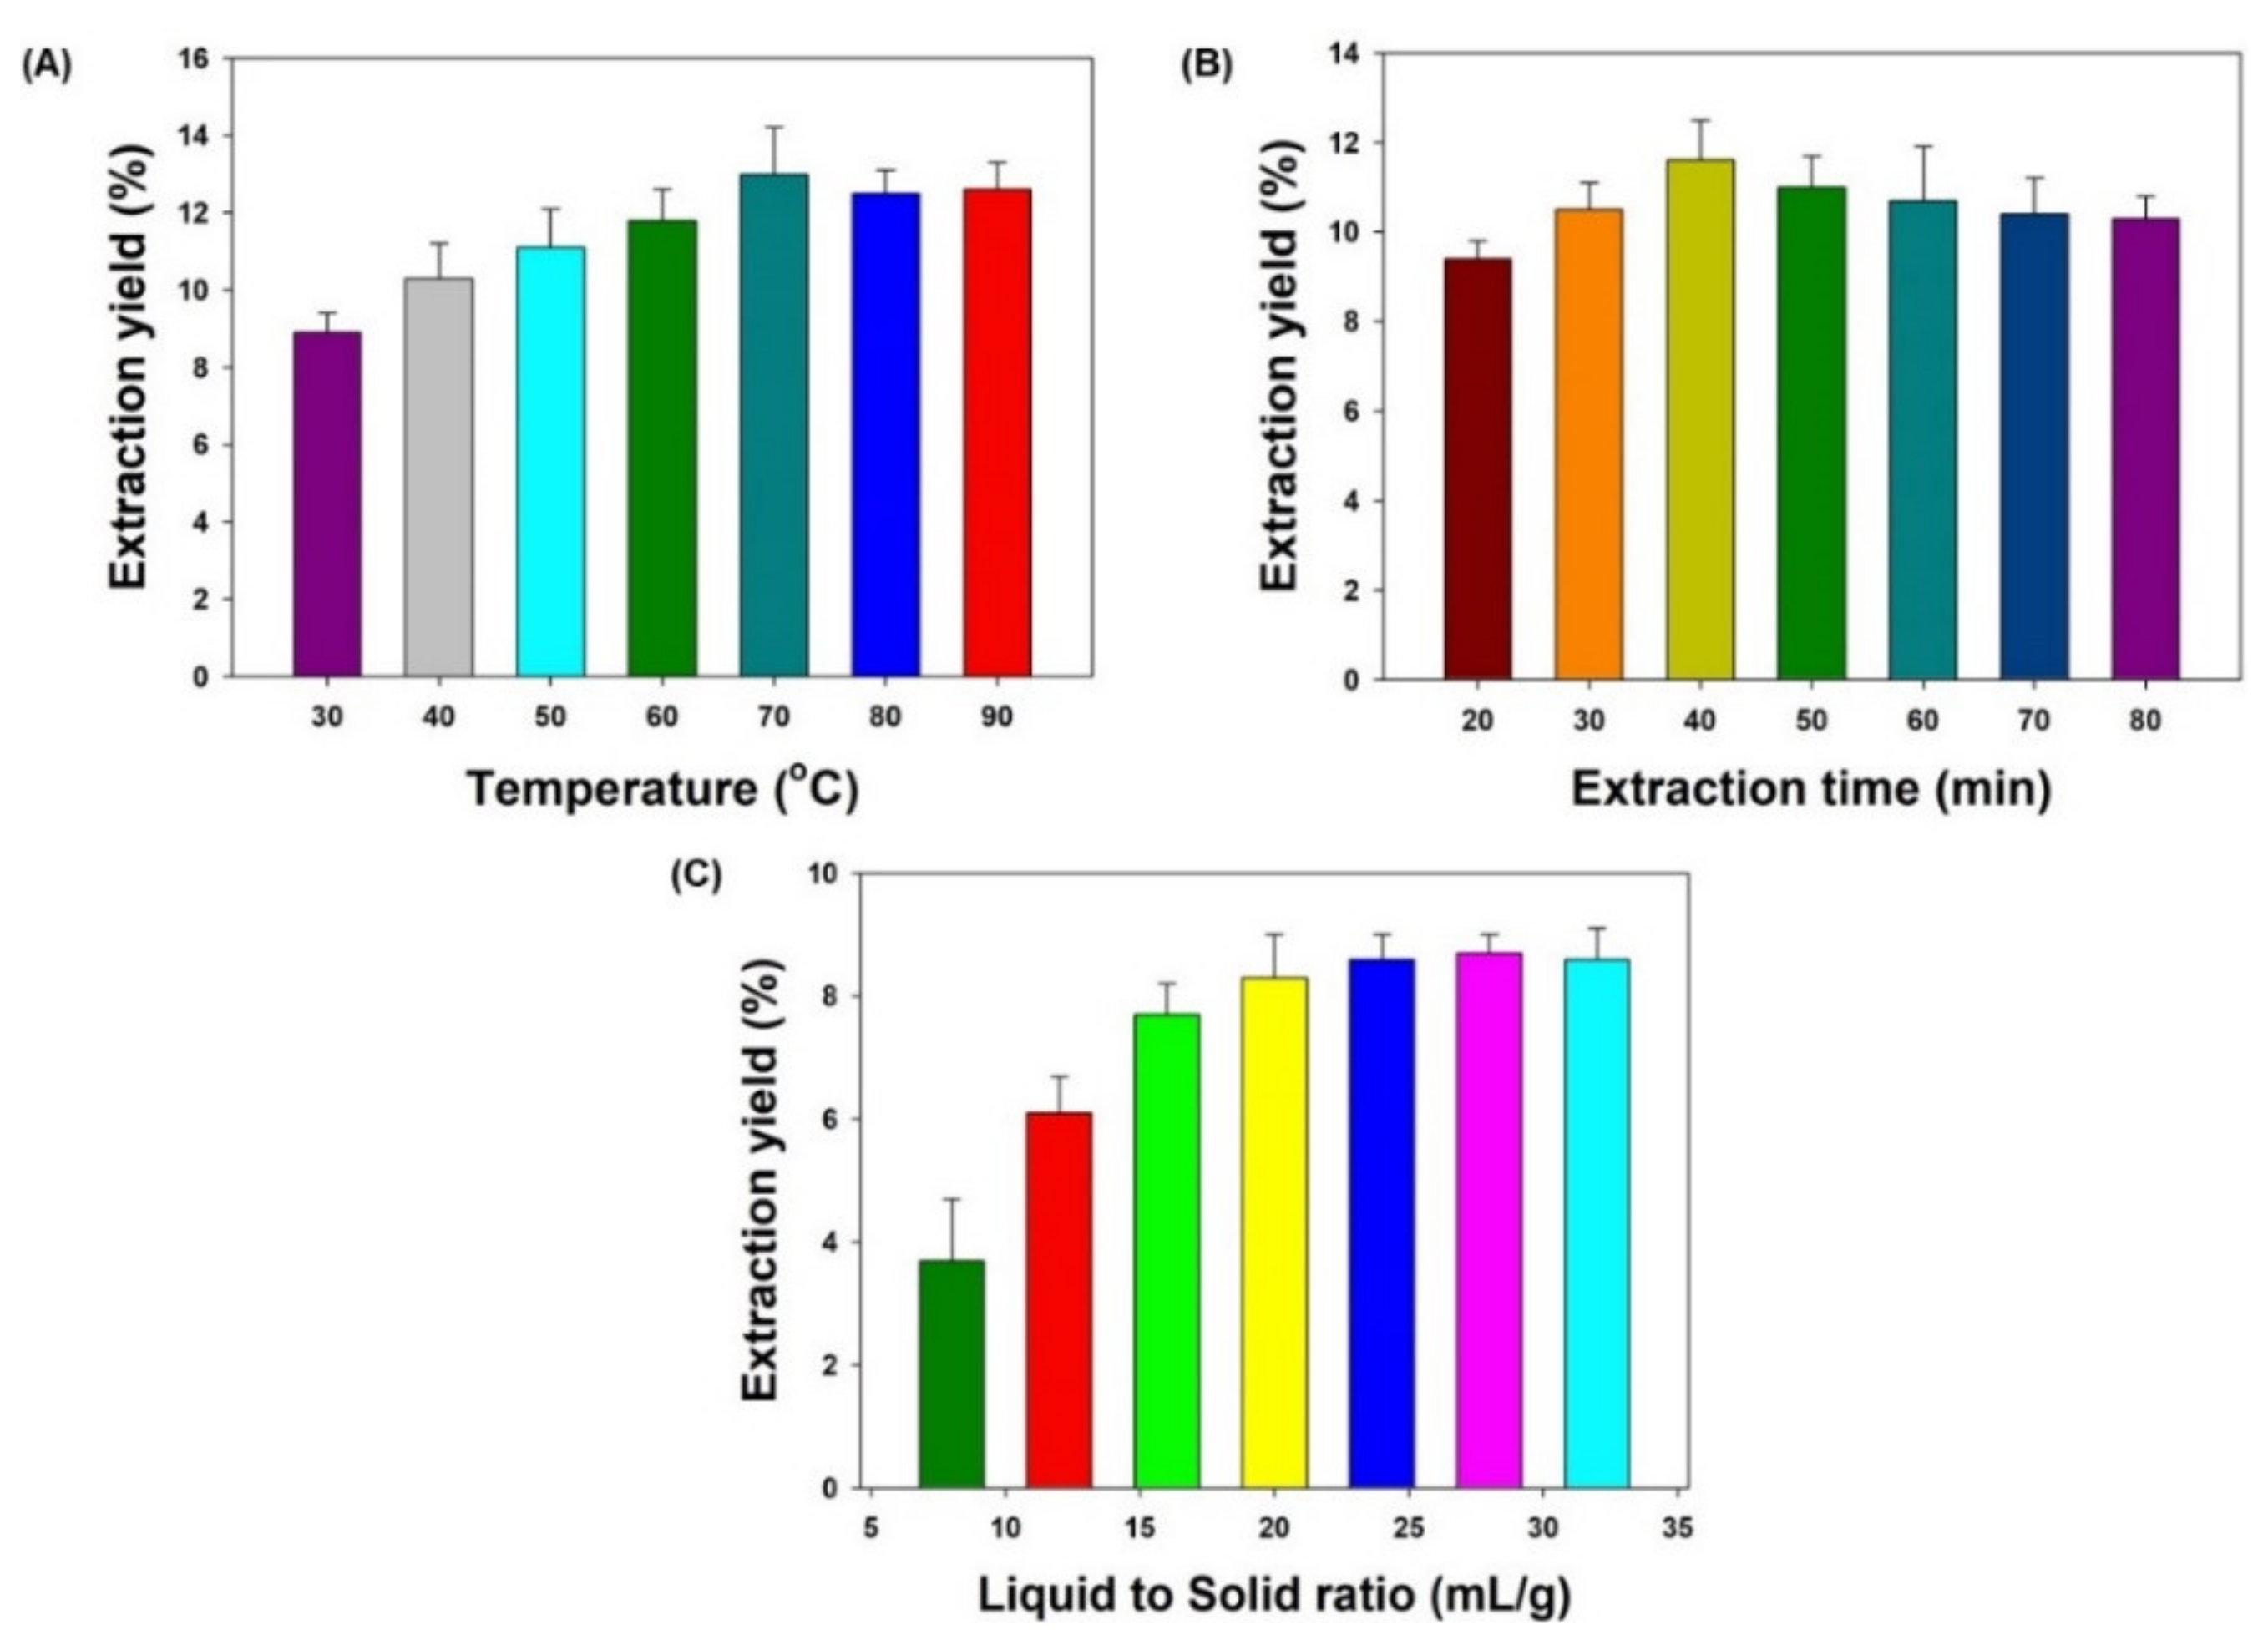
2.1. Effect of Single-Factor Tests on Total Extraction Yield of S. alexandrina (Aerial Parts)

To set a range of UAE independent variables (extraction temperature, extraction time, and liquid to solid ratio) for optimization using the BBD method, we investigated the maximum single factor effects on the total percentage yield of S. alexandrina. Different ranges of extraction temperature (30–90 °C), extraction time (20–80 min), and solid to liquid ratio (8–32 mL/g) were selected to investigate the effect of individual independent factors (i.e., single factors) on total percentage yield while keeping the other two variables constant. Where these parameters were kept constant, an extraction temperature of 40 °C, extraction time of 30 min, and liquid to solid ratio of 20 mL/g were used. The results obtained showed that the total extraction yield was lowest at 30 °C extraction temperature, 20 min extraction time, and 8 mL/g liquid to solid ratio; the yields were highest at 70 °C, 40 min, and 24 mL/g, respectively. Setting the extraction temperature, extraction time, and liquid to solid ratio higher did not produce significant changes in yields (Figure 2). The increase in temperature decreases the viscosity and surface tension of the solvent, increasing its matrix penetration power and resulting in enhanced extraction. Based on these observations, the independent extraction variable ranges were set as 50–70 °C extraction temperature, 30–60 min extraction time, and 16–32 mL/g of liquid to solid ratio; extraction optimization was then applied by the BBD method.

2.2. BBD Method Optimization of Extraction Conditions

The ranges for the three independent extraction variables, namely, extraction temperature (S1), extraction time (S2), and liquid to solid ratio (S3), at three levels (+1, 0, −1) for extraction parameter optimization by the BBD method were selected based on observations from the single-factor experiments.

2.2.1. Statistical Analysis and Model Fitting

In Table 1, the results of 17 experimental combinations of three independent extraction variables were recorded to investigate their impact on percentage yields of sennoside A (R1), sennoside B (R2), aloe-emodin (R3), emodin (R4), and chrysophanol (R5). The results were fitted into Equation (1) (i.e., a second-order polynomial equation):
Y = β 0 + i = 1 n β i P i + i = 1 n 1 j   >   1 j = 2 n β i j   P i P j   + i = 1 n β i i P i     2 + ɛ
(where, Y = dependent variable (%yield); β0, βi, βii, and βij are the constant coefficient, linear coefficient of input factor Pi, quadratic coefficient of input factor Pi, and different interaction coefficients between input factor Pi and Pj, respectively; ɛ is the error of model) to generate the following equations with coded factors for dependent variables (R1R5):
R1 = 2.1 + 0.1839 S1 + 0.0590 S2 + 0.0171 S3 − 0.0368 S1S2 + 0.0210 S1S3 + 0.0048 S2S3 − 0.2109 S12 − 0.0681 S22 − 0.1098 S32.
R2 = 11.68 + 1.07 S1 + 0.4296 S2 − 0.0037 S3 − 0.1520 S1S2 + 0.1173 S1S3 + 0.2493 S2S3 − 1.06 S12 − 0.4894 S22 − 0.7301 S32.
R3 = 2.27 + 0.2085 S1 + 0.0596 S2 + 0.0184 S3 − 0.0295 S1S2 + 0.0225 S1S3 + 0.0058 S2S3 − 0.2282 S12 − 0.0735 S22 − 0.1205 S32.
R4 = 0.2084 + 0.0183 S1 + 0.0058 S2 + 0.0020 S3 − 0.0023 S1S2 + 0.0023 S1S3 − 0.0002 S2S3 − 0.0193 S12 − 0.0073 S22 − 0.0118 S32.
R5 = 1.37 + 0.1220 S1 + 0.0360 S2 + 0.0150 S3 − 0.0140 S1S2 + 0.0080 S1S3 + 0.0015 S2S3 − 0.1222 S12 − 0.0362 S22 − 0.0583 S32.
For the BBD-based experimental design, a quadratic model with an R2 value of 0.9817, 0.9850, 0.9858, 0.9895, and 0.9199 was found to be the best-fit model for the analysis of R1, R2, R3, R4, and R5, respectively. In Table 2, the regression analysis and response regression equation data for the suggested model are listed for R1, R2, R3, R4, and R5.
The adjusted R2/predicted R2 values for R1, R2, R3, R4, and R5 (0.9583/0.7795, 0.9656/0.8281, 0.9675/0.8462, 0.9760/0.8857, and 0.8169/0.7273, respectively) were found to be close to 1, showing a strong correlation between adjusted and predicted values. Furthermore, the difference between adjusted and predicted R2 values was found to be less than 0.2 for every dependent variable, indicating that the models fitted well. To measure whether the precision is adequate, the signal-to-noise ratio can be used, which should be greater than 4 to fit the model. In this experiment, the signal to noise ratio for R1, R2, R3, R4, and R5 were 18.422, 20.067, 20.368, 23.618, and 8.202, respectively; all the values were more than 4, indicating that the models were fitted correctly and suggesting that the proposed model can be used to navigate the design space. In Table 3, the ANOVA (analysis of variance) results for the quadratic models of R1, R2, R3, R4, and R5 are listed.
The model F-value for R1 was found to be 41.81, implying that the model was significant and that there was only a 0.01% chance that an F-value this large could occur due to noise. Similarly, for R2, R3, R4, and R5 the F-values were found to be 50.97, 53.94, 73.19, and 8.93, respectively, implying that each quadratic model was significant and there was only a 0.01, 0.01, 0.01, and 0.43% chance, respectively, that these F-values could occur due to noise. The p-values for the proposed quadratic model of all the dependent variables were found to be very low (<0.05), suggesting that the models developed for analysis of all the variables were significant. The lack of fit F-values of 3.57, 2.89, 2.38, 2.42, and 0.20 for R1, R2, R3, R4, and R5 imply that the lack of fit is not significant relative to the pure error; thus, it is appropriate to fit the model and predict the responses. There is a 12.52, 16.61, 21.04, 20.63, and 89.48% chance that a lack of fit F-value this large could occur due to noise for variables R1, R2, R3, R4, and R5, respectively.

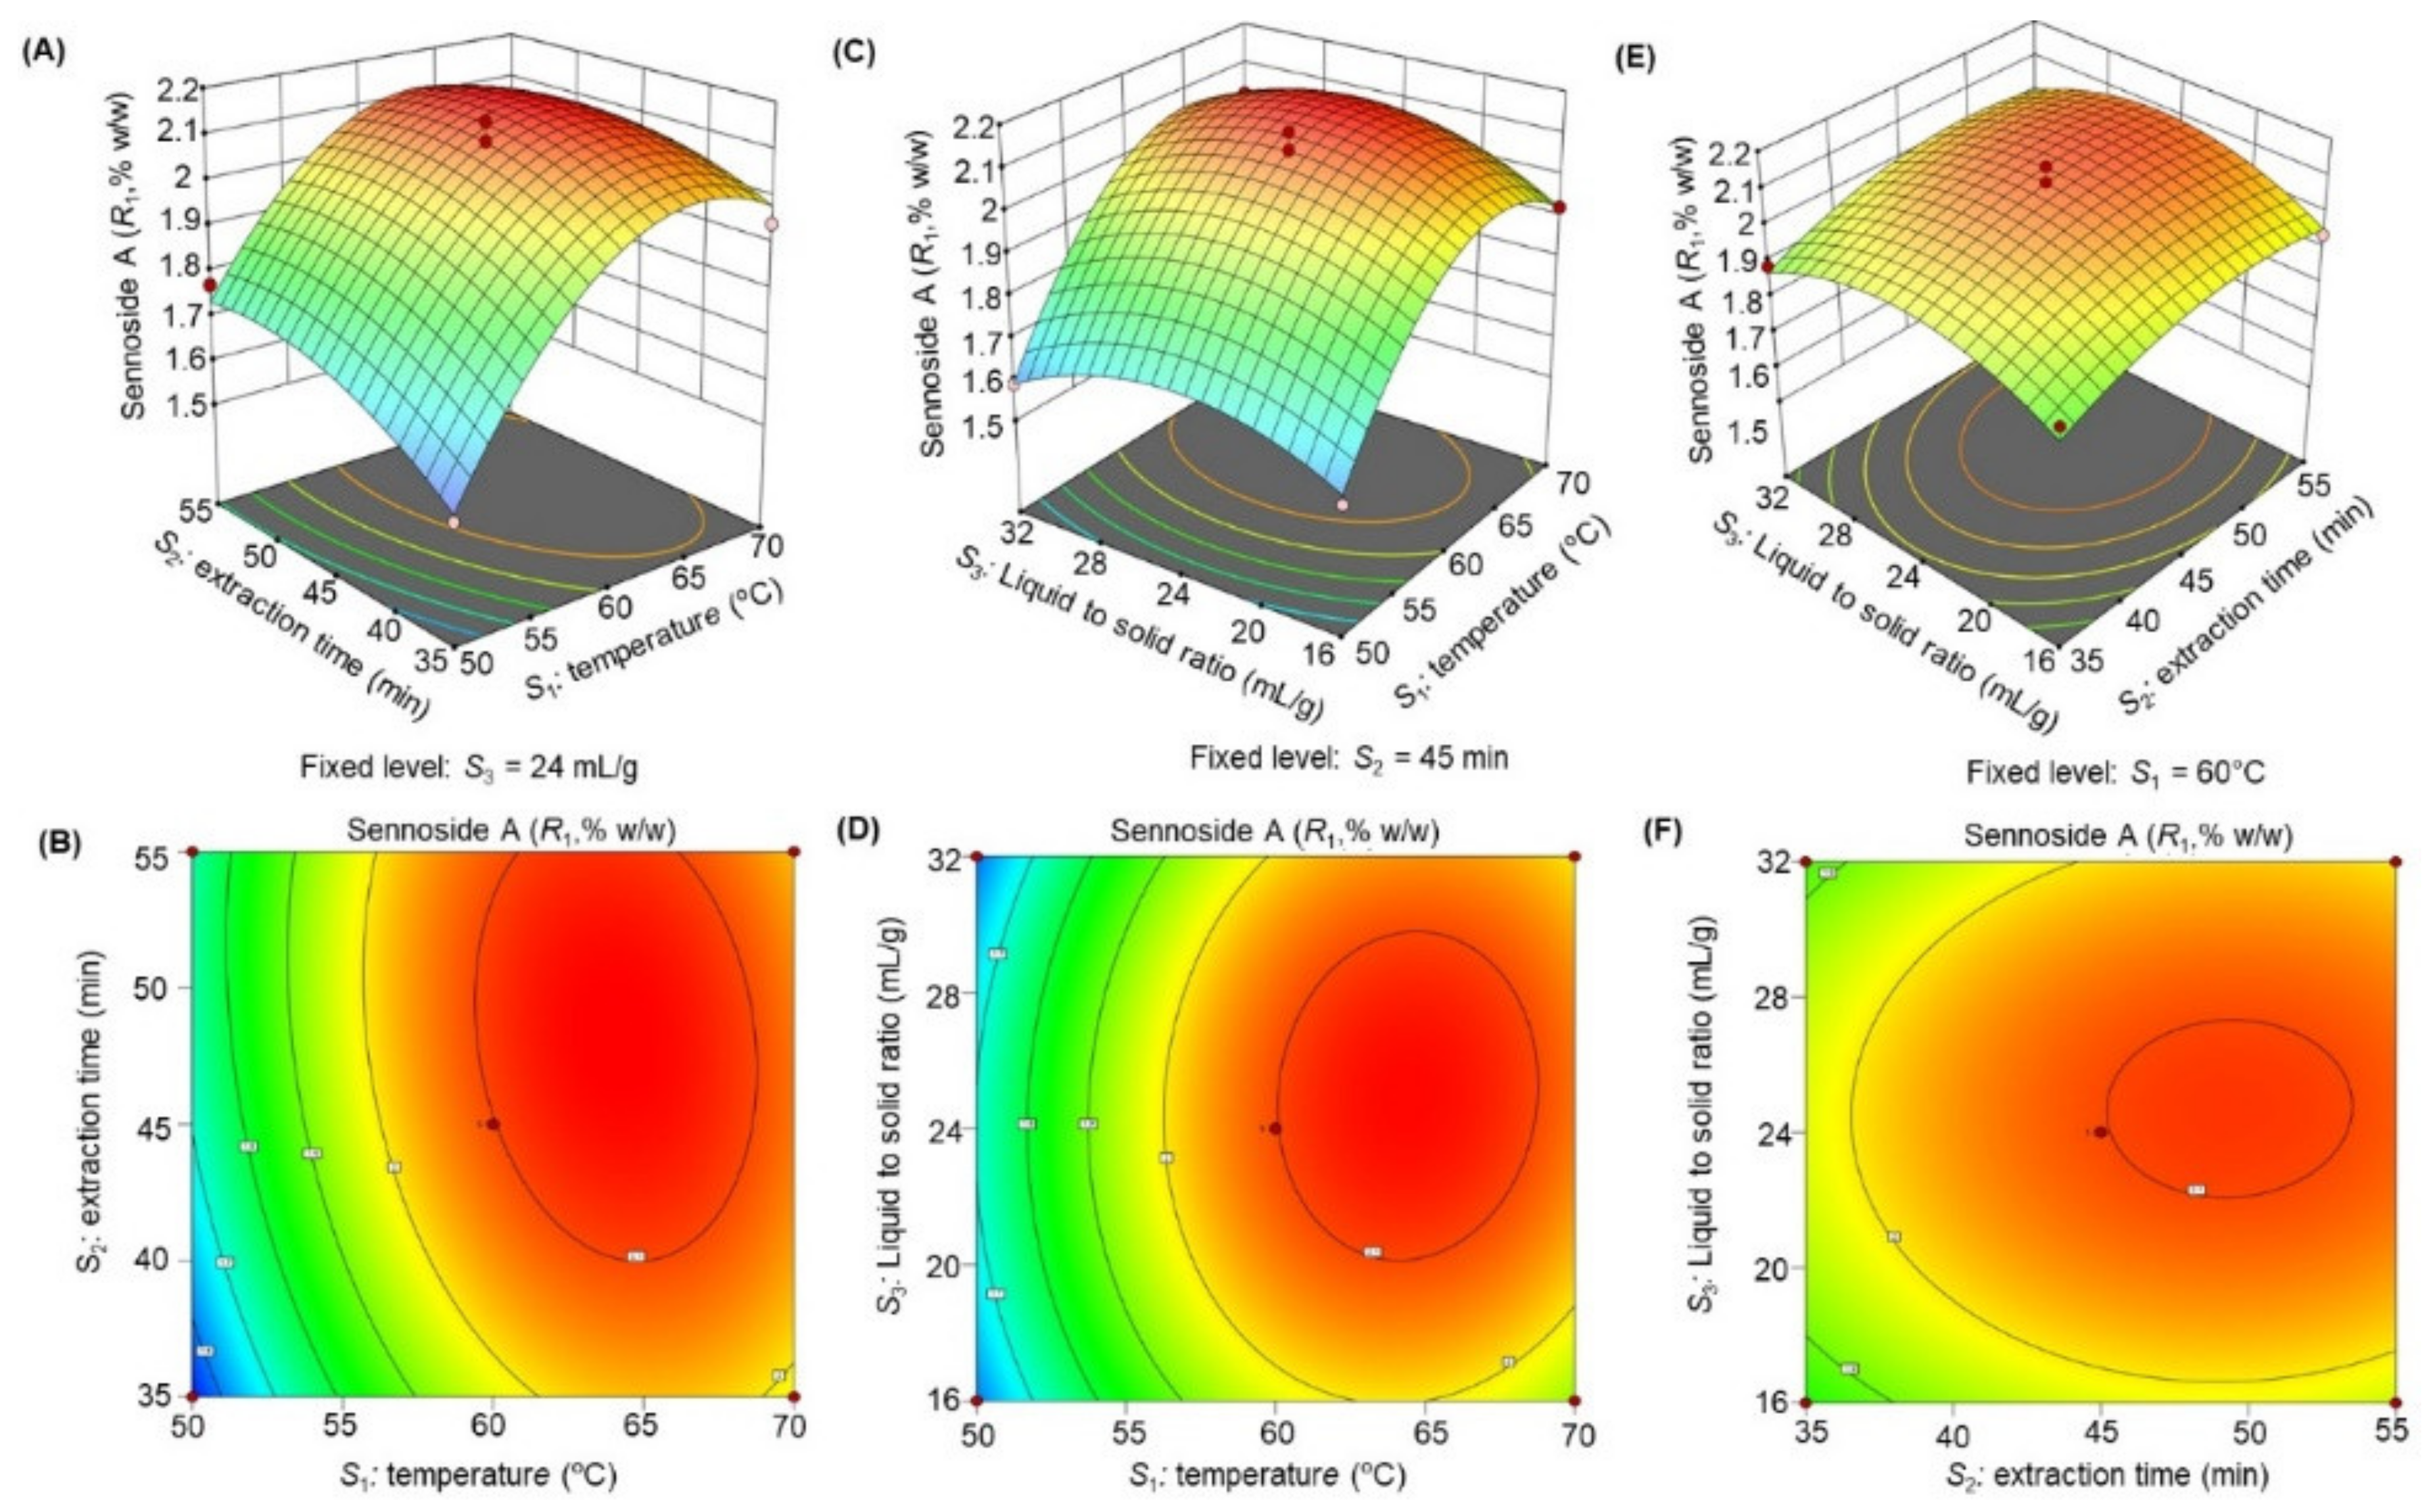
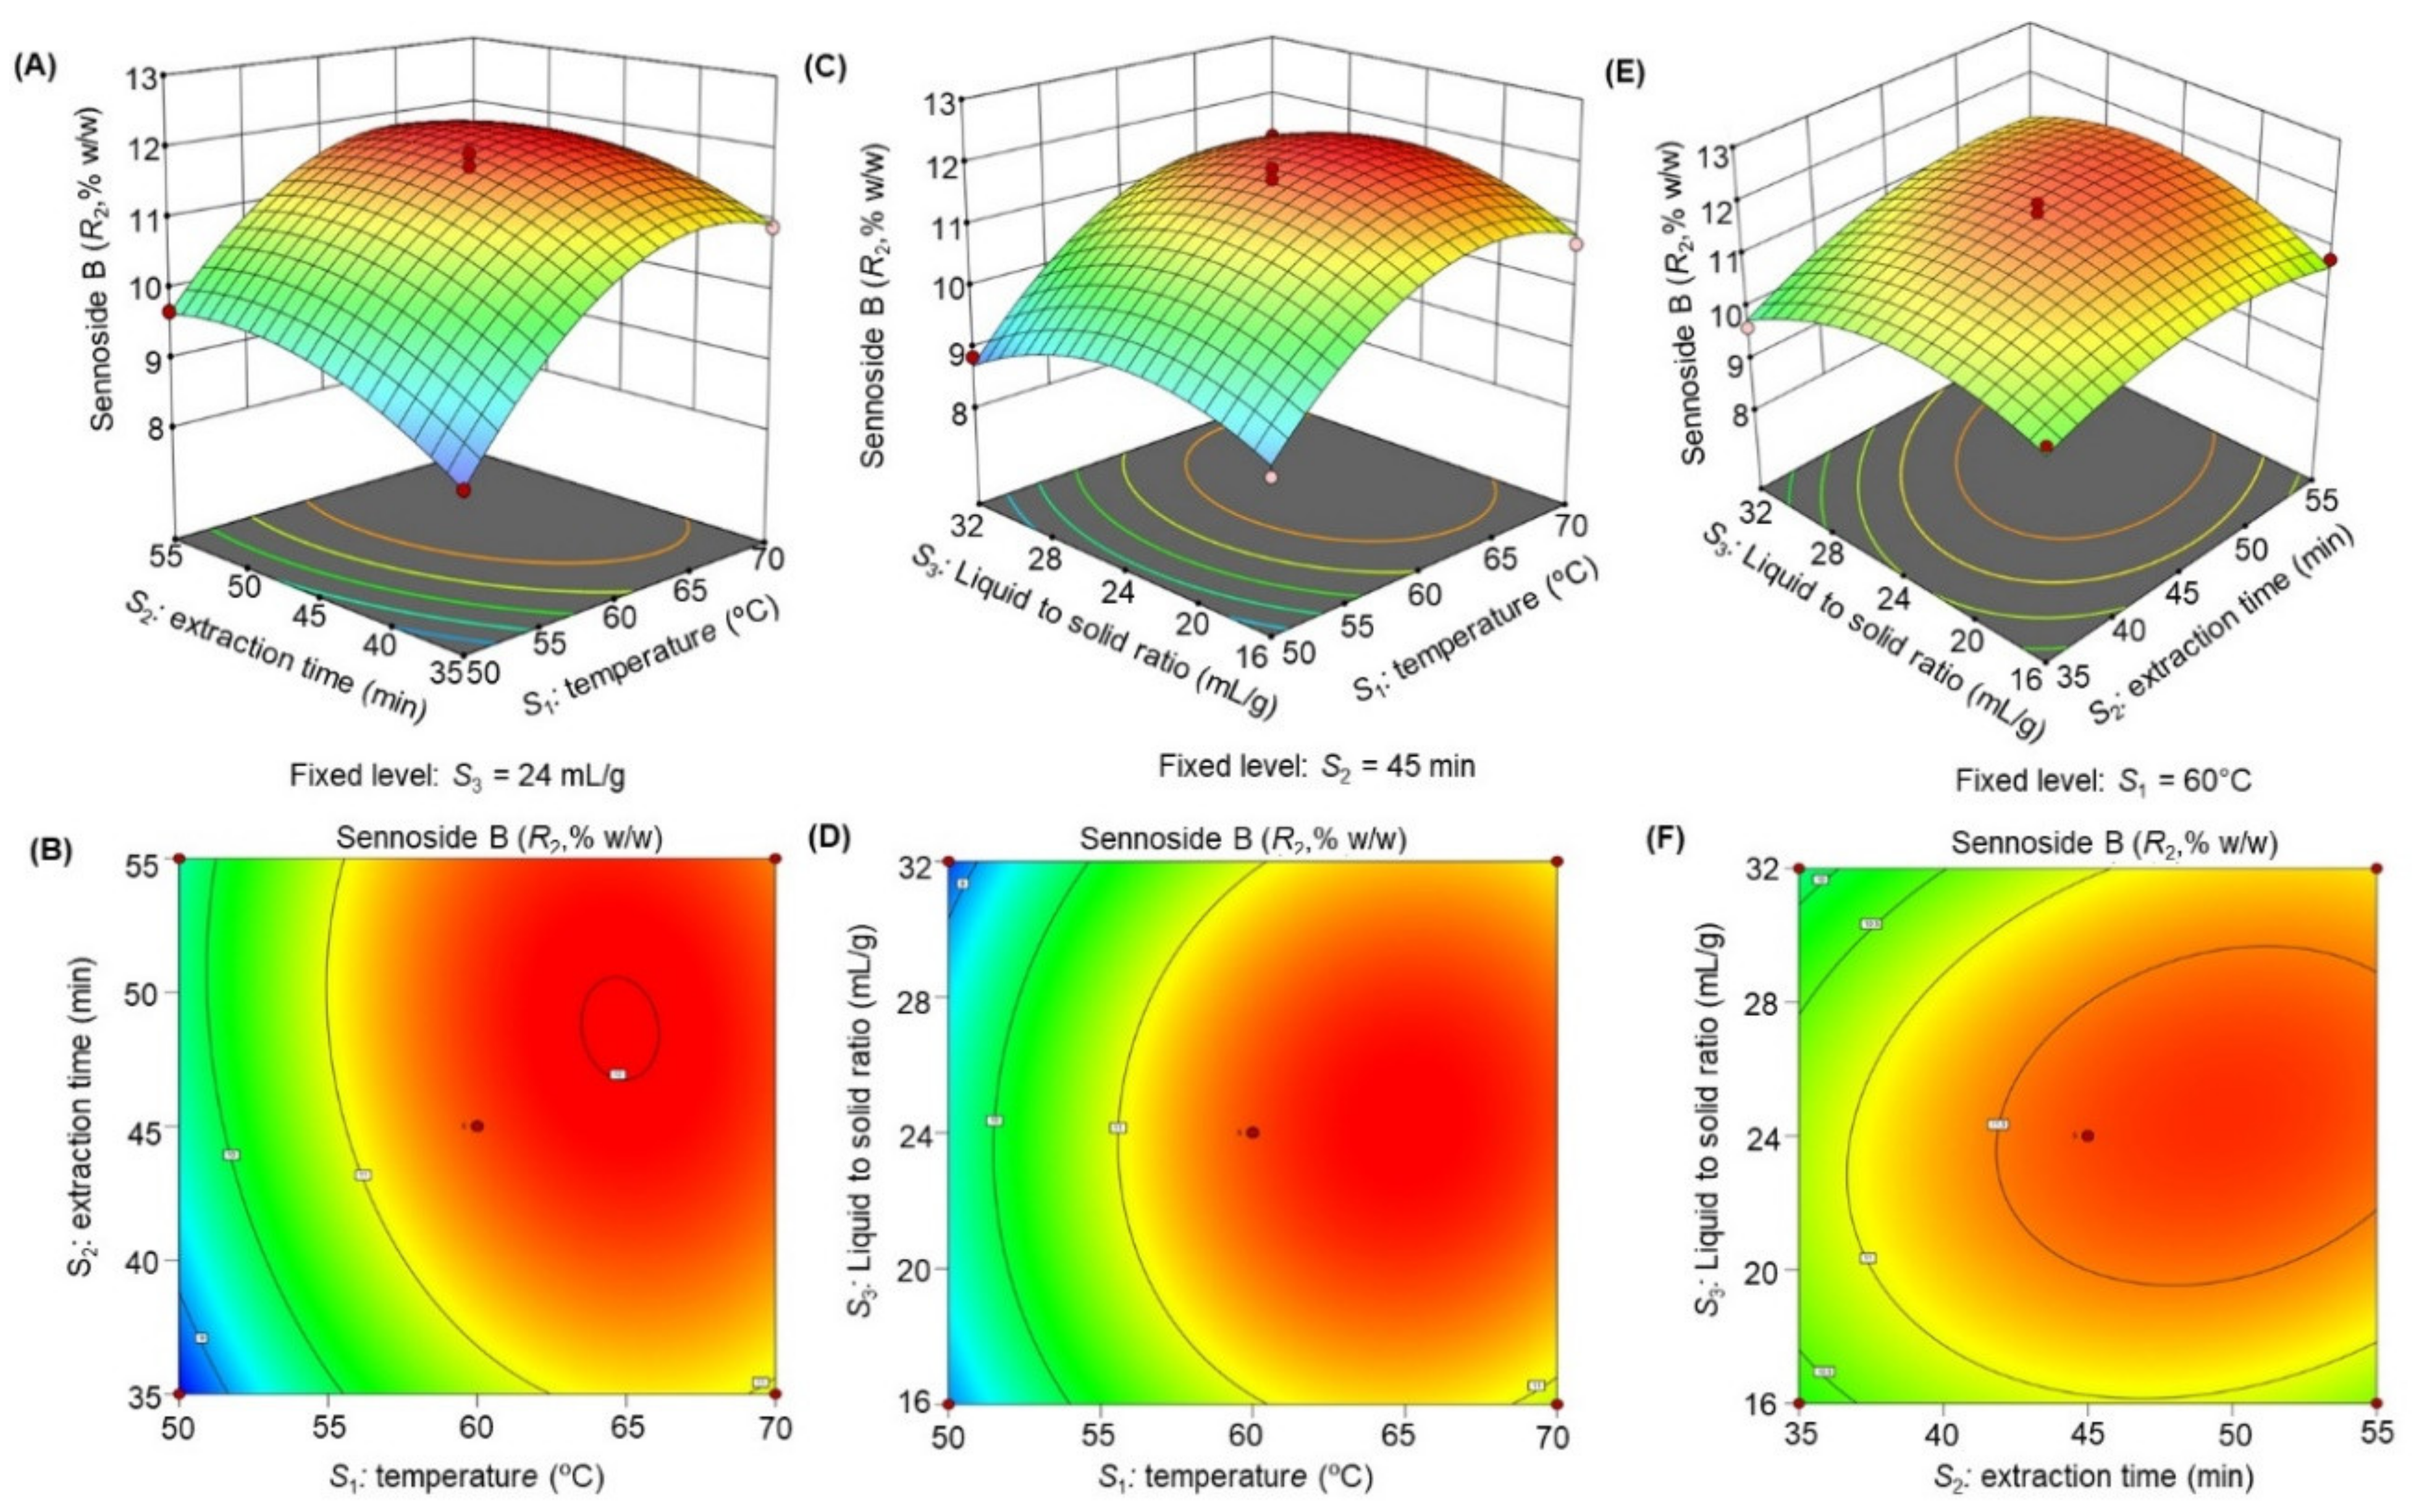
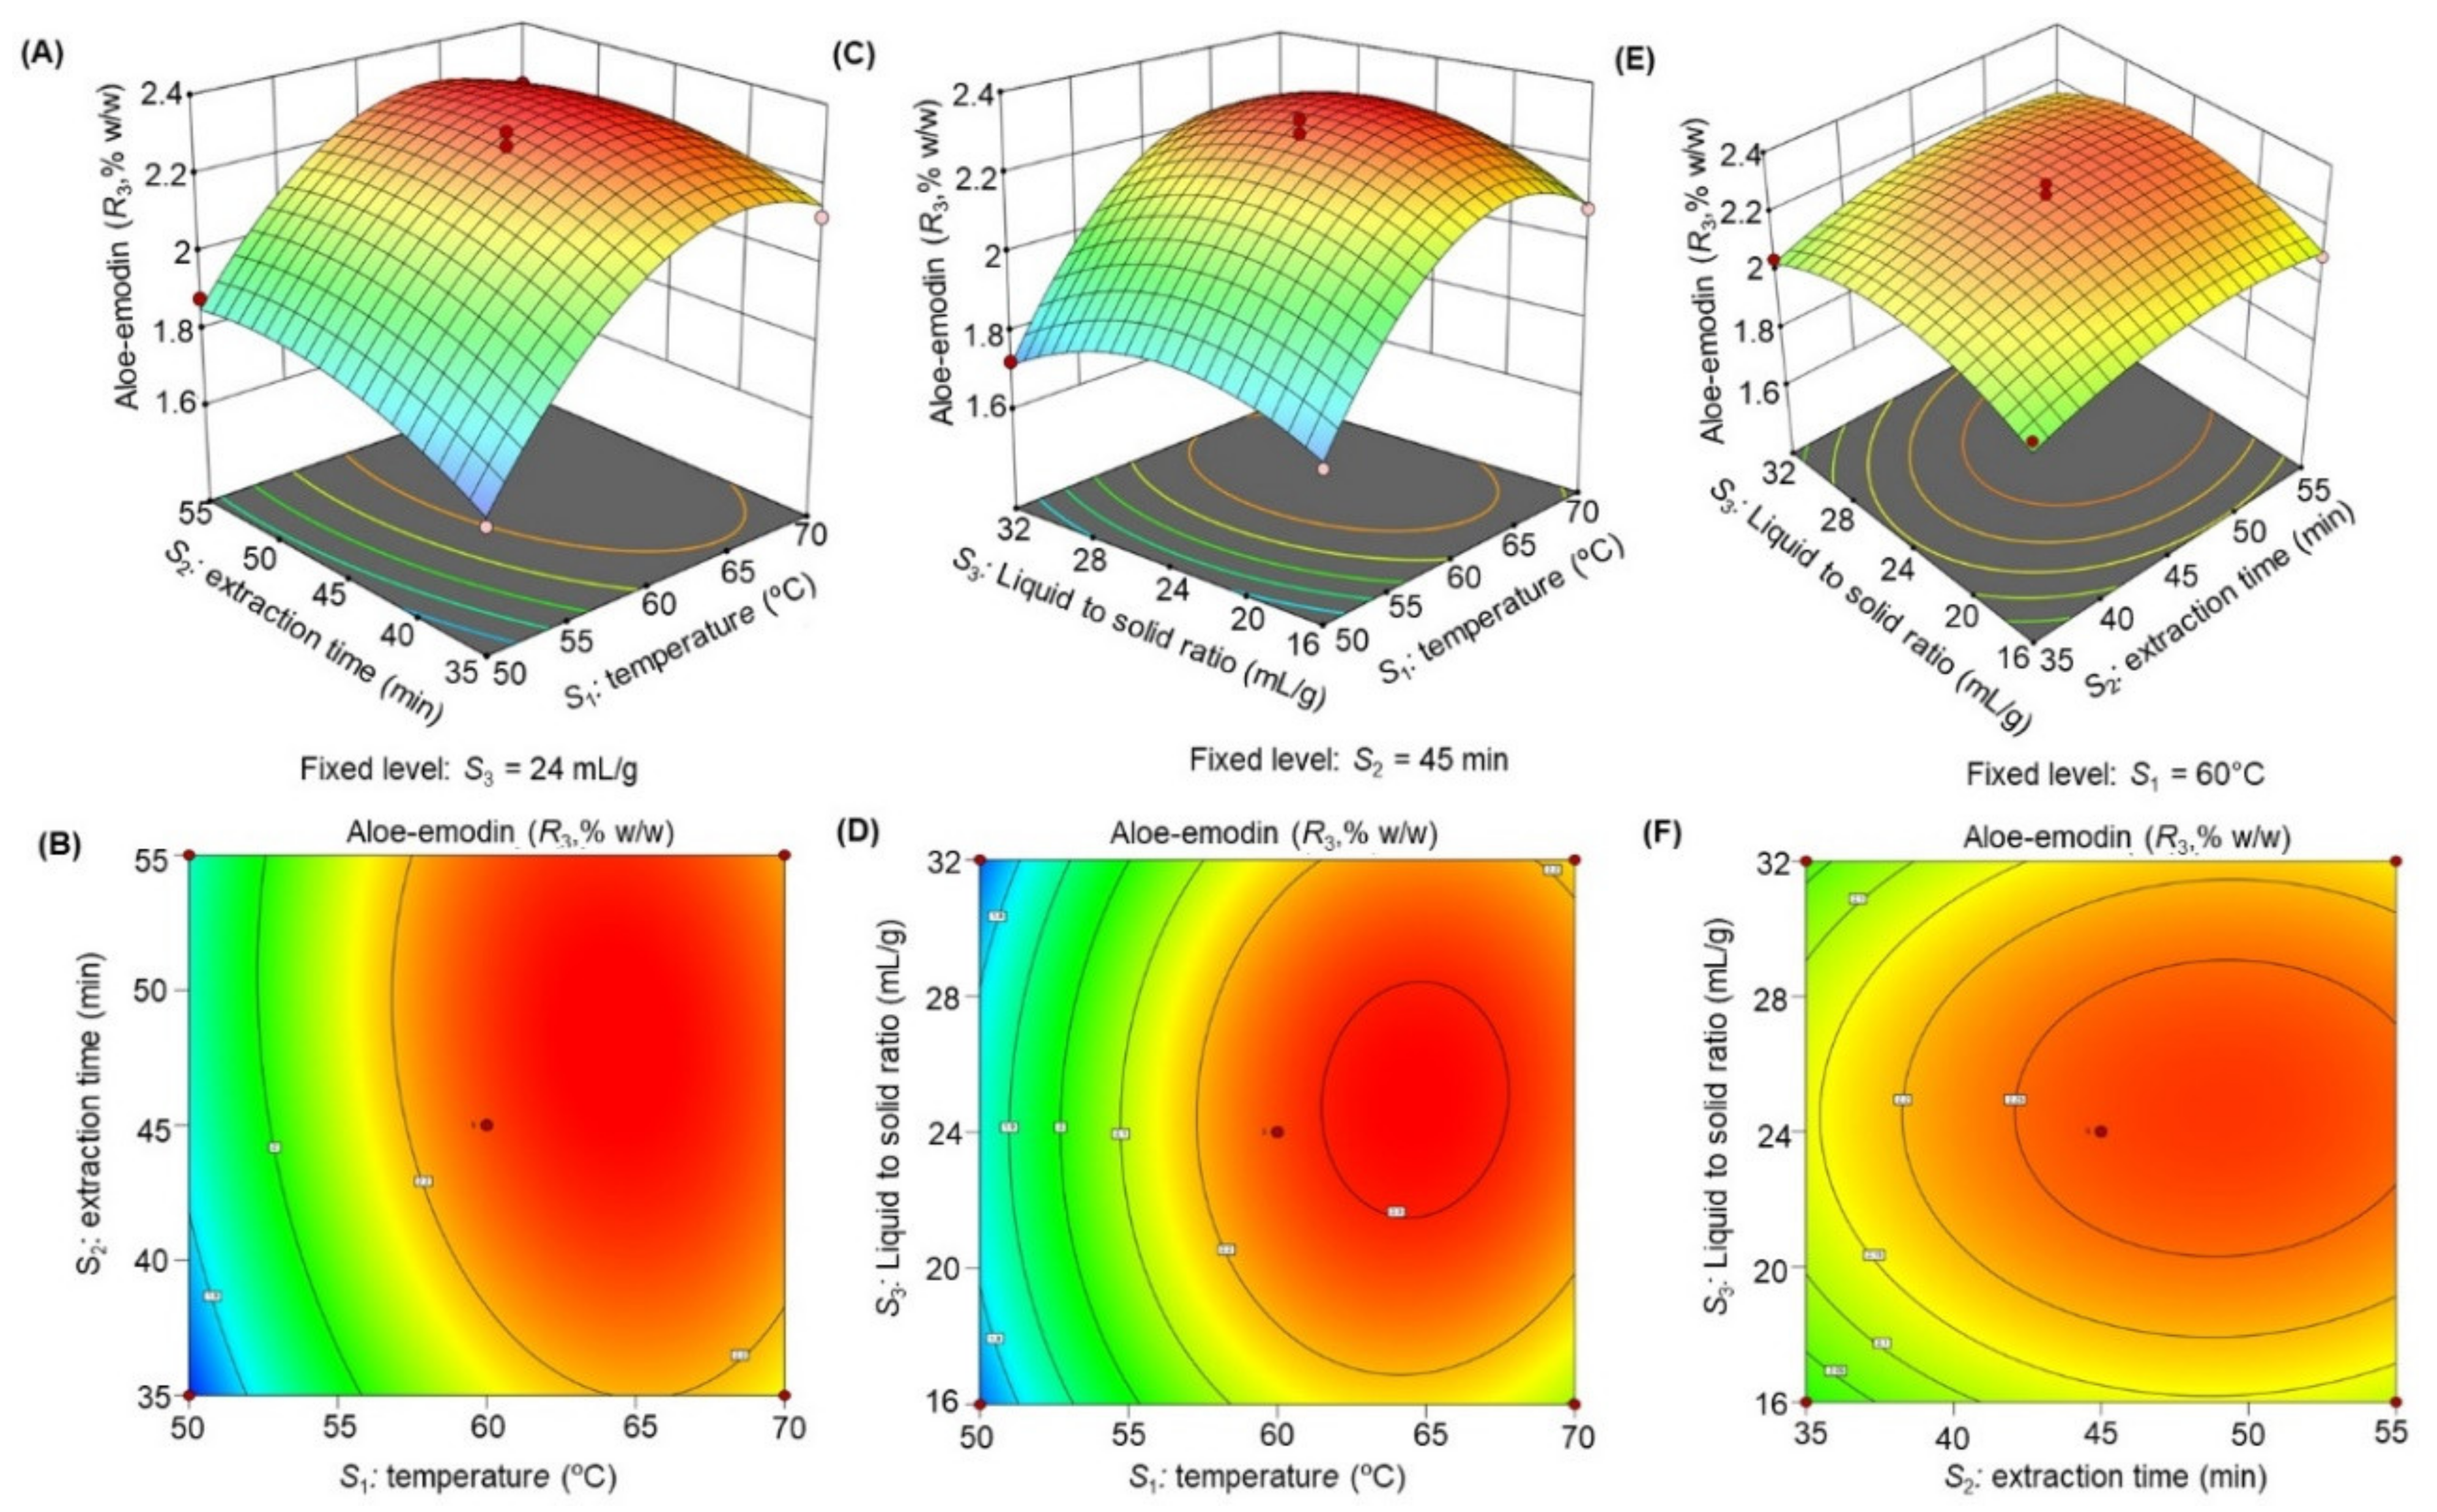
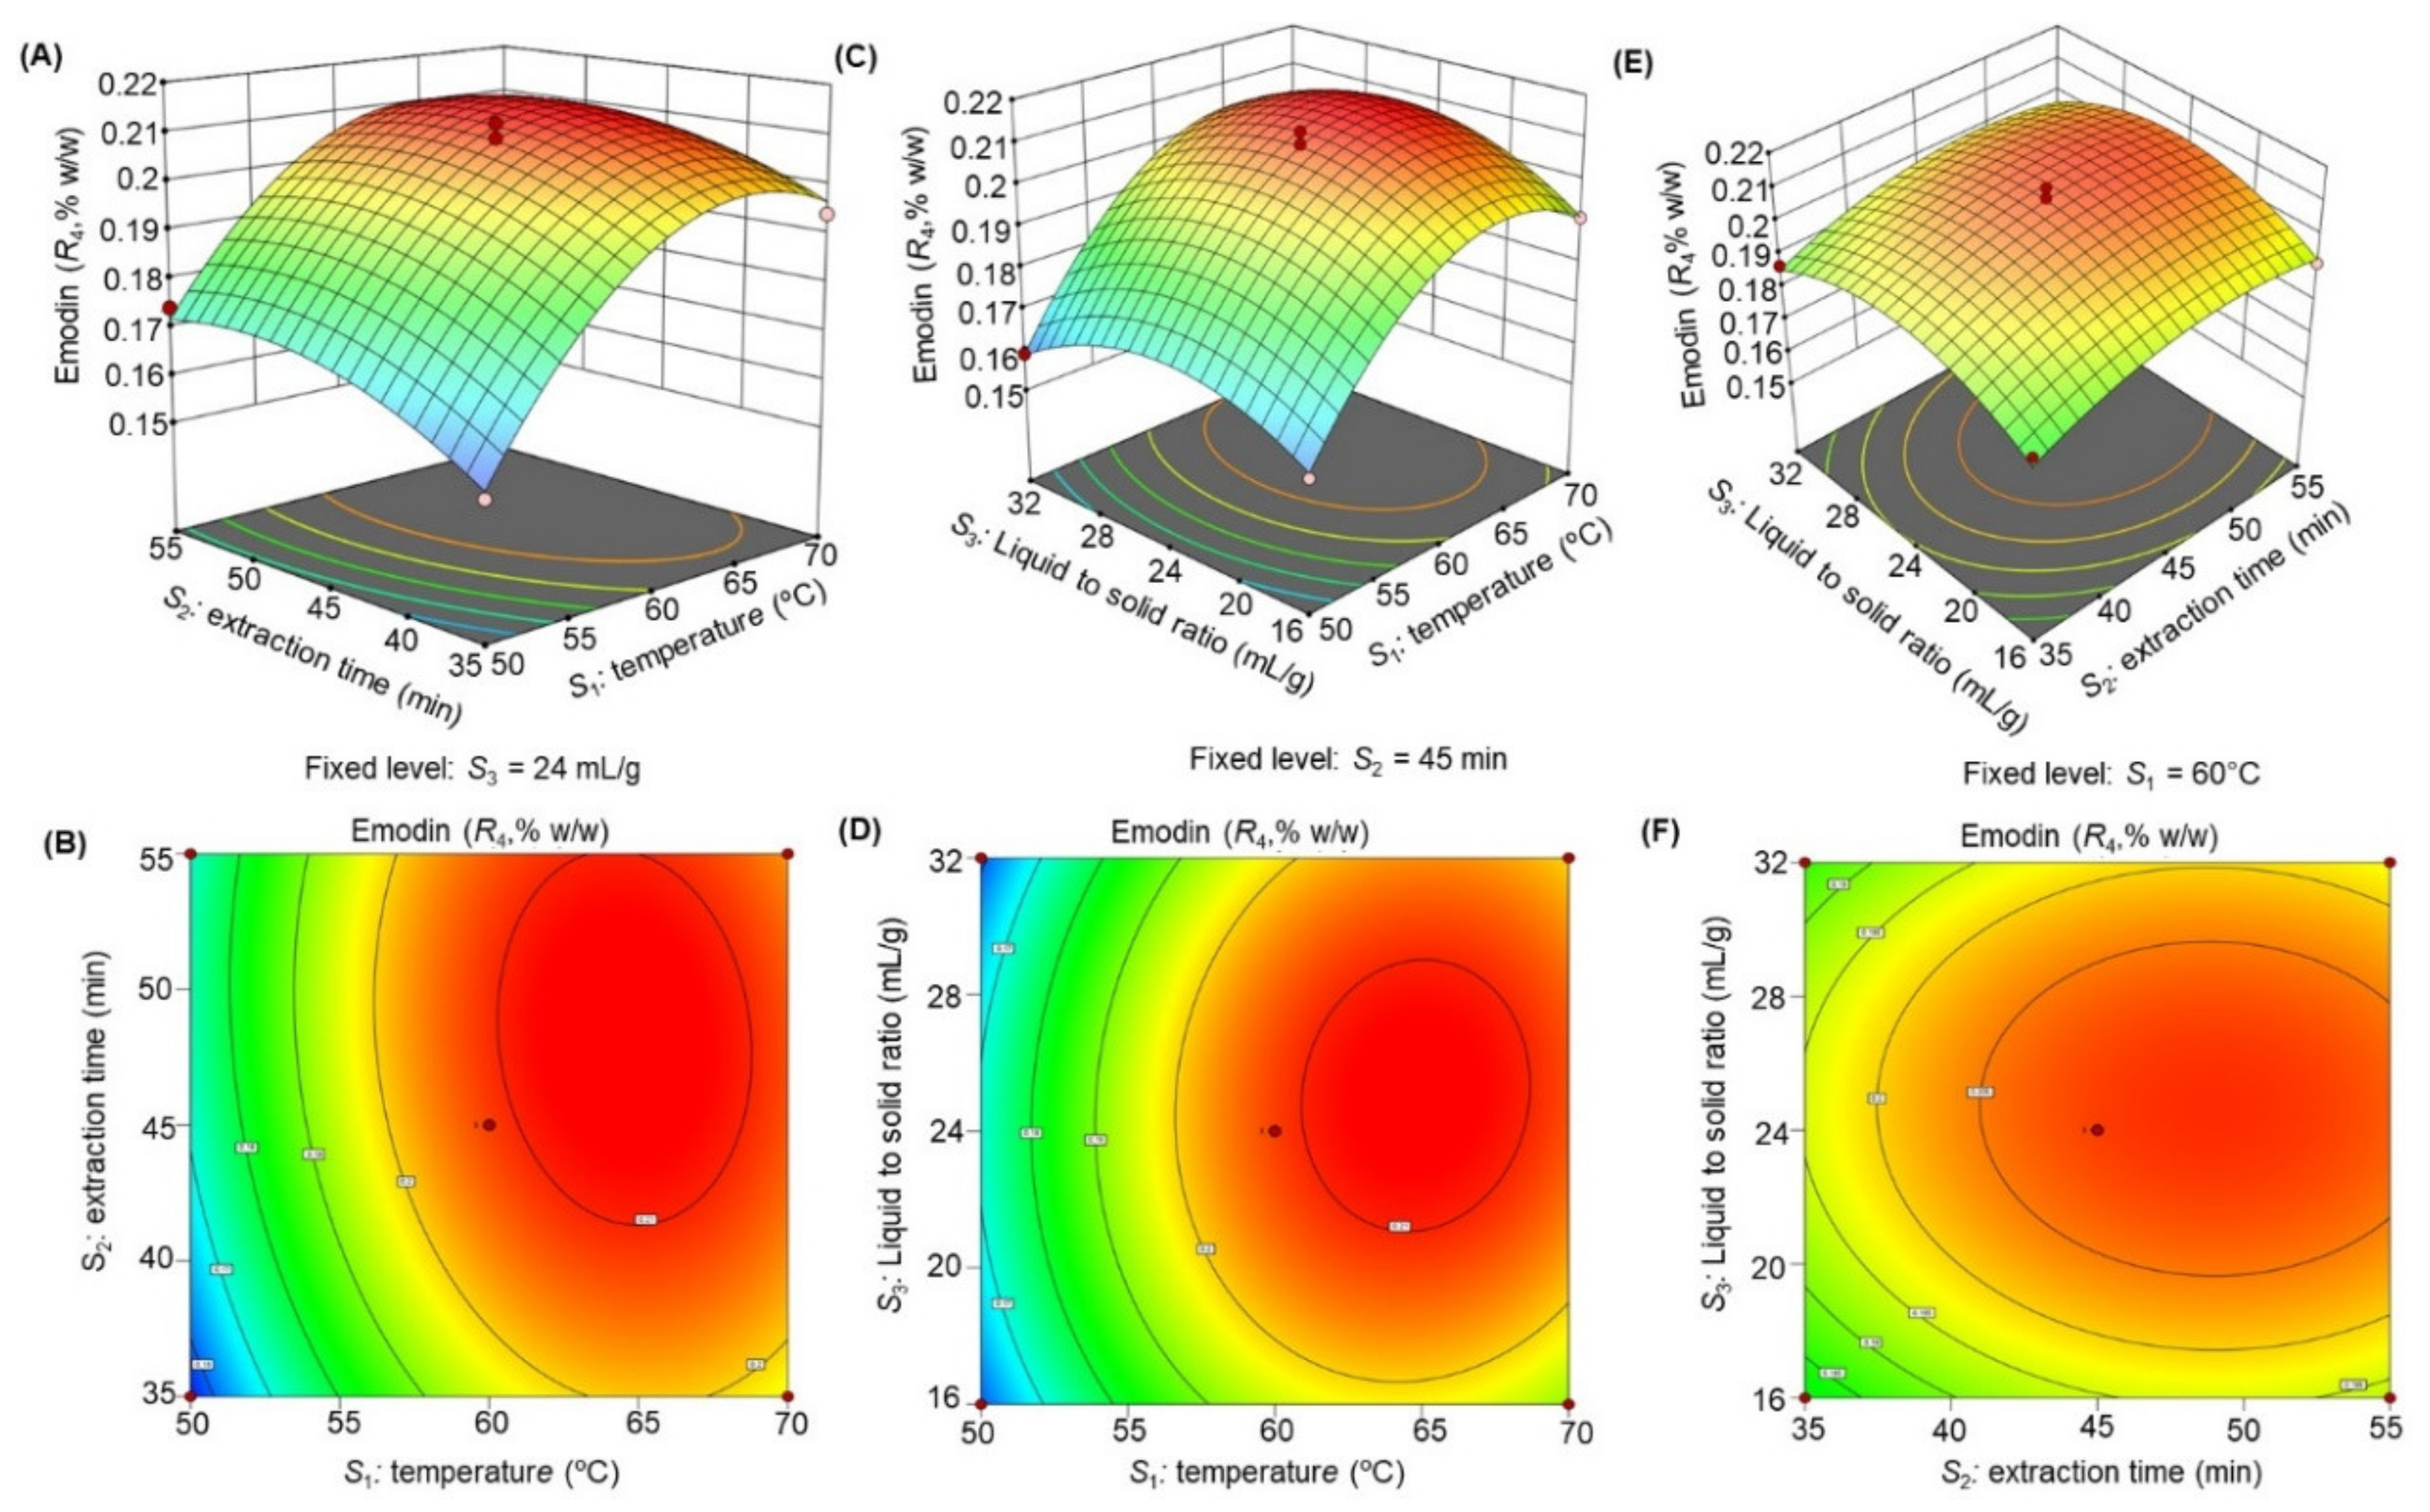
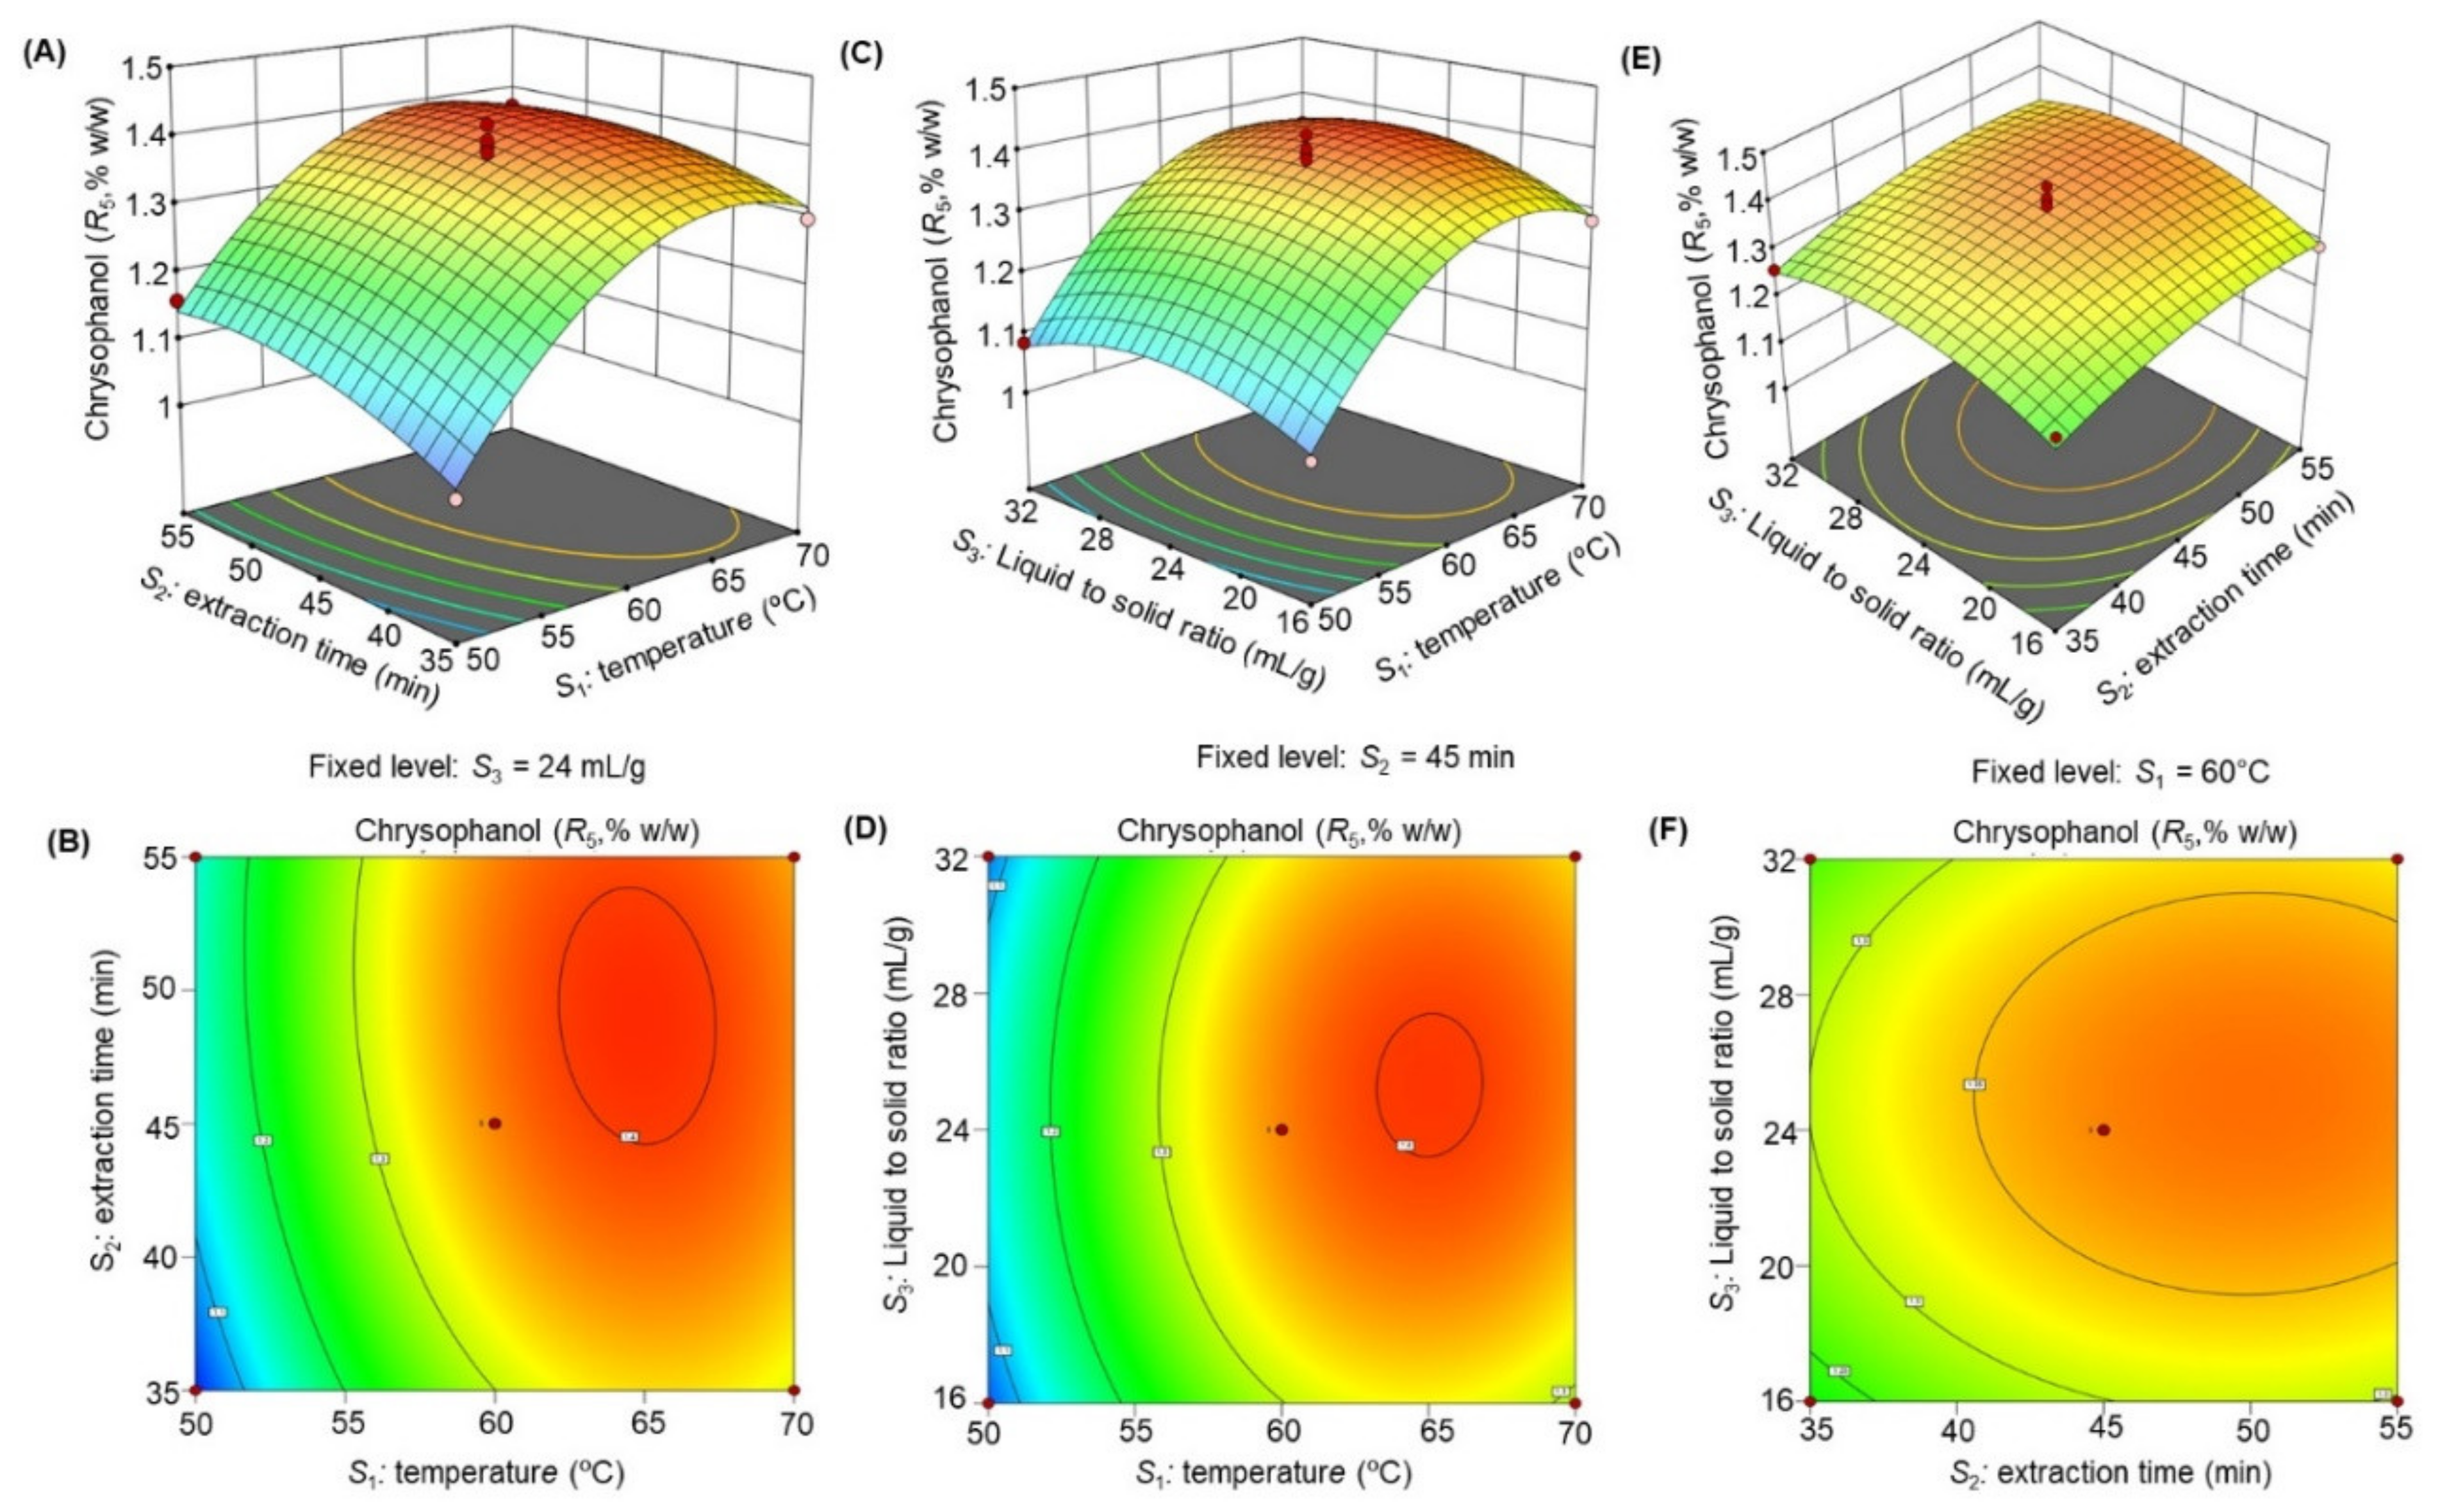
2.2.2. Effect of Independent Variables (S1, S2, and S3) of Ultrasonic Extraction on the Yield of R1, R2, R3, R4, and R5

The influences of individual independent variables S1, S2, and S3, as well as their various interactions with R1, R2, R3, R4, and R5, are listed in Table 4. The linear effects of two variables (S1, S2) and quadratic effects of all three variables (S12, S22, and S32) were found to be significant (p < 0.05), and affect the yields of R1, R2, R3, R4, and R5. The linear effect of the liquid to solid ratio (S3) as well as the interaction effects of all three variables (S1S2, S1S3, and S2S3) exhibited no significant effect (p > 0.05) on the yield of any of the dependent variables (R1, R2, R3, R4, and R5). The high F-values of the linear and quadratic effects of S1 indicated that, among all the dependent variables, S1 has the most impact on the extraction dependent variables. Thus, the extraction will increase most with increasing extraction temperature but at high temperatures, the extraction will decrease.
The R2/percentage coefficient of variation values for all dependent variables (R1, R2, R3, R4, and R5) were 0.9817/2.06, 0.9850/1.96, 0.9858/1.85, 0.9895/1.53, and 0.9199/4.14, respectively, demonstrating good precision and reliability of the experimental values [24].
The response surface 3D plots and 2D contour plots (Figure 3, Figure 4, Figure 5, Figure 6 and Figure 7) were designed to show the interaction effects of the independent variables (S1, S2, and S3) on the yields of the dependent variables (R1, R2, R3, R4, and R5). Each panel demonstrates the effect of two factors on the extraction yields while the third factor was fixed at a base level (60 °C for S1, 45 min for S2, and 24 mL/g for S3). The effects of S1 and S2 (sub-figures A, B in Figure 3, Figure 4, Figure 5, Figure 6 and Figure 7), S1 and S3 (sub-figures C, D in Figure 3, Figure 4, Figure 5, Figure 6 and Figure 7), and S2 and S3 (sub-figures E, F in Figure 3, Figure 4, Figure 5, Figure 6 and Figure 7) on R1, R2, R3, R4, and R5 were recorded. Sub-figures A, B in Figure 3, Figure 4, Figure 5, Figure 6 and Figure 7 showed that the extraction yields of the dependent variables were highest at S1 of 63.8 °C and S2 of 51.6 min. When S1 exceeded 63.8 °C, the yield was found to decrease. The extraction yields of R1R5 increased when S1 was set at 63.5 °C and S3 at 25.6 mL/g, as shown in sub-figures C, D in Figure 3, Figure 4, Figure 5, Figure 6 and Figure 7. Sub-figures E, F in Figure 3, Figure 4, Figure 5, Figure 6 and Figure 7 demonstrate the effect of S2 and S3 interaction on the dependent variables; no significant changes were recorded with an increase in S3, however, a significant increase was observed with increasing S2. Based on these observations, we concluded that the maximal R1, R2, R3, R4, and R5 could be extracted from the aerial parts of S. alexandrina using UAE at a temperature of 63.8 °C, extraction time of 51.6 min, and a liquid to solid ratio of 25.6 mL/g.

2.2.3. BBD Method Validation

The validation of the BBD method used for the analysis was performed by comparing the experimental values and predicted values of the responses (R1, R2, R3, R4, and R5). Establishing the suitability of the generated polynomial equation and BBD application was performed using the percentage prediction error, where small percentage prediction error values demonstrate the validity of the generated polynomial equation and application of the BBD model. The linear correlation between actual and predicted values of R1, R2, R3, R4, and R5 demonstrated high R2 values of 0.9923, 0.9949, 0.9918, 0.9972, and 0.9941, respectively, indicating excellent goodness of fit (p < 0.001).

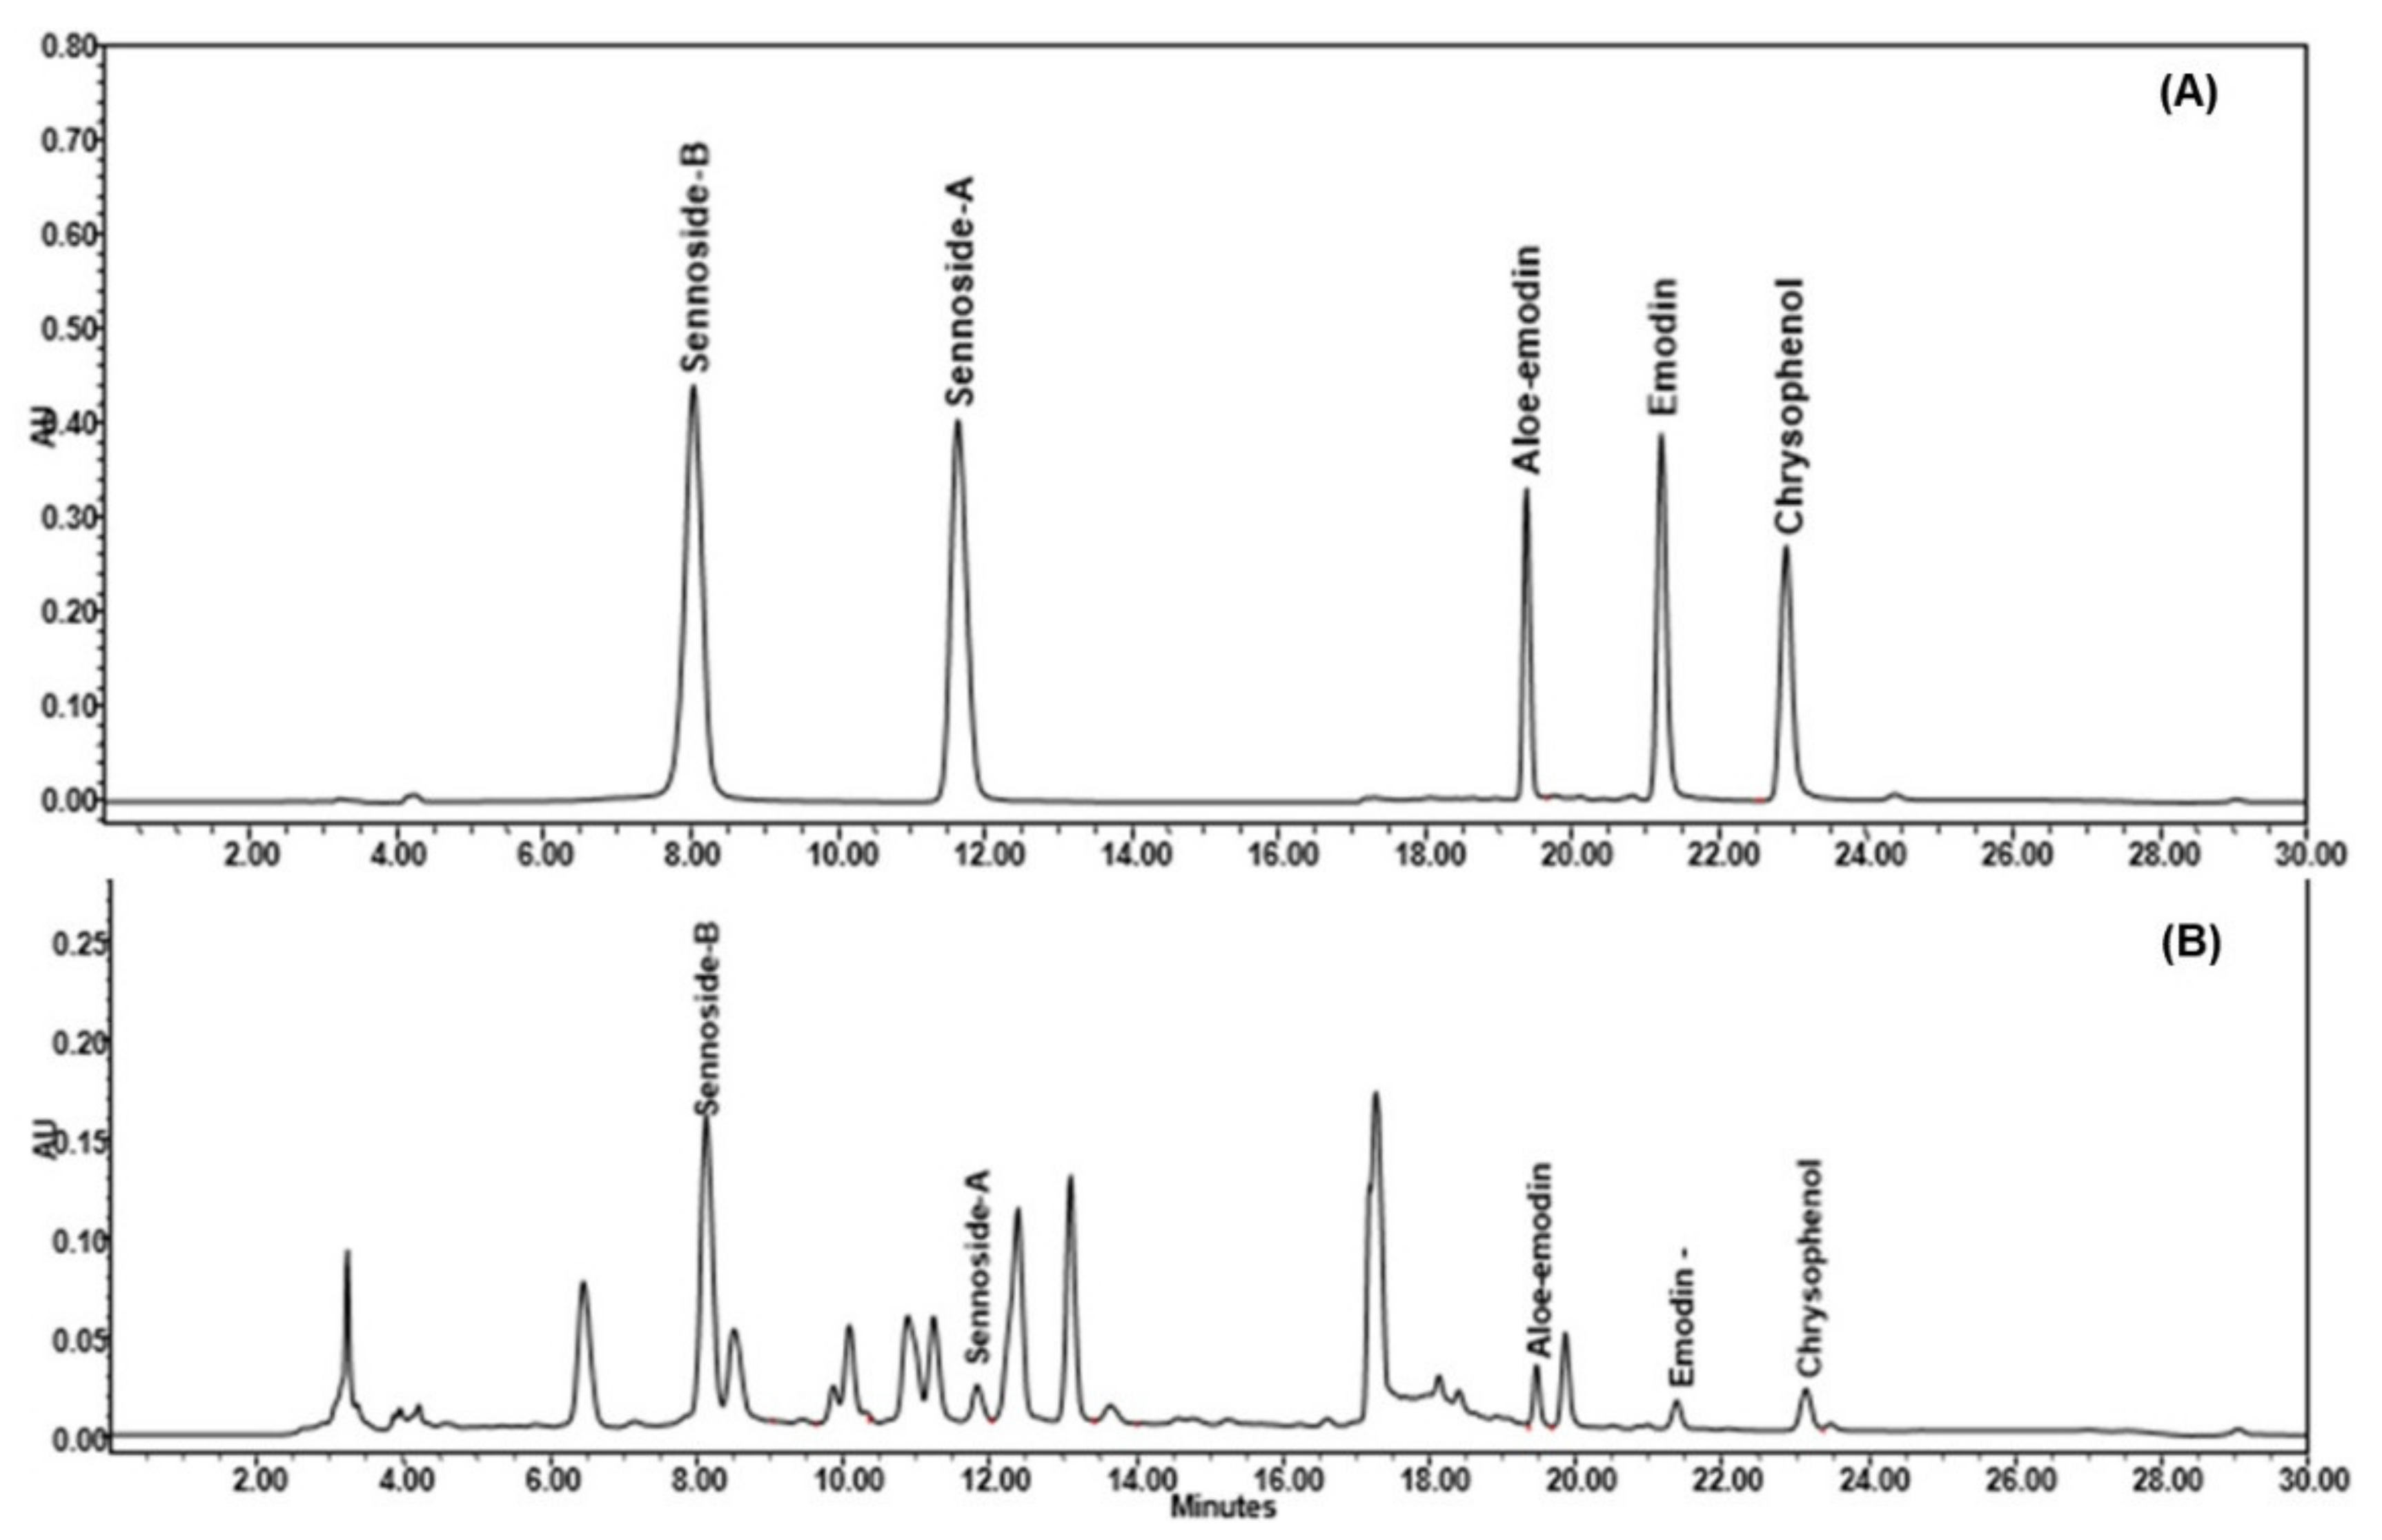
2.3. HPLC Analysis of BBD Optimized SAME

A pinnacle DB Aqueous C18 reversed-phase packing column (Bellefonte, Pennsylvania, United States; 4.6 × 250 mm, 5 μm) was used to separate sennoside A (R1), sennoside B (R2), aloe-emodin (R3), emodin (R4), and chrysophanol (R5), along with the various phytoconstituents available in S. alexandrina methanol extract (SAME) using 0.5% formic acid in ultra-pure water and acetonitrile (a gradient elution) as a mobile phase. Figure 8A illustrates the separation of R1R5 at 272 nm for quantitative analysis. A robust baseline separation was achieved in 26 min. Figure 8B demonstrates a representative chromatogram of S. alexandrina (aerial parts) extracted with methanol by the optimized ultrasonication method. In this experiment, we used the gradient system for elution of the standards and SAME as this approach increases the elution strength, sensitivity, and efficiency of the HPLC column, improves separation quality and detection limit, and decreases the analysis time and column degradation due to strongly retained analytes. Under these conditions, the retention times of sennoside B, sennoside A, aloe-emodin, emodin, and chrysophanol were found to be 8.078, 11.79, 19.43, 21.25, and 22.98 min, respectively.
The developed HPLC method yielded high linearity for sennoside A, sennoside B, aloe-emodin, emodin, and chrysophenol (r2 = 0.999, each) in the 0.5–20 µg/mL linearity range, and low limit of detection (LOD)/limit of quantification (LOQ) (µg/mL) values for sennoside A (0.09/0.29), sennoside B (0.009/0.03), aloe-emodin (0.07/0.23), emodin (0.09/0.273), and chrysophenol (0.019/0.06). The intraday/interday precision (%RSD, relative standard deviation) was recorded at different concentration levels (5, 10, and 15, µg/mL) and found to be: 4.84–5.81%/3.83–4.74% for sennoside A; 3.84–5.41%/3.03–4.81% for sennoside B; 3.22–4.88%/2.42–4.55% for aloe-emodin; 2.80–4.07%/2.20–3.81% for emodin; and 4.21–4.81%/3.62–4.61% for chrysophenol. Such low precision values for the standards indicate that the method is repeatable.

2.4. Verification of Optimized Microwave-Assisted Extraction Conditions

The selected factors (S1S3) demonstrated diverse effects on the yield of dependent variables (R1R5) (Table 5). The predicted optimal levels for R1R5 extraction were found to be S1 of 63.8 °C, S2 of 51.6 min, and S3 of 25.6 mL/g, which were predicted to yield (% w/w) R1 (2.152), R2 (12.031), R3 (2.331), R4 (0.214), and R5 (1.411). The predicted optimal level for each extraction factor was further modified to S1 of 64.2 °C, S2 of 52.1 min, and S3 of 25.2 mL/g to obtain the maximum yields of R1R5. The modified level of all extraction factors was used (n = 3) for the extraction of aerial parts of S. alexandrina using methanol (SAME) and the analysis of the obtained SAME was carried out using the developed HPLC-UV method to quantify R1R5. By using the modified extraction condition, the amounts (% w/w) of R1, R2, R3, R4, and R5 in SAME were found to be 2.237 ± 0.051%, 12.792 ± 0.475%, 2.457 ± 0.053%, 0.261 ± 0.0052%, and 1.529 ± 0.041%, respectively. The low residual percentages of 1.04, 1.06, 1.05, 1.22, and 1.08% for R1, R2, R3, R4, and R5, respectively, indicated that the model was reliable.

2.5. 2,2-Diphenyl-1-Picrylhydrazyl (DPPH) and 2,2′-Azino-Bis (3-Ethylbenzothiazoline-6-Sulfonic Acid (ABTS) Free Radical Scavenging Activities of SAME Samples

The DPPH radical scavenging activity for the 17 (S1–S17) SAME samples, along with the final BBD-optimized ultrasonic-extracted SAME, were evaluated, and the IC50 (µg/mL) values are shown in Table 6. Among these 17 SAME samples (S1–S17), many exhibited good antioxidant properties. Out of these 17 samples, S5 showed the maximum free radical scavenging property (IC50 = 68.4 ± 2.18 µg/mL) compared with standard ascorbic acid (IC50 = 5.9 ± 0.23 µg/mL). The SAME obtained after using the BBD-optimized ultrasonic extraction parameters exhibited strong antioxidant properties, having IC50 = 59.7 ± 1.93 µg/mL. Both the S5 and BBD-optimized SAME were found to contain a substantial amount of anthraquinone glycosides (sennoside A, sennoside B, aloe-emodin, emodin, and chrysophanol), as evaluated by using the HPLC-UV method, which may explain the samples’ antioxidant properties.
The results of ABTS radical scavenging activity of all SAME samples (S1–S17) as well as BBD-optimized ultrasonic-extracted samples given in Table 6 clearly indicate that the extracts (S5 and BBD-optimized SAME) containing larger amounts of sennoside A, sennoside B, aloe-emodin, emodin, and chrysophanol (evaluated by HPLC-UV method) had greater free radical-scavenging properties (IC50 = 58.9 ± 2.33 and 47.2 ± 1.40 µg/mL, respectively). The optimization of extraction parameters leads to an increase in the extraction of all the standards (evaluated by HPLC analysis), which supported the increase in the free radical-scavenging property of the extract. Al-Zain et al. [25] found DPPH and ABTS antioxidant properties of methanol extract of S. alexandrina root with IC50 values of 235.9 and 321.5 µg/mL, respectively. Ahmed et al. [2] reported free radical-scavenging properties of methanol extract of C. angustifolia leaves with IC50 = 2.49 ± 0.01 µg/mL.

3. Discussion

In this experiment, we investigated the effects of various ultrasonic extraction parameters (extraction temperature, extraction time, and liquid to solid ratio) on sennoside A, sennoside B, aloe-emodin, emodin, and chrysophanol extraction from aerial parts of S. alexandrina using the BBD of RSM. The ultrasonication technique was previously reported to be the best method for sennoside A and sennoside B extraction from C. angustifolia leaves [26] as well as for the extraction of aloe-emodin, emodin, and chrysophanol from Rhamnus alpinus bark [27]. This was the basis of exploiting the ultrasonication extraction method and optimizing the extraction parameters by the BBD approach to obtain maximum yields from aerial parts of S. alexandrina. The BBD of RSM plays an important role in determining the optimal values of independent variables under which the maximum response of dependent variables can be achieved [28]. The response surface and contour plot approaches were used to visualize the correlation between responses and different levels of independent variables and interaction types between two independent variables [29]. In this experiment, at a fixed liquid to solid ratio and extraction time, the yields of sennoside A, sennoside B, aloe-emodin, emodin, and chrysophanol increased with increasing extraction temperatures. Similar results were reported by Zhao et al. [30] and Ruan et al. [31], which may indicate that the solubility of these substances increases with increased temperature and, thus, the total yields also increase. Furthermore, the sennoside A, sennoside B, aloe-emodin, emodin, and chrysophanol yields increased with increasing extraction time to a maximum, followed by a decline with further increases in extraction time. The decrease in extraction yields may be due to degradation of the phytoconstituents upon prolonged ultrasound action [32]. Mason et al. [33] reported that ultrasound may induce the formation of acoustic cavities, which prompted cracking of the plant cells. The plant cells cracked completely with increasing extraction time due to acoustic cavitation, thus increasing the extraction yields of the desired compounds. However, insoluble constituents, along with cytosol, become suspended in extraction solvent when the plant cells rupture, resulting in a reduction of the solvent permeability [34]. Additionally, the desired constituents become re-adsorbed on the ruptured plant particles because of their comparatively more specific surface areas, thus decreasing the yields [35]. A mathematical optimization was performed by using the BBD of RSM to decide the optimum level of different extraction variables to obtain maximum yields of the desired compounds. An extraction temperature of 63.8°C, 51.6 min extraction time, and a 25.6 mL/g liquid to solid ratio were determined as the optimal extraction conditions for the ultrasonication technique. The maximum response values (% w/w) were predicted as 2.152, 12.031, 2.331, 0.214, and 1.411% of sennoside A, sennoside B, aloe-emodin, emodin, and chrysophanol, respectively, under these operating conditions. The experiment was performed again with a modified extraction condition (extraction temperature of 64.2 °C, extraction time of 52.1 min, and 25.2 mL/g liquid to solid ratio) to obtain the maximum yield of the desired compounds. The extraction procedure with modified conditions was performed in triplicate, and the results of experimental values were compared with the predicted values. Mean values (% w/w) of 2.237% ± 0.051, 12.792% ± 0.475, 2.457% ± 0.053, 0.261% ± 0.0052, and 1.5297% ± 0.041, respectively, for sennoside A, sennoside B, aloe-emodin, emodin, and chrysophanol were obtained using the modified extraction procedure, which were very close to the predicted values, demonstrating the validity of the RSM model and also demonstrating that the suitability of the model for this extraction procedure.
Several phenolic substances, of both natural and synthetic origin, have been shown to act as antioxidant and radical scavengers, In particular, the flavonoids, which constitute an ubiquitous class as metabolites in higher plants, have been reported to contain numerous active substances [36,37]. In contrast, the anthraquinones and anthrones appear to be nearly unknown in this respect. However, it has been reported that substances of this class have interesting effects as antioxidants; some anthrones may have prooxidant activity due to their ability to generate superoxide anions [12]. It was found that anthraquinones such as chrysophanol and rhein accelerated the formation of hydroxyl radicals and among these compounds, emodin exhibited the strongest scavenging effect on hydroxyl radicals [38]. Emodin has been known to be pharmacologically potent and this characteristic was reported to be associated with its scavenging of hydroxyl radicals [39]. In contrast, the prooxidant ability of chrysophenol may derive from its greater formation of hydroxyl radicals [12]. In this experiment excellent antioxidant properties were exhibited by SAME obtained using the optimized extraction conditions with DPPH assay (IC50 = 59.7 ± 1.93, µg/mL) and ABTS methods (IC50 = 47.2 ± 1.40, µg/mL) compared to standard ascorbic acid. This supported the HPLC-UV analysis of antioxidant marker like emodin, chrysophenol in good quantity in SAME. There may be other compounds present in SAME along with these compounds that might support the antioxidant action of these markers synergistically.

4. Materials and Methods

4.1. Plant Material

The aerial parts of S. alexandrina (voucher specimen no. 16245) were collected in 2014 from Badr, Kingdom of Saudi Arabia by Dr. Md. Yusuf (field taxonomist, Pharmacognosy Department), and the specimen was deposited in the herbarium of Pharmacognosy Department, College of Pharmacy, King Saud University, Saudi Arabia. The collected aerial parts were cut into small pieces, washed with plain water, dried in the plant drying room in the Pharmacognosy Department, and stored in a tightly packed glass jar. Before extraction, the aerial parts were coarsely powdered using a grinder.

4.2. Apparatus and Reagents

The standard compounds sennoside A (≥96.0%), sennoside B (≥90.0%), aloe-emodin (≥95%), emodin (≥97.0%), and chrysophanol (≥98.0%) were purchased from Sigma-Aldrich (St. Louis, MO, USA). The HPLC-grade methanol and acetonitrile were procured from WINLAB (Market Harborough, UK). A Millipore Milli-Q® (Bedford, MA, USA) assembly was used to obtain highly pure water. A Millipore-Millex-HV® filter unit with a membrane filter (0.45 µm pore size) was used for the filtration of solvents, and a syringe filter of 0.22 µm was used for sample preparation. For quantitative analysis, an Alliance 2695 separation module equipped with a 2487 dual wavelength absorbance detector (Waters Instruments, Inc., Milford, MA, USA) was used. DPPH and ABTS reagents for antioxidant assays were procured from Sigma-Aldrich (St. Louis, MO, USA).

4.3. Ultrasound-Assisted Extraction of S. alexandrina Aerial Parts

The extraction of S. alexandrina powdered aerial parts (1 g) was executed in a 50 mL conical flask by UAE using a Sonics vibra cell (Model VCX-750; Sonics, Newtown, CT, USA) with methanol as solvent. Post-extraction, the SAME was cooled and filtered, and the residue was washed thrice with methanol to obtain the final SAME volume, which was then filtered using a syringe filter (0.45 µm, Phenomenex, Torrance, CA, USA). The final filtered extract was dried using a rotavapor (R-300, Buchi, Flawil, Switzerland) to obtain the final percentage yield.

4.4. BBD Experimental Design

4.4.1. Single Factor Experimental Design

The extraction variables (extraction temperature, time, and liquid to solid ratio) were selected based on observation of single-factor effects on the total extraction yield, which was used to optimize all extraction variables using the BBD method to obtain maximum sennoside A, sennoside B, aloe-emodin, emodin, and chrysophanol content from SAME. The impact of single factors on total extraction yield was evaluated by varying the extraction temperatures (30–90 °C), extraction times (20–80 min), and liquid to solid ratios (8–32 mL/g). When one factor was being used as a variable, the other two factors remained fixed (extraction temperature of 40 °C, extraction time of 30 min, and liquid to solid ratio of 20 mL/g).

4.4.2. Optimization of Extraction Variables Using BBD Method and Method Validity Testing

A 3-factorial (33) Box–Behnken design (version 13, Design-Expert Software, Stat-Ease Inc., Minneapolis, USA) was used for optimization of the independent variables extraction temperature (S1), extraction time (S2), and liquid to solid ratio (S3), at low (−1), medium (0), and high levels (+1) (Table 7). A total of 17 experimental runs, comprising five central points, were generated and fitted to a second-order polynomial equation to obtain the total yields of sennoside A (R1), sennoside B (R2), aloe-emodin (R3), emodin (R4), and chrysophanol (R5). Two-dimensional contour plots and three-dimensional response surface plots were made to deduce the independent variables’ effects on R1, R2, R3, R4, and R5 yields, and the “biggest-is-best” principle was used for each variable to obtain the optimum outcome, with p-values ≤ 0.05 considered to be significant. A final confirmation experiment (n = 3) was performed using optimized independent extraction variables, and the experimental yields were compared with predicted values for model validation.

4.5. High-Performance Liquid Chromatography (HPLC) Analysis of BBD-run SAME Samples

For quantitative analysis of R1, R2, R3, R4, and R5 in all 17 BBD-run SAMEs, as well as the final extract obtained using the optimized extraction conditions, an Alliance 2695 Separations module equipped with a 2487 dual wavelength absorbance detector (Waters Instruments, Inc., Milford, MA, USA), was used. The chromatographic analysis was performed using the following equipment: built-in quaternary pump, Pinnacle C18 column (5 μm, 250 × 4.6 mm), four-channel degasser, and autosampler with programmable temperature (25 °C). Different proportions of 0.5% formic acid in ultra-pure water (A) and acetonitrile (B) were used as a mobile phase with a flow rate adjusted to 1 mL/min. The gradient program was optimized as: 0–15 min (15–30% B), 15–18 min (30–34% B), 18–20 min (34–40% B), 20–21 min (40–15% B), and 21–25 min (15% B). Samples (1 mg/mL) were injected into the system at a volume of 10 µL; the output signal was detected at λmax = 272 nm and processed using EMPOWER software version 2.

4.6. Antioxidant Assay of BBD-Run SAME Samples

4.6.1. DPPH Radical-Scavenging Assay

The antioxidative properties of the 17 BBD-run SAMEs, as well as the final extract obtained using the optimized extraction conditions, were evaluated using DPPH, according to the earlier report by Alqahtani et al. [40], with minimal modifications. Different concentrations of the extracts (10, 50, 100, 500, and 1000 μg/mL) were prepared. Subsequently, 500 μL of each concentration was added to 125 μL of DPPH and 375 μL of methanol and then incubated for 30 min at room temperature. The antioxidant activity was measured spectrophotometrically (UV mini-1240, Shimadzu, Japan) in absorbance mode at λmax = 517 nm using ascorbic acid as the positive control. The following equation was used to calculate the radical-scavenging activity:
% of radical-scavenging activity = (Abs control − Abs sample/Abs control) × 100

4.6.2. ABTS Radical Cation Scavenging Activity

The antioxidative assay of the 17 BBD-run SAMEs, as well as the final extract obtained by using the optimized extraction conditions, was evaluated by applying the ABTS method according to the previous report of Li et al. [41], with small modifications. Aqueous solutions of ABTS (7 mmol/L) and potassium persulfate (2.45 mmol/L) were prepared and, after 12 h in the dark, the two solutions were mixed and incubated for 0.5 h, kept in a refrigerator for 24 h, and then diluted in ethanol. To generate a calibration curve, a reaction was initiated by pipetting different prepared concentrations of each extract (10, 50, 100, 500, and 1000 μg/mL) to ABTS solutions of 50 µg/mL (1:1) and recording the absorbance at λmax = 734 nm using ethanol (95%), ABTS (50 µg/mL), and ascorbic acid as a blank, control, and standard, respectively. Three replicates for the standard and each extract were used for the analysis. The percentage of antioxidant property for each extract was calculated using the following formula [42]:
% of radical scavenging activity = (Abs control − Abs sample/Abs control) × 100

4.7. Statistical Analysis

All experiments were carried out with three independent replicates and the values are presented as mean ± standard error of the mean (SEM). Data were statistically analyzed using the Student’s t-test for comparison between the means, applying a significance level of p < 0.05.

5. Conclusions

In this study, RSM with a BBD was used to study ultrasound-assisted extraction of sennoside A, sennoside B, aloe-emodin, emodin, and chrysophanol from the aerial parts of S. alexandrina. The experimental results demonstrated that all three extraction variables (extraction temperature, extraction time, and liquid to solid ratio), had an impact on the extraction of the target compounds. The optimal/modified extraction conditions were found to be: extraction temperature 63.8/64.2 °C, extraction time 51.6/52.1 min, and liquid to solid ratio 25.6/25.2 mL/g. Under these conditions, the experimental yields (% w/w) of sennoside A, sennoside B, aloe-emodin, emodin, and chrysophanol were found to be 2.237, 12.792, 2.457, 0.261, and 1.529%, respectively, which agreed closely with predicted yields (2.152, 12.031, 2.331, 0.214, and 1.411%, respectively). The experimental values were consistent with values predicted by RSM models, thus demonstrating the fitness of the model employed and the accomplishment of RSM in optimizing the extraction conditions. An increase in the antioxidant property of the BBD optimized SAME against DPPH and ABTS radicals were supported by the increase in the content of antioxidant markers like emodin and chrysophenol (HPLC-UV anlysis). There may be some other antioxidant compounds present in BBD optimized SAME alongwith these markers which might synergistacally exhibited the excellent antioxidant propery of SAME. In the future, the proposed optimized ultrasonication extraction method in this work can be employed to extract sennoside A, sennoside B, aloe-emodin, emodin, and chrysophanol efficiently from marketed herbal supplements containing different Senna species.

Author Contributions

Conceptualization, methodology, investigation, writing—original draft preparation, P.A.; software, A.A.; validation, formal analysis, R.N.H. and O.M.N.; investigation, writing—review and editing, O.M.A.; resources, supervision, project administration, funding acquisition, A.S.A. All authors have read and agreed to the published version of the manuscript.

Funding

The authors are thankful to the Researchers Supporting Project number (RSP 2021/132), King Saud University, Riyadh, Saudi Arabia.

Institutional Review Board Statement

Not applicable.

Informed Consent Statement

Not applicable.

Data Availability Statement

Not applicable.

Conflicts of Interest

The authors declare no conflict of interest.

References

  1. Marazzi, B.; Endress, P.K.; Queiroz, L.P.; Conti, E. Phylogenetic relationships within Senna (Leguminosae, Cassiinae) based on three chloroplast DNA regions: Patterns in the evolution of floral symmetry and extrafloral nectaries. Am. J. Bot. 2006, 93, 288–303. [Google Scholar] [CrossRef] [PubMed] [Green Version]
  2. Ahmed, S.I.; Hayat, M.Q.; Tahir, M.; Mansoor, Q.; Ismail, M.; Keck, K.; Bates, R.B. Pharmacologically active flavonoids from the anticancer, antioxidant and antimicrobial extracts of Cassia angustifolia Vahl. BMC Complement. Altern. Med. 2016, 16, 460. [Google Scholar] [CrossRef] [PubMed] [Green Version]
  3. Balasankar, D.; Vanilarasu, K.; Selva Preetha, P.; Rajeswari, S.; Umadevi, M.; Bhowmik, D. Senna—A Medical Miracle Plant. J. Med. Plants Stud. 2013, 1, 41–47. [Google Scholar]
  4. Viegas, C., Jr.; Rezende, A.; Silva, D.H.S.; Castro-Gamboa, I.; Bolzani, V.S. Chemical, biological and ethno pharmacological aspects of the Cassia genus. Quim. Nova 2006, 29, 1279–1286. [Google Scholar]
  5. Leelavathi, V.; Udayasri, P. Qualitative and Quantitative Analytical Studies for the Screening of Phytochemicals from the Leaf Extracts of Senna alexandrina Mill. J. Pharm. Clin. Res. 2018, 10, 210–215. [Google Scholar]
  6. Lemli, J. Metabolism of sennosides: An overview. Pharmacology 1988, 36, 126–128. [Google Scholar] [CrossRef]
  7. Kisa, K.; Sasaki, K.; Yamauchi, K.; Kuwano, S. Potentiating effect of sennoside C on purgative activity of sennoside A in mice. Planta Med. 1981, 42, 302–303. [Google Scholar] [CrossRef]
  8. Yang, L.; Akao, T.; Kobashi, K.; Hattori, M. Purification and characterization of a novel sennoside-hydrolyzing beta-glucosidase from Bifidobacterium sp. strain SEN, a human intestinal anaerobe. Biol. Pharm. Bull. 1996, 19, 705–709. [Google Scholar] [CrossRef] [Green Version]
  9. Morinaga, O.; Nakajima, S.; Tanaka, H.; Shoyama, Y. Production of monoclonal antibodies against a major purgative component, sennoside B, their characterization and use in ELISA. Analyst 2001, 126, 1372–1376. [Google Scholar] [CrossRef]
  10. Oshio, H.; Naruse, Y.; Tsukui, M. Quantitative analysis of the purgative components of Rhubarb and Senna. Chem Pharm. Bull. 1978, 26, 2458–2464. [Google Scholar] [CrossRef] [Green Version]
  11. Akbar, S. Senna alexandrina Mill. (Fabaceae/Leguminosae). In Handbook of 200 Medicinal Plants; Springer: New York, NY, USA, 2020; pp. 1629–1637. [Google Scholar]
  12. Yen, G.-C.; Duh, P.-D.; Chuang, D.-Y. Antioxidant activity of anthraquinones and anthrone. Food Chem. 2000, 70, 437–441. [Google Scholar] [CrossRef]
  13. Stevigny, C.; Rolle, L.; Valentini, N.; Zeppa, G. Optimization of extraction of phenolic content from hazelnut shell using response surface methodology. J. Sci. Food Agric. 2007, 87, 2817–2822. [Google Scholar] [CrossRef]
  14. Yuan, Y.; Liu, Y.; Liu, M.; Chen, Q.; Jiao, Y.; Liu, Y.; Meng, Z. Optimization extraction and bioactivities of polysaccharide from wild Russula griseocarnosa. Saudi Pharm. J. 2017, 25, 523–530. [Google Scholar] [CrossRef]
  15. Yu, M.; Wang, B.; Qi, Z.; Xin, G.; Li, W. Response surface method was used to optimize the ultrasonic assisted extraction of flavonoids from Crinum asiaticum. Saudi J. Biol. Sci. 2019, 26, 2079–2084. [Google Scholar] [CrossRef]
  16. Tiwari, B.K. Ultrasound: A clean, green extraction technology. TrAC-Trend Anal. Chem. 2015, 71, 100–109. [Google Scholar] [CrossRef]
  17. Parisi, O.I.; Puoci, F.; Restuccia, D.; Farina, G.; Iemma, F.; Picci, N. Chapter 4—Polyphenols and Their Formulations: Different Strategies to Overcome the Drawbacks Associated with Their Poor Stability and Bioavailability. In Polyphenols in Human Health and Disease; Academic Press: Cambridge, MA, USA, 2014; pp. 29–45. ISBN 9780123984562. [Google Scholar] [CrossRef]
  18. Box, G.E.; Wilson, K.G. On the experimental attainment of optimum conditions. J. R. Stat. Soc. Ser. A 1951, 13, 1–45. [Google Scholar] [CrossRef]
  19. Liyana-Pathirana, C.; Shahidi, F. Optimization of extraction of phenolic compounds from wheat using response surface methodology. Food Chem. 2005, 93, 47–56. [Google Scholar] [CrossRef]
  20. Tabaraki, R.; Nateghi, A. Optimization of ultrasonic-assisted extraction of natural antioxidants from rice bran using response surface methodology. Ultrason. Sonochem. 2011, 18, 1279–1286. [Google Scholar] [CrossRef]
  21. Xu, Q.; Shen, Y.Y.; Wang, H.F.; Zhang, N.P.; Xu, S.; Zhang, L. Application of response surface methodology to optimise extraction of flavonoids from Fructus sophorae. Food Chem. 2013, 138, 2122–2129. [Google Scholar] [CrossRef]
  22. Azmir, J.; Zaidul, I.S.M.; Rahman, M.M.; Sharif, K.M.; Sahena, F.; Jahurul, M.H.A.; Mohamed, A. Optimization of oil yield of Phaleria macrocarpa seed using response surface methodology and its fatty acids constituents. Ind. Crops Prod. 2014, 52, 405–412. [Google Scholar] [CrossRef]
  23. Aybastıer, O.; Isik, E.; Sahin, S.; Demir, C. Optimization of ultrasonic-assisted extraction of antioxidant compounds from blackberry leaves using response surface methodology. Ind. Crops Prod. 2013, 44, 558–565. [Google Scholar] [CrossRef]
  24. Chopra, S.; Motwani, S.K.; Iqbal, Z.; Talengaonkar, S.; Ahmad, F.J.; Khar, R.K. Optimization of polyherbal gels for vaginal drug delivery by Box-Behnken statistical design. Eur. J. Pharm. Biopharm. 2005, 67, 120–131. [Google Scholar] [CrossRef] [PubMed]
  25. AlZain, M.N.; AlAtar, A.A.; Alqarawi, A.A.; Mothana, R.A.; Noman, O.M.; Herqash, R.N.; AlSheddi, E.S.; Farshori, N.N.; Alam, P. The Influence of Mycorrhizal Fungi on the Accumulation of Sennosides A and B in Senna alexandrina and Senna italica. Separations 2020, 7, 65. [Google Scholar] [CrossRef]
  26. Dhanani, T.; Singh, R.; Reddy, N.; Trivedi, A.; Kumar, S. Comparison on extraction yield of sennoside A and sennoside B from Senna (Cassia angustifolia) using conventional and non-conventional extraction techniques and their quantification using a validated HPLC-PDA detection method. Nat. Prod. Res. 2017, 31, 1097–1101. [Google Scholar] [CrossRef]
  27. Genovese, S.; Tammaro, F.; Menghini, L.; Carlucci, G.; Epifano, F.; Locatelli, M. Comparison of three different extraction methods and HPLC determination of the anthraquinones aloe-emodine, emodine, rheine, chrysophanol and physcione in the bark of Rhamnus alpinus L. (Rhamnaceae). Phytochem. Anal. 2010, 21, 261–267. [Google Scholar] [CrossRef]
  28. Zhang, L.L.; Xu, M.; Wang, Y.M.; Wu, D.M.; Chen, J.H. Optimizing ultrasonic ellagic acid extraction conditions from infructescence of Platycarya strobilacea using response surface methodology. Molecules 2010, 15, 7923–7932. [Google Scholar] [CrossRef]
  29. Zhong, K.; Wang, Q. Optimization of ultrasonic extraction of polysaccharides from dried longan pulp using response surface methodology. Carbohydr. Polym. 2010, 80, 19–25. [Google Scholar]
  30. Zhao, L.C.; Liang, J.; Li, W.; Cheng, K.M.; Xia, X.; Deng, X.; Yang, G.L. The use of response surface methodology to optimize the ultrasound-assisted extraction of five anthraquinones from Rheum palmatum L. Molecules 2011, 16, 5928–5937. [Google Scholar] [CrossRef] [Green Version]
  31. Ruan, N.; Jiao, Z.; Tang, L. Response surface methodology to optimize supercritical carbon dioxide extraction of Polygonum cuspidatum. J. AOAC Int. 2021, qsab108. [Google Scholar] [CrossRef]
  32. Wang, X.S.; Wu, Y.F.; Dai, S.L.; Chen, R.; Shao, Y. Ultrasound-assisted extraction of geniposide from Gardenia jasminoides. Ultrason. Sonochem. 2012, 19, 1155–1159. [Google Scholar] [CrossRef]
  33. Mason, T.J.; Paniwnyk, L.; Lorimer, J.P. The uses of ultrasound in food technology. Ultrason. Sonochem. 1996, 3, S253–S260. [Google Scholar] [CrossRef]
  34. Zhao, S.; Kwok, K.C.; Liang, H. Investigation on ultrasound-assisted extraction of saikosaponins from Radix Bupleuri. Sep. Purif Technol. 2007, 55, 307–312. [Google Scholar] [CrossRef]
  35. Dong, J.; Liu, Y.; Liang, Z.; Wang, W. Investigation on ultrasound-assisted extraction of salvianolic acid B from Salvia miltiorrhizaroot. Ultrason. Sonochem. 2010, 17, 61–65. [Google Scholar] [CrossRef]
  36. Jovanovic, S.V.; Steenken, S.; Tosic, M.; Marjanovic, B.; Simic, M.G. Flavonoids as antioxidants. J. Am. Chem. Soc. 1994, 116, 4846–4851. [Google Scholar] [CrossRef]
  37. Pietta, P.G. Flavonoids as antioxidants. J. Nat. Prod. 2000, 63, 1035–1042. [Google Scholar] [CrossRef]
  38. Vargas, F.; Díaz, Y.; Carbonell, K. Antioxidant and scavenging activity of emodin, aloe-emodin, and rhein on free-radical and reactive oxygen species. Pharm. Biol. 2004, 42, 342–348. [Google Scholar] [CrossRef]
  39. Huang, H.C.; Lee, C.R.; Chao, P.D.; Chen, C.C.; Chu, S.H. Vasorelaxant effect of emodin, an anthraquinone from a Chinese herb. Eur. J. Pharmacol. 1991, 205, 289–294. [Google Scholar]
  40. Alqahtani, A.S.; Noman, O.M.; Rehman, M.T.; Siddiqui, N.A.; Alajmi, M.F.; Nasr, F.A.; Shahat, A.A.; Alam, P. The influence of variations of furanosesquiterpenoids content of commercial samples of myrrh on their biological properties. Saudi Pharm. J. 2019, 27, 981–989. [Google Scholar] [CrossRef]
  41. Li, W.; Hosseinian, F.S.; Tsopmo, A.; Friel, J.K.; Beta, T. Evaluation of antioxidant capacity and aroma quality of breast milk. Nutrition 2009, 25, 105–114. [Google Scholar] [CrossRef]
  42. Li, X.; Wang, X.; Chen, D.; Chen, S. Antioxidant Activity and Mechanism of Protocatechuic Acid in vitro. Funct. Foods Health Dis. 2011, 1, 232–244. [Google Scholar] [CrossRef]
Figure 1. Chemical structure of phytoconstituents: (A) sennoside A; (B) sennoside B; (C) aloe-emodin; (D) emodin; (E) chrysophanol.
Molecules 27 00298 g001
Figure 2. The effects of single factors on total extraction yield of S. alexandrina methanol extract (SAME): (A) extraction temperature effect; (B) extraction time effect; (C) liquid to solid ratio effect. Each value represents a mean ± SD (n = 5).
Molecules 27 00298 g002
Figure 3. (AF): Response surface 3D plots and 2D contour plots showing the interaction effects of temperature (S1), extraction time (S2), and liquid to solid ratio (S3) on the yields of sennoside A (R1).
Molecules 27 00298 g003
Figure 4. (AF): Response surface 3D plots and 2D contour plots showing the interaction effects of temperature (S1), extraction time (S2), and liquid to solid ratio (S3) on the yields of sennoside B (R2).
Molecules 27 00298 g004
Figure 5. (AF): Response surface 3D plots and 2D contour plots showing the interaction effects of temperature (S1), extraction time (S2), and liquid to solid ratio (S3) on the yields of aloe-emodin (R3).
Molecules 27 00298 g005
Figure 6. (AF): Response surface 3D plots and 2D contour plots showing the interaction effects of temperature (S1), extraction time (S2), and liquid to solid ratio (S3) on the yields of emodin (R4).
Molecules 27 00298 g006
Figure 7. (AF): Response surface 3D plots and 2D contour plots showing the interaction effects of temperature (S1), extraction time (S2), and liquid to solid ratio (S3) on the yields of chrysophanol (R5).
Molecules 27 00298 g007
Figure 8. Chromatogram of sennoside A, sennoside B, aloe-emodin, emodin, and chrysophenol estimation in SAME by HPLC-UV method [Conditions: Pinnacle C18 column (4.6 × 250 mm, 5 µm); mobile phase, acetonitrile: 0.5% formic acid in ultra-pure water (gradient system); flow rate: 1 mL/min; UV-detection at λmax = 272 nm at temperature (25 ± 1 °C)]. (A) Representative chromatogram of sennoside B (Rt = 8.078), sennoside A (Rt = 11.79), aloe-emodin (Rt = 19.43), emodin (Rt = 21.25), and chrysophenol (Rt = 22.98). (B) Representative chromatogram of SAME containing sennoside B, sennoside A, aloe-emodin, emodin, and chrysophenol.
Molecules 27 00298 g008
Table 1. Experimental parameters of Box–Behnken design and analysis of sennoside A (R1), sennoside B (R2), aloe-emodin (R3), emodin (R4), and chrysophanol (R5) by HPLC-UV (n = 3).
RunCoded VariablesSennoside A Yield (R1)Sennoside B
Yield (R2)
Aloe-Emodin
Yield (R3)
Emodin
Yield (R4)
Chrysophanol
Yield (R5)
(S1) (°C)(S2) (min)(S3) (mL/g)(% w/w)(% w/w)(% w/w)(% w/w)(% w/w)
10111.963 ± 0.08810.967 ± 0.5592.125 ± 0.0560.194 ± 0.0041.306 ± 0.035
2−1101.77 ± 0.0749.667 ± 0.4541.881 ± 0.0640.174 ± 0.0031.158 ± 0.042
3−1−101.524 ± 0.0578.481 ± 0.4491.651 ± 0.0410.154 ± 0.0051.028 ± 0.031
4−10−11.575 ± 0.0678.763 ± 0.5341.705 ± 0.0490.158 ± 0.0051.052 ± 0.048
50002.143 ± 0.09111.921 ± 0.6382.32 ± 0.0730.212 ± 0.0081.424 ± 0.059
601−11.941 ± 0.05410.796 ± 0.6192.101 ± 0.0490.192 ± 0.0071.291 ± 0.067
71−101.942 ± 0.04710.899 ± 0.5852.121 ± 0.0610.194 ± 0.0061.297 ± 0.041
80002.101 ± 0.09411.742 ± 0.6682.285 ± 0.0790.209 ± 0.0091.401 ± 0.046
90002.081 ± 0.08311.576 ± 0.7142.252 ± 0.0710.206 ± 0.0111.384 ± 0.043
100−111.89 ± 0.0439.632 ± 0.4612.046 ± 0.0510.187 ± 0.0061.261 ± 0.039
1110−11.924 ± 0.06910.705 ± 0.5742.083 ± 0.0550.191 ± 0.0041.283 ± 0.042
120−1−11.887 ± 0.07710.458 ± 0.5152.045 ± 0.0640.184 ± 0.0031.252 ± 0.039
131012.022 ± 0.08411.252 ± 0.7072.189 ± 0.0610.201 ± 0.0091.347 ± 0.061
140002.093 ± 0.08511.643 ± 0.6882.265 ± 0.0720.207 ± 0.0081.392 ± 0.057
150002.073 ± 0.09711.532 ± 0.6332.244 ± 0.0780.208 ± 0.011.259 ± 0.051
161102.041 ± 0.09211.477 ± 0.5542.233 ± 0.0550.205 ± 0.0091.371 ± 0.061
17−1011.589 ± 0.0618.841 ± 0.5011.721 ± 0.0460.159 ± 0.0081.084 ± 0.026
Table 2. Regression analysis and response regression equation results for the final proposed model.
Dependent VariablesSourceR2Adjusted R2Predicted R2SD
R1Linear0.50190.38690.23150.1515
2FI0.51400.2224−0.35700.1706
Quadratic0.98170.95830.77950.0395
R2Linear0.52850.41970.29270.8562
2FI0.54810.2769−0.15930.9557
Quadratic0.98500.96560.82810.2083
R3Linear0.52280.41270.26860.1631
2FI0.53060.2489−0.29980.1845
Quadratic0.98580.96750.84620.0384
R4Linear0.52150.41110.28050.0145
2FI0.52870.2459−0.24910.0164
Quadratic0.98950.97600.88570.0029
R5Linear0.54390.43870.32060.0920
2FI0.54830.2773−0.17640.1044
Quadratic0.91990.81690.72730.0525
Table 3. ANOVA for the fitted quadratic polynomial model of R1, R2, R3, R4, and R5.
Dependent VariablesSourceSum of SquareDegree of FreedomMean SquareF-Valuep Value
R1Model0.588190.065341.81<0.0001 (significant)
Residual0.010970.0016--
Lack of fit0.008030.00273.570.1252 (not significant)
Pure error0.003040.0007--
R2Model19.9192.2150.97<0.0001 (significant)
Residual0.303870.0434--
Lack of fit0.207830.06932.890.1661 (not significant)
Pure error0.096040.0240--
R3Model0.714590.079453.94<0.0001 (significant)
Residual0.010370.0015--
Lack of fit0.006630.00222.380.2104 (not significant)
Pure error0.003740.0009--
R4Model0.005690.000673.19<0.0001 (significant)
Residual0.000178.529 × 10−6--
Lack of fit0.000130.00012.420.2063 (not significant)
Pure error0.000145.300 × 10−6--
R5Model0.222090.02478.930.0043 (significant)
Residual0.019370.0028--
Lack of fit0.002530.00080.19500.8948 (not significant)
Pure error0.016940.0042--
Table 4. The significance of each response variable effect shown by using the F ratio and p-value in the nonlinear second-order model.
Dependent
Variables
Independent VariablesSS aDF bMS cF-Valuep-Value d
R1Linear Effects
S10.270510.2705173.06<0.0001
S20.027810.027817.820.0039
S30.002310.00231.500.2601
Quadratic Effects
S120.187210.1872119.77<0.0001
S220.019510.019512.490.0095
S320.050810.050832.510.0007
Interaction Effects
S1S20.005410.00543.460.1053
S1S30.001810.00181.130.3233
S2S30.000110.00010.05770.8170
R2Linear Effects
S19.2019.20212.10<0.0001
S21.4811.4834.030.0006
S30.000110.00010.00260.9608
Quadratic Effects
S124.7514.75109.52< 0.0001
S221.0111.0123.240.0019
S322.2412.2451.730.0002
Interaction Effects
S1S20.092410.09242.130.1878
S1S30.055010.05501.270.2974
S2S30.248510.24855.730.0480
R3Linear Effects
S10.347810.3478236.28<0.0001
S20.028410.028419.320.0032
S30.002710.00271.840.2176
Quadratic Effects
S120.219310.2193149.00<0.0001
S220.022710.022715.440.0057
S320.061110.061141.520.0004
Interaction Effects
S1S20.003510.00352.370.1680
S1S30.002010.00201.380.2792
S2S30.000110.00010.08990.7731
R4Linear Effects
S10.002710.0027312.42<0.0001
S20.000310.000331.010.0008
S30.000010.00003.750.0939
Quadratic Effects
S120.001610.0016184.37<0.0001
S220.000210.000226.490.0013
S320.000610.000669.03<0.0001
Interaction Effects
S1S20.000010.00002.370.1672
S1S30.000010.00002.370.1672
S2S32.500 × 10−712.500 × 10−70.02930.8689
R5Linear Effects
S10.119110.119143.130.0003
S20.010410.01043.760.0938
S30.001810.00180.65200.4460
Quadratic Effects
S120.062910.062922.790.0020
S220.005510.00552.000.1998
S320.014310.01435.180.0571
Interaction Effects
S1S20.000810.00080.28400.6106
S1S30.000310.00030.09270.7696
S2S39.000 × 10−619.000 × 10−60.00330.9561
a Sum of squares; b degree of freedom; c mean sum of squares; d p-values < 0.05 were considered to be significant; ns: insignificant.
Table 5. Observed and predicted levels for optimal extraction conditions.
FactorPredicted Optimal LevelModified Level
S1 (°C)63.864.2
S2 (min)51.652.1
S3 (mL/g)25.625.2
ResponsePredicted (%w/w)Experimental (%w/w, n = 3)
Sennoside A (R1)2.1522.237 ± 0.051
Sennoside B (R2)12.03112.792 ± 0.475
Aloe-emodin (R3)2.3312.457 ± 0.053
Emodin (R4)0.2140.261 ± 0.0052
Chrysophanol (R5)1.4111.529 ± 0.041
Table 6. ABTS and DPPH free radical scavenging activities of SAME samples.
SampleIC50 ABTS (µg/mL)IC50 DPPH (µg/mL)
S1149.7 ± 5.35178.93 ± 5.70
S2301.4 ± 9.76313.1 ± 9.83
S3324.7 ± 11.59343.8 ± 11.27
S4307.2 ± 11.55326.7 ± 10.74
S558.9 ± 2.3368.4 ± 2.18
S6167.5 ± 7.02192.2 ± 8.39
S7153.2 ± 6.69183.8 ± 8.58
S860.2 ± 2.1969.1 ± 2.48
S963.1 ± 2.0774.7 ± 3.44
S10249.9 ± 10.72260.1 ± 9.81
S11197.2 ± 7.53210.3 ± 7.69
S12275.2 ± 11.31287.9 ± 11.77
S13100.8 ± 3.70115.4 ± 3.08
S1461.8 ± 1.8372.3 ± 3.37
S1566.7 ± 2.1576.3 ± 1.89
S1675.2 ± 2.3984.8 ± 2.46
S17306.7 ± 12.05321.9 ± 12.42
BBD optimized SAME47.2 ± 1.4059.7 ± 1.93
Ascorbic Acid5.9 ± 1.36.8 ± 0.9
Table 7. Extraction variables selected for BBD optimization.
Independent
Variable
Factor LevelDependent VariableGoal
−10+1Sennoside A yield
(% w/w)
(R1)
Sennoside B yield
(% w/w)
(R2)
Aloe-emodin yield
(% w/w)
(R3)
Emodin
yield
(% w/w)
(R4)
Chrysophenol yield
(% w/w)
(R5)
Maximized
Extraction
temperature (°C) (S1)
506070
Extraction time
(min) (S2)
304560
Liquid to solid
ratio (ml/g) (S3)
162432
Publisher’s Note: MDPI stays neutral with regard to jurisdictional claims in published maps and institutional affiliations.

