Article

Re-Evaluations of Zr-DFO Complex Coordination Chemistry for the Estimation of Radiochemical Yields and Chelator-to-Antibody Ratios of 89Zr Immune-PET Tracers

1
Research Center for Advanced Science and Technology, The University of Tokyo, 4-6-1 Komaba, Meguro-ku, Tokyo 153-8904, Japan
2
JFE Engineering Corporation, 2-1 Suehiro-cho, Tsurumi-ku, Yokohama 230-8611, Japan
3
Department of Radiation-Applied Biology Research, Takasaki Advanced Radiation Research Institute, National Institute of Quantum and Radiological Science and Technology (QST), 1233 Watanuki, Takasaki, Gunma 370-1292, Japan
*
Author to whom correspondence should be addressed.
Molecules 2021, 26(16), 4977; https://doi.org/10.3390/molecules26164977
Submission received: 11 July 2021 / Revised: 6 August 2021 / Accepted: 14 August 2021 / Published: 17 August 2021
(This article belongs to the Special Issue Recent Advances in Techniques with Radionuclide for Theranostic Drugs)

Abstract

:
(1) Background: Deferoxamine B (DFO) is the most widely used chelator for labeling of zirconium-89 (89Zr) to monoclonal antibody (mAb). Despite the remarkable developments of the clinical 89Zr-immuno-PET, chemical species and stability constants of the Zr-DFO complexes remain controversial. The aim of this study was to re-evaluate their stability constants by identifying species of Zr-DFO complexes and demonstrate that the stability constants can estimate radiochemical yield (RCY) and chelator-to-antibody ratio (CAR). (2) Methods: Zr-DFO species were determined by UV and ESI-MS spectroscopy. Stability constants and speciation of the Zr-DFO complex were redetermined by potentiometric titration. Complexation inhibition of Zr-DFO by residual impurities was investigated by competition titration. (3) Results: Unknown species, ZrHqDFO2, were successfully detected by nano-ESI-Q-MS analysis. We revealed that a dominant specie under radiolabeling condition (pH 7) was ZrHDFO, and its stability constant (logβ111) was 49.1 ± 0.3. Competition titration revealed that residual oxalate inhibits Zr-DFO complex formation. RCYs in different oxalate concentration (0.1 and 0.04 mol/L) were estimated to be 86% and >99%, which was in good agreement with reported results (87%, 97%). (4) Conclusion: This study succeeded in obtaining accurate stability constants of Zr-DFO complexes and estimating RCY and CAR from accurate stability constants established in this study.

1. Introduction

Coordination chemistry has played an important role in evaluating the functions of radiometal-labeled radiopharmaceuticals for both diagnostic and therapeutic applications. Especially, stability constants between radiometals and bifunctional chelators (BFC) have been key parameters for the evaluation of metal ion selectivity, in-vivo stability, and the pharmacokinetics of radiopharmaceuticals. Furthermore, we can infer that stability constants obtained from carefully considered complex models can contribute to the significant parameters for the development of radiometallic radiopharmaceuticals, the radiochemical yield (RCY) in radiolabeling, and chelator-to-antibody ratio (CAR). The stability constants of refined radiometal-BFC complex models thus have great significance in the development of radiometal-labeled radiopharmaceuticals. Interest in zirconium-89 (89Zr) for immuno-positron emission tomography (immuno-PET) has been accelerating in recent years due to its favorable decay characteristics: a suitable half-life (78.4 h) for antibodies that take a few days to reach the tumor and a low positron (β+) energy (395 keV), which results in good PET image resolution [1,2,3,4,5]. These characteristics have encouraged the development of 89Zr-labeled monoclonal antibodies (mAb) as 89Zr-immunePET reagents for theranostic applications to therapeutic radiometal-labeled antibodies, such as 177Lu. The naturally occurring hydroxamate-type siderophore, deferoxamine B (DFO), a small molecular iron chelator, is the main BFC used with these 89Zr-mAbs because it can strongly bind 89Zr at room temperature in high radiochemical yield (RCY) [6]. Physicochemical properties, including thermodynamics data, have been reported on the complex of common chelating agents and Zr [7,8]. However, despite the focused development of 89Zr-DFO-mAbs, there are only a few studies describing the coordination chemistry of Zr-DFO complexes. DFO is composed of alternating 1,5-diaminopentate and succinic acid residues, as shown in Figure 1, and an H4DFO+ ligand with pKa values (25 °C, I = 0.1) of 8.32, 8.98, and 9.55 for the three hydroxamic acids and 10.84 for the protonated pendant amine [9].
Summers et al. recently proposed that volatilized Zr-DFO complex salt forms 8-coordinated Zr with oxygen ligands, and the chemical formula should be Zr(DFO)(OH)2 as the results of an extended X-ray absorption fine structure (EXAFS) study [10]. On the other hand, the complex structure of Zr-DFO in aqueous solution and their stability constants are also important for RCY evaluation 89Zr-DFO-mAb. The stability constants of the Zr-DFO complex are defined by the following equation (charges are omitted for clarity):
β p q r = [ Zr p H q DFO r ] [ Zr ] p [ H ] q [ DFO ] r ( p 1 ,   4 r > q 0 , r 1 )
Savastano et al. determined that the main Zr-DFO species and their stability constants were ZrHDFO (logβ111 = 36.14) and Zr2H5DFO3 (logβ253 = 134.1) by potentiometric titration experiments [11]. Meanwhile, Toporivska et al. reported logβ111 was 46.4–47.7 by potentiometric and competition UV-vis titration experiments. The reported values in the two literatures differ by the order of 1010 [12]. In addition, previous studies did not consider the inhibition of the formation of the Zr-DFO complex by oxalate (ox2−) despite the fact that oxalate strongly binds to 89Zr [13]. It is important to take into account the complexation of oxalate with 89Zr because 89Zr is usually prepared as oxalic acid solution in the purification process. Zr-DFO complex is expected to be formed from Zr oxalate by ligand exchange as shown in Scheme 1. In fact, the RCY estimate using the reported stability constants of Zr-DFO species and Zr(ox)4 (1029.7) was 0%, which was quite different from that obtained experimentally (87%) [14]. We therefore hypothesized that the disagreement between its estimated and experimental values resulted from the presence of one or more unknown Zr-DFO species. The aim of the present study was therefore to re-evaluate the stability constants and speciation of the Zr-DFO complexes and then to show the role of the more precise stability constants in predicting RCYs and CARs. Namely, this article describes results for stoichiometry and unknown species of the Zr-DFO complex investigated by MS spectroscopies. Although speciation of Zr-DFO complexes was determined in previous studies [11,12], it is likely that unstable species of the Zr-DFO complex were missed because they were decomposed in ionization process of the MS spectroscopies. We therefore hypothesized that unknown species could be discovered by adopting a softer ionization method than previously reported. The pKa values, stability constants, and speciation curves were evaluated by potentiometric titration, and speciation curves were determined from the obtained parameters. Competition titration studies were also performed to reveal the species that inhibit Zr-DFO complex formation. Finally, RCYs in radiolabeling and the CARs required to meet the RCY criteria for clinical trials of 89Zr-DFO-mAb were also evaluated using equations developed from the Zr-DFO complex model refined in this study.

2. Results

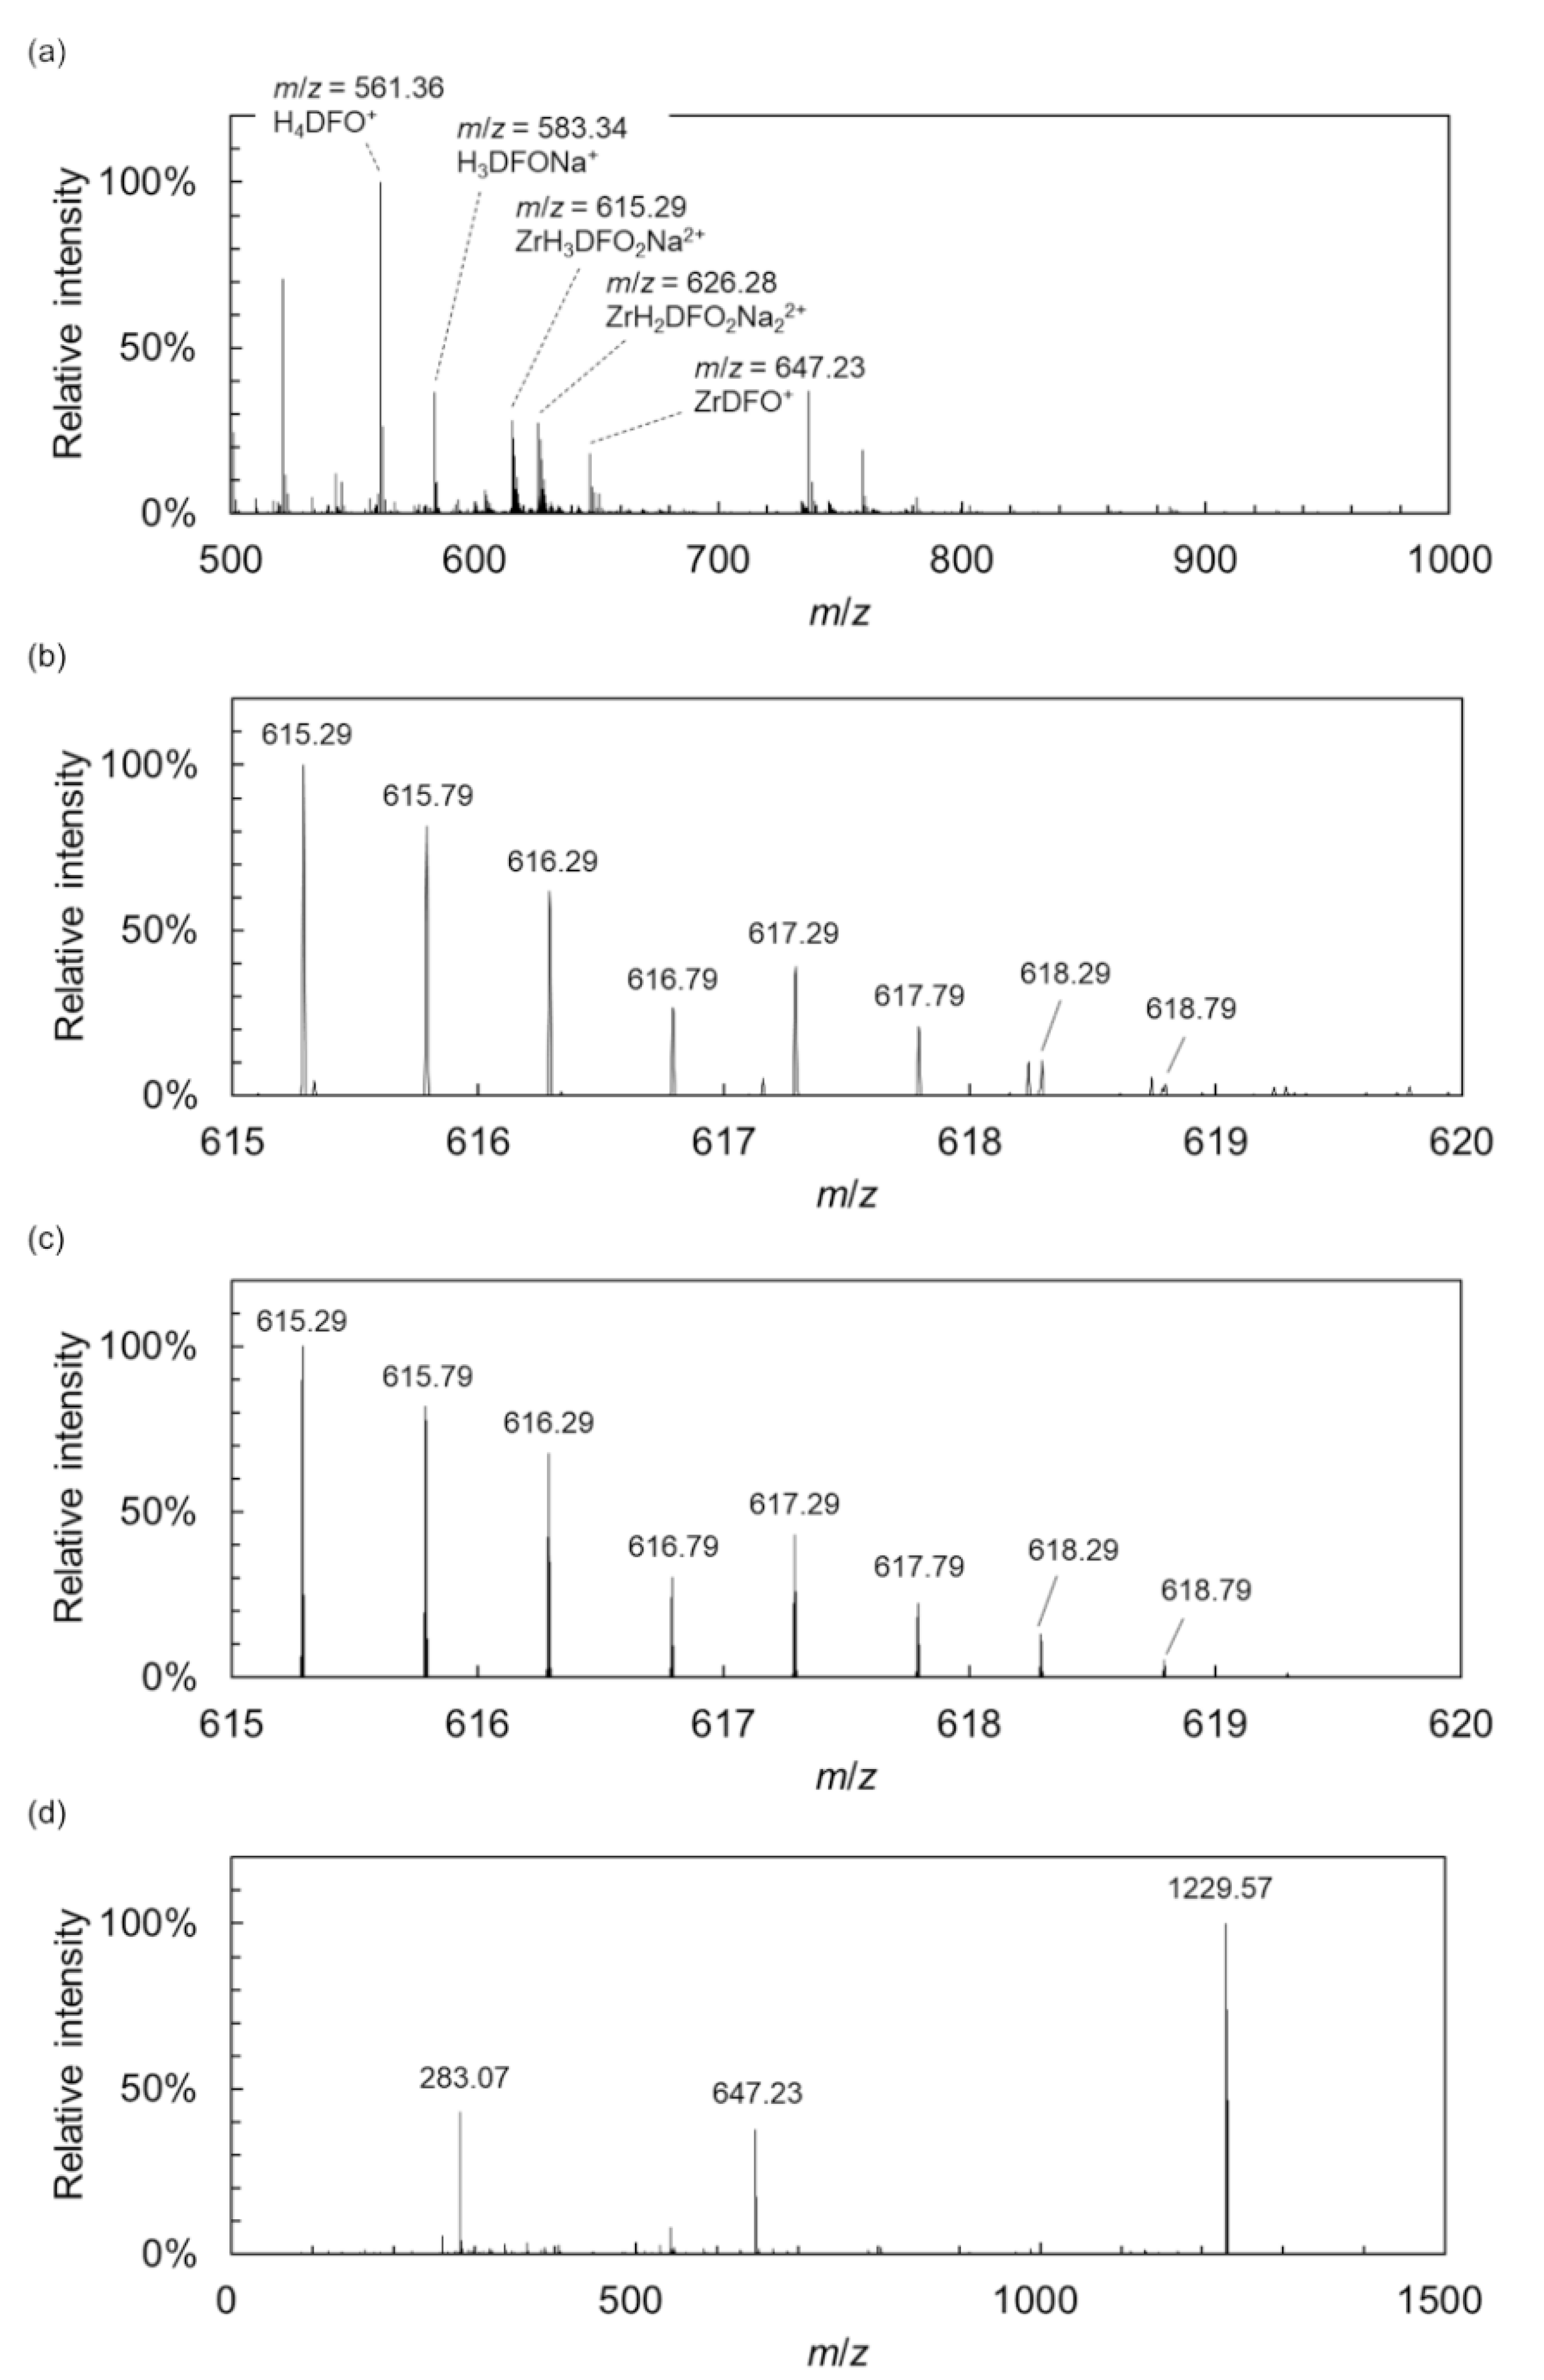
2.1. Mass Spectrometry

Mass spectra of Nano-ESI-Q-MS are shown in Figure 2. Two peaks derived from ZrHDFO (m/z = 324.30 accounted for by H46C25N6O8Zr2+) and ZrDFO (m/z = 647.23 accounted for by H45C25N6O8Zr+) were observed in ESI-Q-MS spectra (data not shown). On the other hand, Nano-ESI-Q-MS revealed mass peaks derived from ZrH3DFO2Na (m/z = 615.29) and ZrH2DFO2Na2 (m/z = 626.28) (Figure 2a). In addition to the above peaks, ZrH4DFO2 (m/z = 604.30), ZrH2DFO2Na (m/z = 1229.57 accounted for by H92C50N12O16NaZr+), and Zr2H4DFO3 (m/z = 618.61 accounted for by H139C75N18O24Zr23+) were detected by the Nano-ESI-Q-MS (Figures S2 and S3). An enlarged view of the peaks derived from ZrH3DFO2Na (m/z = 615.29) is shown in Figure 2b: the peaks clearly correspond to the theoretical isotope distribution of ZrH3DFO2Na shown in Figure 2c. The mass peak of m/z = 1229.57 and the disassembled peak of m/z = 647.23 were also detected in the MS/MS measurement, as shown in Figure 2d.

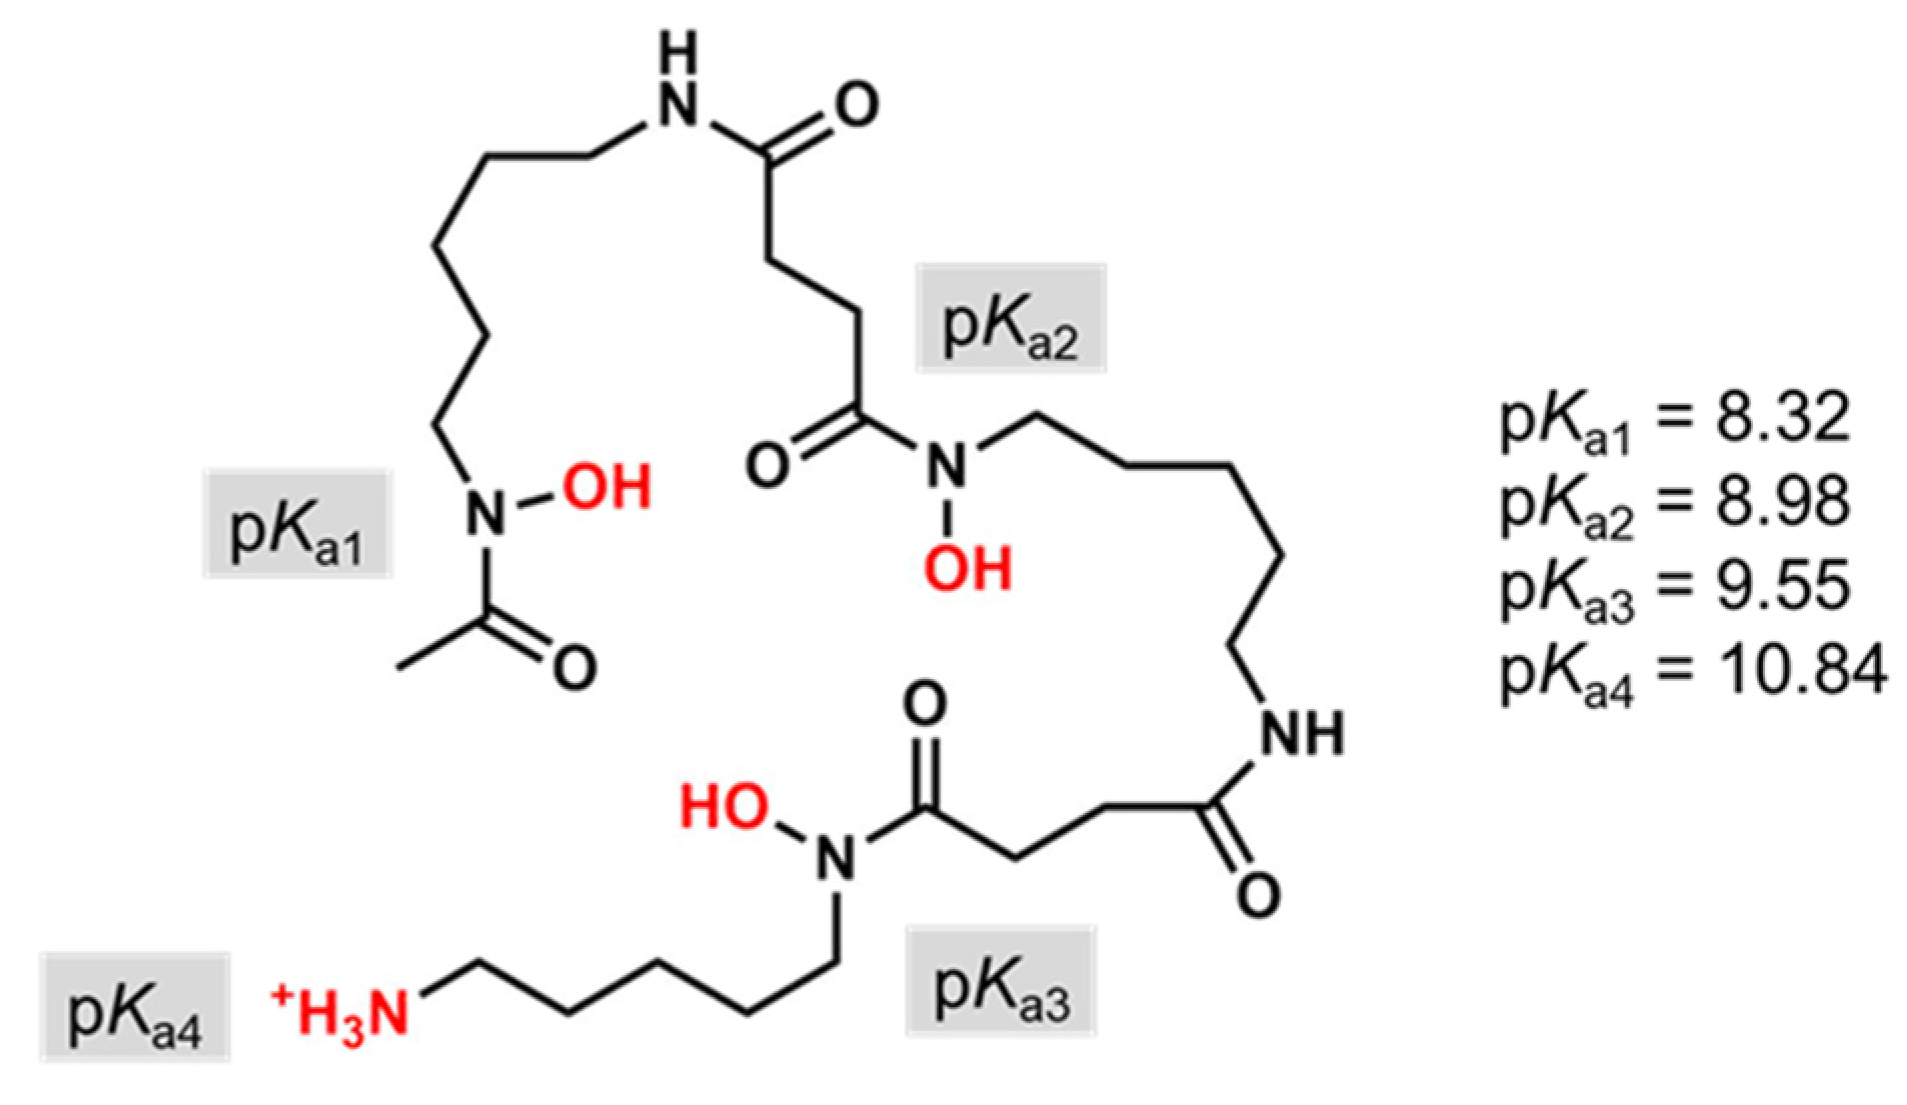
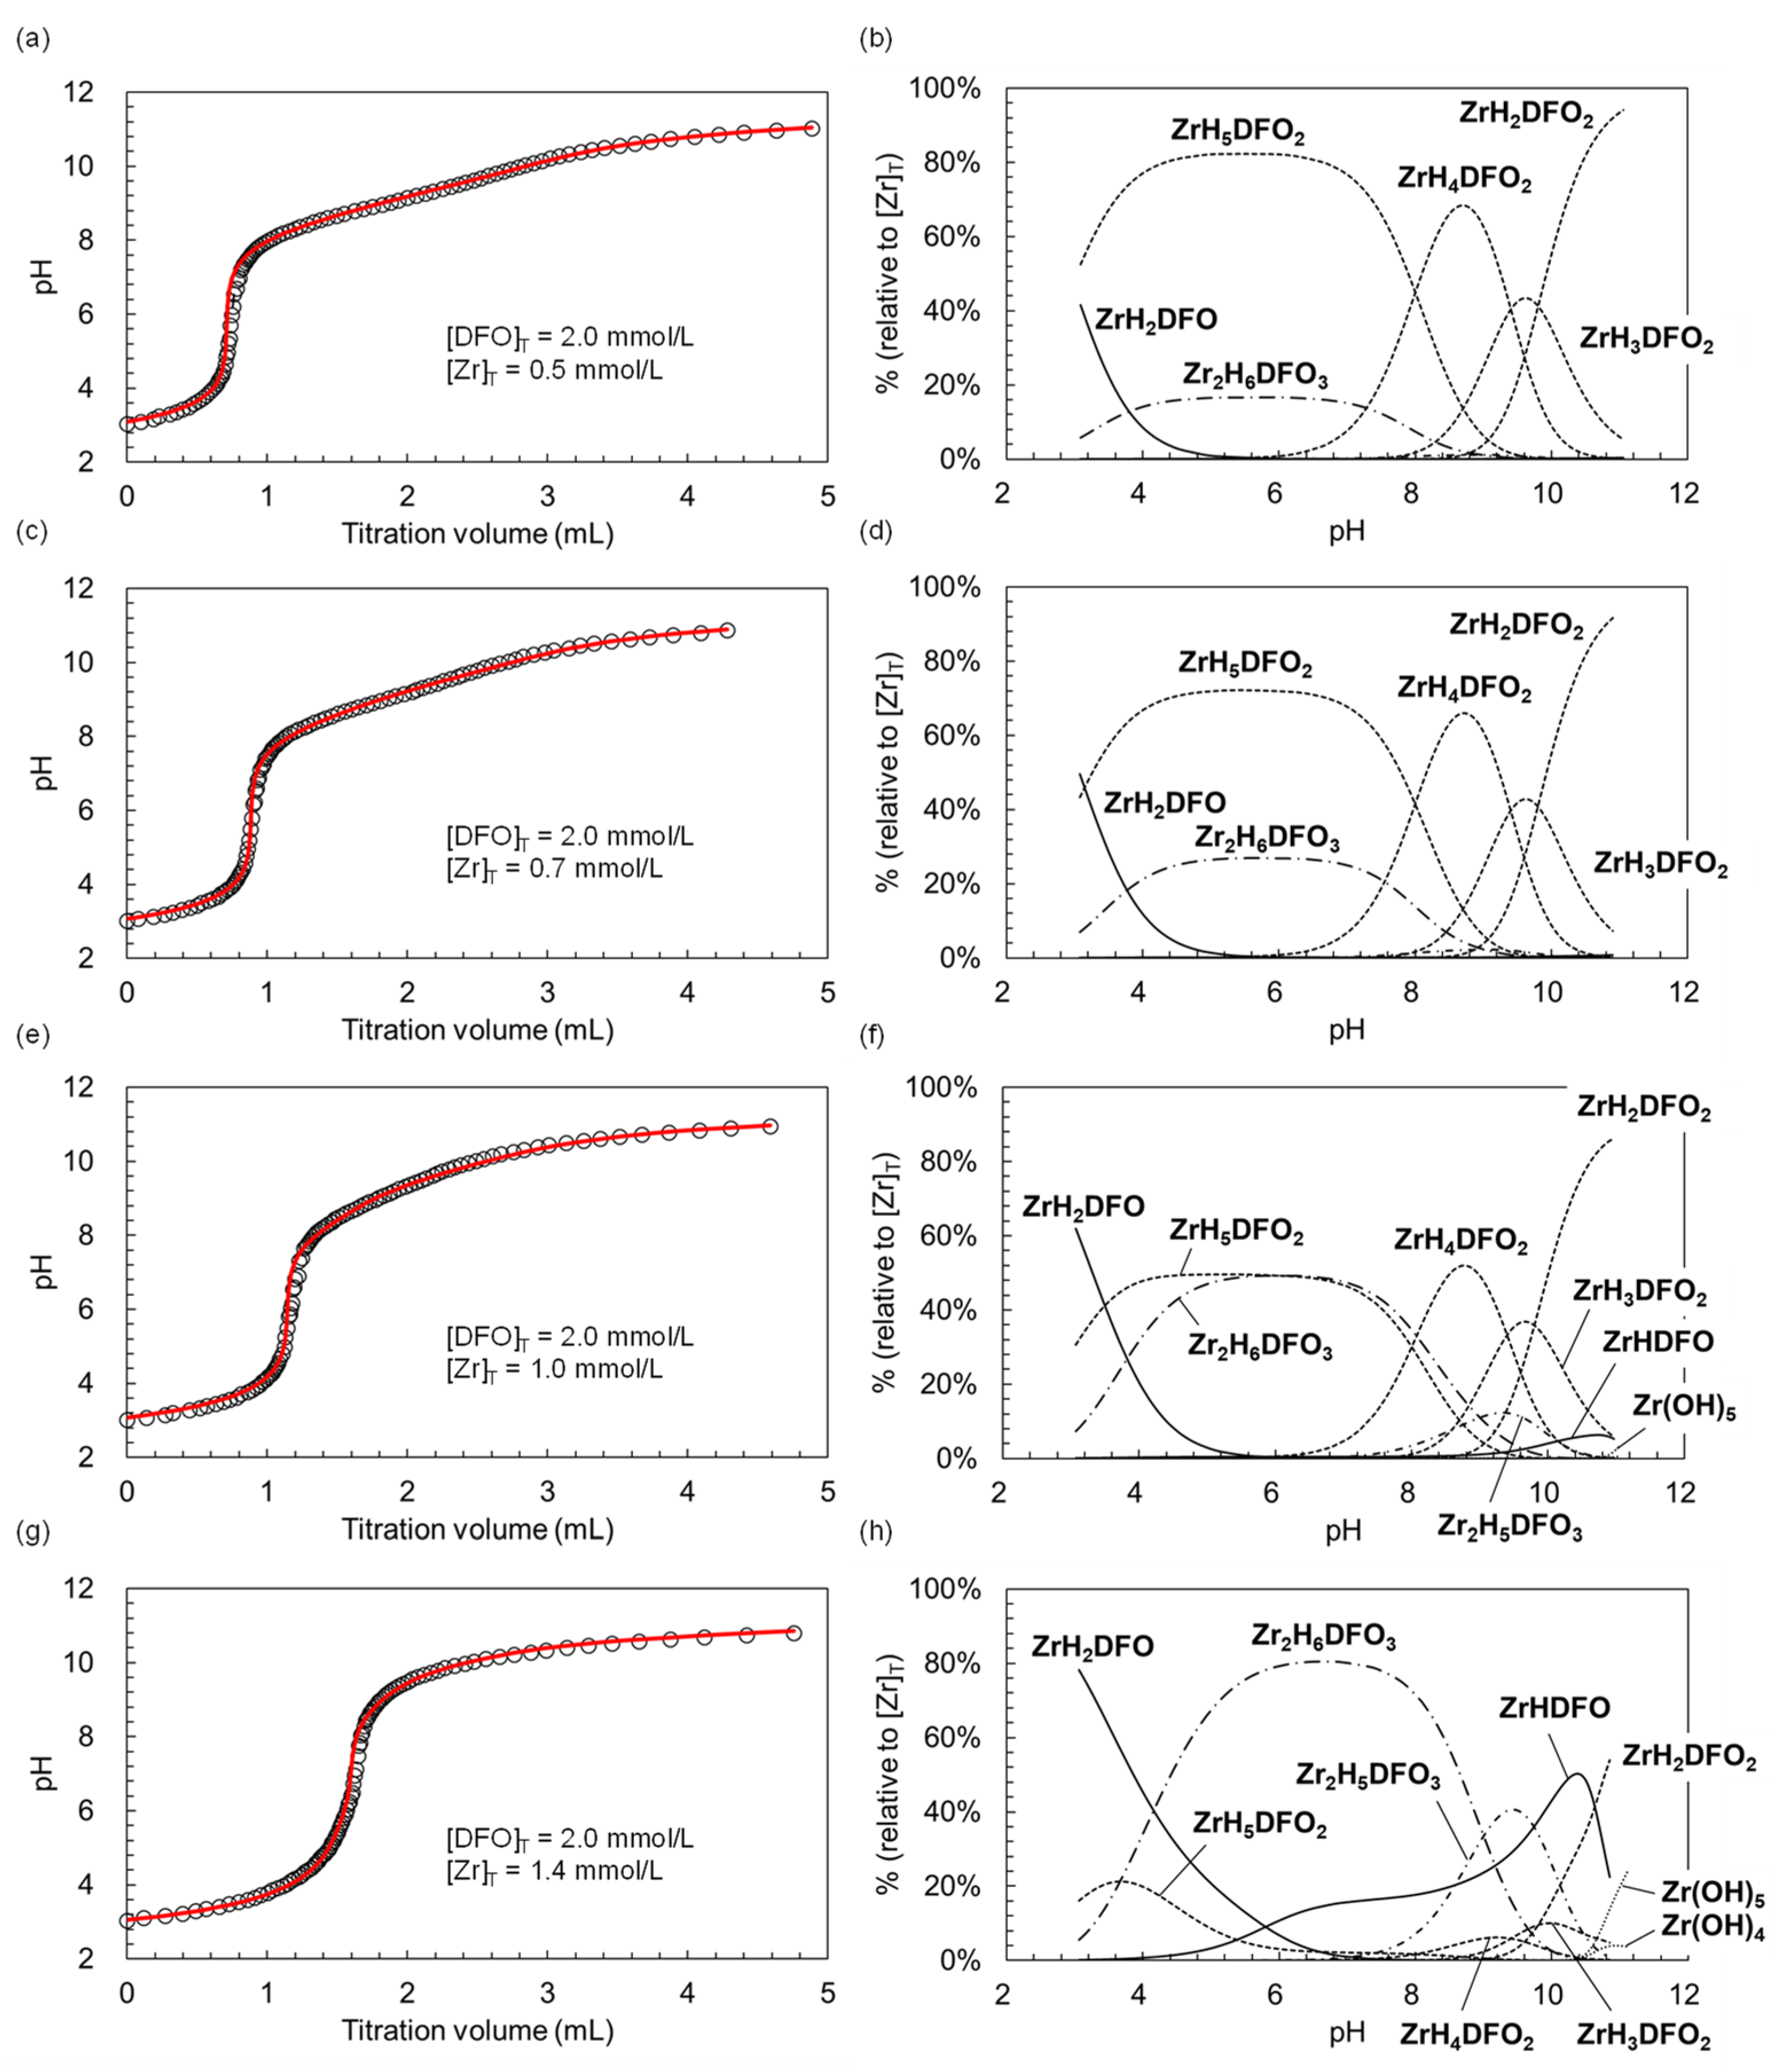
2.2. Potentiometric Titration

Results of the potentiometric titration of DFO (1–5 mmol/L each) are shown in Figure S4 of the Electronic Supplementary Material.
K a i = [ H ] [ H p 1 DFO ] [ H p DFO ]           ( i = 5 p ,   1 p 4 )
pKa values of HqDFO, defined in Equation (2), were determined from the titration curves and are summarized in Table 1. The pKa values obtained in this study showed good agreement with those in the previous report [15,16,17,18,19].
{ [ Zr ] T =   ( p β p q r [ Zr ] p [ H ] q [ DFO ] r + β Zr ( OH ) s [ Zr ] [ OH ] s ) [ DFO ] T =   ( r β p q r [ Zr ] p [ H ] q [ DFO ] r )   { ( 4 p + q 3 r ) β p q r [ Zr ] p [ H ] q [ DFO ] r + ( 4 s ) β Zr ( OH ) s [ Zr ] [ OH ] s } + [ H ] [ OH ] + [ Na ] = 0
Results of the potentiometric titration studies for the co-existence of DFO and Zr are shown in Figure 3a,c,e,g. Plateaus were observed at the range of pH 8.5–9.5 only when the ratio of DFO/Zr was over 2 ([DFO]T = 2.0 mmol/L, [Zr]T = 0–0.7 mmol/L). On the other hand, the plateau at the same pH range became smaller or was not observed when Zr/DFO ratio ≤ 2.0 ([DFO]T = 2.0 mmol/L, [Zr]T = 1.0–1.4 mmol/L). In order to determine stability constants, the simultaneous equations below were solved for each [Na], which is equivalent to the injection volume of NaOH aqueous solution (Equation (3)).
Stability constants of Zr(OH)s were adopted from the published results [20]. It is noted that formation of ZrCln was ignored due to low complexation ability of Cl to Zr4+ ion [21]. The stability constants obtained by fitting the Equation (3) to the titration curves are summarized in Table 2. The stability constants of ZrHDFO (logβ111), ZrH5DFO2 (logβ152), and Zr2H6DFO3 (logβ263) were 49.1 ± 0.3, 93.3 ± 0.1, and 147.7 ± 0.1, respectively. Titration curves numerically reproduced from the abovementioned stability constants are shown in the solid-line curves of Figure 3a,c,e,g. Each reproduced titration curve was well fitted to the experimental curves in all cases. Speciation curves of the Zr-DFO complex under each condition are shown in Figure 3b,d,f,h.

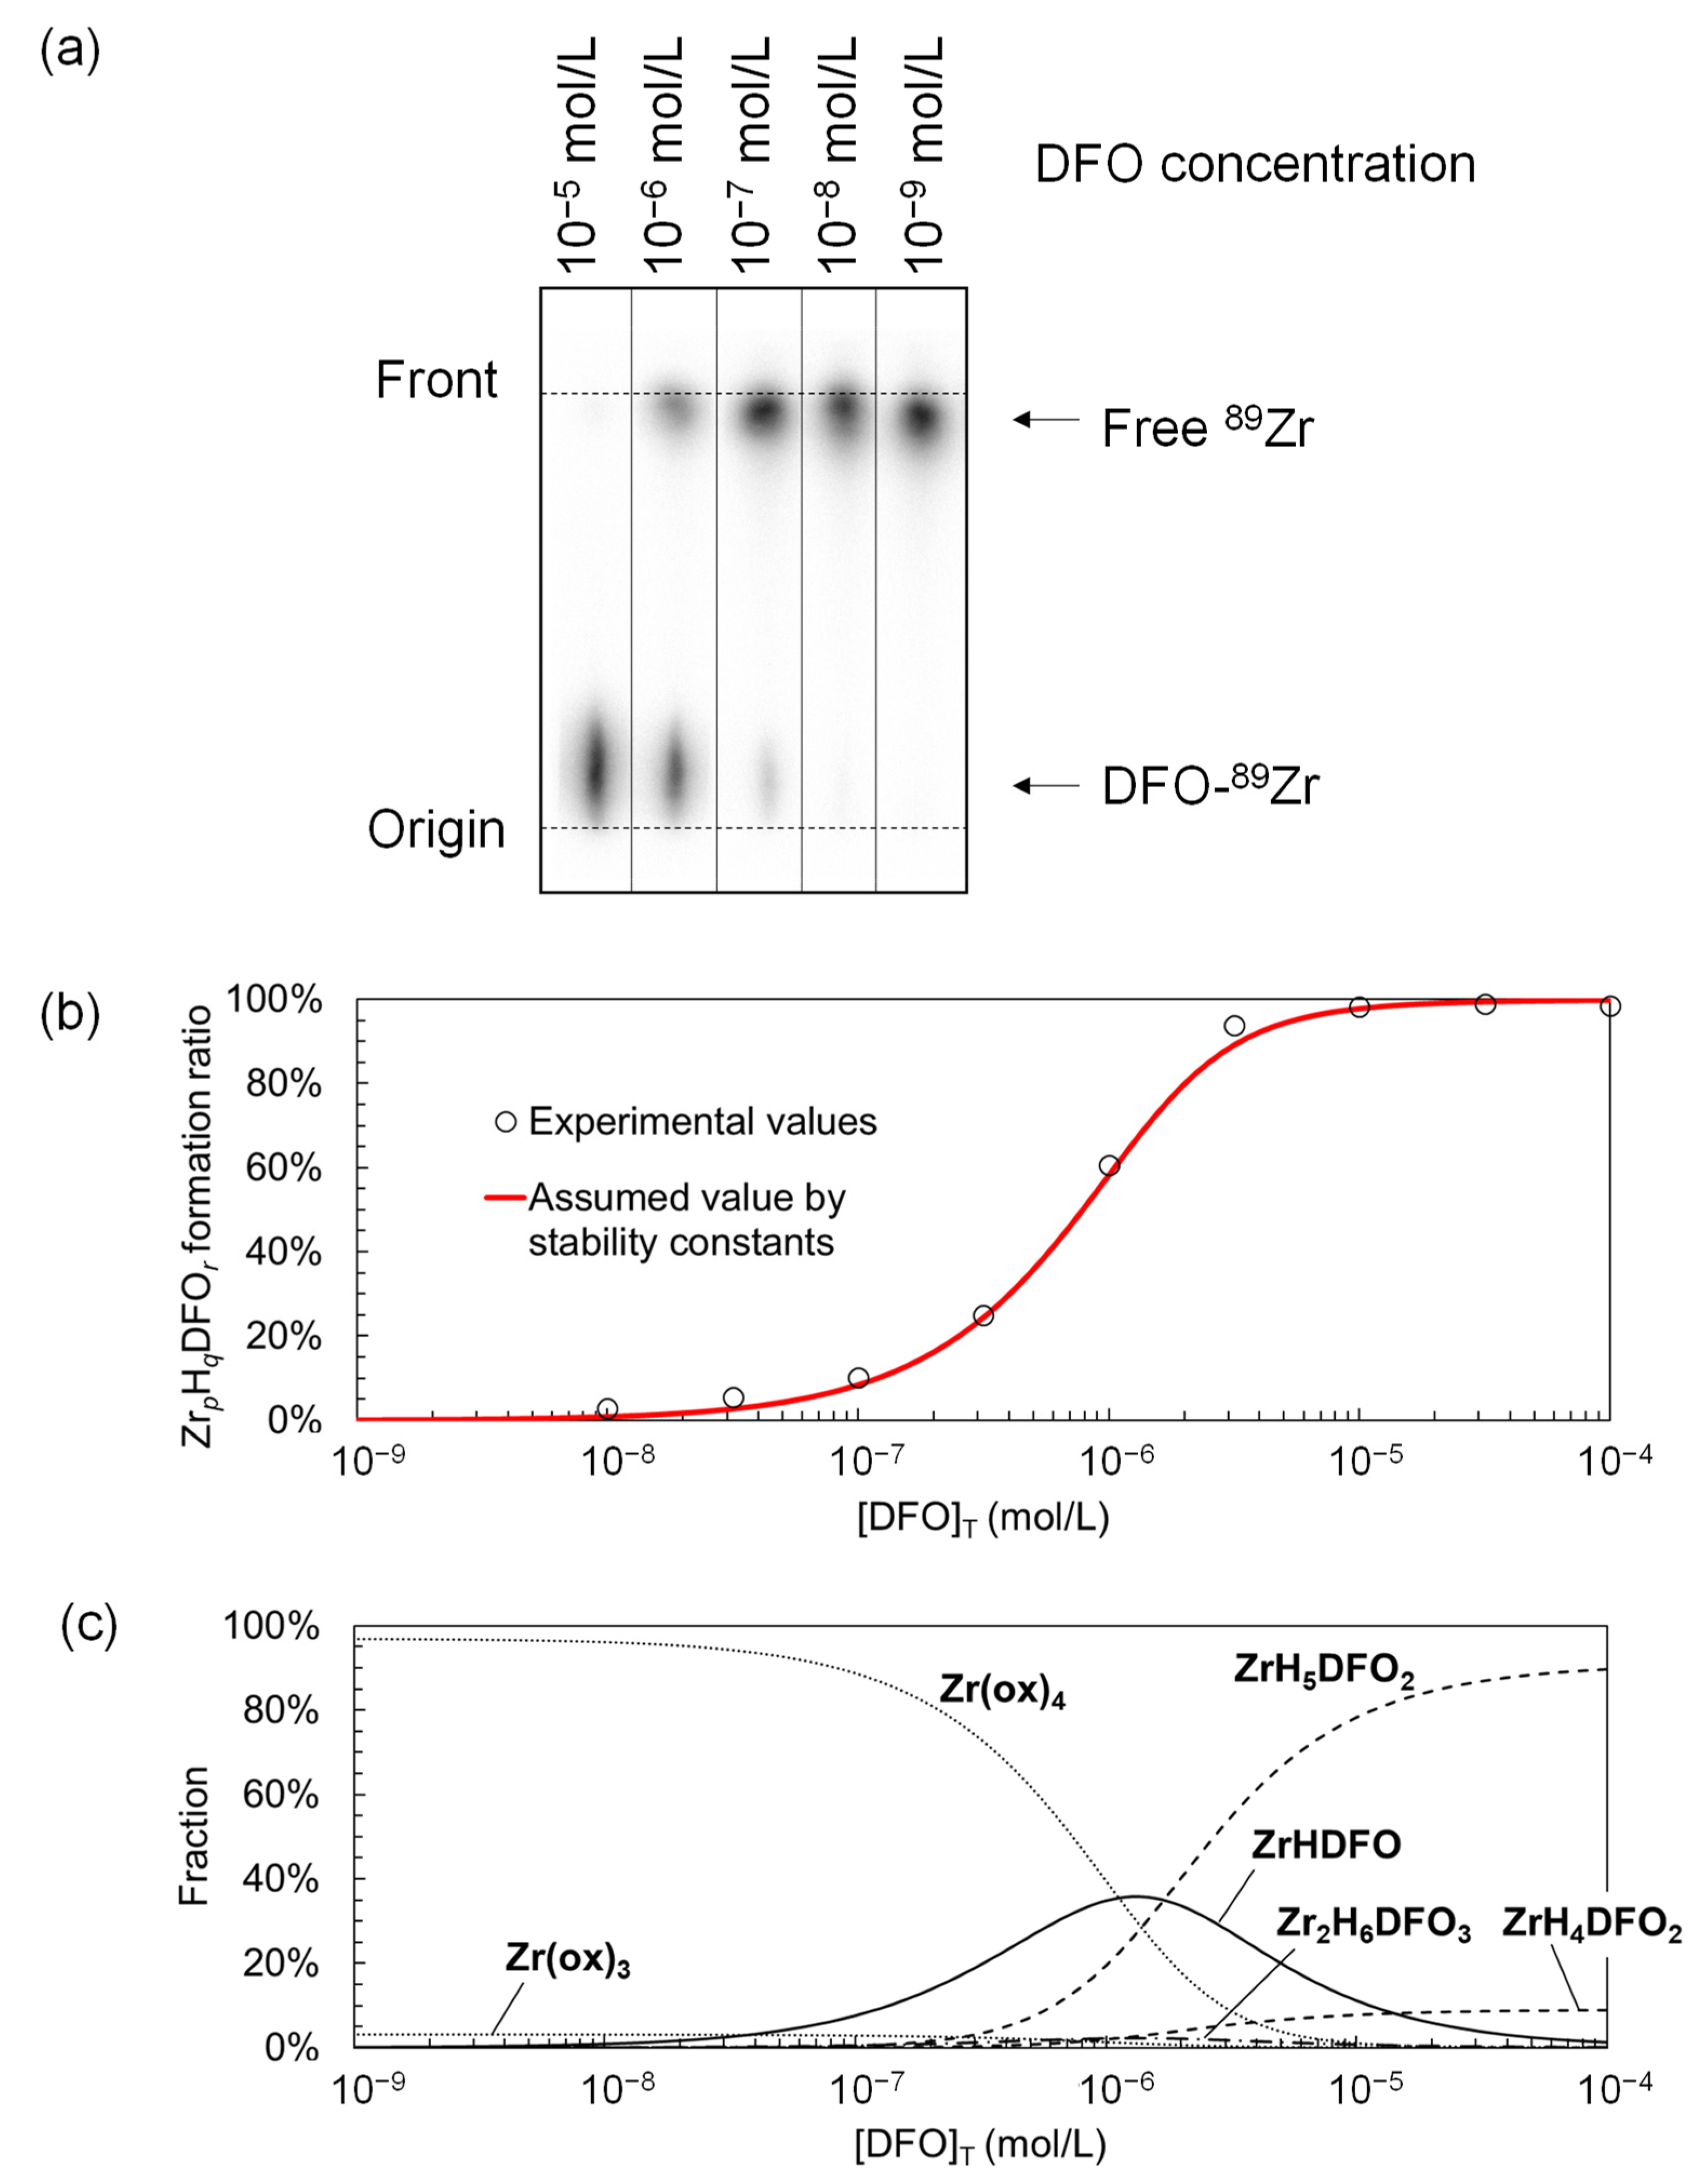
2.3. Competition Studies

ITLC images of the competitive titration in the presence of various concentrations of Y are shown in Figure S5. Radioactive spots at the retention factor (Rf) of 0.1–0.3 were derived from 89Zr-DFO, and those around the front of the TLC were derived from free 89Zr. The radiochemical yield of 89Zr-DFO was over 95% in all cases. ITLC images of the 89Zr distribution in the presence of various concentration of DFO (10−9–10−5 mol/L) and oxalate (0.1 mol/L) are shown in Figure 4a. The intensity of the 89Zr-DFO decreased as the concentration of DFO was diluted. Plots of experimental values are shown in Figure 4b. RCYs of 89Zr-DFO obtained in Figure 4a were equivalent to the total amounts of ZrpHqDFOr species in this case. The red solid line shows the simulation curve assumed from the stability constants obtained in this study, which was in turn well fitted to the experimental values, shown as open circles. The speciation curves were also simulated from the modified Equation (4) to consider Zr-oxalate species, Zr(ox)t (1 ≤ t ≤ 4).
{ [ Zr ] T =   ( p β pqr [ Zr ] p [ H ] q [ DFO ] r + β Zr ( OH ) s [ Zr ] [ OH ] s + β Zr ( ox ) t [ Zr ] [ ox ] t ) [ DFO ] T =   ( r β p q r [ Zr ] p [ H ] q [ DFO ] r ) [ ox ] T = [ ox ] + [ H ] [ ox ] K a 2 , ox + [ H ] 2 [ ox ] K a 1 , ox K a 2 , ox +   ( t β Zr ( ox ) t [ Zr ] [ ox ] t )   { ( 4 p + q 3 r ) β p q r [ Zr ] p [ H ] q [ DFO ] r + ( 4 s ) β Zr ( OH ) s [ Zr ] [ OH ] s + ( 4 2 t ) β Zr ( ox ) t [ Zr ] [ ox ] t } + [ H ] [ OH ] + [ Na ] 2 [ ox ] [ H ] [ ox ] K a 2 , ox = 0
The acid dissociation constants of oxalic acid (Ka1,ox = 10−1.28 and Ka2,ox = 10−3.65) and stability constants of Zr(ox)t were adopted from previously published results [13]. Speciation curves at pH 7.0 taking into account the existence of Zr-DFO (ZrpHqDFOr) and Zr-oxalate (Zr(ox)t) are presented in Figure 4c. This study showed that Zr-oxalate, Zr(ox)3 and Zr(ox)4, mainly exist at low concentration of DFO and Zr-DFO complex, while ZrHDFO and ZrH5DFO2 are dominant at high concentrations of DFO. On the other hand, zirconium hydroxide (Zr(OH)s) did not seem to be present in this system.

2.4. Estimation of RCYs and CARs

We formulated equations based on the following conditions: the speciation curves indicated that both ZrHqDFO2 and Zr2HqDFO3 species existed and that Zr(ox)4 was dominant (Figure 4c). However, the formation of ZrHq(DFO-mAb)2 bis-complex may be negligible due to steric hindrance between antibodies in the case of radiolabeling to DFO-mAb [22]. The radiolabeling condition is therefore simply modelled as competition between ZrHDFO and Zr(ox)4. Because the pKa values of DFO and oxalate indicated that DFO is a fully protonated form (H4DFO) and most of the oxalate is in the deprotonated form (ox) at pH 7.0, the DFO and Zr(ox)4 concentrations can be therefore defined as shown in Equations (5) and (6), respectively.
[ Zr ( ox ) 4 ] β Zr ( ox ) 4 [ Zr ] [ ox ] T 4
[ ZrHDFO ] β 111 K a 1 K a 2 K a 3 K a 4 [ Zr ] [ DFO ] T [ H ] 3
Therefore, the RCY of 89Zr-DFO-mAb ([ZrHDFO]/[Zr]T) can be approximately expressed as Equation (7).
[ ZrHDFO ] [ Zr ] T 1 1 + ( β Zr ( ox ) 4 [ H ] 3 [ ox ] T 4 / β 111 K a 1 K a 2 K a 3 K a 4 [ DFO ] T )
Furthermore, CAR can be estimated from Equation (6) by substituting the following equation for [DFO]T.
[ DFO mAb ] × CAR = [ DFO ] T
Using these equations, the RCYs were estimated under the conditions reported previously [14]. The RCY of 89Zr-DFO-mAb estimated by Equation (6) under the typical radiolabeling conditions ([ox]T = 0.1 mol/L, [DFO-mAb] = 0.5 mg/mL, MWDFO-mAb = 150 kDa, CAR = 1.5) was 86%. The RCY of 89Zr labeling in the presence of lower oxalate concentration (3.0 × 10⁻⁵ mol/L) than that of the standard protocol (1.0 × 10⁻⁴ mol/L) was >97% [23]. Calculation by Equation (6) demonstrated that the CAR with 97% of RCY was estimated to be 3.4 in the presence of 1 mg/mL of mAb and 0.1 mol/L of oxalate. On the other hand, the CAR with the same RCY was 0.3 when the oxalate concentration is 0.05 mol/L.

3. Discussion

Coordination chemistry plays significant roles in the design and evaluation of radiopharmaceuticals. Stability constants directly contribute to the binding strengths between radiometals and BFCs, which are in turn closely related to the in-vivo stability and consequently the pharmacokinetics, i.e., biodistribution and metabolism, of the radiometal-labeled radiopharmaceuticals. With further development of informatics on drug design and pharmacokinetics, the significance of thermodynamic parameters in the design of radiometal-labeled radiopharmaceuticals will increase. As interest in 89Zr has rapidly increased in recent years, numerous 89Zr-DFO-mAbs have been developed as 89Zr-immune-PET radiopharmaceuticals, including under clinical uses, such as 89Zr-DFO-atezolizumab [24]. Other BFCs containing no hydroxamate moiety, such as DOTA, have also been tested, but DFO remains the typical BFC for 89Zr labeling because of its high reactivity at room temperature. However, despite the interest in 89Zr-DFO-mAb, only a few studies have reported the stability constants of the Zr-DFO complexes [11,12]. Additionally, the reported stability constants seem to be inaccurate and the speciation of the Zr-DFO complex incomplete due to abovementioned reasons relating to the prediction of RCY. These backgrounds motivated us to re-evaluate the coordination chemistry of the Zr-DFO complex in this study.
In the present study, the nano-ESI-Q-MS spectroscopy successfully detected the mass peaks of ZrH2DFO2Na, ZrH3DFO2Na, and ZrH4DFO2 as well as those previously detected ZrDFO, ZrHDFO, and Zr2H4DFO3 species [11]. These MS studies showed the existence of ZrHqDFO2 species and are the first to obtain direct evidence of the unknown species. In addition, the plateaus at pH 8.5–9.5 observed in the potentiometric titration in the co-presence of DFO and Zr also inferred the presence of ZrHqDFO2 species because of the following reasons; the plateaus at pH 8.5–9.5 was originated from deprotonation of the hydroxamic acids of the non-complexed HqDFO. The non-complexed DFO existed when DFO/Zr > 2 (Figure 3a,c), which therefore caused the observation of the plateaus. On the other hand, ZrHqDFO2 species were formed, and the non-complexed DFO was negligible when (1 <) DFO/Zr ≤ 2 (Figure 3e,g), which induced the disappearance of the plateaus.
We recalculated the stability constants by taking three species, ZrHqDFO, ZrHqDFO2, and Zr2HqDFO3, into consideration. Consequently, the stability constant of ZrHDFO (logβ111 = 49.1 ± 0.3) was much larger than the previous result (logβ111 = 36.1) and the largest among the β111 values of the DFO metal complexes [9,15,19,25,26,27]. It should be noted that the simulation curves (solid red lines) obtained from the newly obtained stability constants showed excellent agreement with the experimental titration curves (open circles) in the potentiometric titration (Figure 4), which clearly demonstrated the correctness of our re-evaluated DFO-Zr complex model and its stability constants. It is most likely that both residual yttrium of the target material in the 89Zr production process and the oxalate eluent in the 89Zr purification process could inhibit the formation of the 89Zr-DFO complex because DFO can bind to either of them. Thus, we performed competition titration studies. The competition titration of Zr vs Y to DFO eliminated the concern about Y, as even excess amounts of Y (even Y/Zr ≥ 104 or Y/DFO ≥ 102) did not inhibit the complexation of Zr-DFO. The amount of Y was about ~10−5 mol/L in the purified 89Zr solution [28]. Considering that purified 89Zr solution is diluted 10-fold in radiolabeling reaction, the concentration of Y in radiolabeling reaction is estimated to be about ~10−6 mol/L. The competition titration results clearly revealed that remaining Y at the concentration of 10−6 mol/L does not inhibit the complexation of Zr-DFO. These results make sense because the YHDFO complex (log β111 = 16.9) is much less stable than ZrHDFO (log β111 = 49.1) [19]. On the other hand, the competition titration (DFO vs oxalate to Zr) also demonstrated that the formation of 89Zr-DFO and 89Zr-oxalate were in competition, as expected. To the best of our knowledge, this is the first study to experimentally show that oxalate inhibits the formation of Zr-DFO complexes. The ZrpHqDFOr formation ratio was assumed by Equation (2) and by the stability constants obtained in this study and is indicated by the solid red line in Figure 4b. Consequently, the assumed values were well fitted to the experimental values indicated by the open circles, which are supportive of the accuracy of the newly obtained stability constants.
As described before, the stability constant obtained from carefully considered complex model can predict the radiochemical yield (RCY) and the optimal chelator-to-antibody ratio (CAR). CAR is now recognized as an especially significant parameter for the evaluation of the immunoreactivity of radiolabeled compounds; the set of optimal CARs will both show high RCY values in the radiolabeling process and maintain a high immunoreactivity. It is known that a high CAR is favorable for achieving a high RCY but that a radiolabeled antibody with high CAR decreases its immunoreactivity because some binding sites to the target-molecule are bound to BFC groups instead. In fact, a recent study reported that 89Zr-DFO-mAb with a high CAR showed low tumor uptake [29]. We therefore used the stability constants obtained in this study to estimate the RCY in the radiolabeling of 89Zr-DFO-mAb and determine the CAR that would satisfy certain criteria of RCY. The RCY of 89Zr-DFO-mAb estimated by Equation (6) under the typical radiolabeling conditions (86%) and the lower oxalate concentration (>99%) were identical to the experimental values (87% [14] and >97% [23]). These results clearly indicated that the experimental RCYs were explained well by the Equation (6). Even though logβ111 determined in this study much differs with previous study [11,12], the good agreement between experimental and theoretical RCY indicates the accuracy of our stability constants.
We then tried to estimate CARs to satisfy certain criteria of RCY. We set the criteria for RCY in this study as 97% because the IAEA quality control guideline recommended a radiochemical purity of >95% for 89Zr-DFO-trastuzumab for its clinical trials [30]. Calculation by Equation (6) demonstrated that the CAR with 97% of RCY was estimated to be 3.4 in the presence of 1 mg/mL of mAb and 0.1 mol/L of oxalate. On the other hand, the CAR with the same RCY is lower (0.3) when the oxalate concentration is 0.05 mol/L. These results demonstrated that a lower concentration of oxalate is desirable to minimize the CAR when meeting the RCY criteria since a low CAR is generally preferable to maintain the immunoreactivity of the desired radiolabeled antibodies, as described above. Much experimental effort is still necessary to optimize CAR because the number of DFO-mAbs with different CARs are prepared and tested under different conditions in terms of both RCY and immunoreactivity. However, the reported approach enables us to narrow down the conditions from the standpoint of RCY, so it will help to find the optimal CAR for 89Zr-DFO-antibodies with less effort. As a result, DFO-mAb with optimal CAR will be utilized to the manufactural preparation of 89Zr-DFO-mAb radiopharmaceuticals for immune-PET. Furthermore, we expect that these findings will greatly contribute to the design of other radiometal labeled radiopharmaceuticals for clinical use.

4. Materials and Methods

4.1. Chemicals

All aqueous solutions were prepared with distilled water. DFO (Apollo Scientific Ltd., Stockport, UK), 1.0 mol/L NaOH solution (Nacalai Tesque, Kyoto, Japan), NaCl, citric acid (Fujifilm Wako Pure Chemical, Osaka, Japan, guaranteed reagent grade), 1.0 g/L ZrOCl2 in 1.0 mol/L HCl solution (Hayashi Pure Chemical Industries, Osaka, Japan), HEPES (Dojindo Molecular Technology, Kumamoto, Japan), and yttrium (Y) foil (Alfa Aesar, Heysham, UK) were used without further purification.

4.2. Mass Spectrometry

In the mass spectrometry experiments, two types of ionization techniques were tried: electrospray ionization (ESI) and nano-ESI. Mass-spectral data on ESI-Q-MS experiments were collected on a Shimadzu LCMS-8040 mass spectrometer, and data on Nano-ESI-Q-MS experiments were collected on a Thermo Scientific™ Q Exactive™ mass spectrometer, Waltham, USA. Each experiment was conducted in positive mode using the flow injection method. The contents of sample solutions were as follows: Zr: 0.5 mmol/L, DFO: 1.0 mmol/L, NaCl: 0.15 mol/L, and HEPES: 0.1 mol/L (pH 7.0). The concentration of Zr was aligned with a previous study (Zr: 1.0 × 10⁻³ mol/L, DFO: 1.0 × 10⁻³ mol/L) [11]. Since the presence of ZrHqDFO2 was inferred from the results of the potentiometric titration experiment, the concentration of Zr was reduced to half. HEPES buffer was used in order to maintain pH of the reactant at 7.0. The solutions were incubated for 1 h at room temperature to equilibrate Zr-DFO system. Sample solutions were diluted 500-fold just before the MS spectrometry measurement.

4.3. Potentiometric Titration

A C-171 automatic titrator (Kyoto Electronics Manufacturing Co., Ltd., Kyoto, Japan) was used for the potentiometric titration studies. The electrode was filled with 3.3 mol/L KCl solution. The initial volume of the reaction solution was 50 mL, and the initial concentration of DFO ([DFO]T) and Zr ([Zr]T) were adjusted to 1.0–5.0 × 10⁻³ mol and 0.5–1.4 × 10⁻³ mol, respectively. Ionic strength (I) was adjusted to 0.15 mol NaCl in all measurements. The pH was adjusted to below 3 before the titration measurement. N2 gas was then bubbled through the mixture, which was then vigorously stirred for at least 1 min to drive off dissolved CO2 and to allow the solution and the electrode to equilibrate at the 25 °C. Finally, the sample solution was titrated to pH 11 with certified carbonate-free NaOH in dynamic mode, meaning that the amount of 0.1 mol/L NaOH solution added per shot was continuously adjusted by the protocol to achieve an even rate of pH increase. The pKa values of HqDFO and the stability constants βpqr of Zr-DFO were determined by the non-linear least-squares fitting of titration curves using the Equations (1)–(3). Theoretical pH curves against NaOH amount were reproduced by calculation with Equations (1)–(3) using each combination of pKa and βpqr. The most fitted combination of pKa and βpqr was explored.

4.4. Production of 89Zr

Production of 89Zr was carried out using an AVF cyclotron at Takasaki Ion Accelerators for Advanced Radiation Applications (TIARA) at Takasaki Advanced Radiation Research Institutes, the National Institutes for Quantum and Radiological Science and Technology (QST). 89Zr was produced via the 89Y(p,n)89Zr reaction, irradiating 89Y foil (weight: 0.36 g; size: 10 mm × 10 mm × 0.8 mm) with 20 MeV proton beams accelerated by the AVF cyclotron. The incident energy of the proton beam upon the Y targets was adjusted to 13 MeV by 1.2-mm thick Al degraders in order to prevent the generation of 88Zr. The produced radionuclides were characterized by gamma-ray spectrometry by using a high-purity germanium (HPGe) detector coupled to a multichannel analyzer MCA 7700 (SEICO EG&G Co., Ltd., Tokyo, Japan). The radioactivity of 89Zr was determined by considering the gamma-ray energy at 909.2 keV. As a result of characterization by gamma-ray spectrometry, only the radiation from 89Zr was detected, and the intrinsic gamma rays of 88Zr (392.9 keV) were not detected. The generated 89Zr activity per irradiation time and beam current was 23.1 MBq/µAh in our experiments. Purified [89Zr] chloride (89ZrCl4) solution was prepared from irradiated Y targets by the procedures described by Holland et al. [31]. Typically, 80–90% of 89Zr was recovered from the irradiated target as 89ZrCl4.

4.5. Competition Titration

Competition titration studies were performed with ITLC-SG Chromatography paper (Agilent Technologies, Santa Clara, CA, USA). Zr versus Y competition titration to DFO was conducted as follows. Purified [89Zr]ZrCl4 solution (typically 0.1–1.0 MBq), nonradioactive ZrCl4 solution, yttrium chloride (YCl3) solution, HEPES buffer (pH 7.0), and oxalic acid solution were added to DFO solution in a 1.5 mL Eppendorf tube. The final concentrations were DFO 5.0–10 mol/L, Zr 10−7 mol/L, Y 10−8–10−3 mol/L (Y/Zr ratio was 10−1–104), HEPES 0.25 mol/L, and oxalate 0.1 mol/L. The final pH of each mixture was maintained at 7.0. Each mixture was incubated for 1 h at room temperature. After incubation, an aliquot of each mixture was spotted on ITLC paper and analyzed using 0.02 mol/L citrate buffer (pH 5.0) as the mobile phase. Competition titration of DFO versus oxalate complexation to Zr was also conducted using a mixture solution of DFO 10−9–10−4 mol/L, HEPES 0.25 mol/L and oxalate 0.1 mol/L (pH 7.0) without adding nonradioactive Zr or Y. Incubation and ITLC conditions were the same as in the Zr versus Y competition titration.

5. Conclusions

In the present study, highly accurate stability constants for the Zr-DFO complexes were successfully determined. This study also demonstrated that the newly obtained stability constants and consideration of the inhibition by the Zr-oxalate complex enabled the equations to accurately calculate the RCYs and the CARs such that they satisfied certain criteria on RCYs. We therefore concluded that our re-evaluated Zr-DFO complex model was a success. Accurate thermodynamic parameters consequently will contribute significantly to provide a theoretical framework for quantitative calculation of RCY from CAR, antibody, and oxalate concentrations in the process of developing new Zr-DFO mAb for clinical application, and as a result, DFO-mAb with optimal CAR will be used for the preparation of high-quality 89Zr-DFO immune-PET tracers.

Supplementary Materials

The following are available online. Nano ESI MS spectra (ZrDFO+, ZrH2DFO2Na+, and Zr2H4DFO33+), titration curves and speciation curves of DFO, and ITLC images of the competitive DFO titration of Zr versus Y are available online. Figure S1: Nano ESI MS spectra of ZrDFO+, Figure S2: Nano ESI MS spectra of ZrH2DFO2Na+, Figure S3: Nano ESI MS spectra of Zr2H4DFO33+, Figure S4: Titration curves and speciation curves of DFO ([DFO]T = 1.0–5.0 mmol/L), Figure S5: ITLC images of the competitive DFO titration of Zr (10−7 mol/L) versus Y (10−8–10−3 mol/L)

Author Contributions

Conceptualization, R.I. and S.W.; methodology, R.I.; software, R.I.; validation, R.I.; formal analysis, R.I. and I.S.; investigation, R.I.; resources, R.I.; data curation, R.I. and I.S.; writing—original draft preparation, R.I.; writing—review and editing, I.S. and S.W.; visualization, R.I. and S.W.; supervision, N.S.I. and S.W.; project administration, H.I.; funding acquisition, H.I. and N.S.I. All authors have read and agreed to the published version of the manuscript.

Funding

This research received no external funding.

Institutional Review Board Statement

Not applicable.

Informed Consent Statement

Not applicable.

Data Availability Statement

The datasets for this manuscript can be obtained from the corresponding author upon reasonable request.

Acknowledgments

We express our deep gratitude to Toshifumi Omura (JFE Engineering Corporation) for his direct technical help. We are also grateful to Satoshi Watanabe, Koji Imai, and staff of Takasaki Advanced Radiation Application at QST for their operations of the AVF cyclotron. This study was conducted as a part of a collaborative research agreement between JFE Engineering Corporation and QST.

Conflicts of Interest

The authors declare no conflict of interest.

References

  1. Boswell, C.A.; Brechbiel, M.W. Development of Radioimmunotherapeutic and Diagnostic Antibodies: An inside-out View. Nucl. Med. Biol. 2007, 34, 757–778. [Google Scholar] [CrossRef] [PubMed] [Green Version]
  2. van Dongen, G.A.M.S.; Visser, G.W.M.; Hooge, M.N.L.; de Vries, E.G.; Perk, L.R. Immuno-PET: A Navigator in Monoclonal Antibody Development and Applications. Oncologist 2007, 12, 1379–1389. [Google Scholar] [CrossRef] [PubMed] [Green Version]
  3. Nayak, T.K.; Brechbiel, M.W. Radioimmunoimaging with Longer-Lived Positron-Emitting Radionuclides: Potentials and Challenges. Bioconjugate Chem. 2009, 20, 825–841. [Google Scholar] [CrossRef] [PubMed] [Green Version]
  4. Wu, A.M. Antibodies and Antimatter: The Resurgence of Immuno-PET. J. Nucl. Med. 2009, 50, 2–5. [Google Scholar] [CrossRef] [Green Version]
  5. Jauw, Y.W.S.; van Oordt, C.W.M.-v.d.H.; Hoekstra, O.S.; Hendrikse, N.H.; Vugts, D.J.; Zijlstra, J.M.; Huisman, M.C.; van Dongen, G.A.M.S. Immuno-Positron Emission Tomography with Zirconium-89-Labeled Monoclonal Antibodies in Oncology: What Can We Learn from Initial Clinical Trials? Front. Pharmacol. 2016, 7, 131. [Google Scholar] [CrossRef] [PubMed]
  6. Meijs, W.E.; Herscheid, J.D.M.; Haisma, H.J.; Pinedo, H.M. International journal of radiation applications and instrumentation. Part A. Applied radiation and isotopes Evaluation of Desferal as a Bifunctional Chelating Agent for Labeling Antibodies with Zr-89. Int. J. Radiat. Appl. instrumentation. Part A Appl. Radiat. Isot. 1992, 43, 1443–1447. [Google Scholar] [CrossRef]
  7. Popov, K.; Rönkkömäki, H.; Lajunen, L.H.J. Critical Evaluation of Stability Constants of Phosphonic Acids (IUPAC Technical Report). Pure Appl. Chem. 2001, 73, 1641–1677. [Google Scholar] [CrossRef]
  8. Wadas, T.J.; Wong, E.H.; Weisman, G.R.; Anderson, C.J. Coordinating Radiometals of Copper, Gallium, Indium, Yttrium, and Zirconium for PET and SPECT Imaging of Disease. Chem. Rev. 2010, 110, 2858–2902. [Google Scholar] [CrossRef] [PubMed] [Green Version]
  9. Evers, A.; Hancock, R.D.; Martell, A.E.; Motekaitis, R.J. Metal Ion Recognition in Ligands with Negatively Charged Oxygen Donor Groups. Complexation of Iron(III), Gallium(III), Indium(III), Aluminum(III), and Other Highly Charged Metal Ions. Inorg. Chem. 1989, 28, 2189–2195. [Google Scholar] [CrossRef]
  10. Summers, K.L.; Sarbisheh, E.K.; Zimmerling, A.; Cotelesage, J.J.H.; Pickering, I.J.; George, G.N.; Price, E.W. Structural Characterization of the Solution Chemistry of Zirconium(IV) Desferrioxamine: A Coordination Sphere Completed by Hydroxides. Inorg. Chem. 2020, 59, 17443–17452. [Google Scholar] [CrossRef]
  11. Savastano, M.; Bazzicalupi, C.; Ferraro, G.; Fratini, E.; Gratteri, P.; Bianchi, A. Tales of the Unexpected: The Case of Zirconium(IV) Complexes with Desferrioxamine. Molecules 2019, 24, 2098. [Google Scholar] [CrossRef] [Green Version]
  12. Toporivska, Y.; Gumienna-Kontecka, E. The Solution Thermodynamic Stability of Desferrioxamine B (DFO) with Zr(IV). J. Inorg. Biochem. 2019, 198, 110753. [Google Scholar] [CrossRef]
  13. KOYASHI, T.; SASAKI, T.; TAKAGI, I.; MORIYAMA, H. Zirconium Solubility in Ternary Aqueous System of Zr(IV)-OH-Carboxylates. J. Nucl. Sci. Technol. 2009, 46, 142–148. [Google Scholar] [CrossRef]
  14. Perk, L.R.; Vosjan, M.J.W.D.; Visser, G.W.M.; Budde, M.; Jurek, P.; Kiefer, G.E.; van Dongen, G.A.M.S. P-Isothiocyanatobenzyl-Desferrioxamine: A New Bifunctional Chelate for Facile Radiolabeling of Monoclonal Antibodies with Zirconium-89 for Immuno-PET Imaging. Eur. J. Nucl. Med. Mol. Imaging 2010, 37, 250–259. [Google Scholar] [CrossRef] [PubMed] [Green Version]
  15. Buglyó, P.; Culeddu, N.; Kiss, T.; Micera, G.; Sanna, D. Vanadium (IV) and Vanadium (V) Complexes of Deferoxamine B in Aqueous Solution. J. Inorg. Biochem. 1995, 60, 45–59. [Google Scholar] [CrossRef]
  16. Desroches, S.; Biron, F.; Berthon, G. Aluminum Speciation Studies in Biological Fluids Part 5. A Quantitative Investigation of Al(III) Complex Equilibria with Desferrioxamine, 2,3-Dihydroxybenzoic Acid, Tiron, CP20 (L1), and CP94 under Physiological Conditions, and Computer-Aided Assessment of the Aluminum-Mobilizing Capacities of These Ligands in Vivo. J. Inorg. Biochem. 1999, 75, 27–35. [Google Scholar] [CrossRef]
  17. Simanova, A.A.; Persson, P.; Loring, J.S. Evidence for Ligand Hydrolysis and Fe(III) Reduction in the Dissolution of Goethite by Desferrioxamine-B. Geochim. Cosmochim. Acta 2010, 74, 6706–6720. [Google Scholar] [CrossRef]
  18. Duckworth, O.W.; Bargar, J.R.; Jarzecki, A.A.; Oyerinde, O.; Spiro, T.G.; Sposito, G. The Exceptionally Stable Cobalt(III)–Desferrioxamine B Complex. Mar. Chem. 2009, 113, 114–122. [Google Scholar] [CrossRef]
  19. Christenson, E.A.; Schijf, J. Stability of YREE Complexes with the Trihydroxamate Siderophore Desferrioxamine B at Seawater Ionic Strength. Geochim. Cosmochim. Acta 2011, 75, 7047–7062. [Google Scholar] [CrossRef]
  20. Sasaki, T.; Koyashi, T.; Takagi, I.; Moriyama, H. Hydrolysis Constant and Coordination Geometry of Zirconium(IV). J. Nucl. Sci. Technol. 2008, 45, 735–739. [Google Scholar] [CrossRef]
  21. Brown, P.L.; Curti, E.; Grambow, B. Chemical Thermodynamics of Zirconium; Mompean, F., Ed.; Elsevier Science: Amsterdam, The Netherlands, 2006; Volume 8, ISBN 9780080457536. [Google Scholar]
  22. Vosjan, M.J.W.D.; Perk, L.R.; Visser, G.W.M.; Budde, M.; Jurek, P.; Kiefer, G.E.; van Dongen, G.A.M.S. Conjugation and Radiolabeling of Monoclonal Antibodies with Zirconium-89 for PET Imaging Using the Bifunctional Chelate p-Isothiocyanatobenzyl-Desferrioxamine. Nat. Protoc. 2010, 5, 739. [Google Scholar] [CrossRef]
  23. Bhatt, N.B.; Pandya, D.N.; Rideout-Danner, S.; Gage, H.D.; Marini, F.C.; Wadas, T.J. A Comprehensively Revised Strategy That Improves the Specific Activity and Long-Term Stability of Clinically Relevant 89 Zr-Immuno-PET Agents. Dalton Trans. 2018, 47, 13214–13221. [Google Scholar] [CrossRef] [PubMed]
  24. Wei, W.; Rosenkrans, Z.T.; Liu, J.; Huang, G.; Luo, Q.-Y.; Cai, W. ImmunoPET: Concept, Design, and Applications. Chem. Rev. 2020, 120, 3787–3851. [Google Scholar] [CrossRef] [PubMed]
  25. Farkas, E.; Csóka, H.; Micera, G.; Dessi, A. Copper(II), Nickel(II), Zinc(II), and Molybdenum(VI) Complexes of Desferrioxamine B in Aqueous Solution. J. Inorg. Biochem. 1997, 65, 281–286. [Google Scholar] [CrossRef]
  26. Kiss, T.; Farkas, E. Metal-Binding Ability of Desferrioxamine, B. J. Incl. Phenom. Mol. Recognit. Chem. 1998, 32, 385–403. [Google Scholar] [CrossRef]
  27. Jones, K.E.; Batchler, K.L.; Zalouk, C.; Valentine, A.M. Ti(IV) and the Siderophore Desferrioxamine B: A Tight Complex Has Biological and Environmental Implications. Inorg. Chem. 2017, 56, 1264–1272. [Google Scholar] [CrossRef] [PubMed]
  28. Graves, S.A.; Kutyreff, C.; Barrett, K.E.; Hernandez, R.; Ellison, P.A.; Happel, S.; Aluicio-Sarduy, E.; Barnhart, T.E.; Nickles, R.J.; Engle, J.W. Evaluation of a Chloride-Based 89Zr Isolation Strategy Using a Tributyl Phosphate (TBP)-Functionalized Extraction Resin. Nucl. Med. Biol. 2018, 64, 1–7. [Google Scholar] [CrossRef] [PubMed]
  29. Sharma, S.K.; Glaser, J.M.; Edwards, K.J.; Sarbisheh, E.K.; Salih, A.K.; Lewis, J.S.; Price, E.W. A Systematic Evaluation of Antibody Modification and 89Zr-Radiolabeling for Optimized Immuno-PET. Bioconjugate Chem. 2020, 32, 1177–1191. [Google Scholar] [CrossRef] [PubMed]
  30. International Atomic Energy Agency. Quality Control in the Production of Radiopharmaceuticals, IAEA-TECDOC-1856; International Atomic Energy Agency: Vienna, Austria, 2018; p. 77. Available online: https://www-pub.iaea.org/MTCD/Publications/PDF/TE-1856web.pdf (accessed on 1 August 2021).
  31. Holland, J.P.; Sheh, Y.; Lewis, J.S. Standardized Methods for the Production of High Specific-Activity Zirconium-89. Nucl. Med. Biol. 2009, 36, 729–739. [Google Scholar] [CrossRef] [Green Version]
Figure 1. Chemical structure and pKa values of H4DFO. Deprotonation sites are highlighted in red.
Molecules 26 04977 g001
Scheme 1. Reaction between Zr(ox)4 and ZrHDFO. This ligand exchange equilibrium is expected around [DFO]T = 10−6 mol/L.
Molecules 26 04977 sch001
Figure 2. Mass spectra of Zr-DFO complex by Nano-ESI-Q-MS. (a) Entire spectrum from m/z = 500 to 1000. (b) Enlarged view of the mass spectra at the range from m/z = 615 to 620. (c) Isotope distribution of ZrH3DFO2Na2+ species. (d) Nano-ESI-Q-MS/MS spectra from the precursor ion of m/z = 1229.571. A disassembled peak (m/z = 647.23) was observed.
Molecules 26 04977 g002
Figure 3. Titration curves and speciation curves of Zr-DFO complex in the co-presence of DFO ([DFO]T = 2.0 mmol/L) and (a,b) [Zr]T = 0.5 mmol/L (DFO/Zr ratio = 4.0); (c,d) [Zr]T = 0.7 mmol/L (DFO/Zr = 2.85); (e,f) [Zr]T = 1.0 mmol/L (DFO/Zr = 2.0); and (g,h) [Zr]T = 1.4 mmol/L (DFO/Zr = 1.43). Each circle in the titration curve shows an experimental value. The solid red line shows the theoretical curve calculated from the stability constants determined in the potentiometric titration. Speciation curves were generated from Equation (2). All titrations were performed at 25 ℃ in ion strength of 0.15 mol/L NaCl.
Molecules 26 04977 g003
Figure 4. Results of the competition titration. (a) ITLC images of the competitive 89Zr titration of DFO (10−9–10–5 mol/L) vs oxalate (0.1 mol/L). Free 89Zr was distributed at Rf = 0.8–1.0; 89Zr-DFO at Rf = 0.2–0.3. (b) Titration curves of ZrpHqDFOr formation ratio against the DFO concentration. The formation ratio is shown as approximately equal to the radioactivity of 89Zr-DFO per total radioactivity of 89Zr. The open circles show experimental values of the competitive titration, and the red solid line indicates the theoretical curve assumed from the Equation (2) using the calculated stability constants. (c) Speciation curves of the ZrpHqDFOr, Zr(OH)s, and Zr(ox)t species in the system of DFO (10–9–10–4 mol/L) oxalate (0.1 mol/L) at pH 7.0. Calculated from the stability constants obtained in this study.
Molecules 26 04977 g004
Table 1. The log pKai of DFO (1 ≤ i ≤ 4) obtained at various ionic strengths I (mol/L) of NaCl.
pKa1pKa2pKa3pKa4Ref
0.18.4 ± 0.39.2 ± 0.19.7 ± 0.211.0 ± 0.3[18]
0.158.38 ± 0.038.96 ± 0.049.66 ± 0.0811.31 ± 0.25This study
0.158.2078.8119.38110.397[16]
0.608.33 ± 0.038.96 ± 0.039.45 ± 0.0510.85 ± 0.05[15]
0.708.40 ± 0.018.93 ± 0.029.58 ± 0.0210.74 ± 0.09[19]
18.6 ± 0.49.2 ± 0.39.8 ± 0.210.9 ± 0.1[17]
Table 2. The log βpqr of Zr-DFO complexes determined in this study.
pqrlog βpqr
11149.1 ± 0.3
12154.9 ± 0.3
12266.1 ± 0.1
13275.9 ± 0.3
14285.3 ± 0.1
15293.3 ± 0.1
253138.7 ± 0.1
263147.7 ± 0.1
Publisher’s Note: MDPI stays neutral with regard to jurisdictional claims in published maps and institutional affiliations.

