
Native Collagen II Relieves Bone Impairment through Improving Inflammation and Oxidative Stress in Ageing db/db Mice

 ,
, 
Abstract
: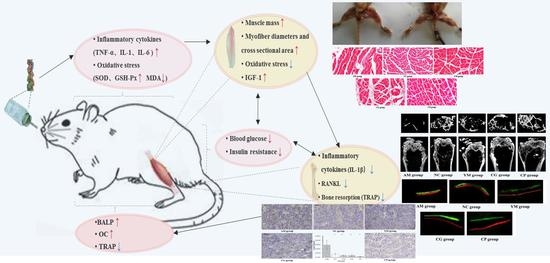
1. Introduction
2. Results
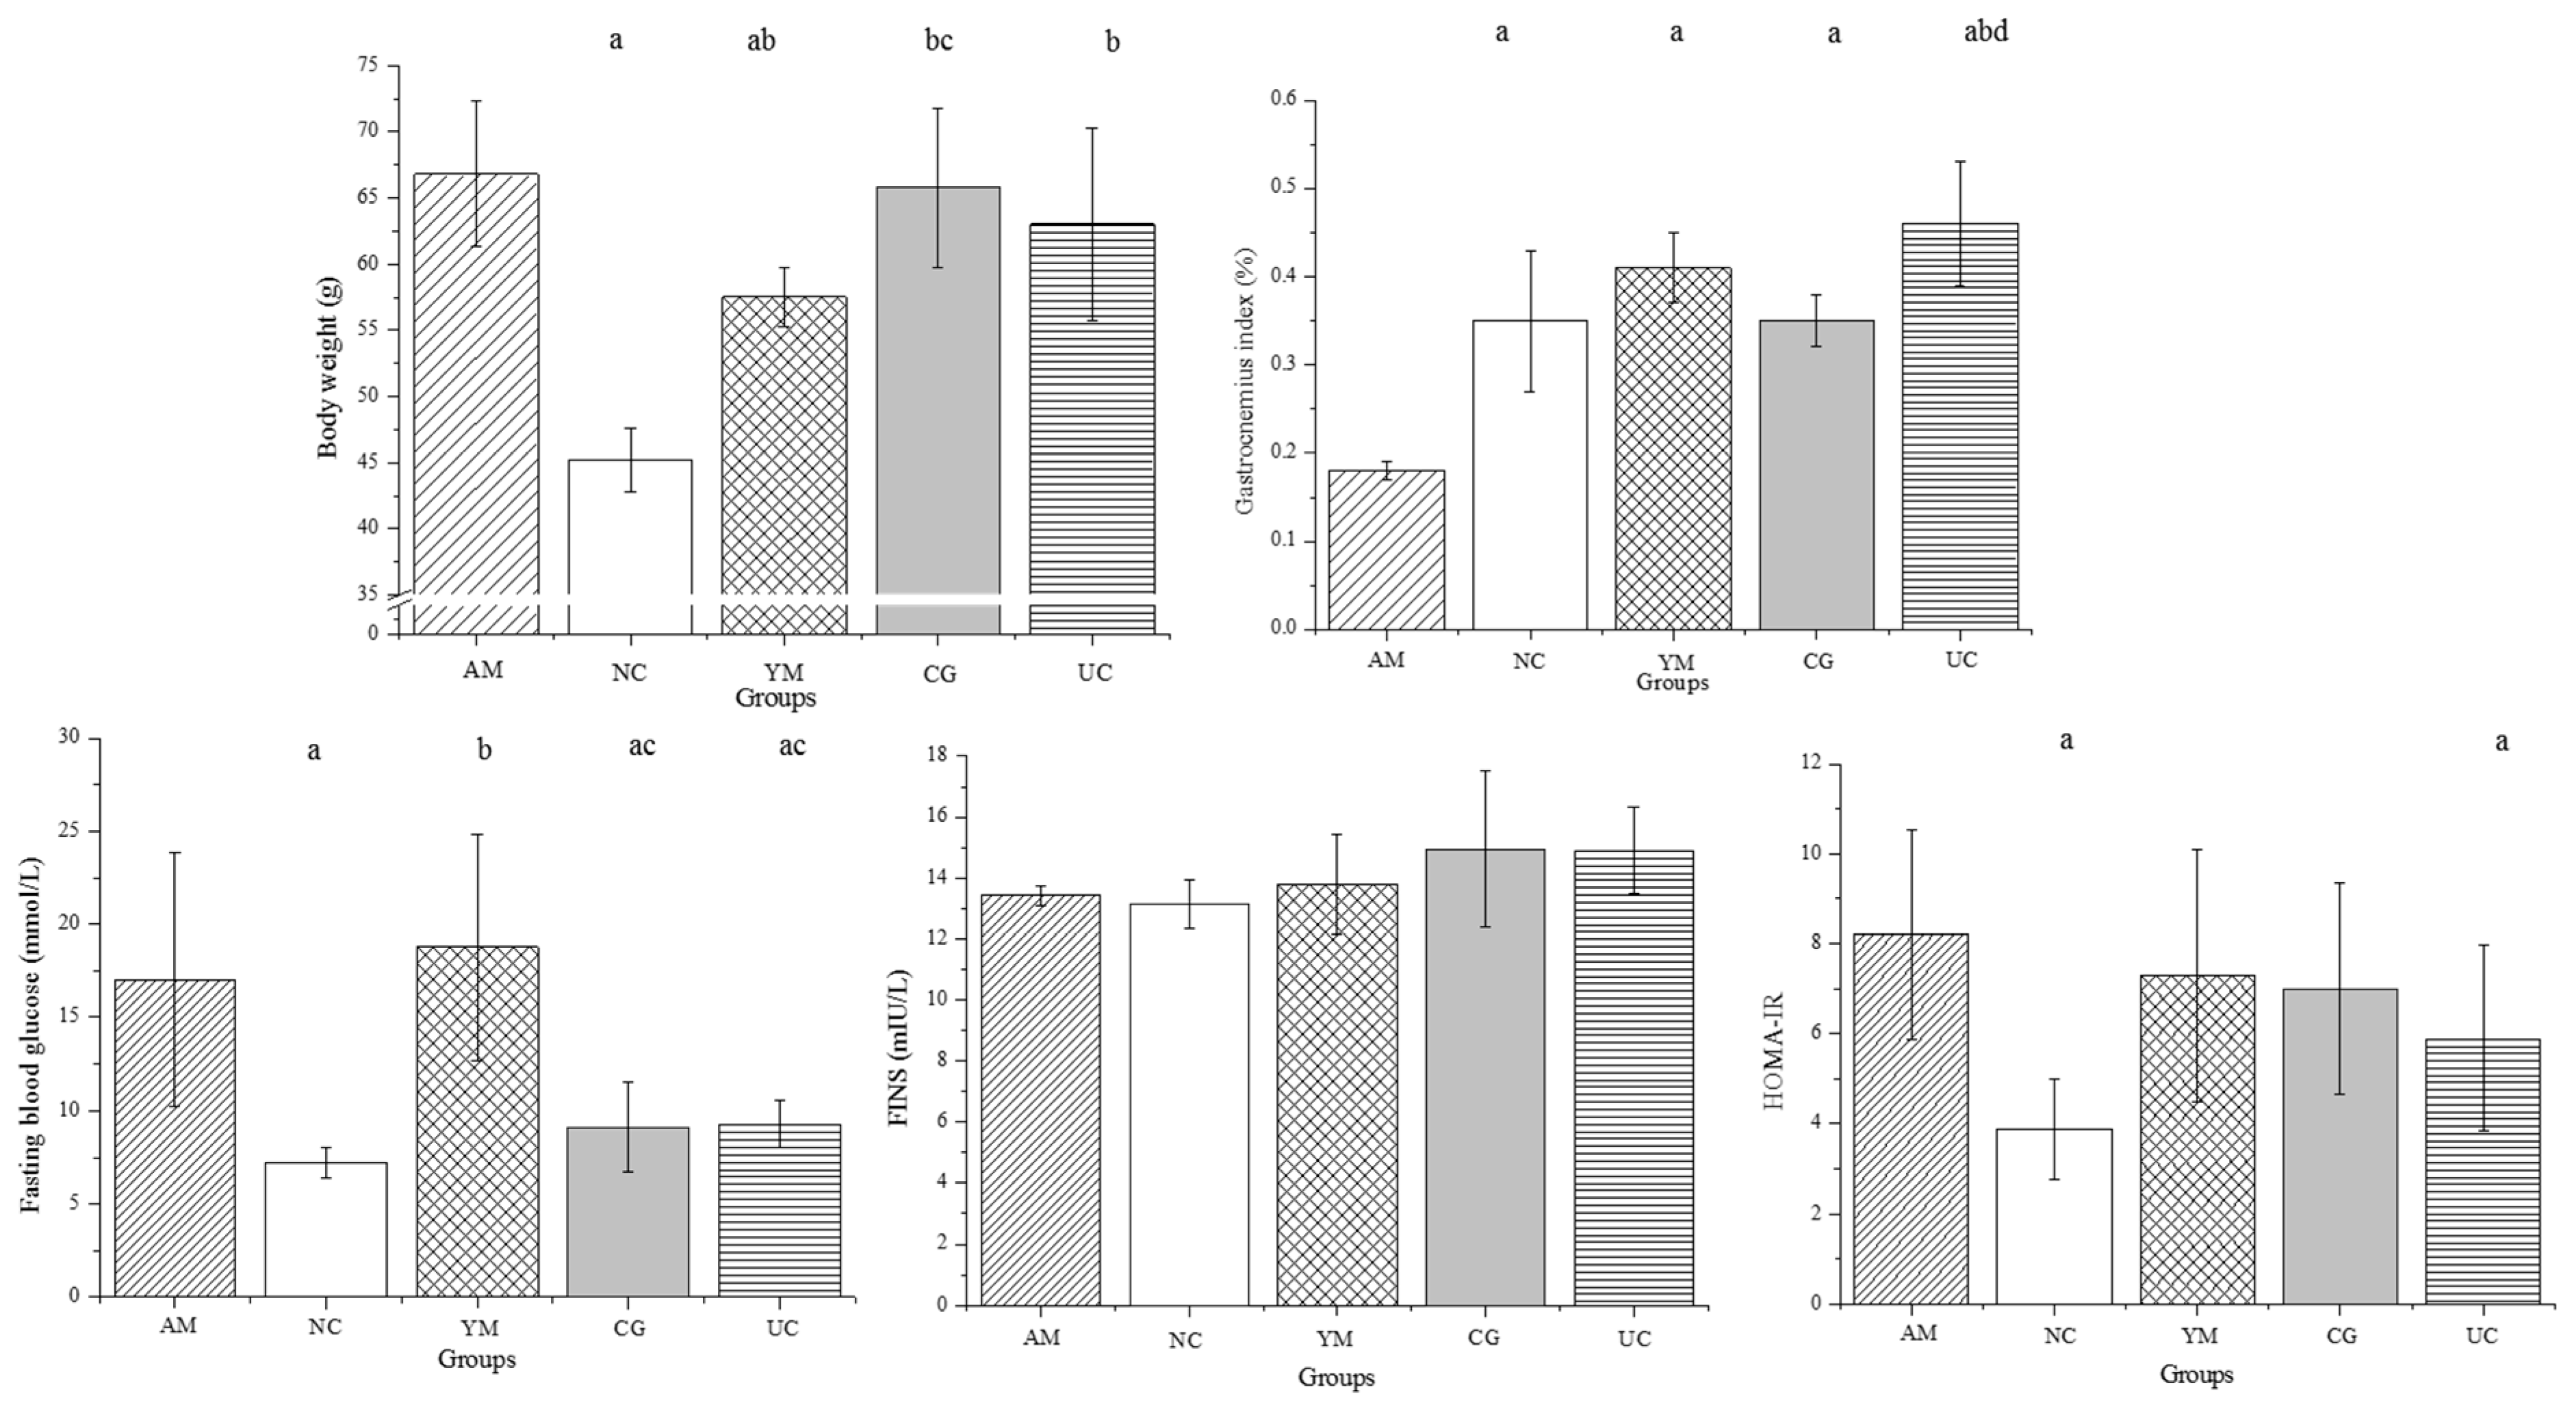
2.1. General Condition and Disease State
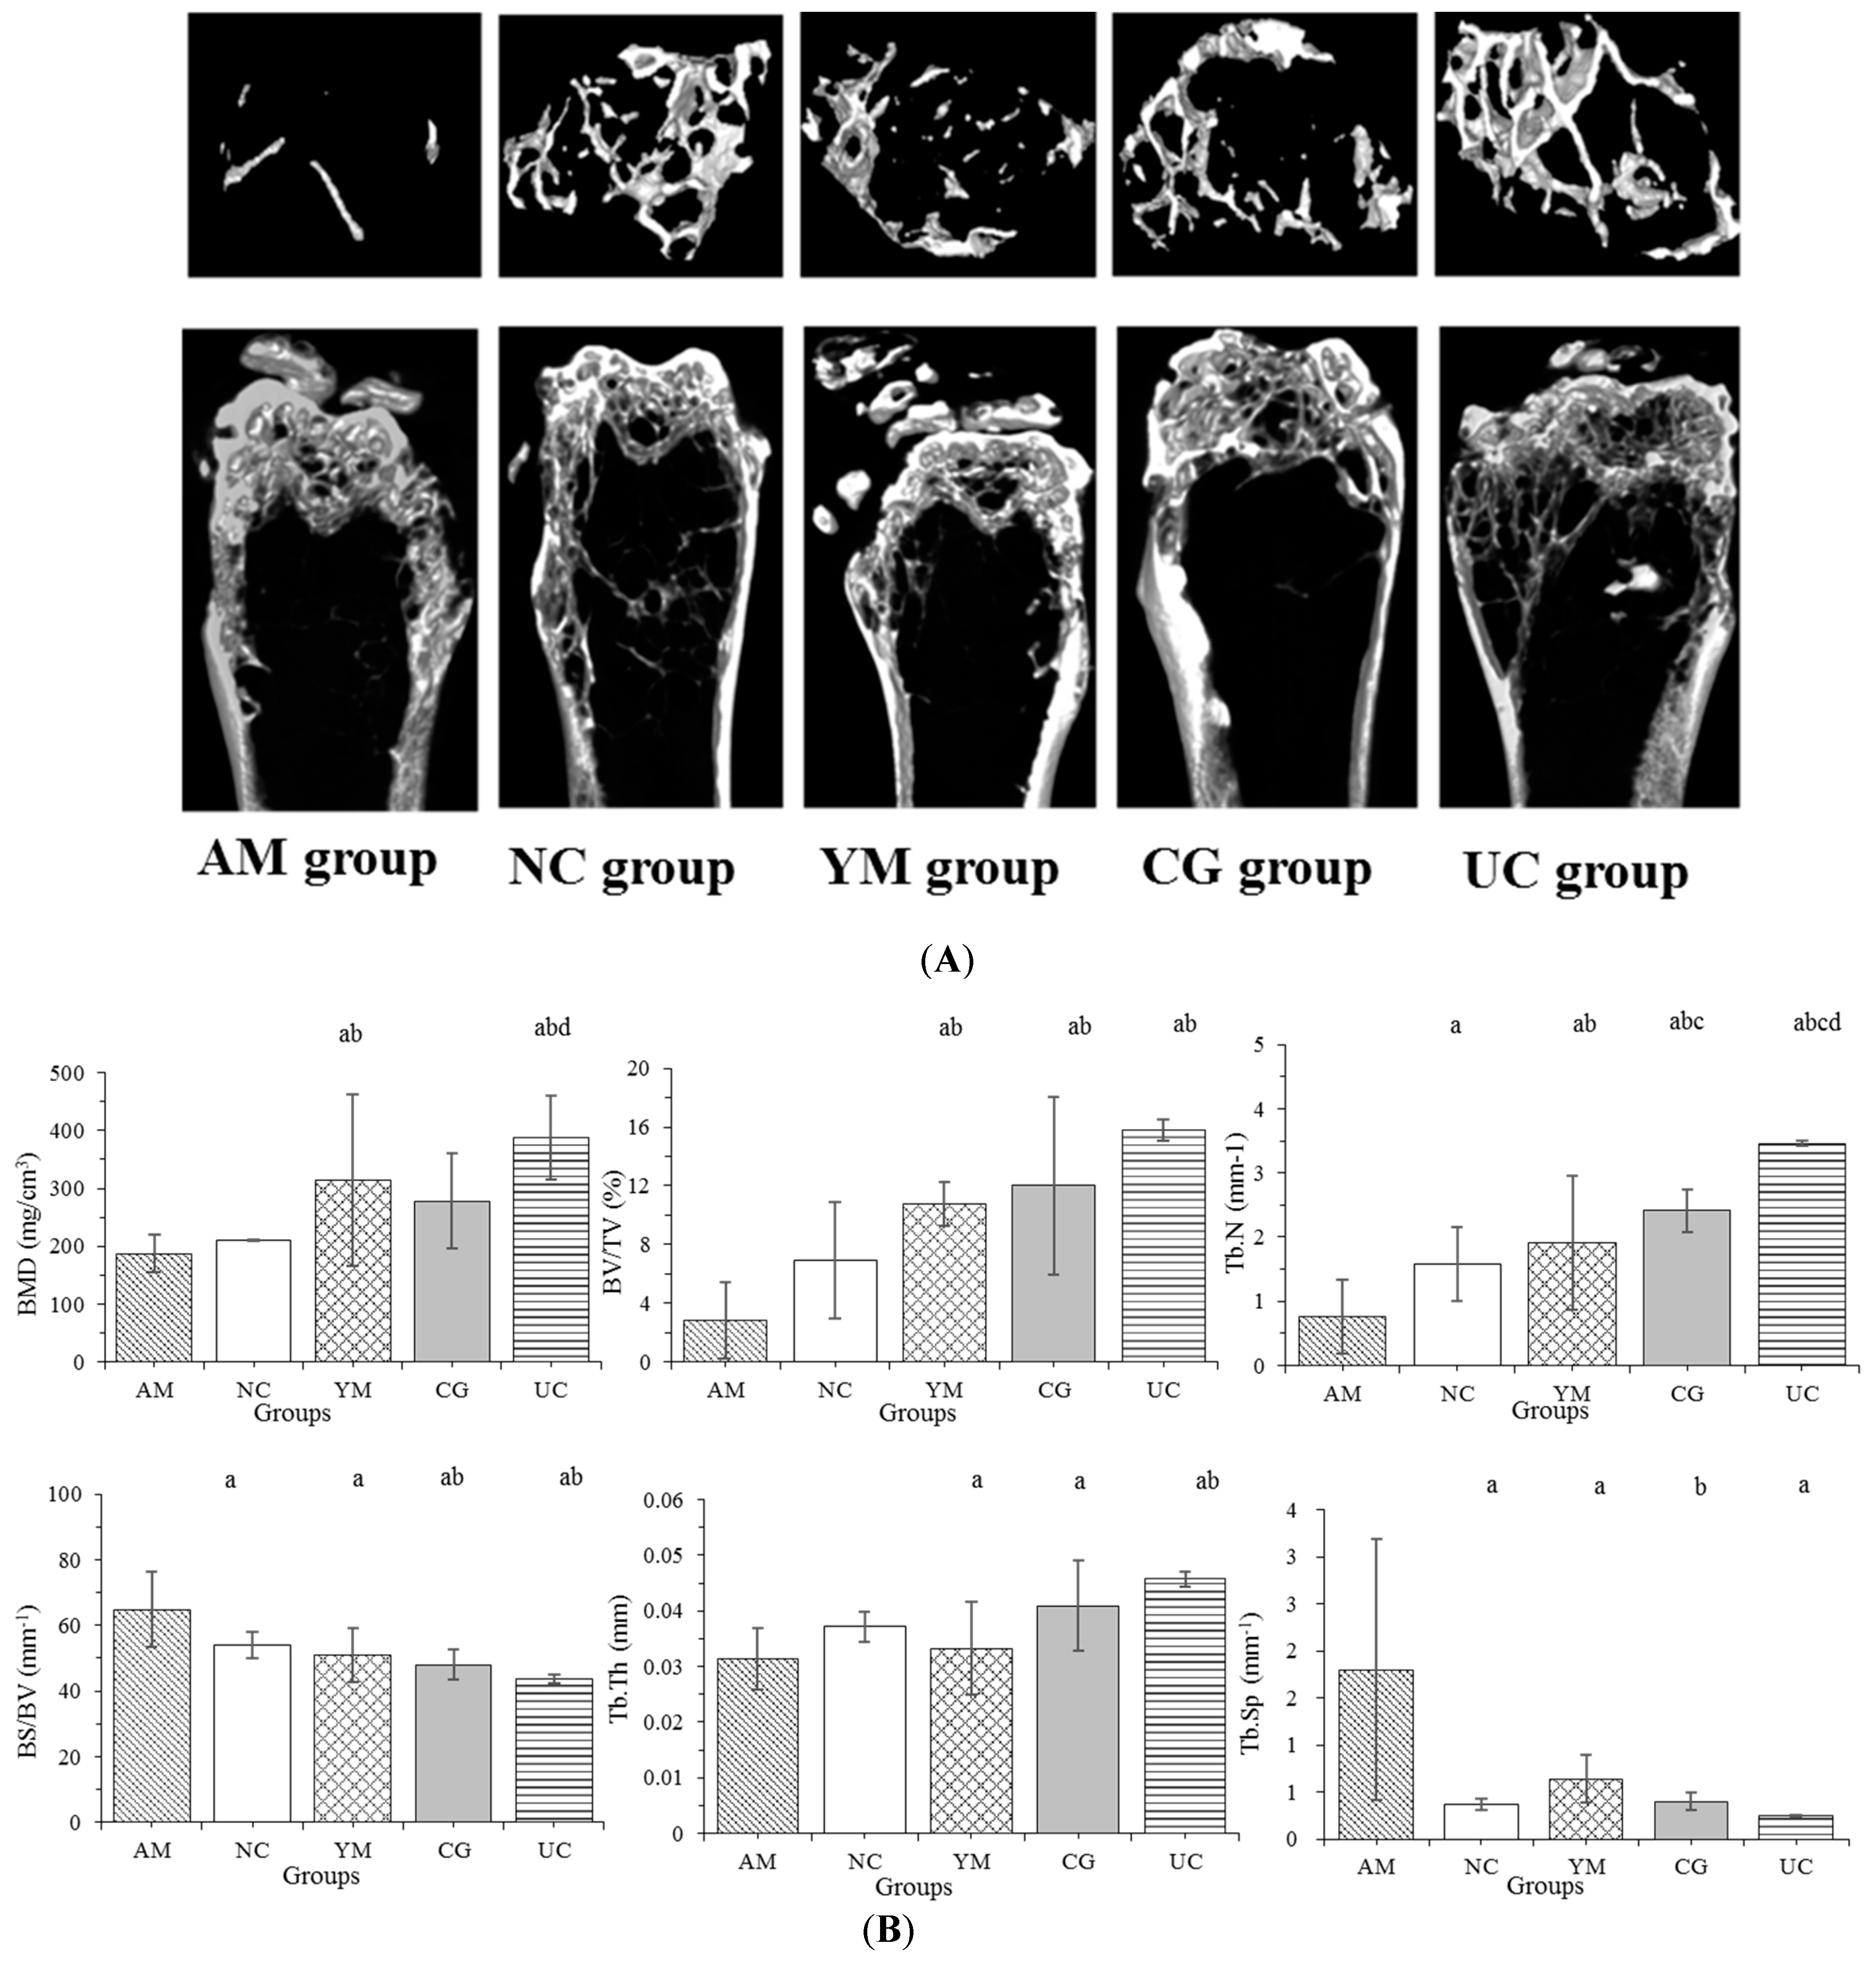
2.2. Micro-CT Femoral Analysis
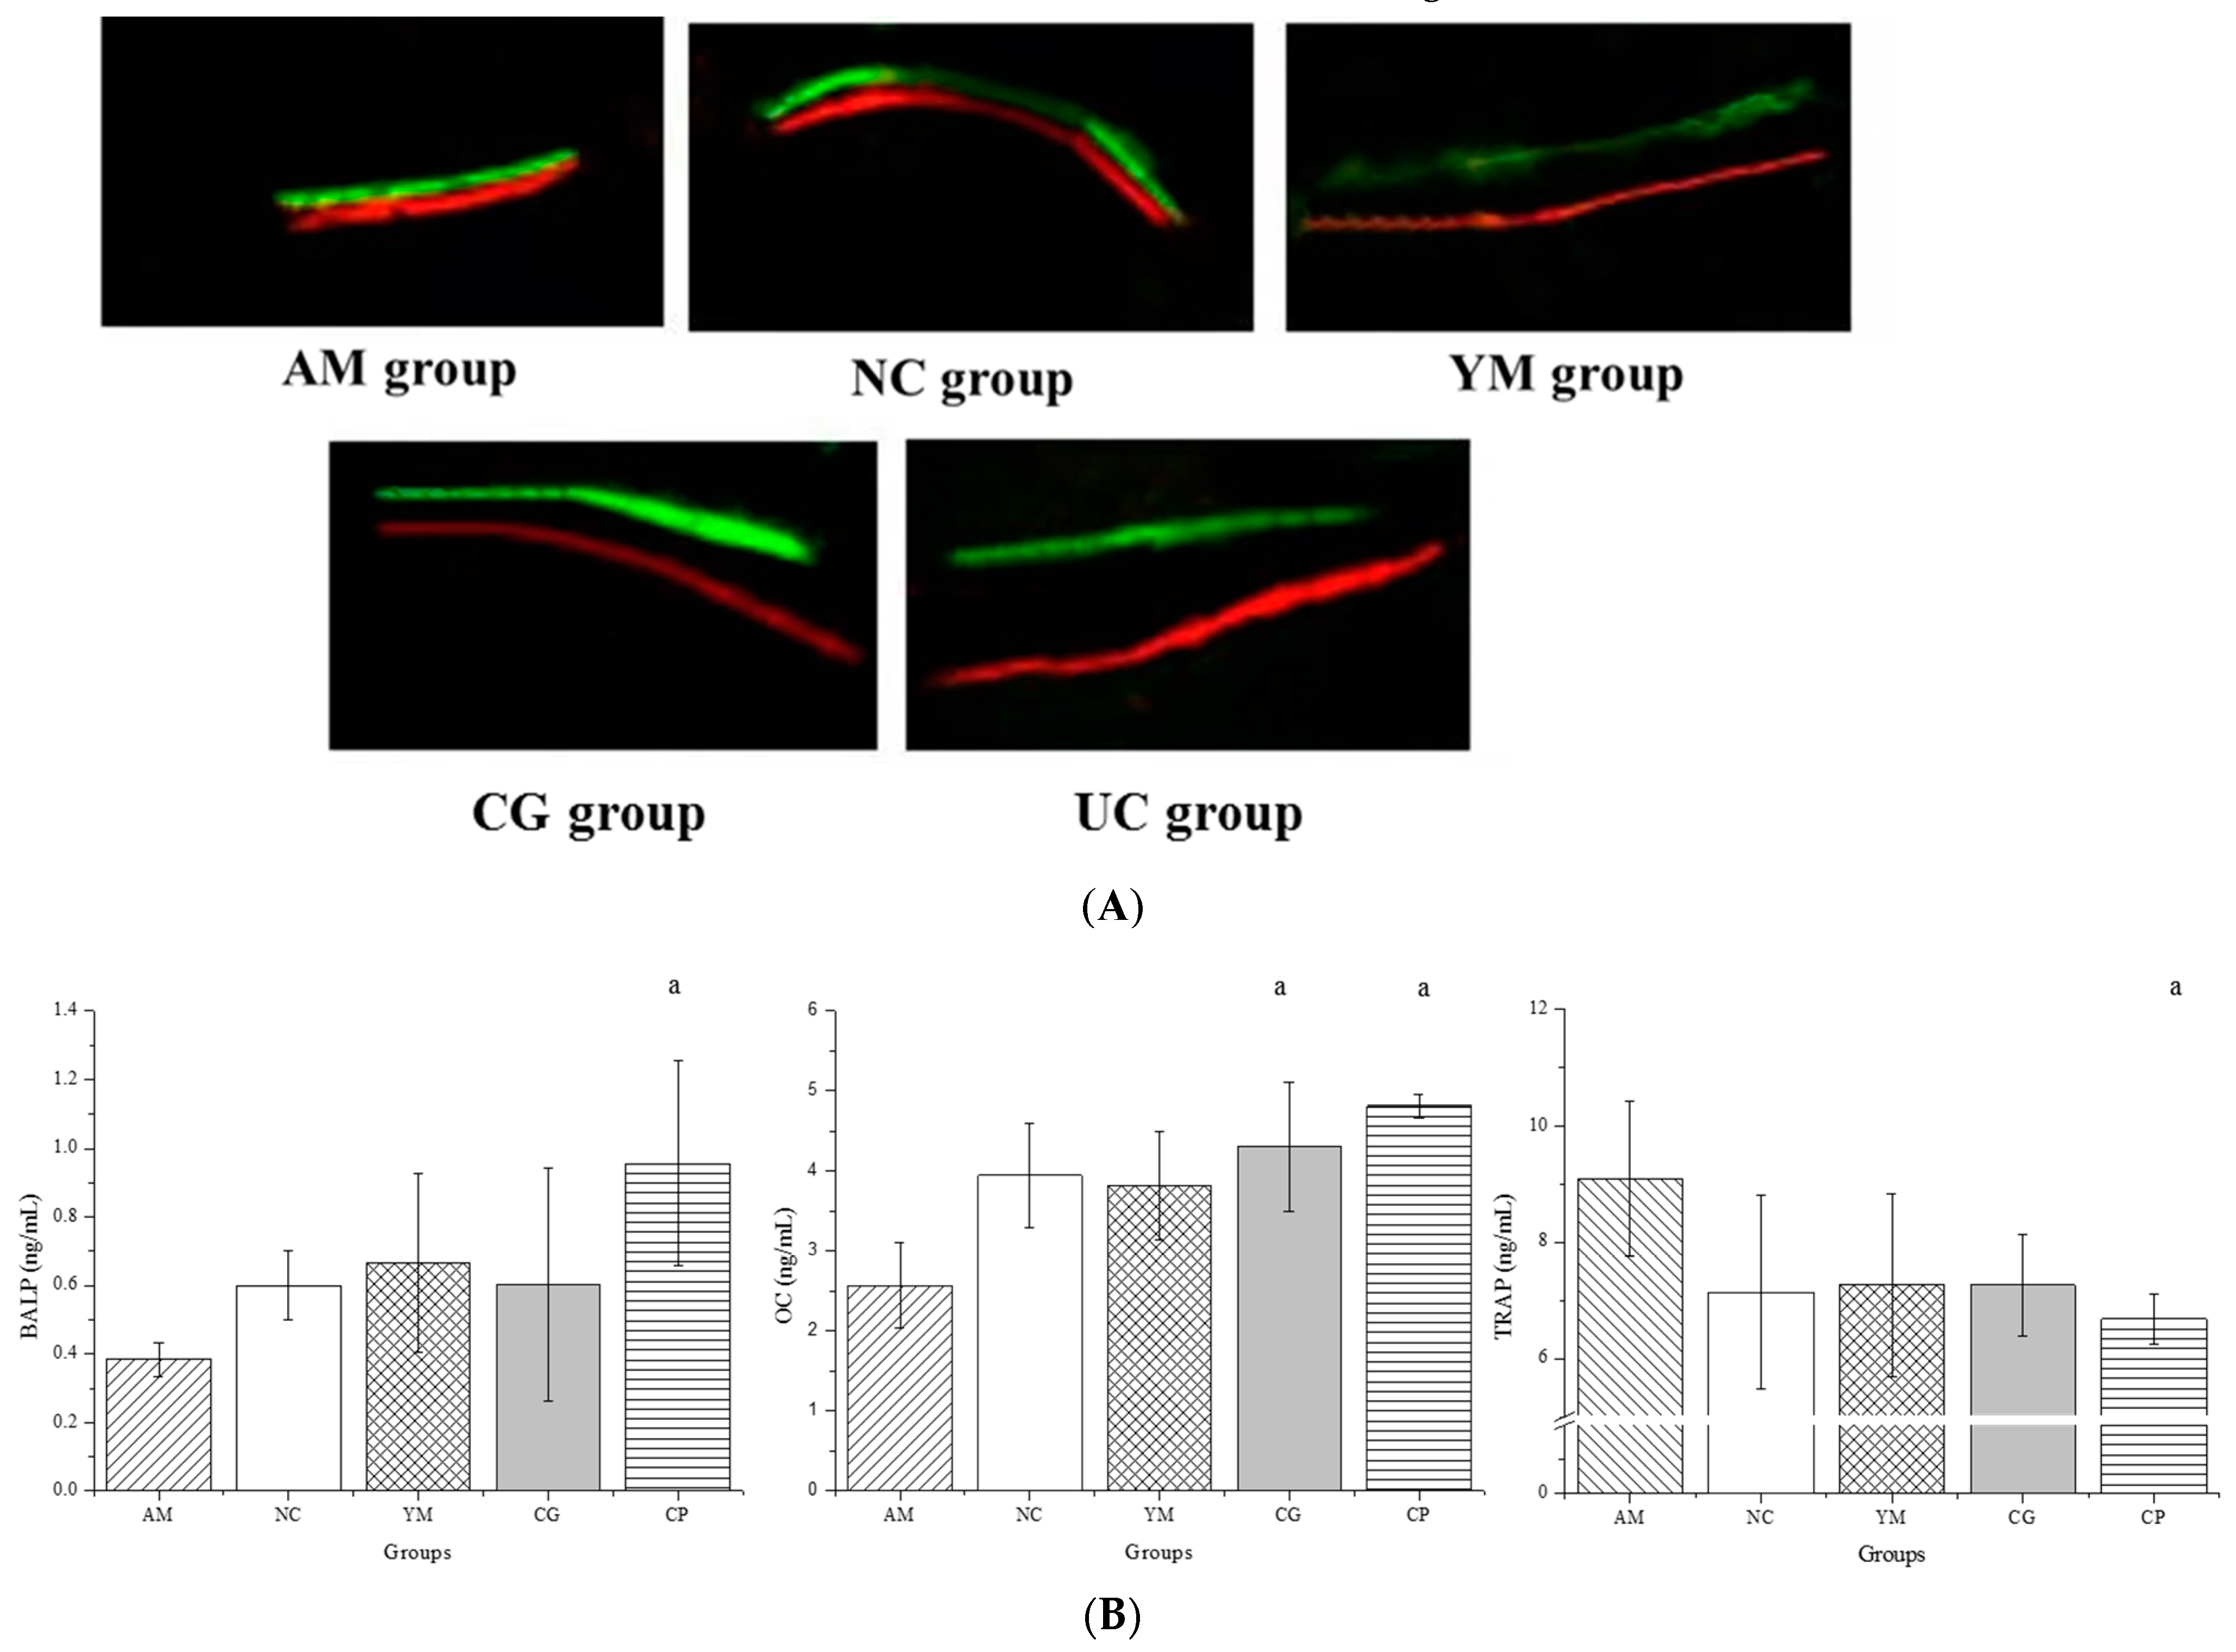
2.3. Dynamic Histomorphometric and Biochemical Markers of Bone Turnover Analysis
2.4. Bone Biomechanical Parameter Analysis
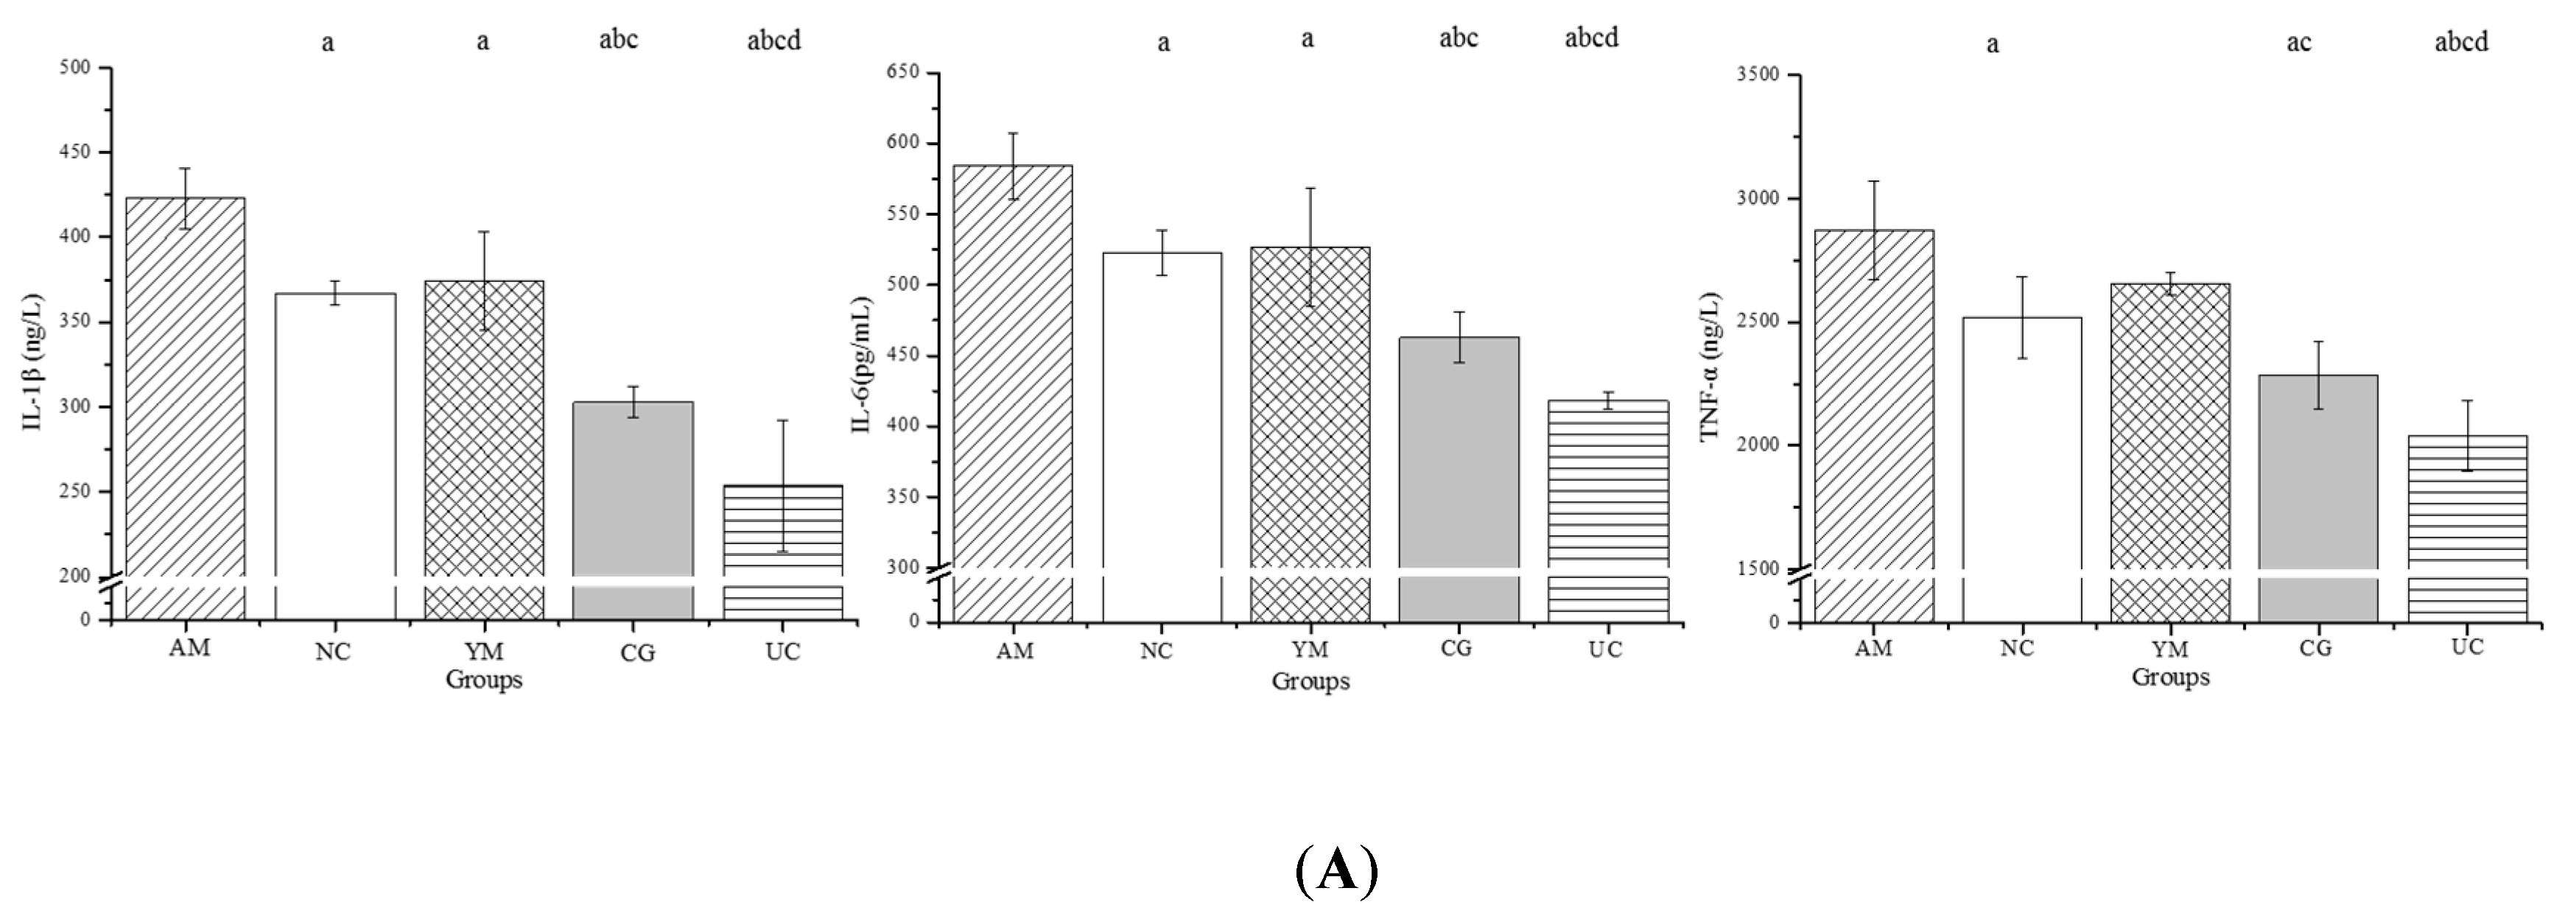
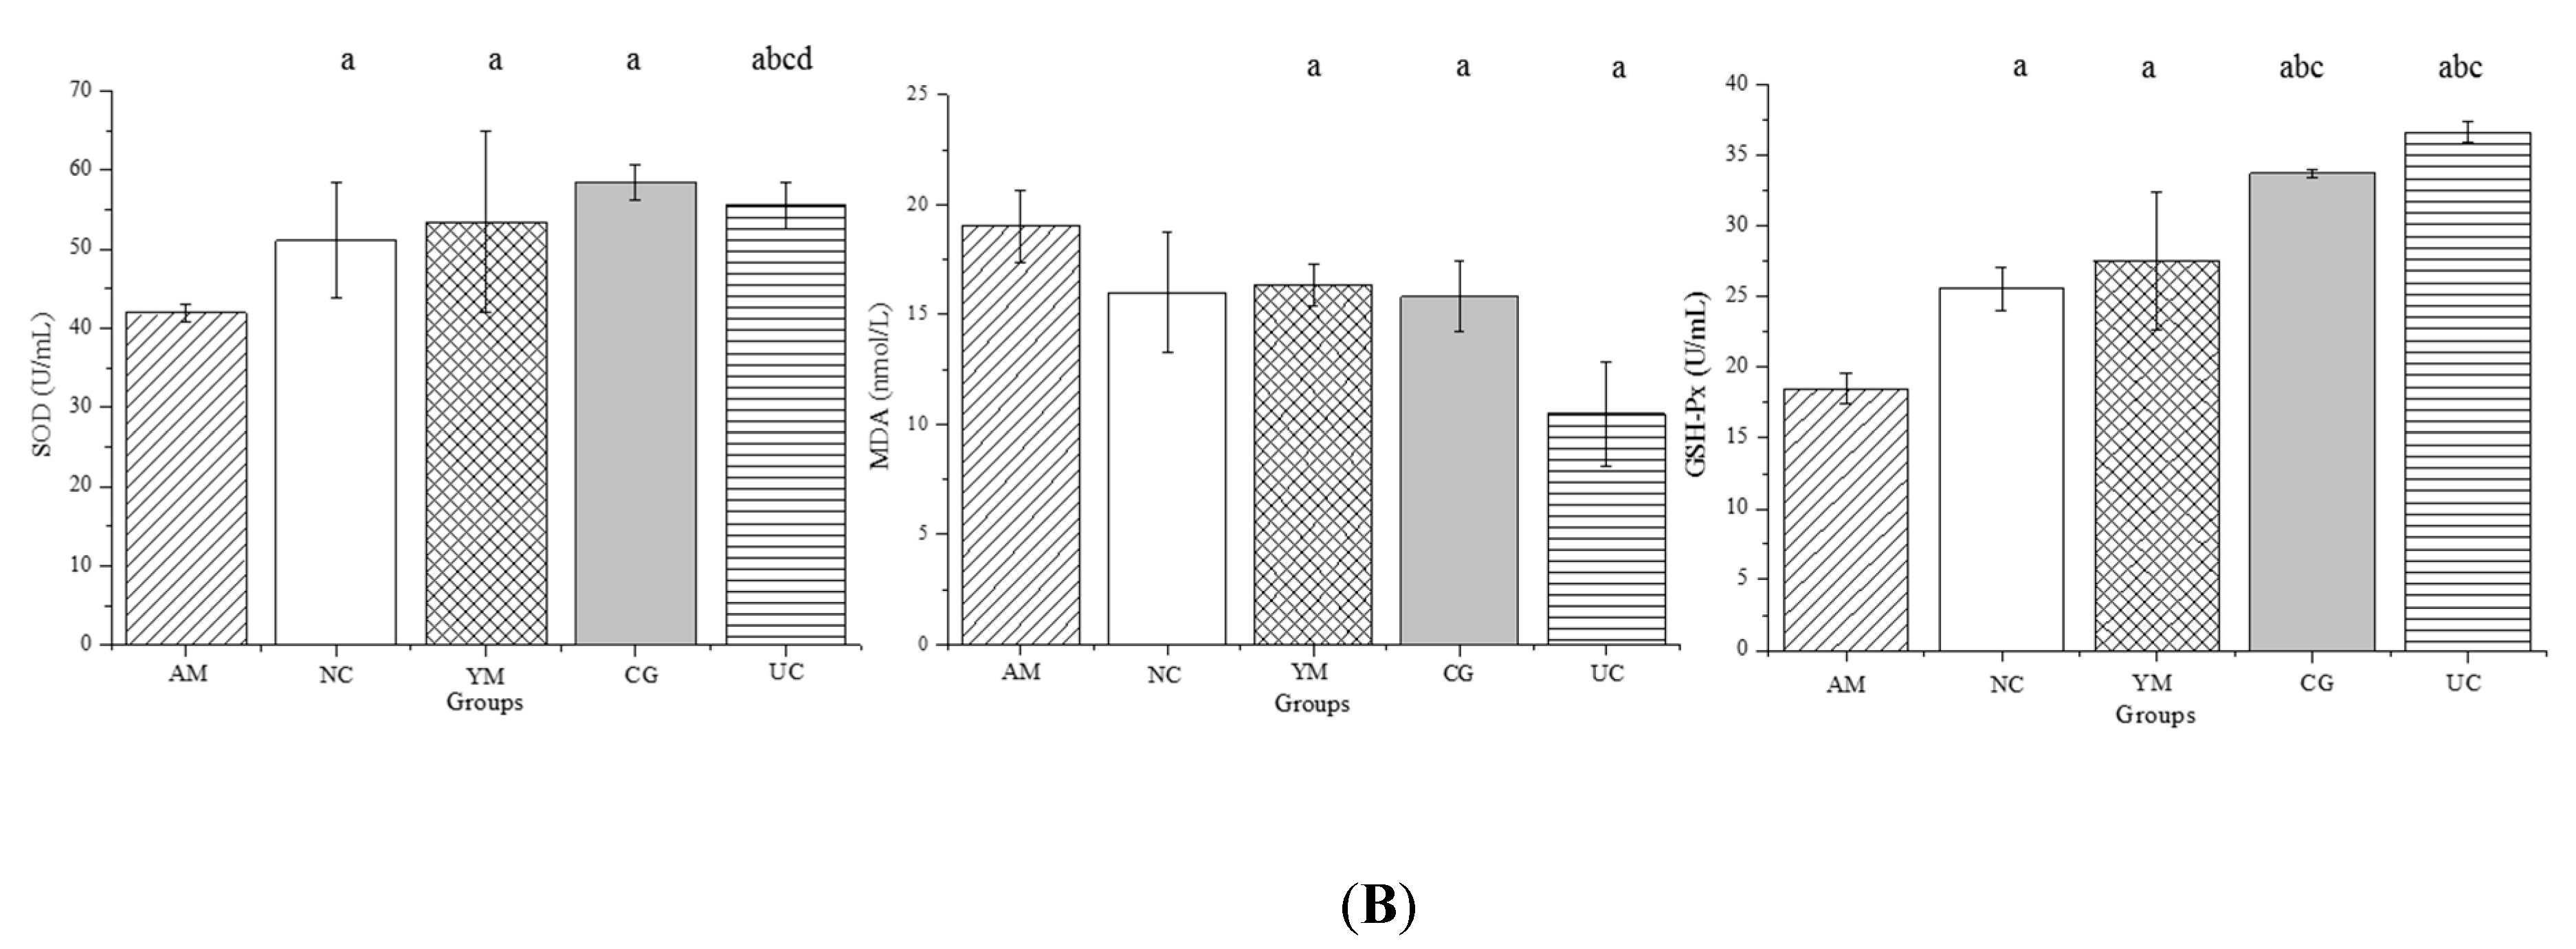
2.5. Inflammation and Oxidative Stress in the Serum
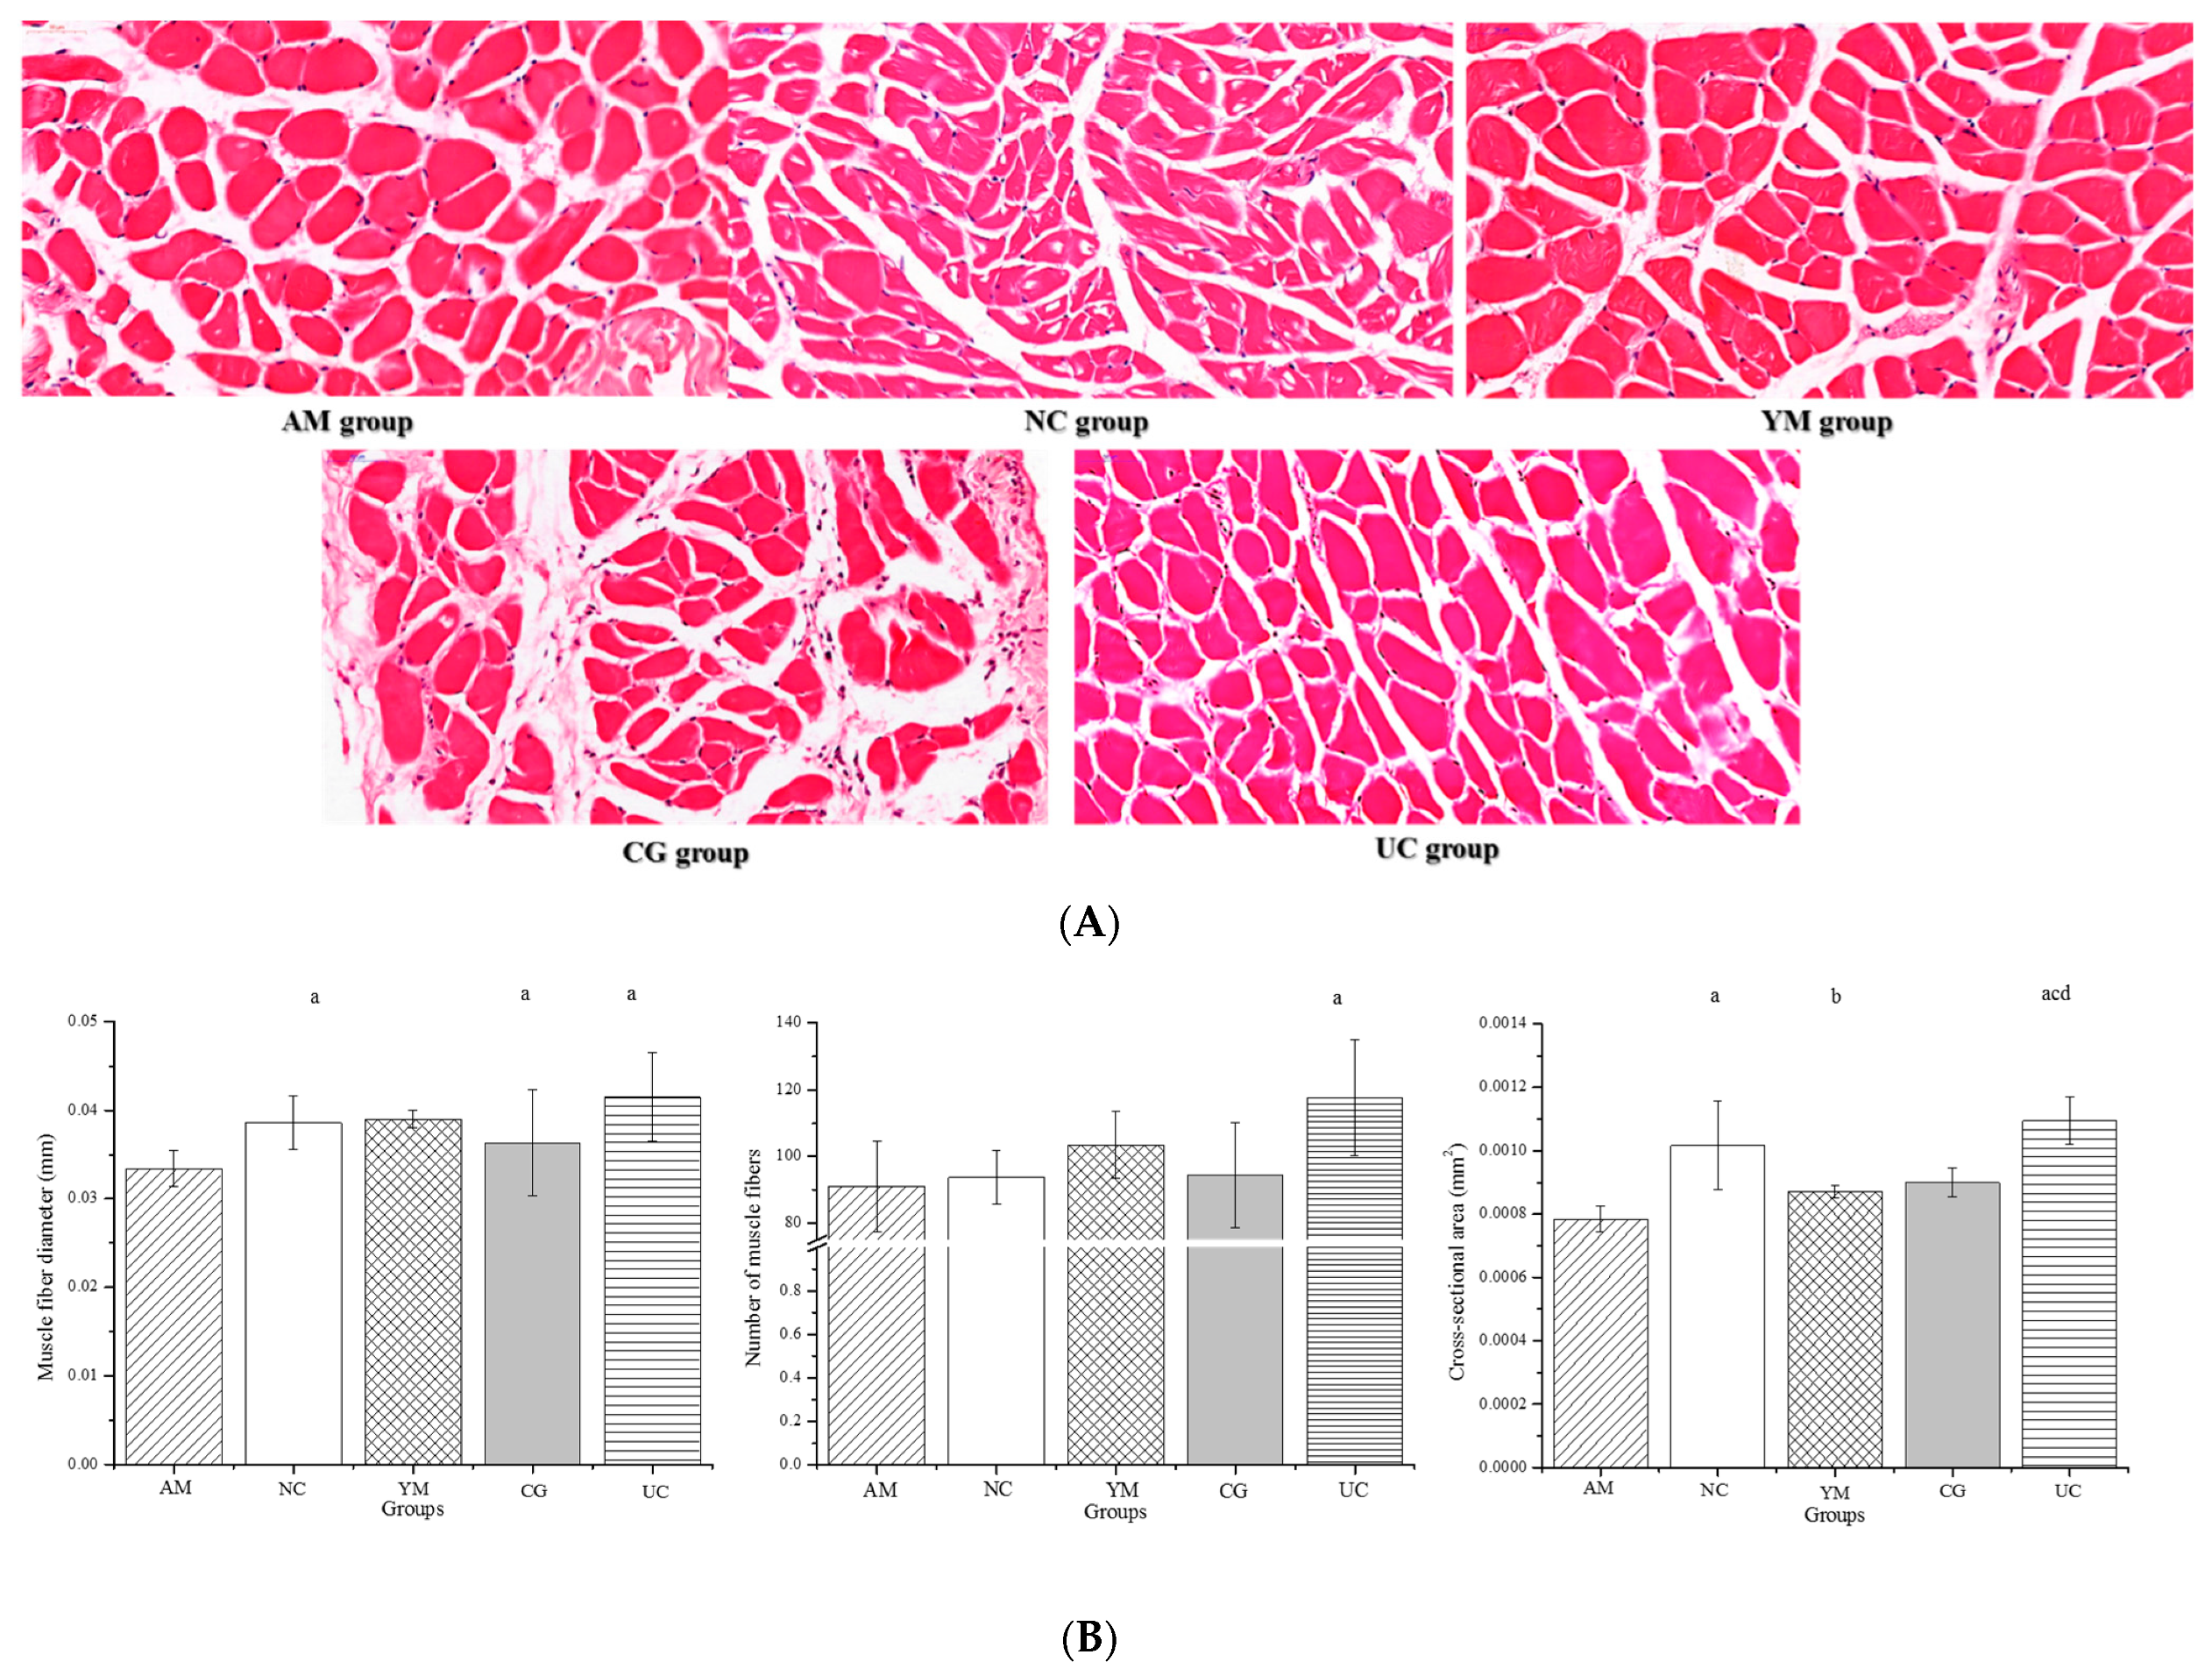
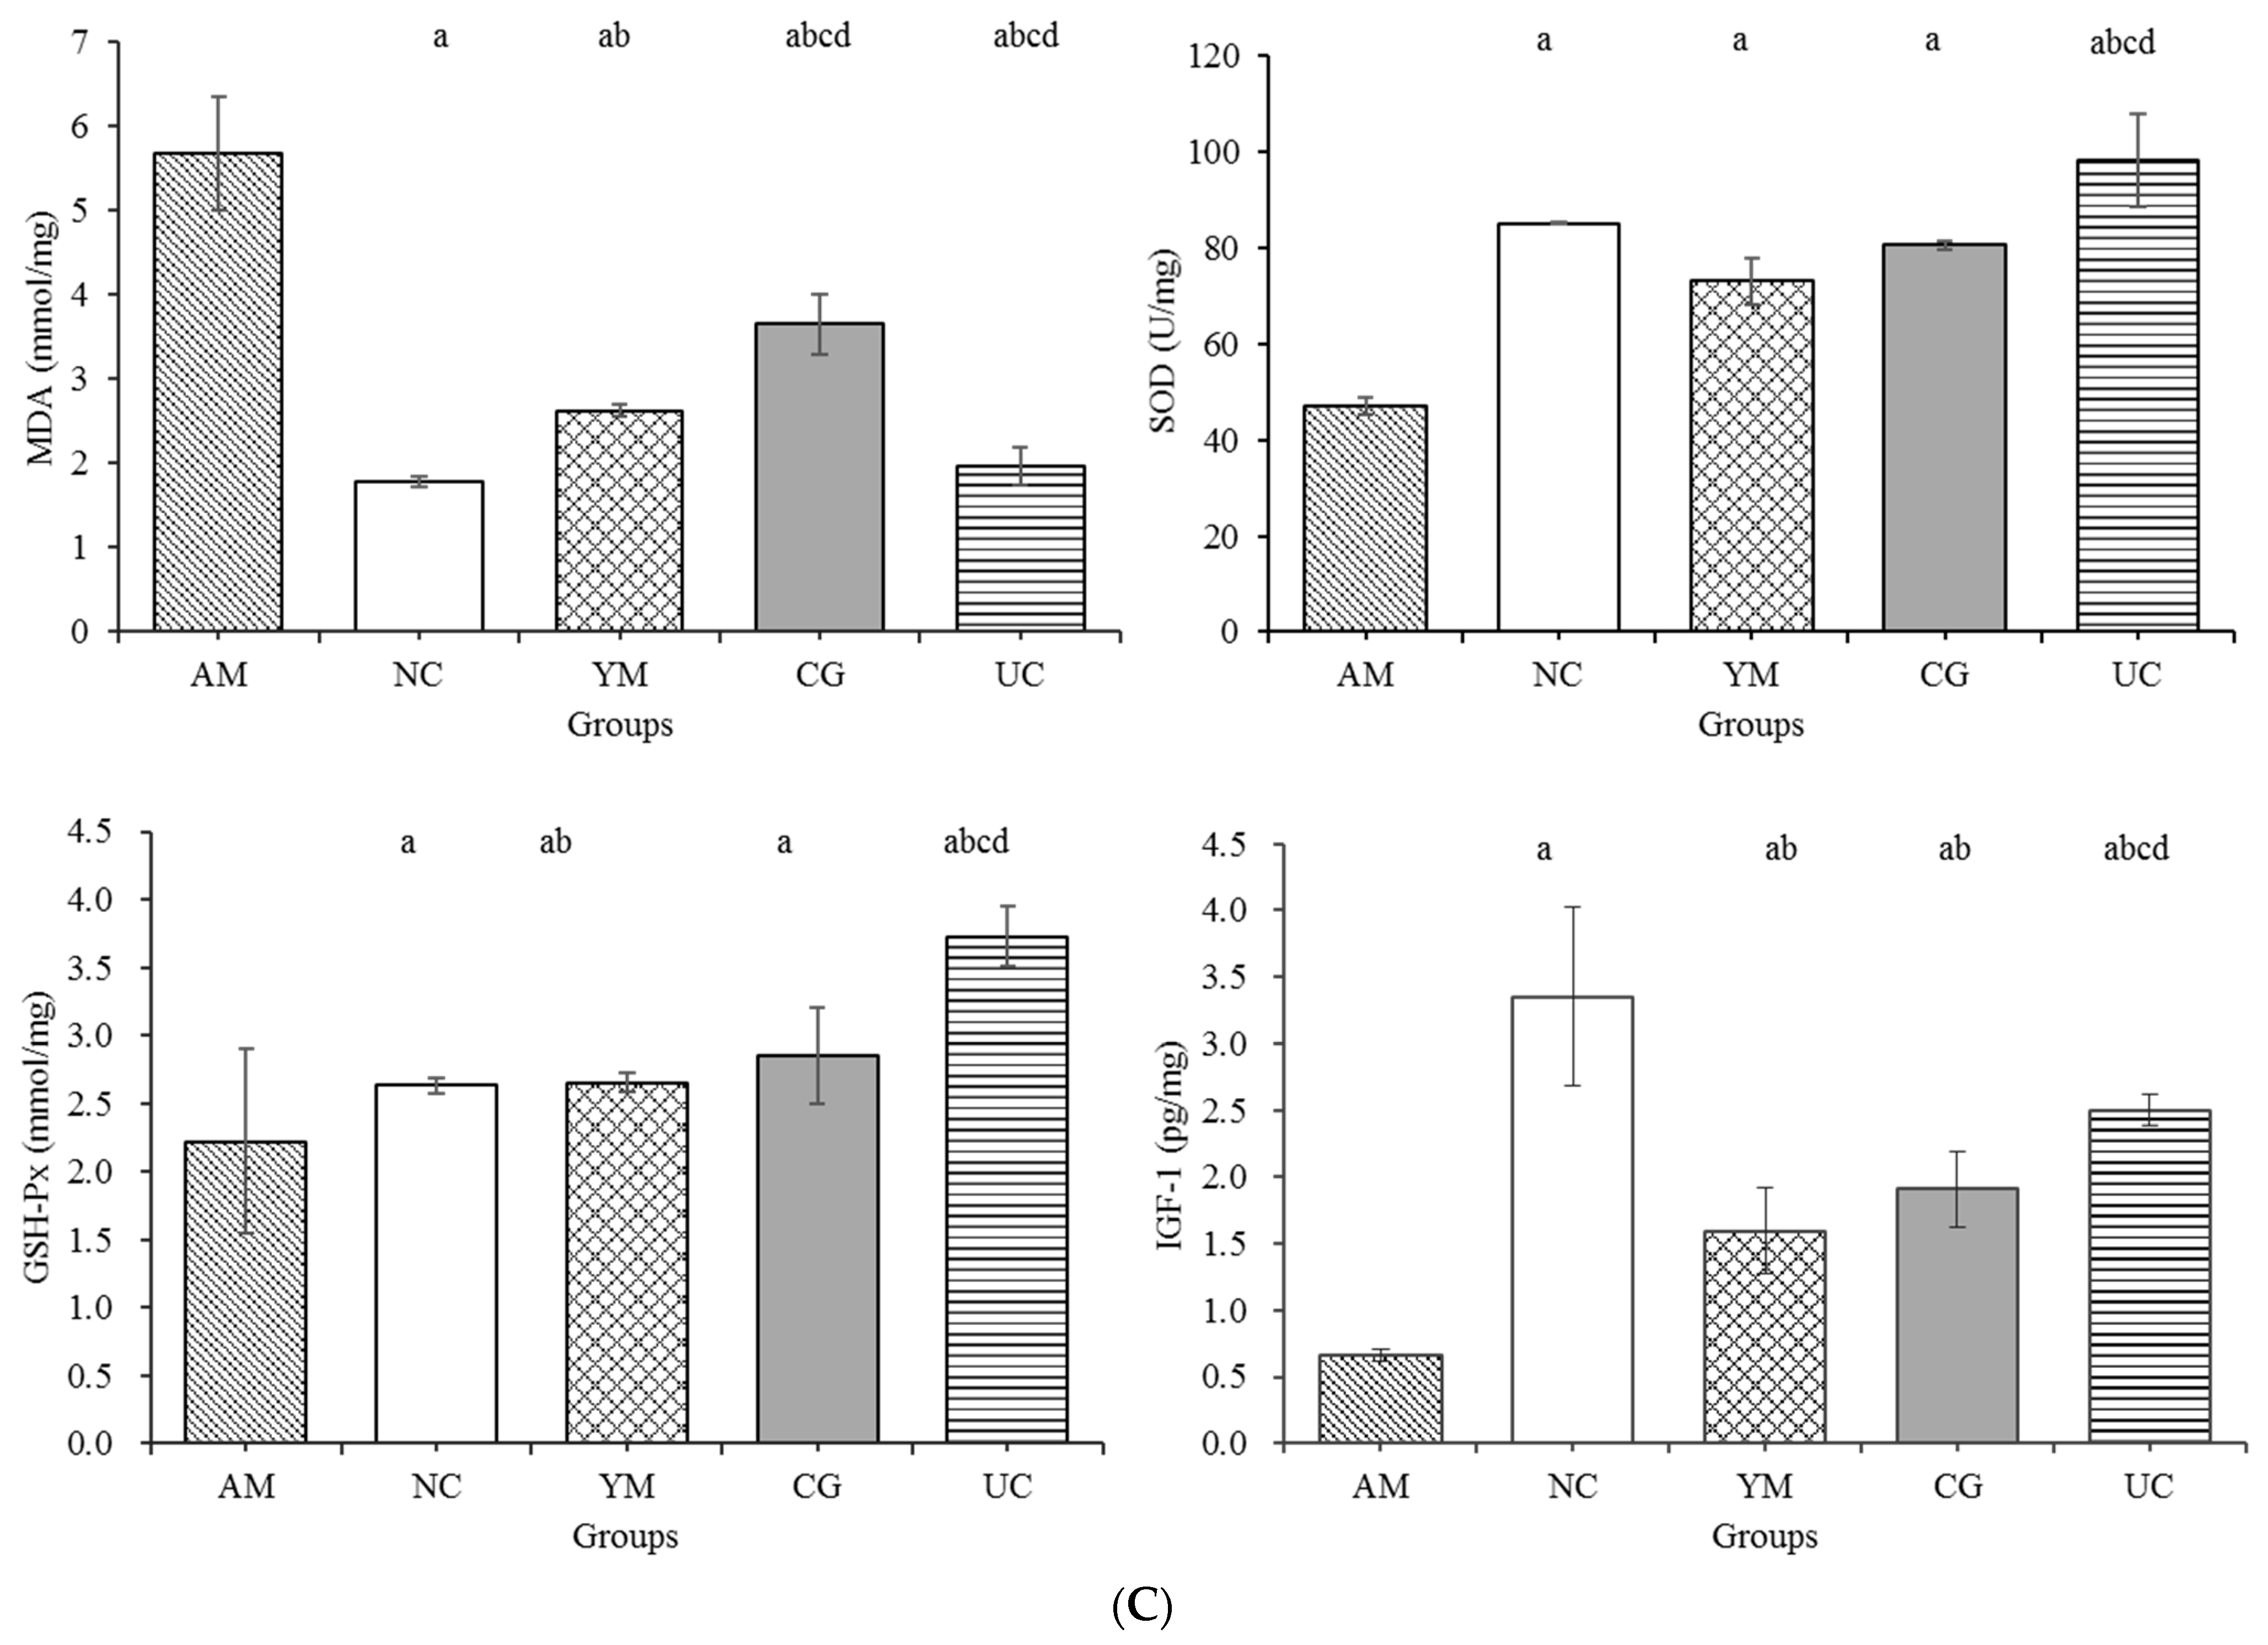
2.6. Histopathological Muscle Analysis and Its Biomarker
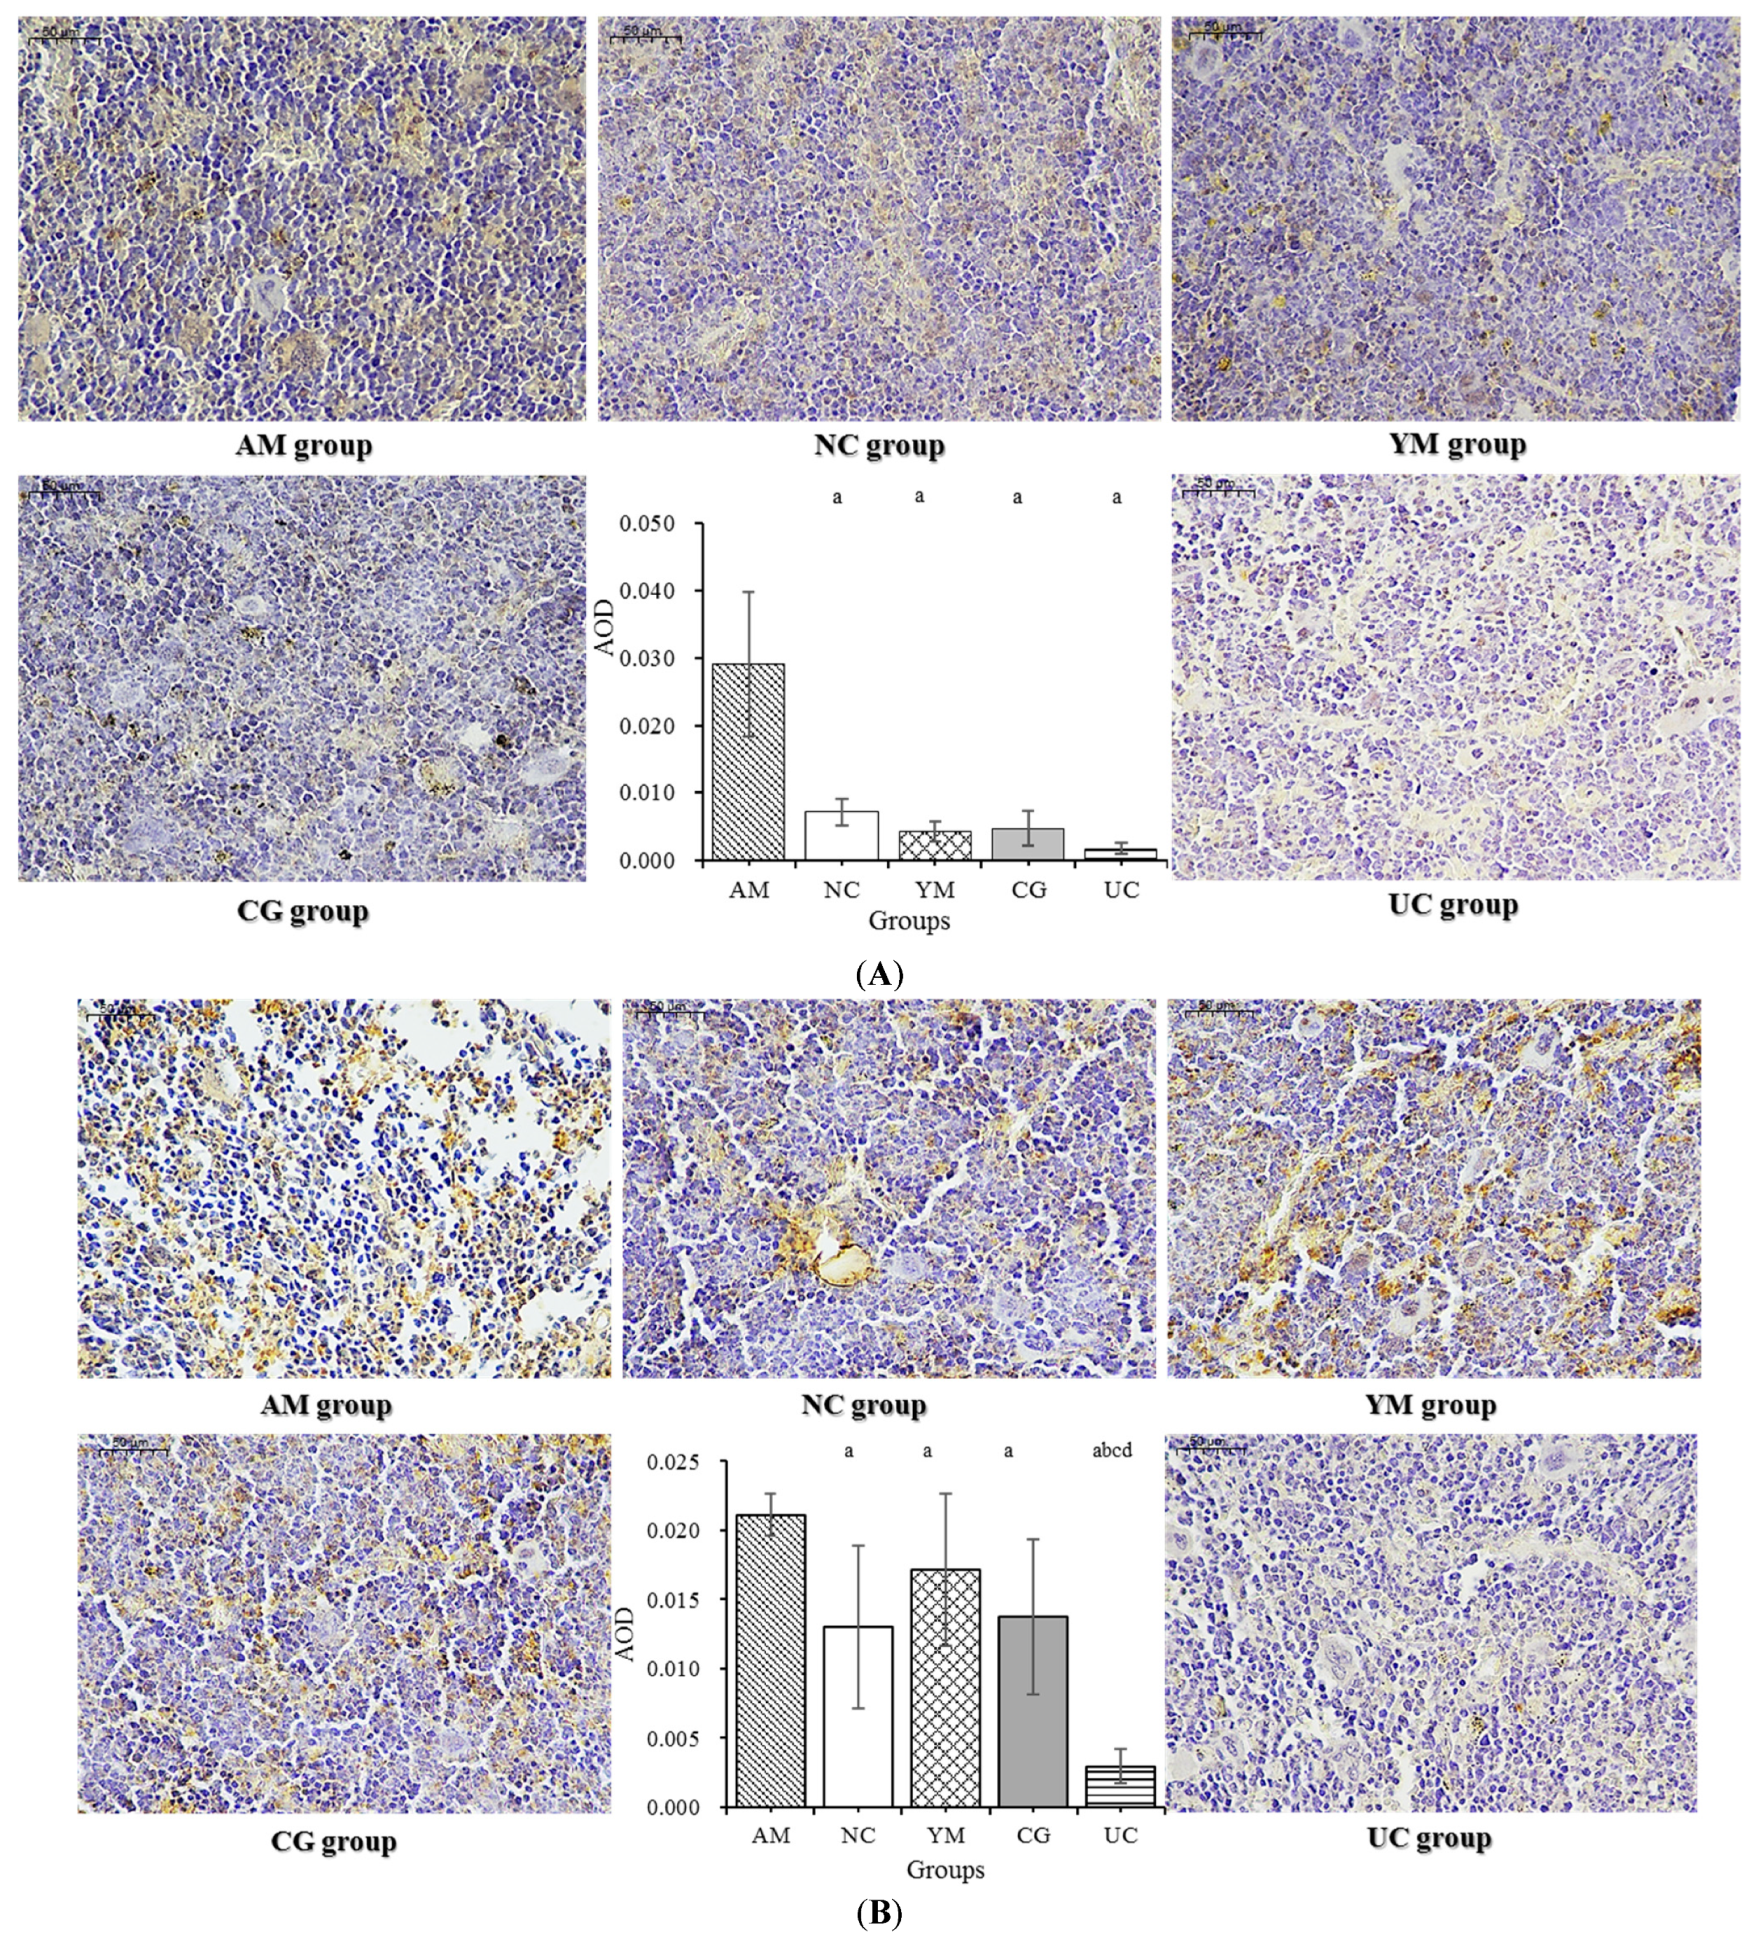
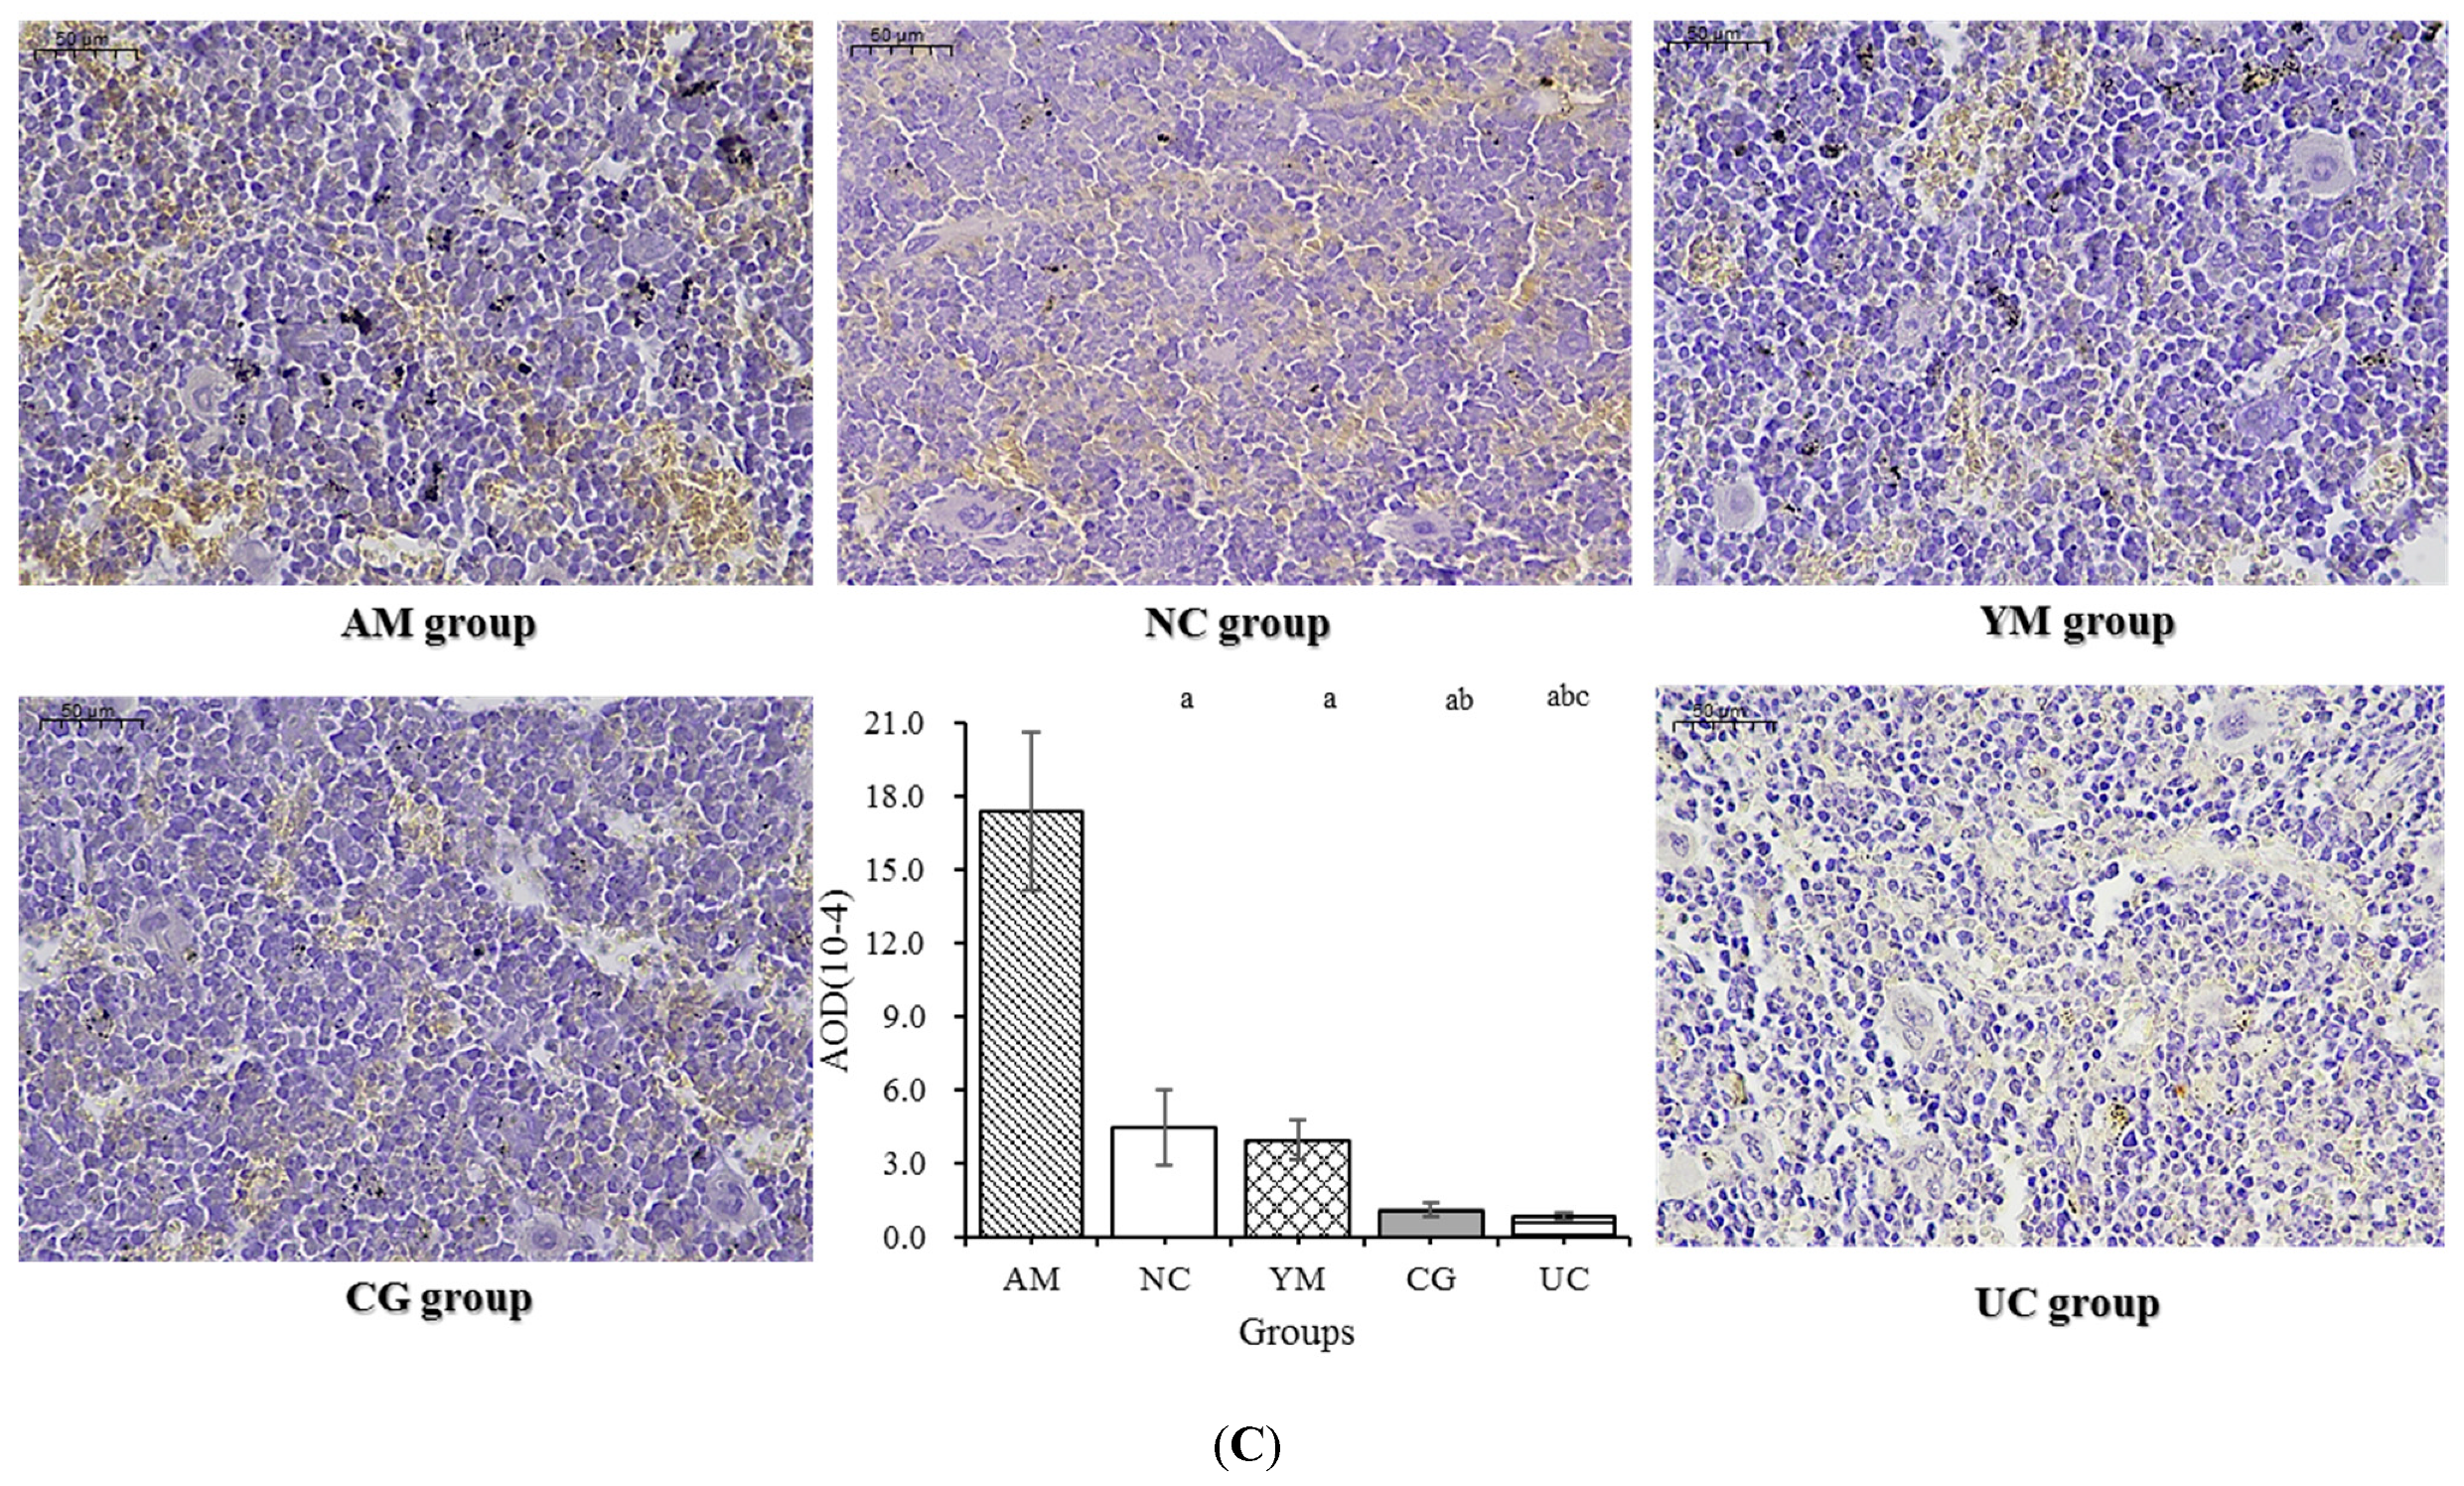
2.7. Immunohistochemical Analysis
3. Materials and Methods
3.1. Materials
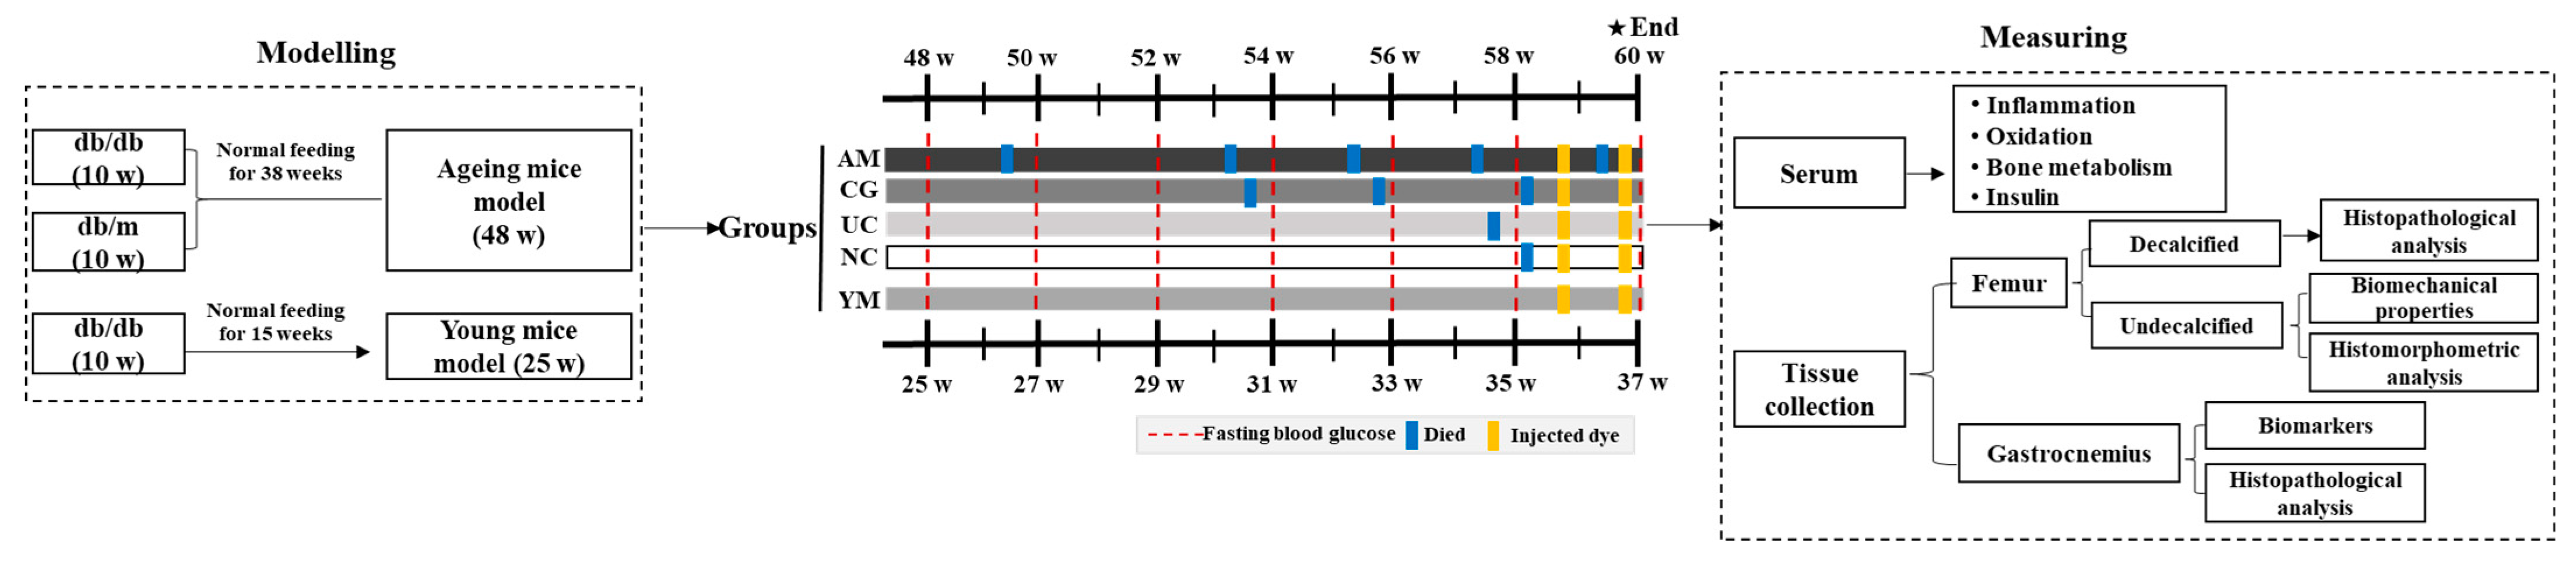
3.2. Animals and Experiment Design
3.2.1. Animal Feeding Conditions and Ageing db/db Mice Model Establishment
3.2.2. Study Design
3.3. Fasting Plasma Glucose and HOMA-IR Measurements
3.4. Micro-CT Analysis
3.5. Biomechanical Bone Parameters
3.6. Slicing of Undecalcified Bones and Dynamic Histomorphometric Analysis
3.7. Biochemical Marker Assay
3.8. Histopathological Analysis
3.9. Statistical Analysis
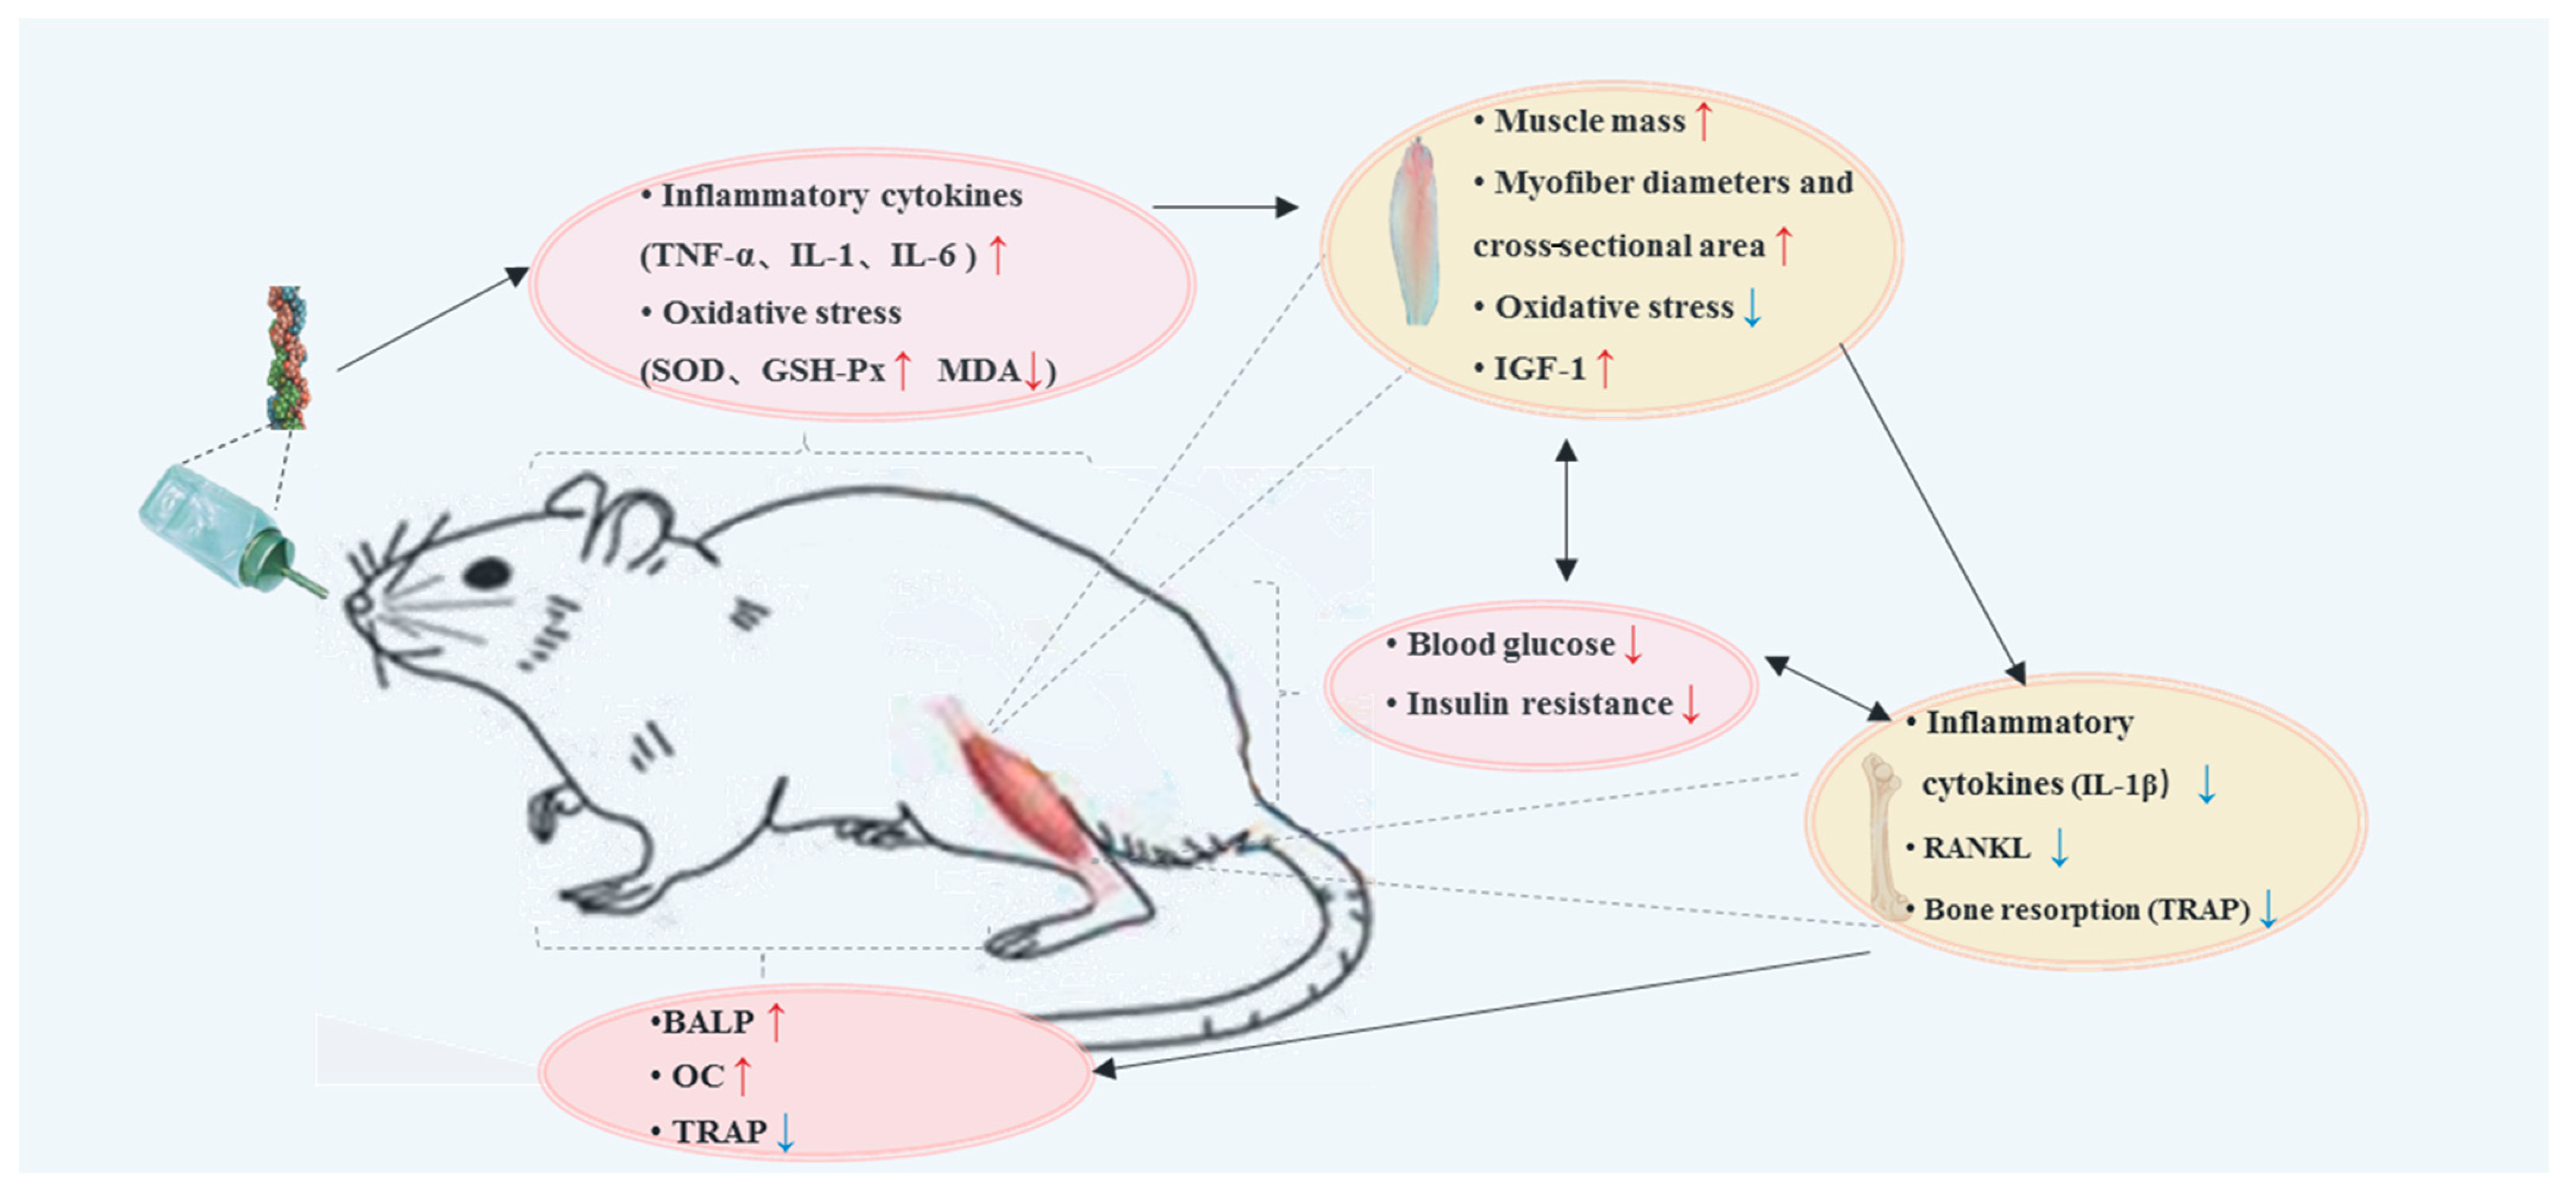
4. Discussion
5. Conclusions
Supplementary Materials
Author Contributions
Funding
Institutional Review Board Statement
Informed Consent Statement
Data Availability Statement
Conflicts of Interest
Sample Availability
References
- Mayfield, J.A.; White, R.D. Insulin therapy for type 2 diabetes: Rescue, augmentation, and replacement of beta-cell function. Am. Fam. Physician 2004, 70, 489–500. [Google Scholar] [PubMed]
- Karstoft, K.; Pedersen, B.K. Exercise and type 2 diabetes: Focus on metabolism and inflammation. Immunol. Cell Biol. 2016, 94, 146–150. [Google Scholar] [CrossRef]
- Ohuchi, K.; Miyakoshi, N.; Kasukawa, Y.; Segawa, T.; Kinoshita, H.; Shimada, Y. Evaluation of bone mineral density and bone strength in autochthonous transgenic model mice for diabetes mellitus (Akita mice). Osteoporos. Sarcopenia 2015, 2, 98–102. [Google Scholar] [CrossRef] [Green Version]
- Kim, K.S.; Park, K.S.; Kim, M.J.; Kim, S.K.; Cho, Y.W.; Park, S.W. Type 2 diabetes is associated with low muscle mass in older adults. Geriatr. Gerontol. Int. 2014, 14, 115–121. [Google Scholar] [CrossRef] [PubMed]
- Burghardt, A.J.; Issever, A.S.; Schwartz, A.V.; Davis, K.A.; Masharani, U.; Majumdar, S.; Link, T.M. High-resolution peripheral quantitative computed tomographic imaging of cortical and trabecular bone microarchitecture in patients with type 2 diabetes mellitus. J. Clin. Endocrinol. Metab. 2010, 95, 5045–5055. [Google Scholar] [CrossRef] [Green Version]
- Janghorbani, M.; Feskanich, D.; Willett, W.C.; Hu, F. Prospective study of diabetes and risk of hip fracture: The Nurses’ Health Study. Diabetes Care 2006, 29, 1573–1578. [Google Scholar] [CrossRef] [Green Version]
- Kanis, J.A.; Cooper, C.; Rizzoli, R.; Reginster, J.Y. European guidance for the diagnosis and management of osteoporosis in postmenopausal women. Osteoporos. Int. 2019, 30, 3–44. [Google Scholar] [CrossRef] [Green Version]
- Kasperk, C.; Georgescu, C.; Nawroth, P. Diabetes Mellitus and Bone Metabolism. Exp. Clin. Endocrinol. Diabetes 2017, 125, 213–217. [Google Scholar] [CrossRef]
- Karsenty, G.; Ferron, M. The contribution of bone towhole-organism physiology. Nature 2012, 481, 314–320. [Google Scholar] [CrossRef]
- Shao, J.; Wang, Z.; Yang, T.; Ying, H.; Zhang, Y.; Liu, S. Bone regulates glucose metabolism as an endocrine organ through osteocalcin. Int. J. Endocrinol. 2015, 967, 673. [Google Scholar] [CrossRef] [PubMed] [Green Version]
- Palermo, A.; D’Onofrio, L.; Buzzetti, R.; Manfrini, S.; Napoli, N. Pathophysiology of Bone Fragility in Patients with Diabetes. Calcif. Tissue Int. 2017, 100, 122–132. [Google Scholar] [CrossRef]
- Saito, M.; Fujii, K.; Mori, Y.; Marumo, K. Role of collagen enzymatic and glycation induced cross-links as a determinant of bone quality in spontaneously diabetic WBN/Kob rats. Osteoporos. Int. 2006, 17, 1514–1523. [Google Scholar] [CrossRef]
- García-Hernández, A.; Arzate, H.; Gil-Chavarría, I.; Rojo, R.; Moreno-Fierros, L. High glucose concentrations alter the biomineralization process in human osteoblastic cells. Bone 2012, 50, 276–288. [Google Scholar] [CrossRef]
- Mercer, N.; Ahmed, H.; Etcheverry, S.B.; Vasta, G.R.; Cortizo, A.M. Regulation of advanced glycation endproduct (AGE) receptors and apoptosis by AGEs in osteoblast-like cells. Mol. Cell. Biochem. 2007, 306, 87–94. [Google Scholar] [CrossRef]
- Fulzele, K.; DiGirolamo, D.J.; Liu, Z.; Xu, J.; Messina, J.L.; Clemens, T.L. Disruption of the insulin-like growth factor type 1 receptor in osteoblasts enhances insulin signaling and action. J. Biol. Chem. 2007, 282, 25649–25658. [Google Scholar] [CrossRef] [Green Version]
- Botolin, S.; McCabe, L.R. Chronic hyperglycemia modulates osteoblast gene expression through osmotic and non-osmotic pathways. J. Cell. Biochem. 2006, 99, 411–424. [Google Scholar] [CrossRef]
- Hamrick, M.W.; McNeil, P.L.; Patterson, S.L. Role of muscle-derived growth factors in bone formation. J. Musculoskelet Neuronal Interact. 2010, 10, 64–70. [Google Scholar]
- Annamalai, R.T.; Mertz, D.R.; Daley, E.L.; Stegemann, J.P. Collagen Type II enhances chondrogenic differentiation in agarose-based modular microtissues. Cytotherapy 2016, 18, 263–277. [Google Scholar] [CrossRef] [Green Version]
- Barat-Houari, M.; Sarrabay, G.; Gatinois, V.; Fabre, A.; Dumont, B.; Genevieve, D.; Touitou, I. Mutation Update for\r, COL2A1\r, Gene Variants Associated with Type II Collagenopathies. Hum. Mutat. 2016, 37, 7–15. [Google Scholar] [CrossRef]
- Wu, J.; Fujioka, M.; Sugimoto, K.; Mu, G.; Ishimi, Y. Assessment of effectiveness of oral administration of collagen peptide on bone metabolism in growing and mature rats. J. Bone Miner. Metab. 2004, 22, 547–553. [Google Scholar] [CrossRef]
- Pawlowski, J.W.; Martin, B.R.; McCabe, G.P.; Ferruzzi, M.G.; Weaver, C.M. Plum and soy aglycon extracts superior at increasing bone calcium retention in ovariectomized sprague dawley rats. J. Agric. Food Chem. 2014, 62, 6108–6117. [Google Scholar] [CrossRef]
- Ausar, S.; Beltramo, D.; Castagna, L.; Quintana, S.; Silvera, E.; Kalayan, G. Treatment of rheumatoid arthritis by oral administration of bovine tracheal type II collagen. Rheumatol. Int. 2001, 20, 138–144. [Google Scholar]
- Porporatto, C.; Bianco, I.D.; Cabanillas, A.M.; Correa, S.G. Early events associated to the oral co-administration of type II collagen and chitosan: Induction of anti-inflammatory cytokines. Int. Immunol. 2004, 16, 433–441. [Google Scholar] [CrossRef] [Green Version]
- Gupta, R.C.; Canerdy, T.D.; Skaggs, P.; Stocker, A.; Zyrkowski, G.; Burke, R.; Wegford, K.; Goad, J.T.; Rohde, K.; Barnett, D.; et al. Therapeutic efficacy of undenatured type-II collagen (UC-II) in comparison to glucosamine and chondroitin in arthritic horses. J. Vet. Pharmacol. Ther. 2009, 32, 577–584. [Google Scholar] [CrossRef]
- D’Altilio, M.; Peal, A.; Alvey, M.; Simms, C.; Curtsinger, A.; Gupta, R.C.; Canerdy, T.D.; Goad, J.T.; Bagchi, M.; Bagchi, D. Therapeutic efficacy and safety of Undenatured Type II Collagen singly or in combination with glucosamine and chondroitin in arthritic dogs. Toxicol. Mech. Methods 2007, 17, 189–196. [Google Scholar] [CrossRef]
- Deparle, L.A.; Gupta, R.C.; Canerdy, T.D.; Goad, J.T.; D’Altilio, M.; Bagchi, M.; Bagchi, D. Efficacy and safety of glycosylated undenatured type-II collagen (UC-II) in therapy of arthritic dogs. J. Vet. Pharmacol. Ther. 2005, 28, 385–390. [Google Scholar] [CrossRef]
- Gencoglu, H.; Orhan, C.; Sahin, E.; Sahin, K. Undenatured Type II Collagen (UC-II) in Joint Health and Disease: A Review on the Current Knowledge of Companion Animals. Animals 2020, 10, 697. [Google Scholar] [CrossRef] [Green Version]
- Bagchi, D.; Misner, B.; Bagchi, M.; Kothari, S.C.; Downs, B.W.; Fafard, R.D.; Preuss, H.G. Effects of orally administered Undenatured Type II Collagen against arthritic inflammatory diseases: A mechanistic exploration. Int. J. Clin. Pharmacol. Res. 2002, 22, 101–110. [Google Scholar]
- Trentham, D.E.; Halpner, A.D.; Trentham, R.A.; Bagchi, M.; Kothari, S.; Preuss, H.G.; Bagchi, D. Use of Native Collagen II in the treatment of rheumatoid arthritis. Clin. Pract. Altern. Med. 2001, 2, 254–259. [Google Scholar]
- Bagi, C.M.; Berryman, E.R.; Teo, S.; Lane, N.E. Oral administration of undenatured native chicken type II collagen (UC-II) diminished deterioration of articular cartilage in a rat model of osteoarthritis (OA). Osteoarthr. Cartil. 2017, 25, 2080–2090. [Google Scholar] [CrossRef] [Green Version]
- Zaidi, M. Skeletal remodeling in health and disease. Nat. Med. 2015, 13, 791–801. [Google Scholar] [CrossRef]
- Franke, S.; Siggelkow, H.; Wolf, G.; Hein, G. Advanced glycation endproducts influence the mRNA expression of RAGE, RANKL and various osteoblastic genes in human osteoblasts. Arch. Int. Physiol. 2007, 113, 154–161. [Google Scholar] [CrossRef] [PubMed]
- Tahimic, C.G.; Wang, Y.; Bikle, D.D. Anabolic effects of IGF-1 signaling on the skeleton. Front. Endocrinol. 2013, 4, 6. [Google Scholar] [CrossRef] [PubMed] [Green Version]
- Yamaguchi, A.; Fujikawa, T.; Tateoka, M.; Soya, H.; Sakuma, K.; Sugiura, T.; Morita, I.; Ikeda, Y.; Hirai, T. The expression of IGF-I and myostatin mRNAs in skeletal muscle of hypophysectomized and underfed rats during postnatal growth. Acta Physiol. 2010, 186, 291–300. [Google Scholar] [CrossRef]
- Lecka-Czernik, B. Diabetes, bone and glucose-lowering agents: Basic biology. Diabetologia 2017, 60, 1163–1169. [Google Scholar] [CrossRef] [Green Version]
- Udagawa, N.; Takahashi, N.; Akatsu, T.; Tanaka, H.; Sasaki, T.; Nishihara, T.; Koga, T.; Martin, T.J.; Suda, T. Origin of osteoclasts: Mature monocytes and macrophages are capable of differentiating into osteoclasts under a suitable microenvironment prepared by bone marrow-derived stromal cells. Proc. Natl. Acad. Sc. USA 1990, 87, 7260–7264. [Google Scholar] [CrossRef] [Green Version]
- Takayanagi, H.; Iizuka, H.; Juji, T.; Nakagawa, T.; Yamamoto, A.; Miyazaki, T.; Koshihara, Y.; Oda, H.; Nakamura, K.; Tanaka, S. Involvement of receptor activator of nuclear factor kappa B ligand/osteoclast differentiation factor in osteoclastogenesis from synoviocytesin rheumatoid arthritis. Arthritis Rheum. 2000, 43, 259–269. [Google Scholar] [CrossRef]
- Lacey, D.L.; Timms, E.; Tan, H.L.; Kelley, M.J.; Dunstan, C.R.; Burgess, T.; Elliott, R.; Colombero, A.; Elliott, G.; Scully, S.; et al. Osteoprotegerinlig and is a cytokine that regulates osteoclast differentiation and activation. Cell 1998, 93, 165–176. [Google Scholar] [CrossRef] [Green Version]
- Pei, L.; Wang, S.; Yi, X.; Li, J.; Bai, Y.; Zhao, H.; Pang, Z. Comparative study on biological characteristics between db/db mice and db/m mice. Proc. Annu. Meet. Jpn. Pharmacol. Soc. 2018. [Google Scholar] [CrossRef]
- Griffin, T.M.; Huebner, J.L.; Kraus, V.B.; Guilak, F. Extreme obesity due to impaired leptin signaling in mice does not cause knee osteoarthritis. Arthritis Rheumatol. 2014, 60, 2935–2944. [Google Scholar] [CrossRef] [PubMed] [Green Version]
- Liu, R.; Wu, L.; Du, Q.; Ren, J.W.; Chen, Q.H.; Li, D.; Mao, R.X.; Liu, X.R.; Li, Y. Small molecule oligopeptides isolated from walnut (juglans regia l.) and their anti-fatigue effects in mice. Molecules 2018, 24, 45. [Google Scholar] [CrossRef] [Green Version]
- Zhu, N.; Liu, R.; He, L.X.; Mao, R.X.; Liu, X.R.; Zhang, T.; Hao, Y.T.; Fan, R.; Xu, M.H.; Li, Y. Radioprotective effect of walnut oligopeptides against gamma radiation-induced splenocyte apoptosis and intestinal injury in mice. Molecules 2019, 24, 1582. [Google Scholar] [CrossRef] [Green Version]
- Wang, J.B.; Liu, X.R.; Liu, S.Q.; Mao, R.X.; Hou, C.; Zhu, N.; Liu, R.; Ma, H.J.; Li, Y. Hypoglycemic Effects of Oat Oligopeptides in High-Calorie Diet/STZ-Induced Diabetic Rats. Molecules 2019, 24, 558. [Google Scholar] [CrossRef] [PubMed] [Green Version]
- Turner, C.H.; Burr, D.B. Basic biomechanical measurements of bone: A tutorial. Bone 1993, 14, 595–608. [Google Scholar] [CrossRef]
- Liu, H.; Li, W.; Liu, Y.S.; Zhang, X.; Zhou, Y.S. Co-administration of aspirin and allogeneic adipose-derived stromal cells attenuates bone loss in ovariectomized rats through the anti-inflammatory and chemotactic abilities of aspirin. Stem Cell Res. Ther. 2015, 6, 200. [Google Scholar] [CrossRef] [Green Version]
- Hapidin, H.; Othman, F.; Soelaiman, I.N.; Shuid, A.N.; Luke, D.A.; Mohamed, N. Negative effects of nicotine on bone-resorbing cytokines and bone histomorphometric parameters in male rats. J. Bone Miner. Metab. 2007, 25, 93–98. [Google Scholar] [CrossRef]
- Vestergaard, P. Discrepancies in bone mineral density and fracture 112risk in patients with type 1 and type 2 dia betes—A meta-analysis. Osteoporos. Int. 2007, 18, 427. [Google Scholar] [CrossRef]
- Leslie, W.D.; Rubin, M.R.; Schwartz, A.V.; Kanis, J.A. Type 2 diabetes and bone. J. Am. Soc. Bone Miner. Res. 2012, 27, 2231–2237. [Google Scholar] [CrossRef]
- Patsch, J.M.; Burghardt, A.J.; Yap, S.P.; Baum, T.; Schwartz, A.V.; Joseph, G.B.; Link, T.M. Increased cortical porosity in type 2 diabetic postmenopausal women with fragility fractures. J. Bone Miner. Res. 2013, 28, 313–324. [Google Scholar] [CrossRef] [PubMed]
- Eni, Y.N.; Brown, C.U.; Wang, Z.; Norman, T.L. The influence of boen morphology on fracture toughness of the femur and tibia. Bone 1997, 21, 453–459. [Google Scholar] [CrossRef]
- Silva, M.J.; Brodt, M.D.; Lynch, M.A.; McKenzie, J.A.; Tanouye, K.M.; Nyman, J.S.; Wang, X. Type 1 diabetes in young rats leads to progressive trabecular bone loss, cessation of cortical bone growth, and diminished whole bone strength and fatigue life. J. Bone Miner. Res. 2010, 24, 1618–1627. [Google Scholar] [CrossRef] [Green Version]
- Khan, M.P.; Singh, A.K.; Joharapurkar, A.A.; Yadav, M.; Shree, S.; Kumar, H.; Gurjar, A.; Mishra, J.S.; Tiwari, M.C.; Nagar, G.K.; et al. Pathophysiological mechanism of bone loss in type 2 diabetes involves inverse regulation of osteoblast function by PGC-1alpha and skeletal muscle atrogens: AdipoR1 as potential target for reversing diabetes induced osteopenia. Diabetes 2015, 64, 2609–2623. [Google Scholar] [CrossRef] [PubMed] [Green Version]
- Shu, A.; Yin, M.T.; Stein, E.; Cremers, S.; Dworakowski, E.; Ives, R.; Rubin, M.R. Bone structure and turnover in type 2 diabetes mellitus. Osteoporos. Int. 2012, 23, 635–641. [Google Scholar] [CrossRef] [Green Version]
- Rubin, M.R. Bone cells and bone turnover in diabetes mellitus. Curr. Osteoporos. Rep. 2015, 13, 186–191. [Google Scholar] [CrossRef]
- Cunha, J.S.; Ferreira, V.M.; Maquigussa, E.; Naves, M.A.; Boim, M.A. Effects of high glucose and high insulin concentrations on osteoblast function in vitro. Cell Tissue Res. 2014, 358, 249–256. [Google Scholar] [CrossRef]
- Kasahara, T.; Imai, S.; Kojima, H.; Katagi, M.; Kimura, H.; Chan, L.; Matsusue, Y. Malfunction of Bone Marrow Derived Osteoclasts and the Delay of Bone Fracture Healing in Diabetic Mice. Bone 2010, 47, 617–625. [Google Scholar] [CrossRef] [PubMed] [Green Version]
- Wittrant, Y.; Gorin, Y.; Woodru_, K.; Horn, D.; Abboud, H.; Mohan, S.; Abboud-Werner, S. High D(+)glucose concentration inhibits RANKL-induced osteoclastogenesis. Bone 2008, 42, 1122–1130. [Google Scholar] [CrossRef] [PubMed] [Green Version]
- He, H.; Liu, R.; Desta, T.; Leone, C.; Gerstenfeld, L.C.; Graves, D.T. Diabetes causes decreased osteoclastogenesis, reduced bone formation, and enhanced apoptosis of osteoblastic cells in bacteria stimulated bone loss. Endocrinology 2004, 145, 447–452. [Google Scholar] [CrossRef] [PubMed] [Green Version]
- Fulzele, K.; Riddle, R.C.; DiGirolamo, D.J.; Cao, X.; Wan, C.; Chen, D.; Faugere, M.C.; Aja, S.; Hussain, M.A.; Brüning, J.C.; et al. Insulin recep-tor signaling in osteoblasts regulates postnatal bone acquisi-tion and body composition. Cell 2010, 142, 309–319. [Google Scholar] [CrossRef] [Green Version]
- Seeman, E.; Delmas, P.D. Bone quality–the material and structural basis of bone strength and fragility. N. Engl. J. Med. 2006, 354, 2250–2261. [Google Scholar] [CrossRef] [Green Version]
- Sheng, M.H.; Zhou, X.D.; Bonewald, L.F.; Baylink, D.J.; Lau, K.H. Disruption of the insulin-like growth factor-1 gene in osteocytes impairs developmental bone growth in mice. Bone 2013, 52, 133–144. [Google Scholar] [CrossRef]
- Guo, B.; Zhang, Z.K.; Liang, C.; Li, J.; Liu, J.; Lu, A.; Zhang, B.T.; Zhang, G. Molecular Communication from Skeletal Muscle to Bone: A Review for Muscle-Derived Myokines Regulating Bone Metabolism. Calcif. Tissue Int. 2016, 100, 184–192. [Google Scholar] [CrossRef]
- Perrini, S.; Laviola, L.; Carreira, M.C.; Cignarelli, A.; Natalicchio, A.; Giorgino, F. The GH/IGF1 axis and signaling pathways in the muscle and bone: Mechanisms underlying age-related skeletal muscle wasting and osteoporosis. J. Endocrinol. 2010, 205, 201–210. [Google Scholar] [CrossRef]
- Lu, H.; Huang, D.; Saederup, N.; Charo, I.F.; Ransohoff, R.M.; Zhou, L. Macrophages recruited via CCR2 produce insulin-like growth factor-1to repair acute skeletal muscle injury. FASEB J. 2011, 25, 358–369. [Google Scholar] [CrossRef] [Green Version]
- Alzghoul, M.B.; Gerrard, D.; Watkins, B.A.; Hannon, K. Ectopic expression of IGF-I and Shh by skeletal muscle inhibits disuse-mediated skeletal muscle atrophy and bone osteopenia in vivo. FASEB J. 2004, 18, 221–223. [Google Scholar] [CrossRef] [Green Version]
- Banu, J.; Wang, L.; Kalu, D.N. Effects of increased muscle mass on bone in male mice overexpressing IGF-I in skeletal muscles. Calcif. Tissue Int. 2003, 73, 196–201. [Google Scholar] [CrossRef]
- Barzilay, J.I.; Cotsonis, G.A.; Walston, J.; Schwartz, A.V.; Satterfield, S.; Miljkovic, I.; Harris, T.B. Insulin resistance is associated with decreased quadriceps muscle strength in nondiabetic adults aged >=70 Years. Diabetes Care 2009, 32, 736–738. [Google Scholar] [CrossRef] [Green Version]
- Wei, W.; Wang, X.; Yang, M.; Smith, L.C.; Dechow, P.C.; Wan, Y. PGC1beta mediates PPARgamma activation of osteoclastogenesis and rosiglitazone-induced bone loss. Cell Metab. 2010, 11, 503–551. [Google Scholar] [CrossRef] [Green Version]
- Rached, M.T.; Kode, A.; Xu, L.; Yoshikawa, Y.; Paik, J.H.; DePinho, R.A.; Kousteni, S. FoxO1 Is a Positive Regulator of Bone Formation by Favoring Protein Synthesis and Resistance to Oxidative Stress in Osteoblasts. Cell Metab. 2010, 11, 147–160. [Google Scholar] [CrossRef] [Green Version]
- Jiao, H.; Xiao, E.; Graves, D.T. Diabetes and Its Effect on Bone and Fracture Healing. Curr. Osteoporos. Rep. 2015, 13, 327–335. [Google Scholar] [CrossRef] [Green Version]
- Cao, B.Y.; Li, R.; Tian, H.H.; Ma, Y.J.; Hu, X.G.; Jia, N.; Wang, Y.Y. PI3K-GLUT4 Signal Pathway Associated with Effects of EX-B3 Electroacupuncture on Hyperglycemia and Insulin Resistance of T2DM Rats. Evid. Based Complementary Altern. Med. Ecam 2016, 2016, 7914387. [Google Scholar] [CrossRef] [Green Version]
- Katayama, Y.; Akatsu, T.; Yamamoto, M.; Kugai, N.; Nagata, N. Role of nonenzymatic glycosylation of type I collagen in diabetic osteopenia. J. Bone Miner. Res. 1996, 11, 931–937. [Google Scholar] [CrossRef]
- Manigrasso, M.B.; Juranek, J.; Ramasamy, R.; Schmidt, A.M. Unlocking the biology of RAGE in diabetic microvascular complications. Trends Endocrinol. Metab. 2014, 25, 15–22. [Google Scholar] [CrossRef] [Green Version]
- Frost, H.M. Bone’s Mechanostat: A 2003 Update. Anat. Rec. Part Discov. Mol. Cell. Evol. Biol. 2003, 275, 1081–1101. [Google Scholar] [CrossRef]
- Moriwaki, S.; Suzuki, K.; Muramatsu, M.; Nomura, A.; Inoue, F.; Into, T.; Yoshiko, Y.; Niida, S. Delphinidin, one of the major anthocyanidins, prevents bone loss through the inhibition of excessive osteoclastogenesis in osteoporosis model mice. PLoS ONE 2014, 9, e97177. [Google Scholar] [CrossRef]
- Bord, S.; Ireland, D.C.; Beavan, S.R.; Compston, J.E. The effects of estrogen on osteoprotegerin, RANKL, and estrogen receptor expression in human osteoblasts. Bone 2003, 32, 136–141. [Google Scholar] [CrossRef]
- Trentham, D.E.; Dynesius-Trentham, R.A.; Orav, E.J.; Combitchi, D.; Lorenzo, C.; Sewell, K.L.; Hafler, D.A.; Weiner, H.L. Effects of oral administration of type II collagen on rheumatoid arthritis. Science 1993, 261, 1727–1730. [Google Scholar] [CrossRef] [Green Version]


| Groups | Maximum Load (N) | Energy to Ultimate Load (J) | Young’s Modulus (MPa) | Stiffness (N/mm) | Breaking Energy (J/m2) |
|---|---|---|---|---|---|
| AM | 7.49 ± 1.49 | 0.0013 ± 0.001 | 775.18 ± 139.11 | 25.02 ± 9.19 | 692.99 ± 127.45 |
| NC | 9.69 ± 2.11 | 0.0037 ± 0.001 a | 1205.54 ± 371.03 a | 54.85 ± 13.53 a | 1605.45 ± 257.17 a |
| YM | 9.89 ± 1.88 | 0.0045 ± 0.001 a | 1190.34 ± 11.49 a | 43.32 ± 2.77 a | 1136.68 ± 22.99 a,b |
| CG | 15.44 ± 3.84 a,b | 0.0058 ± 0.002 a | 1603.71 ± 102.08 a,b,c | 53.11 ± 12.82 a | 1572.01 ± 312.61 a,c |
| UC | 18.01 ± 3.00 a,b,c | 0.0110 ± 0.003 a,b,c,d | 2875.55 ± 312.98 a,b,c,d | 79.94 ± 15.04 a,b,c,d | 2210.94 ± 15.09 a,b,c,d |
| Amino Acid | Content (g/100 g) | Amino Acid | Content (g/100 g) |
|---|---|---|---|
| Asp | 4.15 | Val | 2.05 |
| Glu | 8.72 | Met | 1.15 |
| Ser | 1.36 | Phe | 1.50 |
| His | 0.60 | Ile | 1.32 |
| Gly | 11.72 | Leu | 2.72 |
| Thr | 1.81 | Lys | 2.15 |
| Arg | 4.95 | Pro | 3.63 |
| Ala | 4.6 | Hydroxyproline | 8.26 |
| Tyr | 0.46 |
Publisher’s Note: MDPI stays neutral with regard to jurisdictional claims in published maps and institutional affiliations. |
© 2021 by the authors. Licensee MDPI, Basel, Switzerland. This article is an open access article distributed under the terms and conditions of the Creative Commons Attribution (CC BY) license (https://creativecommons.org/licenses/by/4.0/).
Share and Cite
Fan, R.; Hao, Y.; Liu, X.; Kang, J.; Hu, J.; Mao, R.; Liu, R.; Zhu, N.; Xu, M.; Li, Y. Native Collagen II Relieves Bone Impairment through Improving Inflammation and Oxidative Stress in Ageing db/db Mice. Molecules 2021, 26, 4942. https://doi.org/10.3390/molecules26164942
Fan R, Hao Y, Liu X, Kang J, Hu J, Mao R, Liu R, Zhu N, Xu M, Li Y. Native Collagen II Relieves Bone Impairment through Improving Inflammation and Oxidative Stress in Ageing db/db Mice. Molecules. 2021; 26(16):4942. https://doi.org/10.3390/molecules26164942
Chicago/Turabian StyleFan, Rui, Yuntao Hao, Xinran Liu, Jiawei Kang, Jiani Hu, Ruixue Mao, Rui Liu, Na Zhu, Meihong Xu, and Yong Li. 2021. "Native Collagen II Relieves Bone Impairment through Improving Inflammation and Oxidative Stress in Ageing db/db Mice" Molecules 26, no. 16: 4942. https://doi.org/10.3390/molecules26164942