Article

Optimization of Fermentation Process of Pomegranate Peel and Schisandra Chinensis and the Biological Activities of Fermentation Broth: Antioxidant Activity and Protective Effect Against H2O2-induced Oxidative Damage in HaCaT Cells

1
School of Perfume & Aroma and Cosmetics, Shanghai Institute of Technology, Shanghai 201418, China
2
Engineering Research Center of Perfume & Aroma and Cosmetics, Ministry of Education, Shanghai 201418, China
*
Author to whom correspondence should be addressed.
Molecules 2021, 26(11), 3432; https://doi.org/10.3390/molecules26113432
Submission received: 22 April 2021 / Revised: 31 May 2021 / Accepted: 1 June 2021 / Published: 5 June 2021

Abstract

:
In this study, the lactobacillus fermentation process of pomegranate (Punica granatum L.) peel and Schisandra chinensis (Turcz.) Baill (PP&SC) was optimized by using the response surface method (RSM) coupled with a Box-Behnken design. The optimum fermentation condition with the maximal yield of ellagic acid (99.49 ± 0.47 mg/g) was as follows: 1:1 (w:w) ratio of pomegranate peel to Schisandra chinensis, 1% (v:v) of strains with a 1:1 (v:v) ratio of Lactobacillus Plantarum to Streptococcus Thermophilus, a 37 °C fermentation temperature, 33 h of fermentation time, 1:20 (g:mL) of a solid–liquid ratio and 3 g/100 mL of a glucose dosage. Under these conditions, the achieved fermentation broth (FB) showed stronger free radical scavenging abilities than the water extract (WE) against the ABTS+, DPPH, OH and O2 radicals. The cytotoxicity and the protective effect of FB on the intracellular ROS level in HaCaT cells were further detected by the Cell Counting Kit-8 (CCK-8) assay. The results showed that FB had no significant cytotoxicity toward HaCaT cells when its content was no more than 8 mg/mL. The FB with a concentration of 8 mg/mL had a good protective effect against oxidative damage, which can effectively reduce the ROS level to 125.94% ± 13.46% (p < 0.001) compared with 294.49% ± 11.54% of the control group in H2O2-damaged HaCaT cells. The outstanding antioxidant ability and protective effect against H2O2-induced oxidative damage in HaCaT cells promote the potential for the FB of PP&SC as a functional raw material of cosmetics.

1. Introduction

Pomegranate is an ancient fruit that has been studied by many researchers [1], and its seeds, leaves, peel and flowers can be used as herbal medicine with the functions of arresting thirst, astringency, diarrhea and hemostasis [2]. Pomegranate is rich in a variety of antioxidant substances with the effects of scavenging free radicals [3], antiaging [4] and whitening [5]. Pomegranate extracts from seeds and peels have been used in many industries, such as foods [6], medicine [7] and cosmetics [8], due to their good characteristics and development of deep processing technology. Ellagic acid is one of active substances [9] of pomegranates. Besides its good activity of antioxidation and cells protection [10], ellagic acid may be a potential drug to limit the burden of diabetes [11].
Schisandra chinensis is a dry and mature fruit of perennial deciduous woody vines [12], and it has been used as a Chinese traditional herbal medicine [13]. Schisandra chinensis is rich in lignans, which have a variety of pharmacological effects and display good therapeutic effects on many diseases [14]. The research on Schisandra chinensis has mainly been concentrated on its composition analysis and biological activity. Studies have proven that Schisandra chinensis has the effects of sedation [15], anti-inflammatory [16], inhibiting gene expression [17] and protecting cells [18].
Fermentation is a physiological activity of microorganisms [19], and microbial fermentation technology has been widely used in foods [20], pharmaceuticals [21], energy [22], agriculture [23] and environmental protection [24]. In recent years, there have been some research on pomegranates as a fermentation substrate, mostly in food [25], health products [26] and so on. However, there are few studies on the fermentation of Schisandra chinensis and even less research about the combination of pomegranates and Schisandra chinensis. A lot of research has proven that enzymes can degrade the fibrous tissue of plants, resulting in cell rupture and the outflow of intracellular nutrients in the process of fermentation [27]. Therefore, the extraction rate of effective components and its efficacy may be improved [28]. Macromolecular substances in plants cannot be easily absorbed by the skin, and these substances can be degraded into small molecules easily absorbed by the skin through microbial fermentation, which can also increase the utilization rate of the effective ingredients [29]. Due to the rich active components of plants, such as natural flavonoids, polysaccharides, proteins, polyphenols and new metabolites of microorganisms retained in FB, the research on cosmetics using FB as functional raw materials has attracted great attention. It was reported that FB produced by probiotic fermentation are more friendly and safer to the human skin [30]. Fermentation technology has a unique advantage in plant extraction.
The response surface method (RSM) develops in 50 s, and it is widely used in many technical fields [31], especially in process design and optimization [32]. RSM provides optimization with the help of polynomials adapted to the data obtained from optimization procedure-designed experiments. In this study, the RSM was used to evaluate the effects of different variables on the outcome, which is the ellagic acid content and the interactions among different variables. Oxidative stress was caused by the disruption of the balance between oxidative and antioxidant systems [33]. Excessive reactive oxygen species (ROS) may lead to the oxidation of polyunsaturated fatty acids in low-density lipoprotein or cell membrane phospholipids [34]. This kind of lipid peroxidation produces a large number of peroxidation products that may destroy the structural integrity of the cell membrane and eventually lead to oxidative damage [35]. The level of ROS in cells can be used as an indicator of the protective ability of the active substance [36]. More and more studies have been carried out about how the active substance reduces the UVA/UVB or H2O2-induced oxidative damage in human cells [37].
Hence, the focus of this paper aims to: (1) develop and optimize the fermentation conditions of pomegranate peels and Schisandra chinensis (PP&SC) by using response surface methodology with a Box-Behnken design, (2) quantifying the ellagic acid in the FB and WE by HPLC and determining the scavenging ability of the various free radicals and (3) evaluating the cytotoxicity and the protective effect of FB and WE on the intracellular ROS level in HaCaT cells.

2. Results and Discussion

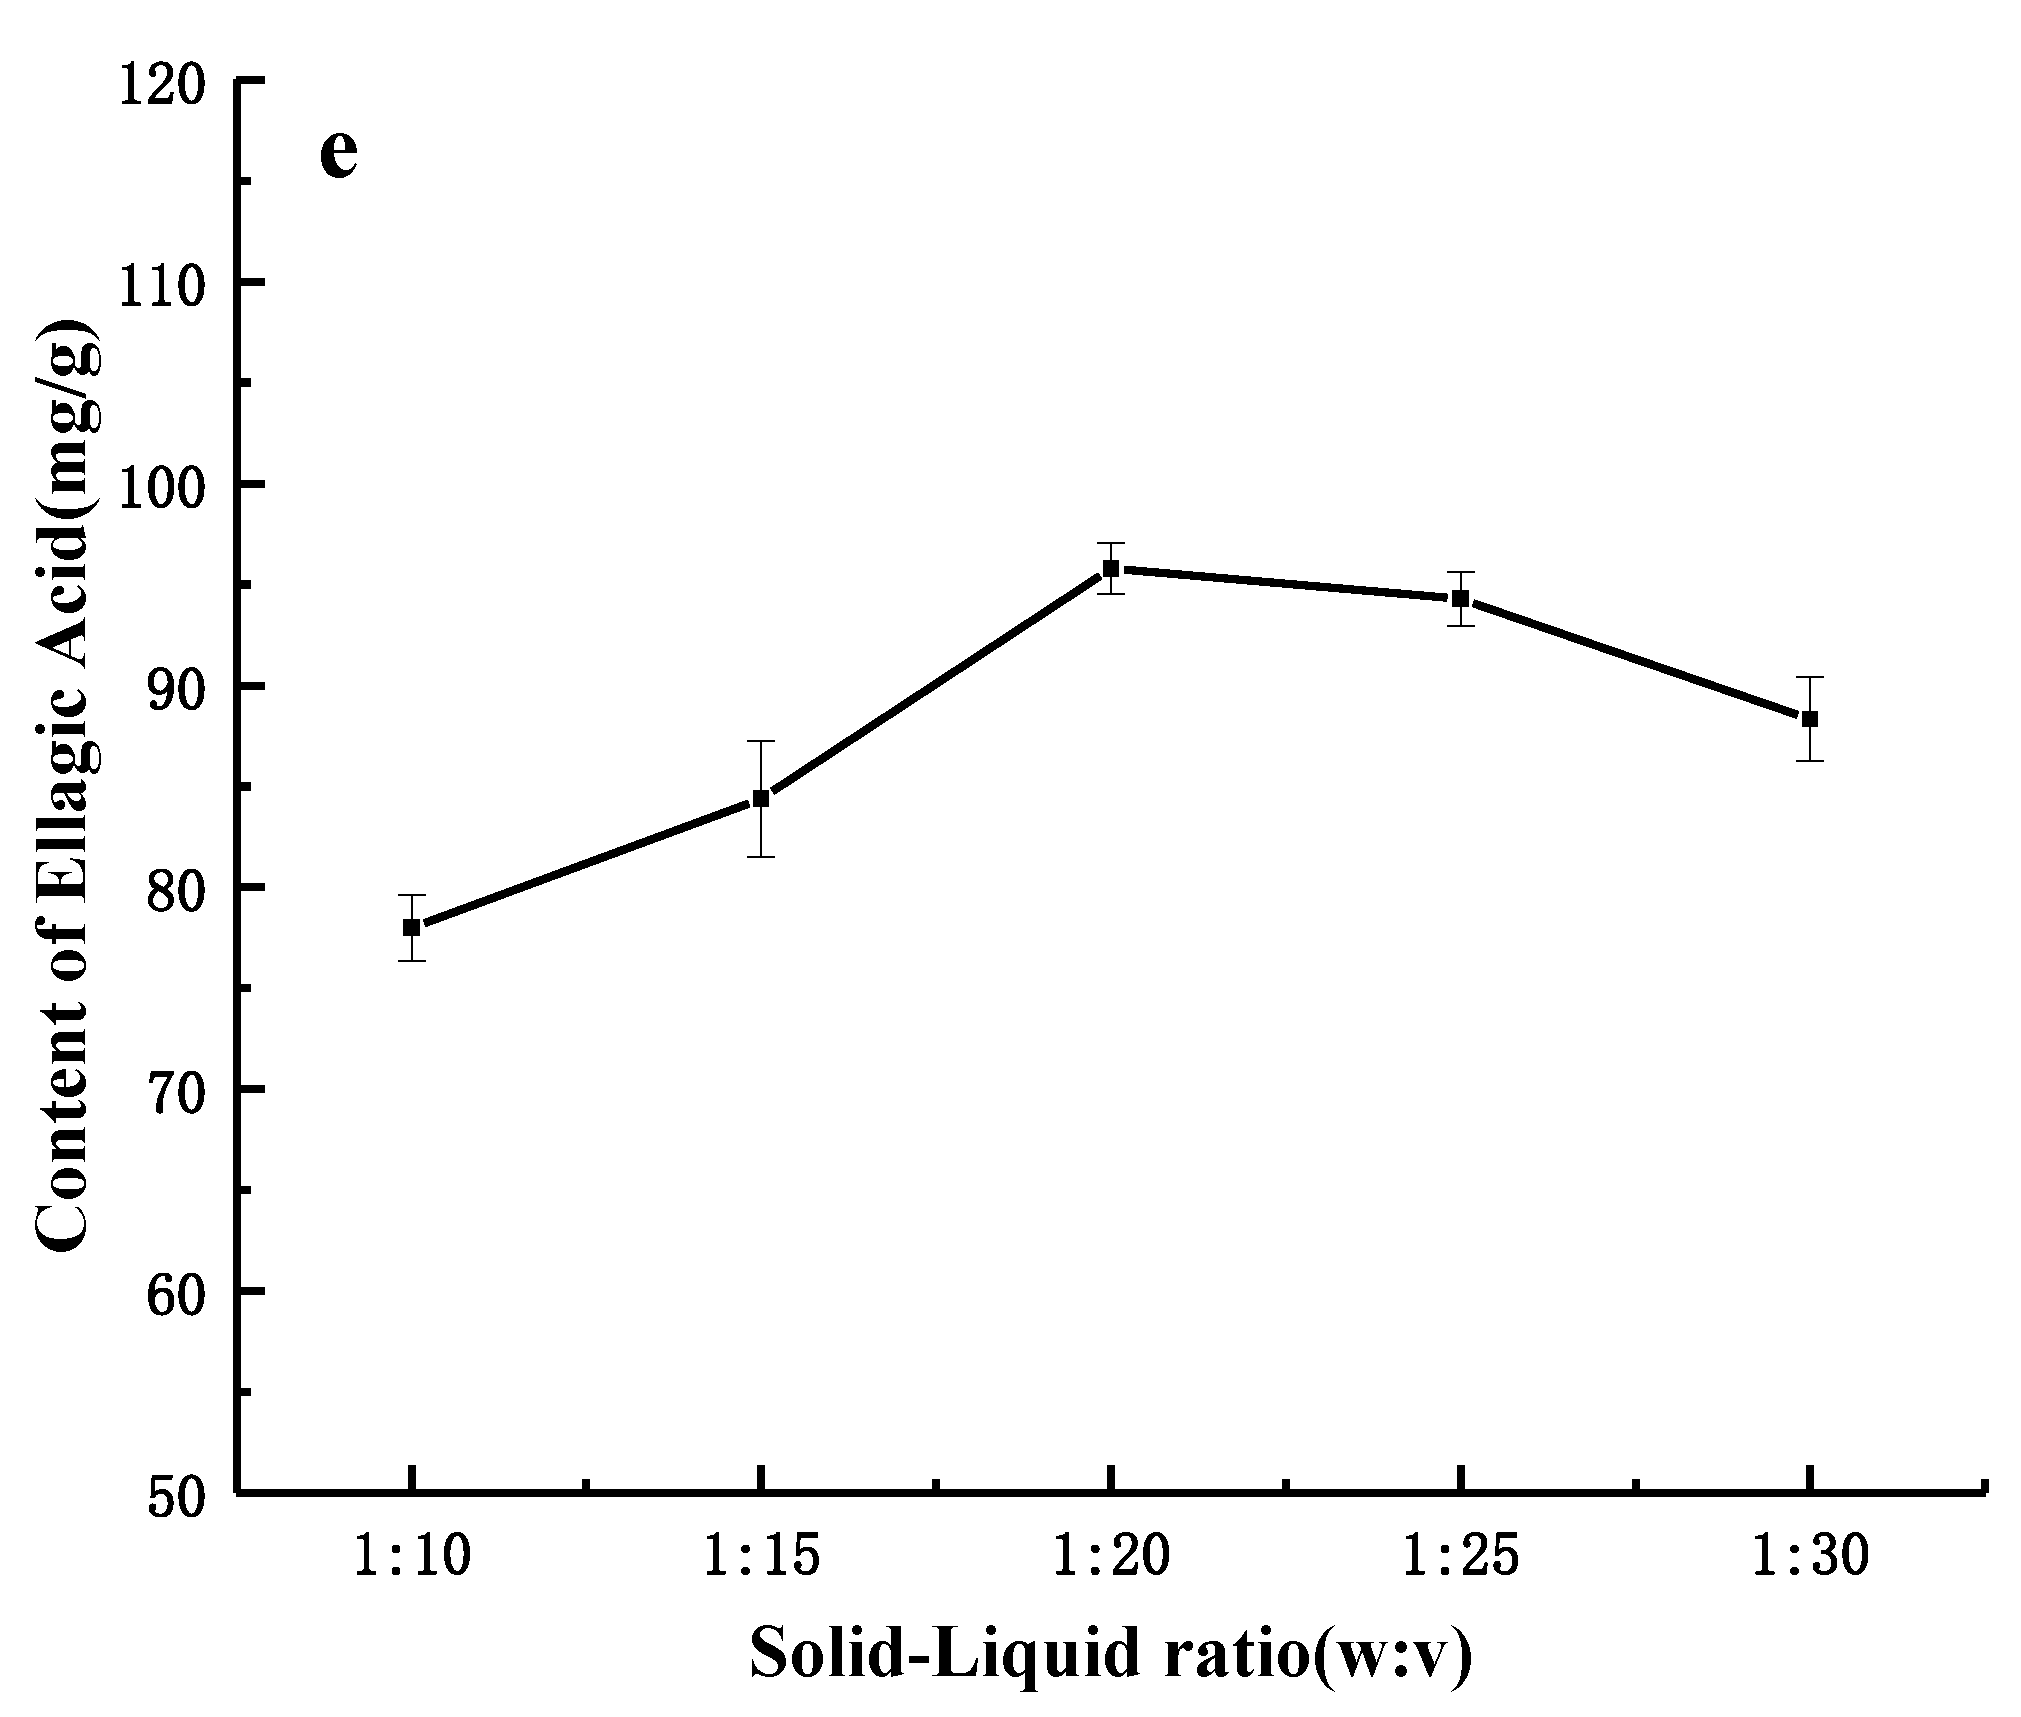
2.1. Single-Factor Experiments

Single-factor experiments and RSM were applied to the optimization of fermentation. Single-factor experiments were carried out with the selected parameters and levels, which provided a suitable range for the BBD in the RSM. To explore the influence of different conditions on the FB, we developed five factors and five levels of experimental program in the single-factor experiments. The ellagic acid content, lignans content and the total DPPH clearance rate were detected in all single-factor experiments. As shown in Figure 1a, the ellagic acid content first increased with the fermentation time from 12 h to 36 h, then fell when the fermentation time was in the range of 36–60 h. A similar change in the trend of the ellagic acid content appeared for the influences of fermentation temperature, strain dosage, glucose dosage and the solid–liquid ratio (Figure 1b–e). The ellagic acid content reached the maximum when the glucose dosage, fermentation time and fermentation temperature reached 3 g/100 mL, 36 h and 37 °C, respectively. A suitable glucose additional amount, fermentation time and fermentation temperature can benefit the growth and activity of microorganisms, thus affecting the release and hydrolysis of tannin into ellagic acid. However, excessive fermentation time and fermentation temperature partly may be attributed to the loss of ellagic acid due to its instability, such as oxidation or degradation to form other compounds. Glucose can be used as the main carbon source of Lactobacillus plantarum and Streptococcus thermophilus, but an excessive glucose dosage can affect the utilization of fermentation substrates by microorganisms, resulting in the reduced release of active substances from plant tissue. In the case of Tunisia soft-seed pomegranates, the contents of ellagic acid in the ethanol, aqueous and ethyl acetate extracts of the pomegranate peels were reported to be 28.45, 41.36 and 32.68 mg/g, respectively [38]. As a contrast, in this experiment, the ellagic acid content was significantly improved after fermentation.
The experimental design of the process optimization by using RSM with BBD was based on the results of the single-factor tests. In this experiment, we mainly explored the change of the ellagic acid content in the FB and the antioxidant capacity of the FB in different fermentation conditions. Therefore, we chose the following three factors that had a greater impact on the ellagic acid content as the response surface variables: fermentation temperature, fermentation time and glucose dosage.

2.2. Building Models and Analyzing Statistics

Based on the results of the experiments on a single factor, three parameters: glucose dosage (A), fermentation time (B) and fermentation temperature (C) were selected as the variables for optimizing the process of fermentation using the ellagic acid content as the index. The experimental steps and their corresponding experimental results are shown in Table 1.
According to the test method designed by design-expert 7.0, the fitting regression of several data in Table 1 was performed. As in Table 2, a multiple regression analysis was used to analyze the experimental data, and the relationship between the response variables and the quadratic regression equation was obtained (Equation (1)).
Y(content of ellagic acid) = 96.43 + 1.20A − 1.97B + 0.86C − 0.92AB − 0.70AC − 0.24BC − 5.23A2 − 4.98B2 − 8.38C2
The significance of the model was detected, and the results in Table 2 were obtained. The high correlation coefficient value (R2 = 0.982) showed that the experimental response values have a good correlation with the predicted response values. p < 0.001 indicated that each dependent variable had a significant relationship with all the independent variables, and the established model was meaningful. The missing item, p > 0.05, indicated that the model fit well and had no significant differences, so the content of ellagic acid could be analyzed by using the model and regression equation. According to the p-value, we determined that three linear coefficients (A, B and C); three quadratic coefficients (A2, B2 and C2) and three interaction coefficients (AB, AC and BC) were significant, which indicated that there was an interaction between the tested variables. The F-value of the model was 50.22, which indicated that the model was very significant when p < 0.0001. Due to the relative pure error, the lack of fitting F-value of 4.89 was not significant (p < 0.37951). The suitability of the models must be checked to prevent inappropriate models from producing undesirable or misleading results [39].
According to the results of the regression analysis, the response surface contour map and the response surface 3D map were drawn in Figure 2. The three-dimensional diagram intuitively reflected the influence of the interaction of each factor on the response value and found the best parameters and the interactions among the parameters. Figure 2a shows the effects of the fermentation time and glucose dosage on the ellagic acid content. The content of ellagic acid increased with the extension of the fermentation time. When the amount of glucose reached a certain point, the content of ellagic acid decreased with the extension of the fermentation time or the increase of glucose. Similarly, the change of the ellagic acid content showed the same trend in Figure 2b,c. The best process conditions we got through optimization were as follows: 6 g/100 mL of glucose addition, 33 h of fermentation time and 37 °C of fermentation temperature. Milessi et al.’s research proved that adding suitable carbon sources can make microbes proliferate, but excessive carbon sources will reduce the utilization rate of microorganisms to fermentation substrates [40]. Lu et al. found that a proper fermentation time can enable microorganisms to proliferate and make full use of fermentation substrates [41]. The temperature suitable for microbial growth is crucial [42]. High or low temperatures may lead to the activity of microorganisms being reduced.
According to the response surface experiment, the optimal technological conditions for the fermentation of PP&SC were as follows: the glucose dosage was 6 g/100 mL, the fermentation time 33 h, the fermentation temperature 37 °C, the strained content (v:v) 1% and solid–liquid ratio 1:20 (g:mL). Under these conditions, the contents of ellagic acid and lignans in the FB reached 99.49 ± 0.47 mg/g and 60.03 ± 0.69 mg/g, respectively, with a DPPH scavenging rate of 95.70% ± 0.36% at the diluted concentration of 0.9 mg/mL. The experiment was repeated three times, and the average value was taken to verify the good effects of the experiment.

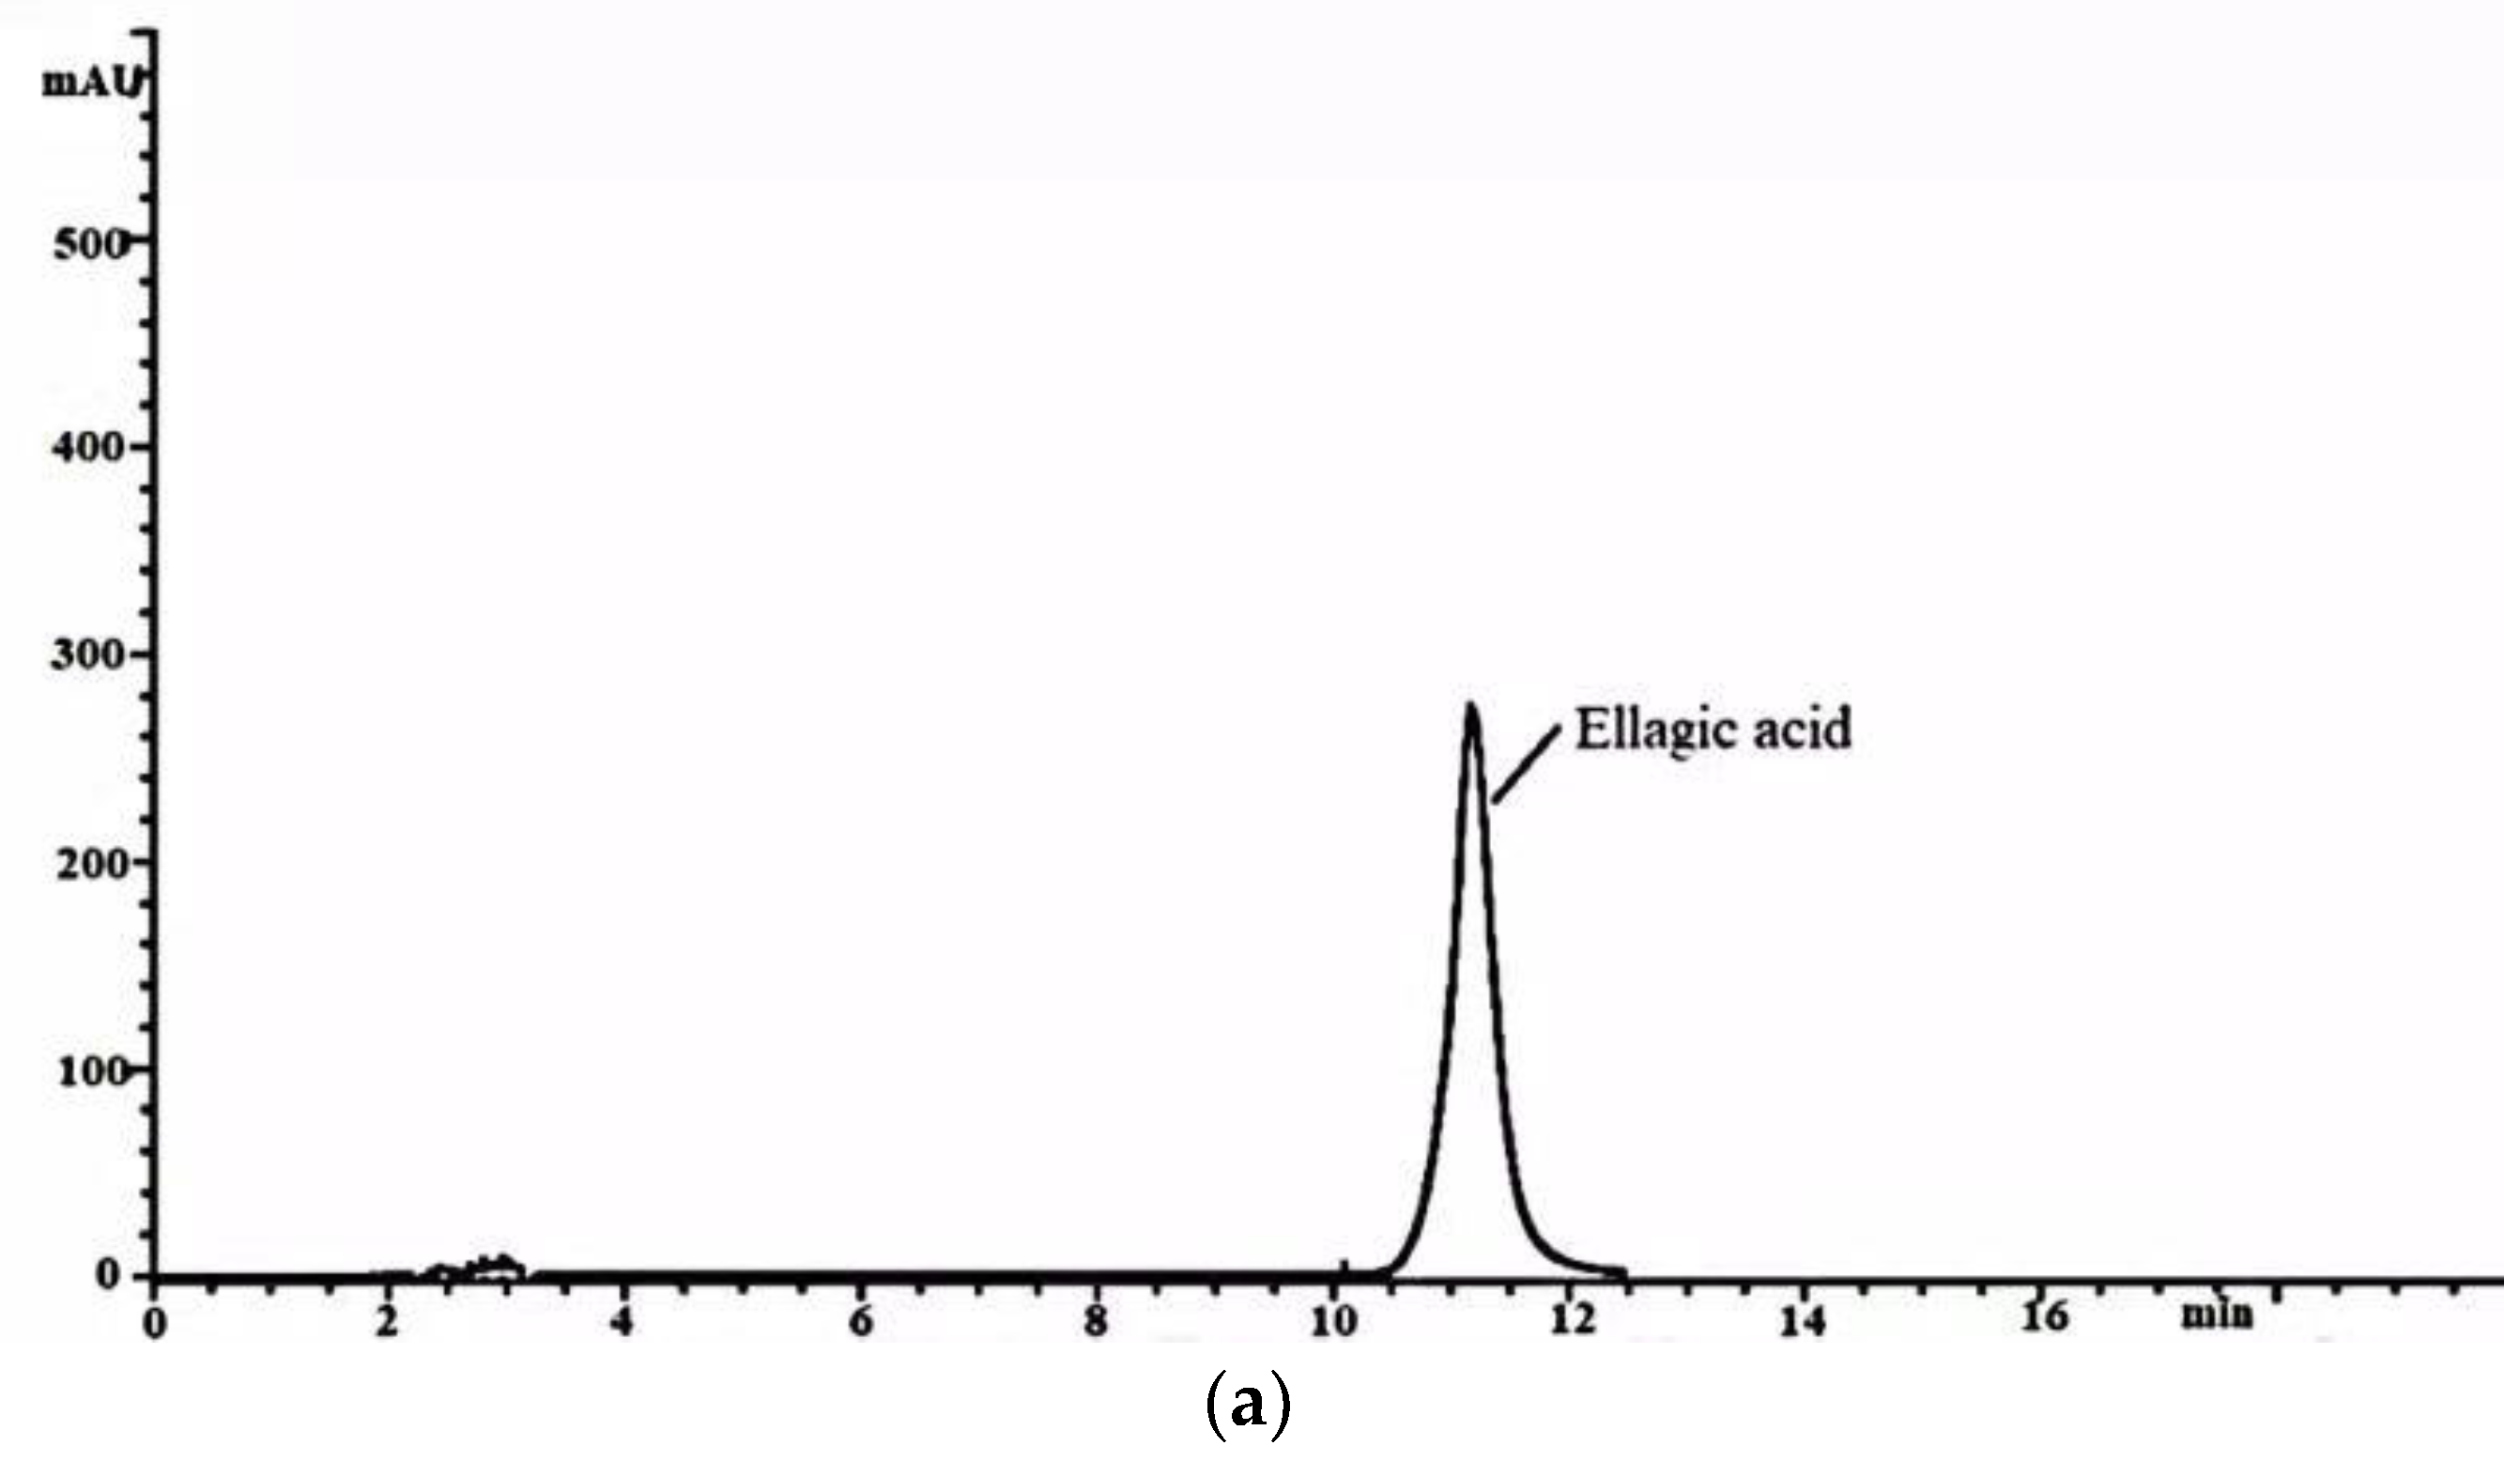
2.3. HPLC Analysis of Ellagic Acid in the FB and WE

The presence of ellagic acid in the FB and WE was detected by HPLC analysis, according to the retention time of the ellagic acid samples (Figure 3). The ellagic acid present in the FB and WE exhibited the same retention time as that of the standard ellagic acid. The results showed that the content of ellagic acid in the FB significantly increased after fermentation compared to that in the WE. The content of ellagic acid was 34.88 ± 0.76 mg/mL in the WE and 99.49 ± 0.47 mg/mL in the FB. These results were consistent with previous studies that microbial fermentation may reduce the pH of FB and promote the conversion of tannin acid to ellagic acid [43].

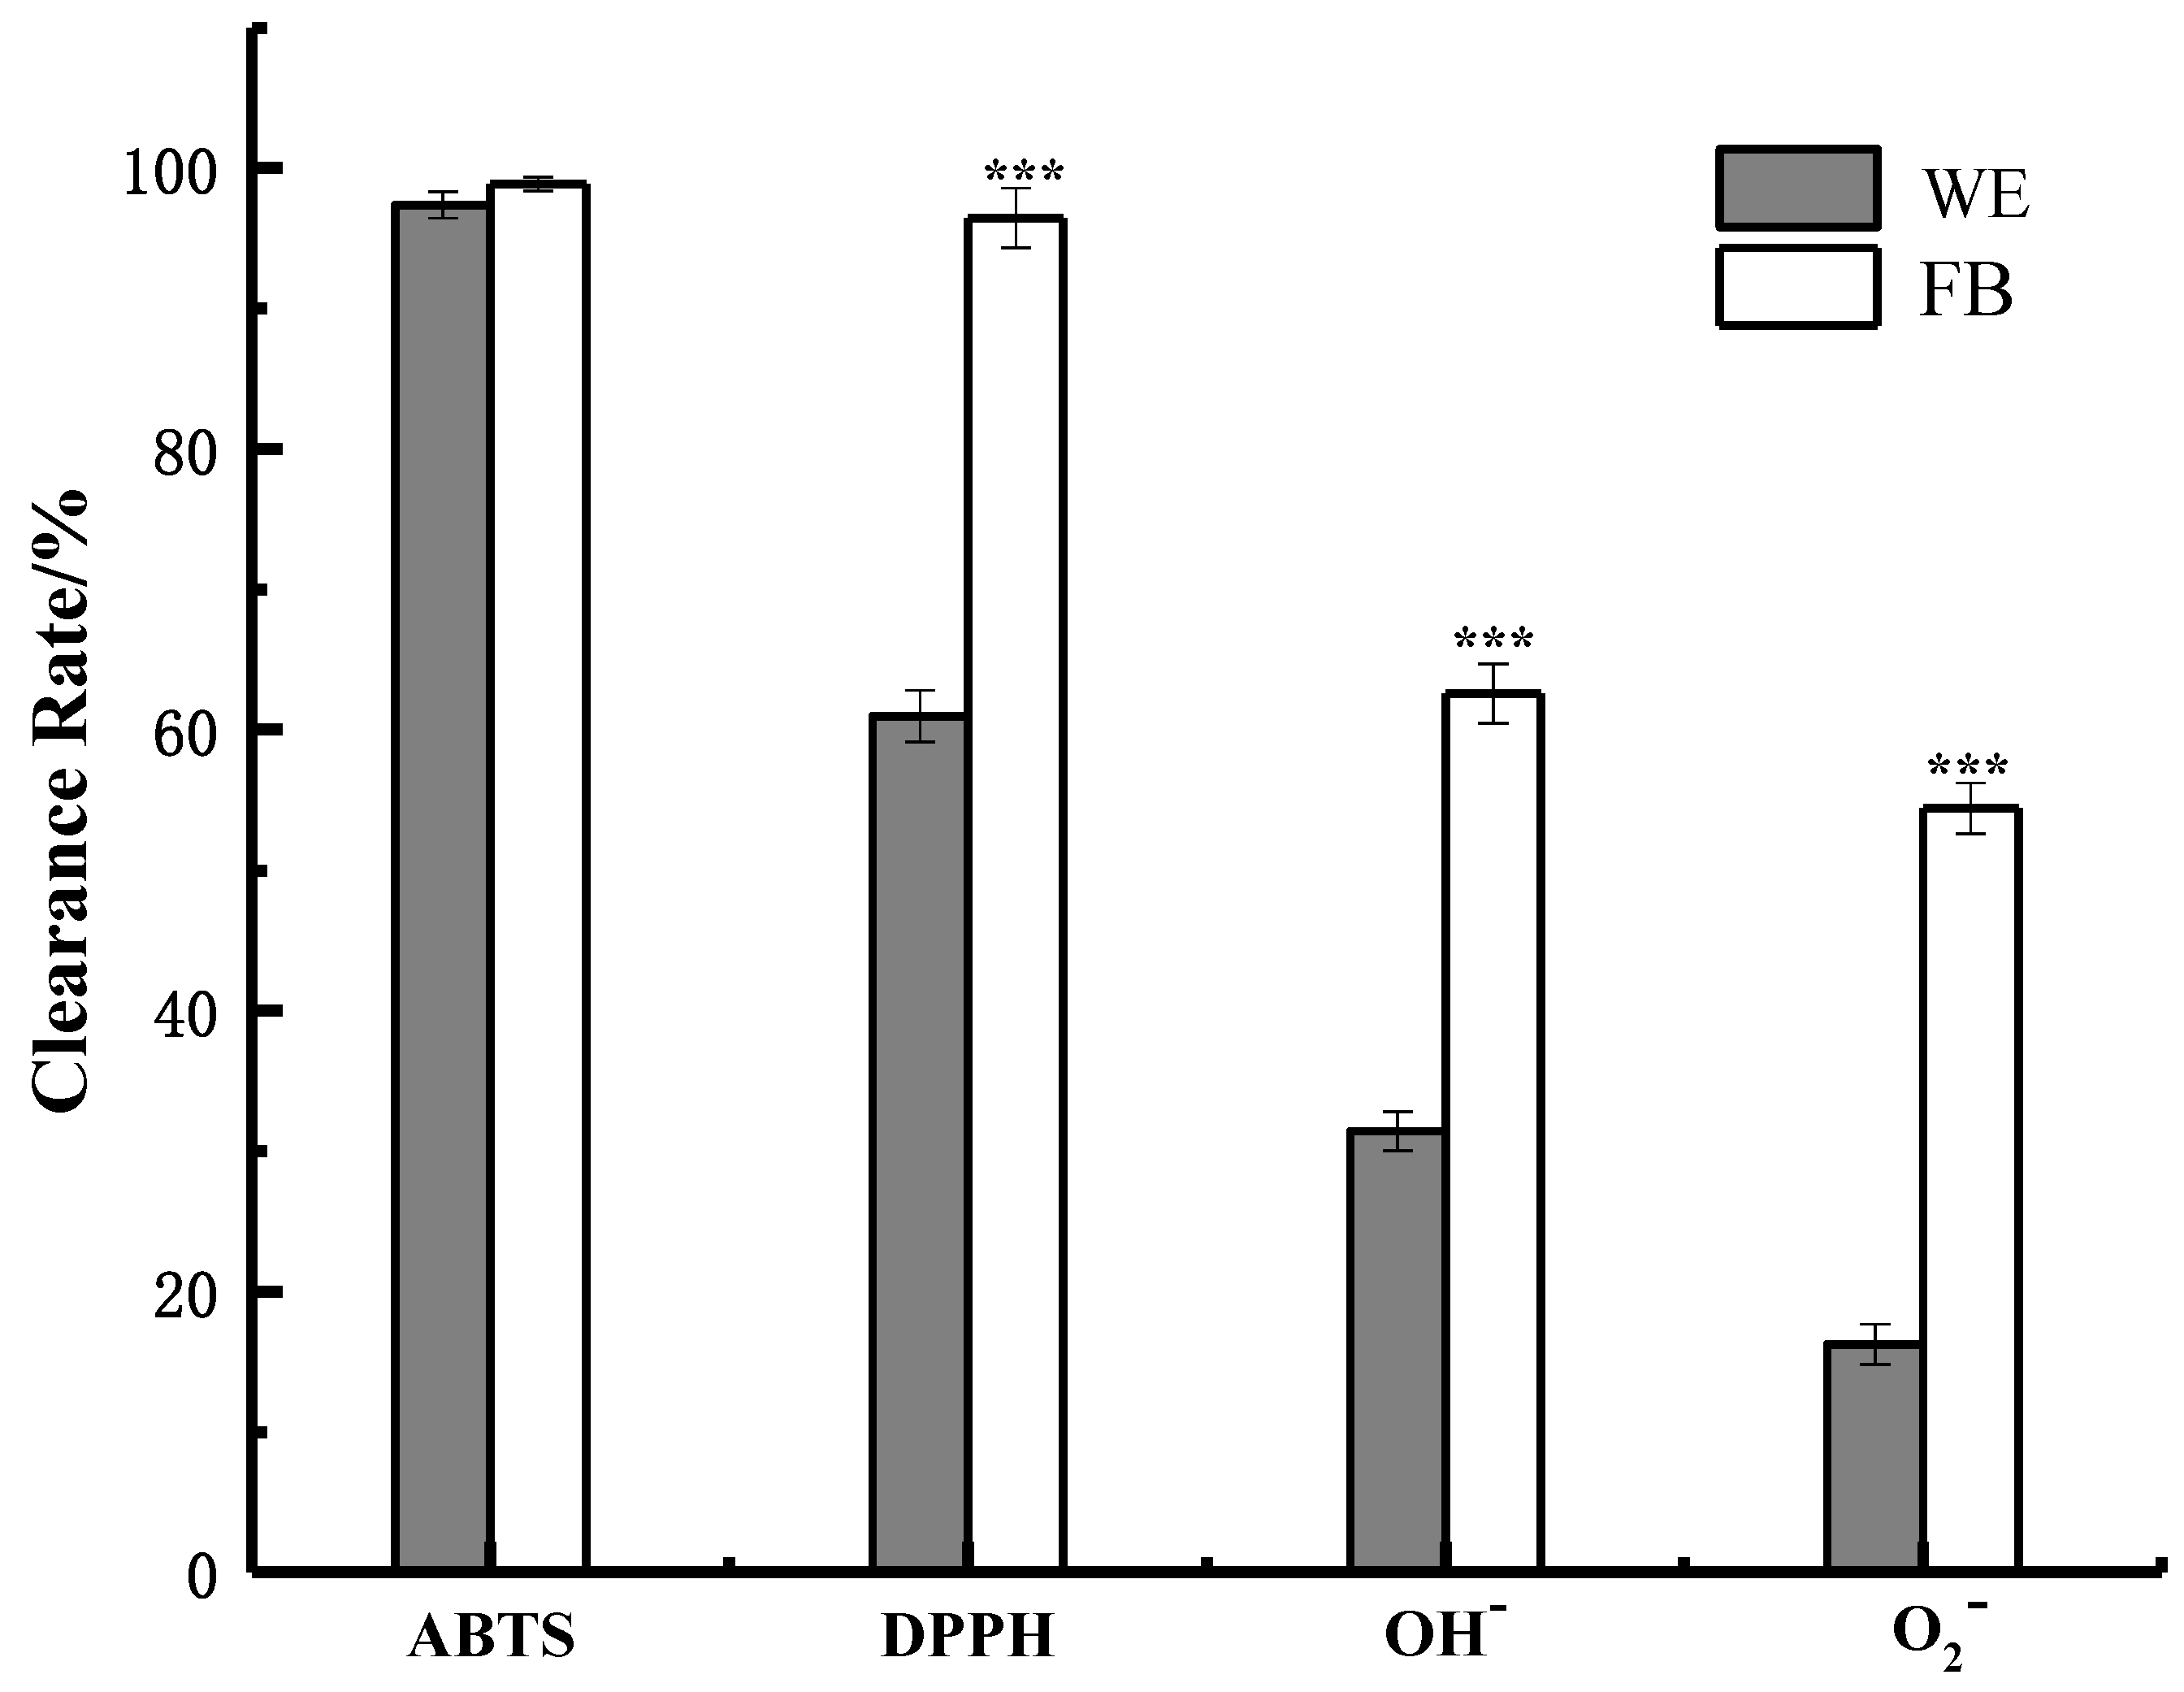
2.4. Antioxidant Ability of WE and FB

To explore in vitro antioxidant activity of the FB, the free radical scavenging abilities against the ABTS+, DPPH, OH and O2 radicals were detected compared with those of WE. The results are shown in Figure 4. When the FB was diluted to 0.6 mg/mL, 0.9 mg/mL, 0.05 g/mL and 0.66 g/mL, the FB still showed strong scavenging abilities against the ABTS, DPPH, OH and O2 radicals, with scavenging rates of 93.00% ± 0.56%, 95.0% ± 0.56% (p < 0.001), 79.50% ± 0.78% (p < 0.001) and 70.80% ± 0.32% (p < 0.001), respectively. Particularly, the EC50 value of the DPPH scavenge activity of freeze-dried FB was 0.042 ± 0.001 mg/mL, which was a little lower than that of pure Vitamin C (EC50 = 0.050 mg/mL). In addition, the EC50 value of the ABTS, OH and O2 scavenging activity of freeze-dried FB were as follows: 0.033 ± 0.001 mg/mL, 4.481 ± 0.032 mg/mL and 6.002 ± 0.040 mg/mL. We also found that the content of ellagic acid effectively increased with the presence of both pomegranate peels and Schisandra chinensis (1:1 w:w) compared with the situation with the presence of a pure pomegranate peel. Under the same concentration of the WE and FB, the latter showed stronger free radical scavenging abilities. Microbial fermentation is a complex process, during which microorganisms may decompose, transform or synthesize different substances through their own metabolic activities [44]. In this case, microbial fermentation can enhance the antioxidant activities through various ways. It may promote cell rupture and the outflow of intracellular antioxidant substances in the plant, such as ellagic acid, lignans, flavonoids and so on. It may also promote the conversion of tannin acid to ellagic acid, resulting in an increase in the content of ellagic acid. On the other hand, microbial fermentation may produce antioxidant factors in its biochemical process [45].

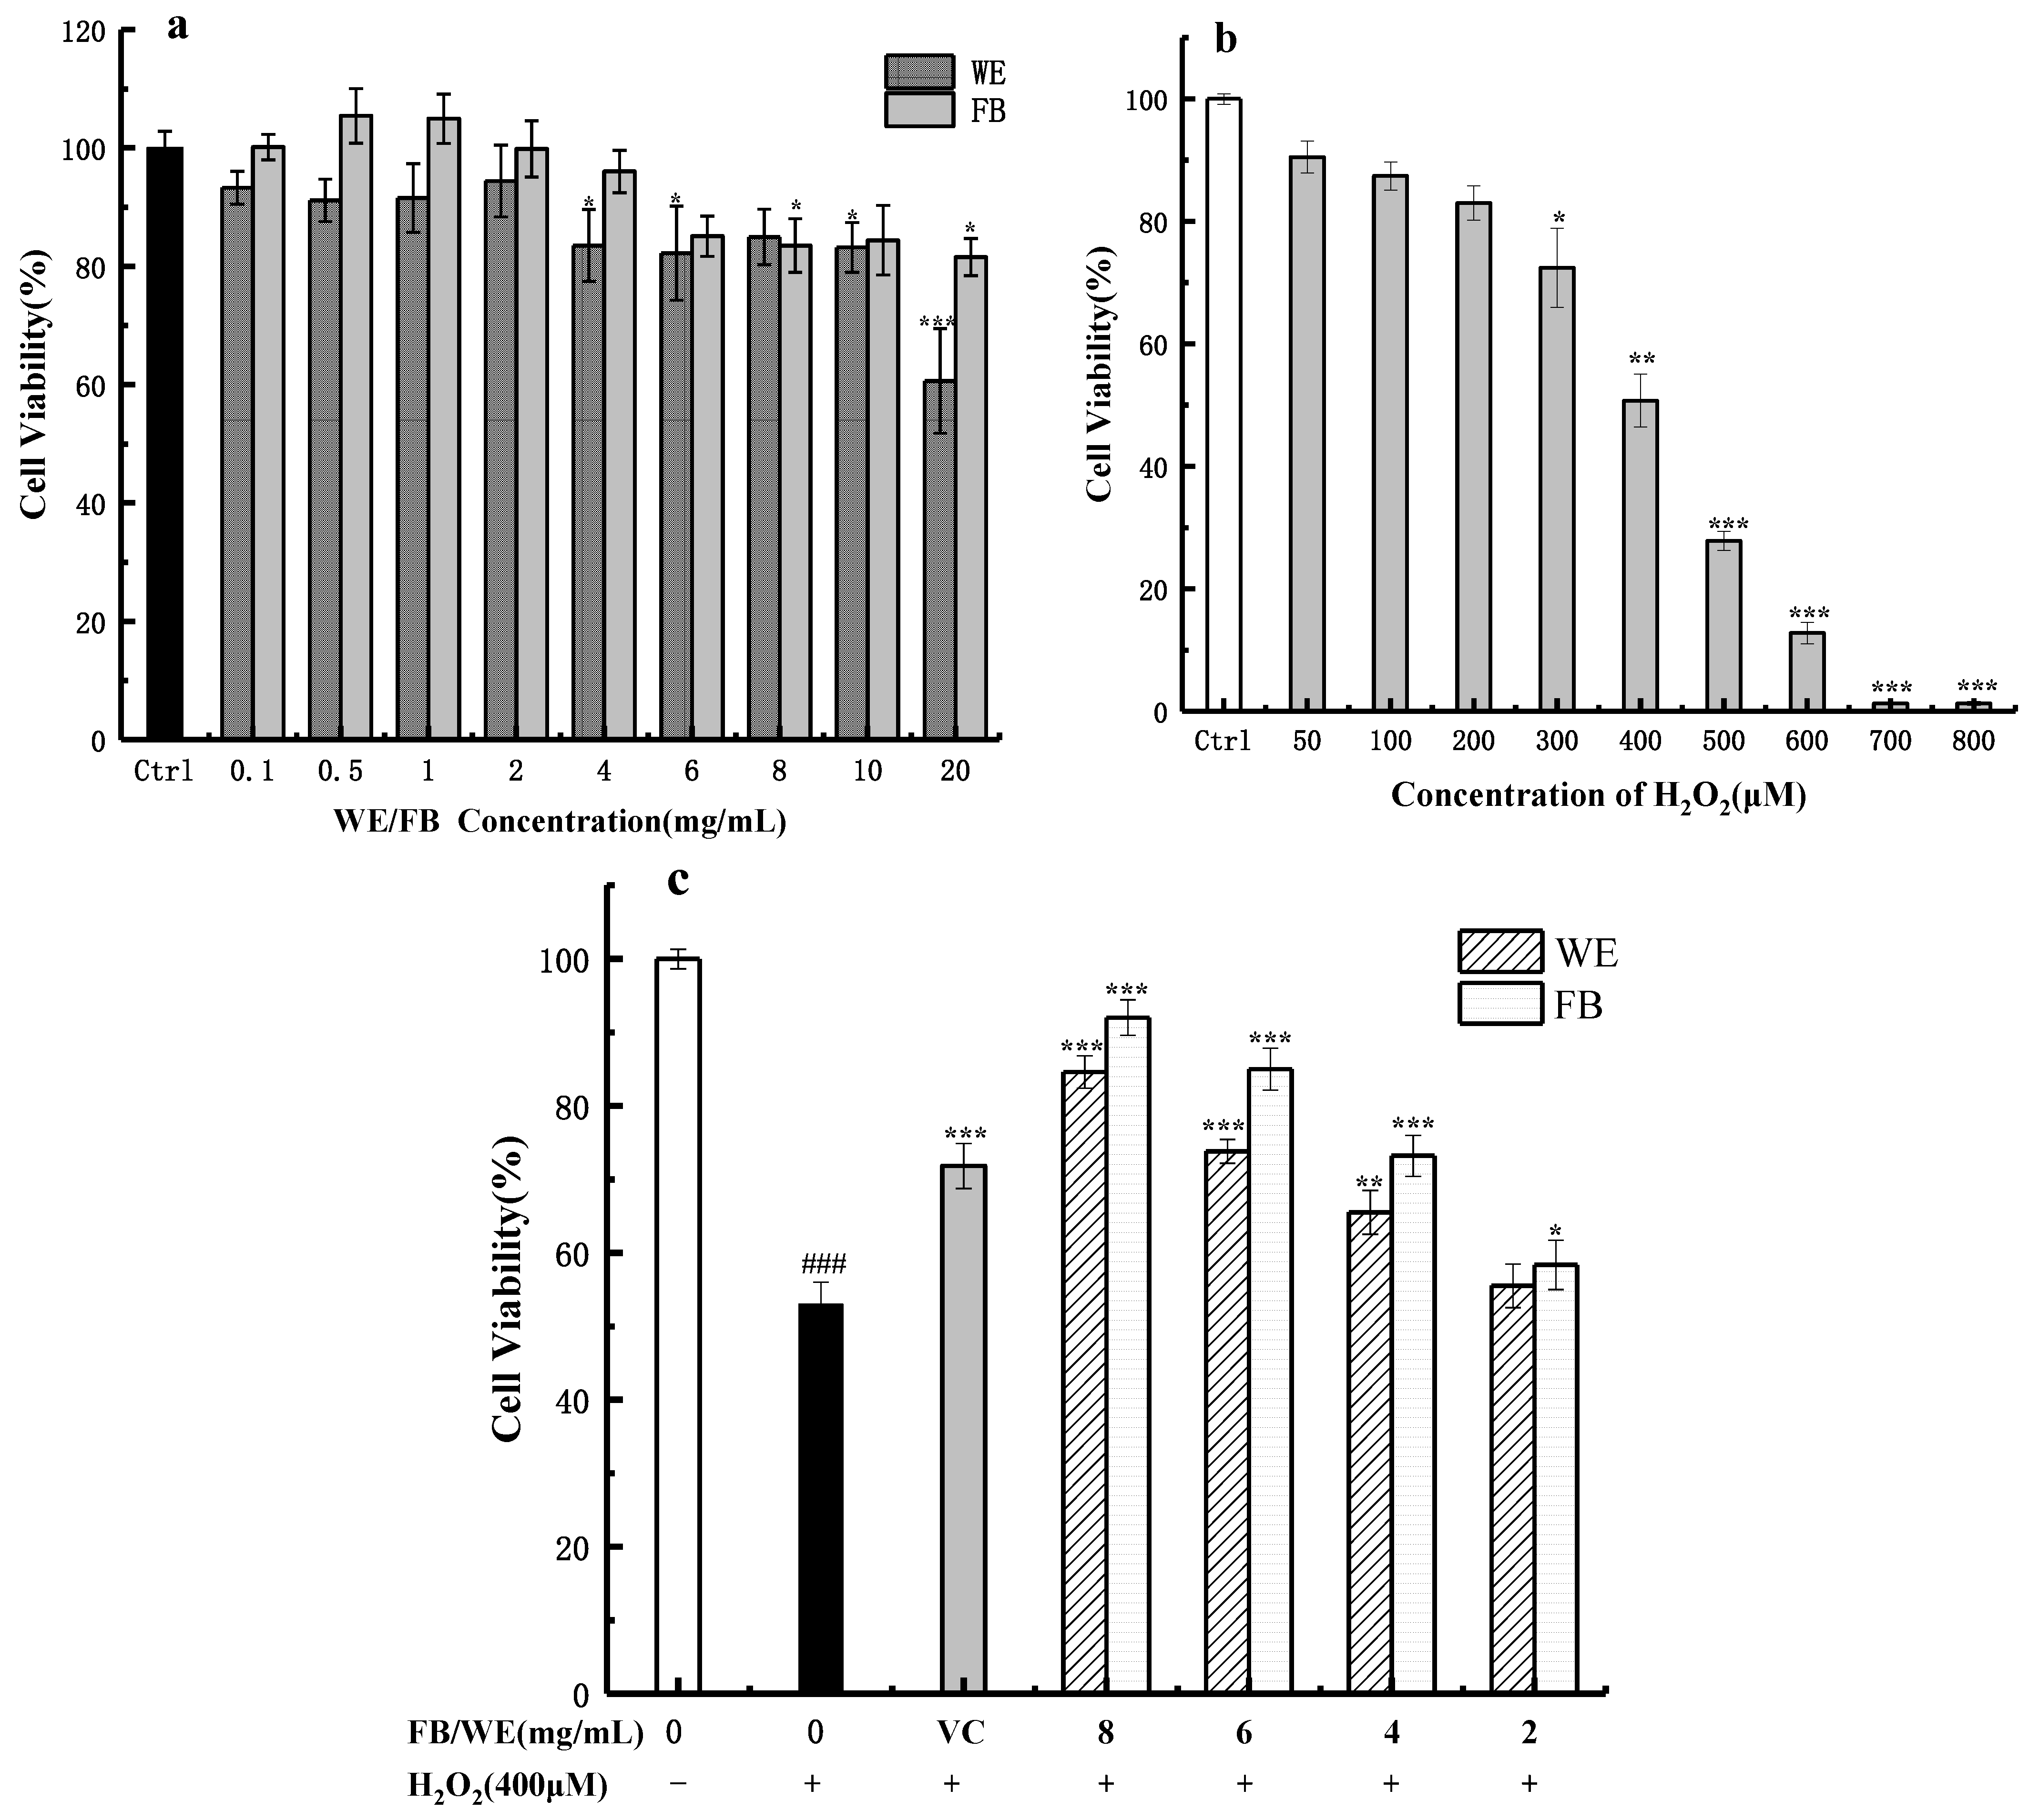
2.5. Effects of FB, WE and H2O2 on the Activity of HaCaT Cells

The CCK-8 assay was used to determine the cytotoxicity of the WE, FB and H2O2 on the HaCaT cells. As shown in Figure 5a, the viability of the HaCaT cells gradually decreased in the groups treated with FB and WE at concentrations of 0.1~20 mg/mL. When the concentrations of WE and FB were in the range of 0.1~10 mg/mL, the corresponding cell viability was higher than 80% of the control group within 24 h. Furthermore, in the concentration range of 0.1~8 mg/mL, the cell viability for the FB was higher than 90% of the control group, indicating no significant cytotoxicity. In particular, when the concentration of the FB was in the lower range of 0.1~2 mg/mL, the cell viability for the FB was above 100% compared with the control group, indicating FB can promote the growth of HaCaT cells in low concentrations. The higher the dose of WE or FB, the more cytotoxicity was observed, since the cell viability decreased to 60.64% ± 8.83% (p < 0.001) and 81.56% ± 3.15% (p < 0.05) following the exposure to 20 mg/mL of WE and FB, respectively. We obviously found that, at the same concentration, the cell viability of the FB was lower than that of the WE, indicating that FB is milder to the HaCaT cells. It was reported that Lactobacillus fermentation has the ability to reduce the cytotoxicity of the fermentation substrates [46]. Microorganisms can decompose toxic substances or modify their toxic components to reduce or eliminate their toxicity [47]. A variety of plant extracts and FB were reported to promote the growth of cells [48] due to the rich bioactive substances, with small molecule produced in the process of plant growth and development, such as flavonoids, tannins and alkaloids [49].
To confirm a suitable concentration for the H2O2-induced injury model in vitro, nominal concentrations of H2O2 (50–800 μM) exposed to HaCaT cells were measured by the CCK-8 assay [50]. As shown in Figure 5b, the viability of the HaCaT cells was dose-dependently decreased and the concentration of 400 μM H2O2 caused about 50% cell mortality. As Zhang et al. [50] reported, at the concentration of 50% cell mortality, the ROS level was high, and the cells received appropriate damage. Therefore, 400 μM H2O2 was selected as the optimal cell injury concentration for all the subsequent experiments.
The results showed that, before the H2O2 treatment, the HaCaT cells were cultured in 8, 6, 4 and 2 mg/mL of WE and FB and then treated with 400 μM of H2O2 [50]. As shown in Figure 5c, the pretreatment of HaCaT cells with FB and WE in the range of 2~8 mg/mL increased the cell viability in different degrees compared with the control group. Among them, the cell viabilities of the FB pretreatment groups (2, 4, 6 and 8 mg/mL) significantly increased from 52.97% ± 3.06% in the injury group to 58.36% ± 3.37% (p < 0.05), 73.22% ± 2.79% (p < 0.001), 85.01% ± 2.85% (p < 0.001) and 92.03% ± 2.42% (p < 0.001), respectively. The FB pretreatment at 6 or 8 mg/mL yielded superior protective effects in contrast with 2 μg/mL of the VC treatment group (71.82% ± 1.60%, p < 0.001). Hseu et al. [51] reported that the ellagic acid treatment significantly inhibited the UVA-induced oxidative stress and apoptosis of HaCaT cells. R. Ahangari’s research proved that ellagic acid can protect cardiomyocytes from oxidative damage [52]. Hou et al. [53] reported the protecting effect of deoxyschisandrin and schisandrin b on HaCaT cells against UVB-induced damage. A study on the total flavonoids extract from Hedyotis diffusa found that flavonoids can protect cells by reducing the level of ROS in cells [54]. Therefore, in this case, the ellagic acid, lignans and flavonoids in the FB may positively contribute to the protection of HaCaT cells against the oxidative damage induced by H2O2.

2.6. Effect of FB and WE on ROS Level in HaCaT Cells Treated with H2O2

H2O2 can stimulate the production of ROS in HaCaT cells, resulting in an oxidative stress response and triggering the activation and apoptosis of various signaling pathways in HaCaT cells [55]. As shown in Figure 6, the fluorescence intensity of the H2O2-stimulated injury group (294.49% ± 11.54%, p < 0.001) was significantly higher than that of the control group, indicating that H2O2 has a great influence on the level of intracellular ROS. The addition of VC effectively inhibited the production of ROS (201.63% ± 8.88%, p < 0.001) and protected the cells. However, the levels of ROS in the HaCaT cells pretreated with different concentrations (1, 2, 4, 6 and 8 mg/mL) of WE and FB were lower than those pretreated with H2O2.
Especially when the concentrations of WE and FB were 8 mg/mL (WE: 163.15% ± 9.13%, p < 0.001; FB: 125.94% ± 13.46%, p < 0.001) or 6 mg/mL (WE: 187.85% ± 10.33%, p < 0.001, FB: 165.92% ± 7.4%, p < 0.001), the levels of intracellular ROS were lower than that of the VC group. The FB can effectively reduce the ROS levels in HaCaT cells induced by H2O2 so that FB has good cell protection against oxidative damage in the range of 4~8 mg/mL. A study showed that ellagic acid extracted from the leaves of Clerodendrum viscosum can inhibit the production of excessive ROS [56]. Similarly, Sepand’s [57] study also confirmed that ellagic acid can improve lipid peroxidation in renal tissue and protect the mitochondria from Gentamicin-induced mitochondrial damage by reducing the ROS content in the mitochondria.

3. Materials and Methods

3.1. Experimental Materials and Chemical Reagents

Pomegranate was sold as Tunisia soft-seed pomegranate, and Schisandra chinensis was sold as north Schisandra chinensis of Changbai Mountain by Tongrentang. In the pre-experiment, we found that the mixed extraction of Schisandra chinensis and pomegranate peel could increase the content of ellagic acid in the extract. Rinse pomegranates with water, cut them into thick slices with a knife and freeze them, then put frozen pomegranate peels into a vacuum freeze-drying machine (TF-FD-1, Tuoyuan, Shanghai, China) for freeze-drying. Wait until the pomegranates are crisp flakes, and then, the artificial skins are separated, and the pomegranates are collected and crushed into yellow powder by a shredder. Wash and dry Schisandra chinensis, crush into dark-red granules with a pulverizer, sift through 50 mesh, dry again, seal and refrigerate for use.
The chemical reagents used are as follows: NaOH, 2,2-diphenyl-1-picrylhydrazyl, H2SO4, NaNO2, Al(NO3)3, ABTS, ellagic acid standard, schisandrin B standard, analytical pure glucose powder, CCK-8 assay, DMEM, FBS, DPBS, DCFH-DA, anhydrous ethanol, methanol, chromic acid and other reagents, all purchased from MACKLIN (Shanghai, China), and the purity and manufacturer’s information can be seen in Supplementary Materials, Table S1. HaCaT cells were purchased from the Shanghai Cell Bank of the Chinese Academy of Sciences.

3.2. Preparation of FB

Accurately weigh pomegranate peel powder and Schisandra chinensis powder, each 2.5 g in a conical flask, add in 6 g of glucose and 100 mL of distilled water, put the sealed powder into a high-pressure sterilizer (DSX-280B, Shen’an, Shanghai, China) for 30 min, remove and place in an ultra-clean working table (BHC-1300B2, AIRTECH, Hsinchu County, Taiwan) and cool to room temperature, add in 0.5 mL each of Lactobacillus Plantarum and Streptococcus Thermophilus, put into a shaking table and culture at 37 °C for 24 h. A high-speed refrigerated centrifuge (TGL-16M, Luxiangyi, Shanghai, China) was used to treat the FB to get the aimed fermentation liquid.

3.3. Determination of Ellagic Acid in the FB

In this study, ellagic acid was measured by an ultraviolet spectrophotometer (ALPHA-1860, Puyuan, Shanghai, China). The content of ellagic acid was determined by referring to Liu’s experimental method and making improvements [58].

3.4. Determination of Antioxidant Activity

In this study, the DPPH radical scavenging rate was measured by an ultraviolet spectrophotometer [59]. In this experiment, DPPH was a major antioxidant index. At the same time, other antioxidant indices, such as ABTS+ [60], OH [61] and O2 [62], were determined to confirm the strength of the antioxidant activity.

3.5. Characterization of Ellagic Acid by HPLC

The instrument used in this experiment was the Agilent 1260 high-performance liquid chromatography system (Agilent Technologies Inc, Walter Bloom Germany). Chromatographic conditions: C18 column; mobile phase: acetonitrile (a): 0.1% phosphoric acid and (b) (18:82), flow rate: 1 mL/min, column temperature: 25 °C, detection wavelength: 254 nm and injection volume: 20 μL. Column specifications: 5-μm Eclipse Plus C18 column (Agilent, Santa Clara, CA, USA); The HPLC separation type: gradient mode; 0.025 mg/mL of ellagic acid standard solution was prepared with the HPLC grade methanol. The WE and FB were made into freeze-dried powder, and then, the mixture was made into 10 mg/mL solution.

3.6. Effects of FB, WE and H2O2 on the Activity of HaCaT Cells

The activity of the HaCaT cells was determined by the CCK-8 assay. The HaCaT cells were cultured in DMEM medium containing 10% fetal bovine serum. The cells were seeded in 96-well plates according to the density of 8000 per well. Then, the plates were placed into the carbon dioxide incubator at 37 °C and 5% CO2, and the CCK-8 assay was added [63]. After incubation for 4 h, the optical density (OD) value was measured at the wavelength of 450 nm by the enzyme reader, which was expressed as the percentage of HaCaT cell activity in the control group [64].
To determine the nominal concentration of the H2O2-induced oxidative damage model in vitro, the HaCaT cells were treated with a nominal concentration of H2O2 (50, 100, 200, 300, 400, 500, 600, 700 and 800 μM) for 2 h [65], and then, the cell survival rate was detected by the CCK-8 assay.
The WE and FB with the same concentrations were filtered by a 220-nm microporous membrane, and the two were prepared into a mixed medium with a concentration of 10, 8, 6, 4, 2, 1, 0.5 and 0.1 mg/mL by using a complete medium. To explore the oxidative protection, HaCaT cells were pretreated with a mixed medium for 24 h before oxidative damage [66] and then exposed to the optimal concentration of hydrogen peroxide After 2 h, the CCK-8 assay was used to determine the cell activity.

3.7. Effects of FB and WE on the ROS Level in HaCaT Cells Treated with H2O2

The level of ROS in the HaCaT cells was detected by a fluorescent probe DCFH-DA. The cells were seeded according to the density of 8000 per well. After 24 h of culture in the mixed medium of 8, 6, 4 and 2 mg/mL, the cells were stimulated with 400 μM H2O2 for 2 h, and then, the DCFH-DA fluorescent probe was added [67]. After 20 min of incubation in the incubator, the cells were washed with DMEM medium, and then, the fluorescence intensity was detected in the fluorescence enzyme reader. The emission wavelength was 488 nm, and the excitation wavelength was 525 nm [68].

3.8. Experimental Design and Statistical Analysis

Design-Expert software 7.0 was used for the experimental design. The accuracy of the polynomial model equation was checked by the F-test and p-value. Statistically significant: p < 0.05. All measurements were taken three times. Origin 2018 (Softonic International, Barcelona, Spain) data processing software was used for data processing and analysis.

4. Conclusions

In the paper, the RSM coupled with Box-Behnken design was applied successfully to optimize the fermentation process of pomegranate peels and Schisandra chinensis. In this work, three factors were evaluated. The optimized condition was obtained and verified with the experimental value. The lactobacillus fermentation more effectively released ellagic acid compared to the water extraction, which was further verified by the application of HPLC to quantify the ellagic acid. The FB showed stronger free radical scavenging abilities against the ABTS+, DPPH, OH and O2 free radicals. Under the concentration without cytotoxicity, both the FB and WE had protective effects on the H2O2-injured HaCaT cells, and the FB showed a stronger cell-protective effect. This paper provided the data support for the preparation technology and bioactivity for the FB of PP&SC. The efficient preparation process, outstanding antioxidant ability and protective effect against H2O2-induced oxidative damage in HaCaT Cells could promote the application of the FB of PP&SC as functional raw materials of cosmetics.

Supplementary Materials

The following are available online. Table S1: Reagent information.

Author Contributions

Conceptualization, H.-M.L. and P.-F.X.; methodology, H.-M.L. and P.-F.X.; software, P.-F.X. and M.-Y.C.; validation, H.-M.L. and Q.-L.L.; formal analysis, P.-F.X. and W.W.; investigation, H.-M.L.; resources, W.W. and H.-M.L.; data curation, P.-F.X.; writing—original draft preparation, P.-F.X.; writing—review and editing, P.-F.X. and H.-M.L.; visualization, S.-N.L.; supervision, W.W.; project administration, W.W. and H.-M.L. and funding acquisition, W.W. and H.-M.L. All authors have read and agreed to the published version of the manuscript.

Funding

This research was funded by the Shanghai Alliance Program (LM201941).

Institutional Review Board Statement

Not applicable.

Informed Consent Statement

Not applicable.

Data Availability Statement

Not applicable.

Conflicts of Interest

The authors declare no conflict of interest.

Sample Availability

Samples of the fermentation broth and water extracts are available from the authors.

References

  1. Castro-Giráldez, M.; Fito, P.; Ortolá, M.D.O.; Balaguer, N. Study of pomegranate ripening by dielectric spectroscopy. Postharvest Biol. Technol. 2013, 86, 346–353. [Google Scholar] [CrossRef]
  2. Li, X.; Liu, L.; Pischetsrieder, M. Pomegranate (Punica granatum L.) wine polyphenols affect Nrf2 activation and antioxidant enzyme expression in human neuroblastoma cells (SH-SY5Y). J. Funct. Foods 2017, 38, 140–150. [Google Scholar] [CrossRef]
  3. Yoshime, L.T.; De Melo, I.L.P.; Sattler, J.A.G.; Torres, R.P.; Mancini-Filho, J. Bioactive compounds and the antioxidant capacities of seed oils from pomegranate (Punica granatum L.) and bitter gourd (Momordica charantia L.). Food Sci. Technol. 2019, 39, 571–580. [Google Scholar] [CrossRef] [Green Version]
  4. Ambigaipalan, P.; de Camargo, A.C.; Shahidi, F. Phenolic Compounds of Pomegranate Byproducts (Outer Skin, Mesocarp, Divider Membrane) and Their Antioxidant Activities. J. Agric. Food Chem. 2016, 64, 6584–6604. [Google Scholar] [CrossRef]
  5. Kang, S.; Choi, B.; Kim, S.; Yi, H.; Park, H.; Park, S.; Song, C.; Park, J.; Lee, Y.; Ku, S. Inhibitory effects of Pomegranate concentrated solution on the activities of Hyaluronidase, Tyrosinase, and Metalloproteinase 1. Clin. Ther. 2015, 37, e118. [Google Scholar] [CrossRef]
  6. Ordoudi, S.A.; Mantzouridou, F.; Daftsiou, E.; Malo, C.; Hatzidimitriou, E.; Nenadis, N.; Tsimidou, M. Pomegranate juice functional constituents after alcoholic and acetic acid fermentation. J. Funct. Foods 2014, 8, 161–168. [Google Scholar] [CrossRef]
  7. Natalello, A.; Hervás, G.; Toral, P.G.; Luciano, G.; Valenti, B.; Mendoza, A.G.; Pauselli, M.; Priolo, A.; Frutos, P. Bioactive compounds from pomegranate by-products increase the in vitro ruminal accumulation of potentially health promoting fatty acids. Anim. Feed. Sci. Technol. 2020, 259, 114355. [Google Scholar] [CrossRef]
  8. Lekshmi, R.; Nisha, S.A.; Kaleeswaran, B.; Alfarhan, A. Pomegranate peel is a low-cost substrate for the production of tannase by Bacillus velezensis TA3 under solid state fermentation. J. King Saud Univ. Sci. 2020, 32, 1831–1837. [Google Scholar] [CrossRef]
  9. Giamogante, F.; Marrocco, I.; Cervoni, L.; Eufemi, M.; Chichiarelli, S.; Altieri, F. Punicalagin, an active pomegranate component, is a new inhibitor of PDIA3 reductase activity. Biochimie 2018, 147, 122–129. [Google Scholar] [CrossRef]
  10. Wang, P.; Zhang, Q.; Hou, H.; Liu, Z.; Wang, L.; Rasekhmagham, R.; Kord-Varkaneh, H.; Santos, H.O.; Yao, G. The effects of pomegranate supplementation on biomarkers of inflammation and endothelial dysfunction: A meta-analysis and systematic review. Complement. Ther. Med. 2020, 49, 102358. [Google Scholar] [CrossRef]
  11. Amor, A.J.; Gómez-Guerrero, C.; Ortega, E.; Sala-Vila, A.; Lázaro, I. Ellagic Acid as a Tool to Limit the Diabetes Burden: Updated Evidence. Antioxidants 2020, 9, 1226. [Google Scholar] [CrossRef] [PubMed]
  12. Szopa, A.; Klimek-Szczykutowicz, M.; Kokotkiewicz, A.; Dziurka, M.; Luczkiewicz, M.; Ekiert, H. Phenolic acid and flavonoid production in agar, agitated and bioreactor-grown microshoot cultures of Schisandra chinensis cv. Sadova No. 1—A valuable medicinal plant. J. Biotechnol. 2019, 305, 61–70. [Google Scholar] [CrossRef]
  13. Sobstyl, E.; Szopa, A.; Ekiert, H.; Gnat, S.; Typek, R.; Choma, I.M. Effect directed analysis and TLC screening of Schisandra chinensis fruits. J. Chromatogr. A 2020, 1618, 460942. [Google Scholar] [CrossRef] [PubMed]
  14. Zhai, J.; Zhang, F.; Gao, S.; Chen, L.; Feng, G.; Yin, J.; Chen, W. Schisandra chinensis extract decreases chloroacetaldehyde production in rats and attenuates cyclophosphamide toxicity in liver, kidney and brain. J. Ethnopharmacol. 2018, 210, 223–231. [Google Scholar] [CrossRef] [PubMed]
  15. Song, Y.; Shan, B.; Zeng, S.; Zhang, J.; Jin, C.; Liao, Z.; Wang, T.; Zeng, Q.; He, H.; Wei, F.; et al. Raw and wine processed Schisandra chinensis attenuate anxiety like behavior via modulating gut microbiota and lipid metabolism pathway. J. Ethnopharmacol. 2021, 266, 113426. [Google Scholar] [CrossRef]
  16. Bae, S.J.; Kim, J.E.; Choi, Y.J.; Lee, S.J.; Gong, J.E.; Choi, Y.-W.; Hwang, D.Y. Novel Function of α-Cubebenoate Derived from Schisandra chinensis as Lipogenesis Inhibitor, Lipolysis Stimulator and Inflammasome Suppressor. Molecules 2020, 25, 4995. [Google Scholar] [CrossRef]
  17. Lee, S.; Chun, J.; Lee, H.-J.; Park, H.; So, I.; Jeon, J.-H.; Park, E.-J. Transcriptome Analysis of the Anti-TGFβ Effect of Schisandra chinensis Fruit Extract and Schisandrin B in A7r5 Vascular Smooth Muscle Cells. Life 2021, 11, 163. [Google Scholar] [CrossRef] [PubMed]
  18. Zhang, Y.-H.; Zhao, Z.-Y.; Wang, B.-J.; Zhang, Y.-Q.; Zhang, M.; Gao, Y.-Y. Protective effect of Schisandra chinensis lignans on hypoxia-induced PC12 cells and signal transduction. J. Toxicol. Environ. Health Part A 2018, 81, 1224–1230. [Google Scholar] [CrossRef]
  19. Mapelli-Brahm, P.; Barba, F.J.; Remize, F.; Garcia, C.; Fessard, A.; Khaneghah, A.M.; Sant’Ana, A.S.; Lorenzo, J.M.; Montesano, D.; Meléndez-Martínez, A.J. The impact of fermentation processes on the production, retention and bioavailability of carotenoids: An overview. Trends Food Sci. Technol. 2020, 99, 389–401. [Google Scholar] [CrossRef]
  20. Palmieri, M.G.S.; Cruz, L.T.; Bertges, F.S.; Húngaro, H.M.; Batista, L.R.; da Silva, S.S.; Fonseca, M.J.V.; Rodarte, M.P.; Vilela, F.M.P.; Amaral, M.D.P.H.D. Enhancement of antioxidant properties from green coffee as promising ingredient for food and cosmetic industries. Biocatal. Agric. Biotechnol. 2018, 16, 43–48. [Google Scholar] [CrossRef]
  21. Xu, N.; Marchionni, K.; Hu, Y.; Zhang, W.; Sosic, Z. Quantitative analysis of a biopharmaceutical protein in cell culture samples using automated capillary electrophoresis (CE) western blot. J. Pharm. Biomed. Anal. 2017, 145, 10–15. [Google Scholar] [CrossRef]
  22. Aslani, A.; Mazzuca-Sobczuk, T.; Eivazi, S.; Bekhrad, K. Analysis of bioenergy technologies development based on life cycle and adaptation trends. Renew. Energy 2018, 127, 1076–1086. [Google Scholar] [CrossRef]
  23. Balwani, I.; Chakravarty, K.; Gaur, S. Role of phytase producing microorganisms towards agricultural sustainability. Biocatal. Agric. Biotechnol. 2017, 12, 23–29. [Google Scholar] [CrossRef]
  24. Viji, R.; Shrinithivihahshini, N.D.; Santhanam, P.; Balakrishnan, S.; Yi, Y.; Rajivgandhi, G. Biomonitoring of the environmental indicator and pathogenic microorganisms assortment in foremost pilgrimage beaches of the Bay of Bengal, Southeast coast, India. Mar. Pollut. Bull. 2019, 149, 110548. [Google Scholar] [CrossRef]
  25. Szutowska, J. Functional properties of lactic acid bacteria in fermented fruit and vegetable juices: A systematic literature review. Eur. Food Res. Technol. 2020, 246, 357–372. [Google Scholar] [CrossRef]
  26. Verotta, L.; Panzella, L.; Antenucci, S.; Calvenzani, V.; Tomay, F.; Petroni, K.; Caneva, E.; Napolitano, A. Fermented pomegranate wastes as sustainable source of ellagic acid: Antioxidant properties, anti-inflammatory action, and controlled release under simulated digestion conditions. Food Chem. 2018, 246, 129–136. [Google Scholar] [CrossRef]
  27. Wang, C.; Zhang, J.; Hu, F.; Zhang, S.; Lu, J.; Liu, S. Bio-pretreatment promote hydrolysis and acidification of oilseed rape straw: Roles of fermentation broth and micro-oxygen. Bioresour. Technol. 2020, 308, 123272. [Google Scholar] [CrossRef] [PubMed]
  28. Walters, N.A.; de Villiers, A.; Joubert, E.; de Beer, D. Improved HPLC method for rooibos phenolics targeting changes due to fermentation. J. Food Compos. Anal. 2017, 55, 20–29. [Google Scholar] [CrossRef]
  29. Medjekal, S.; Bodas, R.; Bousseboua, H.; López, S. Evaluation of three medicinal plants for methane production potential, fiber digestion and rumen fermentation in vitro. Energy Procedia 2017, 119, 632–641. [Google Scholar] [CrossRef]
  30. Morone, J.; Alfeus, A.; Vasconcelos, V.; Martins, R. Revealing the potential of cyanobacteria in cosmetics and cosmeceuticals—A new bioactive approach. Algal Res. 2019, 41, 101541. [Google Scholar] [CrossRef]
  31. Rashki, M.; Azarkish, H.; Rostamian, M.; Bahrpeyma, A. Classification correction of polynomial response surface methods for accurate reliability estimation. Struct. Saf. 2019, 81, 101869. [Google Scholar] [CrossRef]
  32. Yu, M.; Wang, B.; Qi, Z.; Xin, G.; Li, W. Response surface method was used to optimize the ultrasonic assisted extraction of flavonoids from Crinum asiaticum. Saudi J. Biol. Sci. 2019, 26, 2079–2084. [Google Scholar] [CrossRef] [PubMed]
  33. Logarušić, M.; Slivac, I.; Radošević, K.; Bagović, M.; Redovnikovic, I.R.; Srček, V.G. Hempseed protein hydrolysates’ effects on the proliferation and induced oxidative stress in normal and cancer cell lines. Mol. Biol. Rep. 2019, 46, 6079–6085. [Google Scholar] [CrossRef] [PubMed]
  34. Shin, D.; Lee, Y.; Huang, Y.-H.; Lim, H.-W.; Jang, K.; Kim, D.-D.; Lim, C.-J. Probiotic fermentation augments the skin anti-photoaging properties of Agastache rugosa through up-regulating antioxidant components in UV-B-irradiated HaCaT keratinocytes. BMC Complement. Altern. Med. 2018, 18, 196. [Google Scholar] [CrossRef]
  35. Xiao, X.; He, Y.; Li, C.; Zhang, X.; Xu, H.; Wang, B. Nicastrin mutations in familial acne inversa impact keratinocyte proliferation and differentiation through the Notch and phosphoinositide 3-kinase/AKT signalling pathways. Br. J. Dermatol. 2016, 174, 522–532. [Google Scholar] [CrossRef]
  36. Choi, M.; Park, M.; Lee, S.; Lee, J.W.; Choi, W.J.; Lee, C. Establishment of Nrf2-deficient HaCaT and immortalized primary human foreskin keratinocytes and characterization of their responses to ROS-induced cytotoxicity. Toxicol. Vitr. 2019, 61, 104602. [Google Scholar] [CrossRef] [PubMed]
  37. Gao, J.; Guo, J.; Nong, Y.; Mo, W.; Fang, H.; Mi, J.; Qi, Q.; Yang, M. 18β-Glycyrrhetinic acid induces human HaCaT keratinocytes apoptosis through ROS-mediated PI3K-Akt signaling pathway and ameliorates IMQ-induced psoriasis-like skin lesions in mice. BMC Pharmacol. Toxicol. 2020, 21, 1–11. [Google Scholar] [CrossRef]
  38. Masci, A.; Coccia, A.; Lendaro, E.; Mosca, L.; Paolicelli, P.; Cesa, S. Evaluation of different extraction methods from pomegranate whole fruit or peels and the antioxidant and antiproliferative activity of the polyphenolic fraction. Food Chem. 2016, 202, 59–69. [Google Scholar] [CrossRef]
  39. Tabaraki, R.; Heidarizadi, E. Simultaneous biosorption of Arsenic (III) and Arsenic (V): Application of multiple response optimizations. Ecotoxicol. Environ. Saf. 2018, 166, 35–41. [Google Scholar] [CrossRef]
  40. Milessi, T.S.; Aquino, P.M.; Silva, C.R.; Moraes, G.S.; Zangirolami, T.C.; Giordano, R.C.; Giordano, R.L. Influence of key variables on the simultaneous isomerization and fermentation (SIF) of xylose by a native Saccharomyces cerevisiae strain co-encapsulated with xylose isomerase for 2G ethanol production. Biomass. Bioenergy 2018, 119, 277–283. [Google Scholar] [CrossRef]
  41. Lu, H.; Guo, L.; Zhang, L.; Xie, C.; Li, W.; Gu, B.; Li, K. Study on quality characteristics of cassava flour and cassava flour short biscuits. Food Sci. Nutr. 2020, 8, 521–533. [Google Scholar] [CrossRef] [Green Version]
  42. Stavropoulou, D.A.; Filippou, P.; De Smet, S.; De Vuyst, L.; Leroy, F. Effect of temperature and pH on the community dynamics of coagulase-negative staphylococci during spontaneous meat fermentation in a model system. Food Microbiol. 2018, 76, 180–188. [Google Scholar] [CrossRef]
  43. Kumari, A.; Bhawal, S.; Kapila, S.; Yadav, H.; Kapila, R. Health-promoting role of dietary bioactive compounds through epigenetic modulations: A novel prophylactic and therapeutic approach. Crit. Rev. Food Sci. Nutr. 2020, 1–21. [Google Scholar] [CrossRef]
  44. Santini, T.C.; Peng, Y.G. Microbial Fermentation of Organic Carbon Substrates Drives Rapid pH Neutralization and Element Removal in Bauxite Residue Leachate. Environ. Sci. Technol. 2017, 51, 12592–12601. [Google Scholar] [CrossRef] [PubMed]
  45. Rahmani, R.; Beaufort, S.; Villarreal-Soto, S.A.; Taillandier, P.; Bouajila, J.; Debouba, M. Kombucha fermentation of African mustard (Brassica tournefortii) leaves: Chemical composition and bioactivity. Food Biosci. 2019, 30, 100414. [Google Scholar] [CrossRef] [Green Version]
  46. Wei, C.; Yu, L.; Qiao, N.; Wang, S.; Tian, F.; Zhao, J.; Zhang, H.; Zhai, Q.; Chen, W. The characteristics of patulin detoxification by Lactobacillus plantarum 13M5. Food Chem. Toxicol. 2020, 146, 111787. [Google Scholar] [CrossRef]
  47. Vashi, H.; Iorhemen, O.; Tay, J. Degradation of industrial tannin and lignin from pulp mill effluent by aerobic granular sludge technology. J. Water Process. Eng. 2018, 26, 38–45. [Google Scholar] [CrossRef]
  48. Suraiya, S.; Lee, J.M.; Cho, H.J.; Jang, W.J.; Kim, D.-G.; Kim, Y.-O.; Kong, I.-S. Monascus spp. fermented brown seaweeds extracts enhance bio-functional activities. Food Biosci. 2018, 21, 90–99. [Google Scholar] [CrossRef]
  49. Mohammadipanah, F.; Momenilandi, M. Potential of rare actinomycetes in the production of metabolites against multiple oxidant agents. Pharm. Biol. 2017, 56, 51–59. [Google Scholar] [CrossRef] [PubMed]
  50. Zhang, J.; Wang, W.; Mao, X. Chitopentaose protects HaCaT cells against H2O2-induced oxidative damage through modulating MAPKs and Nrf2/ARE signaling pathways. J. Funct. Foods 2020, 72, 104086. [Google Scholar] [CrossRef]
  51. Hseu, Y.-C.; Chou, C.-W.; Kumar, K.S.; Fu, K.-T.; Wang, H.-M.; Hsu, L.-S.; Kuo, Y.-H.; Wu, C.-R.; Chen, S.-C.; Yang, H.-L. Ellagic acid protects human keratinocyte (HaCaT) cells against UVA-induced oxidative stress and apoptosis through the upregulation of the HO-1 and Nrf-2 antioxidant genes. Food Chem. Toxicol. 2012, 50, 1245–1255. [Google Scholar] [CrossRef]
  52. Ahangari, R.; Khezri, S.; Jahedsani, A.; Bakhshii, S.; Salimi, A. Ellagic acid alleviates clozapine-induced oxidative stress and mitochondrial dysfunction in cardiomyocytes. Drug Chem. Toxicol. 2020, 1–9. [Google Scholar] [CrossRef] [PubMed]
  53. Hou, W.; Gao, W.; Wang, D.; Liu, Q.; Zheng, S.; Wang, Y. The Protecting Effect of Deoxyschisandrin and Schisandrin B on HaCaT Cells against UVB-Induced Damage. PLoS ONE 2015, 10, e0127177. [Google Scholar] [CrossRef] [Green Version]
  54. Li, Y.; Chen, X.; Niu, S.; Zhou, H.; Li, Q. Protective Antioxidant Effects of Amentoflavone and Total Flavonoids from Hedyotis diffusa on H2O2 -Induced HL-O2 Cells through ASK1/p38 MAPK Pathway. Chem. Biodivers. 2020, 17. [Google Scholar] [CrossRef]
  55. Chang, T.-M.; Tsen, J.-H.; Yen, H.; Yang, T.-Y.; Huang, H.-C. Extract fromPeriostracum cicadaeInhibits Oxidative Stress and Inflammation Induced by Ultraviolet B Irradiation on HaCaT Keratinocytes. Evid. Based Complement. Altern. Med. 2017, 2017, 1–12. [Google Scholar] [CrossRef] [Green Version]
  56. Shendge, A.K.; Basu, T.; Panja, S.; Chaudhuri, D.; Mandal, N. An ellagic acid isolated from Clerodendrum viscosum leaves ameliorates iron-overload induced hepatotoxicity in Swiss albino mice through inhibition of oxidative stress and the apoptotic pathway. Biomed. Pharmacother. 2018, 106, 454–465. [Google Scholar] [CrossRef]
  57. Sepand, M.R.; Ghahremani, M.H.; Razavi-Azarkhiavi, K.; Aghsami, M.; Rajabi, J.; Keshavarz-Bahaghighat, H.; Soodi, M. Ellagic acid confers protection against gentamicin-induced oxidative damage, mitochondrial dysfunction and apoptosis-related nephrotoxicity. J. Pharm. Pharmacol. 2016, 68, 1222–1232. [Google Scholar] [CrossRef]
  58. Liu, Y.; Liu, Y.; Liu, Y.; Liu, H.; Shang, Y. Evaluating effects of ellagic acid on the quality of kumquat fruits during storage. Sci. Hortic. 2018, 227, 244–254. [Google Scholar] [CrossRef]
  59. Nagamallu, R.; Srinivasan, B.; Ningappa, M.B.; Kariyappa, A.K. Synthesis of novel coumarin appended bis(formylpyrazole) derivatives: Studies on their antimicrobial and antioxidant activities. Bioorg. Med. Chem. Lett. 2016, 26, 690–694. [Google Scholar] [CrossRef] [PubMed]
  60. Hernández-Ruiz, K.L.; Ruiz-Cruz, S.; Cira-Chávez, L.A.; Gassos-Ortega, L.E.; Ornelas-Paz, J.D.J.; Del-Toro-Sánchez, C.L.; Márquez-Ríos, E.; López-Mata, M.A.; Rodríguez-Félix, F. Evaluation of Antioxidant Capacity, Protective Effect on Human Erythrocytes and Phenolic Compound Identification in Two Varieties of Plum Fruit (Spondias spp.) by UPLC-MS. Molecules 2018, 23, 3200. [Google Scholar] [CrossRef] [PubMed] [Green Version]
  61. Ruan, X.; Liu, Y.; Wang, G.; Frost, R.L.; Qian, G.; Tsang, D.C. Transformation of functional groups and environmentally persistent free radicals in hydrothermal carbonisation of lignin. Bioresour. Technol. 2018, 270, 223–229. [Google Scholar] [CrossRef] [PubMed]
  62. Dai, C.-Y.; Liao, P.-R.; Zhao, M.-Z.; Gong, C.; Dang, Y.; Qu, Y.; Qiu, L.-S. Optimization of Ultrasonic Flavonoid Extraction from Saussurea involucrate, and the Ability of Flavonoids to Block Melanin Deposition in Human Melanocytes. Molecules 2020, 25, 313. [Google Scholar] [CrossRef] [Green Version]
  63. Mackei, M.; Vörösházi, J.; Sebők, C.; Neogrády, Z.; Mátis, G.; Jerzsele, Á. Fermented Wheat Germ Extract as a Redox Modulator: Alleviating Endotoxin-Triggered Oxidative Stress in Primary Cultured Rat Hepatocytes. Oxidative Med. Cell. Longev. 2020, 2020, 1–9. [Google Scholar] [CrossRef]
  64. Xie, X.; Dai, H.; Zhuang, B.; Chai, L.; Xie, Y.; Li, Y. Exogenous hydrogen sulfide promotes cell proliferation and differentiation by modulating autophagy in human keratinocytes. Biochem. Biophys. Res. Commun. 2016, 472, 437–443. [Google Scholar] [CrossRef] [PubMed]
  65. Xie, Y.; Guo, Y.; Cao, S.; Xue, M.; Fan, Z.; Gao, C.; Jin, B. Hydroxysafflor Yellow A Attenuates Hydrogen Peroxide-Induced Oxidative Damage on Human Umbilical Vein Endothelial Cells. Evid. Based Complement. Altern. Med. 2020, 2020, 1–8. [Google Scholar] [CrossRef]
  66. Acito, M.; Bartolini, D.; Ceccarini, M.R.; Russo, C.; Vannini, S.; Dominici, L.; Codini, M.; Villarini, M.; Galli, F.; Beccari, T.; et al. Imbalance in the antioxidant defence system and pro-genotoxic status induced by high glucose concentrations: In vitro testing in human liver cells. Toxicol. In Vitro 2020, 69, 105001. [Google Scholar] [CrossRef] [PubMed]
  67. Jaisin, Y.; Ratanachamnong, P.; Wongsawattkul, O.; Watthammawut, A.; Malaniyom, K.; Natewong, S. Antioxidant and anti-inflammatory effects of piperine on UV-B-irradiated human HaCaT keratinocyte cells. Life Sci. 2020, 263, 118607. [Google Scholar] [CrossRef] [PubMed]
  68. Trajčíková, E.; Kurin, E.; Slobodníková, L.; Straka, M.; Lichváriková, A.; Dokupilová, S.; Čičová, I.; Nagy, M.; Mučaji, P.; Fialová, S.B. Antimicrobial and Antioxidant Properties of Four Lycopus Taxa and an Interaction Study of Their Major Compounds. Molecules 2020, 25, 1422. [Google Scholar] [CrossRef] [Green Version]
Figure 1. The influence of each single factor on the content of ellagic Acid in FB. (a) Fermentation time (h), (b) fermentation temperature (°C), (c) strain dosage (v:v), (d) glucose dosage (g/100 mL) and (e) solid–liquid ratio (w:v). Molecules 26 03432 i001 Content of ellagic acid. Data shown as the mean ± S.D. (n = 5).
Molecules 26 03432 g001aMolecules 26 03432 g001b
Figure 2. Response surface plots: (a) glucose dosage and fermentation time on the ellagic acid content, (b) glucose dosage and fermentation temperature on the ellagic acid content and (c) fermentation time and fermentation temperature on the ellagic acid content.
Molecules 26 03432 g002aMolecules 26 03432 g002b
Figure 3. HPLC chromatograms of ellagic acid. (a) Ellagic acid standard, (b) ellagic acid in WE and (c) ellagic acid in FB.
Molecules 26 03432 g003aMolecules 26 03432 g003b
Figure 4. Antioxidant ability of the WE and FB. Significance: *** p < 0.001 vs. WE-treated group. Data shown as the mean ± S.D. (n = 3).
Molecules 26 03432 g004
Figure 5. Effects of WE and FB on H2O2-introduced HaCaT cells damage. (a) Cytotoxicity of WE and FB on HaCaT cells. The HaCaT cells were cultured for 24 h with the WE and FB of 20, 10, 8, 6, 4, 2, 1, 0.5 and 0.1 mg/mL, and then, the cell viability was measured by a CCK-8 assay. Significance: *** p < 0.001 and * p < 0.05 vs. the control group. (b) Cytotoxicity of different concentrations of H2O2 on HaCaT cells. The HaCaT cells were cultured in complete medium for 24 h and then stimulated with different concentrations (50, 100, 200, 300, 400, 500, 600, 700 and 800 μM) of H2O2 for 2 h, and then, the cell viability was measured by the CCK-8 assay. Significance: *** p < 0.001, ** p < 0.01 and * p < 0.05 vs. the control group. (c) Cytotoxicity of the WE and FB on 400 μM H2O2-introduced HaCaT cell damage. The cells were cultured with different concentrations (8, 6, 4 and 2 mg/mL) of WE and FB for 24 h and then stimulated by 400 μM H2O2 for 2 h, and then, the cell viability was measured by the CCK-8 assay. In the picture: VC stands for Vitamin C, and the concentration is 2 μg/mL. Significance: ### p < 0.001 vs. the control group. *** p < 0.001, ** p < 0.01 and * p < 0.05 vs. the H2O2-treated group. Data shown as the mean ± S.D. (n = 5).
Molecules 26 03432 g005
Figure 6. Effects of the WE and FB on H2O2-introduced ROS production in HaCaT cells. The cells were cultured with different concentrations (8, 6, 4, 2 and 1 mg/mL) of WE and FB for 24 h and then stimulated by 400 μM of H2O2 for 2 h. The ROS content was detected by DCFH-DA and examined by a fluorescence enzyme reader. In the picture: VC stands for Vitamin C, and the concentration is 2 μg/mL. Significance: ### p < 0.001 vs. the control group. *** p < 0.001, ** p < 0.01 and * p < 0. 05 vs. the H2O2-treated group. Data shown as the mean ± S.D. (n = 5).
Molecules 26 03432 g006
Table 1. Response surface design and experimental results.
Serial NumberA/gB/hC/°CEllagic Acid Content
(mg/g)
13363795.25
26483784.29
33243583.04
43483579.86
53363796.41
60363982.29
70483783.94
83363795.48
96363983.53
100363580.71
110243786.31
126363584.73
133253986.75
143483982.62
153363797.80
163363797.22
176243790.33
A = Glucose dosage (g/100 mL), B = fermentation time (h) and C = fermentation temperature (°C).
Table 2. Response surface quadratic model ANOVA and regression coefficient estimation.
ParameterSum of SquaresdfMean SquaresF-Valuep-Value
Model625.19969.4750.22<0.0001 ***
A11.59111.598.380.0232 *
B30.89130.8922.330.0021 **
C5.8715.874.240.0483 *
AB3.3713.372.430.0027 **
AC1.9311,931.400.0258 *
BC0.2310.230.160.0184 *
A2115.321115.3283.37<0.0001 ***
B2104.461104.4675.52<0.0001 ***
C2295.931295.93213.94<0.0001 ***
Residual9.6871.38
Lack of Fit4.8931.631.360.3795
Pure Error4.8041.20
Cor total634.8716
R20.9820
A = Glucose dosage (g/100 mL), B = fermentation time (h), C = fermentation temperature (°C) and R2 = Coefficients of determination. Significance * p < 0.05, ** p < 0.01 and *** p < 0.001.
Publisher’s Note: MDPI stays neutral with regard to jurisdictional claims in published maps and institutional affiliations.

