Article

Graphene Assisted in the Analysis of Coumarins in Angelicae Pubescentis Radix by Dispersive Liquid–Liquid Microextraction Combined with 1H-qNMR

Gansu Provincial Key Laboratory of Aridland Crop Science, College of Agronomy, Gansu Agricultural University, Lanzhou 730070, China
*
Author to whom correspondence should be addressed.
These authors contributed equally to this work.
Molecules 2021, 26(9), 2416; https://doi.org/10.3390/molecules26092416
Submission received: 5 March 2021 / Revised: 19 April 2021 / Accepted: 19 April 2021 / Published: 21 April 2021
(This article belongs to the Section Natural Products Chemistry)

Abstract

:
The content of active components in traditional Chinese medicine is relatively small, and it is difficult to detect some trace components with modern analytical instruments, so good pretreatment and extraction are very important in the experiment. Graphene was introduced by a dispersive liquid–liquid microextraction method based on solidification of floating organic drop (DLLME-SFO) with graphene/1-dodecyl alcohol used as the extractant, and this method, combined with quantitative proton nuclear magnetic resonance spectroscopy (1H-qNMR), was used to simultaneously qualitative and quantitative osthole, columbianadin and isoimperatorin in Angelicae Pubescentis Radix. In this experiment, a magnetic stirrer was used for extraction, all NMR spectra were recorded on a Bruker Advance III 600 MHz spectrometer with dimethyl sulfoxide-d6 (DMSO-d6) as deuterated solvent and pyrazine as the internal standard. The influencing factors and NMR parameters in the extraction process were investigated and optimized. In addition, the methodology of the established method was also examined. The quantitative signals of osthole, columbianadin and isoimperatorin were at a chemical shift of δ6.25–δ6.26 ppm, δ6.83–δ6.85 ppm, and δ6.31–δ6.32 ppm. The linear ranges of osthole, columbianadin and isoimperatorin were all 0.0455–2.2727 mg/mL, and R2 were 0.9994, 0.9994 and 0.9995, respectively. The limits of detection of osthole, columbianadin and isoimperatorin were 0.0660, 0.0720, 0.0620 mg, and the limits of quantification of osthole, columbianadin and isoimperatorin were 0.2201, 0.2401, 0.2066 mg/mL. The solution had good stability and repeatability within 24 h. The recoveries of osthole, columbianadin and isoimperatorin were 102.26%, 99.89%, 103.28%, respectively. The established method is simple and easy to operate, which greatly reduces the cumbersome pretreatment of samples and has high extraction efficiency.

1. Introduction

Angelicae Pubescentis Radix (APR) is the dried root of Angelicae pubescentis maxim f. biserrata Shan et Yuan in China [1]. In addition to a long medical history in China, it is also distributed in Korea and Japan [2]. APR is pungent and mild, and has a good effect when treating rheumatic arthralgia. From the perspective of the basic theory of traditional Chinese medicine (TCM), dampness evil is recognized as one of the main pathogenic factors of the coronavirus disease 2019. APR as monarch drug or adjuvant can dispel pathogenic windage, clear dampness and activate yang qi, and has played an important role in the outbreak [3,4]. Coumarin is a type of aromatic family of compounds with benzo-α-pyranone as the parent nucleus, which has been proved to be the compound with the most abundant content and the strongest biological activity [5]. In the 2020 edition of the Chinese pharmacopeia, coumarin components are regarded as one of the indexes to evaluate its quality. In modern pharmacological studies, coumarin has anti-inflammatory and analgesic [6,7], rheumatoid arthritis [8], anti-tumor [9], and anti-bone marrow osteoporosis effects [10].
In short, a dispersive liquid–liquid microextraction (DLLME) is a liquid phase microextraction technique [11]. During the DLLME development era, myriad of innovations were introduced [12,13,14,15]. Among them, dispersive liquid–liquid microextraction based on the solidification of floating organic drop (DLLME-SFO) was proposed by Leong [16] in 2008, which was based on dispersive liquid–liquid microextraction (DLLME) [17,18,19,20] and liquid-phase microextraction based on solidification of floating organic drop (LLME-SFO) [21]. The extraction process is composed of a dispersant, extractant and sample solution, among which the dispersant is the key to form the emulsion. Its function is to disperse the extractant into small droplets in the solution and increase the contact area with the sample solution. Therefore, the purpose of dispersants with both hydrophilicity and lipophilicity is to be soluble in the extractant and sample solution simultaneously, such as methanol, ethanol, acetonitrile, etc. In addition, the extractant is not mutually soluble with water and should be nonvolatile, with a density less than that of water and a melting point close to room temperature, so as to float on the sample solution and form suspended droplets, which would be convenient in experimental operation. Commonly used extractants include dodecyl alcohol, 2-dodecyl, undecyl and some halogenated hydrocarbons. In summary, Leong combined the advantages of the above two methods and overcame their disadvantages: toxic extraction solvents were needed in DLLME, such as chlorobenzene, chloroform and carbon tetrachloride, which were not conducive to human health for a long time; in LLME-SFO, although the amount of organic solvent in the extraction process is reduced, the extraction speed is slow. Compared with the above methods, DLLME-SFO extraction process is simple, more efficient and more environmentally friendly. The methods are currently used for determination of traces of lead and Hg2+ in aqueous samples [22,23], pesticide residues and heavy metals [24,25,26] in food and trace amounts of aflatoxin [27] in spoiled food. It was also used for pharmacological studies [28] in medicine. In practical applications, DLLME-SFO is generally combined with modern analytical instruments, such as high-performance liquid chromatography (HPLC) [29,30,31], gas chromatography (GC) [32,33,34], and atomic absorption spectroscopy (AAS) [35,36,37], etc. However, this method has not been reported to be combined with nuclear magnetic resonance spectrometer (NMR), and it would been used for the first time for the qualitative and quantitative analysis of the osthole (OS), columbianadin (CO) and isoimperatorin (IS).
Graphene is a two-dimensional flat monolayer structure composed of carbon atoms connected by sp2 hybridization with a honeycomb shape [38]. It has good hardness, electrical and thermal conductivity, it also has the property of reconciling the contradiction between brittleness and ductility [39,40]. In addition to the above characteristics, graphene has strong adsorption capacity due to the presence of a large number of carboxyl, hydroxyl and epoxy groups on the surface. At present, many graphene-based extraction methods have been successfully established [41,42,43]. In the previous studies, it was found [44] that there are unique advantages in the determination of the effective components in TCM by quantitative proton nuclear magnetic resonance spectroscopy (1H-qNMR). (1) There is no special requirement for the determination of compounds. (2) There is no damage to the analyte and it can be recovered after the measurement. (3) A large number of reference substances are not needed, and multiple indicators can be determined simultaneously only by selecting appropriate internal standard substances and the deuterium-substituted solvent, which is more consistent with the diversity of effective components in TCM. However, there are some problems such as low sensitivity and strong interference when qNMR is used for extremely low concentration and trace substances, so the sample needs to be enriched or concentrated in the early treatment. DLLME-SFO, as a pre-treatment method that can be integrated with extraction and concentration, has high extraction efficiency, high speed and simple operation. Therefore, DLLME-SFO was combined with 1H-qNMR, graphene was introduced [45] to increase the adsorption and extraction efficiency and graphene/1-dodecyl alcohol was used as extraction agent, which was helpful to solve the problem of low concentration and strong interference (Table 1). This method was used for the first time to quantitatively and qualitatively analyze the OS, CO and IS in APR.

2. Results and Discussion

2.1. Optimization of NMR Parameters

NS is the number of repeated samples. If NS is too small, insufficient scanning will result in poor accuracy and reproducibility; when NS is set high, the reproducibility is better and the signal-to-noise ratio can be improved to make the baseline of spectrogram more stable and flat, but at the same time the detection time will be prolonged. The process of the nucleus from the excited state to the equilibrium arrangement state is called the relaxation process, this process is a necessary condition for the generation of nuclear magnetic resonance phenomenon, the time required by it is called D1. In the 1H-qNMR experiment, the appropriate D1 directly depends on the accuracy of quantitative results, and the suitable D1 can ensure the complete relaxation of the quantitative nucleus and the spectrum peak will not be saturated, which is conducive to the correct integration of the quantitative peak. If the D1 is too small, the quantitative results will be inaccurate and distorted, but D1 should not be set too high which would cause the extension of detection time.
In this experiment, D1 and NS were set step by step to accumulate multiple experiments, and samples were taken from small to large according to D1 and NS. Then, the quantitative characteristic peaks of analytes and internal standard (pyazine) were integrated, and D1 and NS values whose integral area ratio no longer changed significantly were selected.

2.1.1. Choice of D1

Through the investigation of different D1 (1, 5, 15, 20, 25, 30, 40, 50, 70, 90 and 100 s), the results showed that, with the gradual increase of D1, detection analysis time was also extended and the integral area was gradually decreased, and, when D1 was 15 s, the integral area no longer changed. After comprehensive consideration, we chose 15 s for D1.

2.1.2. Choice of NS

When NS was 16, 32, 64 and 128 times, the influence on the integral area was investigated. According to the analysis results, NS has no influence on the integral area, and with the increase of NS, the detection and analysis time were also extended, so NS was set at 16 times.

2.2. Optimization of DLLME-SFO Conditions

The optimization of DLLME-SFO conditions were obtained by investigating the volume ratio of ultrapure water to the sample solution, the types, concentration and volume of extractant, different ionic strength, different pH, different speed and different extraction time. The enrichment factor (ER) is defined as the ratio of the total amount of the measured substance in the extraction phase to the initial amount of the measured substance in the sample phase. The specific calculation formula is as follows:
ER = 100 × V 0 C 0 V s C s + V 0 C 0
C0 and Cs are the concentration of the substance to be measured in the extraction solvent phase and the sample phase when the extraction reaches equilibrium. V0 and Vs. are the volume of the extraction solvent phase and the sample phase respectively.

2.2.1. Choice of Extractant and Dispersant

In the experiment, graphene and graphene oxide were selected to investigate the effects on ER of OS, CO and IS within the range of 2.5–0.125 mg/mL, respectively. As can be seen from Figure 1, the extraction effect of graphene was better; in this study, methanol was used to extract medicinal materials. Therefore, in order not to introduce other dispersion items to interfere with the extraction solution, methanol was used as a dispersant during the experiment.

2.2.2. Selection of Volume Ratio of Distilled Water to Test Sample Solution

When the volume ratio of distilled water to the test solution was 4:6, 5:5 and 6:4, the solvent after extraction was a white, turbid liquid, and the turbidity degree was more pronounced with no large droplets appearing. When the volume ratio was 7:3, the solvent after extraction was still a white, turbid liquid, although the turbidity degree was relatively low and there was also no large droplets. When the volume ratio was 8:2 and 9:1, there was no turbidity and droplets appeared in the extracted solution. ER was calculated and compared according to the experimental results. Finally when the volume ratio of distilled water to the test solution was 9:1, the extracted solution had no turbidity and the extraction rate was the highest.

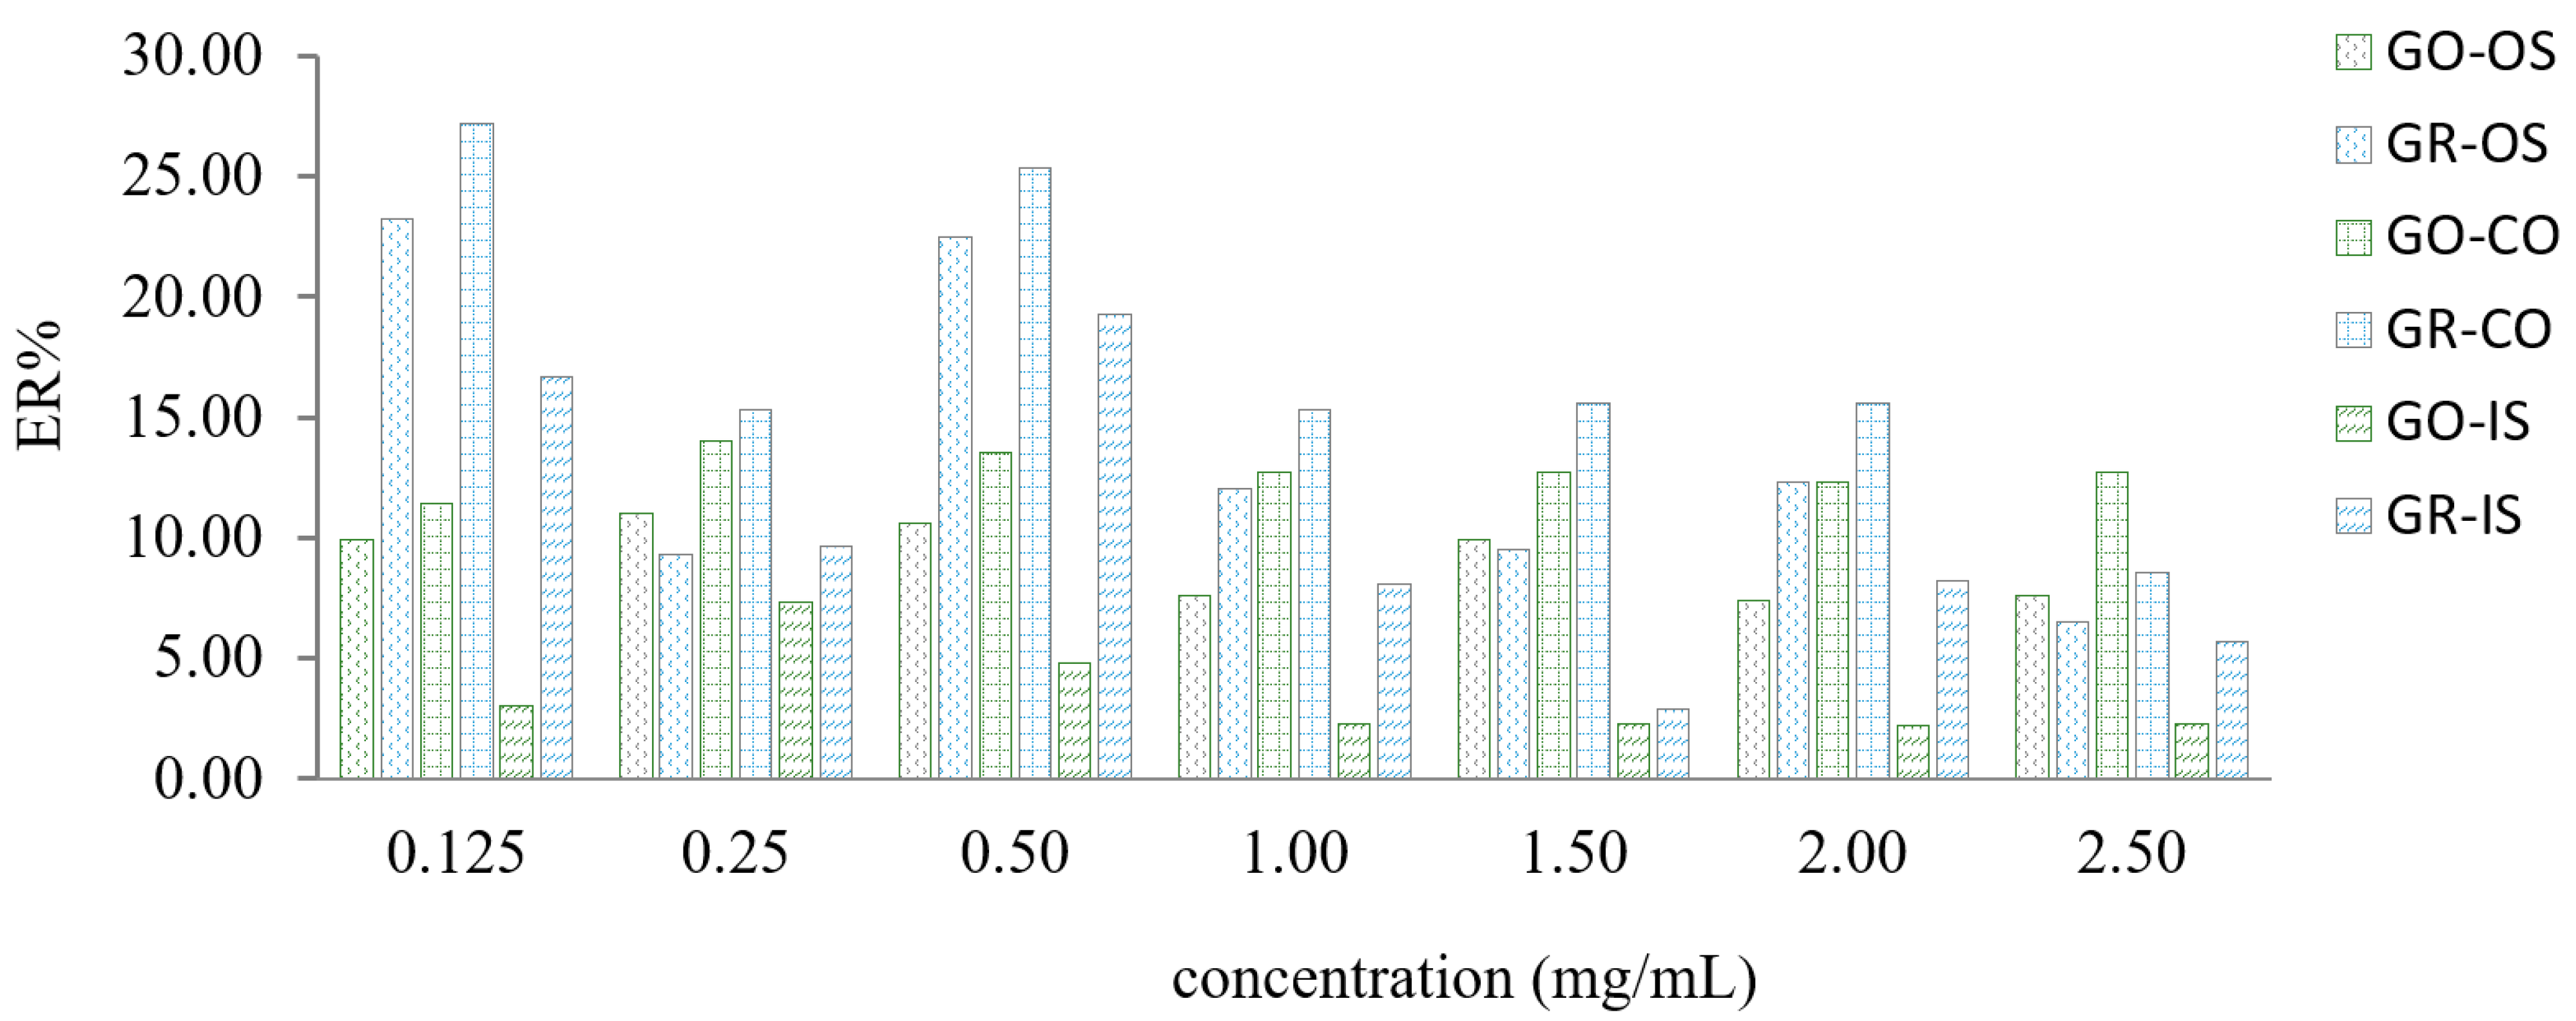
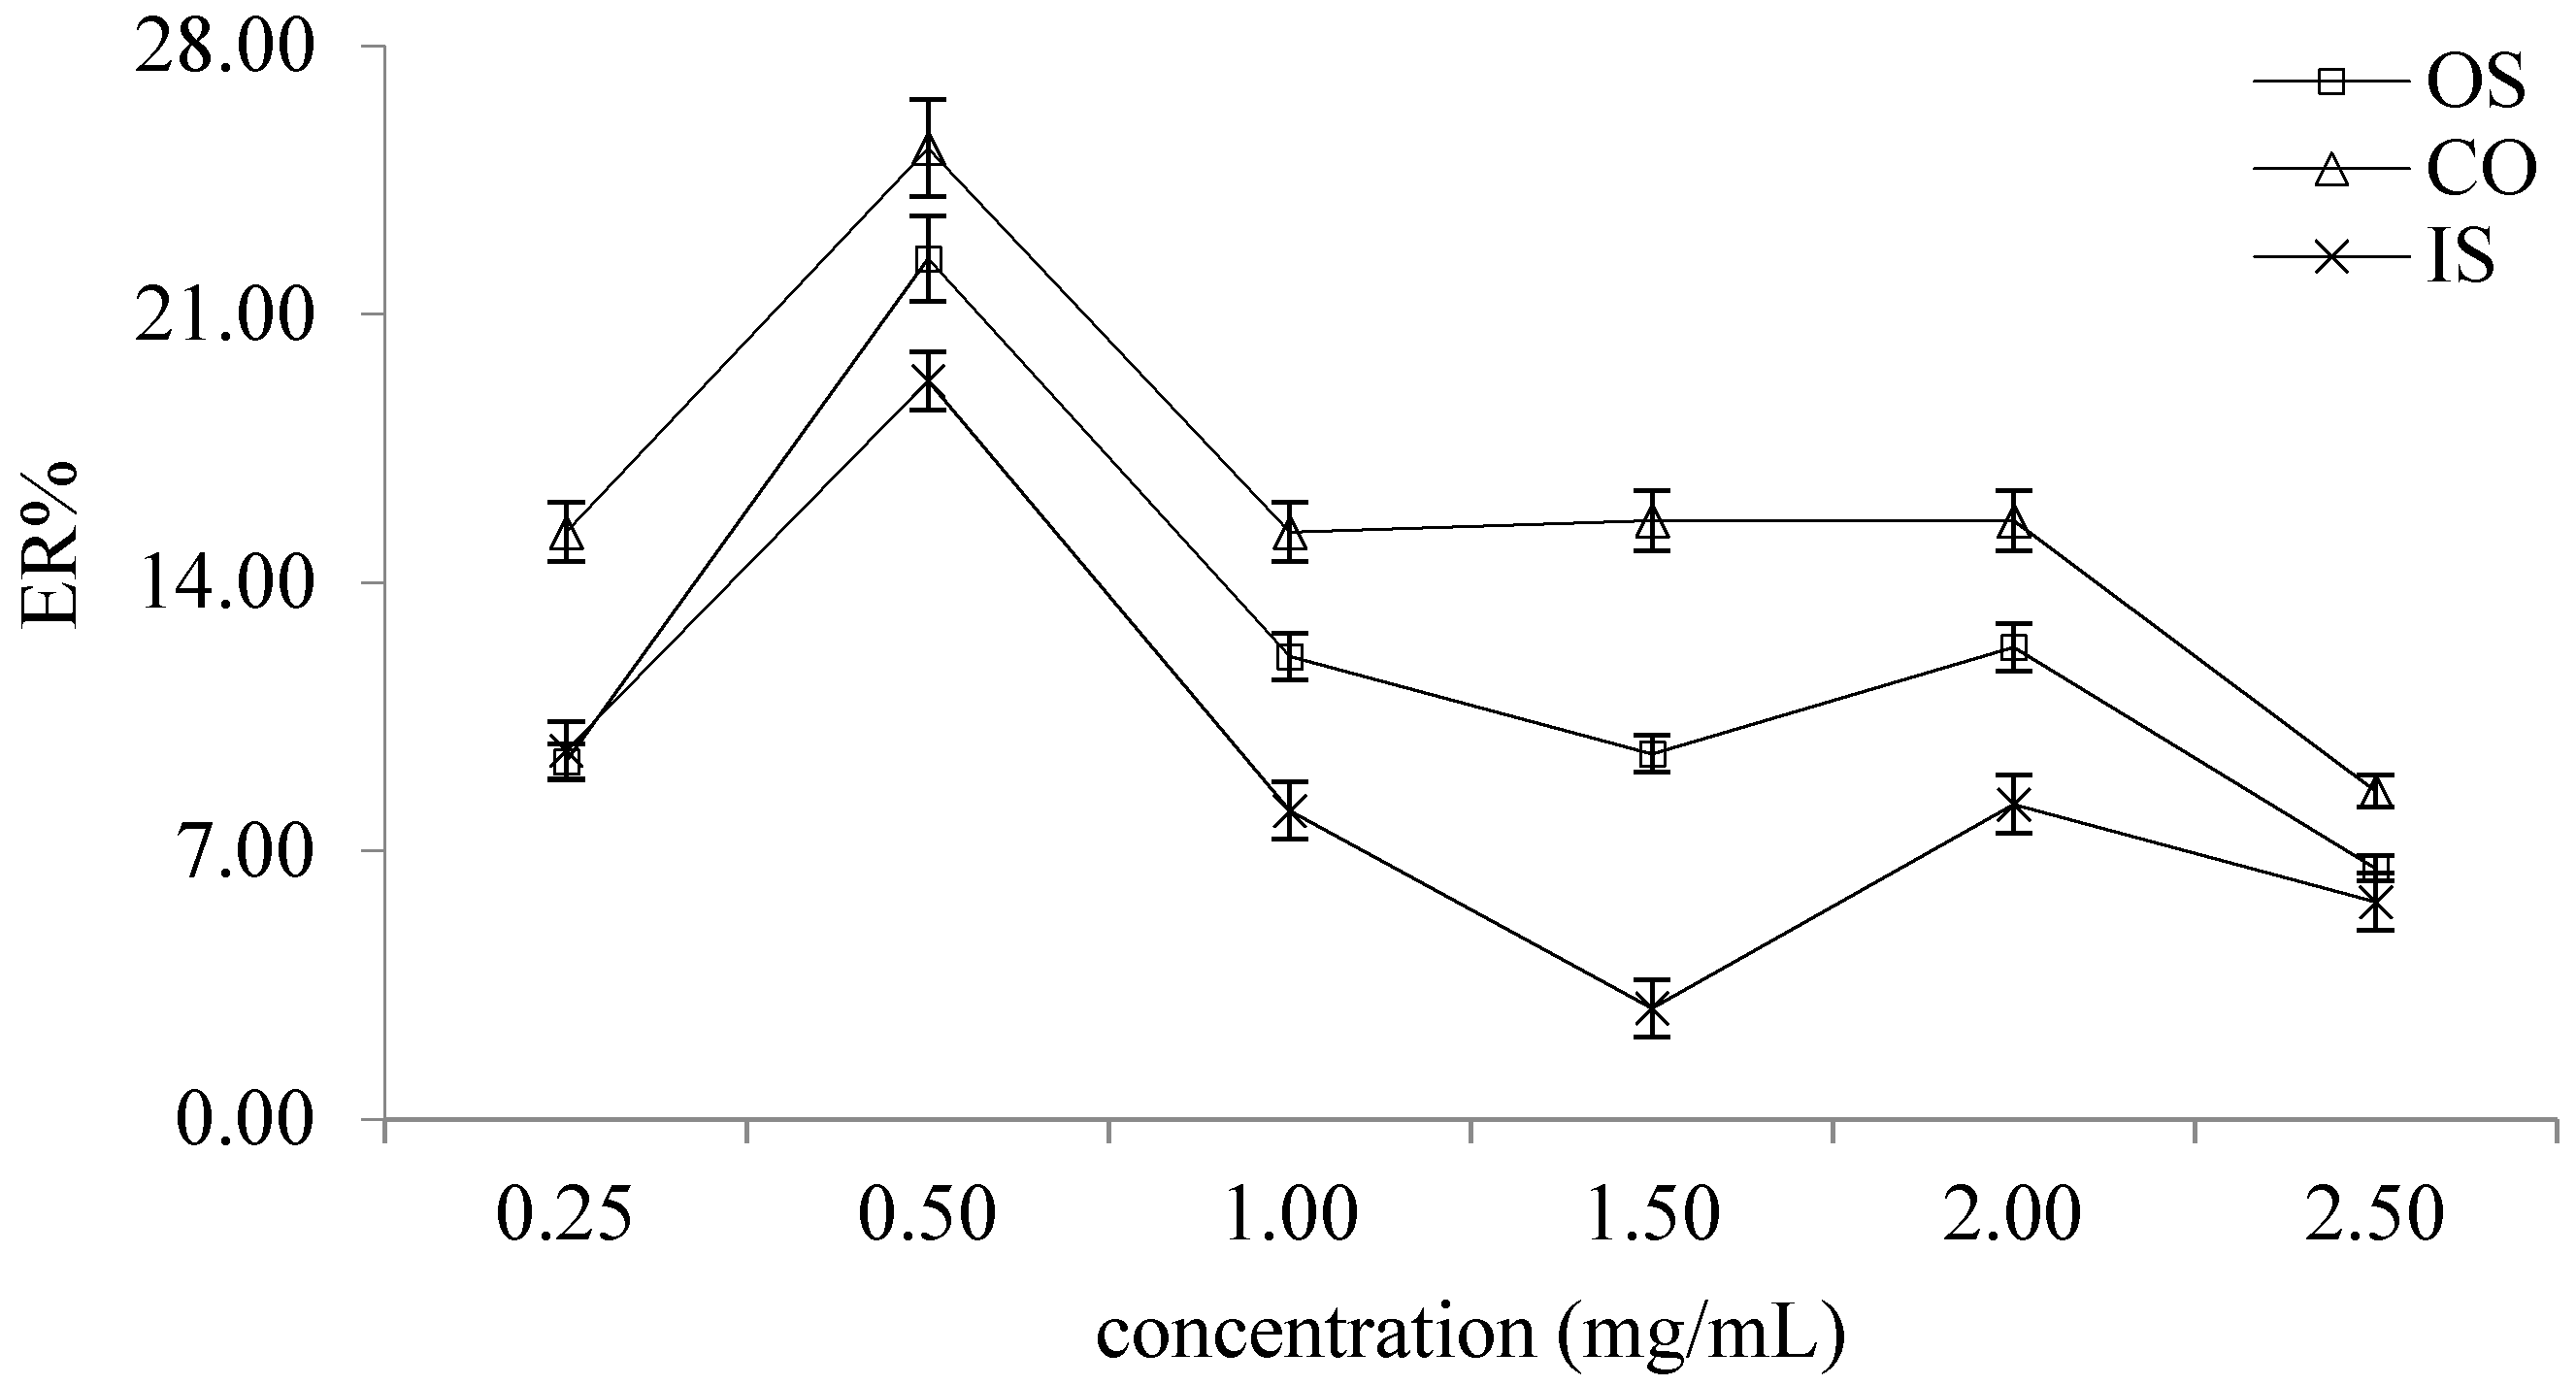
2.2.3. Selection of Graphene Concentration in 1-Dodecyl Alcohol

The study investigated the influence of the concentration of graphene in 1-dodecyl alcohol at 2.5–0.25 mg/mL on ER. It can be seen from the Figure 2 that when the concentration of graphene in 1-dodecyl alcohol was 0.50 mg/mL, the ER of OS, CO and IS were the highest.

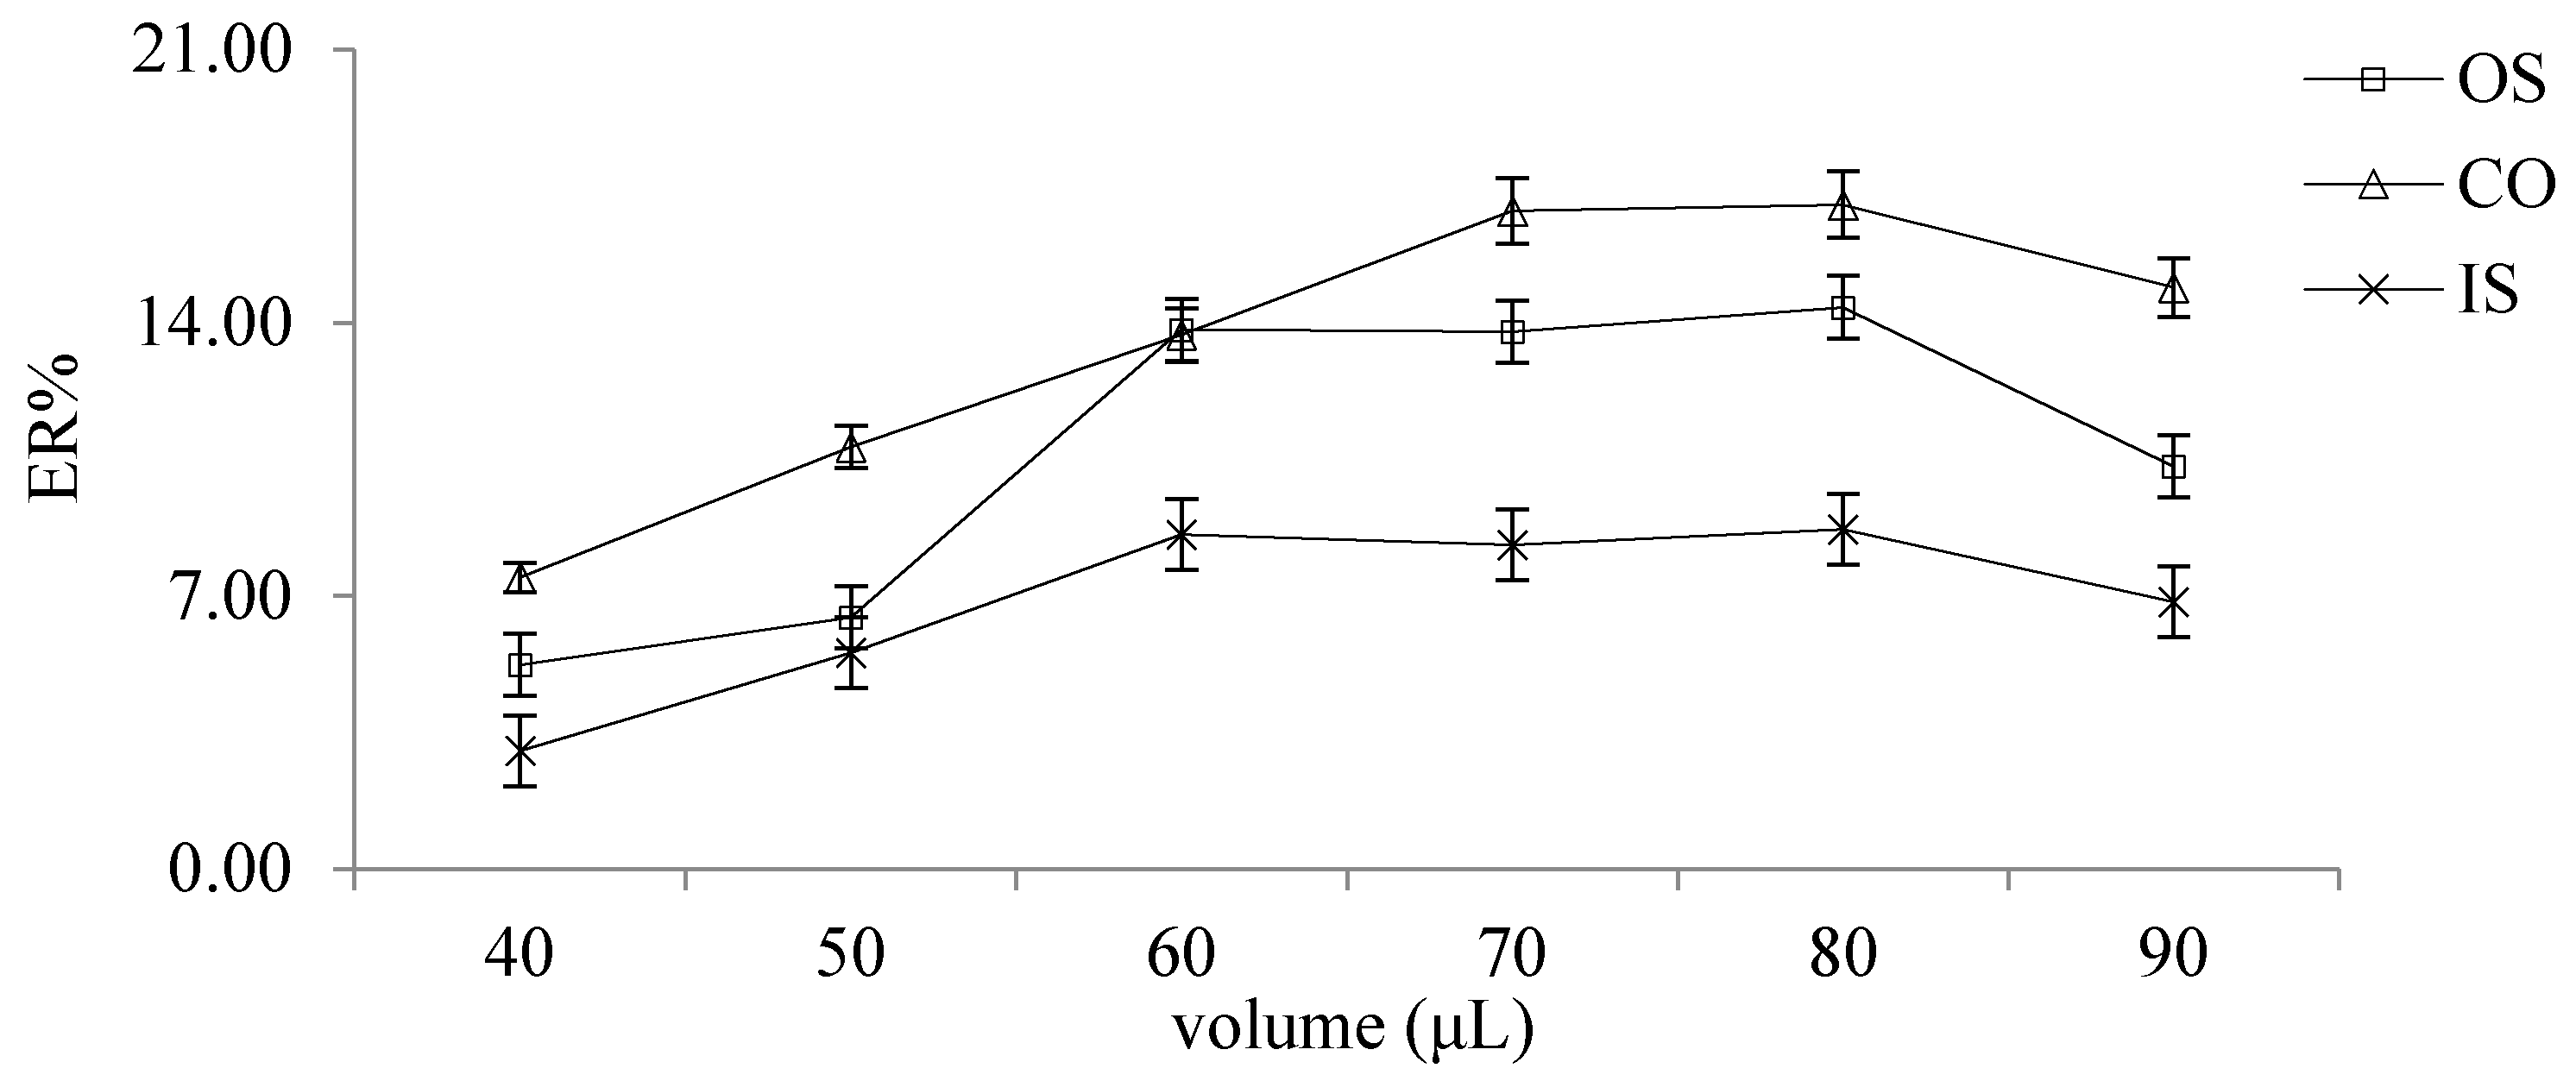
2.2.4. Selection of Extractant Volume

In order to evaluate the effect of the volume of the extractant on ER, different volumes of graphene/1-dodecyl alcohol (40, 50, 60, 70, 80 and 90 μL) were selected for investigation. As shown in the Figure 3, the extraction efficiency was the highest when the volume was 80 μL.

2.2.5. Selection of Extractant Volume

The lactones in coumarin components are prone to ring opening and hydrolysis under alkaline conditions. Therefore, the effect of pH on ER at 2–7 was analyzed by adding 0.40 mol/L HCl and 0.40 mol/L NaOH. When the pH of the solution was 5, the ER of OS, CO and IS were the highest, at 16.39%, 19.62% and 11.11%, respectively. The detailed results are shown in Figure 4.

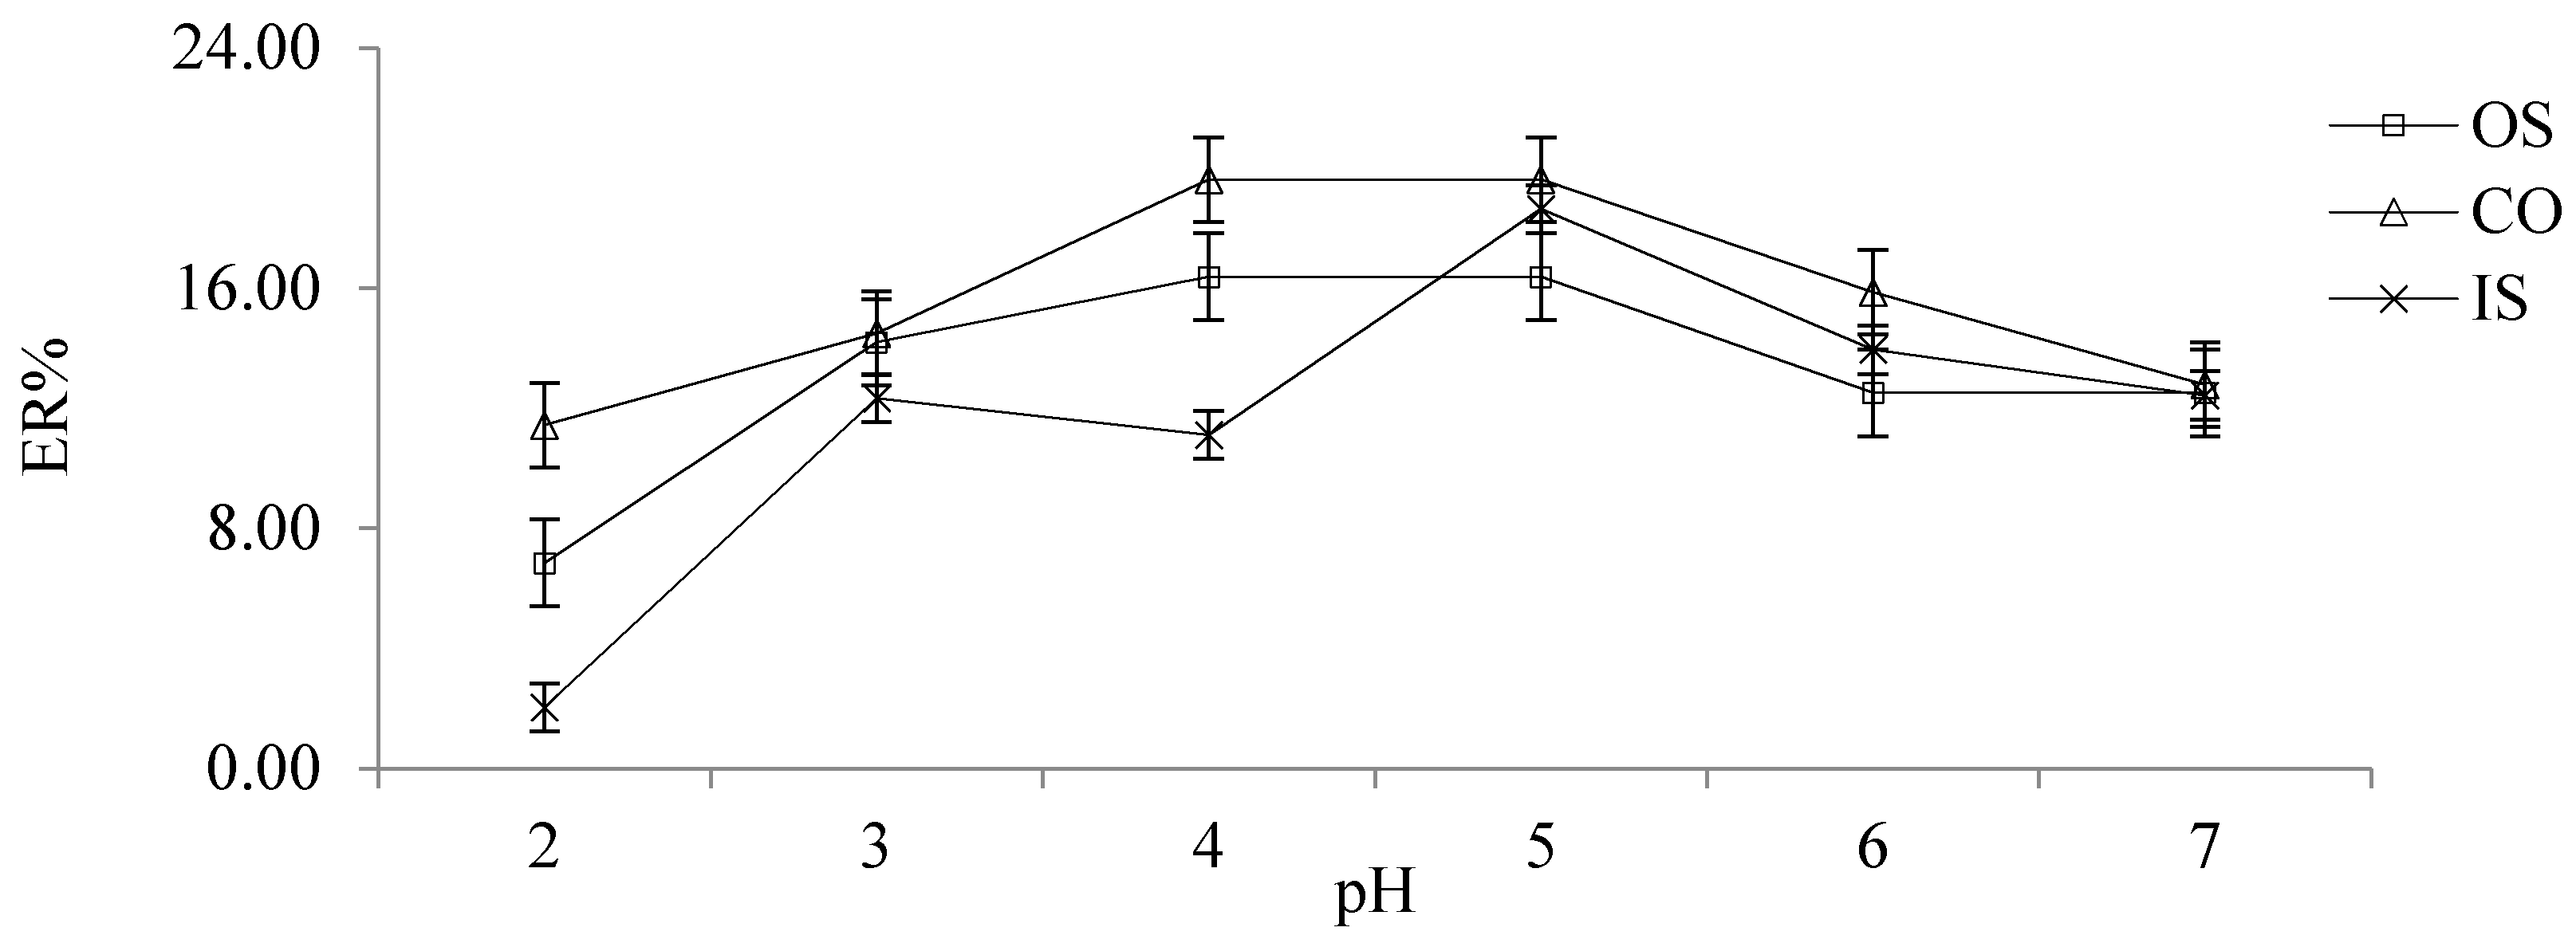
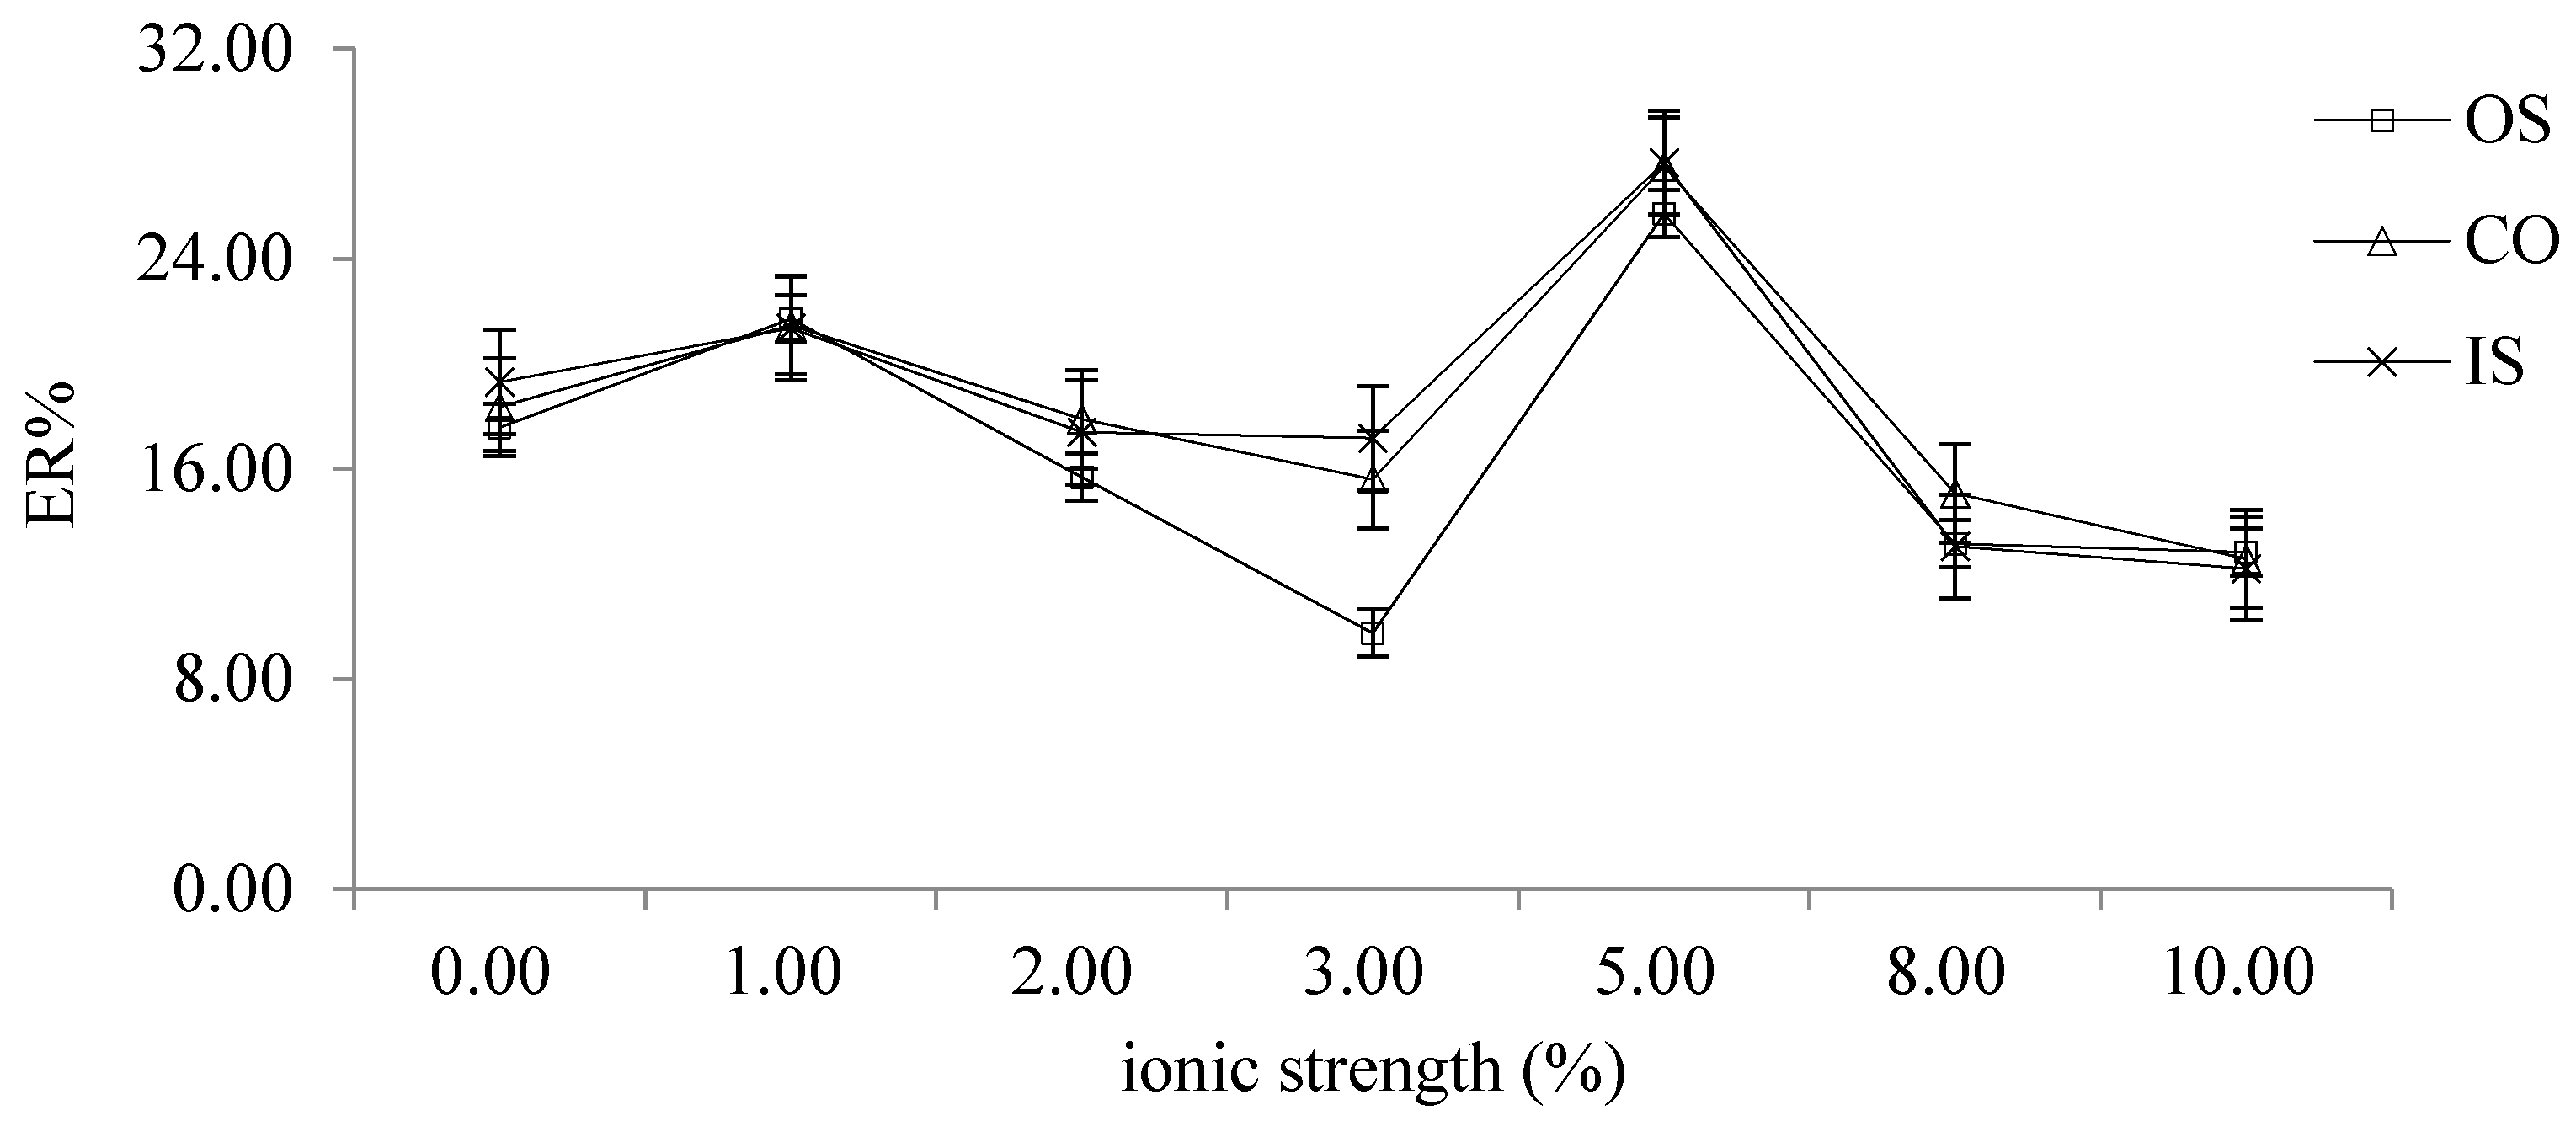
2.2.6. Choice of Ionic Strength

The effects of different ionic strength (0%, 1%, 2%, 2.5%, 5%, 8% and 10%) on the extraction efficiency were investigated by adding different concentrations of NaCl into the extraction solution. The results showed that when NaCl concentration was 5%, the ER% of OS, CO and IS was the best. (Figure 5)

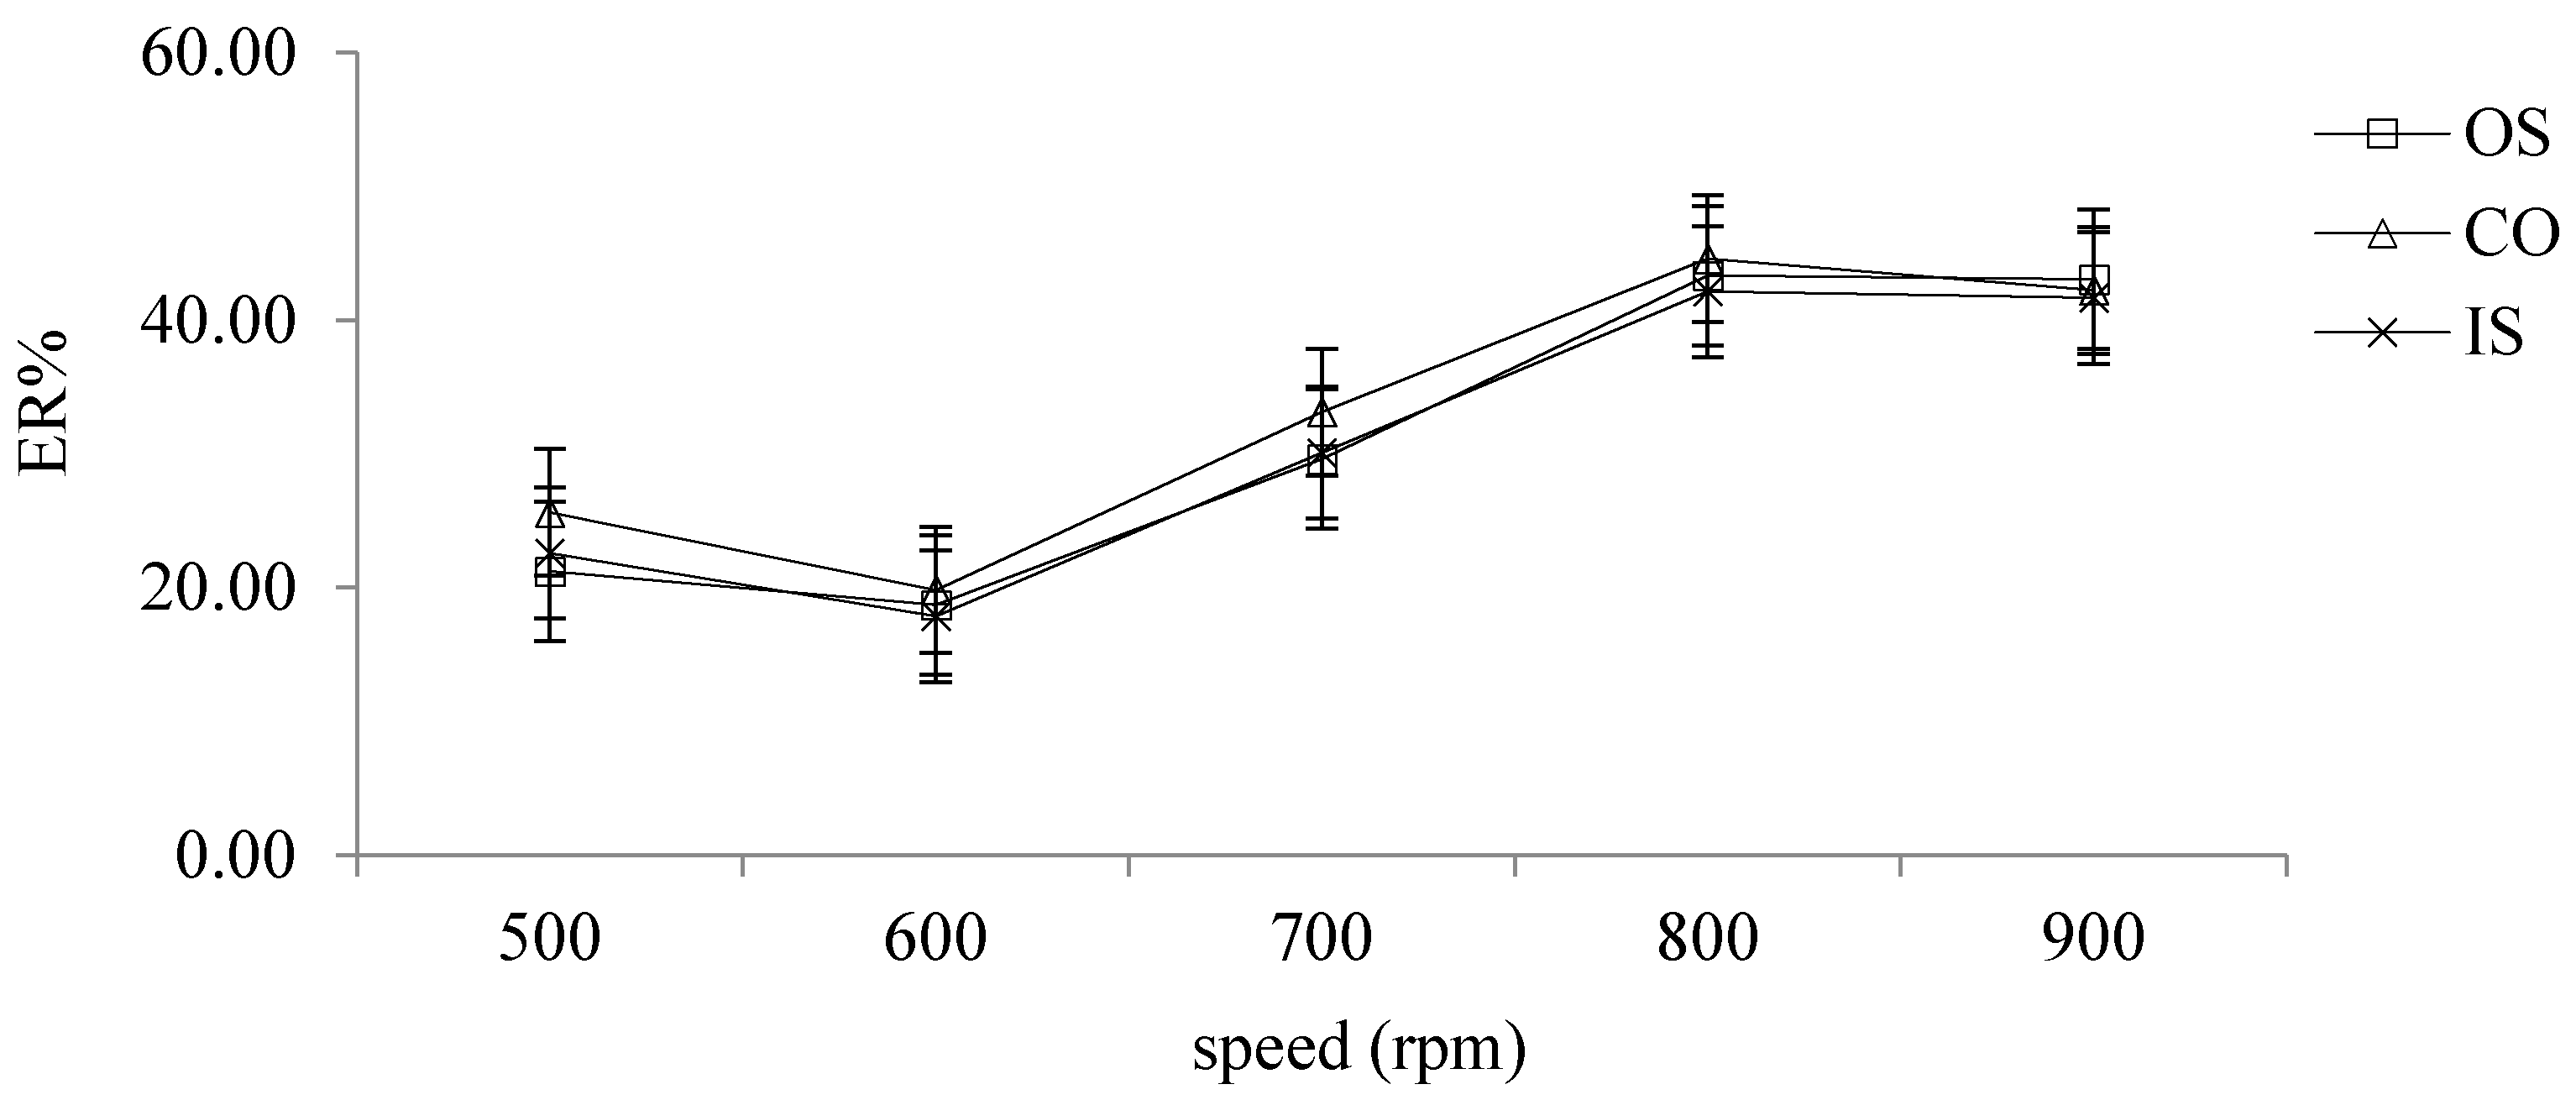
2.2.7. Selection of Different Speed

The effect of speed on extraction efficiency was investigated by setting the speed to 500, 600, 700, 800, 900, 1000, 1200 and 1400 rpm. The experimental results showed that, when the speed was greater than or equal to 1000 rpm, the extracted solution presented white turbidity without droplets, and as can be seen from Figure 6, when the speed reached 800 rpm, the ER of the target analytes gradually tended to be stable and reached the highest point, so 800 rpm was chosen as the speed.

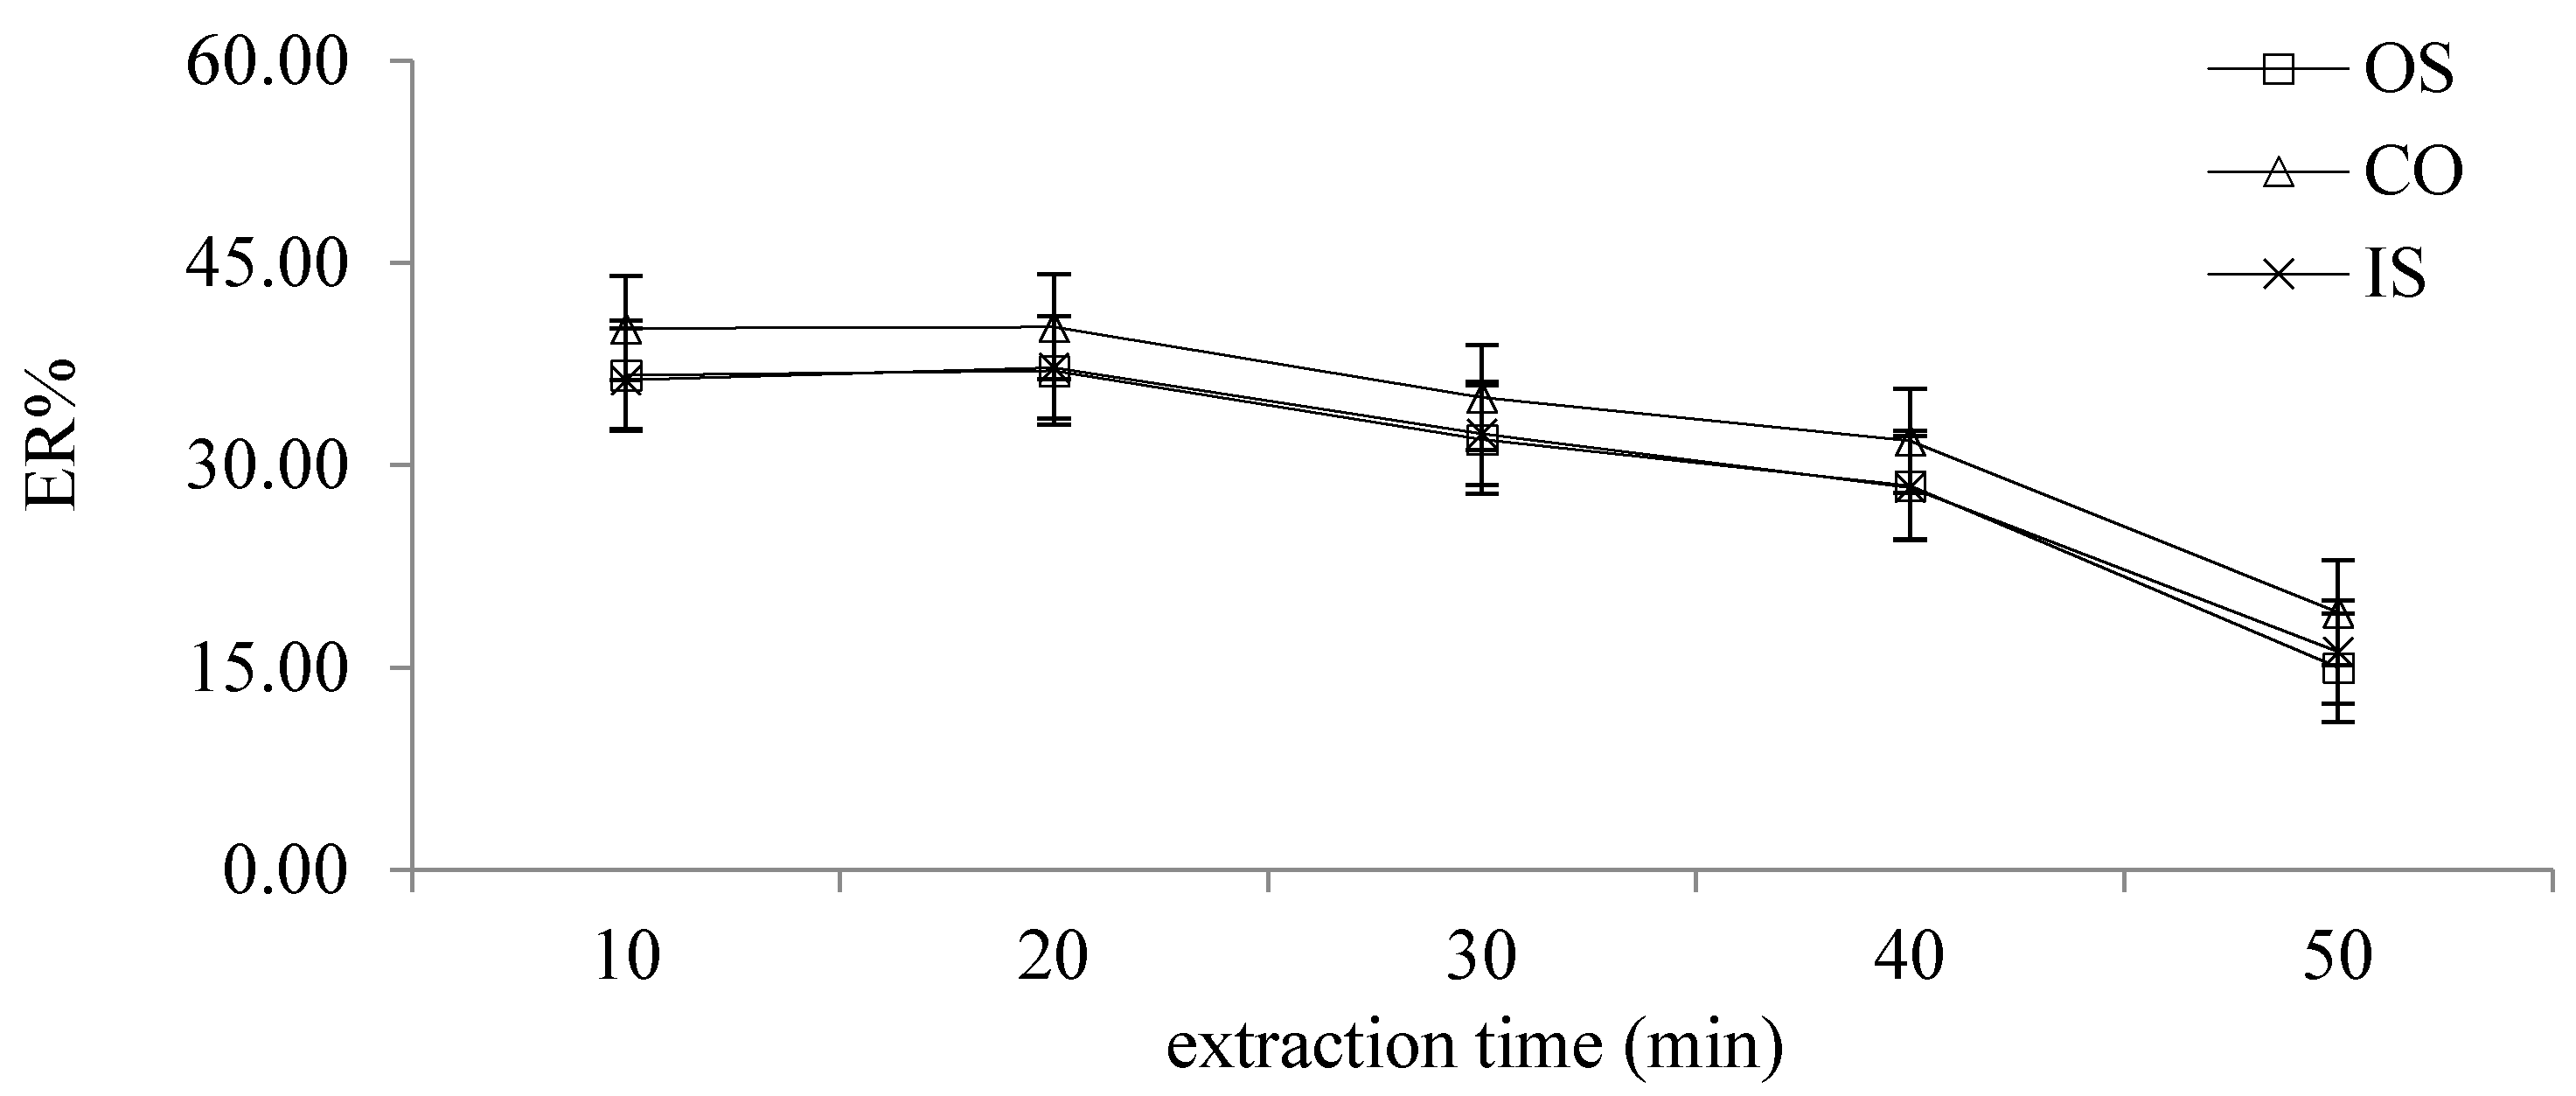
2.2.8. Different Extraction Times

The extraction time was the period from the addition of the magnetic rotor into the extraction solution to the end of extraction. The effects of different extraction times (10, 20, 30, 40 and 50 min) on ER were investigated. As can be seen from the Figure 7, when the extraction time was 10–20 min, the ER of the target analyte gradually increased and reached its maximum at 20 min. When the extraction time was more than 20 min, ER decreased with the extension of the extraction time. Therefore, 20 min was selected as the extraction time in this study.

2.3. Methodology Validation

2.3.1. Linearity

The appropriate amount of OS, CO and IS was precisely weighed and prepared into a mixed solution, then diluted to eight different concentrations. The linear range of OS, CO and IS were all 0.0455–2.2727 mg/mL, and R2 were 0.9994, 0.9994 and 0.9995, respectively. The results showed that there was a good linear relationship between the internal area and the concentration (Table 2).

2.3.2. Limit of Detection and Limit of Quantification

Limit of detection (LOD) is the smallest amount that the method can reliably detect to determine presence or absence of an analyte. Limit of quantification (LOQ) is the smallest amount that the method can reliably measure quantitatively to an acceptable level. Using the equation XB + kσB, where XB and σB are the mean and the standard deviation of blank measurements, and k is the numerical factor determining the confidence level, LOD: k = 3, LOQ: k = 10 [46]. The LOD and LOQ of OS, CO and IS were analyzed as shown in the Table 2 below.

2.3.3. Precision

High, medium and low concentrations were selected from the mixed reference materials and each concentration was measured in parallel for three times to determine precision. The RSD of OS, CO and IS were 1.10%, 1.07% and 0.90%, respectively, indicating that the precision of the instrument was good.

2.3.4. Stability and Repeatability

In order to monitor the stability of the extracted sample solution, the same batch of medicinal materials should be measured under the same experimental conditions at 0, 2, 4, 8, 12 and 24 h. The RSD of OS, CO and IS were 1.56%, 1.04% and 1.54%, respectively, indicating that the samples were relatively stable within 24 h. The same batch of samples was repeated in order to investigate the repeatability of the established method, the RSD of OS, CO and IS were 2.56%, 2.13% and 3.70%, respectively.

2.3.5. Recovery

One milligram of APR powder with known content was precisely weighed, and an appropriate amount of reference substance was added. The powder was for detection and analysis which was extracted according to 2.1, and then extracted according to 2.2. The experimental results were shown in Table 3.

2.4. Determination of the Samples

The established method was used to determine OS, CO and IS of APR from different producing areas. The detailed results were shown in Table 4. The quantitative signal of OS was at δ6.25–δ6.26 ppm, CO was at δ6.83–δ6.85 ppm, and IS was at δ6.31–δ6.32 ppm.

3. Materials and Methods

3.1. Reagent

Nuclear magnetic resonance spectrometer (Bruker Advance III 600-MHz, Karlsruhe, Germany); magnetic stirrer (INNOTEG-Science One MR 1, Staufen, Germany); PS-30 ultrasonic cleaning machine (Shenzhen Dekang Science and Technology Co., Ltd., Shenzhen, China); HX203 telectronic balance (Fujian Huazhi Scientific Instrument Co., Ltd., Fujian, China); JFSD-100 disintegrator (Shandong Jingcheng Medical Equipment Manufacturing Co., Ltd., Shandong, China).

3.2. Chemical

Osthol (Lot EH150063, 98%), dimethyl sulfoxide-d6 (DMSO-d6) (99.9%) and pyrazine (98%) were all bought from Shanghai Energy Chemical Co., Ltd. (Shanghai, China), isoimperatorin (Lot 18062202, 98%) and columbianadin (98%) were purchased from Chengdu Pufei De Biotech Co., Ltd. (Chengdu, China), the chemical structural formulas were showed in Figure 8. Graphene and graphene oxide were all bought from Suzhou UG (Suzhou, China). Nano Material Co., Ltd. Methanol (≥99.5%) was bought from Tianjin Fuyu Chemical Co., Ltd. (Tianjin, China); 1-dodecyl alcohol (≥98%) was purchased from Shanghai Macklin Biochemical Co., Ltd. (Shanghai, China )NaCl (≥96%) was bought from Shanghai Sinopharm Chemical Reagent Co., Ltd. (Shanghai, China); HCl (≥96%) and NaOH (≥96%) were all bought from Tianjin Damao Chemical Reagent Factory (Tianjin, China).

3.3. Method

3.3.1. Preparation of Sample Solution

APR was crushed and sifted, and 5 g of medicinal powder was precisely weighed and added with 50 mL methanol, which was extracted by ultrasonic (40 °C, 40 min), methanol was used to make up the missing weight, the extraction was filtered by decompression and stored at 4 °C in the dark for later use.

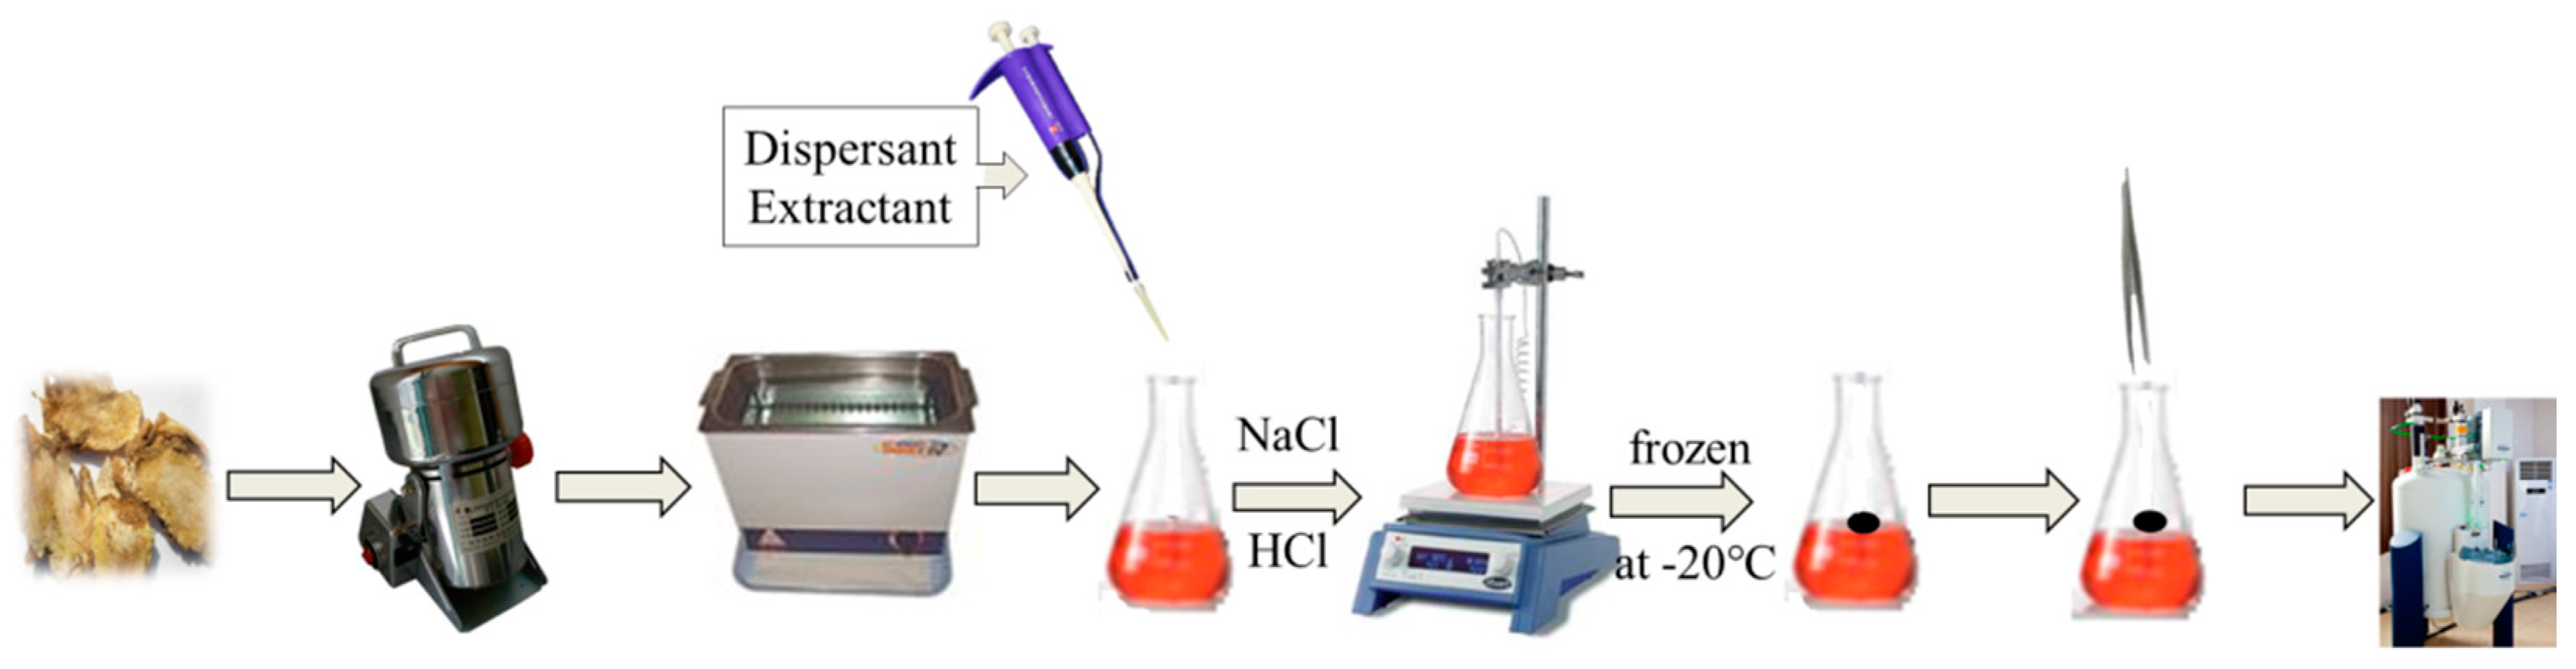
3.3.2. Extraction Process of DLLME-SFO

Graphene (2.5 mg) was precisely weighed and placed in a 10 mL volumetric flask. 1-dodecyl alcohol was added and ultrasonic was used for 1 h to make graphene completely dissolved in 1-dodecyl alcohol. After standing the solution was not stratified or precipitated, then graphene/1-dodecyl alcohol extractant was obtained, and the appropriate amount of the prepared extractant was absorbed and diluted to 0.5 mg/mL. The conical flask was fixed on the magnetic agitator, 9 mL ultrapure water and 1 mL test solution, 80 μL graphene/1-dodecyl alcohol (5 mg/mL) and 100 μL NaCl (5%) solution were added respectively, and the pH of the solution was adjusted to 5. Magnetic rotor was introduced in the conical flask, then extracted after 20 min (800 rpm, 40 °C) and let stand for 5 min, the conical flask was gently turned to form a large droplet, which was quickly frozen at −20 °C for 10 min. After solidification, the conical flask was removed with a small spoon and melted at room temperature, the accumulated phase was extracted with microinjection needle, besides the volume of accumulated phase was recorded and injected into the nuclear magnetic tube. Then 450 μL DMSO-d6 and 25 μL pyrazine (10 mg/mL) were added. The specific experimental operation process was shown in the Figure 9. The 1H-NMR spectrum of APR was shown in Figure 10. The preconcentration factor was obtained by dividing the concentration after extraction by the concentration before extraction. The preconcentration factors for OS, CO and IS were 270.01%, 248.30% and 268.29%, respectively. Although the preconcentration factors were low, they were useful for the QNMR method. It was found that the impurity peaks in the 1H-NMR spectrum were less and the separation degree was better after extraction (Figure 11).

3.3.3. NMR Acquisition and Processing Parameters

All NMR spectra were recorded on a Bruker Advance III 600 MHz spectrometer. The spectrometer was operating at 600.10 MHz for 1H resonances, using a multinuclear broadband 5 mm probe. DMSO was chosen as deuterated solvent because of its superior solubility, preventing the solvent peak from overlapping with other peaks. Pyrazine was selected as the internal standard. Usual procedures for locking and shimming were conducted and followed by a careful tuning and matching adjustment for each sample. The pulse sequence was zg30, pulse width (P1) of 10.00 μs, test temperature (TE) of 295.6 K, spectrum width (SWH) of 11904.762 Hz, acquisition time (AQ) of 2.75 s, relaxation delay time (D1) of 1 s, scan times (NS) of 32 times.

4. Conclusions

The purpose of this study was to establish DLLME-SFO method, and graphene/1-dodecyl alcohol as extractant combined with 1H-qNMR for the first time to analyze OS, CO and IS in APR qualitatively and quantitatively. The extraction conditions were all optimized to obtain the best extraction method. The accuracy, stability and recovery of the established method were good after the methodology verification. Compared with other conventional methods, this method is more environmentally friendly, and has a high extraction efficiency, simple operation and good precision. The introduction of nanomaterials enhanced the adsorption and extraction, which help to solve the problem of low sensitivity and strong interference. It is worth discussing and explore for the extraction of effective components of TCM. It is hoped that this method can be used in the extraction of some valuable and rare effective ingredients in TCM in the future, which have special curative effect for some hard to treat diseases, such as cancer, HIV and so on.

Author Contributions

Conceptualization, Y.F. and Q.L.; data curation, Y.F.; formal analysis, Y.F.; investigation, Y.F. and Q.L.; methodology, Y.F. and Q.L.; project administration, Q.L. and D.Q.; supervision, Y.F., Q.L., D.Q. and G.L.; validation, Y.F.; writing—original draft, Y.F.; writing—review and editing, Y.F., Q.L. All authors have read and agreed to the published version of the manuscript.

Funding

This work was supported by Research Program Sponsored by Gansu Provincial Key Laboratory of Aridland Crop Science, Gansu Agricultural University (No.GSCS-2018-3), the National Natural Science Foundation of China (31860102) and Discipline Construction Fund Project of Gansu Agricultural University (GSAU-XKJS-2018-086).

Data Availability Statement

The data presented in this study are available on request from the corresponding author.

Conflicts of Interest

There are no conflict of interest to declare.

Sample Availability

Samples of the compounds are available from the authors.

References

  1. Chinese Pharmacopoeia Commission. Pharmacopoeia of People’s Republic of China; China Medical Science and Technology Press: Beijing, China, 2020; Volume 1, pp. 133–134. [Google Scholar]
  2. Lu, Y.Q.; Wu, H.W.; Yu, X.K.; Zhang, X.; Luo, H.Y.; Tang, L.Y.; Wang, Z.J. Traditional Chinese medicine of Angelicae pubescentis radix: A review of phytochemistry, pharmacology and pharmacokinetics. Front. Pharmacol. 2020, 11, 355. [Google Scholar] [CrossRef]
  3. Zhao, Y.S.; Hou, X.Y.; Gao, Z.H.; Wang, T. Tracing sources of prescriptions for treating dampness in initial stage of Corona Virus disease 2019. Chin. Arch. Trad. Chin. Med. 2020, 4, 4–7. [Google Scholar]
  4. Chen, X. Enlightenment of “lung wind” in Nei Jing on the treatment of COVID-19 JIN Jue. Shanghai J. Trad. Chin. Med. 2020, 5, 6–10. [Google Scholar]
  5. Yang, Y.F.; Zhang, L.; Zhang, Y.B.; Yang, X.W. Simultaneous assessment of absorption characteristics of coumarins from Angelicae Pubescentis Radix: In vitro transport across Caco-2 cell and in vivo pharmacokinetics in rats after oral administration. J. Chromatogr. B 2017, 1060, 308–315. [Google Scholar] [CrossRef]
  6. Li, X.; Wang, J.; Gao, L. Anti-inflammatory and analgesic activity of r.a.p. (Radix Angelicae Pubescentis) ethanol extracts. Afr. J. Trad. Complement. Altern. Med. 2013, 10, 422–426. [Google Scholar] [CrossRef] [Green Version]
  7. Li, R.; Zhao, C.; Yao, M.; Song, Y.; Wu, Y.; Wen, A. Analgesic effect of coumarins from Radix angelicae pubescentis is mediated by inflammatory factors and TRPV1 in a spared nerve injury model of neuropathic pain. J. Ethnopharmacol. 2017, 195, 81–88. [Google Scholar] [CrossRef] [PubMed]
  8. Jiao, X.; Li, J.; Yu, X.; Liu, W.; Tian, J.; He, J.; Chang, Y. The pharmacokinetics, bioavailability and excretion of columbianetin acetate and its metabolite columbianetin were analysed in rat plasma by LC-MS/MS after administration of columbianetin acetate and Angelicae pubescentis radix extract. RSC Adv. 2015, 5, 95882–95893. [Google Scholar] [CrossRef]
  9. Emami, S.; Dadashpour, S. Current developments of coumarin-based anti-cancer agents in medicinal chemistry. Eur. J. Med. Chem. 2015, 102, 611–630. [Google Scholar] [CrossRef] [PubMed]
  10. Wang, S.; Sun, M.; Zhang, Y.; Zhang, J.; He, L. EGFR/cell membrane chromatography-online-high performance liquid chromatography/mass spectrometry method for screening EGFR antagonists from Radix Angelicae Pubescentis. Sci. China Chem. 2010, 53, 2357–2362. [Google Scholar] [CrossRef]
  11. Horstkotte, B.; Maya, F.; Duarte, C.M.; Cerdà, V. Determination of ppb-level phenol index using in-syringe dispersive liquid-liquid microextraction and liquid waveguide capillary cell spectrophotometry. Microchim. Acta 2012, 179, 91–98. [Google Scholar] [CrossRef]
  12. Alexovič, M.; Andruch, V.; Balogh, I.S.; Šandrejová, J. A single-valve sequential injection manifold (SV-SIA) for automation of air-assisted liquid-phase microextraction: Stopped flow spectrophotometric determination of chromium(vi). Anal. Meth. UK 2013, 5, 2497. [Google Scholar] [CrossRef]
  13. Chen, P.S.; Haung, W.Y.; Huang, S.D. Analysis of triazine herbicides using an up-and-down-shaker-assisted dispersive liquid–liquid microextraction coupled with gas chromatography–mass spectrometry. J. Chromatogr. B 2014, 955–956, 116–123. [Google Scholar] [CrossRef]
  14. Horstkotte, B.; Suárez, R.; Solich, P.; Cerdà, V. In-syringe magnetic stirring assisted dispersive liquid–liquid micro-extraction with solvent washing for fully automated determination of cationic surfactants. Anal. Meth. UK 2014, 6, 9601–9609. [Google Scholar] [CrossRef]
  15. Alexovič, M.; Wieczorek, M.; Kozak, J.; Kościelniak, P.; Balogh, I.S.; Andruch, V. An automatic, vigorous-injection assisted dispersive liquid–liquid microextraction technique for stopped-flow spectrophotometric detection of boron. Talanta 2015, 133, 127–133. [Google Scholar] [CrossRef] [PubMed]
  16. Leong, M.I.; Huang, S.D. Dispersive liquid–liquid microextraction method based on solidification of floating organic drop combined with gas chromatography with electron-capture or mass spectrometry detection. J. Chromatogr. A 2008, 1211, 8–12. [Google Scholar] [CrossRef]
  17. Berijani, S.; Assadi, Y.; Anbia, M.; Milani Hosseini, M.R.; Aghaee, E. Dispersive liquid–liquid microextraction combined with gas chromatography-flame photometric detection. J. Chromatogr. A 2006, 1123, 1–9. [Google Scholar] [CrossRef]
  18. Rezaee, M.; Assadi, Y.; Milani Hosseini, M.R.; Aghaee, E.; Ahmadi, F.; Berijani, S. Determination of organic compounds in water using dispersive liquid–liquid microextraction. J. Chromatogr. A 2006, 1116, 1–9. [Google Scholar] [CrossRef] [PubMed]
  19. Farahani, H.; Norouzi, P.; Dinarvand, R.; Ganjali, M.R. Development of dispersive liquid–liquid microextraction combined with gas chromatography–mass spectrometry as a simple, rapid and highly sensitive method for the determination of phthalate esters in water samples. J. Chromatogr. A 2007, 1172, 105–112. [Google Scholar] [CrossRef]
  20. Zang, X.H.; Wu, Q.H.; Zhang, M.Y.; Xi, G.H.; Wang, Z. Developments of dispersive liquid-liquid microextraction technique. Chin. J. Anal. Chem. 2009, 37, 161–168. [Google Scholar] [CrossRef] [Green Version]
  21. Khalili Zanjani, M.R.; Yamini, Y.; Shariati, S.; Jönsson, J.Å. A new liquid-phase microextraction method based on solidification of floating organic drop. Anal. Chim. Acta 2007, 585, 286–293. [Google Scholar] [CrossRef]
  22. Shamsipur, M.; Fattahi, N.; Sadeghi, M.; Pirsaheb, M. Determination of ultra traces of lead in water samples after combined solid-phase extraction–dispersive liquid–liquid microextraction by graphite furnace atomic absorption spectrometry. J. Iran. Chem. Soc. 2013, 11, 249–256. [Google Scholar] [CrossRef]
  23. Sadeghi, M.; Nematifar, Z.; Irandoust, M.; Fattahi, N.; Hamzei, P.; Barati, A.; Shamsipur, M. Efficient and selective extraction and determination of ultra trace amounts of Hg2+ using solid phase extraction combined with ion pair based surfactant-assisted dispersive liquid–liquid microextraction. RSC Adv. 2015, 5, 100511–100521. [Google Scholar] [CrossRef]
  24. Sun, X.; Xing, X.; Du, Z. Application of dispersive liquid–liquid microextraction based on solidification of floating organic drop for the determination of extractables from pharmaceutical packaging materials. Talanta 2019, 120540. [Google Scholar] [CrossRef] [PubMed]
  25. Pirsaheb, M.; Fattahi, N. Trace determination of heavy metals in farmed trout fish using dispersive liquid–liquid microextraction based on solidification of floating organic drop and graphite furnace atomic absorption spectrometry. Anal. Meth. UK 2015, 7, 6266–6273. [Google Scholar] [CrossRef]
  26. Ahmadi-Jouibari, T.; Fattahi, N. Speciation of inorganic arsenic species and total inorganic arsenic in rice using microwave-assisted dispersive liquid–liquid micro-extraction and electrothermal atomic absorption spectrometry. Food Addit. Contam. A 2015, 32, 1140–1147. [Google Scholar] [CrossRef] [PubMed]
  27. Rezaee, M.; Khalilian, F.; Mashayekhi, H.A.; Fattahi, N. A novel method for the high preconcentration of trace amounts of the aflatoxins in pistachios by dispersive liquid–liquid microextraction after solid-phase extraction. Anal. Meth. UK 2014, 6, 3456–3461. [Google Scholar] [CrossRef]
  28. Taheri, S.; Jalali, F.; Fattahi, N.; Bahrami, G. Sensitive determination of atorvastatin in human plasma by dispersive liquid-liquid microextraction and solidification of floating organic drop followed by high-performance liquid chromatography. J. Sep. Sci. 2014, 38, 309–315. [Google Scholar] [CrossRef] [PubMed]
  29. Hryniewicka, M.; Starczewska, B.; Gołębiewska, A. Determination of budesonide and sulfasalazine in water and wastewater samples using DLLME-SFO-HPLC-UV Method. Water 2019, 11, 1581. [Google Scholar] [CrossRef] [Green Version]
  30. Ahmadi-Jouibari, T.; Fattahi, N.; Shamsipur, M.; Pirsaheb, M. Dispersive liquid–liquid microextraction followed by high-performance liquid chromatography–ultraviolet detection to determination of opium alkaloids in human plasma. J. Pharm. Biomed. 2013, 85, 14–20. [Google Scholar] [CrossRef] [PubMed]
  31. Ahmadi-Jouibari, T.; Fattahi, N.; Shamsipur, M. Rapid extraction and determination of amphetamines in human urine samples using dispersive liquid–liquid microextraction and solidification of floating organic drop followed by high performance liquid chromatography. J. Pharm. Biomed. 2014, 94, 145–151. [Google Scholar] [CrossRef] [PubMed]
  32. Hou, X.; Zheng, X.; Zhang, C.; Ma, X.; Ling, Q.; Zhao, L. Ultrasound-assisted dispersive liquid–liquid microextraction based on the solidification of a floating organic droplet followed by gas chromatography for the determination of eight pyrethroid pesticides in tea samples. J. Chromatogr. B 2014, 969, 123–127. [Google Scholar] [CrossRef] [PubMed]
  33. Dai, L.; Cheng, J.; Matsadiq, G.; Liu, L.; Li, J.-K. Dispersive liquid–liquid microextraction based on the solidification of floating organic droplet for the determination of polychlorinated biphenyls in aqueous samples. Anal. Chim. Acta 2010, 674, 201–205. [Google Scholar] [CrossRef] [PubMed]
  34. Sanagi, M.M.; Abbas, H.H.; Ibrahim, W.A.W.; Aboul-Enien, H.Y. Dispersive liquid–liquid microextraction method based on solidification of floating organic droplet for the determination of triazine herbicides in water and sugarcane samples. Food Chem. 2012, 133, 557–562. [Google Scholar] [CrossRef] [PubMed]
  35. El-Shahawi, M.S.; Al-Saidi, H.M. Dispersive liquid-liquid microextraction for chemical speciation and determination of ultra-trace concentrations of metal ions. Trac. Trend Anal. Chem. 2013, 44, 12–24. [Google Scholar] [CrossRef]
  36. Rezaee, M.; Yamini, Y.; Khanchi, A.; Faraji, M.; Saleh, A. A simple and rapid new dispersive liquid–liquid microextraction based on solidification of floating organic drop combined with inductively coupled plasma-optical emission spectrometry for preconcentration and determination of aluminium in water samples. J. Hazard Mater. 2010, 178, 766–770. [Google Scholar] [CrossRef] [PubMed]
  37. Mandlate, J.S.; Soares, B.M.; Seeger, T.S.; Vecchia, P.D.; Mello, P.A.; Flores, E.M.M.; Duarte, F.A. Determination of cadmium and lead at sub-ppt level in soft drinks: An efficient combination between dispersive liquid-liquid microextraction and graphite furnace atomic absorption spectrometry. Food Chem. 2017, 221, 907–912. [Google Scholar] [CrossRef]
  38. Geim, A.K.; Novoselov, K.S. The rise of graphene. Nature 2017, 6, 183–191. [Google Scholar] [CrossRef]
  39. Novoselov, K.S.; Fal′ko, V.I.; Colombo, L.; Gellert, P.R.; Schwab, M.G.; Kim, K. A roadmap for graphene. Nature 2012, 490, 192–200. [Google Scholar] [CrossRef] [PubMed]
  40. Geim, A.K. Graphene: Status and Prospects. Science 2009, 324, 1530–1534. [Google Scholar] [CrossRef] [Green Version]
  41. Ma, X.; Wang, J.; Wu, Q.; Wang, C.; Wang, Z. Extraction of carbamate pesticides in fruit samples by graphene reinforced hollow fibre liquid microextraction followed by high performance liquid chromatographic detection. Food Chem. 2014, 157, 119–124. [Google Scholar] [CrossRef]
  42. Sun, M.; Tang, R.; Wu, Q.; Wang, C.; Wang, Z. Graphene Reinforced Hollow Fiber Liquid Phase Microextraction for the Enrichment of some Phenylurea Residues in Milk Sample. Food Anal. Meth. 2013, 7, 1097–1102. [Google Scholar] [CrossRef]
  43. Zhang, W.; Zhou, W.; Chen, Z. Graphene/polydopamine-modified polytetrafluoroethylene microtube for the sensitive determination of three active components in Fructus Psoraleaeby online solid-phase microextraction with high-performance liquid chromatography. J. Sep. Sci. 2014, 37, 3110–3116. [Google Scholar] [CrossRef] [PubMed]
  44. Yang, X. The Establishment of Novel Dispersive Liquid Phase Microextraction Methods and Their Application for Analysis of Cinnamic Acid Derivatives in Traditional Chinese Medicines; Shanxi Medical University: Taiyuan, China, 2018. [Google Scholar]
  45. Feng, Y.; Li, Q.; Yang, L.; Zhang, Y.; Qiu, D. The Use of 1H-qNMR Method for Simultaneous Determination of Osthol, Columbianadin, and Isoimperatorin in Angelicae Pubescentis Radix. J. Aoac. Int. 2020, 103, 851–856. [Google Scholar] [CrossRef] [PubMed]
  46. Owczarek, A.; Klys, A.; Olszewska, M.A. A validated 1H qNMR method for direct and simultaneous quantification of esculin, fraxin and (−)-epicatechin in Hippocastani cortex. Talanta 2019, 192, 263–269. [Google Scholar] [CrossRef] [PubMed]
Figure 1. Choice of extractant. Note: graphene oxide, GO; graphene, GR.
Molecules 26 02416 g001
Figure 2. The influence of the concentration of graphene in 1-dodecyl alcohol on ER of OS, CO and IS.
Molecules 26 02416 g002
Figure 3. The effect of the volume of the extractant on ER.
Molecules 26 02416 g003
Figure 4. The effect of pH on ER.
Molecules 26 02416 g004
Figure 5. The effects of different ionic strength on ER.
Molecules 26 02416 g005
Figure 6. The effects of different speed on ER.
Molecules 26 02416 g006
Figure 7. The effects of different extraction times on ER.
Molecules 26 02416 g007
Figure 8. The chemical structural formulas of OS (1), CO (2), and IS (3).
Molecules 26 02416 g008
Figure 9. The specific experimental operation process.
Molecules 26 02416 g009
Figure 10. The 1H-NMR spectrum of OS (1), CO (2), IS (3) and APR (4) obtained at 600 MHz in DMSO-d6 solvent. The quantitative signals of OS (A), CO (B) and IS (C) were at chemical shift of δ6.25–δ6.26 ppm, δ6.83–δ6.85 ppm, δ6.31–δ6.32 ppm.
Molecules 26 02416 g010
Figure 11. The 1H-NMR spectrum of APR: unextracted (1) and extracted (2), obtained at 600 MHz in DMSO-d6 solvent. The quantitative signals of OS (A), CO (B) and IS (C) were at chemical shift of δ6.25–δ6.26 ppm, δ6.83–δ6.85 ppm, δ6.31–δ6.32 ppm.
Molecules 26 02416 g011
Table 1. The advantages of the established method compared with other methods.
Detection MethodExtraction Method
1H-qNMRHPLC DLLME-SFOOther extraction
methods
Requirement on sample formNo specific
requirements
LiquidVolume of samples
required
1 mL≥10 mL
Demand for reference
substances
NoYesNeed to stand layerNoYes
Detection test≤5 min>10 minExtraction time20 min>20 min
Recycling of samples after measurementYesNoSimultaneous separation and extractionYesNo
Table 2. Linearity, limit of detection and limit of quantification of OS, CO and IS.
AnalyteLinear Regression EquationR2LOD (mg/mL)LOQ (mg/mL)
OSy = 0.0798x + 0.00080.99940.06600.2201
COy = 0.0822x + 0.00070.99940.07200.2401
ISy = 0.0784x − 0.00110.99950.06200.2066
Table 3. The recovery of OS, CO and IS.
AnalyteOriginal
Content (g)
Added
Content (g)
Total
Observed (g)
Recovery
(%)
Average
Recovery (%)
RSD
(%)
OS0.00570.00570.011398.19102.263.62
0.0117104.46
0.0117106.12
0.011297.37
0.0117105.13
CO0.00850.00850.0170100.0799.893.86
0.016897.66
0.016694.29
0.0172101.64
0.0175105.79
IS0.00580.00570.011497.93103.284.15
0.0121109.33
0.0118103.68
0.011599.11
0.0119106.34
Table 4. The content of OS, CO and IS of APR from different producing areas.
NumberContent (g/g)
OSCOIS
10.00230.00400.0017
20.00160.0021-
30.00240.0040-
40.00030.00060.0007
50.00020.00100.0002
60.00260.00490.0030
70.00430.00610.0002
80.00420.00690.0007
90.00420.00690.0008
100.00200.00550.0015
Publisher’s Note: MDPI stays neutral with regard to jurisdictional claims in published maps and institutional affiliations.

