
Solution and Solid-State Photophysical Properties of Positional Isomeric Acrylonitrile Derivatives with Core Pyridine and Phenyl Moieties: Experimental and DFT Studies

 ,
,
Abstract
:
1. Introduction
2. Result and Discussion
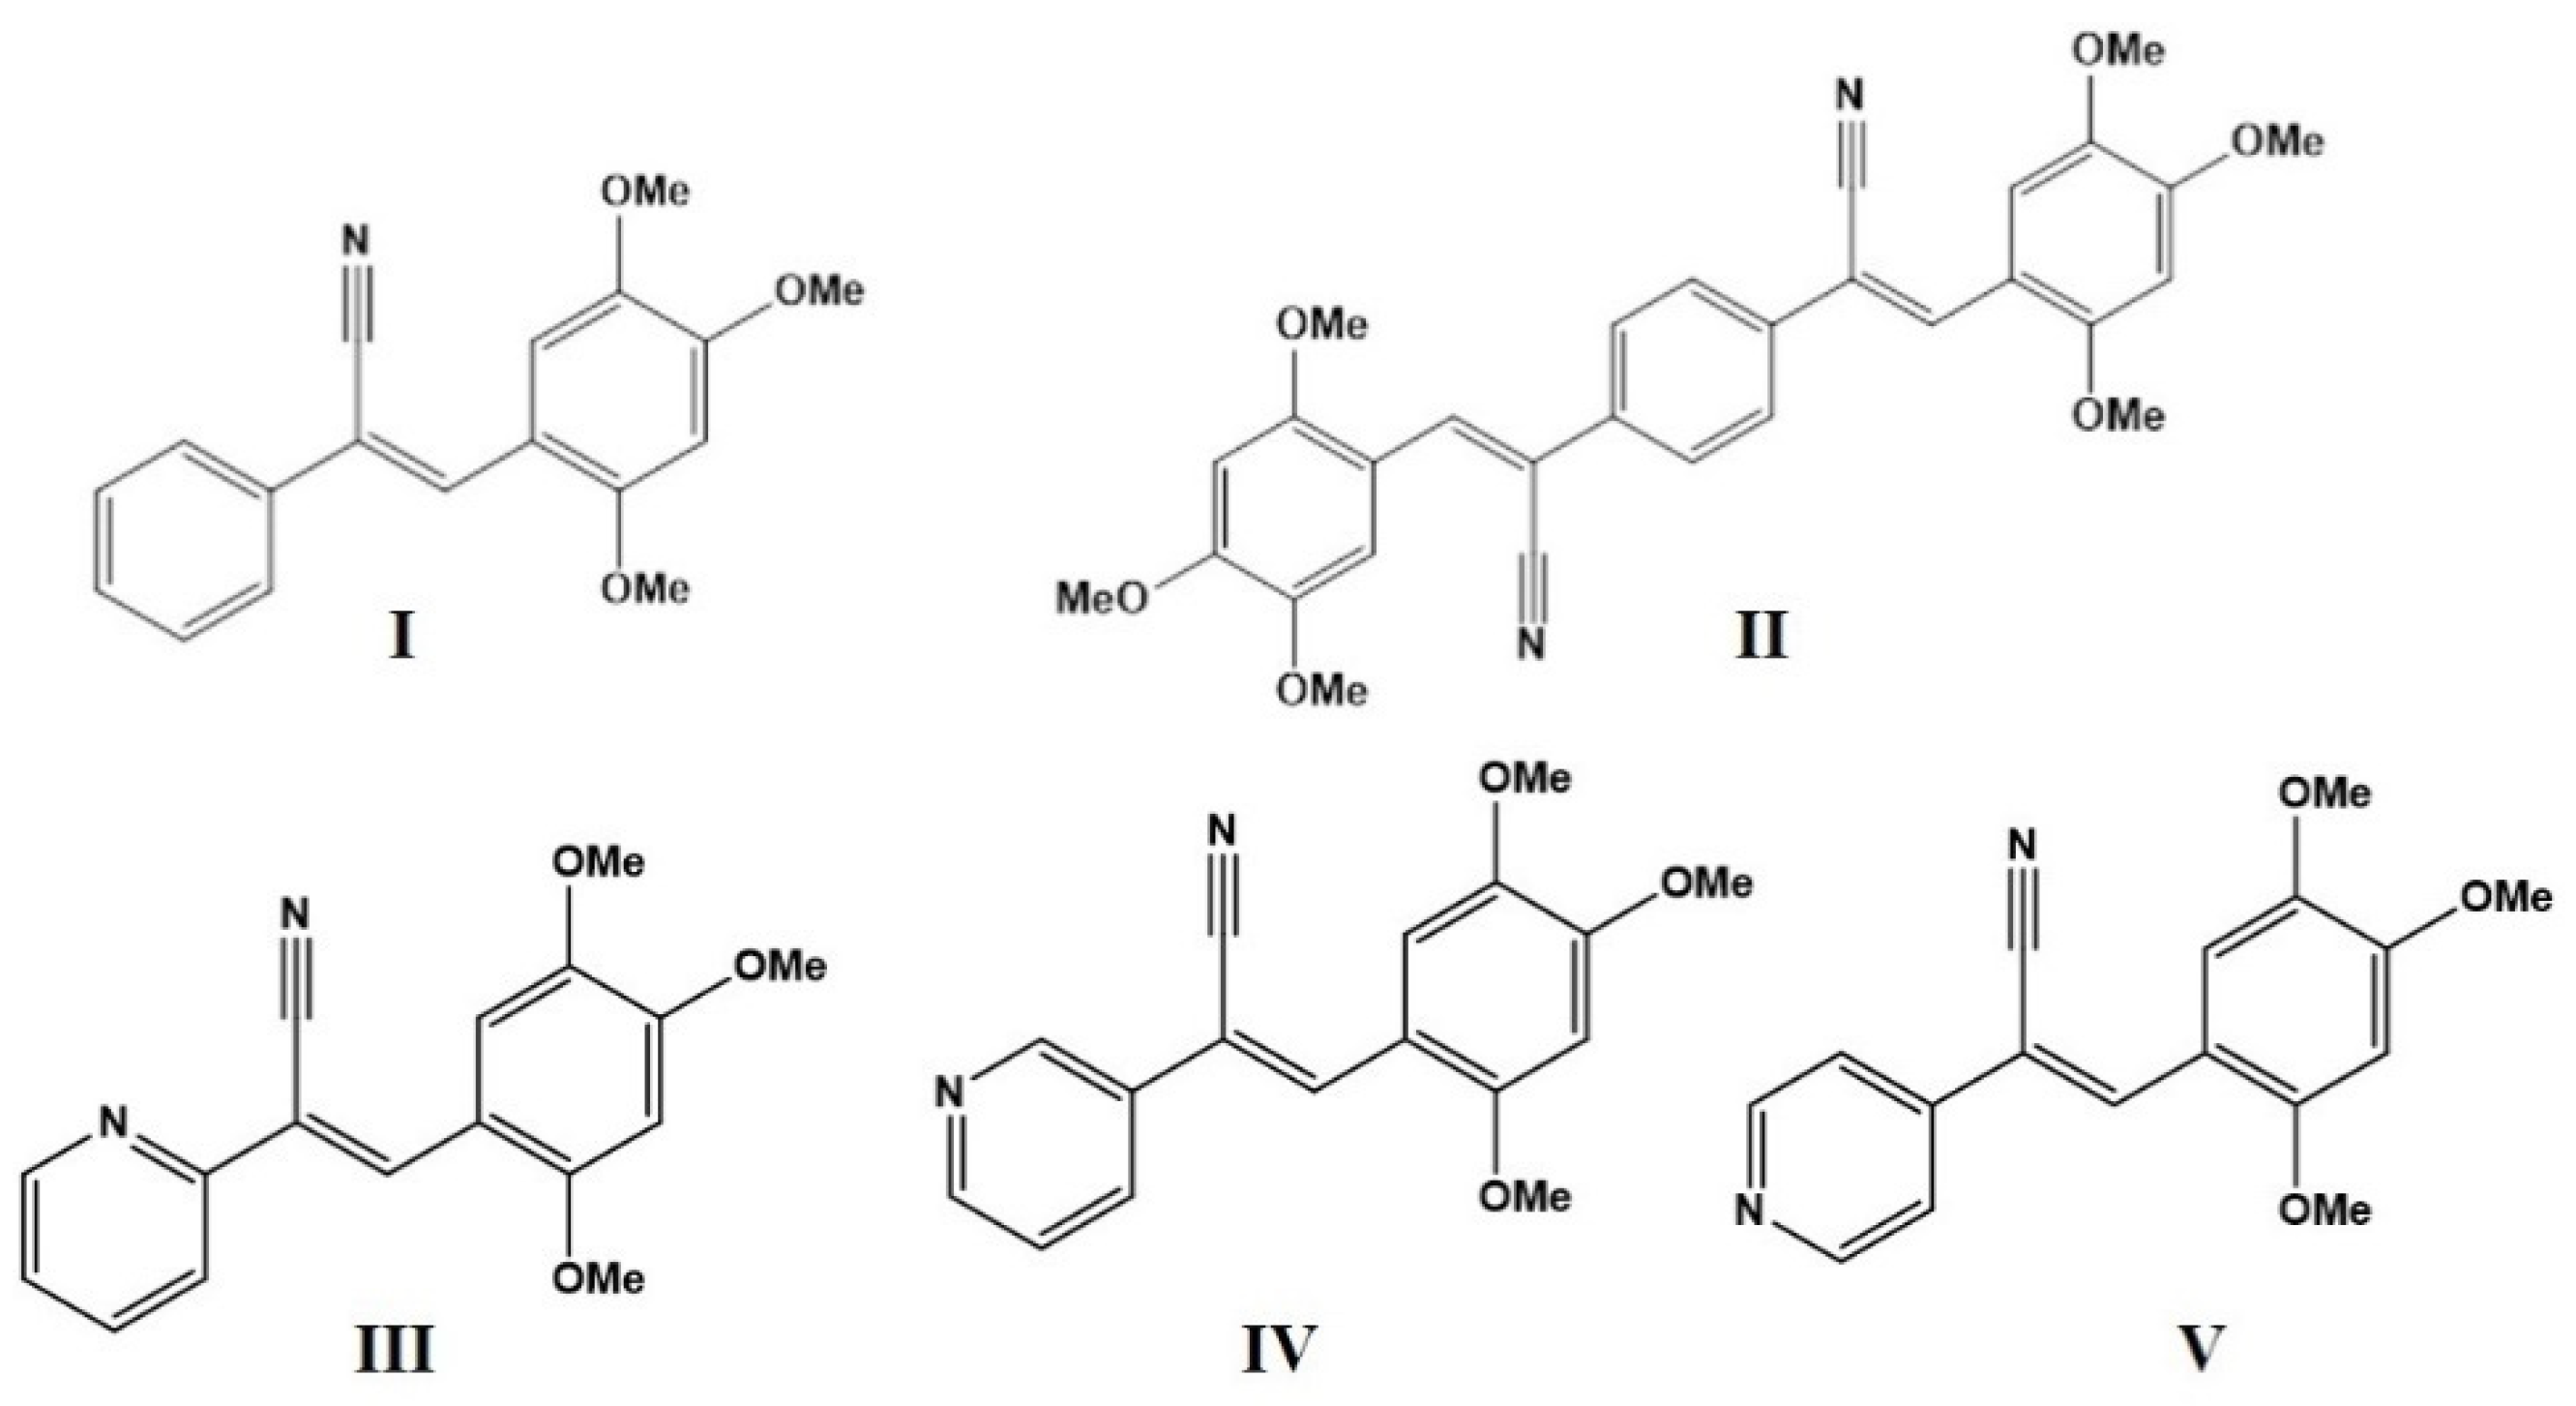
2.1. Synthesis
2.2. Absorption Properties of I–V in Solution and Solid State
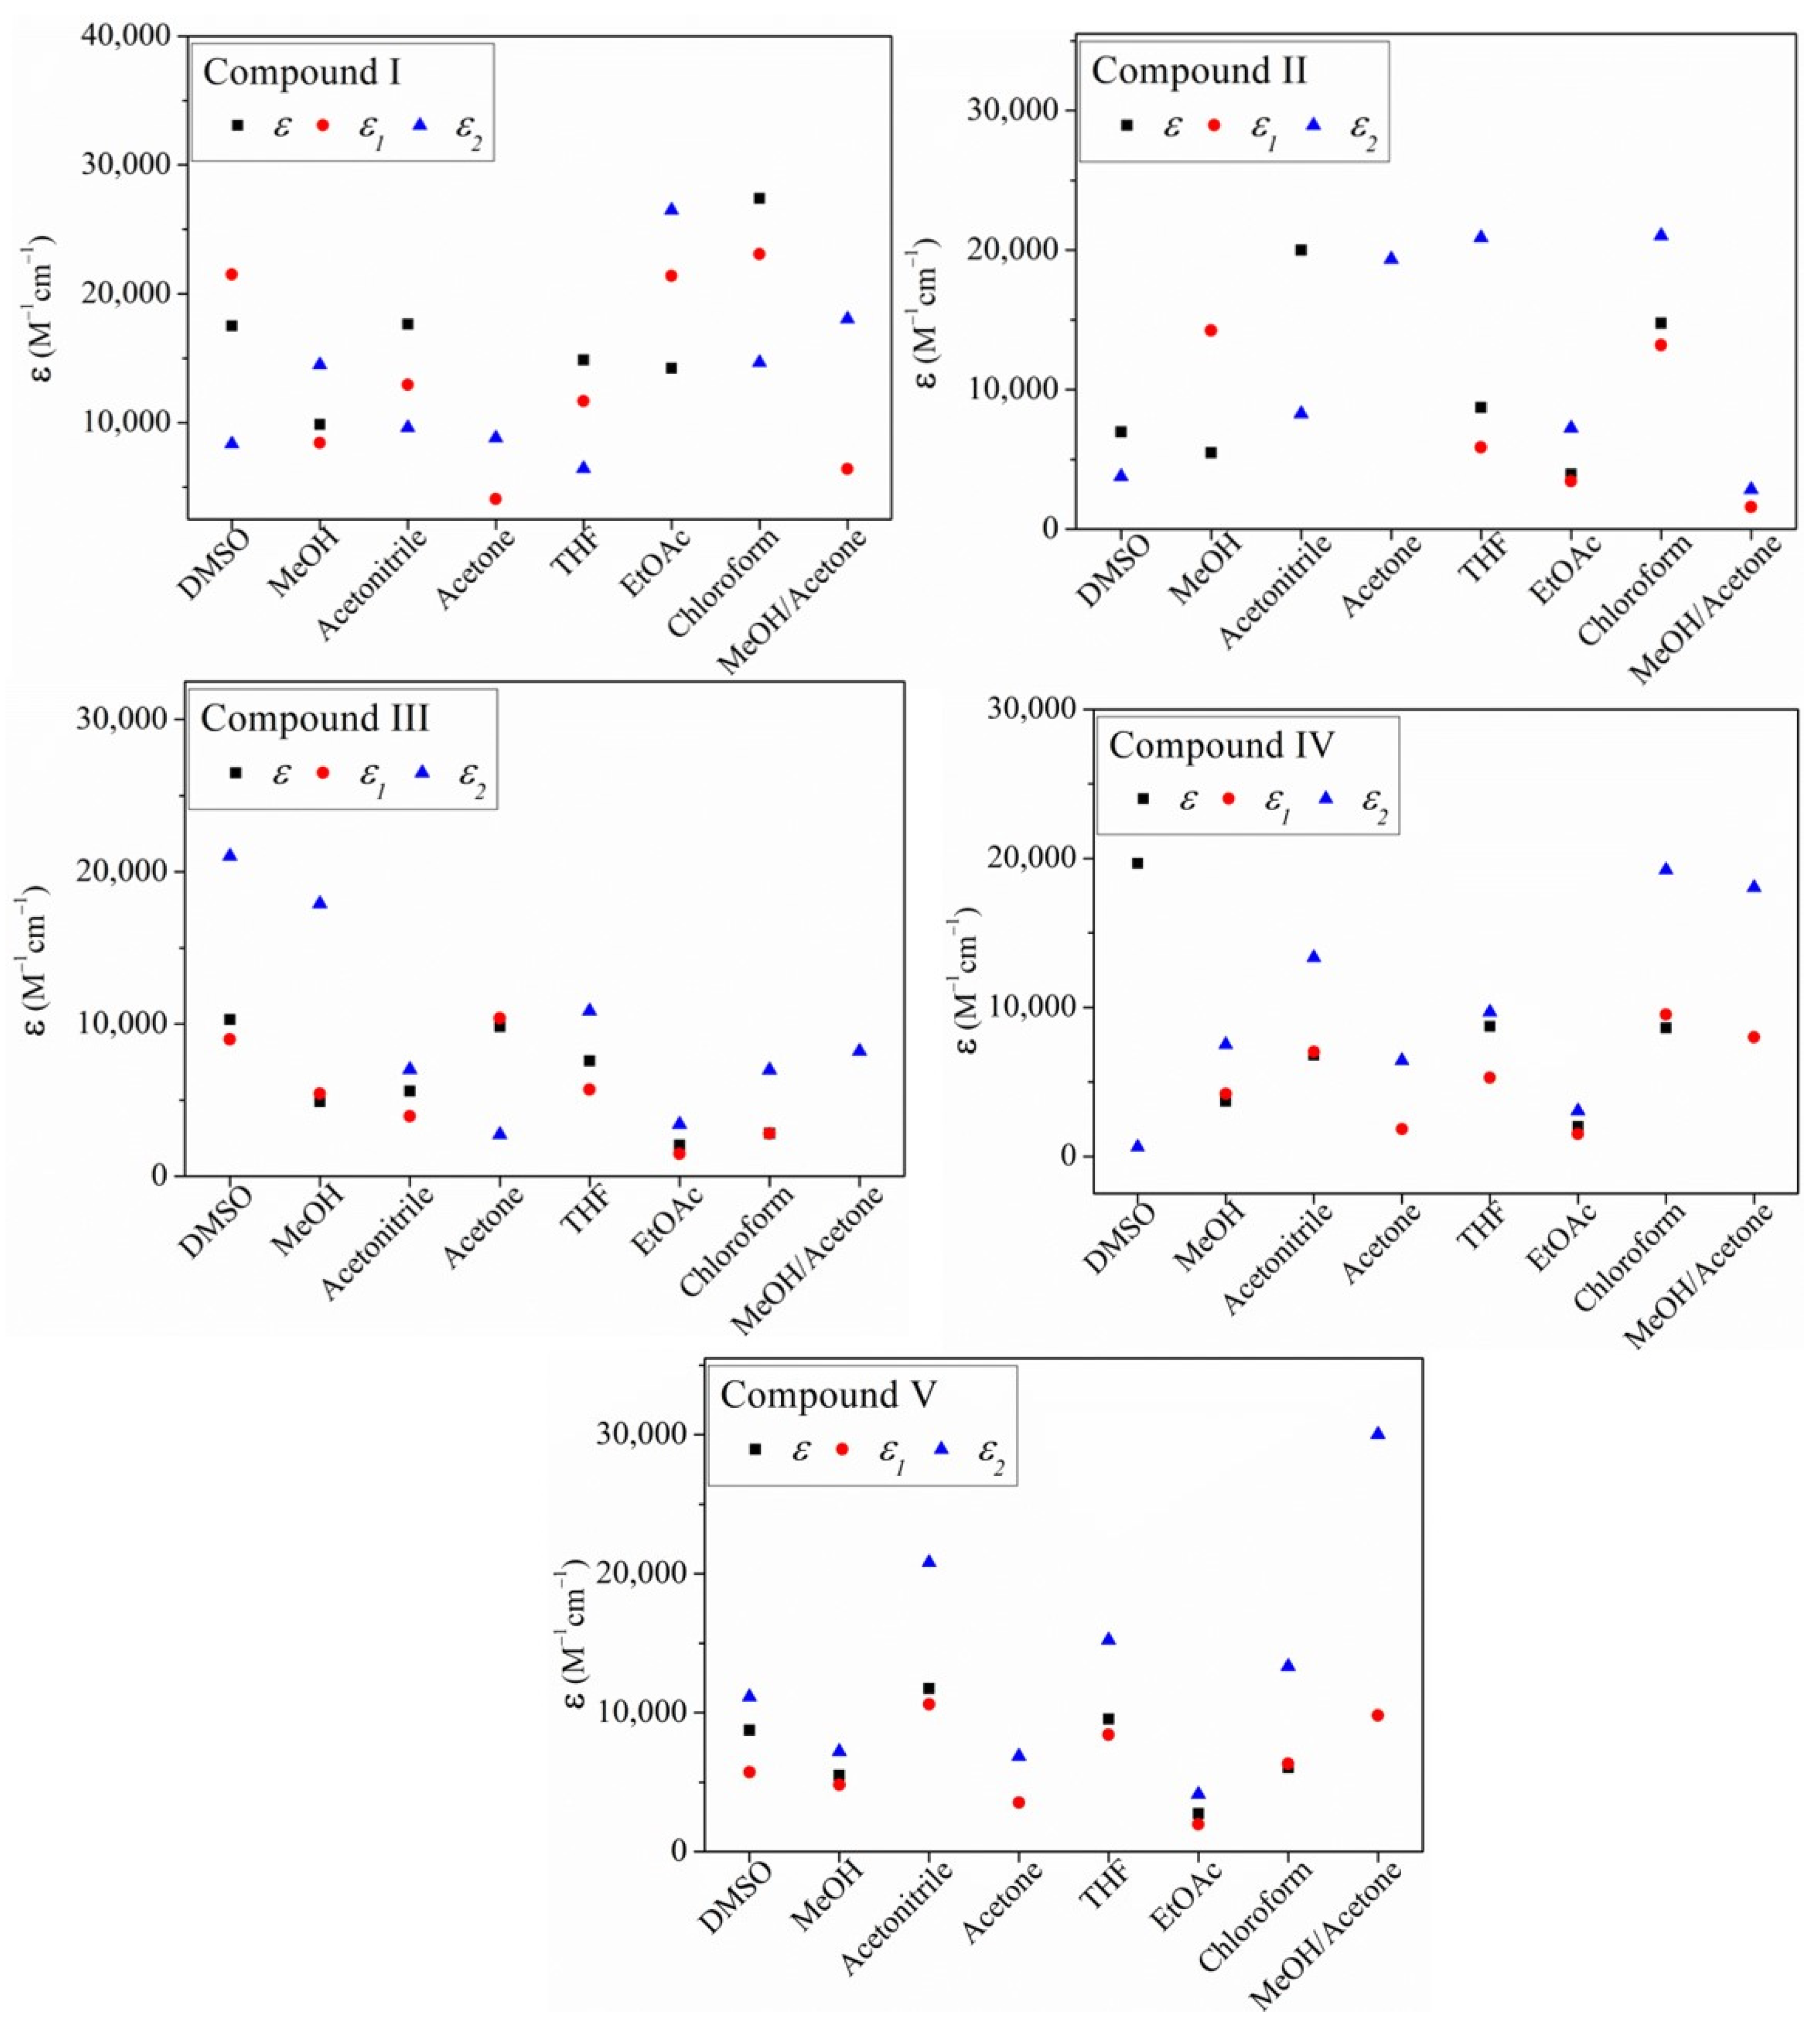
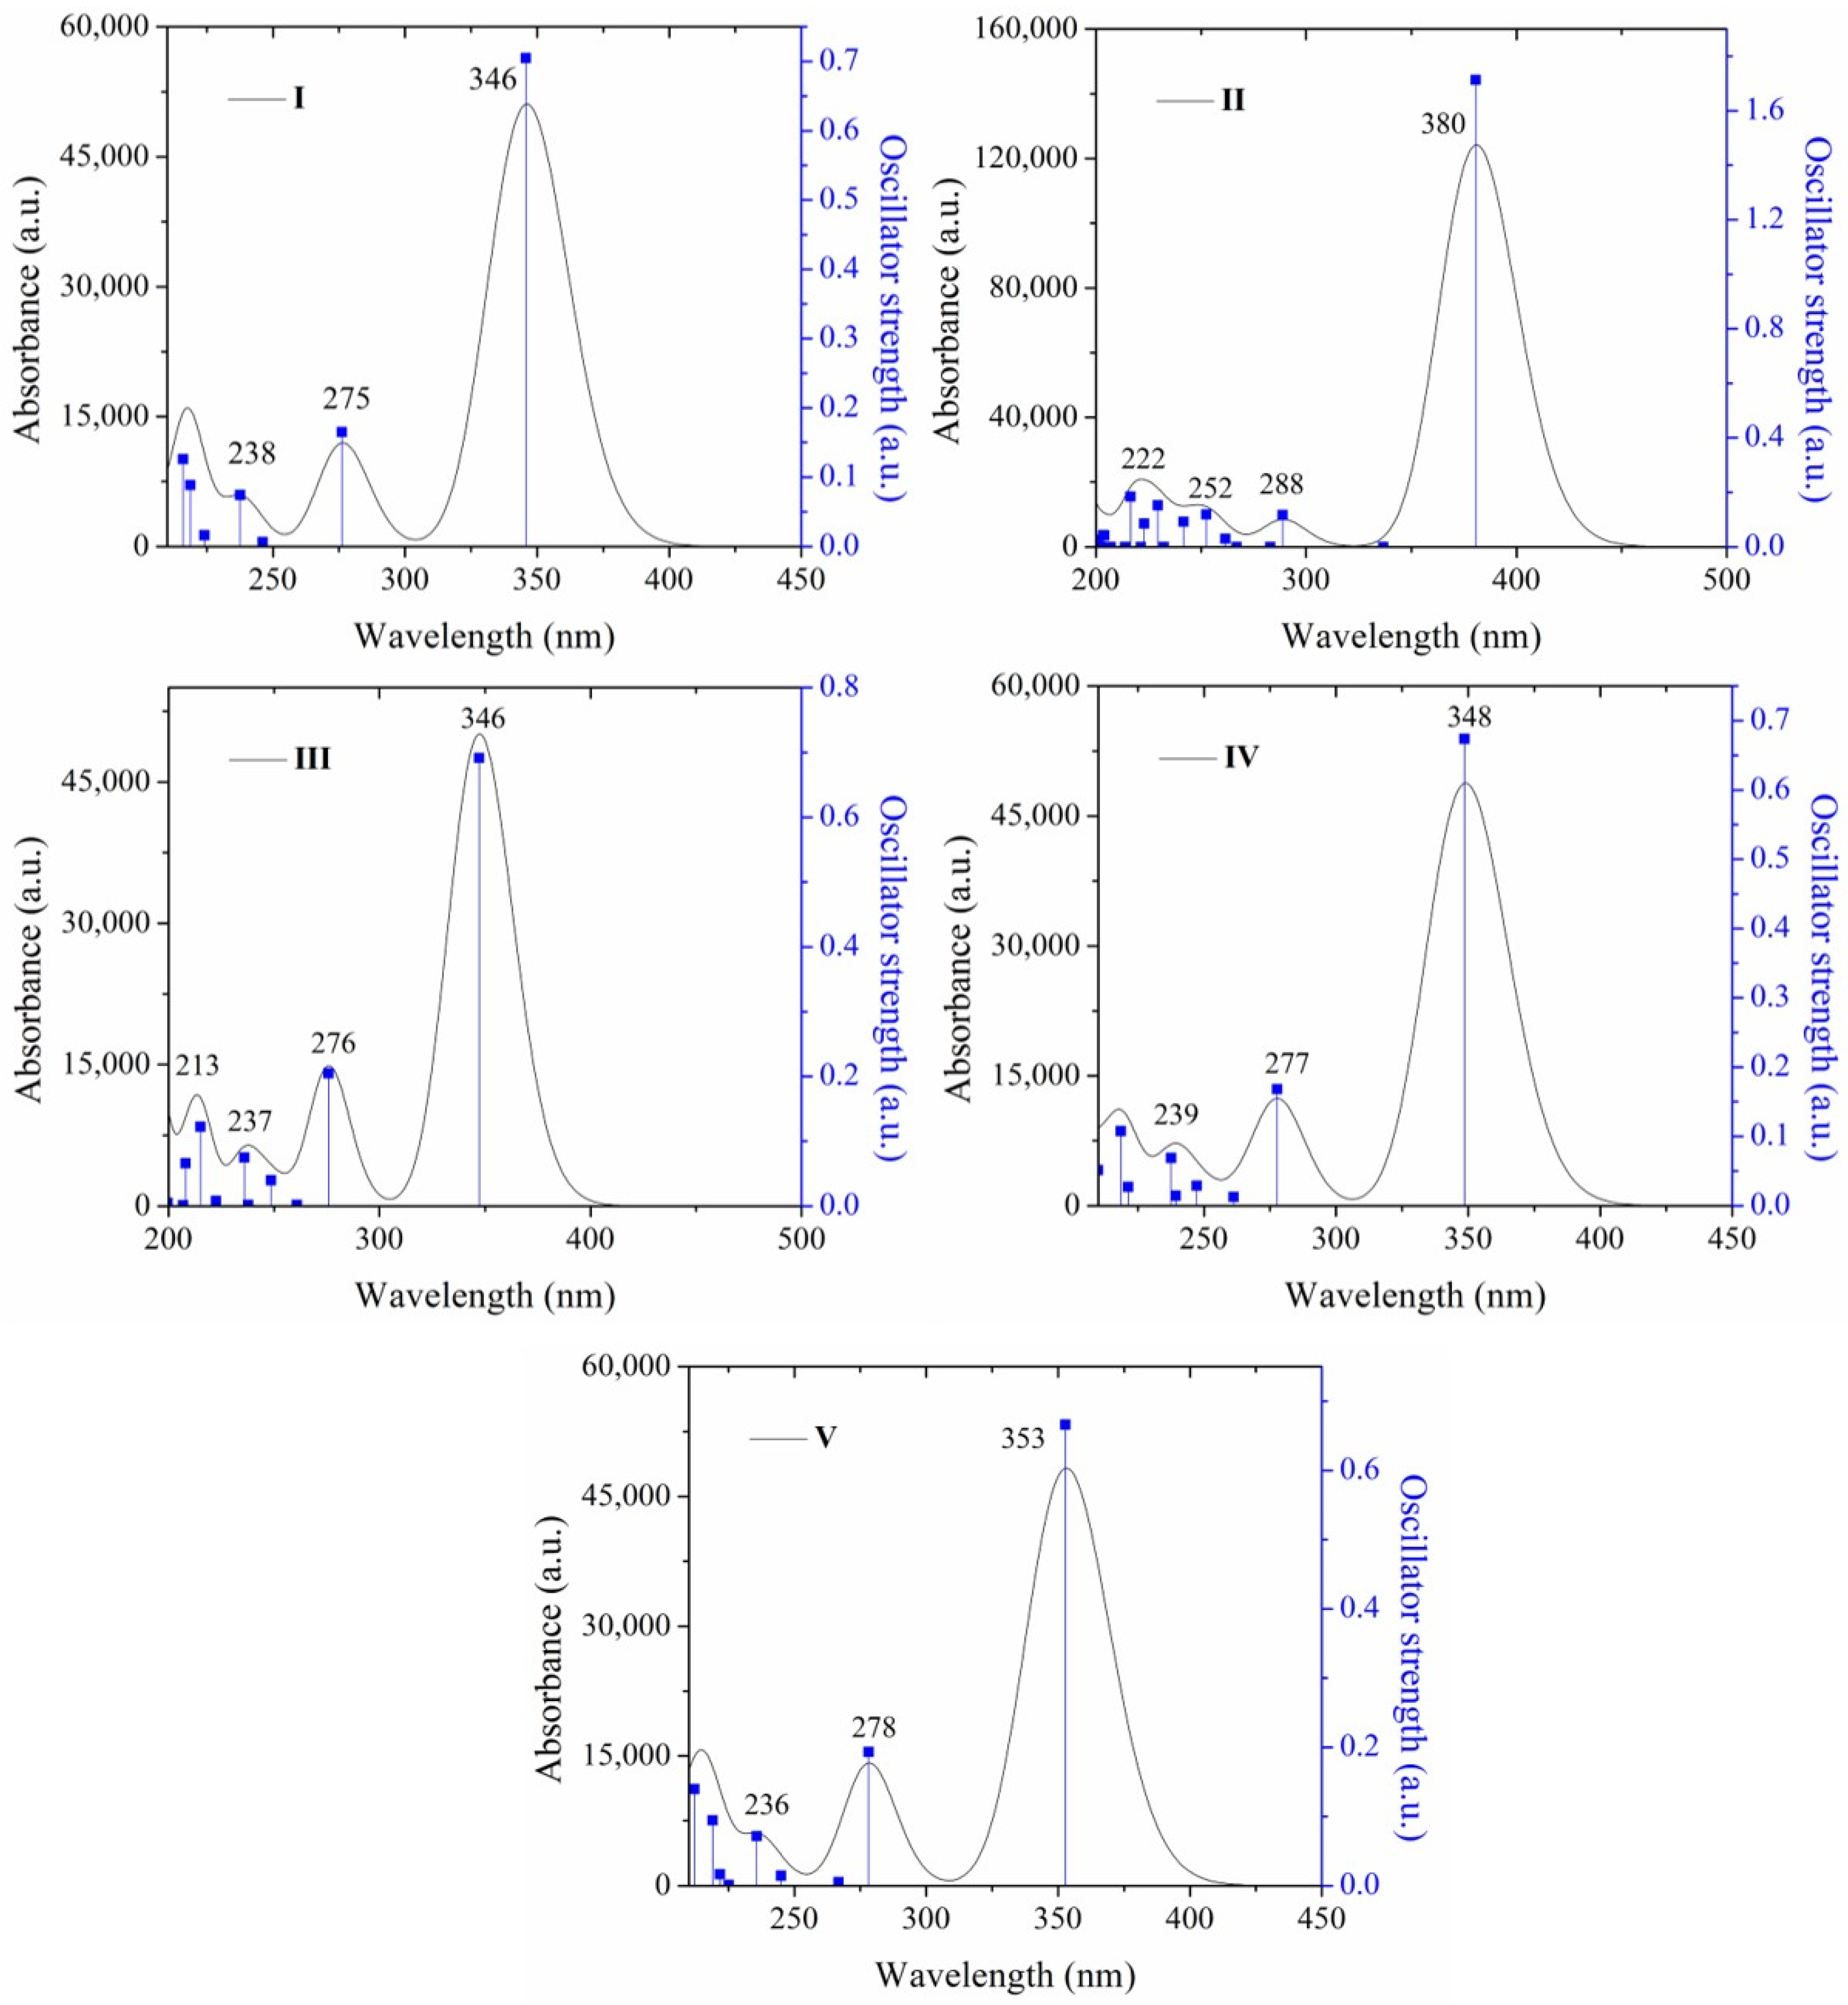
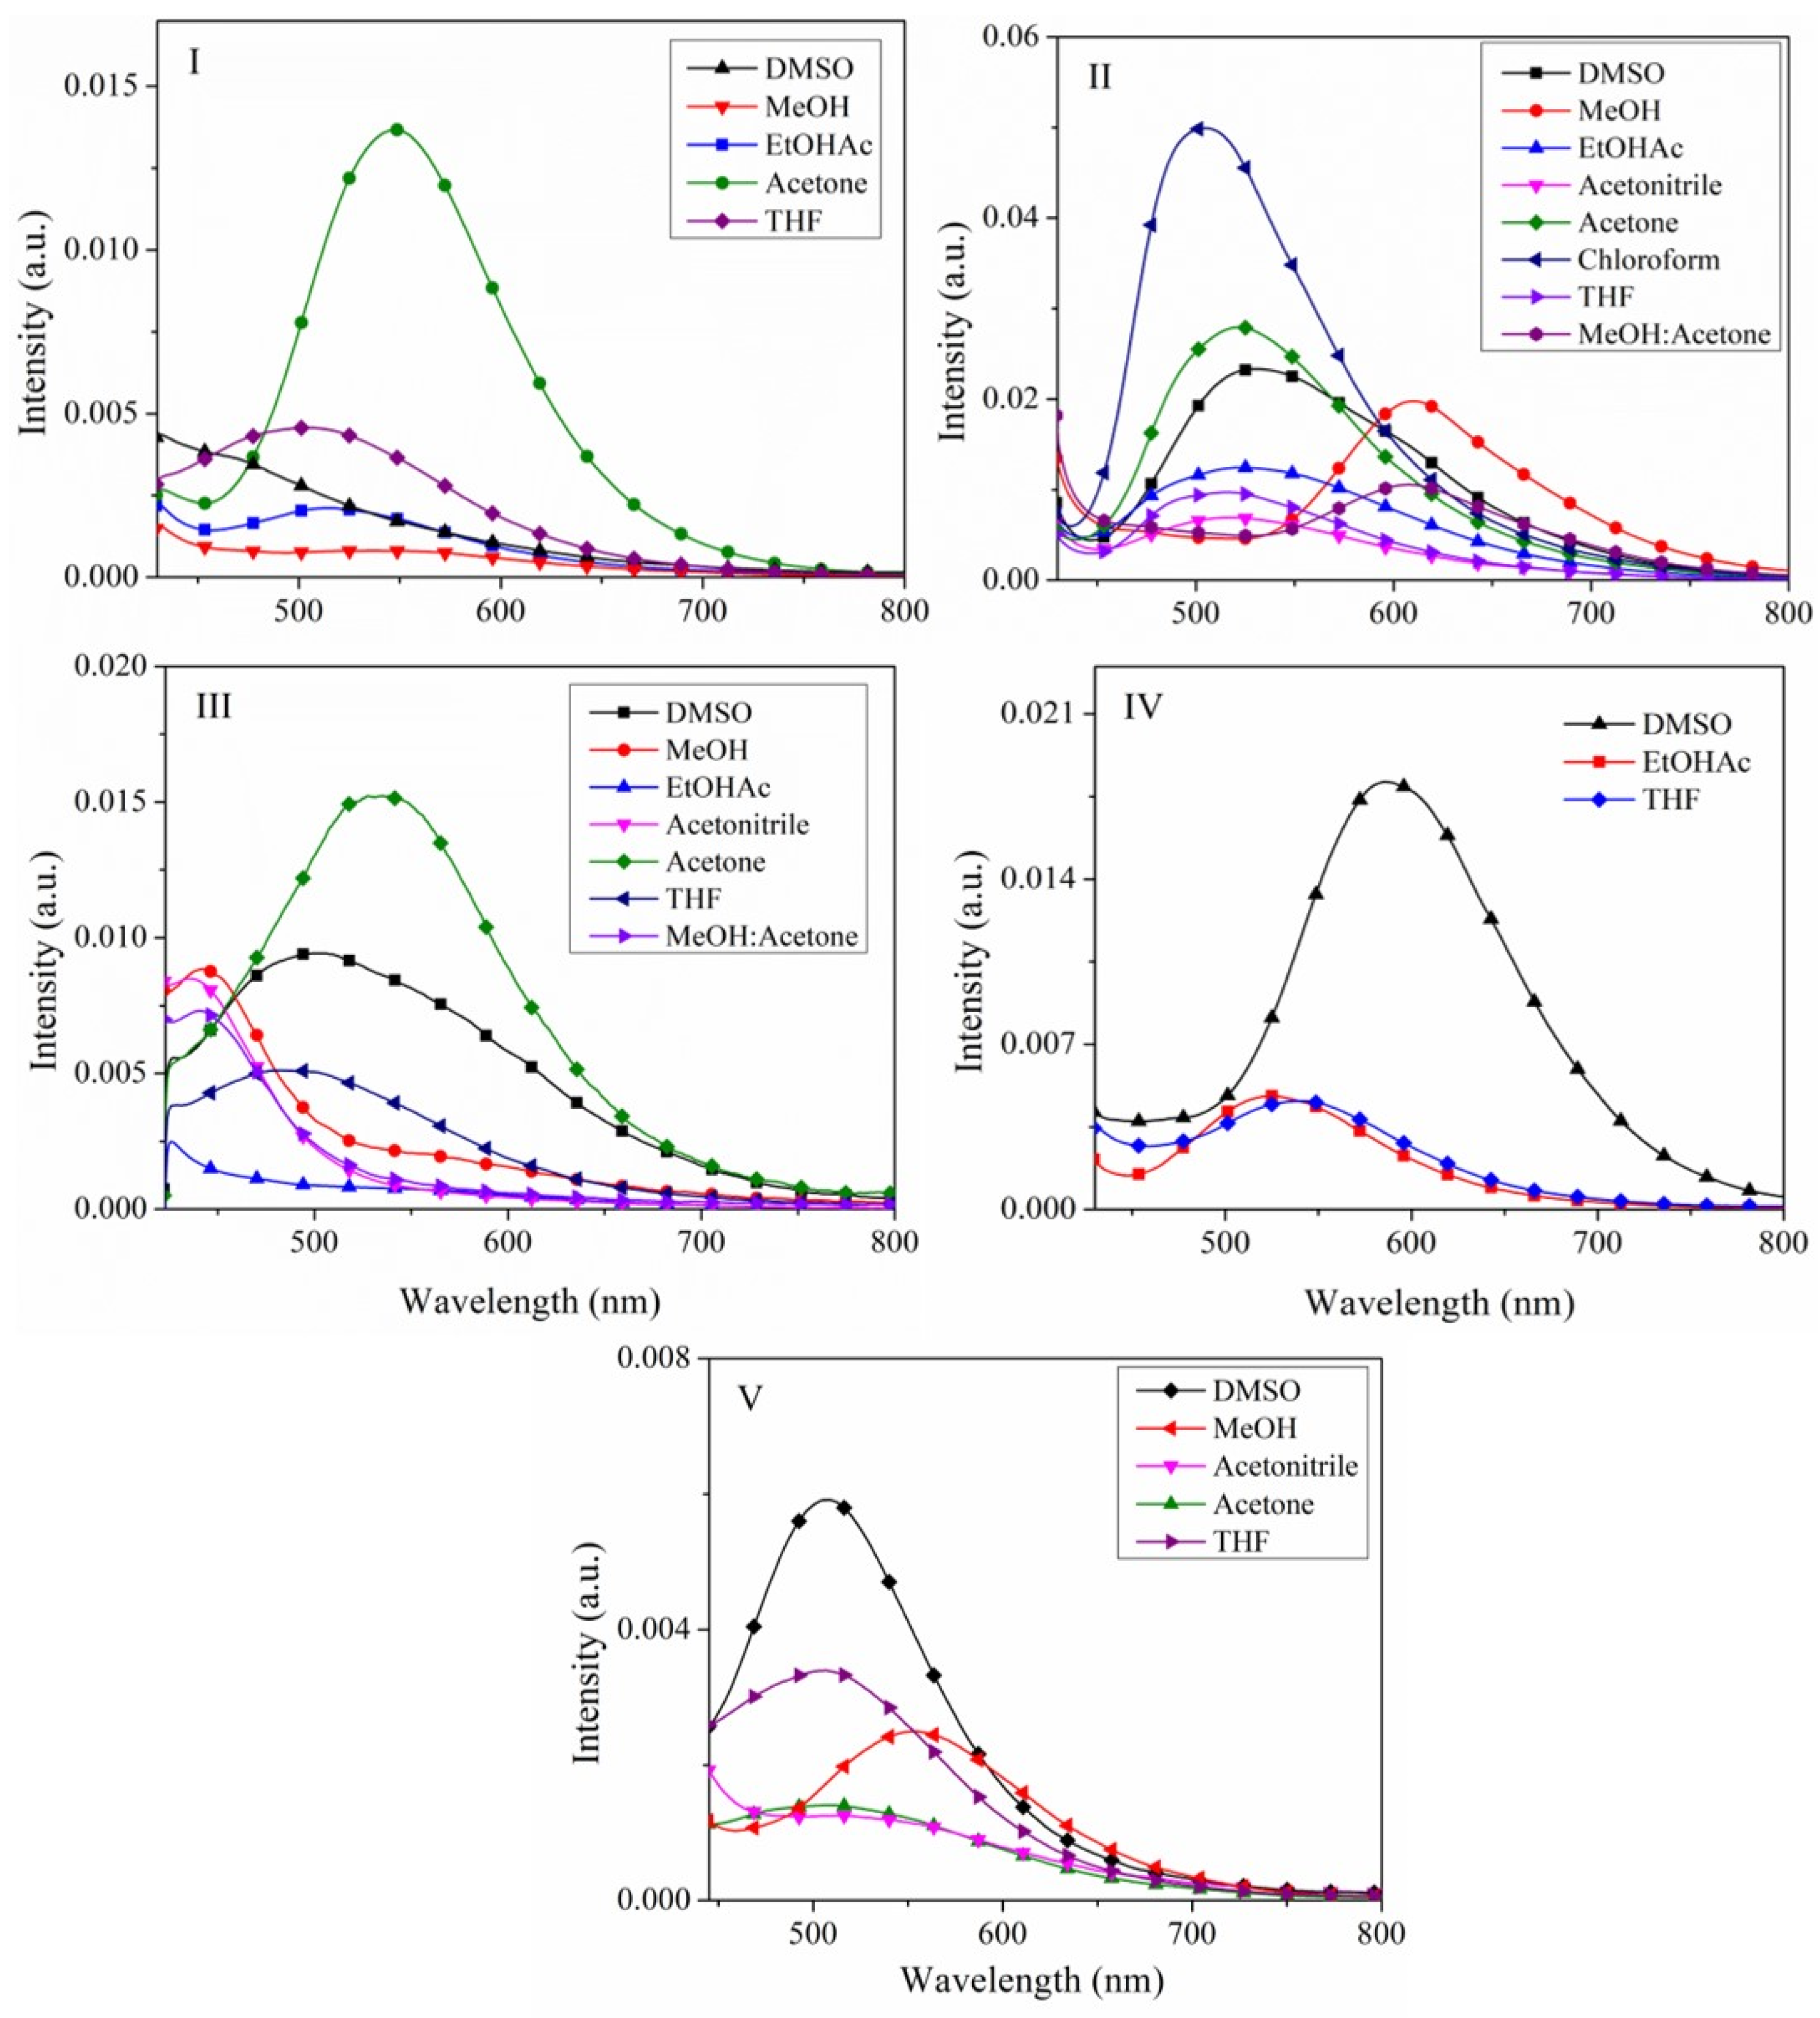
2.2.1. The Effect of the Solvent on the Absorption Spectra
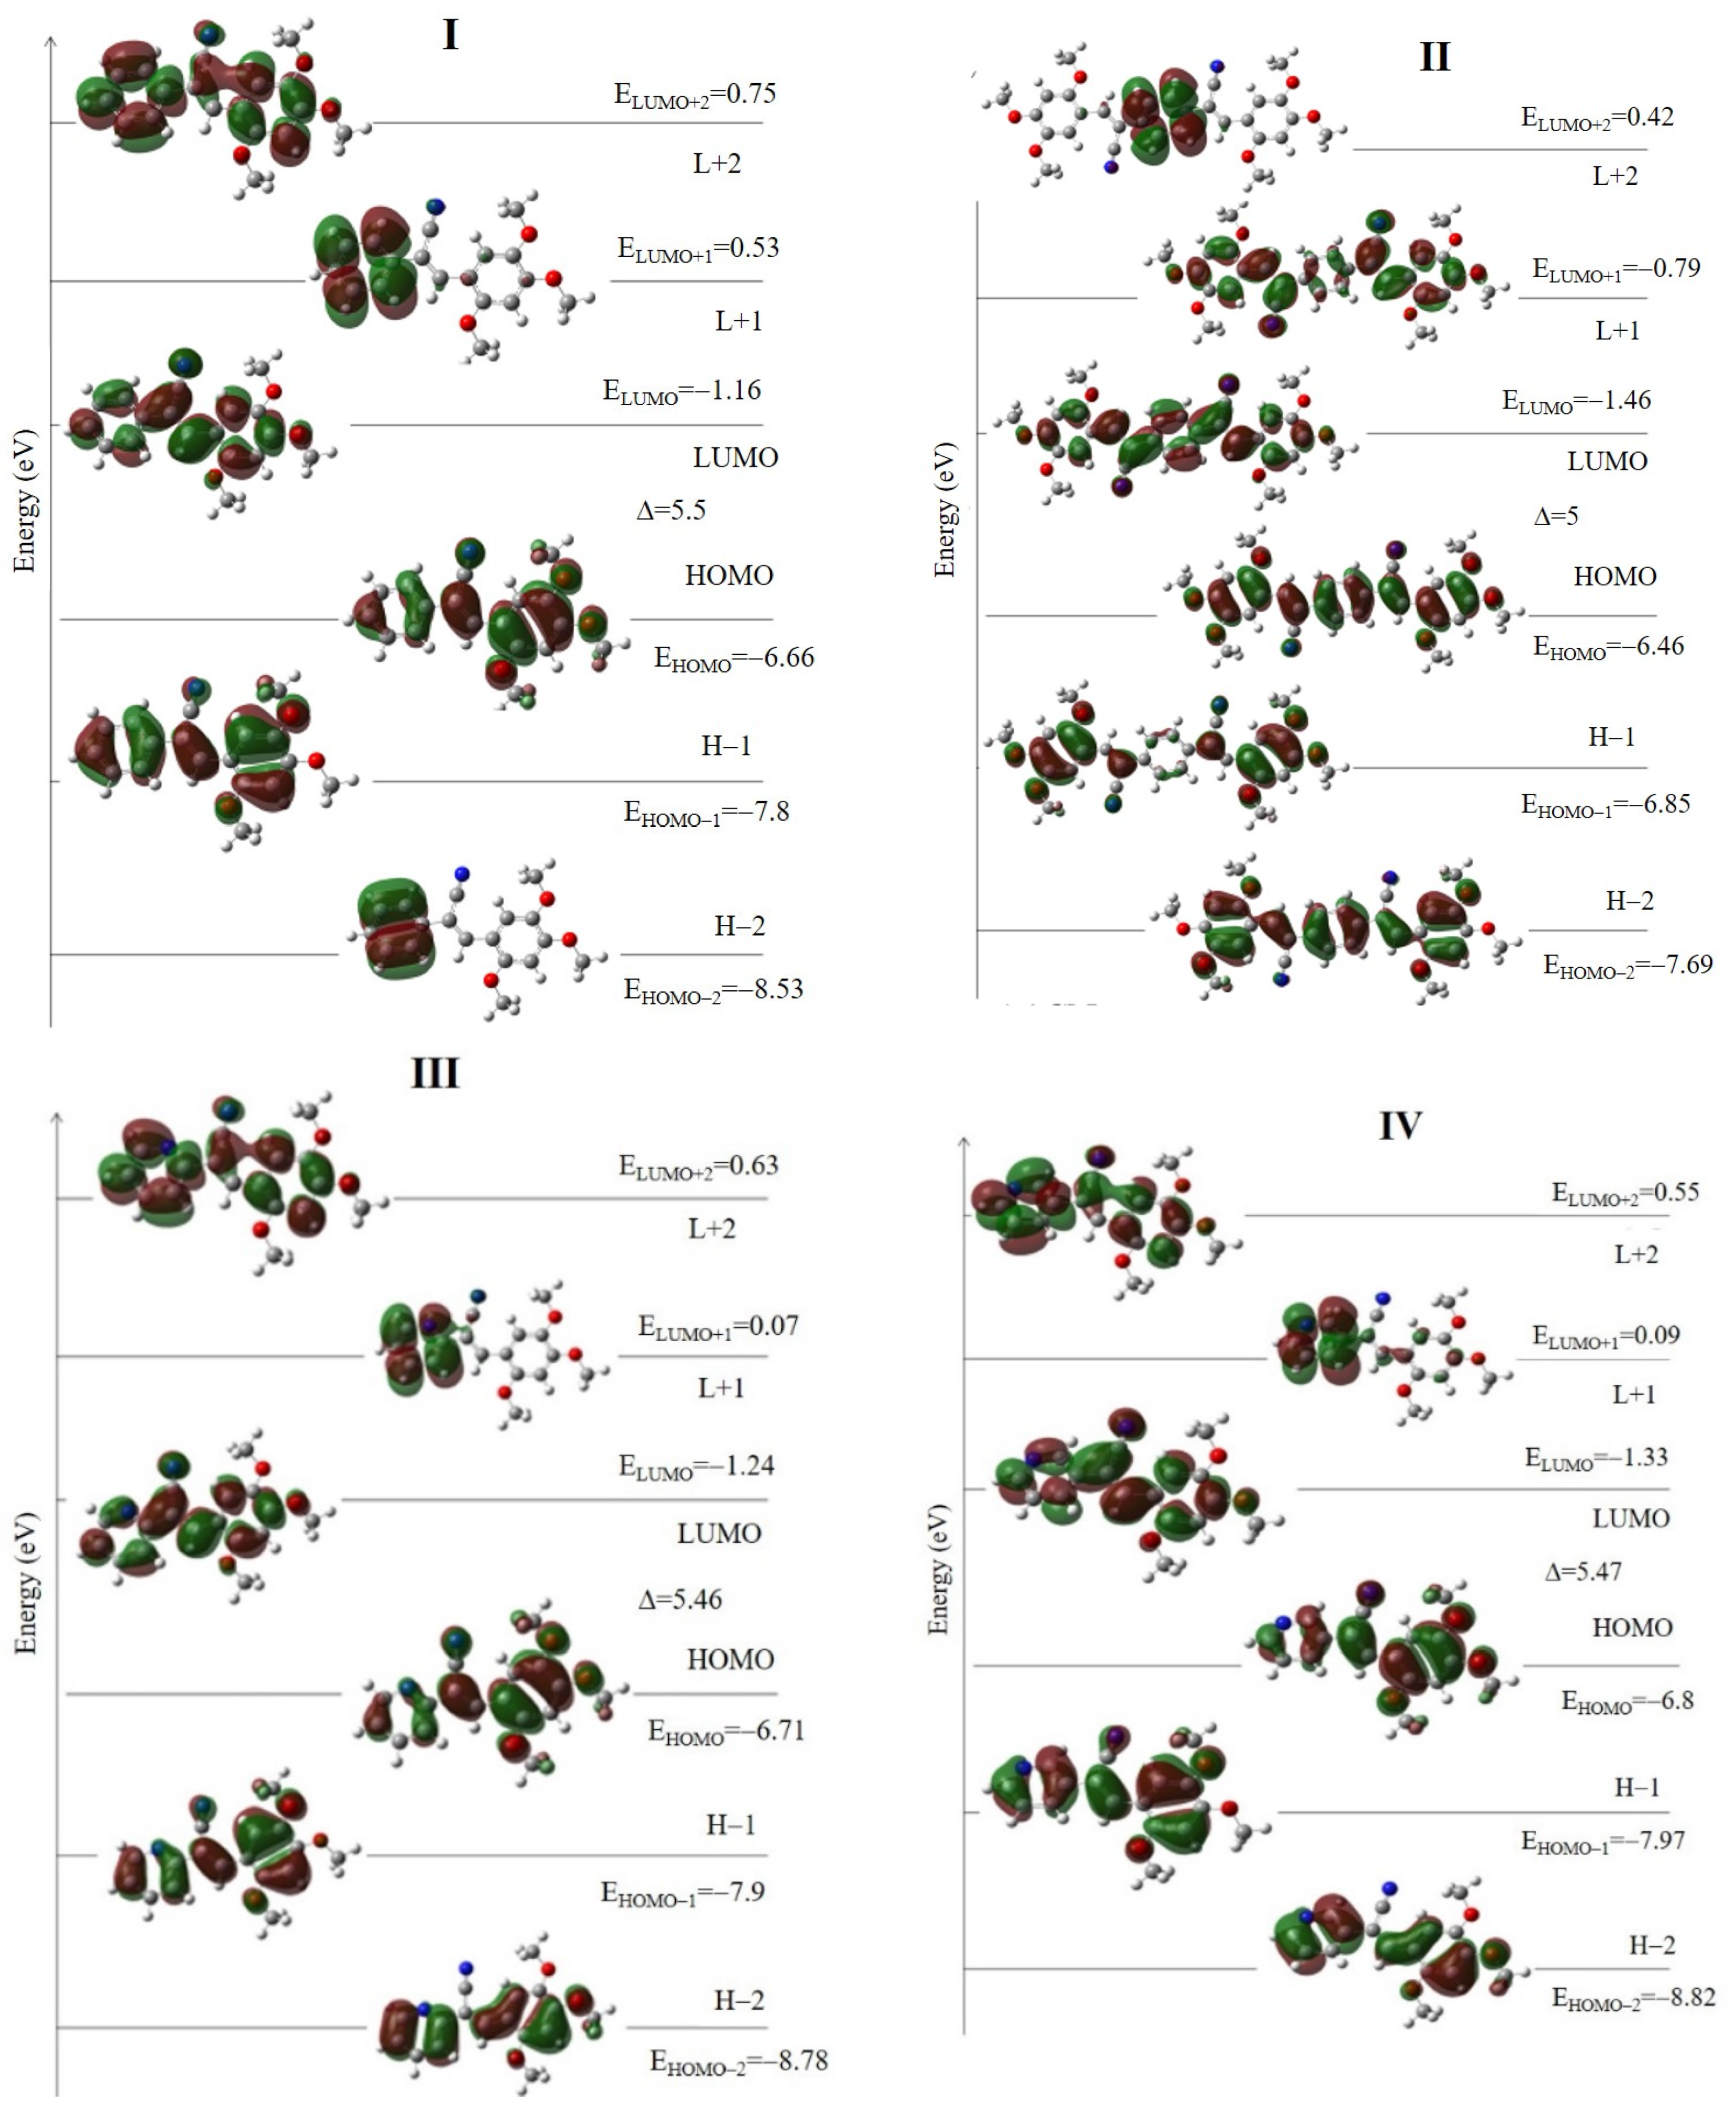
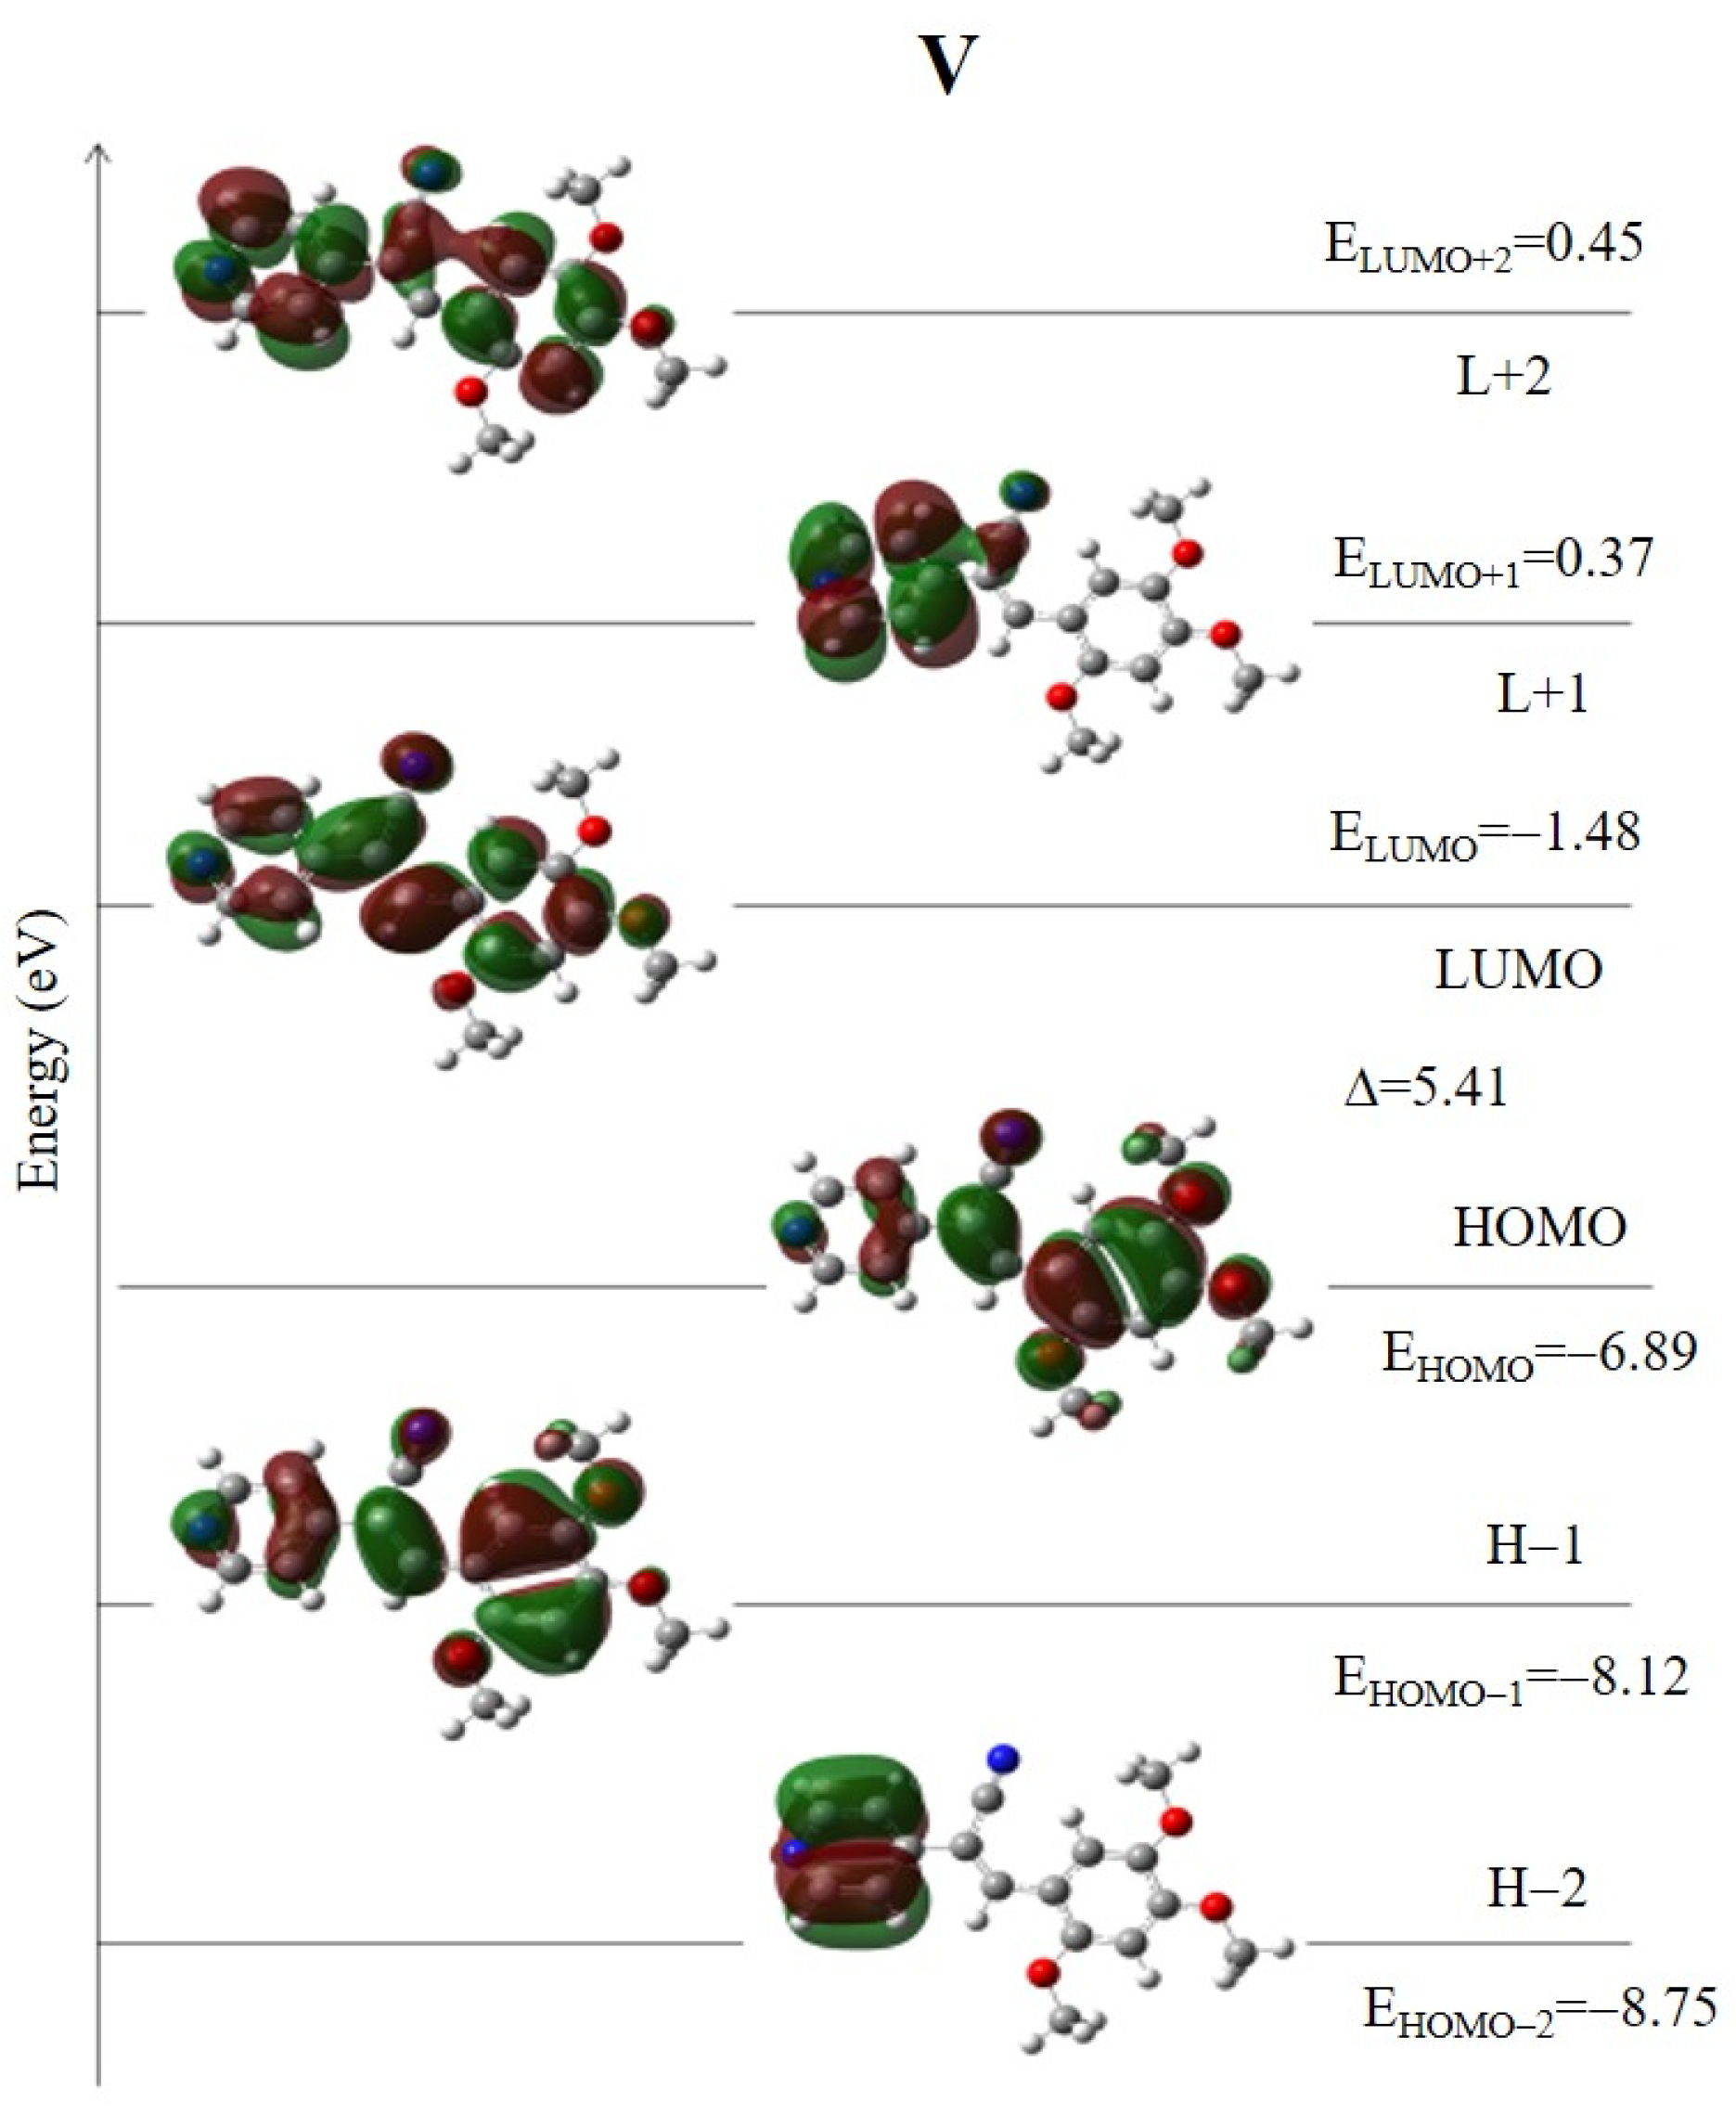
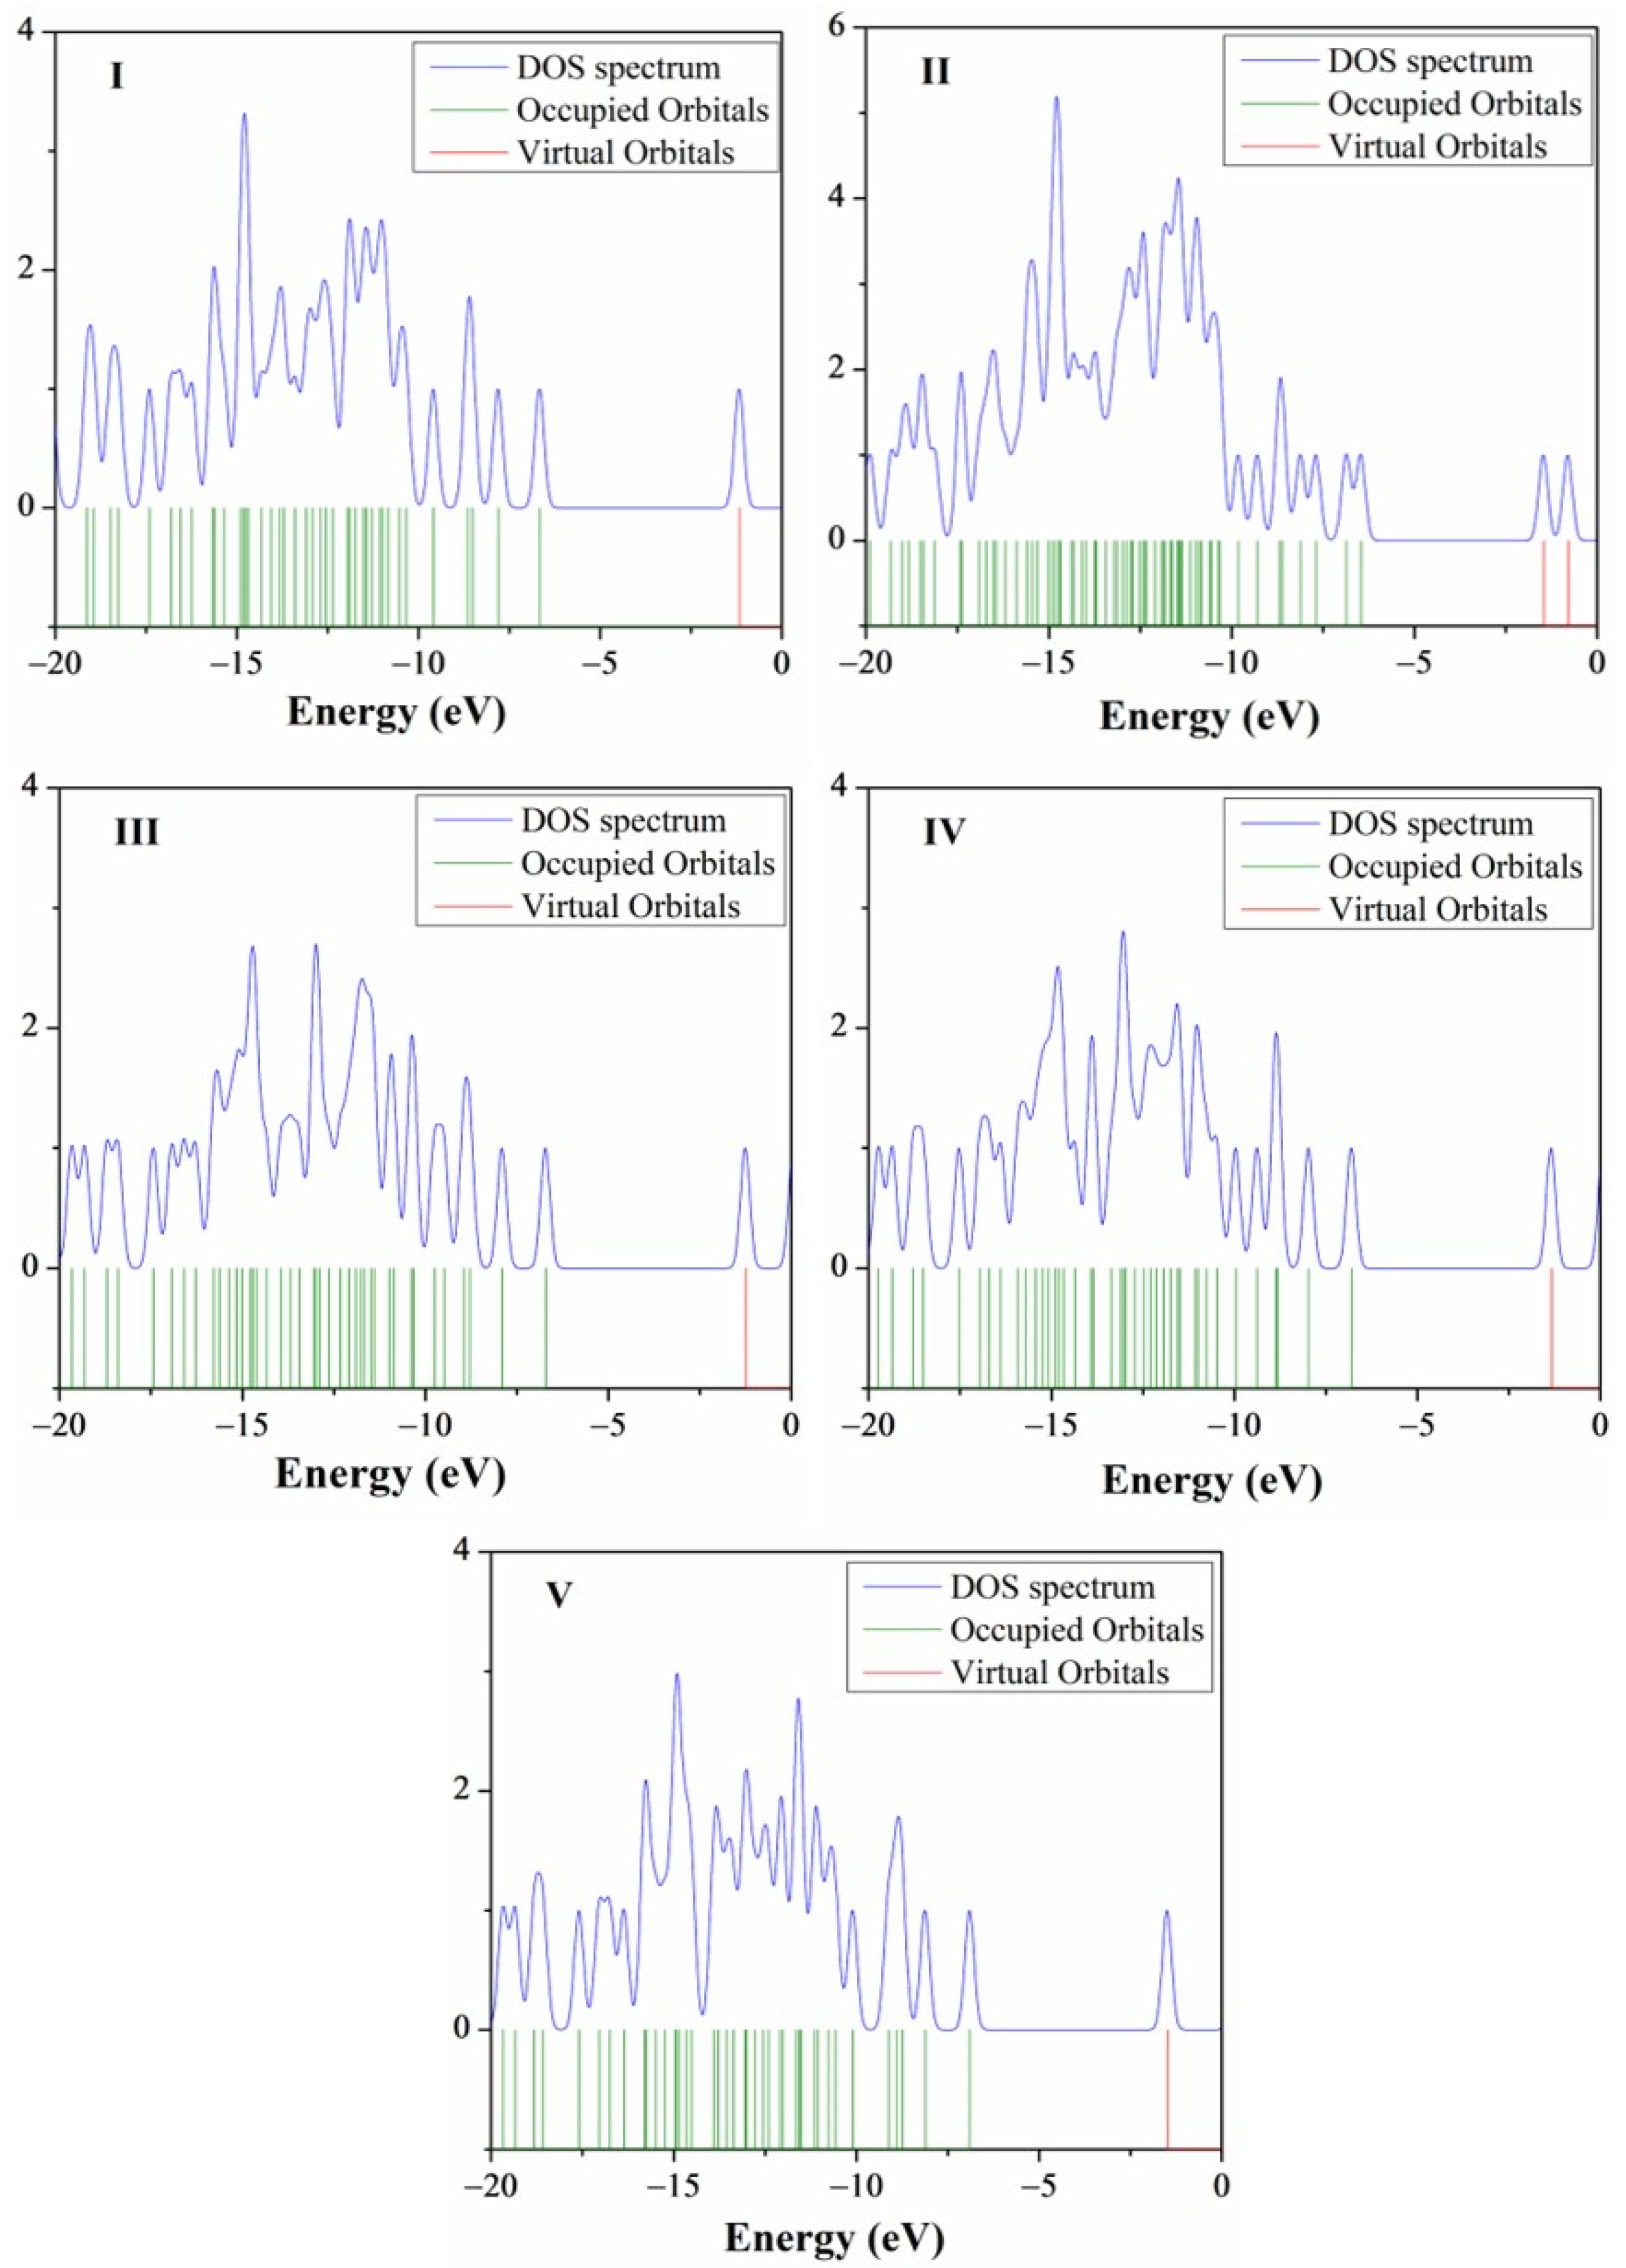
2.2.2. Absorption Properties by Theoretical Calculation
2.2.3. Absorption Spectra in the Solid State
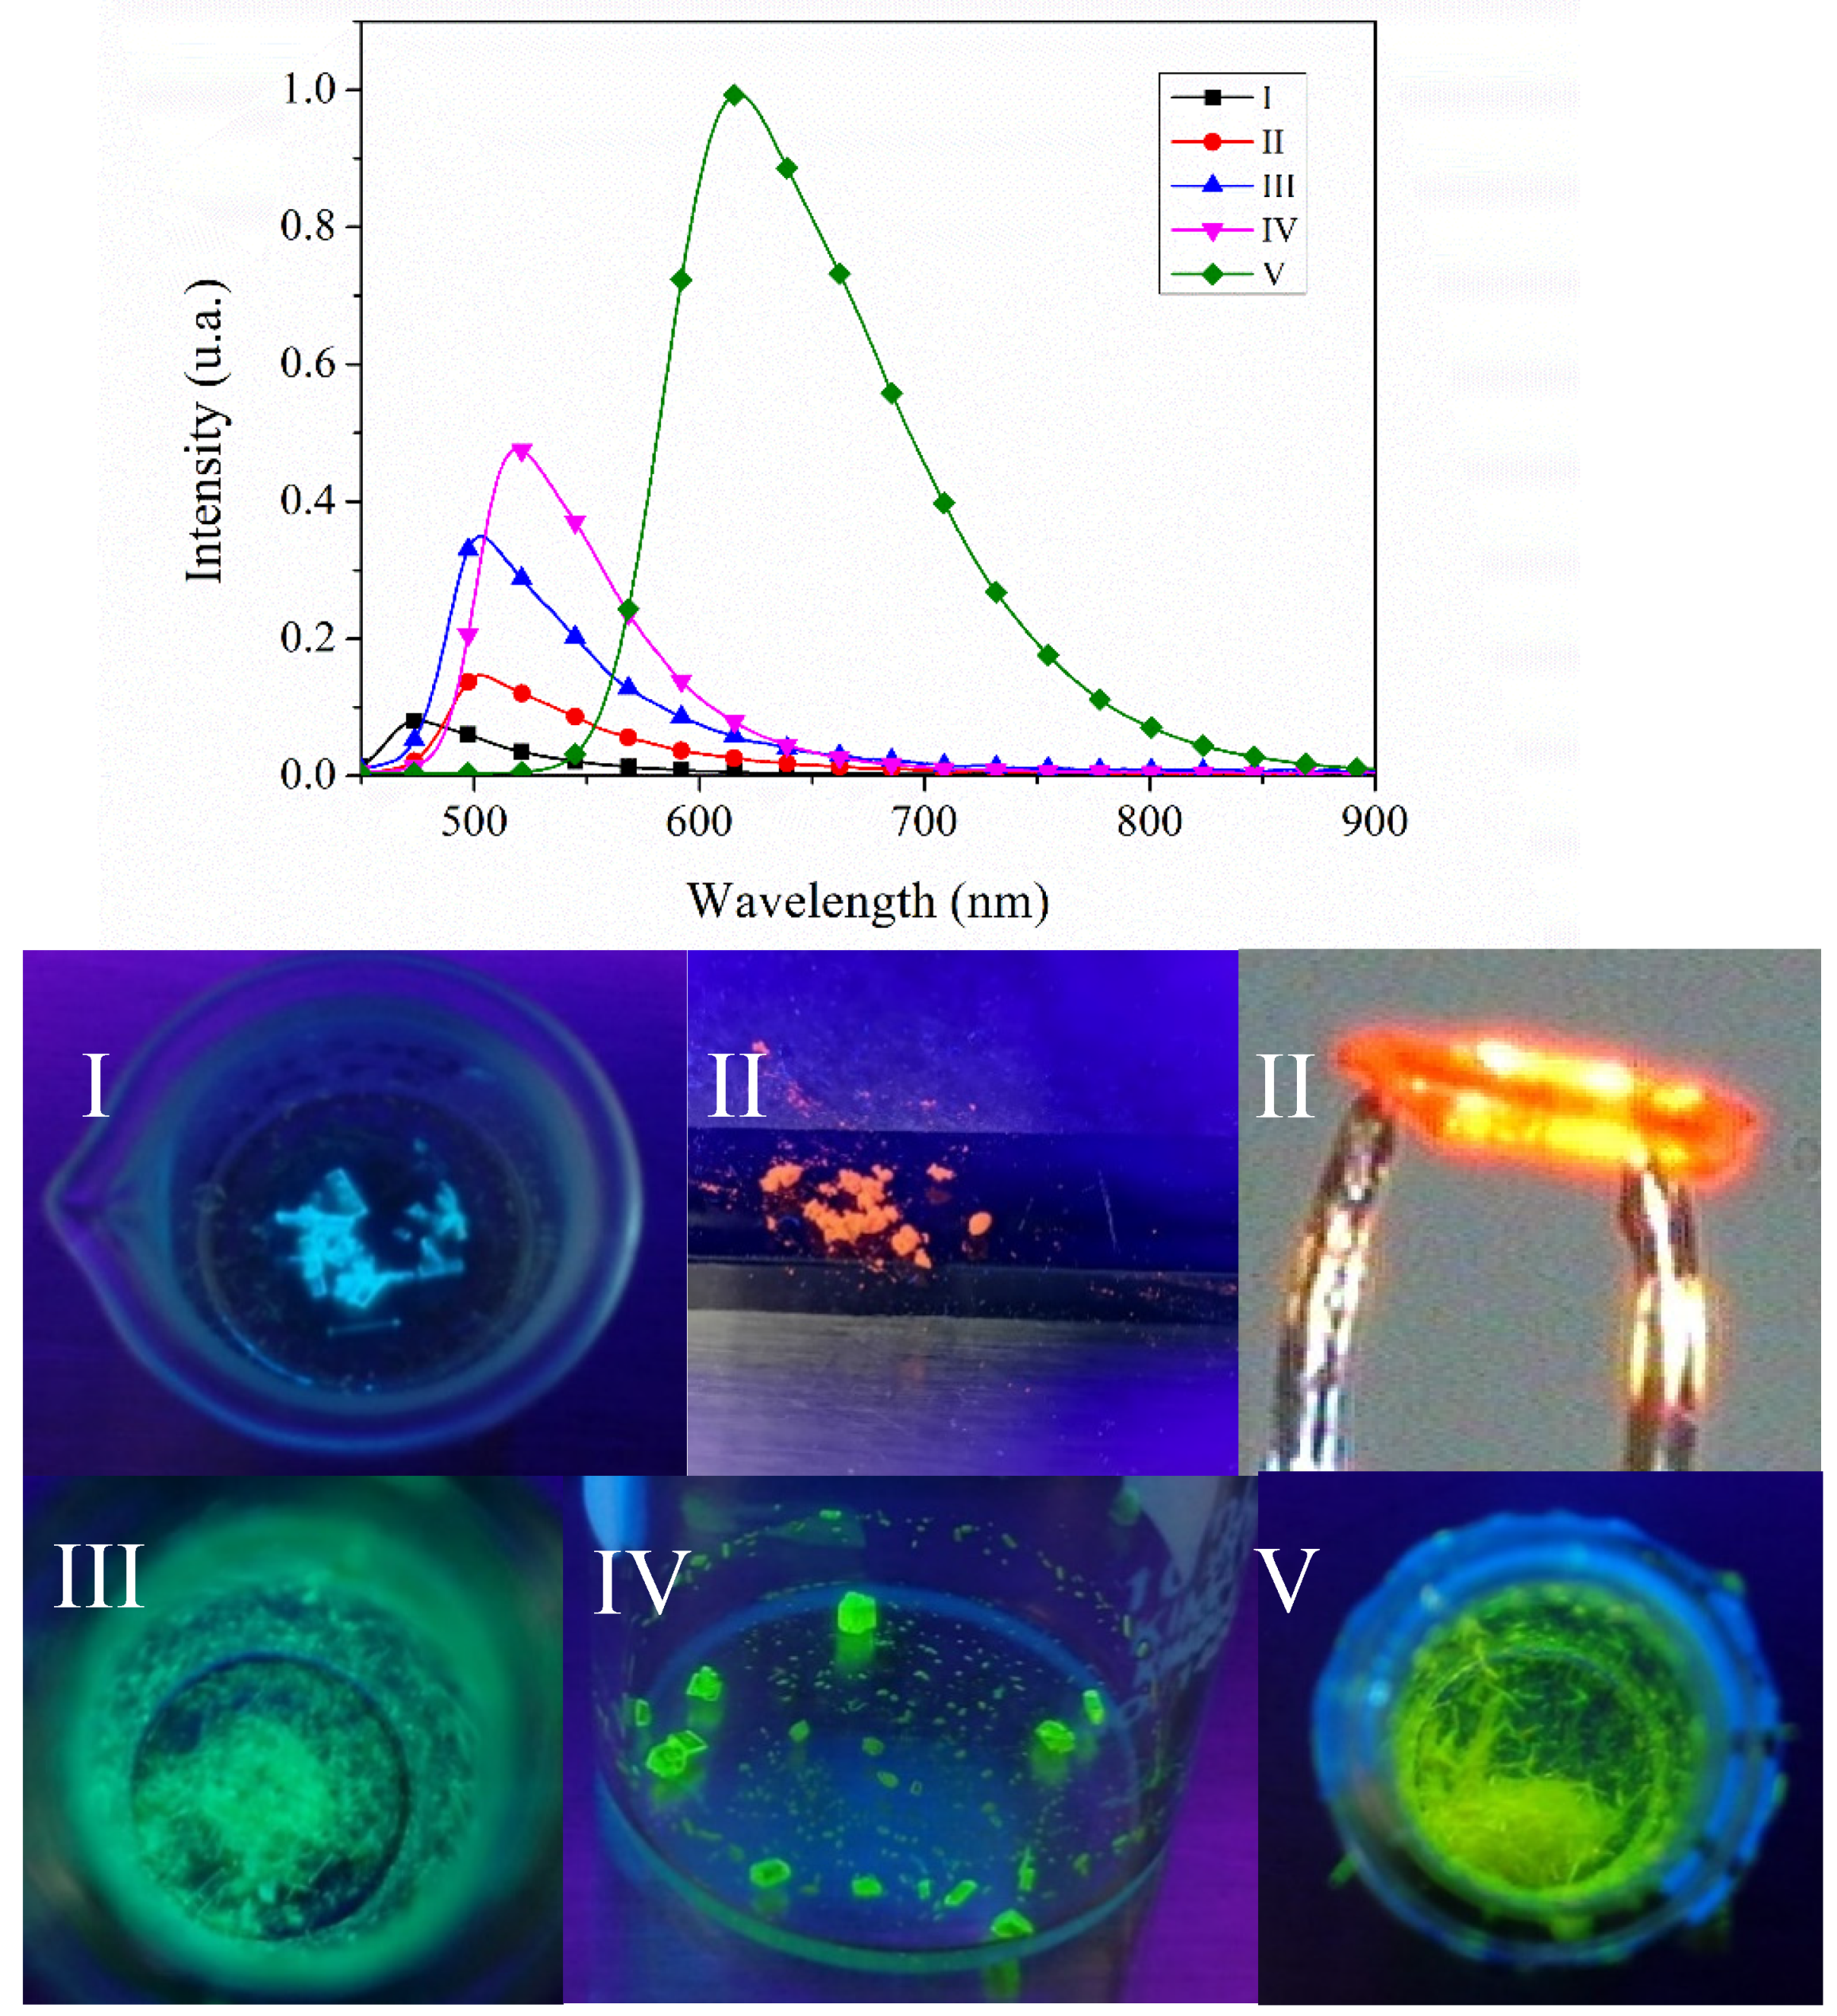
2.2.4. Emission Spectra in Solution and Solid State
2.2.5. Estimation of the Ground State Dipole Moment
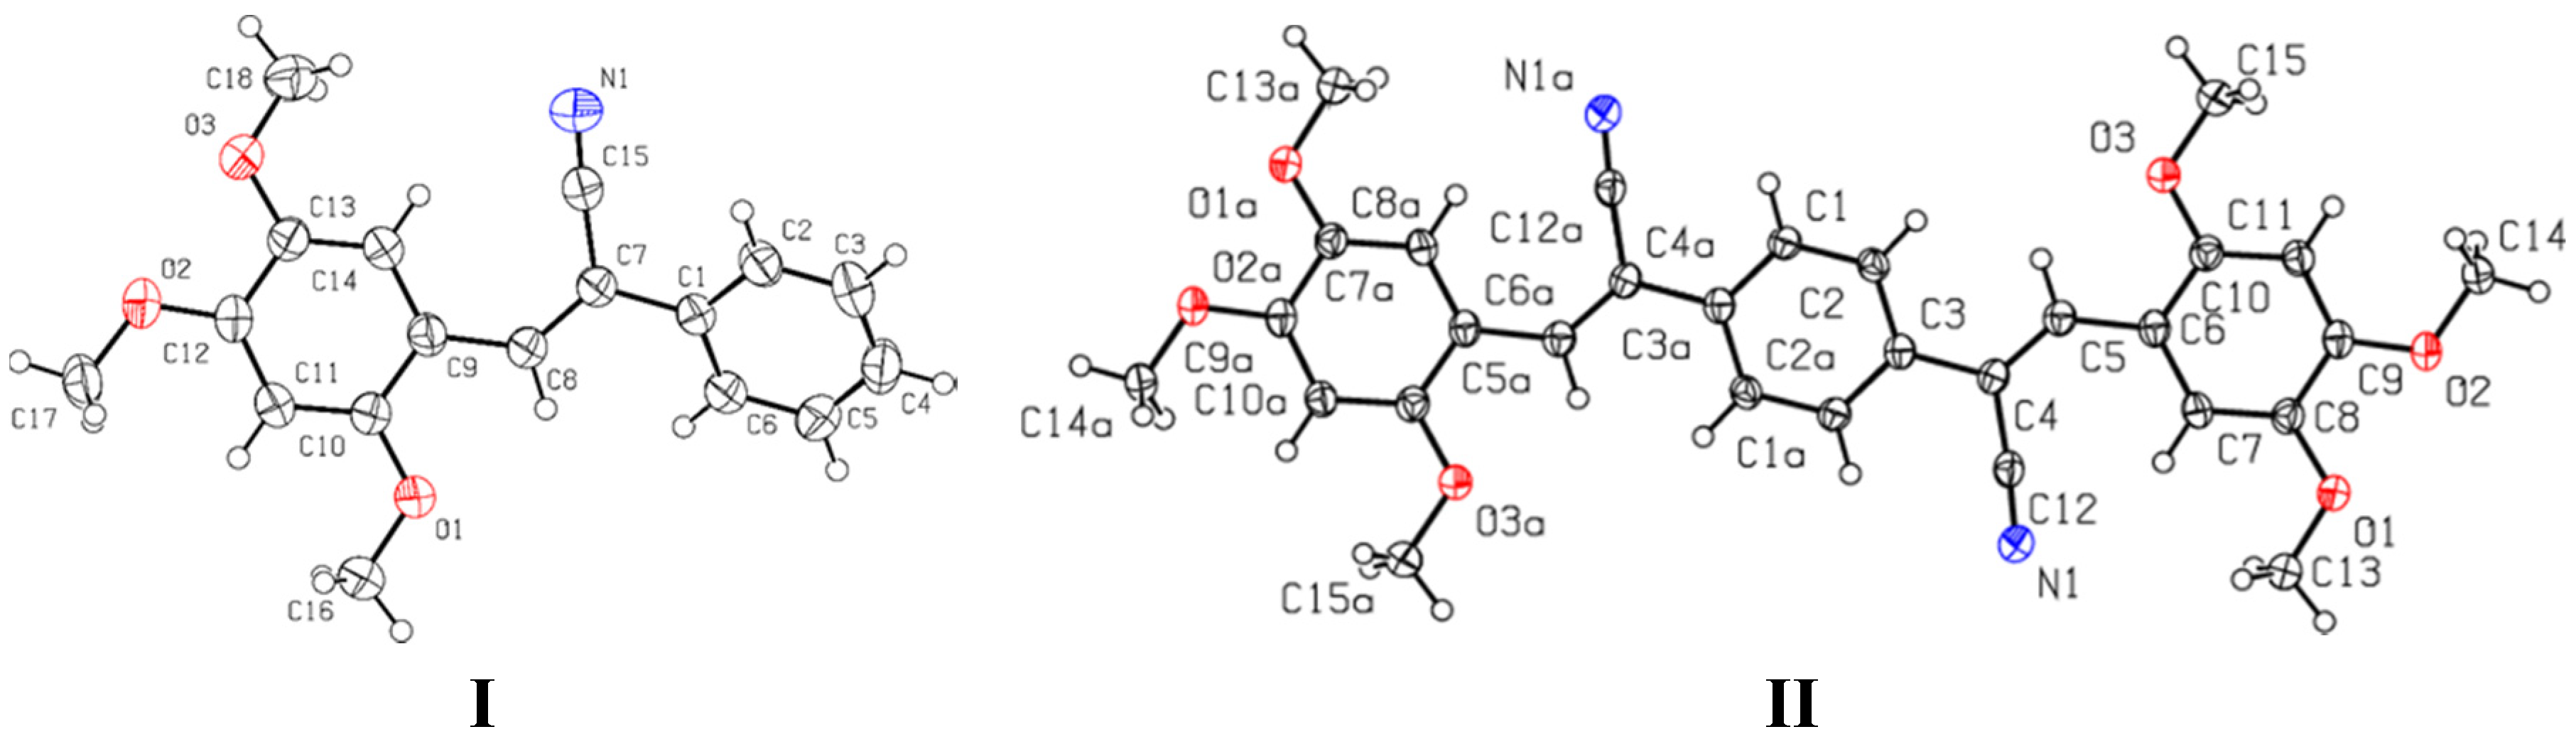
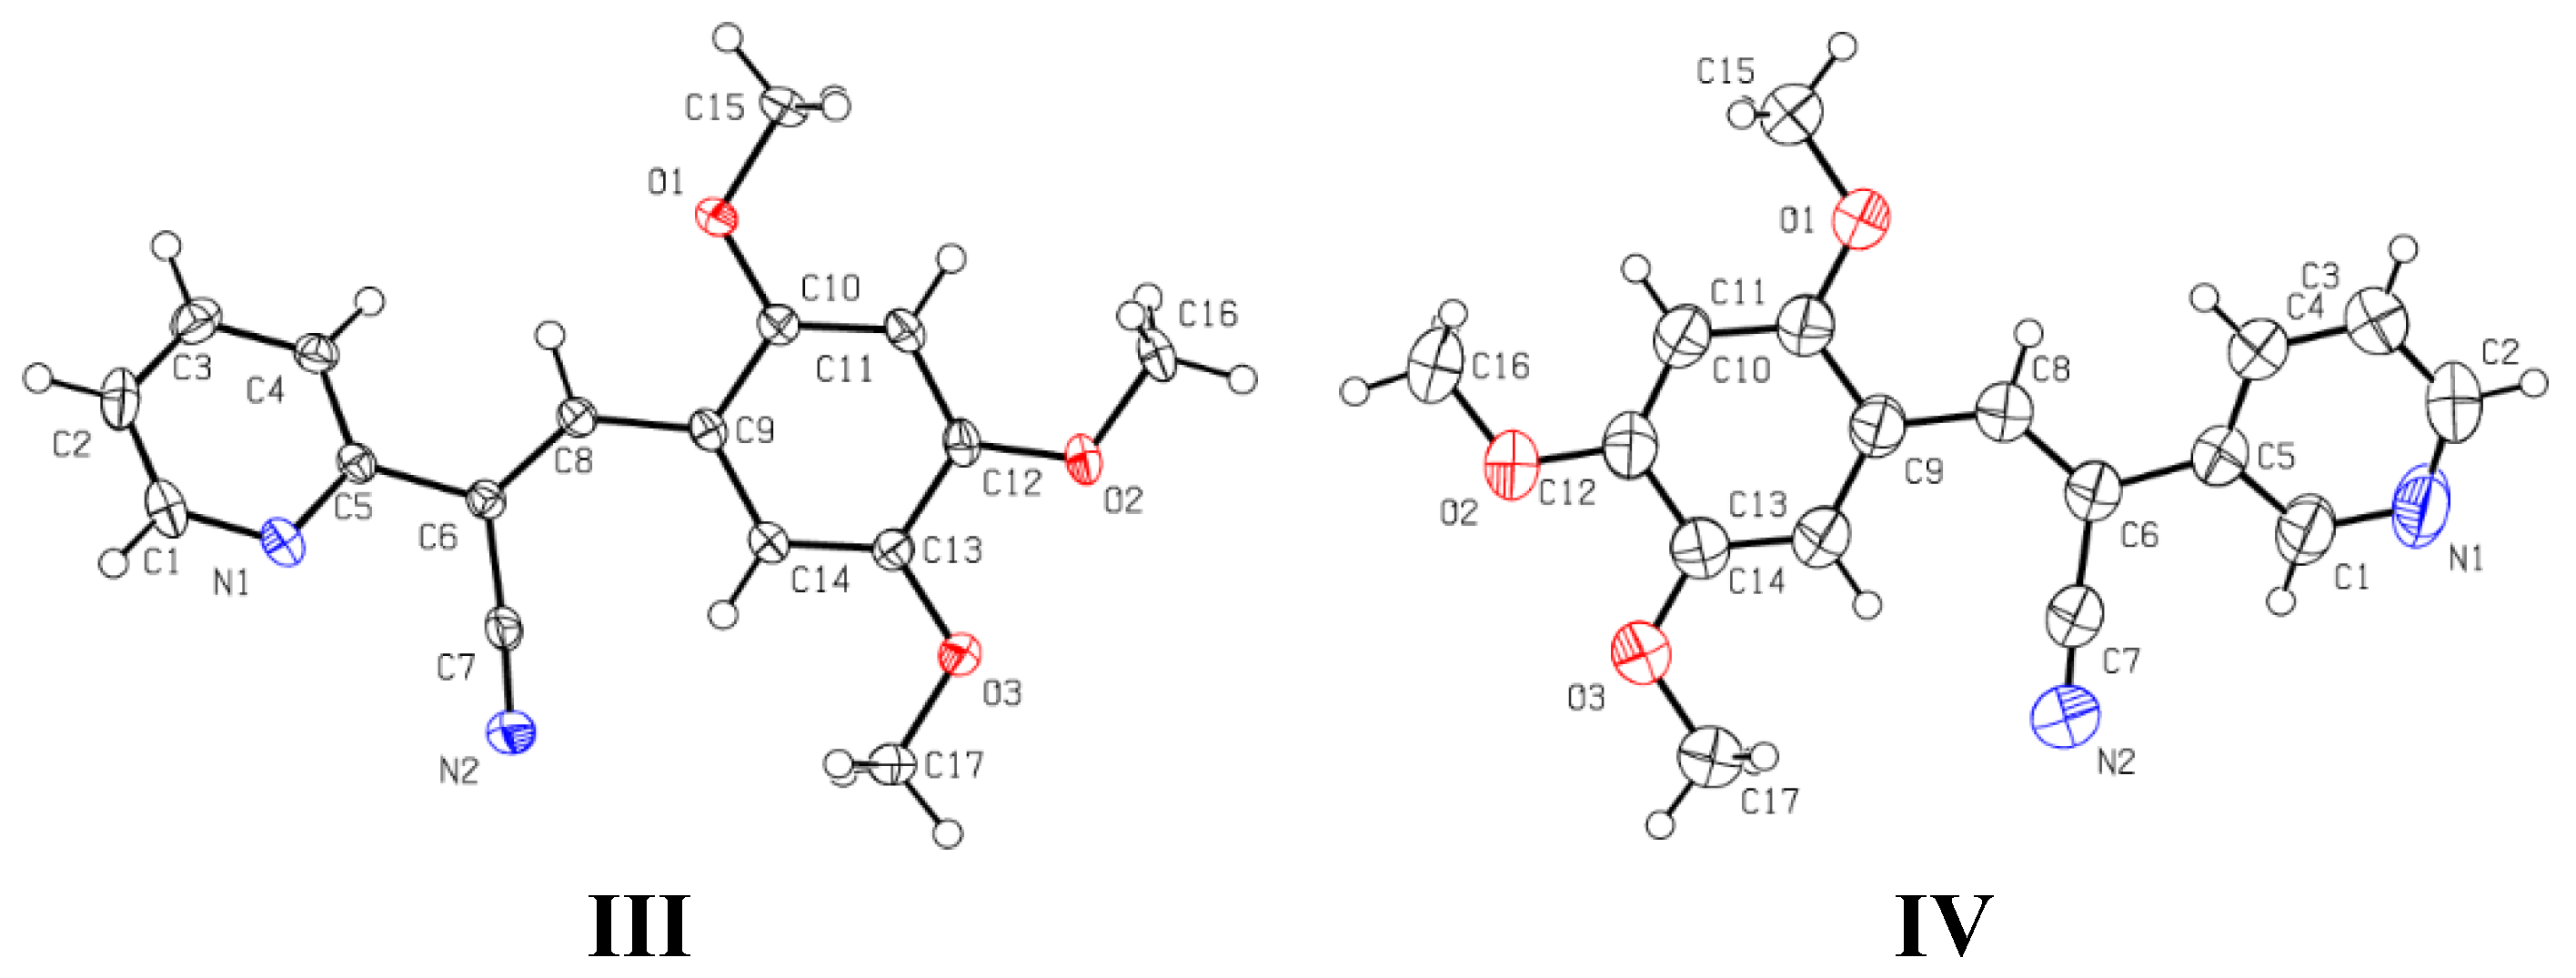
2.3. Crystallographic Data
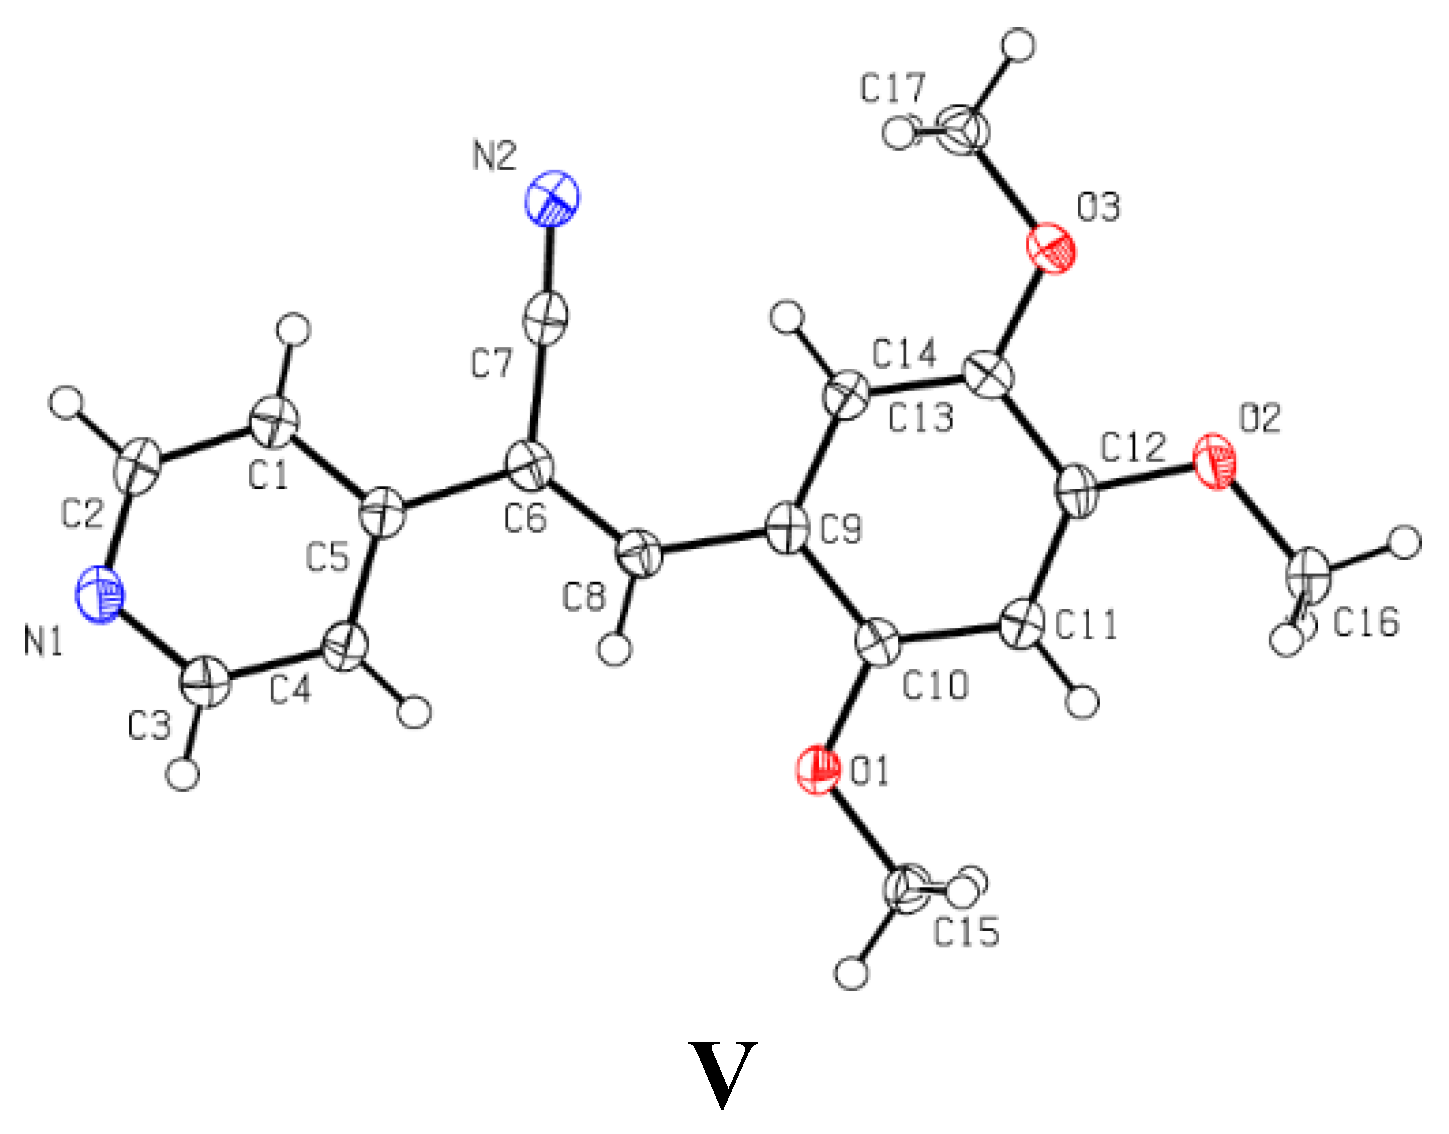
2.3.1. Single Crystal X-ray Diffraction (SCXRD)
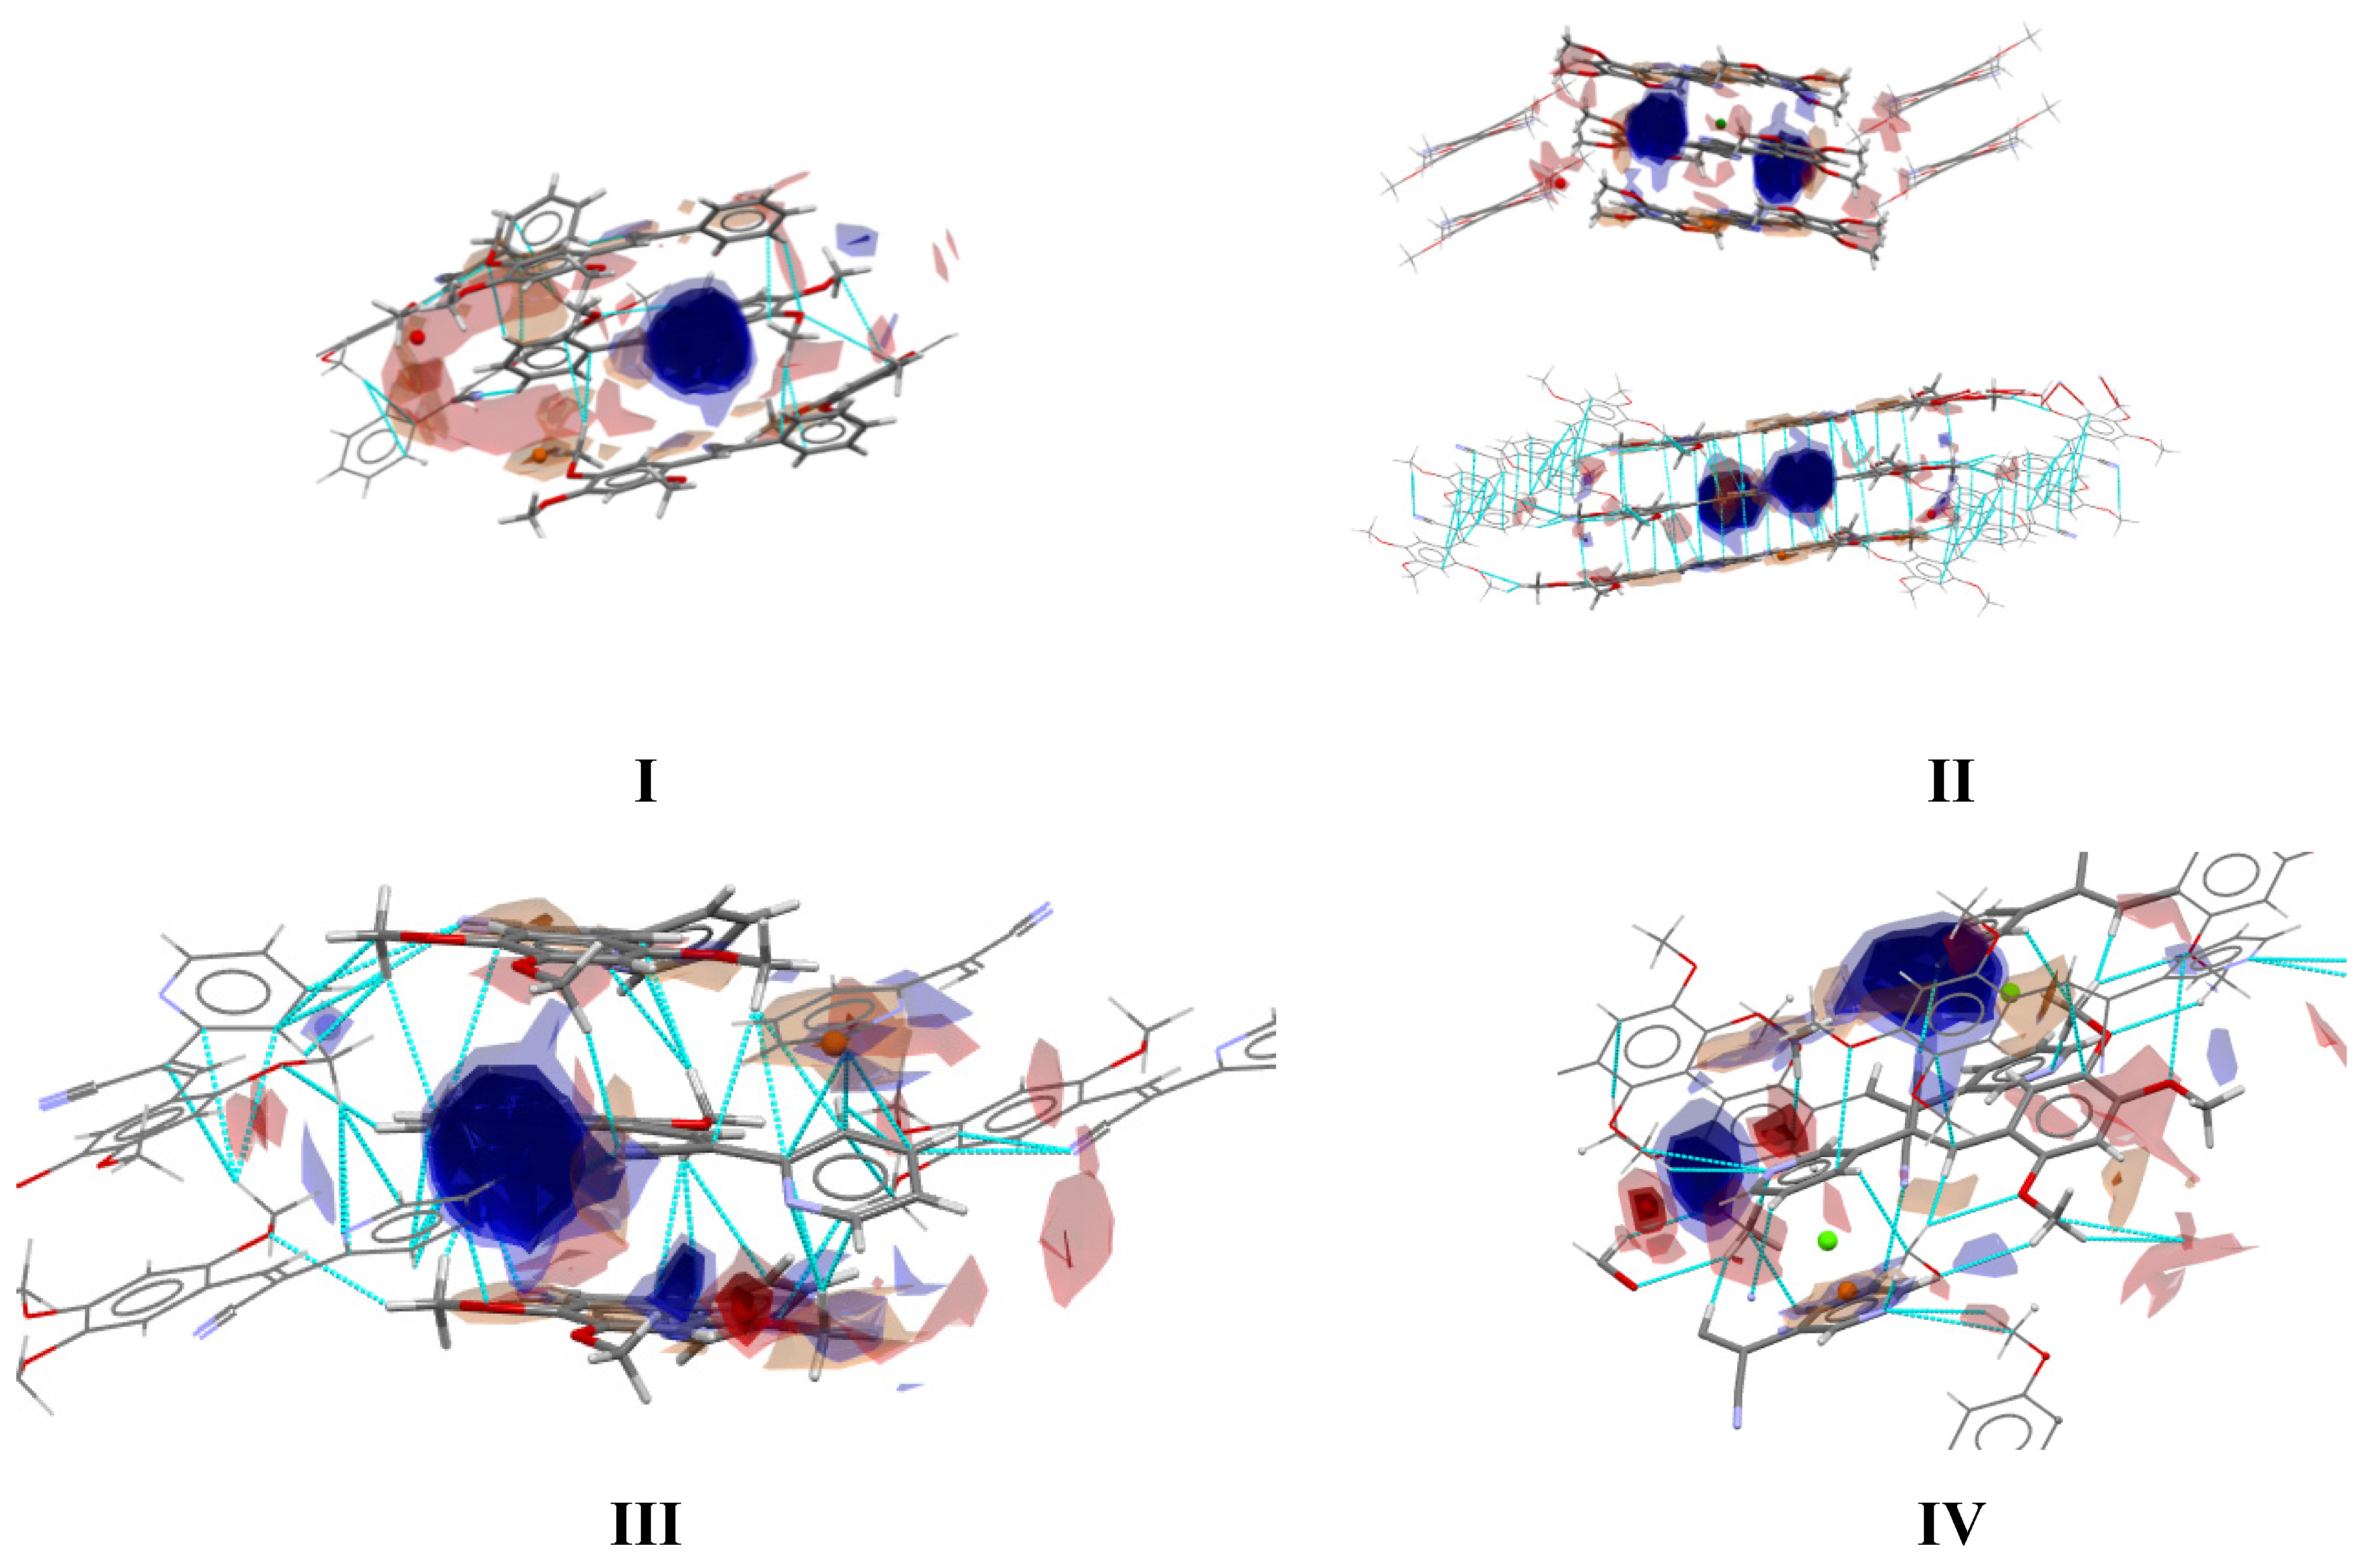
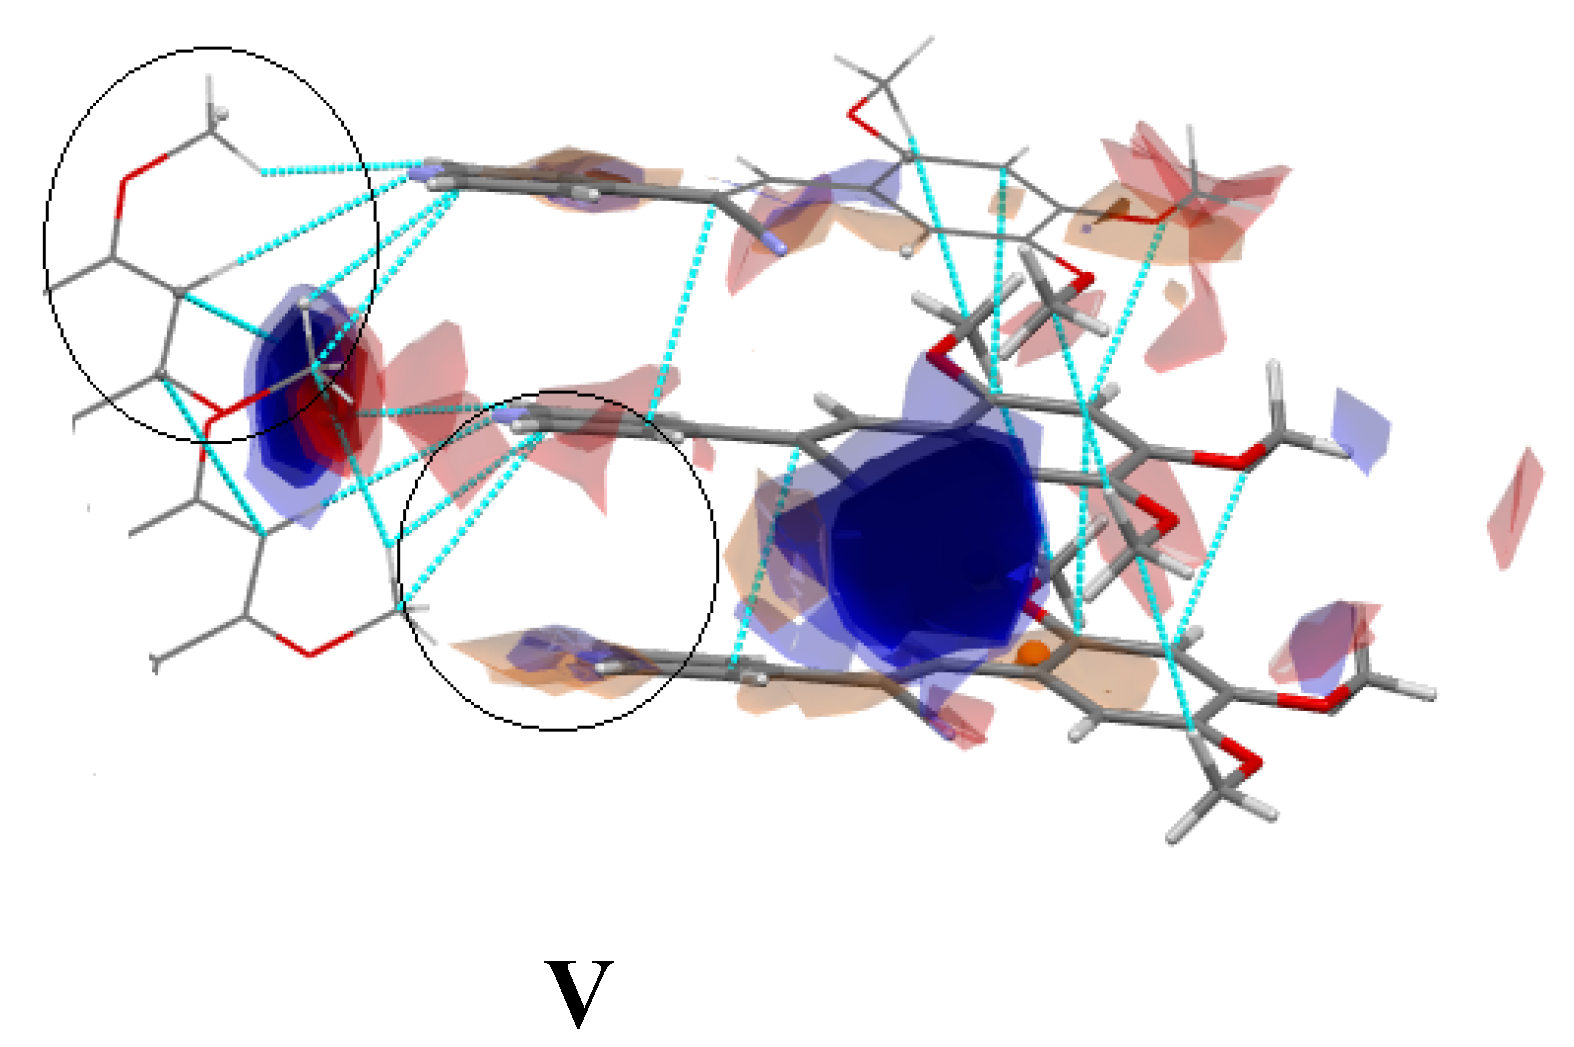
2.3.2. Full Molecular Interactions Maps
2.3.3. Molecular Packing of Compounds I–V
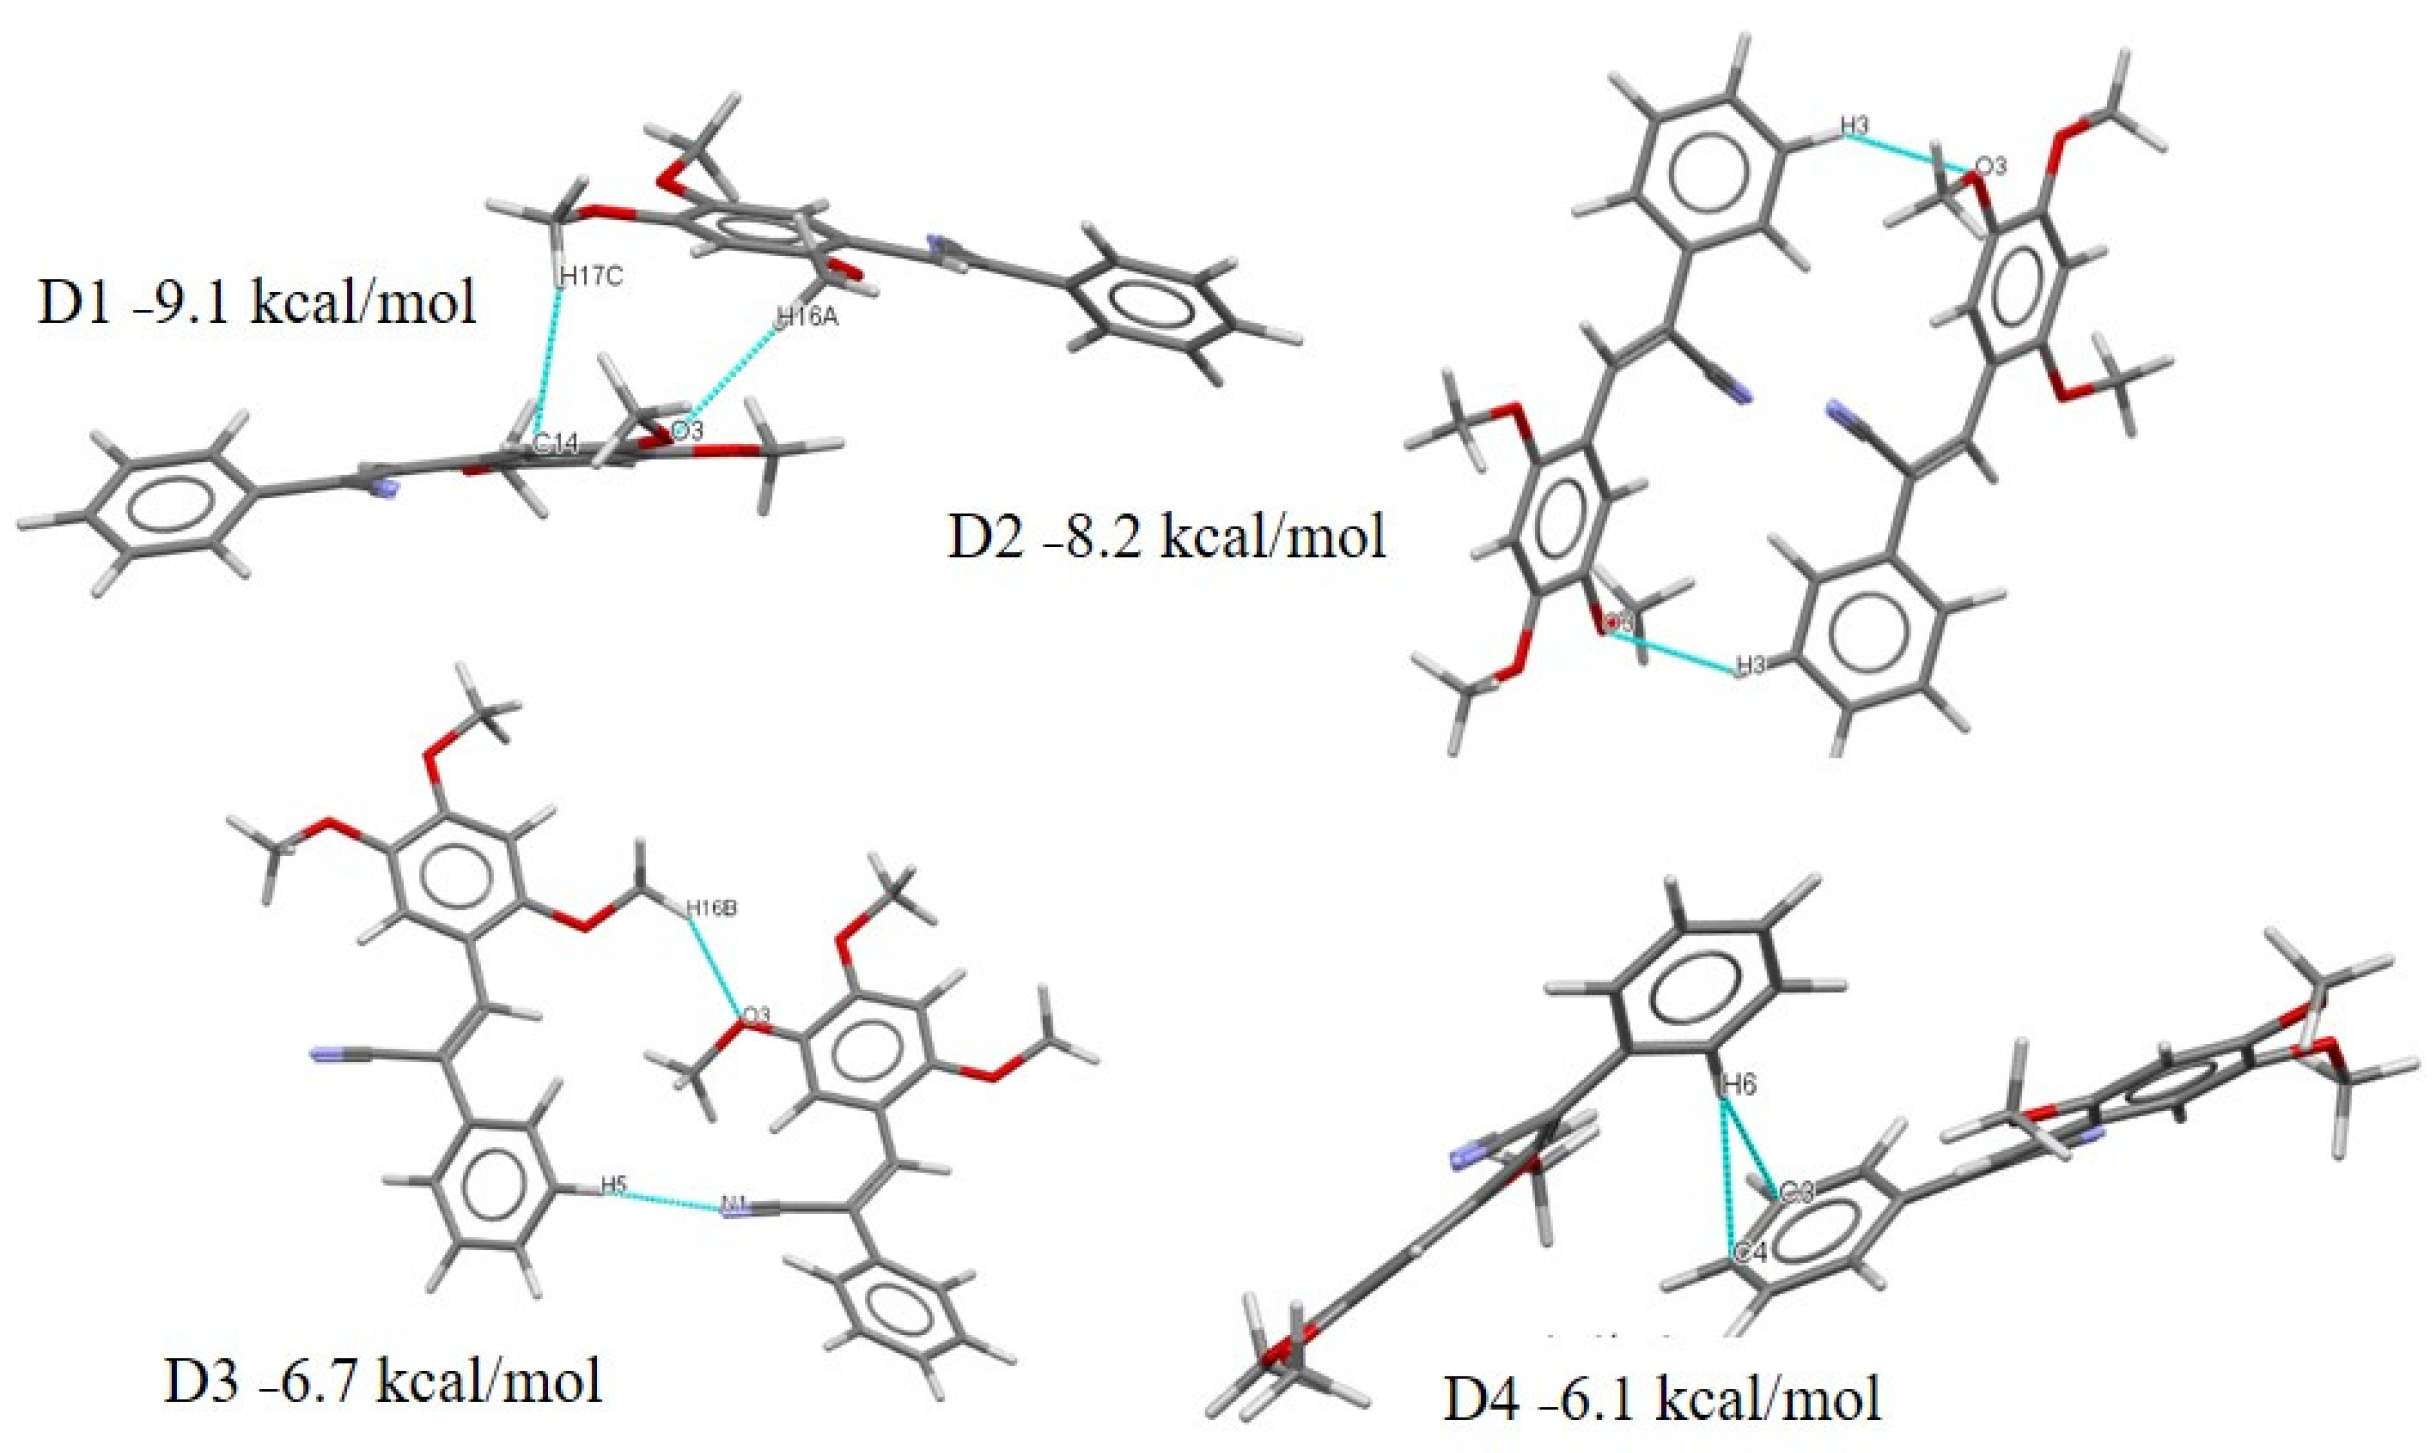
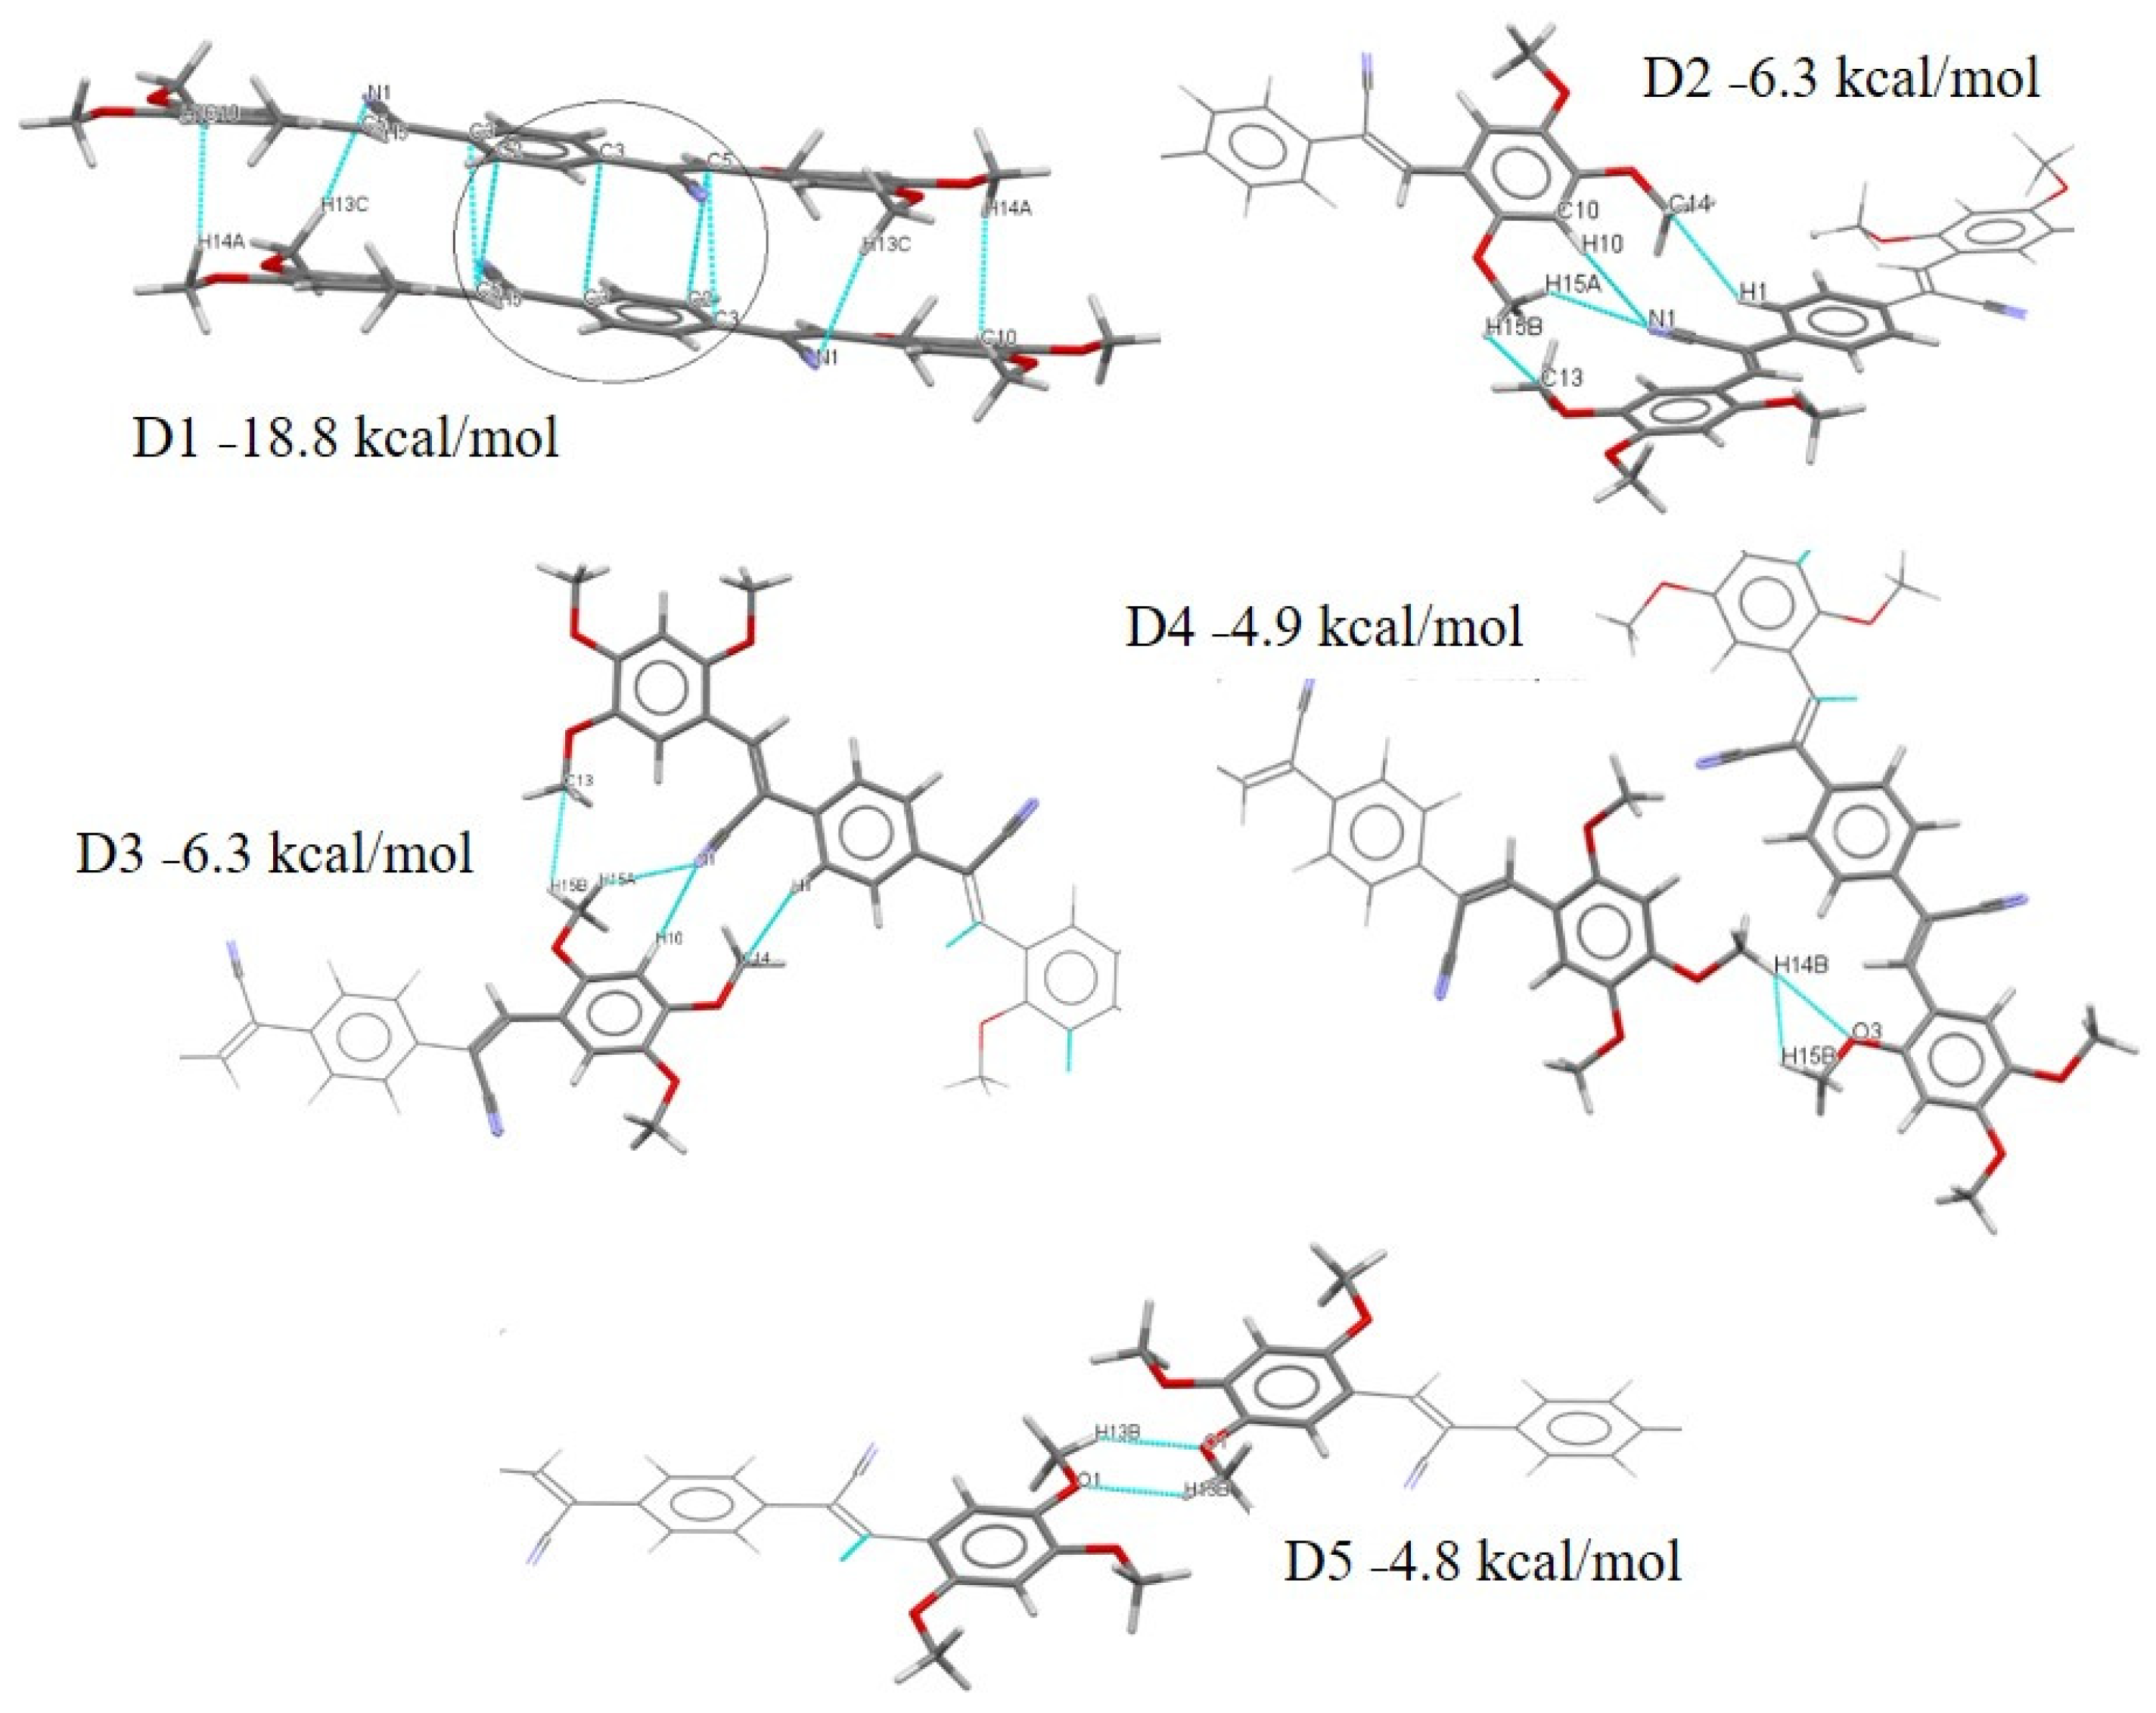
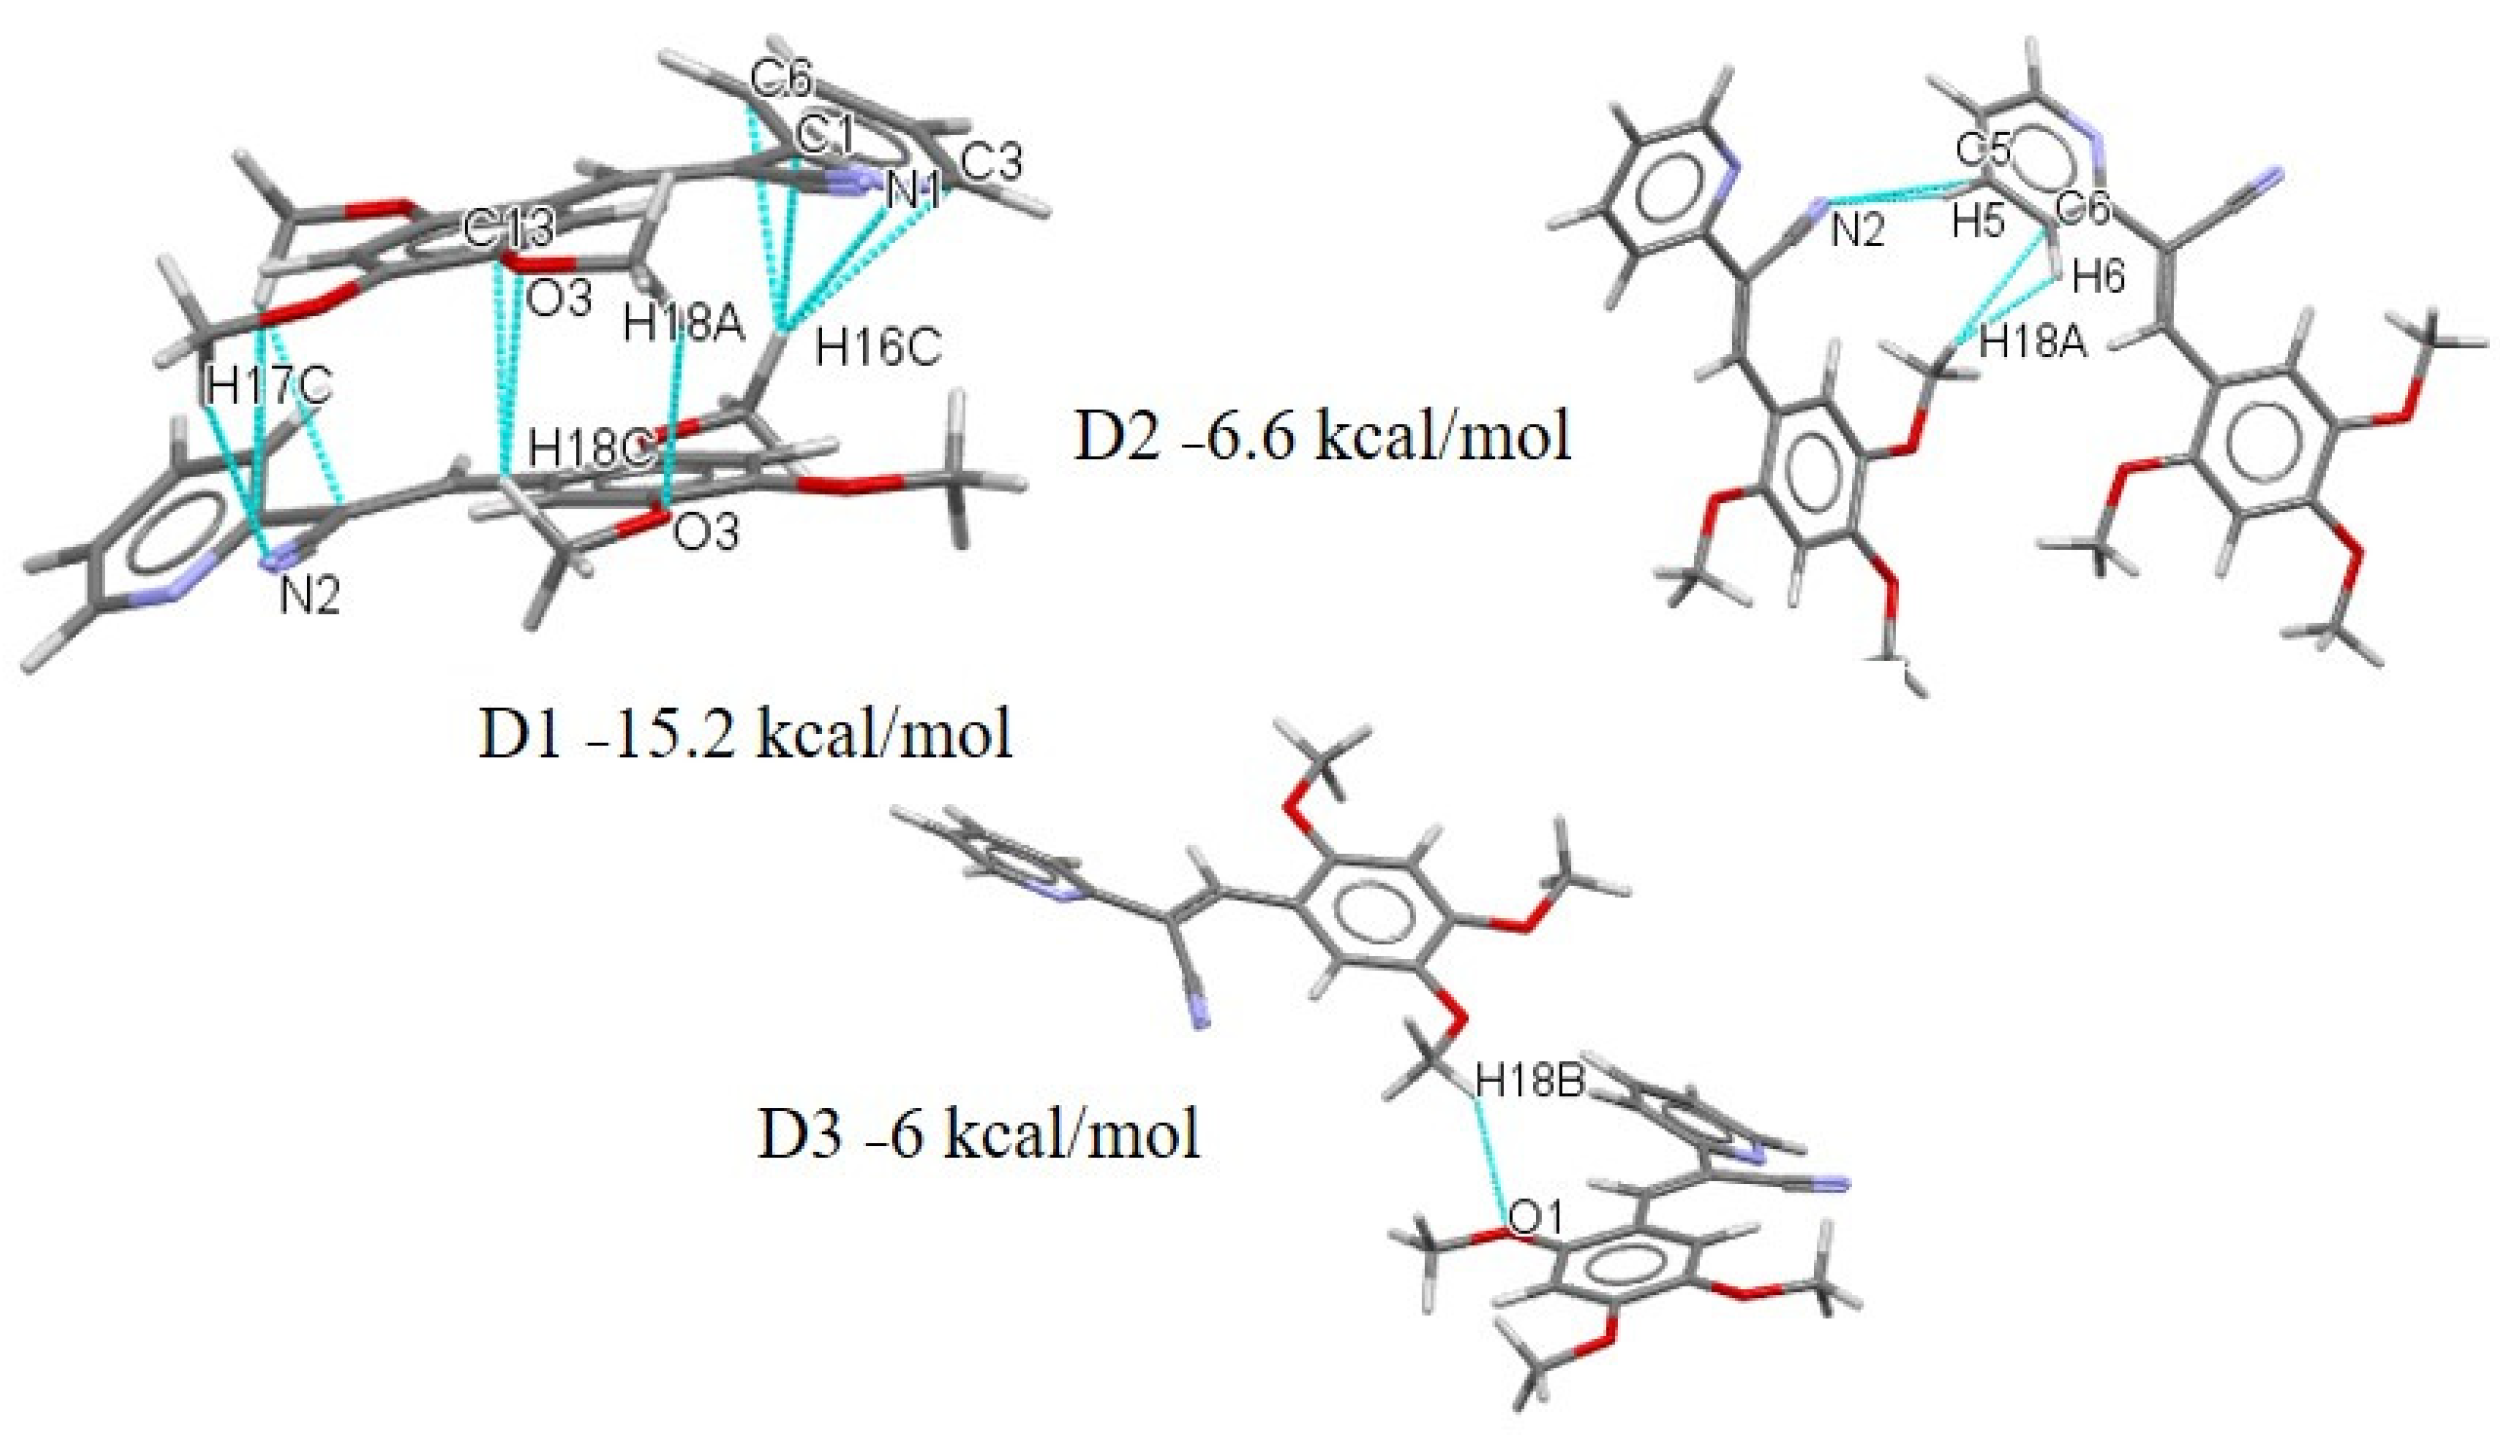
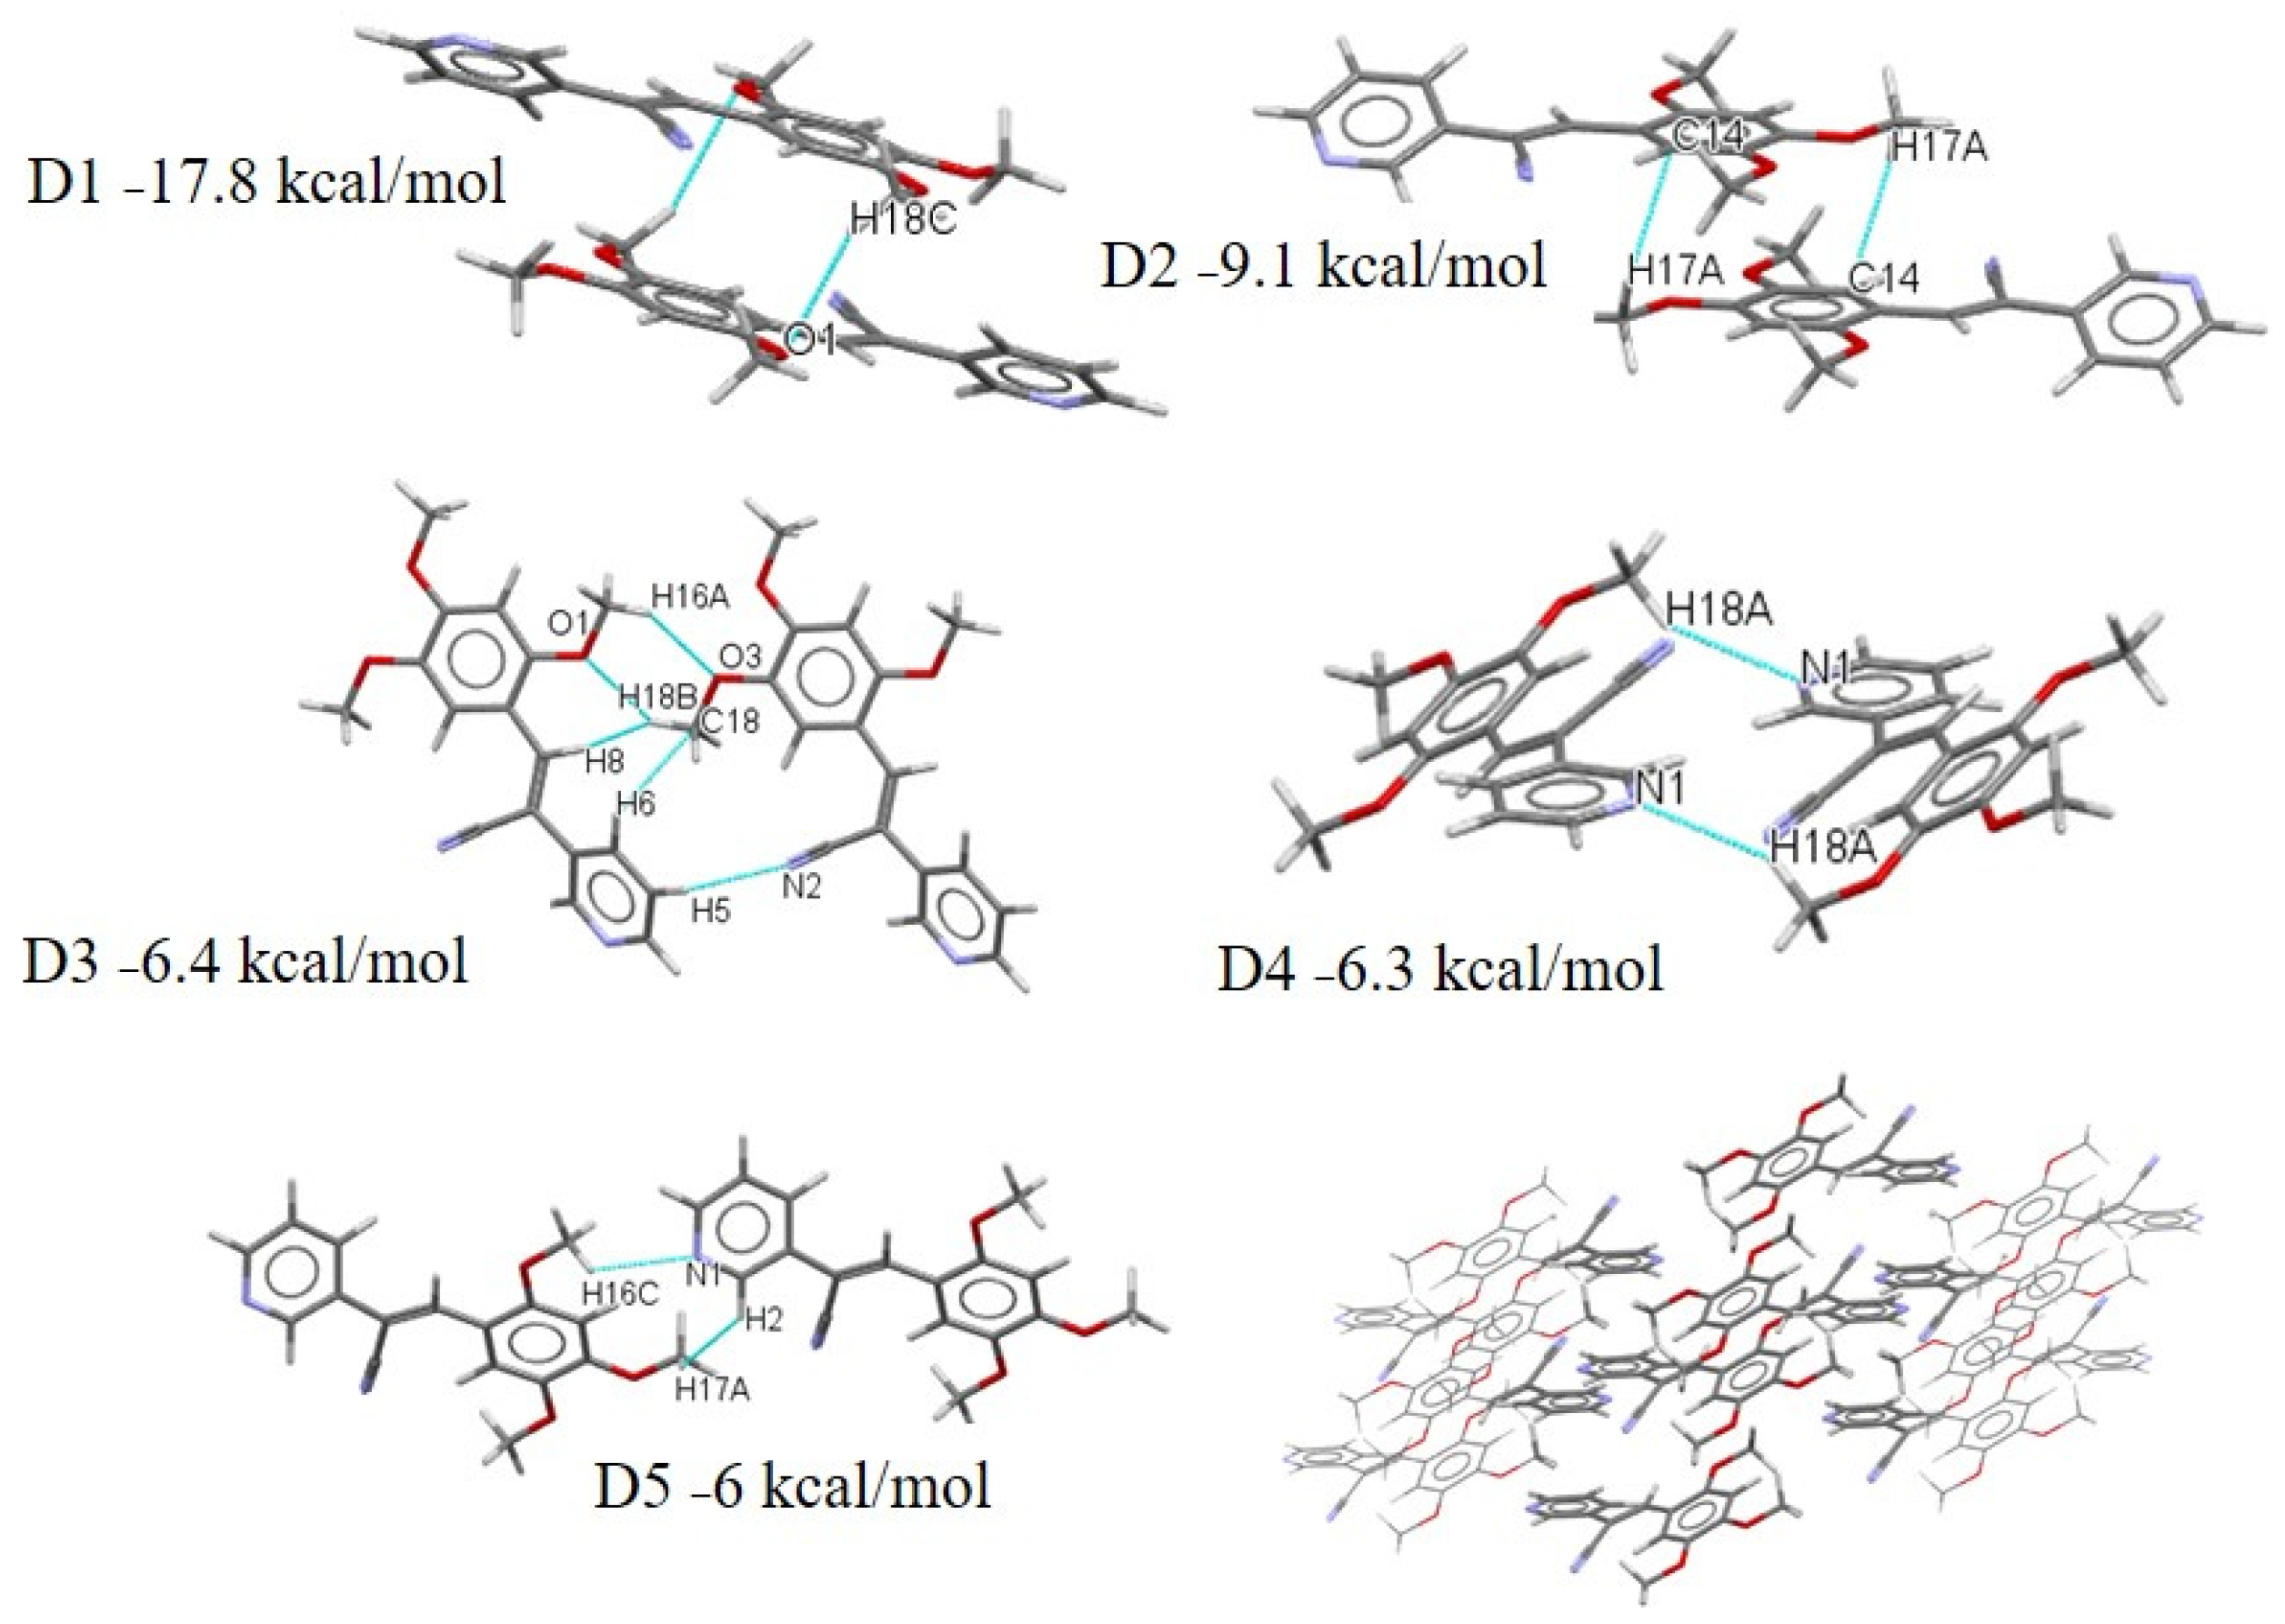
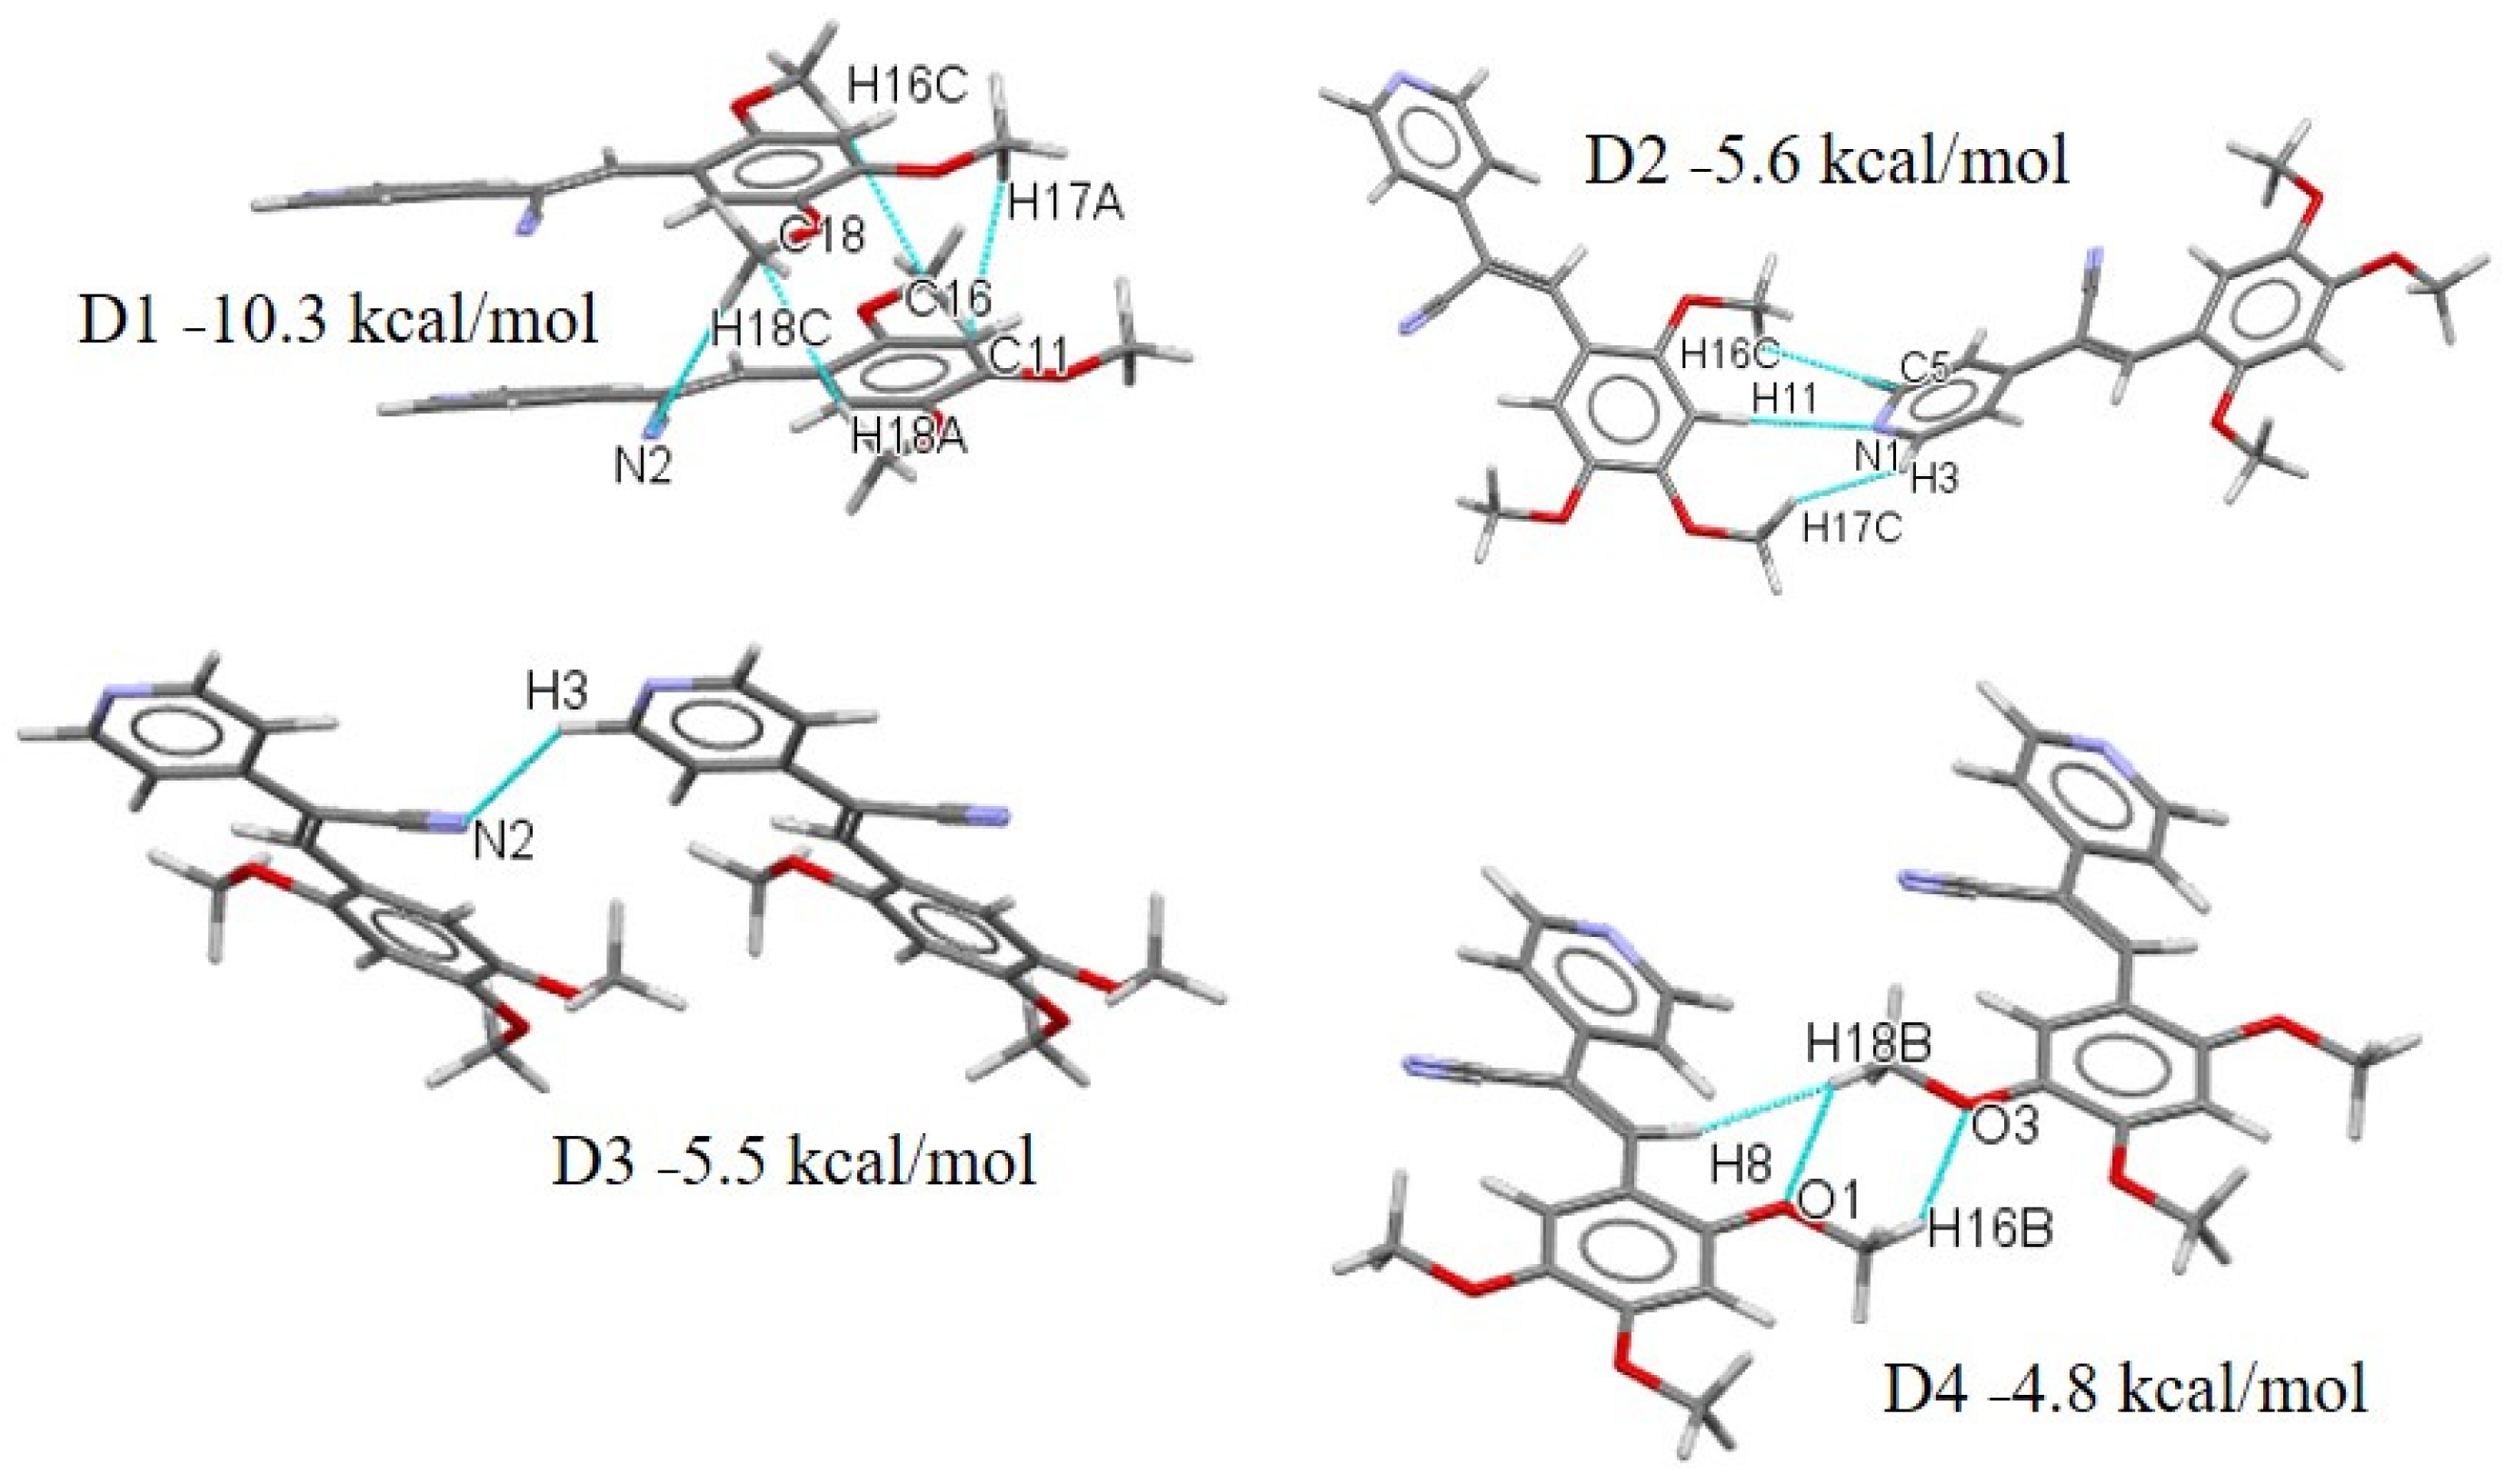
2.4. Quantitative Analysis of the Intermolecular Interactions of Compounds I–V
2.5. Natural Bond Orbital (NBO) Analysis
3. Materials and Methods
3.1. Materials and Instrumentation
3.2. Absorbance and Emission (UV-Vis and PL)
3.3. Single Crystal X-ray Diffraction (SCXRD)
3.4. PIXEL Energy and Quantum Chemical Calculations
4. Conclusions
Supplementary Materials
Author Contributions
Funding
Institutional Review Board Statement
Informed Consent Statement
Data Availability Statement
Acknowledgments
Conflicts of Interest
Sample Availability
References
- Friend, R.H.; Gymer, R.W.; Holmes, A.B.; Burroughes, J.H.; Marks, R.N.; Taliani, C.; Bradley, D.D.C.; Santos, D.A.D.; Brédas, J.L.; Lögdlund, M.; et al. Electroluminescence in Conjugated Polymers. Nature 1999, 397, 121–128. [Google Scholar] [CrossRef]
- Ekbote, A.; Mobin, S.M.; Misra, R. Structure–Property Relationship in Multi-Stimuli Responsive D–A–A′ Benzothiazole Functionalized Isomers. J. Mater. Chem. C 2018, 6, 10888–10901. [Google Scholar] [CrossRef]
- Hoche, J.; Schulz, A.; Dietrich, L.M.; Humeniuk, A.; Stolte, M.; Schmidt, D.; Brixner, T.; Würthner, F.; Mitric, R. The Origin of the Solvent Dependence of Fluorescence Quantum Yields in Dipolar Merocyanine Dyes. Chem. Sci. 2019, 10, 11013–11022. [Google Scholar] [CrossRef] [PubMed] [Green Version]
- Forrest, S.R.; Thompson, M.E. Introduction: Organic Electronics and Optoelectronics. Chem. Rev. 2007, 107, 923–925. [Google Scholar] [CrossRef]
- Gierschner, J.; Park, S.Y. Luminescent Distyrylbenzenes: Tailoring Molecular Structure and Crystalline Morphology. J. Mater. Chem. C 2013, 1, 5818–5832. [Google Scholar] [CrossRef]
- Wuest, J.D. Co-Crystals Give Light a Tune-Up. Nat. Chem. 2012, 4, 74–75. [Google Scholar] [CrossRef] [PubMed]
- Energy Transfer. Principles of Fluorescence Spectroscopy; Lakowicz, J.R., Ed.; Springer US: Boston, MA, USA, 2006; pp. 443–475. ISBN 978-0-387-46312-4. [Google Scholar]
- Callis, P.R. Binding Phenomena and Fluorescence Quenching. II: Photophysics of Aromatic Residues and Dependence of Fluorescence Spectra on Protein Conformation. J. Mol. Struct. 2014, 1077, 22–29. [Google Scholar] [CrossRef]
- Reichardt, C.; Welton, T. Solvents and Solvent Effects in Organic Chemistry, 4th ed.; Wiley-VCH Verlag GmbH & Co. KGaA: Weinheim, Germany, 2010; ISBN 978-3-527-32473-6. [Google Scholar]
- Zheng, D.; Yuan, X.-A.; Ma, H.; Li, X.; Wang, X.; Liu, Z.; Ma, J. Unexpected Solvent Effects on the UV/Vis Absorption Spectra of o-Cresol in Toluene and Benzene: In Contrast with Non-Aromatic Solvents. R. Soc. Open Sci. 2018, 5, 171928. [Google Scholar] [CrossRef] [PubMed] [Green Version]
- Litwinienko, G.; Ingold, K.U. Solvent Effects on the Rates and Mechanisms of Reaction of Phenols with Free Radicals. Acc. Chem. Res. 2007, 40, 222–230. [Google Scholar] [CrossRef] [PubMed]
- Dopfer, O.; Fujii, M. Probing Solvation Dynamics around Aromatic and Biological Molecules at the Single-Molecular Level. Chem. Rev. 2016, 116, 5432–5463. [Google Scholar] [CrossRef]
- Barbara, P.F.; Jarzeba, W. Dynamic Solvent Effects on Polar and Nonpolar Isomerizations. Acc. Chem. Res. 1988, 21, 195–199. [Google Scholar] [CrossRef]
- Orozco, M.; Luque, F.J. Theoretical Methods for the Description of the Solvent Effect in Biomolecular Systems. Chem. Rev. 2000, 100, 4187–4226. [Google Scholar] [CrossRef] [PubMed]
- Ramamurthy, V.; Sivaguru, J. Supramolecular Photochemistry as a Potential Synthetic Tool: Photocycloaddition. Chem. Rev. 2016, 116, 9914–9993. [Google Scholar] [CrossRef] [PubMed]
- Meyer, E.A.; Castellano, R.K.; Diederich, F. Interactions with Aromatic Rings in Chemical and Biological Recognition. Angew. Chem. Int. Edit. 2003, 42, 1210–1250. [Google Scholar] [CrossRef]
- Salonen, L.M.; Ellermann, M.; Diederich, F. Aromatic Rings in Chemical and Biological Recognition: Energetics and Structures. Angew. Chem. Int. Edit. 2011, 50, 4808–4842. [Google Scholar] [CrossRef]
- Forbes, C.R.; Sinha, S.K.; Ganguly, H.K.; Bai, S.; Yap, G.P.A.; Patel, S.; Zondlo, N.J. Insights into Thiol–Aromatic Interactions: A Stereoelectronic Basis for S–H/π Interactions. J. Am. Chem. Soc. 2017, 139, 1842–1855. [Google Scholar] [CrossRef] [Green Version]
- Saggu, M.; Levinson, N.M.; Boxer, S.G. Direct Measurements of Electric Fields in Weak OH···π Hydrogen Bonds. J. Am. Chem. Soc. 2011, 133, 17414–17419. [Google Scholar] [CrossRef] [Green Version]
- Hobza, P.; Havlas, Z. Blue-Shifting Hydrogen Bonds. Chem. Rev. 2000, 100, 4253–4264. [Google Scholar] [CrossRef]
- Samanta, S.; Sanyal, S.; Maity, M.; Chaudhury, M.; Ghosh, S. Unusual Solvent Effect of Molecular Charge Transfer Complexes: Stacking/Non-Stacking Interaction Revealed by Characterization of Structure and Photophysical Aspects. J. Lumin. 2017, 190, 403–412. [Google Scholar] [CrossRef]
- Kim, J.H.; Lindeman, S.V.; Kochi, J.K. Charge-Transfer Forces in the Self-Assembly of Heteromolecular Reactive Solids: Successful Design of Unique (Single-Crystal-to-Single-Crystal) Diels−Alder Cycloadditions. J. Am. Chem. Soc. 2001, 123, 4951–4959. [Google Scholar] [CrossRef] [Green Version]
- Jazwinski, J.; Blacker, A.J.; Lehn, J.-M.; Cesario, M.; Guilhem, J.; Pascard, C. Cyclo-Bisintercalands: Synthesis and Structure of an Intercalative Inclusion Complex, and Anion Binding Properties. Tetrahedron Lett. 1987, 28, 6060. [Google Scholar] [CrossRef]
- Bilyk, A.; Harding, M.M. Guest-Induced Assembly of a Chiral [2 + 2] Metallomacrocycle. J. Chem. Soc. Chem. Commun. 1995, 1697–1698. [Google Scholar] [CrossRef]
- Scott Lokey, R.; Iverson, B.L. Synthetic Molecules That Fold into a Pleated Secondary Structure in Solution. Nature 1995, 375, 303–305. [Google Scholar] [CrossRef]
- Varghese, S.; Das, S. Role of Molecular Packing in Determining Solid-State Optical Properties of π-Conjugated Materials. J. Phys. Chem. Lett. 2011, 2, 863–873. [Google Scholar] [CrossRef] [PubMed]
- Zhang, Z.; Huang, H.; Yang, X.; Zang, L. Tailoring Electronic Properties of Graphene by π–π Stacking with Aromatic Molecules. J. Phys. Chem. Lett. 2011, 2, 2897–2905. [Google Scholar] [CrossRef]
- Hong, Y.; Lam, J.W.Y.; Tang, B.Z. Aggregation-Induced Emission. Chem. Soc. Rev. 2011, 40, 5361–5388. [Google Scholar] [CrossRef] [Green Version]
- Sutton, C.; Risko, C.; Brédas, J.-L. Noncovalent Intermolecular Interactions in Organic Electronic Materials: Implications for the Molecular Packing vs Electronic Properties of Acenes. Chem. Mater. 2016, 28, 3–16. [Google Scholar] [CrossRef]
- Facchetti, A. π-Conjugated Polymers for Organic Electronics and Photovoltaic Cell Applications. Chem. Mater. 2011, 23, 733–758. [Google Scholar] [CrossRef]
- Cruz-Cabeza, A.J.; Davey, R.J.; Sachithananthan, S.S.; Smith, R.; Tang, S.K.; Vetter, T.; Xiao, Y. Aromatic Stacking—A Key Step in Nucleation. Chem. Commun. 2017, 53, 7905–7908. [Google Scholar] [CrossRef] [PubMed] [Green Version]
- Redinha, J.S.; Jesus, A.J.L.; Pais, A.A.C.C.; Almeida, J.A.S. Crystallization: From the Conformer to the Crystal. Adv. Top. Crys. Growth 2013. [Google Scholar] [CrossRef]
- Moriya, T. Excited-State Reactions of Coumarins in Aqueous Solutions. II. The Fluorescence Quenching of 7-Ethoxycoumarins by Halide Ions. Bull. Chem. Soc Jpn. 1984, 57, 1723–1730. [Google Scholar] [CrossRef]
- Kumar, S.; Rao, V.C.; Rastogi, R.C. Excited-State Dipole Moments of Some Hydroxycoumarin Dyes Using an Efficient Solvatochromic Method Based on the Solvent Polarity Parameter, ETN. Spectrochim. Acta A 2001, 57, 41–47. [Google Scholar] [CrossRef]
- Anandhan, K.; Cerón, M.; Perumal, V.; Ceballos, P.; Gordillo-Guerra, P.; Pérez-Gutiérrez, E.; Castillo, A.E.; Thamotharan, S.; Percino, M.J. Solvatochromism and PH Effect on the Emission of a Triphenylimidazole-Phenylacrylonitrile Derivative: Experimental and DFT Studies. RSC Adv. 2019, 9, 12085–12096. [Google Scholar] [CrossRef] [Green Version]
- Anandhan, K.; Cerón, M.; Ceballos, P.; Ramos-Hernández, R.; Perumal, V.; Pérez-Gutiérrez, E.; Sosa-Rivadeneyra, M.; Thamotharan, S.; Percino, M.J. 1H-NMR, Photophysical, and PH Studies of 4-(4,5-Diphenyl-1H-Imidazol-2-Yl)Benzaldehyde through Experimental and DFT Theoretical Analysis. ChemistrySelect 2020, 5, 415–425. [Google Scholar] [CrossRef]
- Demissie, E.G.; Mengesha, E.T.; Woyessa, G.W. Modified Solvatochromic Equations for Better Estimation of Ground and Excited State Dipole Moments of P-Aminobenzoicacid (PABA): Accounting for Real Shape over Hypothetical Spherical Solvent Shell. J. Photochem. Photobiol. A 2017, 337, 184–191. [Google Scholar] [CrossRef]
- Melavanki, R.; Vaijayanthimala, S.; Yallur, B.C.; Shelar, V.M.; Singh, D.; Sadasivuni, K.K.; Patil, N.R. Preparation and Optical Parameter Characterization of Two Aldehyde Derivative Thin Films for Photonic Applications by Drop Casting Method. Luminescence 2020, 35, 903–912. [Google Scholar] [CrossRef]
- Hrdlovic, P.; Donovalova, J.; Stankovicova, H.; Gaplovsky, A. Influence of Polarity of Solvents on the Spectral Properties of Bichromophoric Coumarins. Molecules 2010, 15, 8915–8932. [Google Scholar] [CrossRef] [Green Version]
- Raikar, U.S.; Tangod, V.B.; Mannopantar, S.R.; Mastiholi, B.M. Ground and Excited State Dipole Moments of Coumarin 337 Laser Dye. Opt. Commun. 2010, 283, 4289–4292. [Google Scholar] [CrossRef]
- Manohara, S.R.; Kumar, V.U.; Shivakumaraiah; Gerward, L. Estimation of Ground and Excited-State Dipole Moments of 1, 2-Diazines by Solvatochromic Method and Quantum-Chemical Calculation. J. Mol. Liq. 2013, 181, 97–104. [Google Scholar] [CrossRef]
- Giri, R. Temperature Effect Study upon the Fluorescence Emission of Substituted Coumarins. Spectrochim. Acta Part A Mol. Spectrosc. 1992, 48, 843–848. [Google Scholar] [CrossRef]
- Udayakumar, M.; Cerón, M.; Ceballos, P.; Venkatesan, P.; Percino, M.J.; Thamotharan, S. A Quantitative Study of Weak Noncovalent Interactions in Two Pyridine Isomers Containing Nitrile and Thiophene Moieties: A Combined X-ray and Theoretical Investigation. J. Chem. Sci. 2019, 131, 60. [Google Scholar] [CrossRef] [Green Version]
- Udayakumar, M.; Cerón, M.; Ceballos, P.; Percino, M.J.; Thamotharan, S. Interplay of Weak Noncovalent Interactions in Two Conjugated Positional Isomers: A Combined X-Ray, Optical Properties and Theoretical Investigation. J. Mol. Struct. 2019, 1195, 32–42. [Google Scholar] [CrossRef]
- Jana, P.; Paramasivam, M.; Khandelwal, S.; Dutta, A.; Kanvah, S. Perturbing the AIEE Activity of Pyridine Functionalized α-Cyanostilbenes with Donor Substitutions: An Experimental and DFT Study. New J. Chem. 2019, 44, 218–230. [Google Scholar] [CrossRef]
- Venkatesan, P.; Cerón, M.; Thamotharan, S.; Robles, F.; Percino, M.J. Quantitative Analysis of Weak Non-Covalent Interactions in (Z)-3-(4-Halophenyl)-2-(Pyridin-2/3/4-Yl)Acrylonitriles. Cryst. Eng. Comm. 2018, 20, 2681–2697. [Google Scholar] [CrossRef]
- Pérez-Gutiérrez, E.; Percino, M.J.; Chapela, V.M.; Cerón, M.; Maldonado, J.L.; Ramos-Ortiz, G. Synthesis, Characterization and Photophysical Properties of Pyridine-Carbazole Acrylonitrile Derivatives. Materials 2011, 4, 562–574. [Google Scholar] [CrossRef] [Green Version]
- Percino, M.J.; Chapela, V.M.; Montiel, L.-F.; Pérez-Gutiérrez, E.; Maldonado, J.L. Spectroscopic Characterization of Halogen- and Cyano-Substituted Pyridinevinylenes Synthesized without Catalyst or Solvent. Chem. Pap. 2010, 64, 360–367. [Google Scholar] [CrossRef]
- Percino, M.J.; Chapela, V.M.; Pérez-Gutiérrez, E.; Cerón, M.; Soriano, G. Synthesis, Optical, and Spectroscopic Characterisation of Substituted 3-Phenyl-2-Arylacrylonitriles. Chem. Pap. 2011, 65, 42–51. [Google Scholar] [CrossRef]
- Percino, M.J.; Cerón, M.; Ceballos, P.; Soriano-Moro, G.; Castro, M.E.; Chapela, V.M.; Bonilla-Cruz, J.; Reyes-Reyes, M.; López-Sandoval, R.; Siegler, M.A. Important Role of Molecular Packing and Intermolecular Interactions in Two Polymorphs of (Z)-2-Phenyl-3-(4-(Pyridin-2-Yl)Phenyl)Acrylonitrile. Preparation, Structures, and Optical Properties. J. Mol. Struct. 2014, 1078, 74–82. [Google Scholar] [CrossRef]
- Percino, M.J.; Cerón, M.; Ceballos, P.; Soriano-Moro, G.; Rodríguez, O.; Chapela, V.M.; Castro, M.E.; Bonilla-Cruz, J.; Siegler, M.A. Changes in the Luminescence Emission of α,β-Unsaturated Acrylonitrile Derivatives: Morphology, Polymorphism and Solvent Effect. CrystEngComm 2016, 18, 7554–7572. [Google Scholar] [CrossRef]
- Percino, M.J.; Cerón, M.; Rodríguez, O.; Soriano-Moro, G.; Castro, M.E.; Chapela, V.M.; Siegler, M.A.; Pérez-Gutiérrez, E. Conformational and Molecular Structures of α,β-Unsaturated Acrylonitrile Derivatives: Photophysical Properties and Their Frontier Orbitals. Molecules 2016, 21, 389. [Google Scholar] [CrossRef] [Green Version]
- Percino, J.; Cerón, M.; Venkatesan, P.; Ceballos, P.; Bañuelos, A.; Rodríguez, O.; Siegler, M.A.; Robles, F.; Chapela, V.M.; Soriano-Moro, G.; et al. Two Different Emissions of (2 Z )-2-(4-Bromophenyl)-3-[4-(Dimethylamino)Phenyl]Prop-2-Enenitrile Due to Crystal Habit and Size: Synthesis, Optical, and Supramolecular Characterization. Cryst. Growth Des. 2017, 17, 1679–1694. [Google Scholar] [CrossRef]
- Bras, L.L.; Chaitou, K.; Aloïse, S.; Adamo, C.; Perrier, A. Aggregation-Caused Quenching versus Crystallization Induced Emission in Thiazolo[5,4-b]Thieno[3,2-e]Pyridine (TTP) Derivatives: Theoretical Insights. Phys. Chem. Chem. Phys. 2018, 21, 46–56. [Google Scholar] [CrossRef]
- Bünau, G.V.B.J.B. Birks: Photophysics of Aromatic Molecules. Wiley-Interscience, London 1970. 704 Seiten. Preis: 210s-v. Bünau-1970-Berichte Der Bunsengesellschaft Für Physikalische Chemie-Wiley Online Library. Available online: https://onlinelibrary.wiley.com/doi/abs/10.1002/bbpc.19700741223 (accessed on 17 November 2020).
- Macrae, C.F.; Sovago, I.; Cottrell, S.J.; Galek, P.T.A.; McCabe, P.; Pidcock, E.; Platings, M.; Shields, G.P.; Stevens, J.S.; Towler, M.; et al. Mercury 4.0: From Visualization to Analysis, Design and Prediction. J. Appl. Cryst. 2020, 53, 226–235. [Google Scholar] [CrossRef] [PubMed] [Green Version]
- Gavezzotti, A. Calculation of Intermolecular Interaction Energies by Direct Numerical Integration over Electron Densities. 2. An Improved Polarization Model and the Evaluation of Dispersion and Repulsion Energies. J. Phys. Chem. B 2003, 107, 2344–2353. [Google Scholar] [CrossRef]
- El-Emam, A.A.; Kumar, E.S.; Janani, K.; Al-Wahaibi, L.H.; Blacque, O.; El-Awady, M.I.; Al-Shaalan, N.H.; Percino, M.J.; Thamotharan, S. Quantitative Assessment of the Nature of Noncovalent Interactions in N-Substituted-5-(Adamantan-1-Yl)-1,3,4-Thiadiazole-2-Amines: Insights from Crystallographic and QTAIM Analysis. RSC Adv. 2020, 10, 9840–9853. [Google Scholar] [CrossRef] [Green Version]
- Al-Wahaibi, L.H.; Akilandeswari, G.; Anusha, R.; Al-Shaalan, N.H.; Alkmali, O.M.; El-Emam, A.A.; Percino, J.M.; Thamotharan, S. Insights into the Nature of Weak Noncovalent Interactions in 3-(4-Fluorophenyl)-6-(2-Fluorophenyl)-1,2,4-Triazolo[3,4-b][1,3,4]Thiadiazole, a Potential Bioactive Agent: X-Ray, QTAIM and Molecular Docking Analysis. J. Mol. Struct. 2019, 1183, 331–341. [Google Scholar] [CrossRef]
- Khadem Sadigh, M.; Zakerhamidi, M.S.; Shamkhali, A.N.; Shaabani, B.; Rad-Yousefnia, N. Investigation on Environmental Sensitivity Characteristics of Pyridine Compounds with Different Position of N-Atoms and Various Active Functional Groups. J. Mol. Liq. 2019, 275, 926–940. [Google Scholar] [CrossRef]
- Asiri, A.M.; Karabacak, M.; Kurt, M.; Alamry, K.A. Synthesis, Molecular Conformation, Vibrational and Electronic Transition, Isometric Chemical Shift, Polarizability and Hyperpolarizability Analysis of 3-(4-Methoxy-Phenyl)-2-(4-Nitro-Phenyl)-Acrylonitrile: A Combined Experimental and Theoretical Analysis. Spectrochim. Acta A 2011, 82, 444–455. [Google Scholar] [CrossRef] [PubMed]
- Zhang, Y.; Zhuang, G.; Ouyang, M.; Hu, B.; Song, Q.; Sun, J.; Zhang, C.; Gu, C.; Xu, Y.; Ma, Y. Mechanochromic and Thermochromic Fluorescent Properties of Cyanostilbene Derivatives. Dyes Pigment. 2013, 98, 486–492. [Google Scholar] [CrossRef]
- Zhao, Y.; Truhlar, D.G. The M06 Suite of Density Functionals for Main Group Thermochemistry, Thermochemical Kinetics, Noncovalent Interactions, Excited States, and Transition Elements: Two New Functionals and Systematic Testing of Four M06-Class Functionals and 12 Other Functionals. Theor. Chem. Acc. 2008, 120, 215–241. [Google Scholar] [CrossRef] [Green Version]
- Frisch, M.J.; Trucks, G.W.; Schlegel, H.B.; Scuseria, G.E.; Robb, M.A.; Cheeseman, J.R.; Scalmani, G.; Barone, V.; Petersson, G.A.; Nakatsuji, H.; et al. Gaussian 16 Rev. C.01; Gaussian, Inc.: Wallingford, CT, USA, 2016. [Google Scholar]
- Karthikeyan, K.; Rama, I.; Subashini, A.; Arunagiri, C.; Selvakumar, S. Crystal Structure, Hydrogen Bonding, Hirshfeld Surface Analysis and Inhibition Efficiency of a Schiff Base 2-Methoxy-6-(Naphthalene-2-Yliminomethyl)-Phenol. Chem. Data Collect. 2020, 25, 100337. [Google Scholar] [CrossRef]
- Udhayakala, P.; Rajendiran, T.V.; Gunasekaran, S. Density Functional Theory Investigations for the Adsorption of Some Oxadiazole Derivatives on Mild Steel. J. Adv. Sci. Res. 2012, 3, 67–74. [Google Scholar]
- Irfan, A.; Al-Sehemi, A.G.; Chaudhry, A.R.; Muhammad, S. How Methoxy Groups Change Nature of the Thiophene Based Heterocyclic Chalcones from P-Channel to Ambipolar Transport Semiconducting Materials. J. King Saud Univ. Sci. 2018, 30, 458–465. [Google Scholar] [CrossRef]
- Kosar, B.; Albayrak, C. Spectroscopic Investigations and Quantum Chemical Computational Study of (E)-4-Methoxy-2-[(p-Tolylimino)Methyl]Phenol. Spectrochim. Acta A 2011, 78, 160–167. [Google Scholar] [CrossRef] [PubMed]
- Pearson, R.G. Absolute Electronegativity and Hardness Correlated with Molecular Orbital Theory. Proc. Natl. Acad. Sci. USA 1986, 83, 8440–8441. [Google Scholar] [CrossRef] [PubMed] [Green Version]
- Mukhopadhyay, A.; Maka, V.K.; Moorthy, J.N. Remarkable Influence of ‘Phane Effect’ on the Excited-State Properties of Cofacially Oriented Coumarins. Phys. Chem. Chem. Phys. 2017, 19, 4758–4767. [Google Scholar] [CrossRef] [PubMed]
- Solvent and Environmental Effects. Principles of Fluorescence Spectroscopy; Lakowicz, J.R., Ed.; Springer US: Boston, MA, USA, 2006; pp. 205–235. ISBN 978-0-387-46312-4. [Google Scholar]
- Basavaraja, J.; Suresh Kumar, H.M.; Inamdar, S.R.; Wari, M.N. Estimation of Ground and Excited State Dipole Moment of Laser Dyes C504T and C521T Using Solvatochromic Shifts of Absorption and Fluorescence Spectra. Spectrochim. Acta Part A Mol. Biomol. Spectrosc. 2016, 154, 177–184. [Google Scholar] [CrossRef]
- Gavezzotti, A. The Calculation of Molecular Volumes and the Use of Volume Analysis in the Investigation of Structured Media and of Solid-State Organic Reactivity. J. Am. Chem. Soc. 1983, 105, 5220–5225. [Google Scholar] [CrossRef]
- Zhao, Y.H.; Abraham, M.H.; Zissimos, A.M. Fast Calculation of van Der Waals Volume as a Sum of Atomic and Bond Contributions and Its Application to Drug Compounds. J. Org. Chem. 2003, 68, 7368–7373. [Google Scholar] [CrossRef]
- Callis, P.R. Binding Phenomena and Fluorescence Quenching. I: Descriptive Quantum Principles of Fluorescence Quenching Using a Supermolecule Approach. J. Mol. Struct. 2014, 1077, 14–21. [Google Scholar] [CrossRef]
- Allen, F.H.; Kennard, O.; Watson, D.G.; Brammer, L.; Orpen, A.G.; Taylor, R. Tables of Bond Lengths Determined by X-Ray and Neutron Diffraction. Part 1. Bond Lengths in Organic Compounds. J. Chem. Soc. Perkin Trans. 2 1987, S1–S19. [Google Scholar] [CrossRef]
- Mercury-The Cambridge Crystallographic Data Centre (CCDC). Available online: https://www.ccdc.cam.ac.uk/Community/csd-community/freemercury/ (accessed on 17 November 2020).
- Thompson, H.P.G.; Day, G.M. Which Conformations Make Stable Crystal Structures? Mapping Crystalline Molecular Geometries to the Conformational Energy Landscape. Chem. Sci. 2014, 5, 3173–3182. [Google Scholar] [CrossRef] [Green Version]
- Wood, P.A.; Olsson, T.S.G.; Cole, J.C.; Cottrell, S.J.; Feeder, N.; Galek, P.T.A.; Groom, C.R.; Pidcock, E. Evaluation of Molecular Crystal Structures Using Full Interaction Maps. Cryst. Eng. Comm. 2012, 15, 65–72. [Google Scholar] [CrossRef]
- Verdonk, M.L.; Cole, J.C.; Taylor, R. SuperStar: A Knowledge-Based Approach for Identifying Interaction Sites in Proteins. J. Mol. Biol. 1999, 289, 1093–1108. [Google Scholar] [CrossRef] [PubMed]
- Nissink, J.W.M.; Taylor, R. Combined Use of Physicochemical Data and Small-Molecule Crystallographic Contact Propensities to Predict Interactions in Protein Binding Sites. Org. Biomol. Chem. 2004, 2, 3238–3249. [Google Scholar] [CrossRef]
- Bruno, I.J.; Cole, J.C.; Lommerse, J.P.M.; Rowland, R.S.; Taylor, R.; Verdonk, M.L. IsoStar: A Library of Information about Nonbonded Interactions. J. Comput. Aided Mol. Des. 1997, 11, 525–537. [Google Scholar] [CrossRef]
- Corpinot, M.K.; Bučar, D.-K. A Practical Guide to the Design of Molecular Crystals. Cryst. Growth Des. 2019, 19, 1426–1453. [Google Scholar] [CrossRef] [Green Version]
- Wang, C.; Dong, H.; Li, H.; Zhao, H.; Meng, Q.; Hu, W. Dibenzothiophene Derivatives: From Herringbone to Lamellar Packing Motif. Cryst. Growth Des. 2010, 10, 4155–4160. [Google Scholar] [CrossRef]
- Su, M.; Yan, X.; Guo, X.; Li, Q.; Zhang, Y.; Li, C. Two Orthogonal Halogen-Bonding Interactions Directed 2D Crystalline Supramolecular J-Dimer Lamellae. Chem. Eur. J. 2020, 26, 4505–4509. [Google Scholar] [CrossRef]
- Bond, A.D. ProcessPIXEL: A Program to Generate Energy-Vector Models from Gavezzotti’s PIXEL Calculations. J. Appl. Cryst. 2014, 47, 1777–1780. [Google Scholar] [CrossRef]
- Venkatesan, P.; Thamotharan, S.; Kumar, R.G.; Ilangovan, A. Invariant and Variable Intermolecular Interactions in Functionalized Malonic Acid Half-Esters: X-Ray, Hirshfeld Surface and PIXEL Energy Analyses. Cryst. Eng. Comm. 2014, 17, 904–915. [Google Scholar] [CrossRef]
- Venkatesan, P.; Rajakannan, V.; Venkataramanan, N.S.; Ilangovan, A.; Sundius, T.; Thamotharan, S. Structural Investigation of (2E)-2-(Ethoxycarbonyl)-3-[(4-Methoxyphenyl)Amino]Prop-2-Enoic Acid: X-Ray Crystal Structure, Spectroscopy and DFT. J. Mol. Struct. 2016, 1119, 259–268. [Google Scholar] [CrossRef]
- Hunter, C.A. Quantifying Intermolecular Interactions: Guidelines for the Molecular Recognition Toolbox. Angew. Chem. Int. Edit. 2004, 43, 5310–5324. [Google Scholar] [CrossRef]
- Thamotharan, S.; Kothandapani, J.; Selva Ganesan, S.; Venkataramanan, N.S.; Madan Kumar, S.; Byrappa, K.; Percino, J.; Robles, F. Quantitative Analysis of Intermolecular Interactions in 2,2’-((4-Bromophenyl)Methylene)Bis(3-Hydroxy-5,5-Dimethylcyclohex-2-En-1-One): Insights from Crystal Structure, PIXEL, Hirshfeld Surfaces and QTAIM Analysis. J. Chem. Sci. 2018, 130, 20. [Google Scholar] [CrossRef] [Green Version]
- Dunitz, J.D.; Gavezzotti, A. Supramolecular Synthons: Validation and Ranking of Intermolecular Interaction Energies. Cryst. Growth Des. 2012, 12, 5873–5877. [Google Scholar] [CrossRef]
- Srivastava, K.; Shimpi, M.R.; Srivastava, A.; Tandon, P.; Sinha, K.; Velaga, S.P. Vibrational Analysis and Chemical Activity of Paracetamol–Oxalic Acid Cocrystal Based on Monomer and Dimer Calculations: DFT and AIM Approach. RSC Adv. 2016, 6, 10024–10037. [Google Scholar] [CrossRef]
- Singh, I.; El-Emam, A.A.; Pathak, S.K.; Srivastava, R.; Shukla, V.K.; Prasad, O.; Sinha, L. Experimental and Theoretical DFT (B3LYP, X3LYP, CAM-B3LYP and M06-2X) Study on Electronic Structure, Spectral Features, Hydrogen Bonding and Solvent Effects of 4-Methylthiadiazole-5-Carboxylic Acid. Mol. Simul. 2019, 45, 1029–1043. [Google Scholar] [CrossRef]
- Kerru, N.; Gummidi, L.; Bhaskaruni, S.V.H.S.; Maddila, S.N.; Singh, P.; Jonnalagadda, S.B. A Comparison between Observed and DFT Calculations on Structure of 5-(4-Chlorophenyl)-2-Amino-1,3,4-Thiadiazole. Sci. Rep. 2019, 9, 19280. [Google Scholar] [CrossRef]
- Alam, M.; Park, S. Molecular Structure, Spectral Studies, NBO, HOMO–LUMO Profile, MEP and Mulliken Analysis of 3β,6β-Dichloro-5α-Hydroxy-5α–Cholestane. J. Mol. Struct. 2018, 1159, 33–45. [Google Scholar] [CrossRef]
- Sebastian, S.; Sundaraganesan, N. The Spectroscopic (FT-IR, FT-IR Gas Phase, FT-Raman and UV) and NBO Analysis of 4-Hydroxypiperidine by Density Functional Method. Spectrochim. Acta A 2010, 75, 941–952. [Google Scholar] [CrossRef]
- Clark, R.C.; Reid, J.S. The Analytical Calculation of Absorption in Multifaceted Crystals. Acta Crysllogr. A 1995, 51, 887–897. [Google Scholar] [CrossRef]
- Sheldrick, G.M. SHELXT—Integrated Space-Group and Crystal-Structure Determination. Acta Cryst. A 2015, 71, 3–8. [Google Scholar] [CrossRef] [Green Version]
- Dolomanov, O.V.; Bourhis, L.J.; Gildea, R.J.; Howard, J.A.K.; Puschmann, H. OLEX2: A Complete Structure Solution, Refinement and Analysis Program. J. Appl. Cryst. 2009, 42, 339–341. [Google Scholar] [CrossRef]
- Kendall, R.A.; Dunning, T.H.; Harrison, R.J. Electron Affinities of the First-row Atoms Revisited. Systematic Basis Sets and Wave Functions. J. Chem. Phys. 1992, 96, 6796–6806. [Google Scholar] [CrossRef] [Green Version]
- Grimme, S.; Antony, J.; Ehrlich, S.; Krieg, H. A Consistent and Accurate Ab Initio Parametrization of Density Functional Dispersion Correction (DFT-D) for the 94 Elements H-Pu. J. Chem. Phys. 2010, 132, 154104. [Google Scholar] [CrossRef] [Green Version]
- Barone, V.; Cossi, M. Quantum Calculation of Molecular Energies and Energy Gradients in Solution by a Conductor Solvent Model. J. Phys. Chem. A 1998, 102, 1995–2001. [Google Scholar] [CrossRef]
- Casida, M.E.; Jamorski, C.; Casida, K.C.; Salahub, D.R. Molecular Excitation Energies to High-Lying Bound States from Time-Dependent Density-Functional Response Theory: Characterization and Correction of the Time-Dependent Local Density Approximation Ionization Threshold. J. Chem. Phys. 1998, 108, 4439–4449. [Google Scholar] [CrossRef]
- Gavezzotti, A. Non-Conventional Bonding between Organic Molecules. The ‘Halogen Bond’ in Crystalline Systems. Mol. Phys. 2008, 106, 1473–1485. [Google Scholar] [CrossRef] [Green Version]
- Gavezzotti, A. Efficient Computer Modeling of Organic Materials. The Atom–Atom, Coulomb–London–Pauli (AA-CLP) Model for Intermolecular Electrostatic-Polarization, Dispersion and Repulsion Energies. New J. Chem. 2011, 35, 1360–1368. [Google Scholar] [CrossRef]
- Glendening, E.D.; Badenhoop, J.K.; Reed, A.E.; Carpenter, J.E.; Bohmann, C.M.; Morales, C.M.; Karafiloglou, P.; Landis, C.R.; Weinhold, F. NBO 7.0; Theoretical Chemistry Institute, University of Wisconsin: Madison, WI, USA, 2018. [Google Scholar]
- Lu, T.; Chen, F. Multiwfn: A Multifunctional Wavefunction Analyzer. J. Comput. Chem. 2012, 33, 580–592. [Google Scholar] [CrossRef]
- Humphrey, W.; Dalke, A.; Schulten, K. VMD: Visual Molecular Dynamics. J. Mol. Graph. 1996, 14, 33–38. [Google Scholar] [CrossRef]


| I | II | ||||||||
|---|---|---|---|---|---|---|---|---|---|
| λ (nm) | E (eV) | f | Major Contribution (%) | λexp (nm) | λ (nm) | E (eV) | f | Major Contribution (%) | λexp (nm) |
| Gas | |||||||||
| 345 | 3.58 | 0.705 | HOMO→LUMO(97) | 376 | 380 | 3.25 | 1.713 | H − 1→L + 1(12) HOMO→LUMO(86) | 416 |
| 276 | 4.49 | 0.165 | H − 1→LUMO(86) | 299 | 288 | 4.29 | 0.116 | H − 3→L + 1(10) H − 2→LUMO(60) H − 1→L + 1(19) | 281 |
| 246 | 5.03 | 0.006 | H − 2→LUMO(40) H − 1→L + 1(12) HOMO→L + 1 (30) | - | 252 | 4.90 | 0.118 | H − 2→LUMO(13) H − 1→L + 1(58) | 254 |
| 237 | 5.21 | 0.074 | H − 3→LUMO(20) H − 1→LUMO(12) HOMO→L + 2(33) HOMO→L + 3(27) | 241 | 229 | 5.40 | 0.152 | H − 4→LUMO(55) HOMO→L + 2(37) | - |
| 224 | 5.53 | 0.016 | H − 3→LUMO(47) H − 2→LUMO(14) HOMO→L + 2(23) | - | 216 | 5.72 | 0.185 | HOMO→L + 3(19) HOMO→L + 5(46) | - |
| III | IV | ||||||||
| 347 | 3.57 | 0.691 | HOMO→LUMO(97) | 393 | 348 | 3.55 | 0.673 | HOMO→LUMO(97) | 387 |
| 275 | 4.49 | 0.204 | H − 1→LUMO(85) | 276 | 277 | 4.46 | 0.168 | H − 1→LUMO (85) | 306 |
| 260 | 4.75 | 0.001 | H − 3→LUMO(39) H − 3→L + 1(40) | 250 | 261 | 4.74 | 0.012 | H − 3→LUMO (39) H − 3→L + 1 (40) | 349 |
| 248 | 4.98 | 0.039 | H − 4→LUMO(10) H − 2→L + 1(12) H − 1→L + 1(51) | 243 | 247 | 5.01 | 0.028 | H − 3→LUMO(10) H − 1→L + 1 (12) HOMO→L + 1(51) | |
| 237 | 5.21 | 0.001 | H − 3→LUMO(14) H − 3→L + 1(43) H − 3→L + 2(12) | 239 | 5.18 | 0.014 | H − 3→LUMO(14) H − 3→L + 1 (43) H − 3→L + 2 (12) H − 2→LUMO (10) | ||
| V | |||||||||
| 352 | 3.51 | 0.661 | HOMO→LUMO(97) | 393 | |||||
| 278 | 4.45 | 0.193 | H − 1→LUMO(88) | 310 | |||||
| 266 | 4.64 | 0.005 | H − 3→LUMO(60) H − 3→L + 2(25) | 248 | |||||
| 244 | 5.06 | 0.014 | H − 2→LUMO(66) HOMO→L + 1(12) | - | |||||
| 235 | 5.25 | 0.071 | HOMO→L + 2(37) HOMO→L + 3(35) | - | |||||
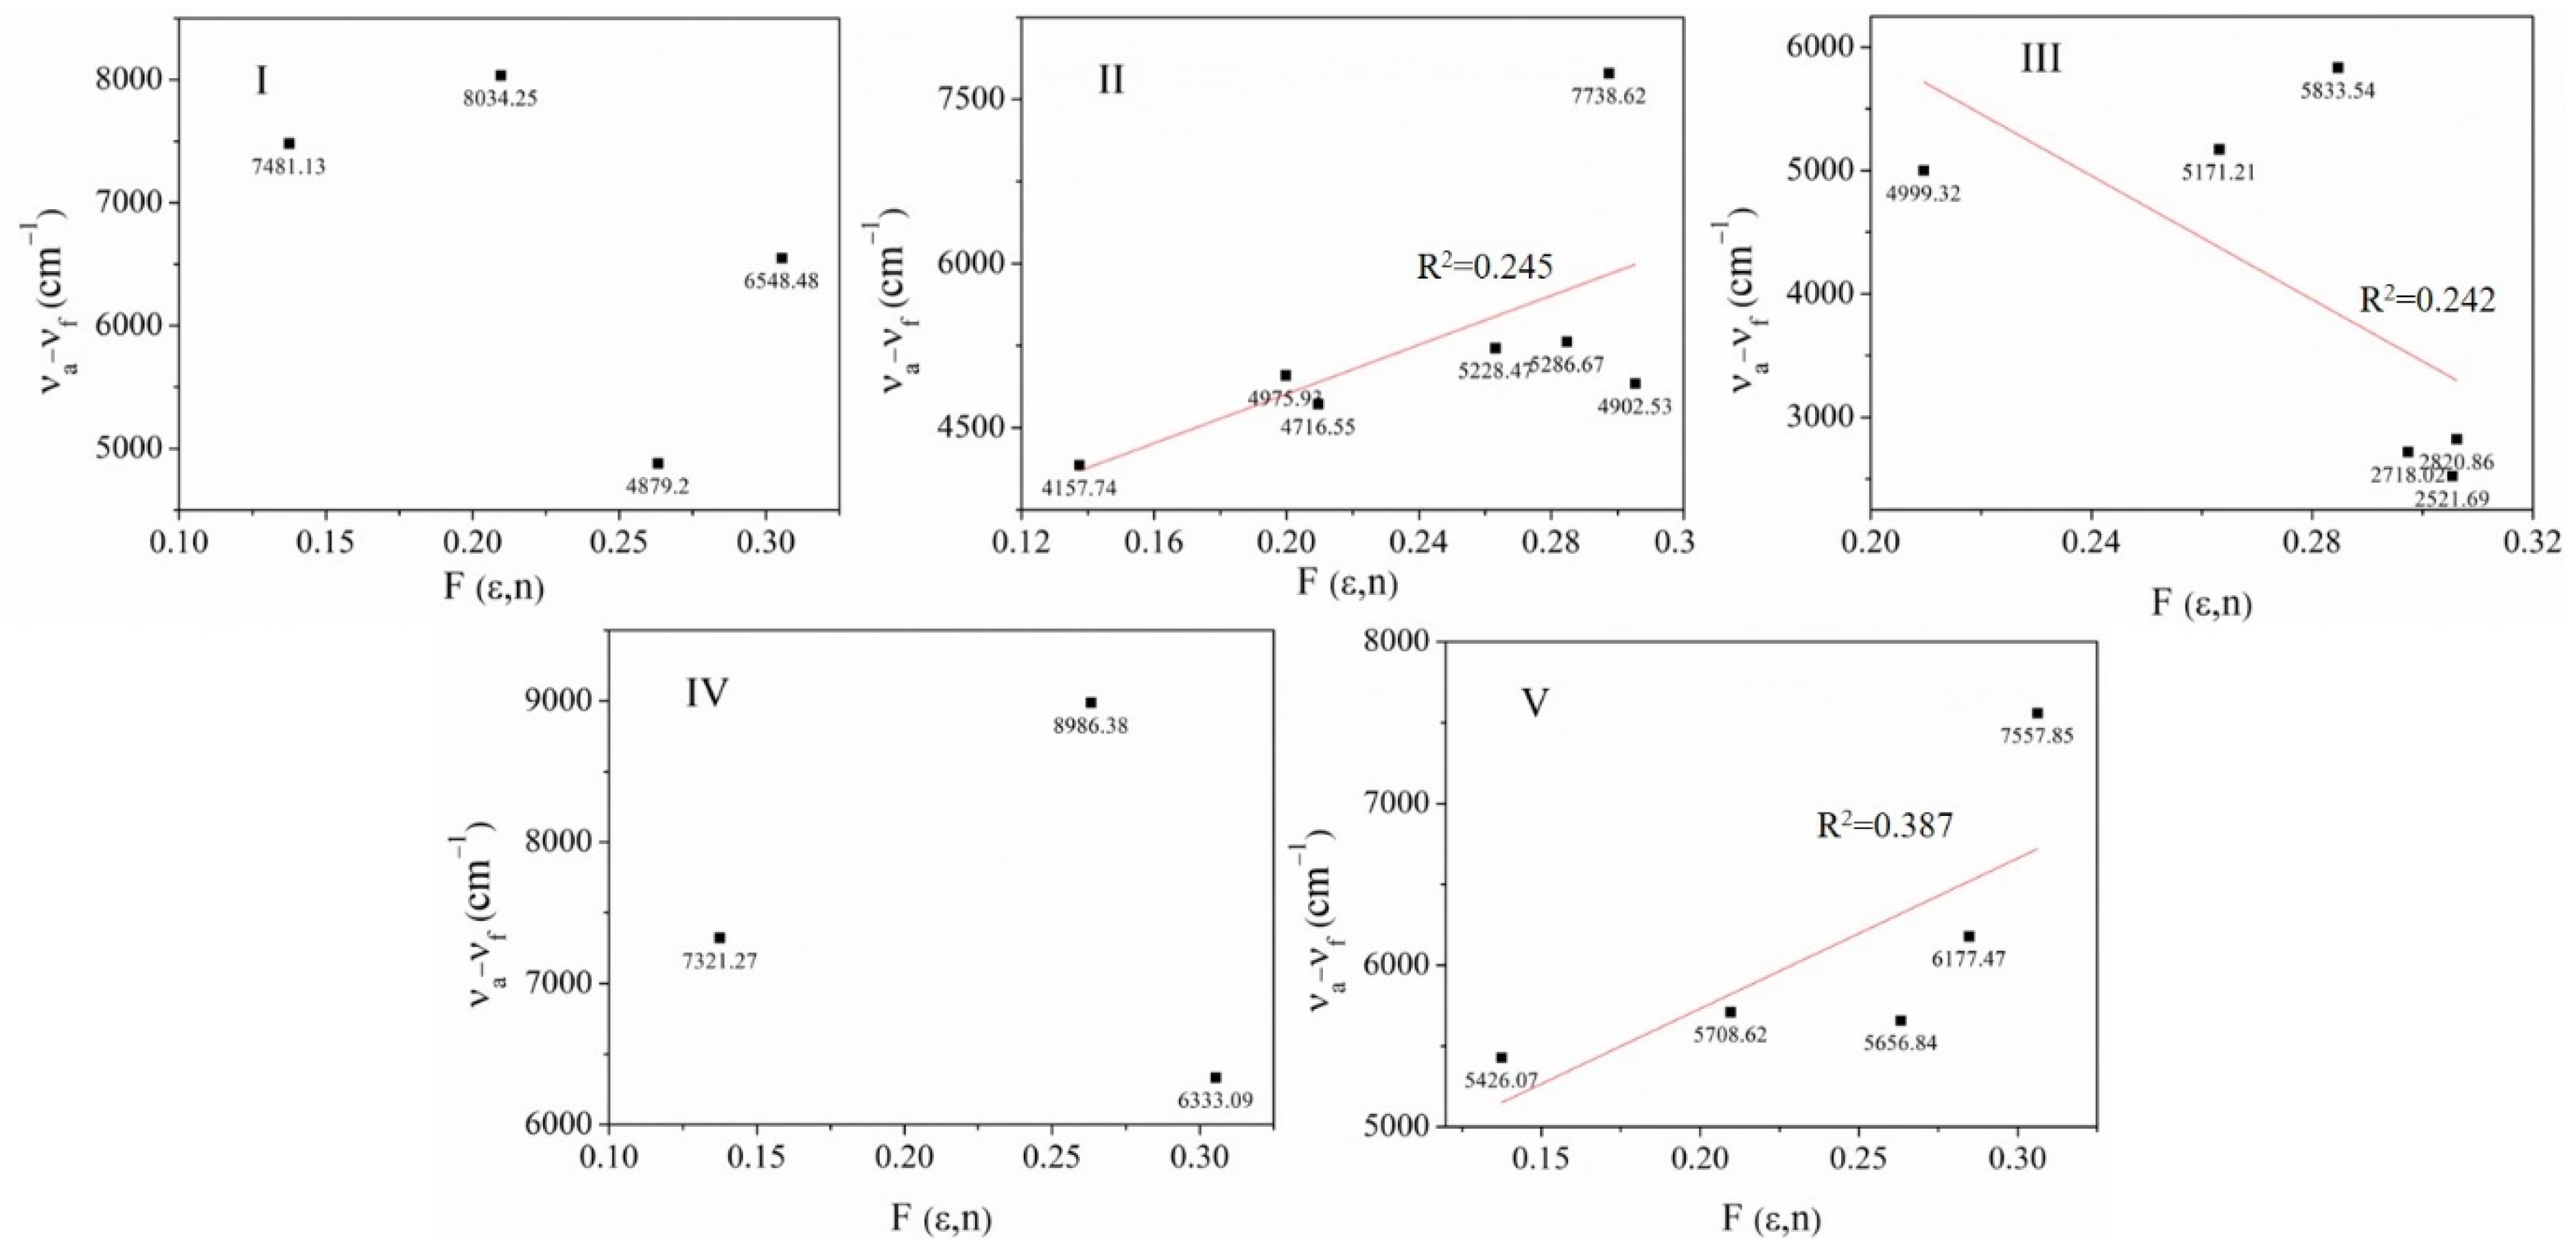
| Stokes Shift (cm−1) | |||||
|---|---|---|---|---|---|
| Solvent | I | II | III | IV | V |
| DMSO | 4879.2 | 5228.47 | 5171.21 | 8986.38 | 5656.84 |
| MeOH | -- | 14,842.76 | 2820.86 | -- | 7557.85 |
| EtOAc | -- | 4902.53 | 2521.69 | -- | 6177.47 |
| AcCN | 8034.25 | 5286.67 | 5833.54 | -- | 5708.62 |
| Acetone | 7481.13 | 4716.55 | 4999.32 | 7321.27 | 5426.07 |
| CHCl3 | 6548.48 | 4975.93 | -- | 6333.09 | -- |
| THF | -- | 4157.74 | -- | -- | -- |
| MeOH/acetone | -- | 7738.62 | 2718.02 | -- | -- |
| η | 2.75 | 2.50 | 2.73 | 2.73 | 2.70 |
| powder | 1644.61 | 322.52 | 1638.19 | 1615.48 | 571.5 |
| Φ* = (%) | 14.58 | 40.13 | 80.72 | 138.16 | 148.72 |
| μe − μg | μg D | μe | Φ° | a * | a ** | μg (D) | μe | |
|---|---|---|---|---|---|---|---|---|
| I | - | - | - | 4.95 | 5.32 | 5.71 | 7.63 | |
| II | 1.52 | 7.58 | 13.1 | 33.04 | 5.93 | 6.23 | 0.0003 | 12.69 |
| III | 4.92 | 5.55 | 7.22 | 8.13 | ||||
| IV | 2.13 | 3.72 | 5.65 | 49.89 | 4.92 | 5.49 | 7.69 | 8.09 |
| V | 1.31 | 9.2 | 3.97 | 38.02 | 4.92 | 5.21 | 7.15 | 7.45 |
| Assigned [77] | Bond Length | Ia | Ib | Ic | II | |
|---|---|---|---|---|---|---|
| Double bond Csp2=Csp2 (overall) [77] 1.316 If it is conjugated with Ar. 1.339 | C(7)-C(8) | 1.3483(18) | 1.3457(18) | 1.3492(16) | C(4)-C(5) | 1.352(3) |
| Bond Car≈Car C≈C (overall) 1.380 1.384 | C(9)-C(10) C(9)-C(14) C(10)-C(11) C(13)-C(14) | 1.4058(18) 1.4082(18) 1.3994(18) 1.3762(18) | 1.4073(18) 1.4078(18) 1.3961(18) 1.3759(18) | 1.4043(16) 1.4067(16) 1.3965(15) 1.3742(16) | C(6)-C(11) C(6)-C(7) C(10)-C(11) C(7)-C(8) | 1.403(3) 1.408(3) 1.404(2) 1.387(2) |
| Csp2-Car (overall) 1.483 (conjugated)1.470, 1.488 | C(1)-C(7) C(8)-C(9) | 1.4897(17) 1.4548(17) | 1.4898(17) 1.4569(17) | 1.4861(15) 1.4536(15) | C(3)-C(4) C(5)-C(6) | 1.480(2) 1.455(2) |
| Ia | Ib | Ic | II | |||
| Atoms | (°) | Atoms | (°) | |||
| C(6)-C(1)-C(7)-C(8) | −32.6(2) | 32.9(2) | 32.7(2) | C(2)-C(3)-C(4)-C(5) | −5.3(3) | |
| C(2)-C(1)-C(7)-C(15) | −30.7(2) | 30.5(2) | 30.5(2) | C(1)-C(3)-C(4)-C(12) | −3.7(2) | |
| C(6)-C(1)-C(7)-C(15) | 148.9(1) | −148.89(15) | −148.8(1) | C(2)-C(3)-C(4)-C(12) | 176.47(15) | |
| C(15)-C(7)-C(8)-C(9) | 0.5(2) | −0.2(3) | −0.6(2) | C(12)-C(4)-C(5)-C(6) | −3.1(3) | |
| C(1)-C(7)-C(8)-C(9) | −177.9(1) | 177.85(14) | 177.8(1) | C(3)-C(4)-C(5)-C(6) | 178.77(17) | |
| C(7)-C(8)-C(9)-C(10) | 169.8(1) | −170.14(16) | −169.9(1) | C(4)-C(5)-C(6)-C(11) | 175.14(18) | |
| C(7)-C(8)-C(9)-C(14) | −7.9(2) | 7.8(3 | 8.0(2) | C(4)-C(5)-C(6)-C(7) | −6.0(3) | |
| C(14)-C(9)-C(10)-O(1) | −178.9(1) | 178.8(1) | 178.8(1) | C(7)-C(6)-C(11)-O(3) | 175.56(15) | |
| C(8)-C(9)-C(10)-O(1) | 3.1(2) | −3.1(2) | −3.2(2) | C(5)-C(6)-C(11)-O(3) | −5.5(2) | |
| C(10)-C(11)-C(12)-O(2) | 178.8(1) | −178.8(1) | −178.8(1) | O(2)-C(9)-C(10)-C(11) | −177.78(17) | |
| Assigned [77] | III | IV | IV | |
|---|---|---|---|---|
| Double bond Csp2=Csp2 (overall)1.316 * with Ar. 1.339 | C(6)-C(8) | 1.3560(16) | 1.351(2) | 1.358(3) |
| Bond Car≈Car C≈C (overall) 1.380 1.384 | C(9)-C(10) C(9)-C(14)C(10)-C(11) C(13)-C(14) | 1.4060(16) 1.4110(17) 1.3952(17) 1.3747(17) | 1.405(2) 1.407(2) 1.398(2) 1.377(2) | 1.405(3) 1.404(4) 1.402(3) 1.376(3) |
| Csp2-Car (overall) 1.483 (conjugated) 1.470, 1.488 | C(5)-C(6) C(8)-C(9) | 1.4869(17) 1.4481(17) | 1.491(2) 1.443(2) | 1.486(3) 1.446(3) |
| Atoms | III | IV | V |
|---|---|---|---|
| C(4)-C(5)-C(6)-C(8) | 29.39(18) | 28.89 | 13.2(4) |
| N(1)-C(5)-C(6)-C(7) | 27.07(15) | ||
| C(1)-C(5)-C(6)-C(7) | 28.98 | 11.8(3) | |
| C(4)-C(5)-C(6)-C(7) | −153.52(12) | −150.33 | −167.2(2) |
| C(7)-C(6)-C(8)-C(9) | −1.7(2) | 1.18 | 3.6(4) |
| C(5)-C(6)-C(8)-C(9) | 175.10(12) | −177.97 | −176.9(2) |
| C(6)-C(8)-C(9)-C(10) | −173.62(13) | 179.17 | −174.3(2) |
| C(6)-C(8)-C(9-C(14) | 4.3(2) | 0.88 | 7.1(4) |
| C(14)-C(9)-C(10)-O(1) | 178.97(10) | 178.23 | −177.7(2) |
| C(8)-C(9)-C(10)-O(1) | −2.97(16) | −0.17 | 3.6(3) |
| C(10)-C(11)-C(12)-O(2) | −178.25(12) | 178.11 | −179.4(2) |
| Crystal | Ecoul | Epol | Edis | Erep | Etot |
|---|---|---|---|---|---|
| Ia | −14.31 | −5.37 | −39.07 | 23.70 | −35.06 |
| Ib | −14.55 | −5.59 | −39.60 | 24.71 | −35.03 |
| Ic | −14.38 | −5.47 | −39.34 | 24.23 | −34.96 |
| II | −25.50 | −9.76 | −71.91 | 52.86 | −54.30 |
| III | −19.01 | −7.93 | −44.43 | 33.24 | −38.12 |
| IV | −14.02 | −5.28 | −40.12 | 23.18 | −36.25 |
| V | −12.97 | −7.24 | −45.84 | 31.64 | −37.45 |
Publisher’s Note: MDPI stays neutral with regard to jurisdictional claims in published maps and institutional affiliations. |
© 2021 by the authors. Licensee MDPI, Basel, Switzerland. This article is an open access article distributed under the terms and conditions of the Creative Commons Attribution (CC BY) license (http://creativecommons.org/licenses/by/4.0/).
Share and Cite
Castillo, A.; Ceballos, P.; Santos, P.; Cerón, M.; Venkatesan, P.; Pérez-Gutiérrez, E.; Sosa-Rivadeneyra, M.; Thamotharan, S.; Siegler, M.A.; Percino, M.J. Solution and Solid-State Photophysical Properties of Positional Isomeric Acrylonitrile Derivatives with Core Pyridine and Phenyl Moieties: Experimental and DFT Studies. Molecules 2021, 26, 1500. https://doi.org/10.3390/molecules26061500
Castillo A, Ceballos P, Santos P, Cerón M, Venkatesan P, Pérez-Gutiérrez E, Sosa-Rivadeneyra M, Thamotharan S, Siegler MA, Percino MJ. Solution and Solid-State Photophysical Properties of Positional Isomeric Acrylonitrile Derivatives with Core Pyridine and Phenyl Moieties: Experimental and DFT Studies. Molecules. 2021; 26(6):1500. https://doi.org/10.3390/molecules26061500
Chicago/Turabian StyleCastillo, Armando, Paulina Ceballos, Pilar Santos, Margarita Cerón, Perumal Venkatesan, Enrique Pérez-Gutiérrez, Martha Sosa-Rivadeneyra, Subbiah Thamotharan, Maxime A. Siegler, and María Judith Percino. 2021. "Solution and Solid-State Photophysical Properties of Positional Isomeric Acrylonitrile Derivatives with Core Pyridine and Phenyl Moieties: Experimental and DFT Studies" Molecules 26, no. 6: 1500. https://doi.org/10.3390/molecules26061500