Towards Iron(II) Complexes with Octahedral Geometry: Synthesis, Structure and Photophysical Properties

 , ,
, ,  ,
,
Abstract
:1. Introduction
2. Results
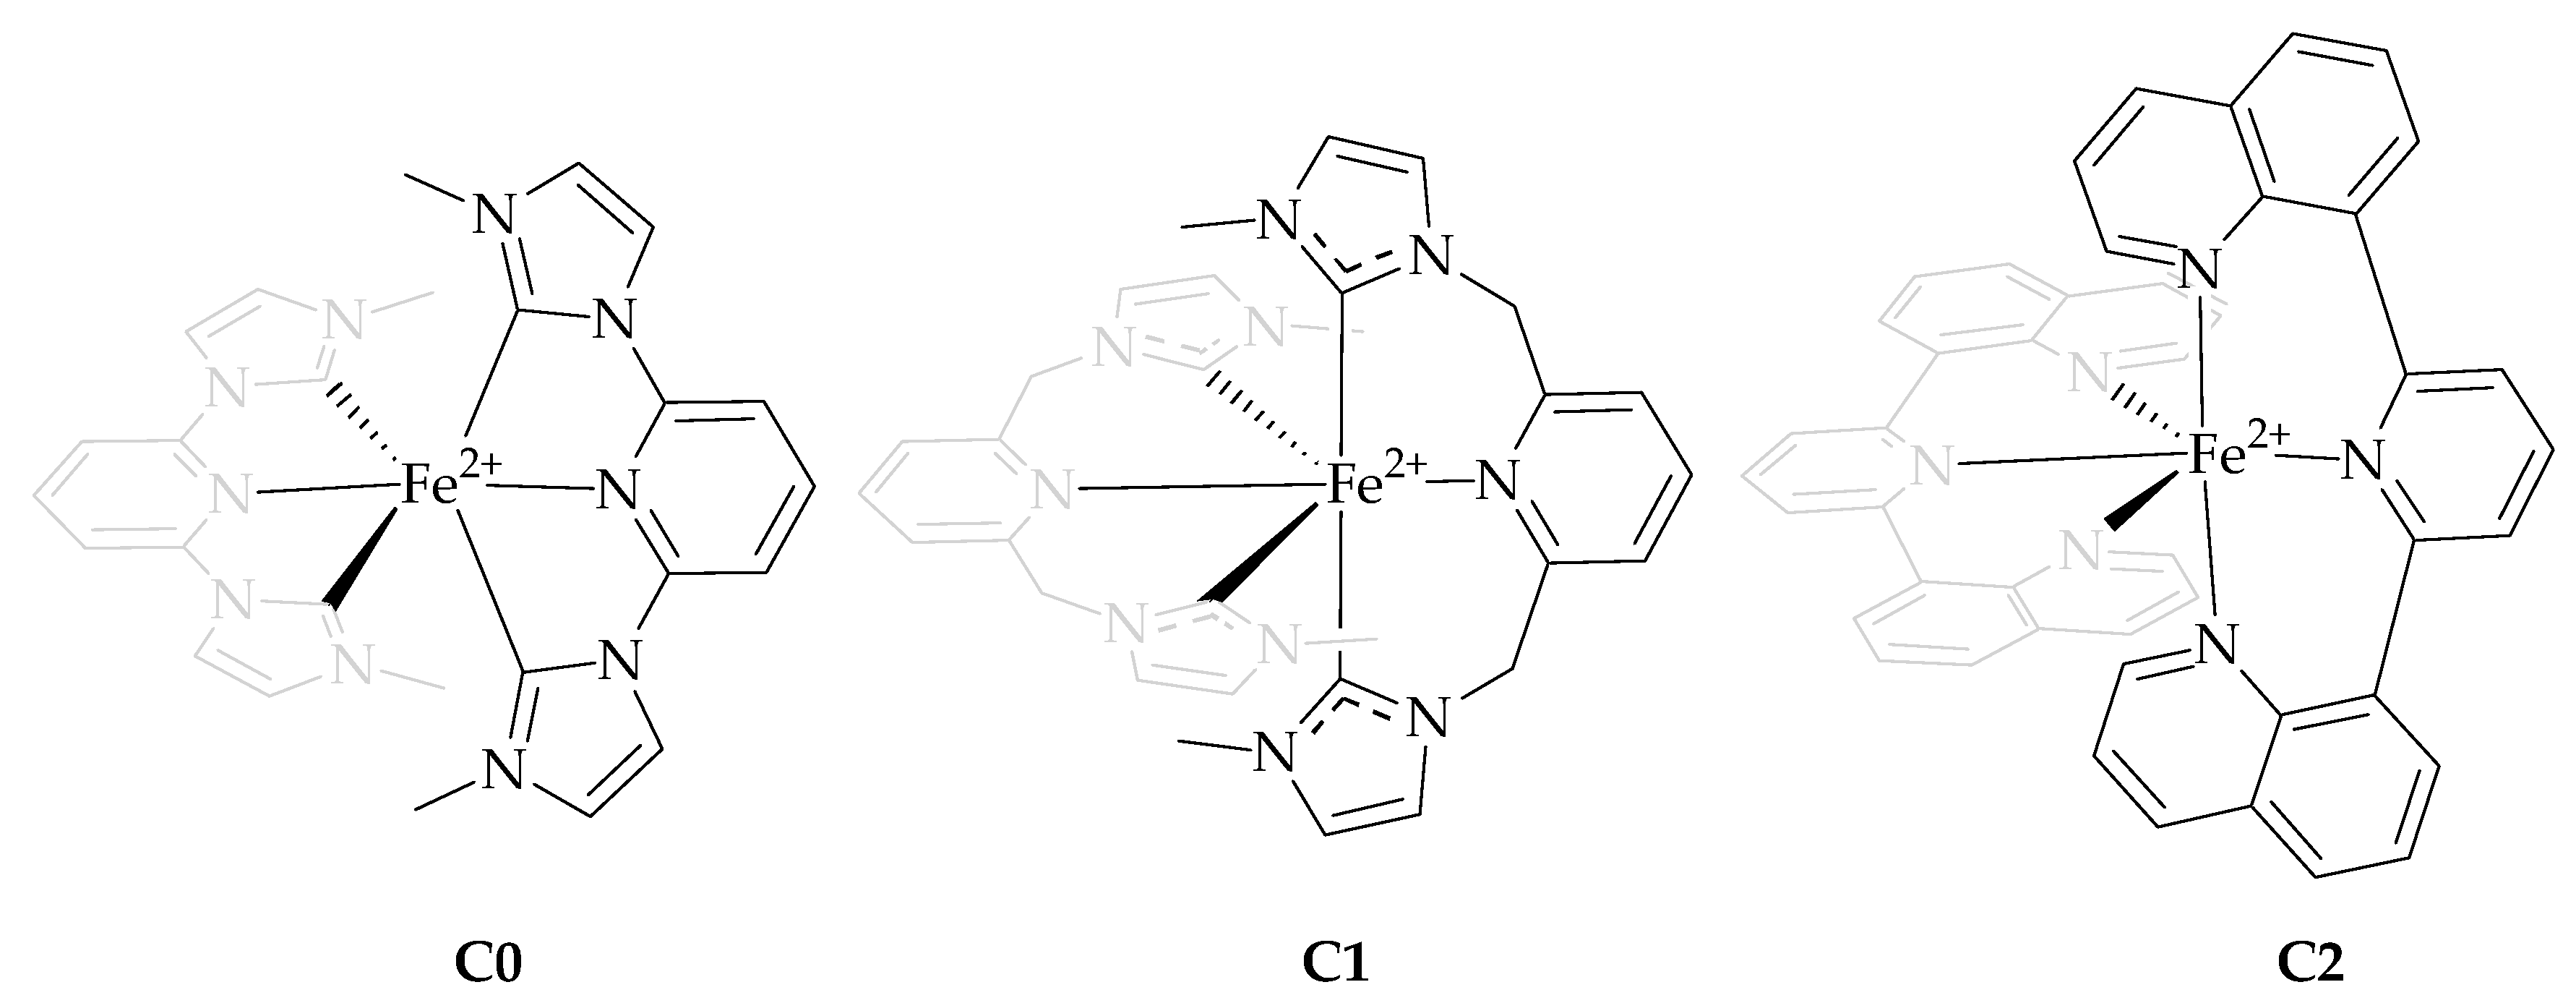
2.1. Synthesis and Characterization
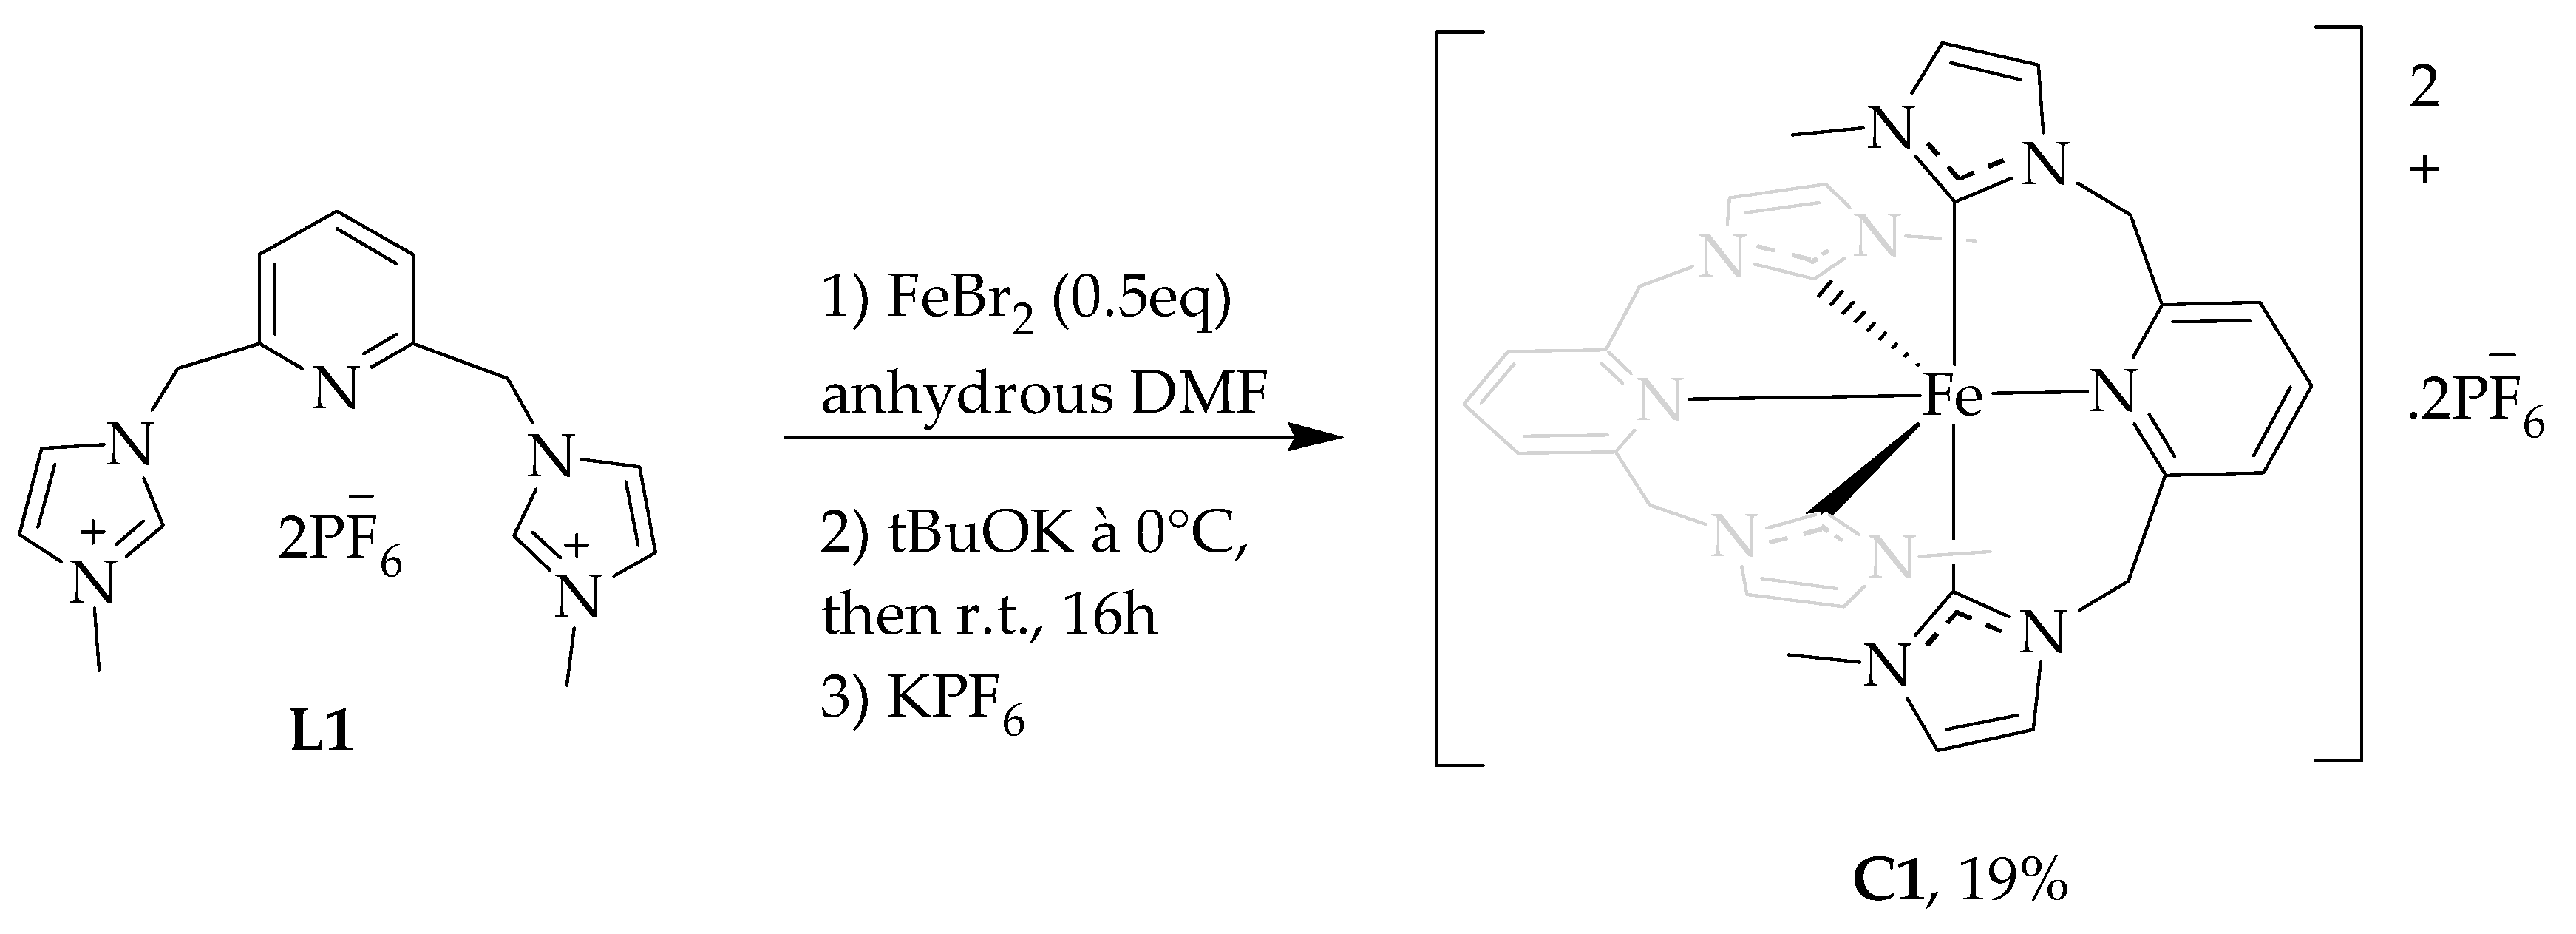
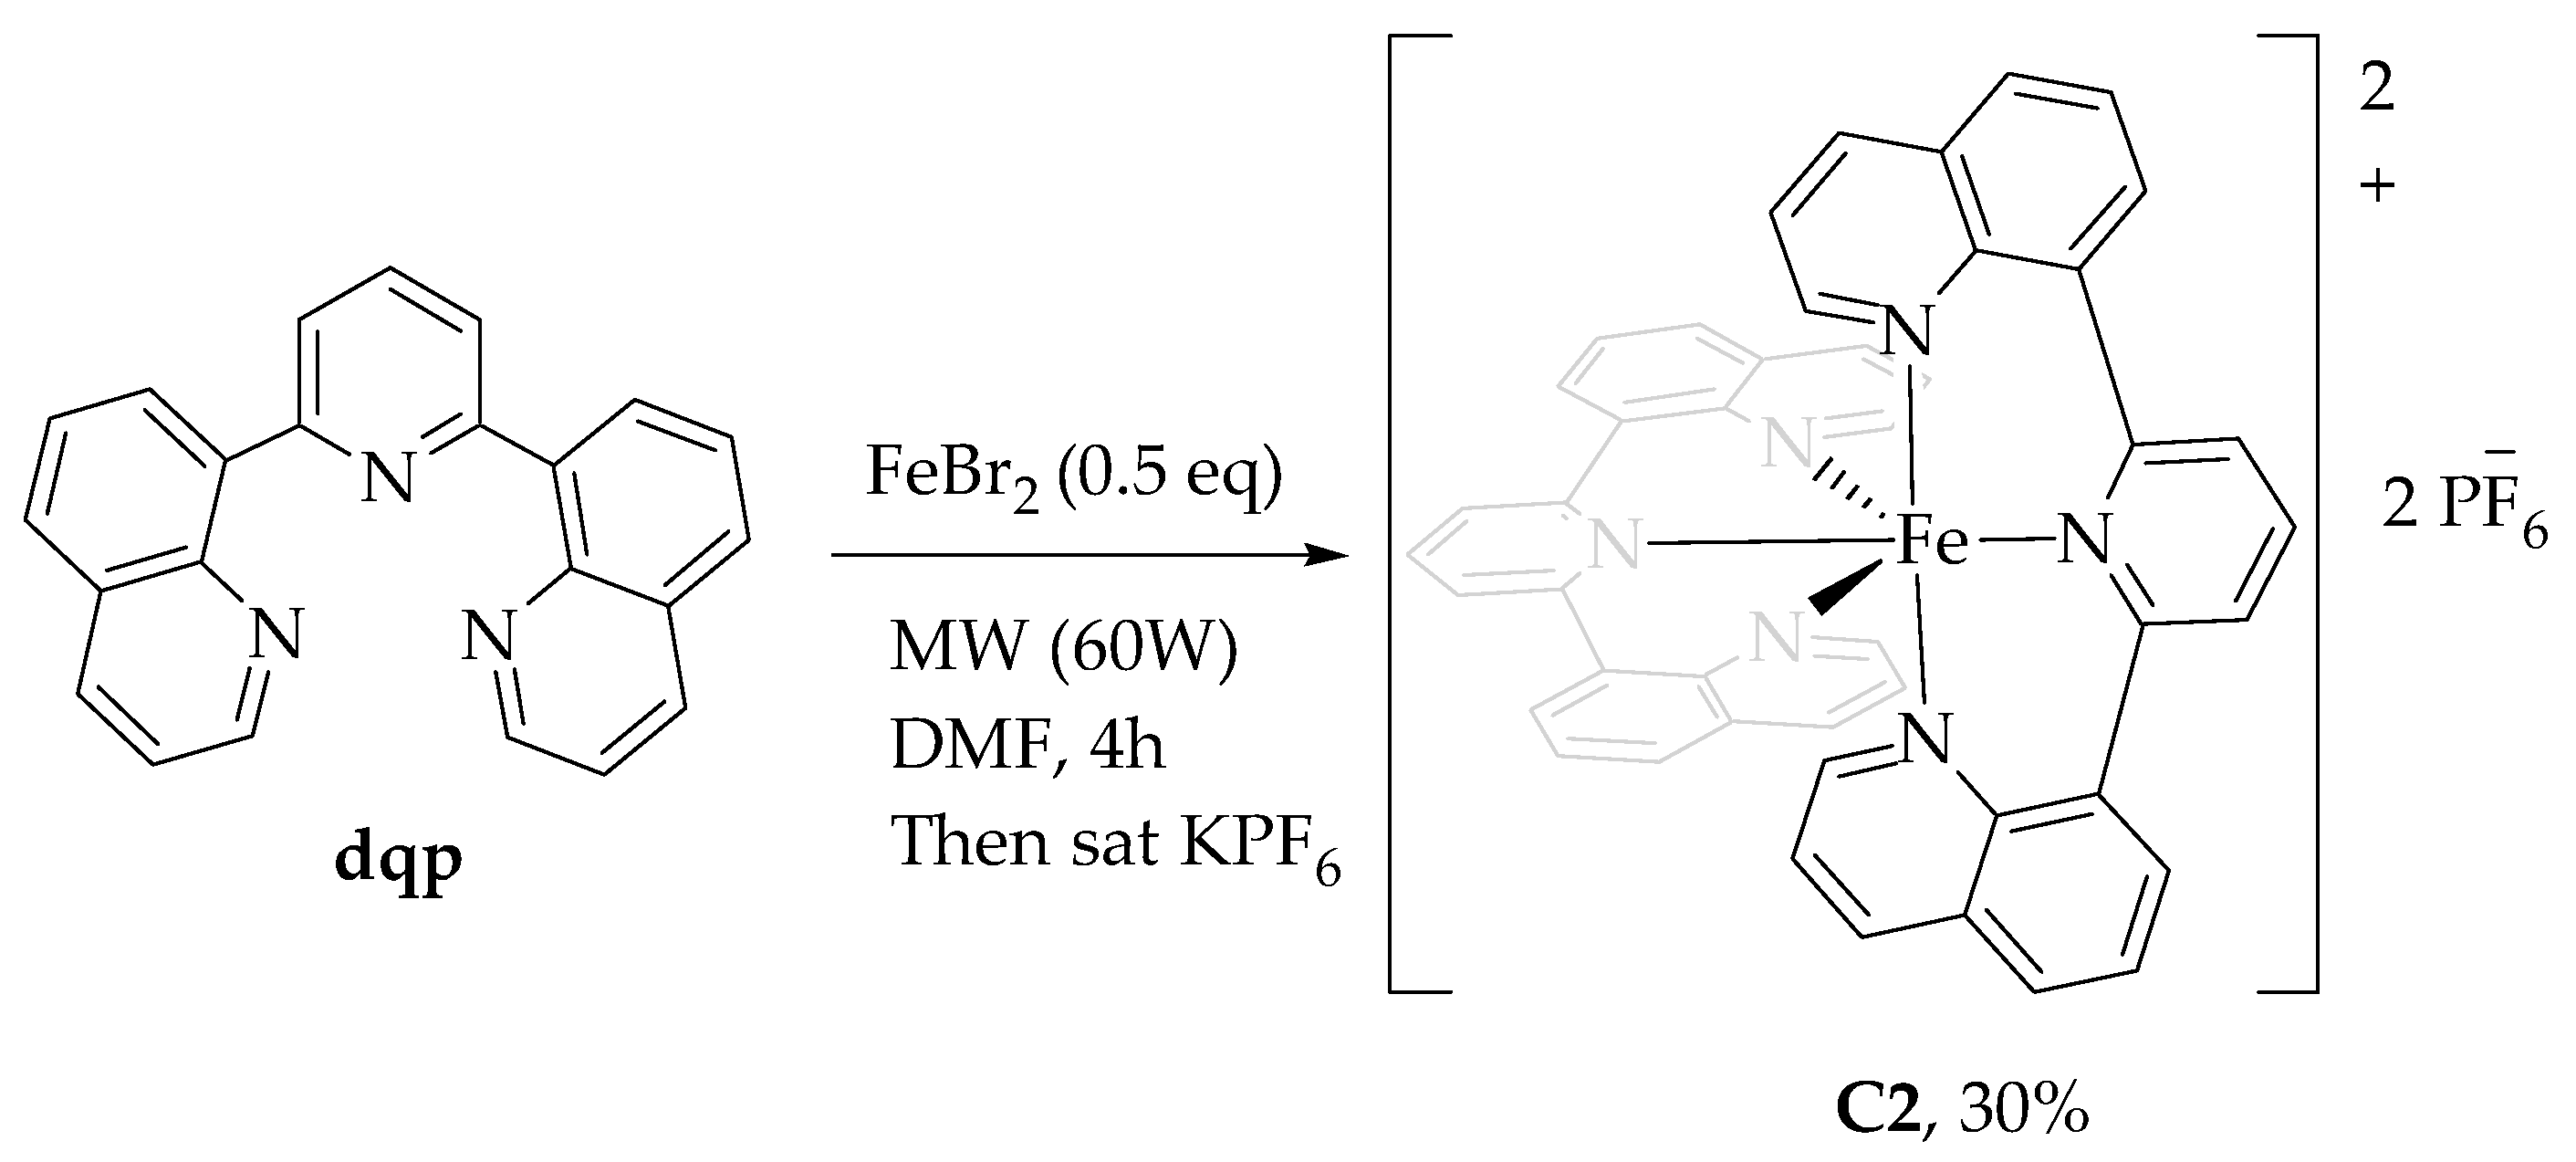
2.1.1. Synthesis of Ligands and Complexes
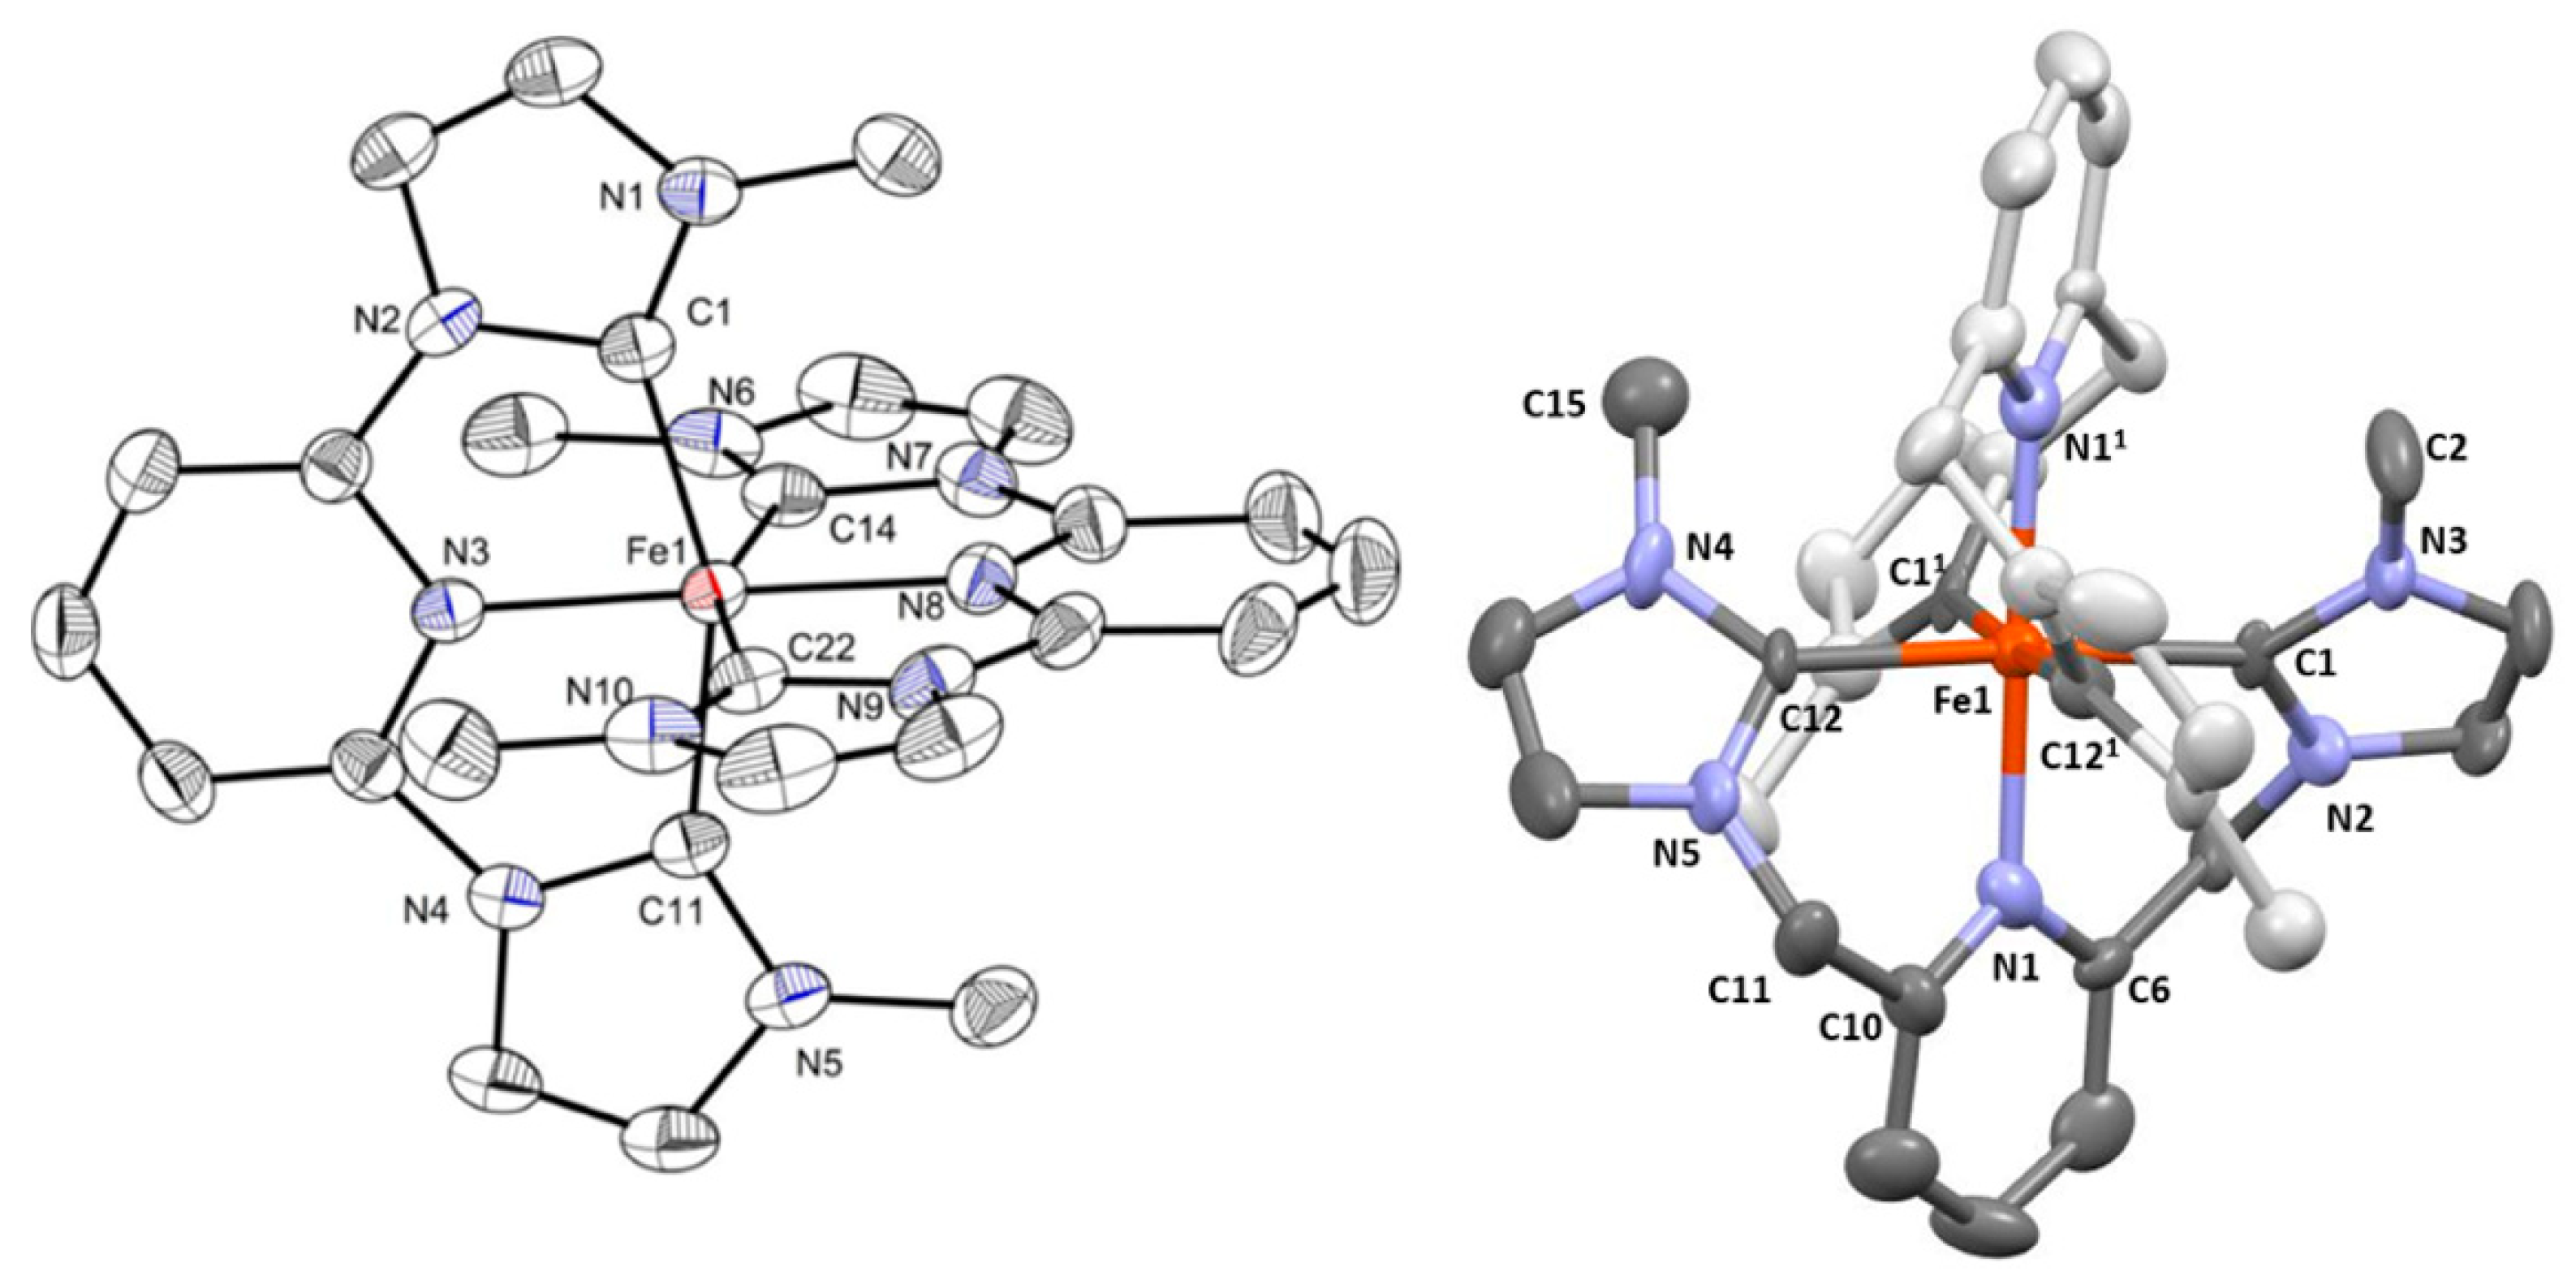
2.1.2. X-Ray Structures
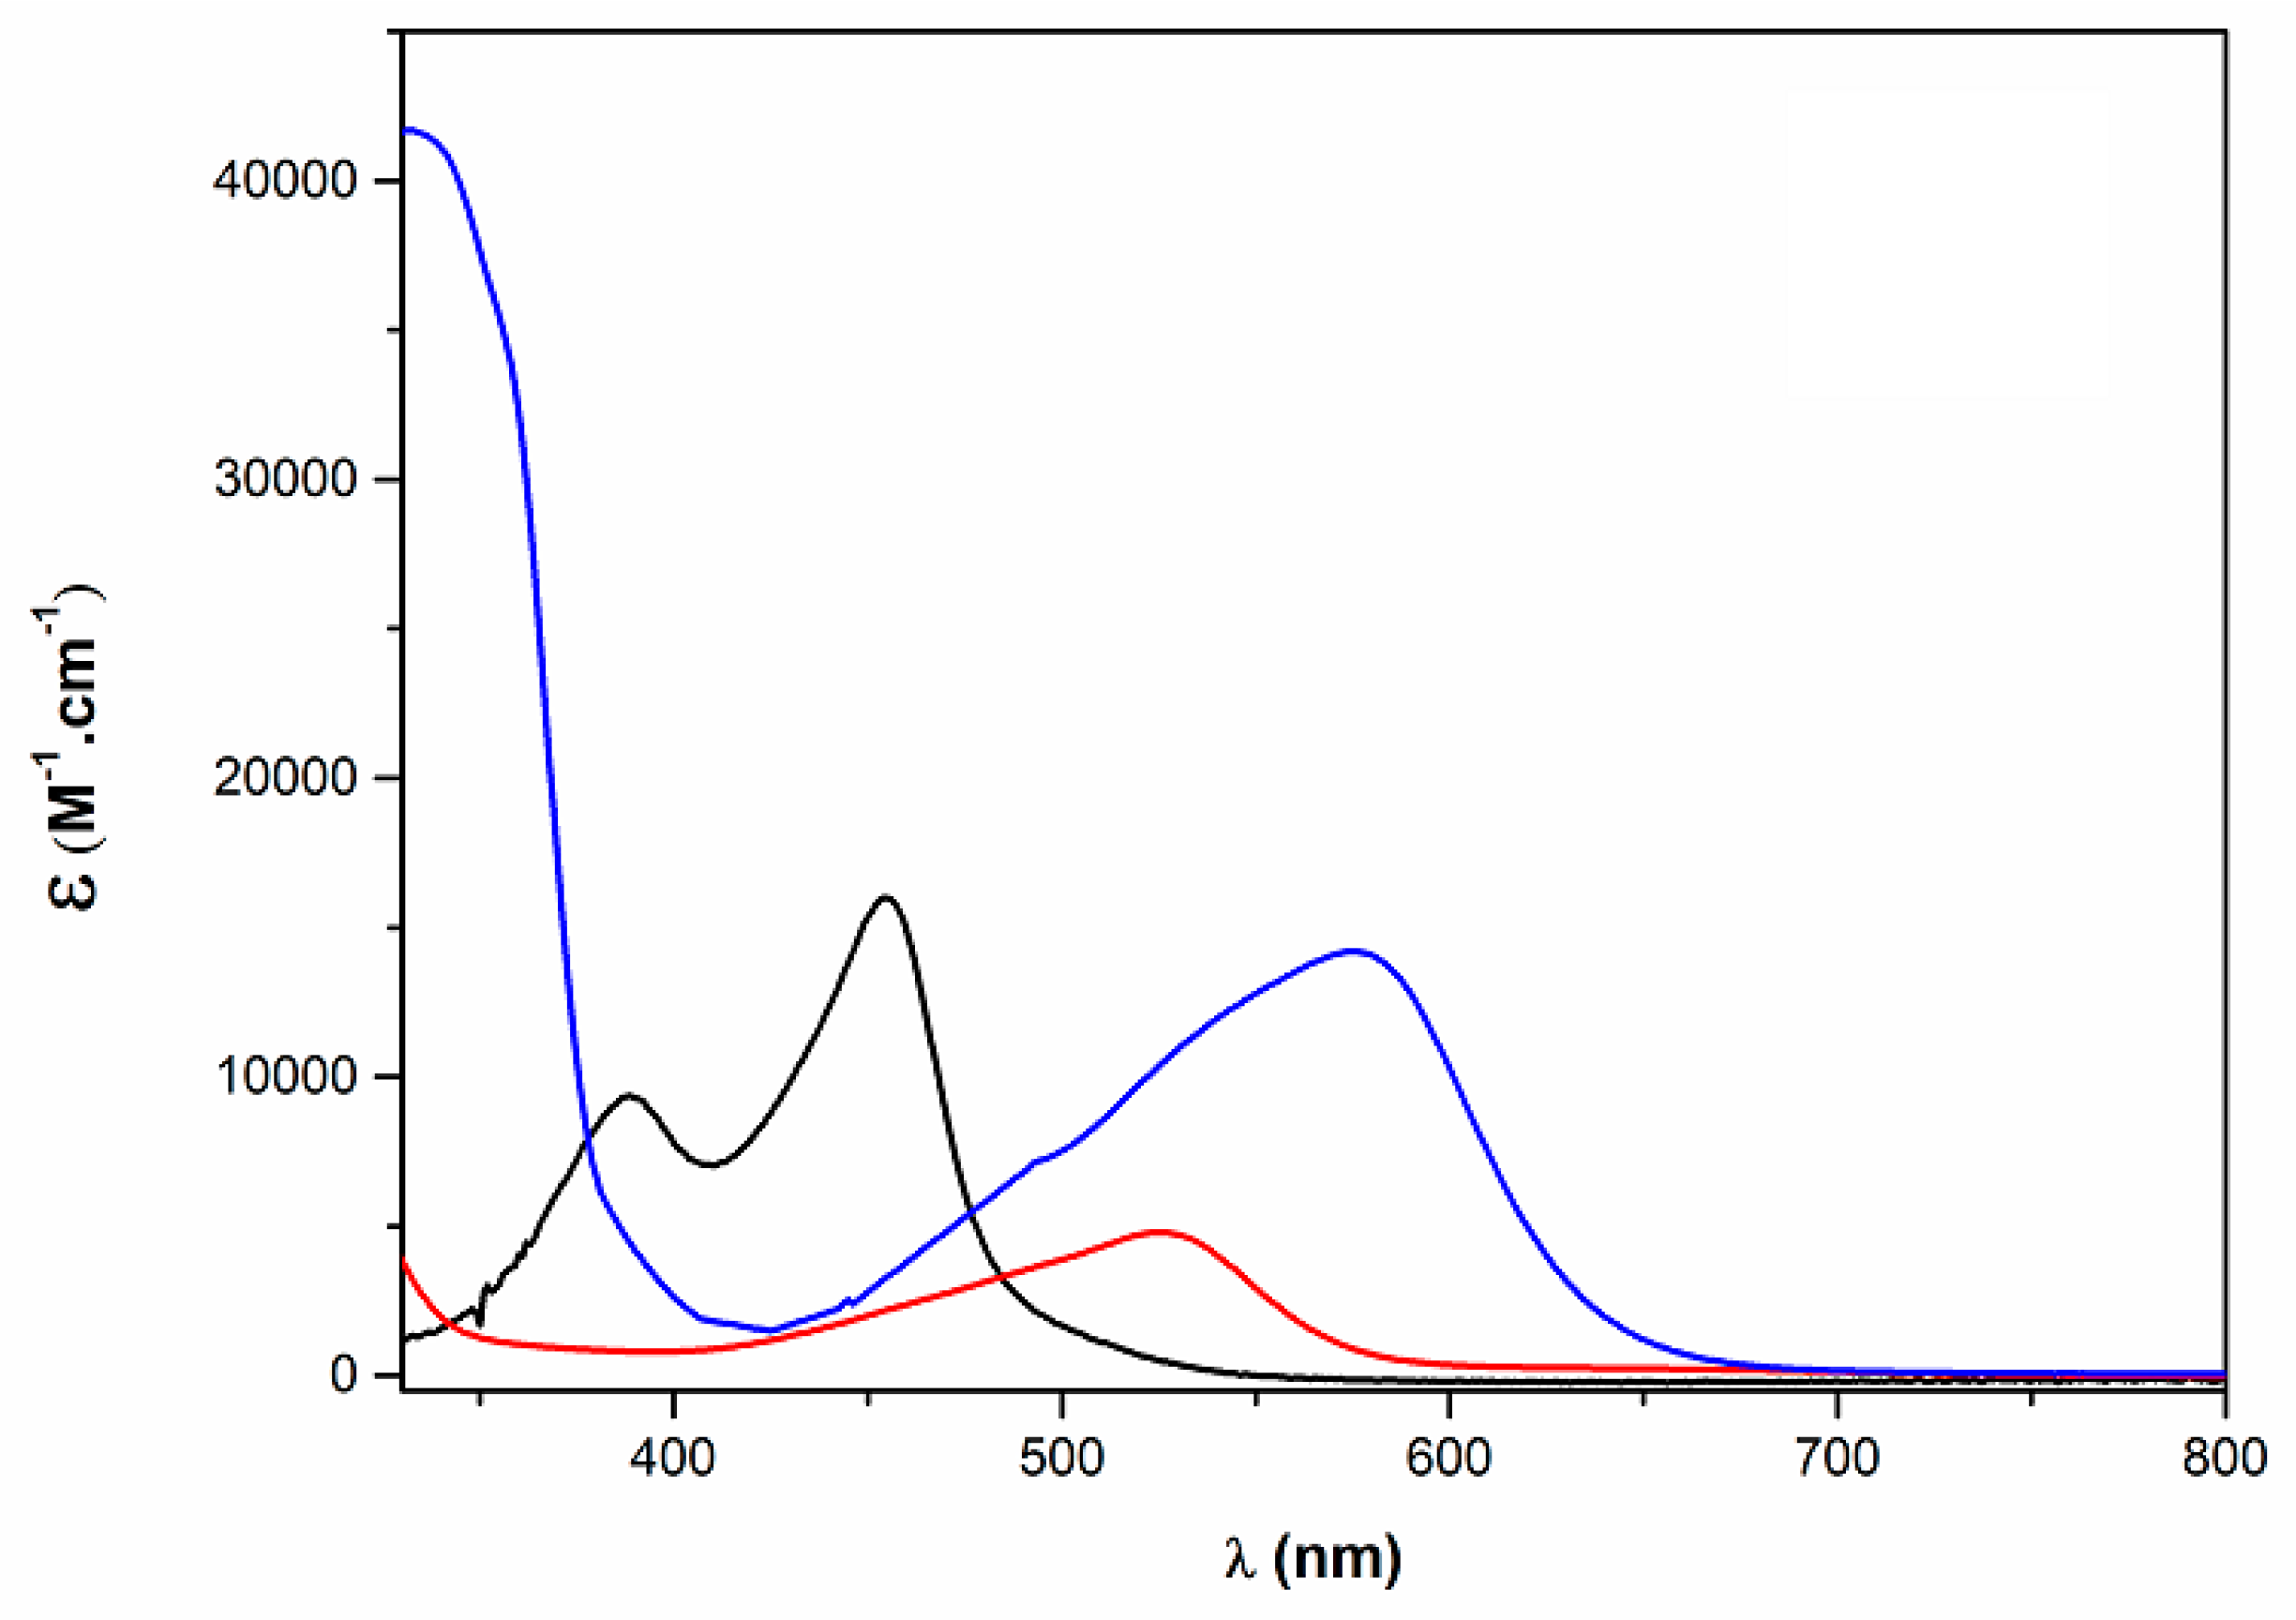
2.1.3. Electronic and Electrochemical Properties
2.2. Excited State Relaxation Dynamics
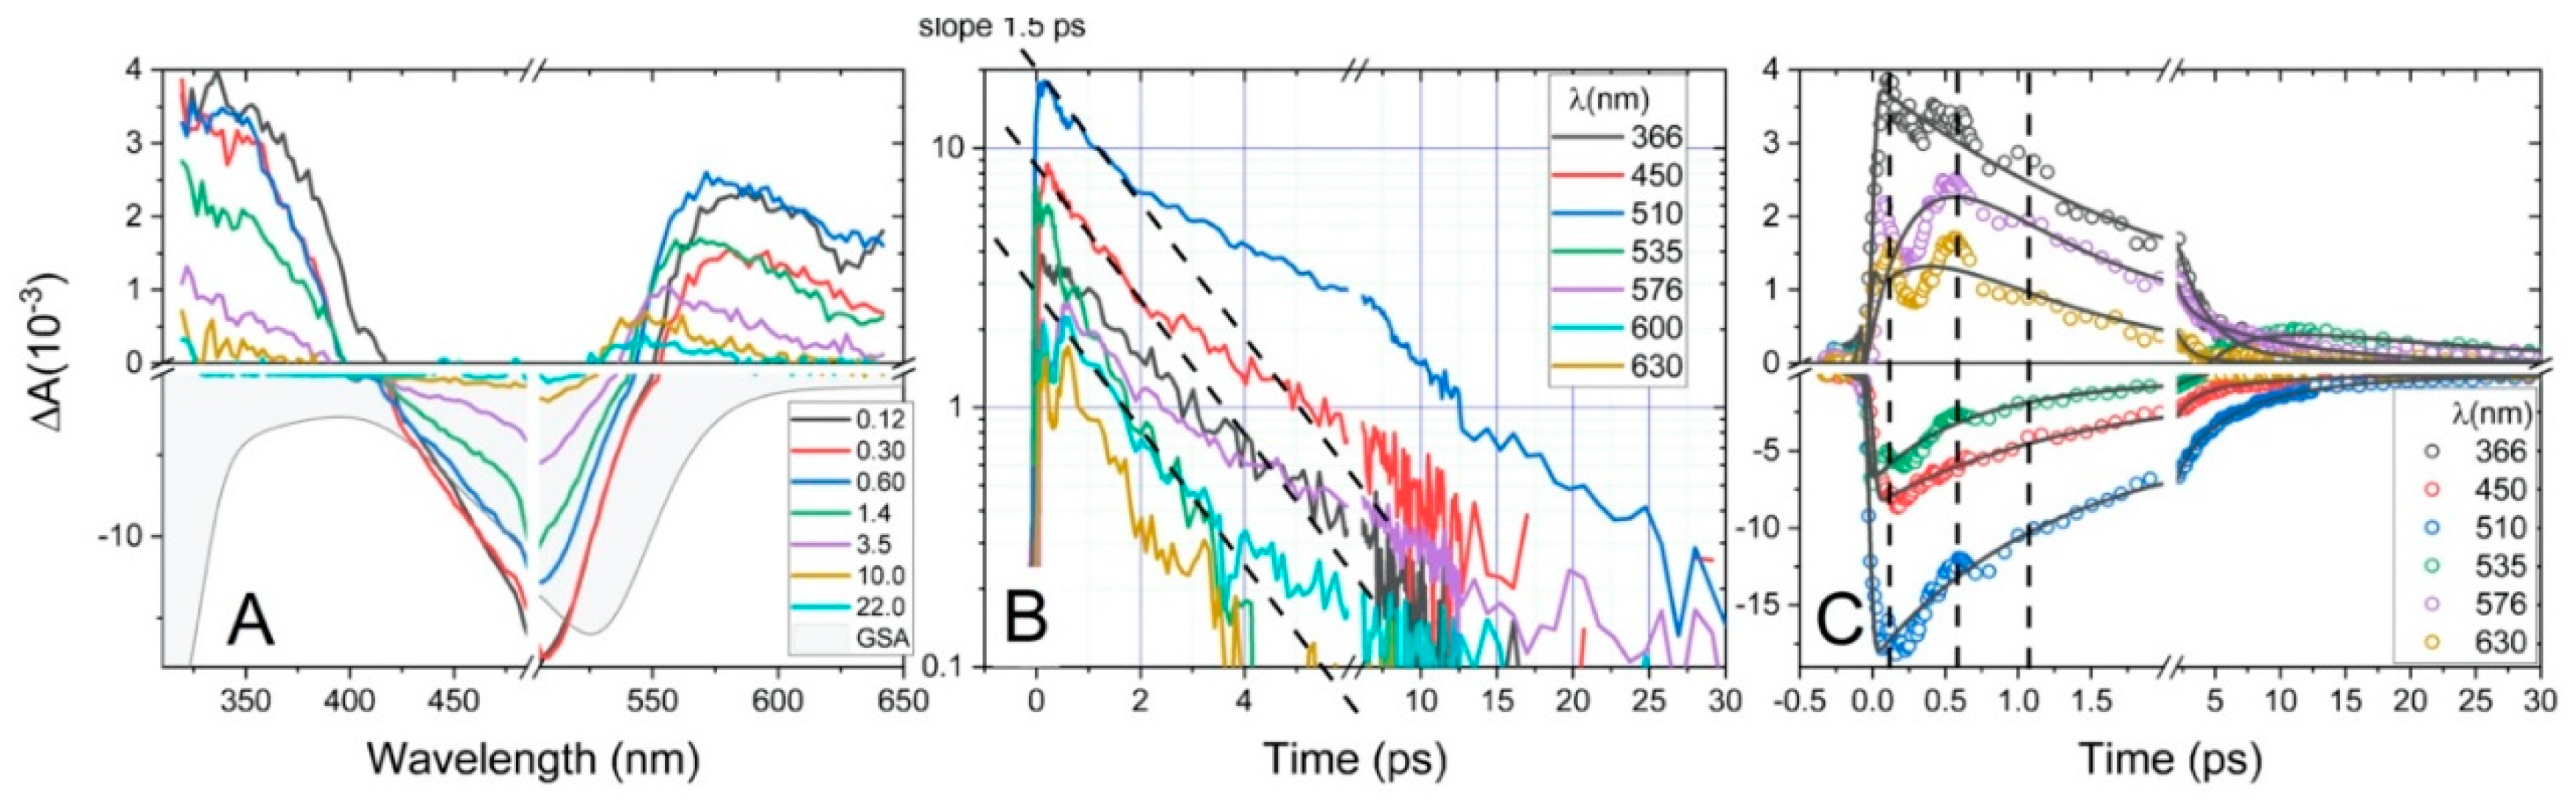
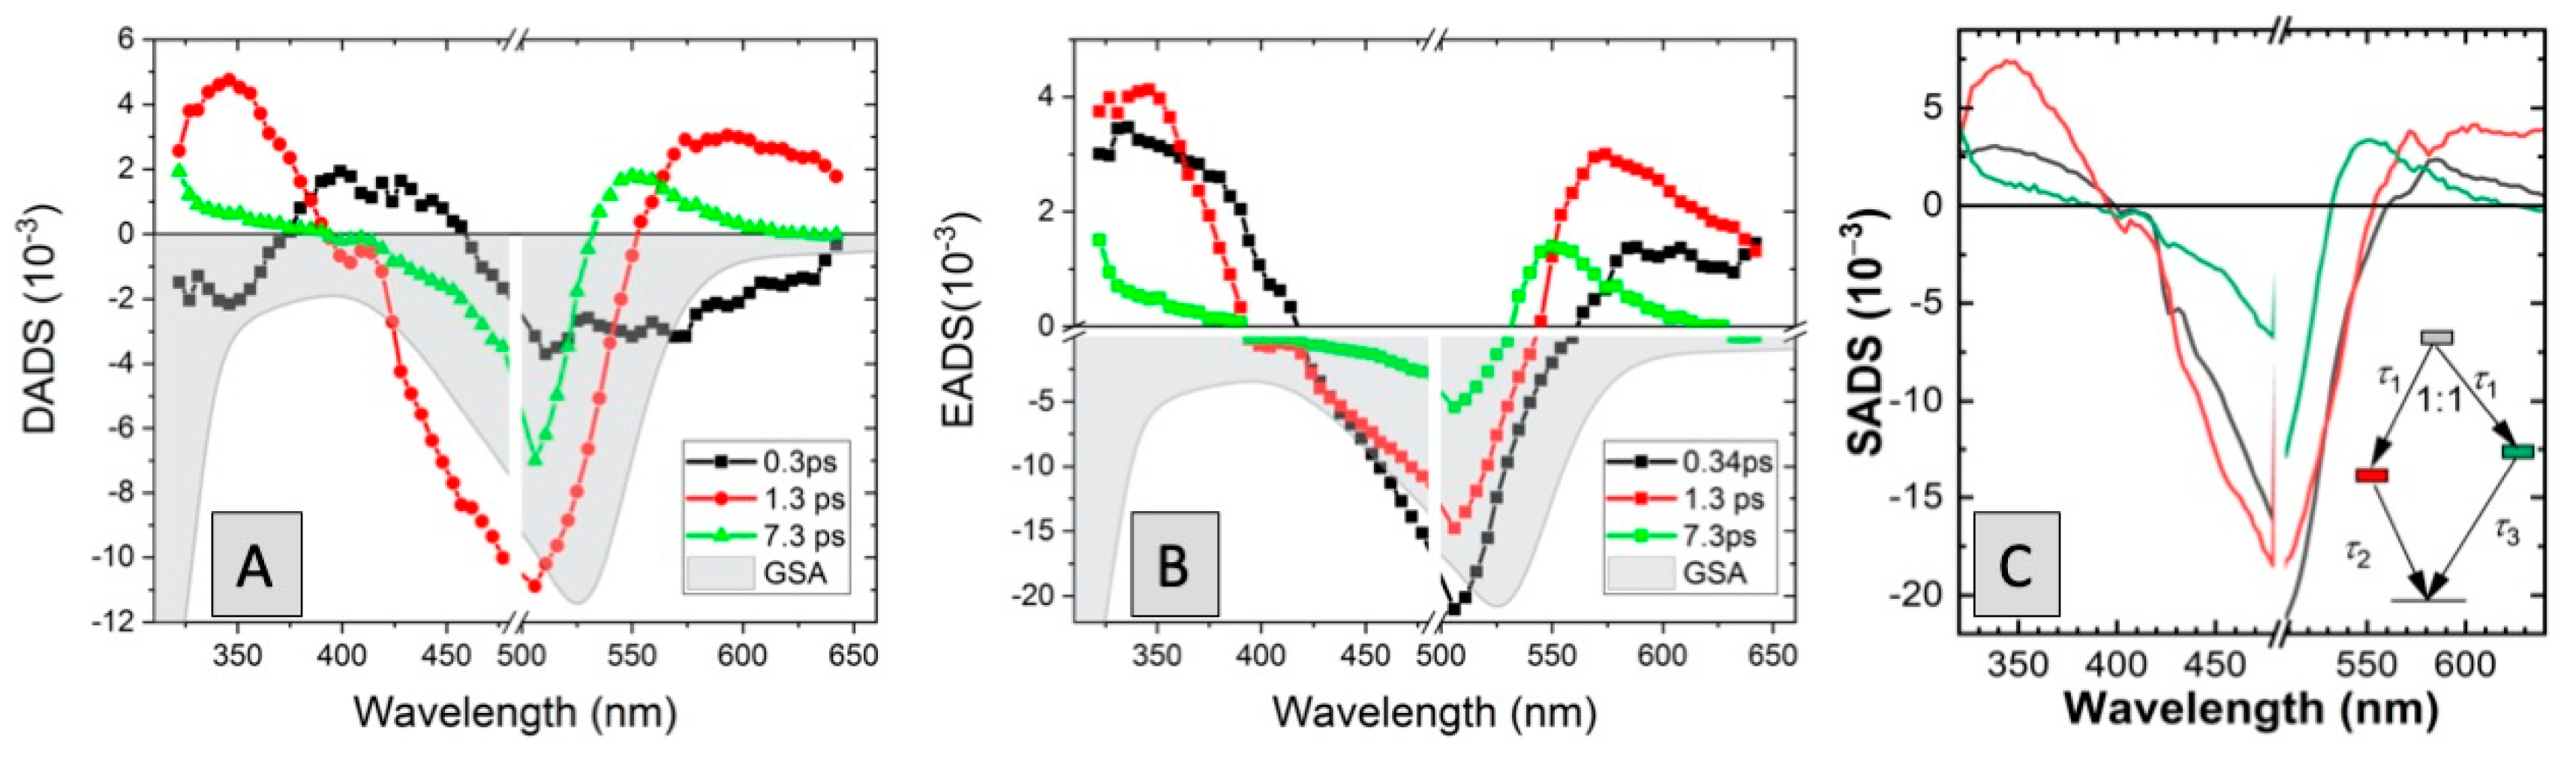
2.2.1. Fs-TAS of C1
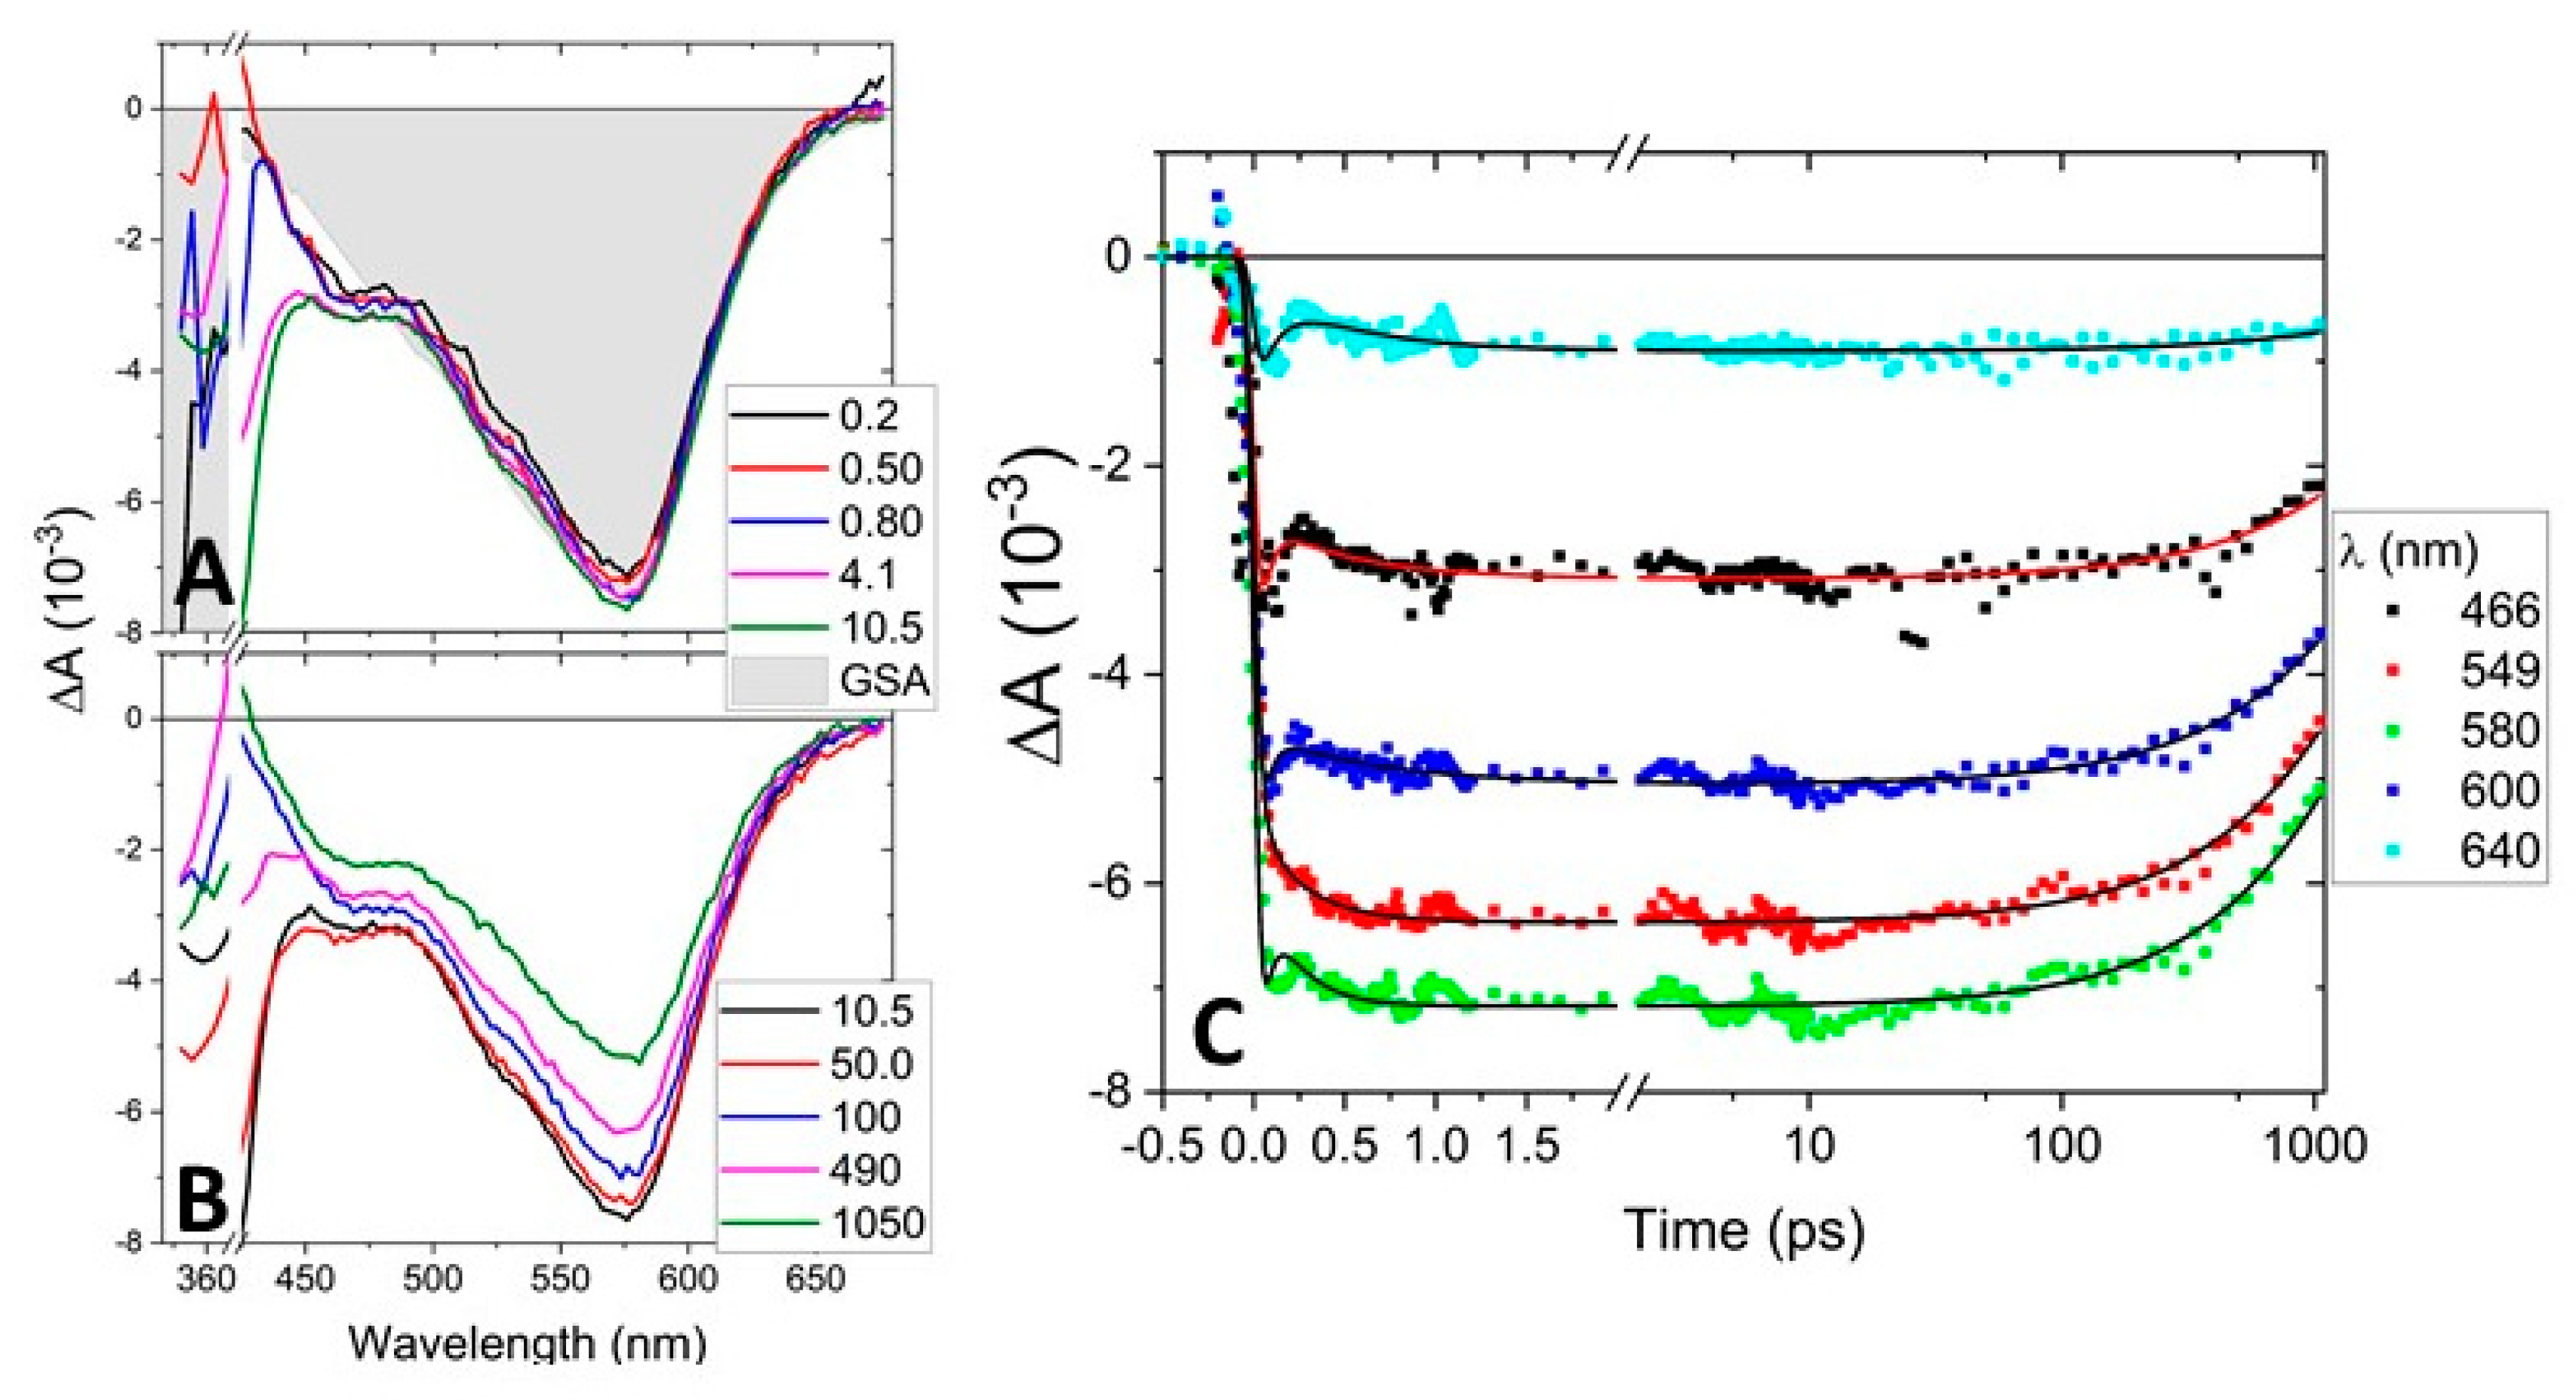
2.2.2. Fs-TAS of C2
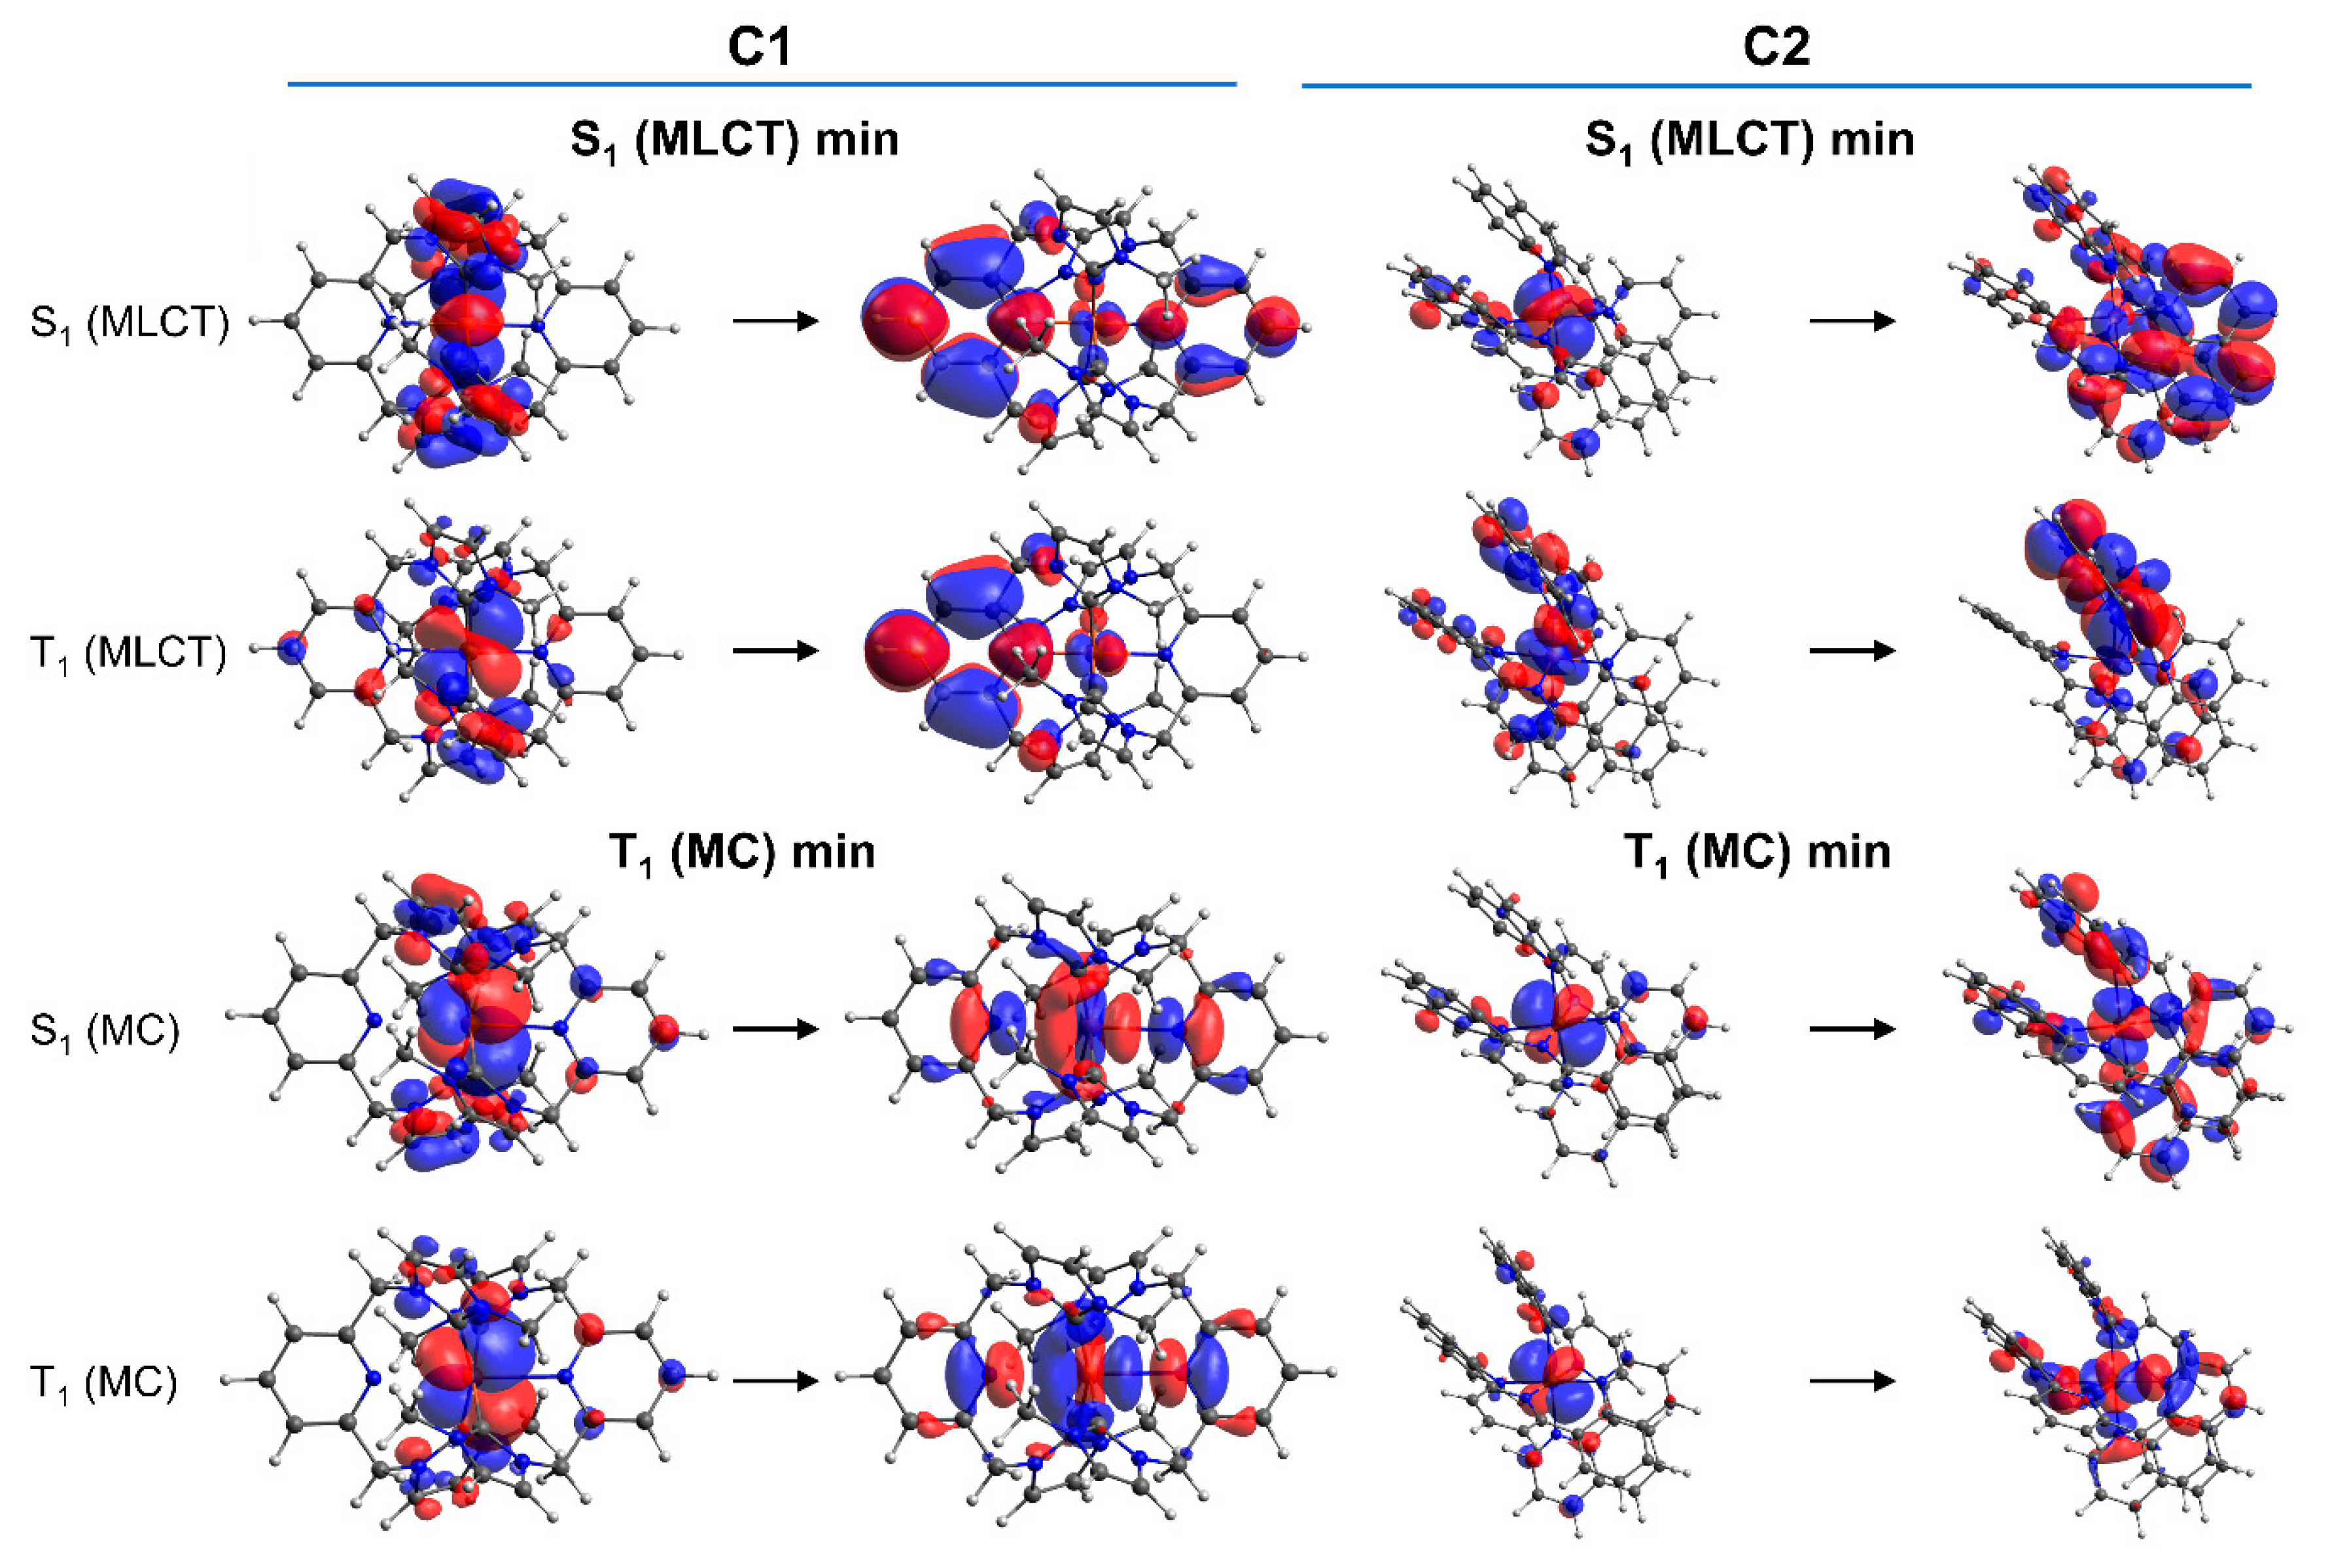
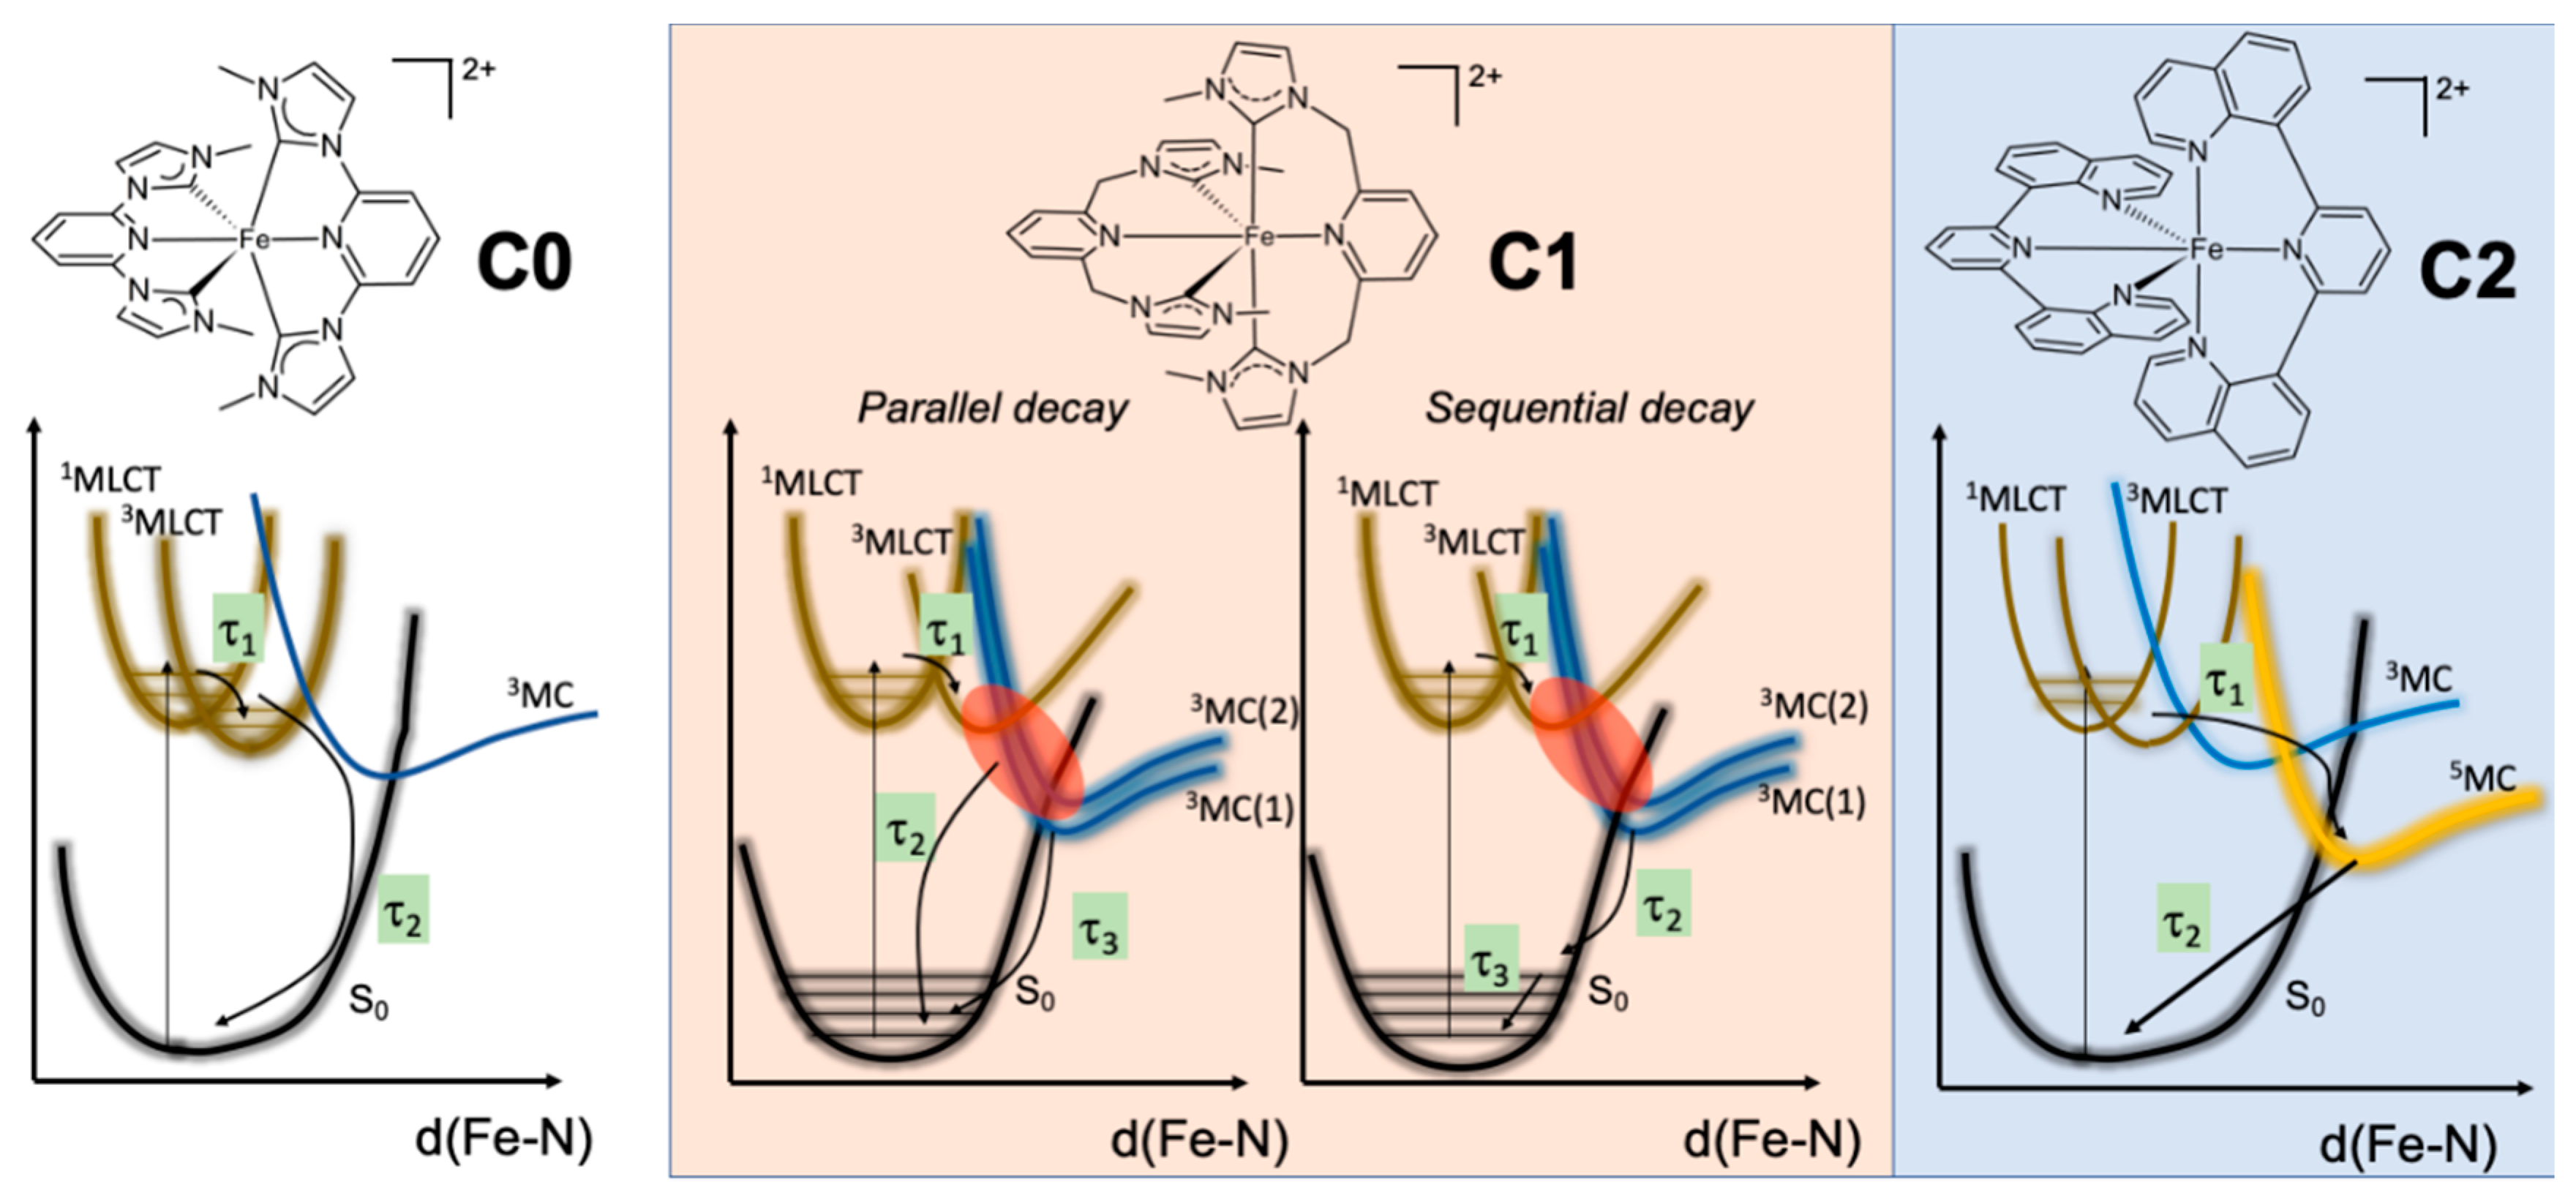
2.3. Excited-State Decay Mechanism Based on TD-DFT Calculations
3. Materials and Methods
3.1. General Information
3.2. Xray Diffraction
3.3. Ultrafast Transient Absorption Spectroscopy
3.4. Computational Details
3.5. Synthesis of Ligands and Complexes
3.5.1. Synthesis of Ligands
3.5.2. Synthesis of Complexes
4. Discussion and Conclusions
Supplementary Materials
Author Contributions
Funding
Acknowledgments
Conflicts of Interest
References
- Hagfeldt, A.; Boschloo, G.; Sun, L.; Kloo, L.; Pettersson, H. Dye-Sensitized Solar Cells. Chem. Rev. 2010, 110, 6595–6663. [Google Scholar] [CrossRef]
- Vos, J.G.; Kelly, J.M. Ruthenium polypyridyl chemistry; from basic research to applications and back again. Dalton Trans. 2006, 4869–4883. [Google Scholar] [CrossRef]
- Pastore, M.; Selloni, A.; Fantacci, S.; De Angelis, F. Electronic and Optical Properties of Dye-Sensitized TiO2 Interfaces. In First Principles Approaches to Spectroscopic Properties of Complex Materials; Di Valentin, C., Botti, S., Cococcioni, M., Eds.; Springer: Berlin/Heidelberg, Germany, 2014; Volume 347, pp. 1–45. ISBN 978-3-642-55067-6. [Google Scholar]
- Duchanois, T.; Etienne, T.; Cebrián, C.; Liu, L.; Monari, A.; Beley, M.; Assfeld, X.; Haacke, S.; Gros, P.C. An Iron-Based Photosensitizer with Extended Excited-State Lifetime: Photophysical and Photovoltaic Properties: An Iron-Based Photosensitizer with Extended Excited-State Lifetime. Eur. J. Inorg. Chem. 2015, 2015, 2469–2477. [Google Scholar] [CrossRef]
- Marchini, E.; Darari, M.; Lazzarin, L.; Boaretto, R.; Argazzi, R.; Bignozzi, C.A.; Gros, P.C.; Caramori, S. Recombination and regeneration dynamics in FeNHC(II)-sensitized solar cells. Chem. Commun. 2020, 56, 543–546. [Google Scholar] [CrossRef]
- Creutz, C.; Chou, M.; Netzel, T.L.; Okumura, M.; Sutin, N. Lifetimes, spectra, and quenching of the excited states of polypyridine complexes of iron(II), ruthenium(II), and osmium(II). J. Am. Chem. Soc. 1980, 102, 1309–1319. [Google Scholar] [CrossRef]
- Gawelda, W.; Cannizzo, A.; Pham, V.-T.; van Mourik, F.; Bressler, C.; Chergui, M. Ultrafast Nonadiabatic Dynamics of [FeII(bpy)3]2+ in Solution. J. Am. Chem. Soc. 2007, 129, 8199–8206. [Google Scholar] [CrossRef] [PubMed]
- Liu, Y.; Harlang, T.; Canton, S.E.; Chábera, P.; Suárez-Alcántara, K.; Fleckhaus, A.; Vithanage, D.A.; Göransson, E.; Corani, A.; Lomoth, R.; et al. Towards longer-lived metal-to-ligand charge transfer states of iron(II) complexes: An N-heterocyclic carbene approach. Chem. Commun. 2013, 49, 6412–6414. [Google Scholar] [CrossRef] [PubMed] [Green Version]
- Liu, L.; Duchanois, T.; Etienne, T.; Monari, A.; Beley, M.; Assfeld, X.; Haacke, S.; Gros, P.C. A new record excited state 3 MLCT lifetime for metalorganic iron (II) complexes. Phys. Chem. Chem. Phys. 2016, 18, 12550–12556. [Google Scholar] [CrossRef] [PubMed]
- Duchanois, T.; Liu, L.; Pastore, M.; Monari, A.; Cebrián, C.; Trolez, Y.; Darari, M.; Magra, K.; Francés-Monerris, A.; Domenichini, E.; et al. NHC-Based Iron Sensitizers for DSSCs. Inorganics 2018, 6, 63. [Google Scholar] [CrossRef] [Green Version]
- Francés-Monerris, A.; Magra, K.; Darari, M.; Cebrián, C.; Beley, M.; Domenichini, E.; Haacke, S.; Pastore, M.; Assfeld, X.; Gros, P.C.; et al. Synthesis and Computational Study of a Pyridylcarbene Fe(II) Complex: Unexpected Effects of fac/mer Isomerism in Metal-to-Ligand Triplet Potential Energy Surfaces. Inorg. Chem. 2018, 57, 10431–10441. [Google Scholar] [CrossRef] [PubMed]
- Darari, M.; Domenichini, E.; Francés-Monerris, A.; Cebrián, C.; Magra, K.; Beley, M.; Pastore, M.; Monari, A.; Assfeld, X.; Haacke, S.; et al. Iron(II) complexes with diazinyl-NHC ligands: Impact of π-deficiency of the azine core on photophysical properties. Dalton Trans. 2019, 48, 10915–10926. [Google Scholar] [CrossRef] [PubMed]
- Magra, K.; Domenichini, E.; Francés-Monerris, A.; Cebrián, C.; Beley, M.; Darari, M.; Pastore, M.; Monari, A.; Assfeld, X.; Haacke, S.; et al. Impact of the fac/mer Isomerism on the Excited-State Dynamics of Pyridyl-carbene Fe(II) Complexes. Inorg. Chem. 2019, 58, 5069–5081. [Google Scholar] [CrossRef] [PubMed] [Green Version]
- Magra, K.; Darari, M.; Domenichini, E.; Francés-Monerris, A.; Cebrián, C.; Beley, M.; Pastore, M.; Monari, A.; Assfeld, X.; Haacke, S.; et al. Photophysical Investigation of Iron(II) Complexes Bearing Bidentate Annulated Isomeric Pyridine-NHC Ligands. J. Phys. Chem. C 2020, 124, 18379–18389. [Google Scholar] [CrossRef]
- Chábera, P.; Kjaer, K.S.; Prakash, O.; Honarfar, A.; Liu, Y.; Fredin, L.A.; Harlang, T.C.B.; Lidin, S.; Uhlig, J.; Sundström, V.; et al. FeII Hexa N-Heterocyclic Carbene Complex with a 528 ps Metal-to-Ligand Charge-Transfer Excited-State Lifetime. J. Phys. Chem. Lett. 2018, 9, 459–463. [Google Scholar] [CrossRef] [PubMed]
- Braun, J.D.; Lozada, I.B.; Kolodziej, C.; Burda, C.; Newman, K.M.E.; van Lierop, J.; Davis, R.L.; Herbert, D.E. Iron(II) coordination complexes with panchromatic absorption and nanosecond charge-transfer excited state lifetimes. Nat. Chem. 2019, 11, 1144–1150. [Google Scholar] [CrossRef] [PubMed]
- Lindh, L.; Chábera, P.; Rosemann, N.W.; Uhlig, J.; Wärnmark, K.; Yartsev, A.; Sundström, V.; Persson, P. Photophysics and Photochemistry of Iron Carbene Complexes for Solar Energy Conversion and Photocatalysis. Catalysts 2020, 10, 315. [Google Scholar] [CrossRef] [Green Version]
- Abrahamsson, M.; Jäger, M.; Österman, T.; Eriksson, L.; Persson, P.; Becker, H.-C.; Johansson, O.; Hammarström, L. A 3.0 μs Room Temperature Excited State Lifetime of a Bistridentate RuII—Polypyridine Complex for Rod-like Molecular Arrays. J. Am. Chem. Soc. 2006, 128, 12616–12617. [Google Scholar] [CrossRef]
- Hu, Y.-Z.; Wilson, M.H.; Zong, R.; Bonnefous, C.; McMillin, D.R.; Thummel, R.P. A luminescent Pt(II) complex with a terpyridine-like ligand involving a six-membered chelate ring. Dalton Trans. 2005, 354–358. [Google Scholar] [CrossRef]
- Vezzu, D.A.K.; Ravindranathan, D.; Garner, A.W.; Bartolotti, L.; Smith, M.E.; Boyle, P.D.; Huo, S. Highly Luminescent Tridentate N∧C*N Platinum(II) Complexes Featured in Fused Five–Six-Membered Metallacycle and Diminishing Concentration Quenching. Inorg. Chem. 2011, 50, 8261–8273. [Google Scholar] [CrossRef]
- Mengel, A.K.C.; Förster, C.; Breivogel, A.; Mack, K.; Ochsmann, J.R.; Laquai, F.; Ksenofontov, V.; Heinze, K. A Heteroleptic Push-Pull Substituted Iron(II) Bis(tridentate) Complex with Low-Energy Charge-Transfer States. Chem. Eur. J. 2015, 21, 704–714. [Google Scholar] [CrossRef]
- Kjær, K.S.; Kaul, N.; Prakash, O.; Chábera, P.; Rosemann, N.W.; Honarfar, A.; Gordivska, O.; Fredin, L.A.; Bergquist, K.-E.; Häggström, L.; et al. Luminescence and reactivity of a charge-transfer excited iron complex with nanosecond lifetime. Science 2019, 363, 249–253. [Google Scholar] [CrossRef] [PubMed]
- Sauvage, J.P.; Collin, J.P.; Chambron, J.C.; Guillerez, S.; Coudret, C.; Balzani, V.; Barigelletti, F.; De Cola, L.; Flamigni, L. Ruthenium(II) and Osmium(II) Bis(terpyridine) Complexes in Covalently-Linked Multicomponent Systems: Synthesis, Electrochemical Behavior, Absorption Spectra, and Photochemical and Photophysical Properties. Chem. Rev. 1994, 94, 993–1019. [Google Scholar] [CrossRef]
- Campagna, S.; Puntoriero, F.; Nastasi, F.; Bergamini, G.; Balzani, V. Photochemistry and Photophysics of Coordination Compounds: Ruthenium. In Photochemistry and Photophysics of Coordination Compounds I; Balzani, V., Campagna, S., Eds.; Springer: Berlin/Heidelberg, Germany, 2007; Volume 280, pp. 117–214. ISBN 978-3-540-73346-1. [Google Scholar]
- Rillema, D.P.; Jones, D.S. Structure of tris(2,2′-bipyridyl)ruthenium(II) hexafluorophosphate, [Ru(bipy)3][PF6]2; X-ray crystallographic determination. J. Chem. Soc. Chem. Commun. 1979, 849–851. [Google Scholar] [CrossRef]
- Medlycott, E.A.; Hanan, G.S. Designing tridentate ligands for ruthenium(II) complexes with prolonged room temperature luminescence lifetimes. Chem. Soc. Rev. 2005, 34, 133–142. [Google Scholar] [CrossRef]
- Dinda, J.; Liatard, S.; Chauvin, J.; Jouvenot, D.; Loiseau, F. Electronic and geometrical manipulation of the excited state of bis-terdentate homo- and heteroleptic ruthenium complexes. Dalton Trans. 2011, 40, 3683–3688. [Google Scholar] [CrossRef] [Green Version]
- Otto, S.; Grabolle, M.; Förster, C.; Kreitner, C.; Resch-Genger, U.; Heinze, K. [Cr(ddpd)2]3+: A Molecular, Water-Soluble, Highly NIR-Emissive Ruby Analogue. Angew. Chem. Int. Ed. 2015, 54, 11572–11576. [Google Scholar] [CrossRef]
- Otto, S.; Scholz, N.; Behnke, T.; Resch-Genger, U.; Heinze, K. Thermo-Chromium: A Contactless Optical Molecular Thermometer. Chem. Eur. J. 2017, 23, 12131–12135. [Google Scholar] [CrossRef] [Green Version]
- Jamula, L.L.; Brown, A.M.; Guo, D.; McCusker, J.K. Synthesis and Characterization of a High-Symmetry Ferrous Polypyridyl Complex: Approaching the 5T2/3T1 Crossing Point for FeII. Inorg. Chem. 2014, 53, 15–17. [Google Scholar] [CrossRef]
- Gründemann, S.; Albrecht, M.; Loch, J.A.; Faller, J.W.; Crabtree, R.H. Tridentate Carbene CCC and CNC Pincer Palladium(II) Complexes: Structure, Fluxionality, and Catalytic Activity. Organometallics 2001, 20, 5485–5488. [Google Scholar] [CrossRef]
- Slavov, C.; Hartmann, H.; Wachtveitl, J. Implementation and Evaluation of Data Analysis Strategies for Time-Resolved Optical Spectroscopy. Anal. Chem. 2015, 87, 2328–2336. [Google Scholar] [CrossRef]
- Snellenburg, J.J.; Laptenok, S.P.; Seger, R.; Mullen, K.M.; Stokkum, I.H.M. van Glotaran: A Java -Based Graphical User Interface for the R Package TIMP. J. Stat. Softw. 2012, 49. [Google Scholar] [CrossRef] [Green Version]
- Tatsuno, H.; Kjær, K.S.; Kunnus, K.; Harlang, T.C.B.; Timm, C.; Guo, M.; Chàbera, P.; Fredin, L.A.; Hartsock, R.W.; Reinhard, M.E.; et al. Hot Branching Dynamics in a Light-Harvesting Iron Carbene Complex Revealed by Ultrafast X-ray Emission Spectroscopy. Angew. Chem. Int. Ed. 2020, 59, 364–372. [Google Scholar] [CrossRef] [PubMed] [Green Version]
- Kunnus, K.; Vacher, M.; Harlang, T.C.B.; Kjær, K.S.; Haldrup, K.; Biasin, E.; van Driel, T.B.; Pápai, M.; Chabera, P.; Liu, Y.; et al. Vibrational wavepacket dynamics in Fe carbene photosensitizer determined with femtosecond X-ray emission and scattering. Nat. Commun. 2020, 11, 634. [Google Scholar] [CrossRef] [PubMed] [Green Version]
- Cannizzo, A.; Milne, C.J.; Consani, C.; Gawelda, W.; Bressler, C.; van Mourik, F.; Chergui, M. Light-induced spin crossover in Fe(II)-based complexes: The full photocycle unraveled by ultrafast optical and X-ray spectroscopies. Coord. Chem. Rev. 2010, 254, 2677–2686. [Google Scholar] [CrossRef] [Green Version]
- Consani, C.; Prémont-Schwarz, M.; ElNahhas, A.; Bressler, C.; van Mourik, F.; Cannizzo, A.; Chergui, M. Vibrational Coherences and Relaxation in the High-Spin State of Aqueous [FeII(bpy)3]2+. Angew. Chem. Int. Ed. 2009, 48, 7184–7187. [Google Scholar] [CrossRef]
- Wolf, M.M.N.; Groß, R.; Schumann, C.; Wolny, J.A.; Schünemann, V.; Døssing, A.; Paulsen, H.; McGarvey, J.J.; Diller, R. Sub-picosecond time resolved infrared spectroscopy of high-spin state formation in Fe(II) spin crossover complexes. Phys. Chem. Chem. Phys. 2008, 10, 4264–4273. [Google Scholar] [CrossRef]
- Francés-Monerris, A.; Gros, P.C.; Assfeld, X.; Monari, A.; Pastore, M. Toward Luminescent Iron Complexes: Unravelling the Photophysics by Computing Potential Energy Surfaces. ChemPhotoChem 2019, 3, 666–683. [Google Scholar] [CrossRef]
- Dolomanov, O.V.; Bourhis, L.J.; Gildea, R.J.; Howard, J.A.K.; Puschmann, H. OLEX2: A complete structure solution, refinement and analysis program. J. Appl. Crystallogr. 2009, 42, 339–341. [Google Scholar] [CrossRef]
- Sheldrick, G.M. A short history of SHELX. Acta Crystallogr. A 2008, 64, 112–122. [Google Scholar] [CrossRef] [Green Version]
- Francés-Monerris, A.; Gros, P.C.; Pastore, M.; Assfeld, X.; Monari, A. Photophysical properties of bichromophoric Fe(II) complexes bearing an aromatic electron acceptor. Theor. Chem. Acc. 2019, 138, 86. [Google Scholar] [CrossRef]
- Frisch, M.J.; Trucks, G.W.; Schlegel, H.B.; Scuseria, G.E.; Robb, M.A.; Cheeseman, J.R.; Scalmani, G.; Barone, V.; Petersson, G.A.; Nakatsuji, H.; et al. Gaussian 16, Revision C.01. Gaussian, Inc.: Wallingford, CT, USA, 2016. Available online: https://gaussian.com/citation/ (accessed on 30 October 2020).
- Boese, A.D.; Handy, N.C. A new parametrization of exchange–correlation generalized gradient approximation functionals. J. Chem. Phys. 2001, 114, 5497–5503. [Google Scholar] [CrossRef]
- Hirata, S.; Head-Gordon, M. Time-dependent density functional theory within the Tamm–Dancoff approximation. Chem. Phys. Lett. 1999, 314, 291–299. [Google Scholar] [CrossRef]
- Grimme, S.; Antony, J.; Ehrlich, S.; Krieg, H. A consistent and accurate ab initio parametrization of density functional dispersion correction (DFT-D) for the 94 elements H-Pu. J. Chem. Phys. 2010, 132, 154104. [Google Scholar] [CrossRef] [PubMed] [Green Version]
- Martin, R.L. Natural transition orbitals. J. Chem. Phys. 2003, 118, 4775–4777. [Google Scholar] [CrossRef]
- Etienne, T.; Assfeld, X.; Monari, A. Toward a Quantitative Assessment of Electronic Transitions’ Charge-Transfer Character. J. Chem. Theory Comput. 2014, 10, 3896–3905. [Google Scholar] [CrossRef]
- Etienne, T.; Assfeld, X.; Monari, A. New Insight into the Topology of Excited States through Detachment/Attachment Density Matrices-Based Centroids of Charge. J. Chem. Theory Comput. 2014, 10, 3906–3914. [Google Scholar] [CrossRef]
- Pápai, M.; Vankó, G.; Rozgonyi, T.; Penfold, T.J. High-Efficiency Iron Photosensitizer Explained with Quantum Wavepacket Dynamics. J. Phys. Chem. Lett. 2016, 7, 2009–2014. [Google Scholar] [CrossRef] [Green Version]
- Paulus, B.C.; Adelman, S.L.; Jamula, L.L.; McCusker, J.K. Leveraging excited-state coherence for synthetic control of ultrafast dynamics. Nature 2020, 582, 214–218. [Google Scholar] [CrossRef]
- Bauer, M.; Steube, J.; Päpcke, A.; Bokareva, O.; Reuter, T.; Demeshko, S.; Schoch, R.; Hohloch, S.; Meyer, F.; Heinze, K.; et al. Janus-type dual emission of a Cyclometalated Iron(III) complex. 2020; in review. [Google Scholar]
- Steube, J.; Burkhardt, L.; Päpcke, A.; Moll, J.; Zimmer, P.; Schoch, R.; Wölper, C.; Heinze, K.; Lochbrunner, S.; Bauer, M. Excited-State Kinetics of an Air-Stable Cyclometalated Iron(II) Complex. Chem. Eur. J. 2019, 25, 11826–11830. [Google Scholar] [CrossRef]
- Tang, Z.; Chang, X.-Y.; Wan, Q.; Wang, J.; Ma, C.; Law, K.-C.; Liu, Y.; Che, C.-M. Bis(tridentate) Iron(II) Complexes with a Cyclometalating Unit: Photophysical Property Enhancement with Combinatorial Strong Ligand Field Effect. Organometallics 2020, 39, 2791–2802. [Google Scholar] [CrossRef]
Sample Availability: Samples of the compounds are not available from the authors. |


| Bond Length (Å) | Angles (°) | ||||||
|---|---|---|---|---|---|---|---|
| C0 | C1 | C0 | C1 | ||||
| Fe1-N3 | 1.919(3) | Fe1-N1 | 2.035(11) | C1-Fe1-N3 | 79.5(1) | C1-Fe1-N1 | 87.7(5) |
| Fe–N8 | 1.930(3) | Fe1-N1′ | 2.035(11) | C11-Fe1-N3 | 79.2(1) | C12-Fe1-N1 | 88.5(4) |
| Fe1-C11 | 1.965(3) | Fe1-C12 | 1.981(11) | C1-Fe1-C11 | 158.0(2) | C12-Fe1-C1 | 176.1(5) |
| Fe1-C14 | 1.965(3) | Fe1-C1′ | 1.981(10) | C14-Fe1-N8 | 79.0(1) | C1′-Fe1-N1′ | 87.7(5) |
| Fe1-C1 | 1.966(3) | Fe1-C1 | 1.981(10) | C22-Fe1-N8 | 79.0(1) | C12′-Fe1-N1′ | 88.5(5) |
| Fe-C22 | 1.970(3) | Fe1-C12′ | 1.981(11) | C14-Fe1-C22 | 158.0(2) | C1′-Fe1-C12′ | 176.1(5) |
| Bond Length (Å) | Angles (°) | ||
|---|---|---|---|
| Fe1-N2 | 1.961(2) | N2-Fe1-N3 | 90.36(9) |
| Fe1-N2′ | 1.957(2) | N3′-Fe1-N1 | 90.88(8) |
| Fe1-N1 | 1.997(2) | N3-Fe1-N1 | 177.58(8) |
| Fe1-N1′ | 1.997(2) | N2′-Fe1-N1′ | 90.15(9) |
| Fe1-N3 | 1.986(2) | N2′-Fe1-N3′ | 90.48(9) |
| Fe1-N3′ | 1.995(2) | N3′-Fe1-N1′ | 179.21(9) |
| Complex | λabs-Max a (nm) ε(M−1.cm−1) | Eox (FeIII/FeII) b (V/SCE) | Ered1 (V/SCE) | ΔE c (eV) |
|---|---|---|---|---|
| C0 | 393 (9000) 460 (15,900) | 0.71 (rev) | −2.00 (irrev) | 2.75 |
| C1 | 525 (4800) | 0.31 (rev) | −2.05 (irrev) | 2.36 |
| C2 | 575 (14,200) | 0.96 (rev) | −1.35 (rev) | 2.31 |
| Fe–N | S0 min | S1 min | T1 min | Q1 min |
|---|---|---|---|---|
| C1 | ||||
| Fe–N1 | 2.120 | 2.151 | 2.604 | 2.491 |
| Fe–N1′ | 2.122 | 2.042 | 2.417 | 2.490 |
| C2 | ||||
| Fe–N1 | 2.013 | 2.003 | 2.281 | 2.190 |
| Fe–N2 | 1.975 | 1.960 | 1.955 | 2.179 |
| Fe–N3 | 2.013 | 2.019 | 2.283 | 2.189 |
| Fe–N1′ | 2.013 | 2.010 | 2.121 | 2.188 |
| Fe–N2′ | 1.976 | 1.973 | 1.937 | 2.179 |
| Fe–N3′ | 2.013 | 2.024 | 2.120 | 2.191 |
Publisher’s Note: MDPI stays neutral with regard to jurisdictional claims in published maps and institutional affiliations. |
© 2020 by the authors. Licensee MDPI, Basel, Switzerland. This article is an open access article distributed under the terms and conditions of the Creative Commons Attribution (CC BY) license (http://creativecommons.org/licenses/by/4.0/).
Share and Cite
Darari, M.; Francés-Monerris, A.; Marekha, B.; Doudouh, A.; Wenger, E.; Monari, A.; Haacke, S.; Gros, P.C. Towards Iron(II) Complexes with Octahedral Geometry: Synthesis, Structure and Photophysical Properties. Molecules 2020, 25, 5991. https://doi.org/10.3390/molecules25245991
Darari M, Francés-Monerris A, Marekha B, Doudouh A, Wenger E, Monari A, Haacke S, Gros PC. Towards Iron(II) Complexes with Octahedral Geometry: Synthesis, Structure and Photophysical Properties. Molecules. 2020; 25(24):5991. https://doi.org/10.3390/molecules25245991
Chicago/Turabian StyleDarari, Mohamed, Antonio Francés-Monerris, Bogdan Marekha, Abdelatif Doudouh, Emmanuel Wenger, Antonio Monari, Stefan Haacke, and Philippe C. Gros. 2020. "Towards Iron(II) Complexes with Octahedral Geometry: Synthesis, Structure and Photophysical Properties" Molecules 25, no. 24: 5991. https://doi.org/10.3390/molecules25245991