
Pre-Treatment Methods for Regeneration of Spent Activated Carbon

Bio Resource Center, Institute for Advanced Engineering, Yongin-si 17180, Korea
*
Author to whom correspondence should be addressed.
†
These authors contributed equally to this work.
Molecules 2020, 25(19), 4561; https://doi.org/10.3390/molecules25194561
Submission received: 4 September 2020
/
Revised: 23 September 2020
/
Accepted: 2 October 2020
/
Published: 6 October 2020
(This article belongs to the Special Issue Materials and Technologies Used in Wastewater Treatment)
Abstract
:Spent activated carbon (SAC) usually exhibits a low specific surface area due to its high ash contents. In this study, pre-treatments, such as heat and acid treatments, were optimized to improve this feature. The heat pre-treatment did not reduce the ash content, nor did it increase the surface area. Because metallic ions adsorbed in SACs turn into ash upon the heat treatment. In the acid pre-treatment, the volatiles and fixed carbon were increased with decreasing ash contents. In this study, it was found that the surface area increase was correlated with the ratio between fixed carbon and ash. Among the pre-treatment methods, the combined heat and acid pre-treatment method highly increased the ratio, and therefore led to the surface area increase. Additionally, the acid pre-treatment was carried out using different types of acid (organic and inorganic acids) solutions to further improve the surface areas. The organic acid treatment caused a significant structural collapse compared to the inorganic acid treatment, decreasing the surface area. In particular, H3PO4 effectively removed ashes adsorbed on the activated carbon surface and regenerated the exhausted activated carbon. Both the heat and acid pre-treatments before chemical activation resulted in the positive effects such as strong desorption of pollutants and ashes within the internal structure of the activated carbon. Therefore, the regeneration introduced in this study is methodically the best method to regenerate SAC and maintain a stable structure.
1. Introduction
Drinking water guidelines of the World Health Organization (WHO), which are followed by South Korea [1], define permissible levels of contaminants in water. Adsorption is one of the most effective methods to remove contaminants from wastewater due to its simple operation, low cost, and high adsorption efficiency. Accordingly, activated carbon (AC) is commonly used as an adsorbent in water and wastewater treatment facilities because it can adsorb a wide variety of organic and inorganic contaminants due to its porous nature, surface area, and abundant surface functional groups [2,3,4]. Therefore, consumption of ACs for industrial use has become an indicator of development and environmental management efficiency. ACs are generally prepared using natural resources, such as wood, coal, nutshells, and petroleum residues [5,6,7]. However, the price of precursors, especially woods, has recently increased due to restricted logging, which also commonly causes environmental impacts. Thus, the treatment of spent adsorbents is one of the most viable options to effectively solve the critical problems in view of environmental and economic considerations than disposal in landfill and reutilization [8,9,10]. The waste resources were easily accessed, but complex production processes should be required. In contrast, if the SACs are used as resources for the AC production, additional carbon precursor is not required and also the only regeneration process is required. In this study, the regeneration of SAC has been focused owing to the environmental protection and low production cost. Supplementary Materials Table S1 shows the cost comparison of regenerated and fresh ACs. The cost of regenerated ACs was 35–55% lower than the fresh ones [11]. Additionally, the various regeneration methods were introduced, and also summarized their both advantages and disadvantages in Supplementary Materials Table S2. Among the methods, the landfilling was inexpensive and simple method. However, it caused the serious environmental problems, likely soil contamination. Considering the environmental protection and production cost, the regeneration of SACs was suggested. The suitable method also should be selected for the efficient regenerations of SACs.
The replacement cycle of AC is commonly between three to four years, and the used AC is known as SAC. Compared to AC, the surface area of SAC is approximately 30–40% lower, and the ash content is approximately 10% higher [12]. Most water treatment plants prefer to replace new AC instead of reusing SAC, despite the high price of the former. The main reasons for this choice are: (1) adsorbed materials still remain in regenerated AC after heat activation, (2) the regenerated AC presents inferior physical properties, and (3) regeneration effect rapidly decreased.
The surface area of regenerated SACs by thermal process can be recovered about 60% and the carbon content decreased during regeneration process, but that is only commercially viable technique [13]. Also, the ash content was increasing from 1.6 to 3.0 times, thus decreasing the SAC structural stability. A high ash content significantly decreases the activity and regeneration efficiency of SAC. Therefore, regeneration methods should be further developed to improve the physical properties of SAC [14].
To improve the regeneration efficiency, various pre-treatment methods currently have been developed. Among the several pre-treatments, an acid treatment is commonly suggested to remove organic materials. However, the acid pre-treatment causes the oxygen functional group of the AC to collapse or etch over the oxygen functional group, and it can affect the final surface area [15]. Moreover, the acidic groups form acidic oxygen surface complexes, which can affect their use as adsorbents or as catalysts [16,17]. Thus, regeneration of physical properties by such treatments (pre-treatment, leaching, or washing) should be optimization.
The aim of this research is to evaluate the regenerated SAC by the different pre-treatment methods. The present research evaluates the influence of experimental parameters such as pre-treatment pathway and acidity groups on the characteristics of regenerated SAC. In particular, the surface area of SACs after different pre-treatments was compared, and the correlation between surface area and physical properties was investigated.
2. Materials and Methods
The SACs were obtained from a wastewater treatment plant at Seoul in South Korea. Before use, the SACs were dried at 100 °C for 24 h. To confirm the effects of the acid pre-treatment, organic or inorganic acid solutions were used. For the organic acid pre-treatment, citric acid (C6H8O7, Sigma-Aldrich, MA, USA, >99%), oxalic acid hydrate (C2H2O4, Sigma-Aldrich, MA, USA, 99%), and DL-tartaric acid (C4H6O6 H2O, Duksan, Ansan, South Korea, >99.5%) were selected. For the inorganic acids, hydrochloric acid (HCl, Daejung, Incheon, South Korea, 35–37%), hydrogen peroxide (H2O2, Duksan, Ansan, South Korea, 28%) [18], and phosphoric acid (H3PO4, Sigma-Aldrich, MA, USA, ACS reagent >85% in H2O) were selected.
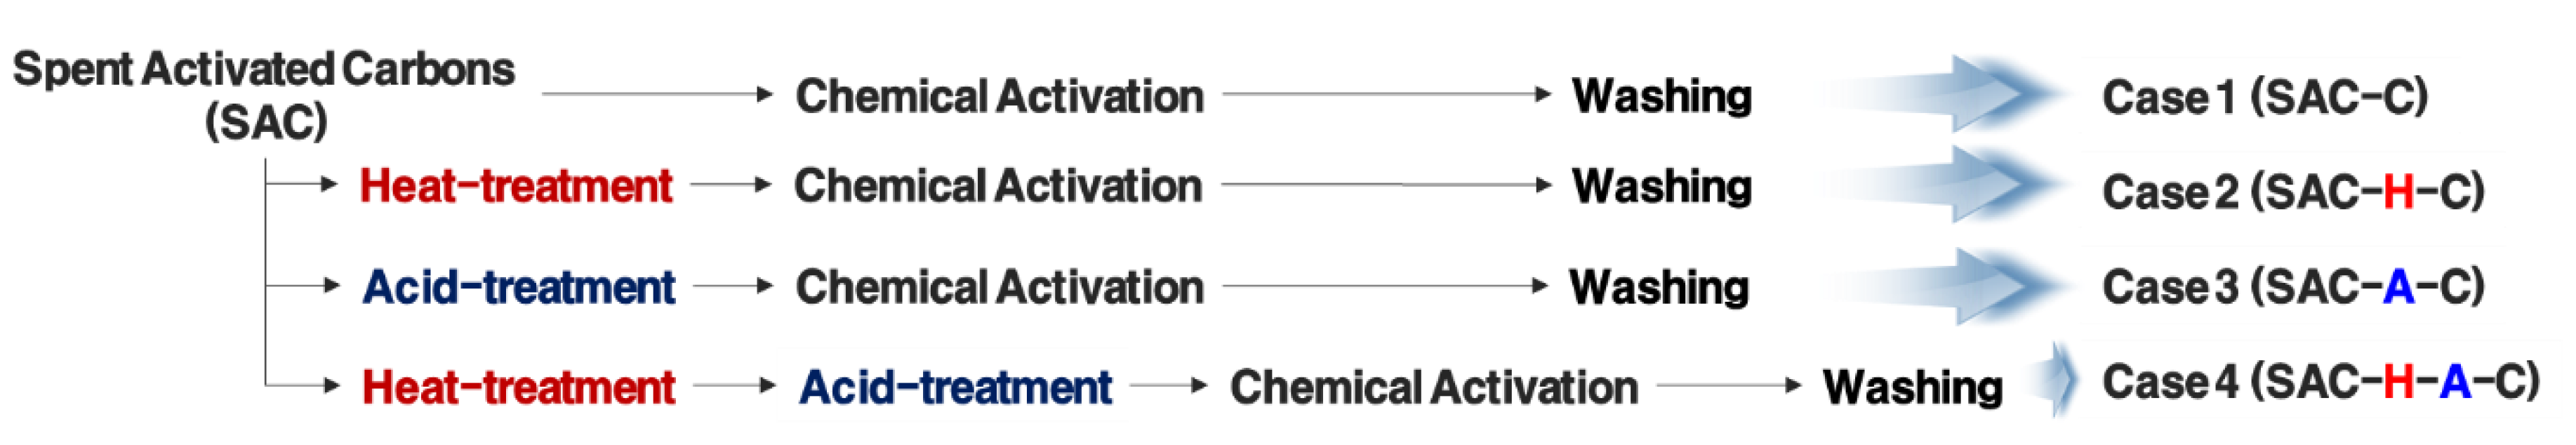
The SACs were prepared by four types of pathways, named Case 1, 2, 3, and 4, and heat treatment, acid treatment, and chemical activation were investigated.
For Case 1, the treatment method was a one-step chemical activation. The solid phase of the SAC was mixed with a solid phase of potassium hydroxide (KOH, Samchun Chemical, Seoul, South Korea), at a SAC/KOH weight ratio of 0.5 [19,20,21]. The samples were gradually heated at 5 °C/min until 750 °C, at which the temperature was maintained for 1 h. Subsequently, the samples were heated to 850 °C at a rate of 5 °C/min, and then held for 3 h. After chemical activation, the samples were washed with water three times and then neutralized. This sample was named SAC-C. For Case 2, approximately 10 g of SAC was slowly heated in a quartz reactor at a heating rate of 5 °C/min from room temperature to 500 °C under a nitrogen (N2) atmosphere (flow rate of 100 mL/min) [22]. The samples were held at this temperature for 10 h before slowly cooling down under a N2 atmosphere. After the heat treatment, the SAC was activated with KOH in the same manner as in Case 1. This sample was named SAC-H-C. For Case 3, the SACs were treated by organic and inorganic acids before chemical activation. For that, 10 g of SAC was washed 0.5 M acid solution for 0.5 h, filtered and rinsed with deionized water (DI) until neutral pH was achieved, and then dried at 105 °C in an oven for approximately 24 h. After the acid pre-treatment, the chemical activation was the same as that for Case 1 (SAC-A-C). In Case 4, both previous pre-treatments (heat and acid treatments) were used, after which chemical activation and washing methods were performed (denoted as SAC-H-A-C). Figure 1 describes the SAC regeneration pathway in Cases 1–4.
For the proximate analysis, dried SAC samples were placed in a furnace (Daeheung Sci., DF-4S, Incheon, South Korea) and heated at 950 °C for 7 min, and then 750 °C for 10 h. The ash, volatile s, and fixed carbon contents within the SACs were measured as weight percentages.
An elemental analysis (EA) was conducted by following procedures described elsewhere using an elemental analyzer (Flash EA 1112, Thermo Scientific, Milan, Italy). The elemental contents of C, H, O, N, and S were determined [19,20].
The surface area of SACs was analyzed using the Brunauer-Emmett-Teller (BET) method based on the N2 adsorption at −196 °C using an adsorption analyzer (ASAP 2010, Micrometrics, Norcross, GA, USA). The pore size of the SAC was calculated according to the Barrett Joyner and Halenda (BJH) method. Before carrying out the N2 isotherms, the SAC were outgassed at 350 °C to a constant vacuum (P/Po = 2µmHg) for 6 h.
The materials adsorbed on the SACs were analyzed by X-ray fluorescence (XRF-1800, Shimadzu, Tokyo, Japan).
3. Results and Discussion
3.1. Regeneration of Pre-Treated SAC
As mentioned in the experimental section, different pre-treatments were conducted to identify the most efficient process for SAC regeneration. The surface area and pore size distribution of SAC were 681.59 m2/g and 3.39 nm. The chemical activation efficiently enhanced the surface area of the samples, but the ash generation was observed after the activation, as shown in Supplementary Figure S1. The adsorbed metal ions on the ACs were not eliminated during the regeneration process (especially thermal and chemical activation), and then it was remained on the carbon surface and pores. The metal ions adsorbed on the ACs were reduced and converted into the ashes during the thermal process, which also could block the pores [21]. In previous reports, acid washing is widely used after chemical activation to remove the ashes from the SAC pores. In the present study, SAC was chemically regenerated, but post-treatments such as neutralization using acid solution were not conducted. After the activation, the samples were simply washed with DI water to confirm the pre-treatment effects.
Phosphoric acid was used as the strong acid in the pre-treatment process (Figure 1). Table 1 shows the AC properties obtained upon different pre-treatment processes. The SAC-C without pre-treatments exhibited higher specific surface area than those with pre-treatments. Although the surface area increased, the ash content in ACs before and after chemical activation (i.e., SAC and SAC-C, respectively) was comparable, as shown in Supplementary Figure S2. This result indicates that the generated ashes could not be eliminated without the additional acid washing. The potassium (K) only increased in SAC-C due to the KOH activation process. The various pre-treatment processes were carried out in this study, and the reason to choose the process was summarized in Supplementary Table S3 [23,24]. The expected effects and actual results were also compared. The expectation of heating and acid washing was removal of ashes and structure preventing, respectively. In the pre-treated ACs, the surface area increased in the following order: SAC-H-C < SAC-A-C < SAC-H-A-C. Furthermore, SAC-H-C, which was thermally pre-treated, exhibited lower surface areas due to the generated ashes, as previous research [25]. To reduce the ash load, an acid pre-treatment was conducted for the SAC-A-C. The SAC was treated by phosphoric acid (H3PO4) prior to the chemical activation to eliminate the adsorbed metal ions which caused the ashes. The process effectively reduced the ash production (6.1%), as shown in Table 1, but it did not significantly affect the specific surface area. It might be a possible explanation that higher concentration of acid aqueous will deteriorate the SAC by diminishing heavy metal desorption [15]. The SAC-H-A-C was treated with both heat and acid pre-treatments before the activation process. The amount of generated ash was reduced, and the specific surface area was comparable to that of SAC-C. The pre-treatment using both heat and acid treatments was more efficient than either method alone. The combined treatment of both thermal air and oxalic acid aqueous washing is the most excellent method for recovering the textural properties of SAC than one step [8]. However, the resulting surface area (SAC-H-A-C) was slightly lower than that of SAC-C.
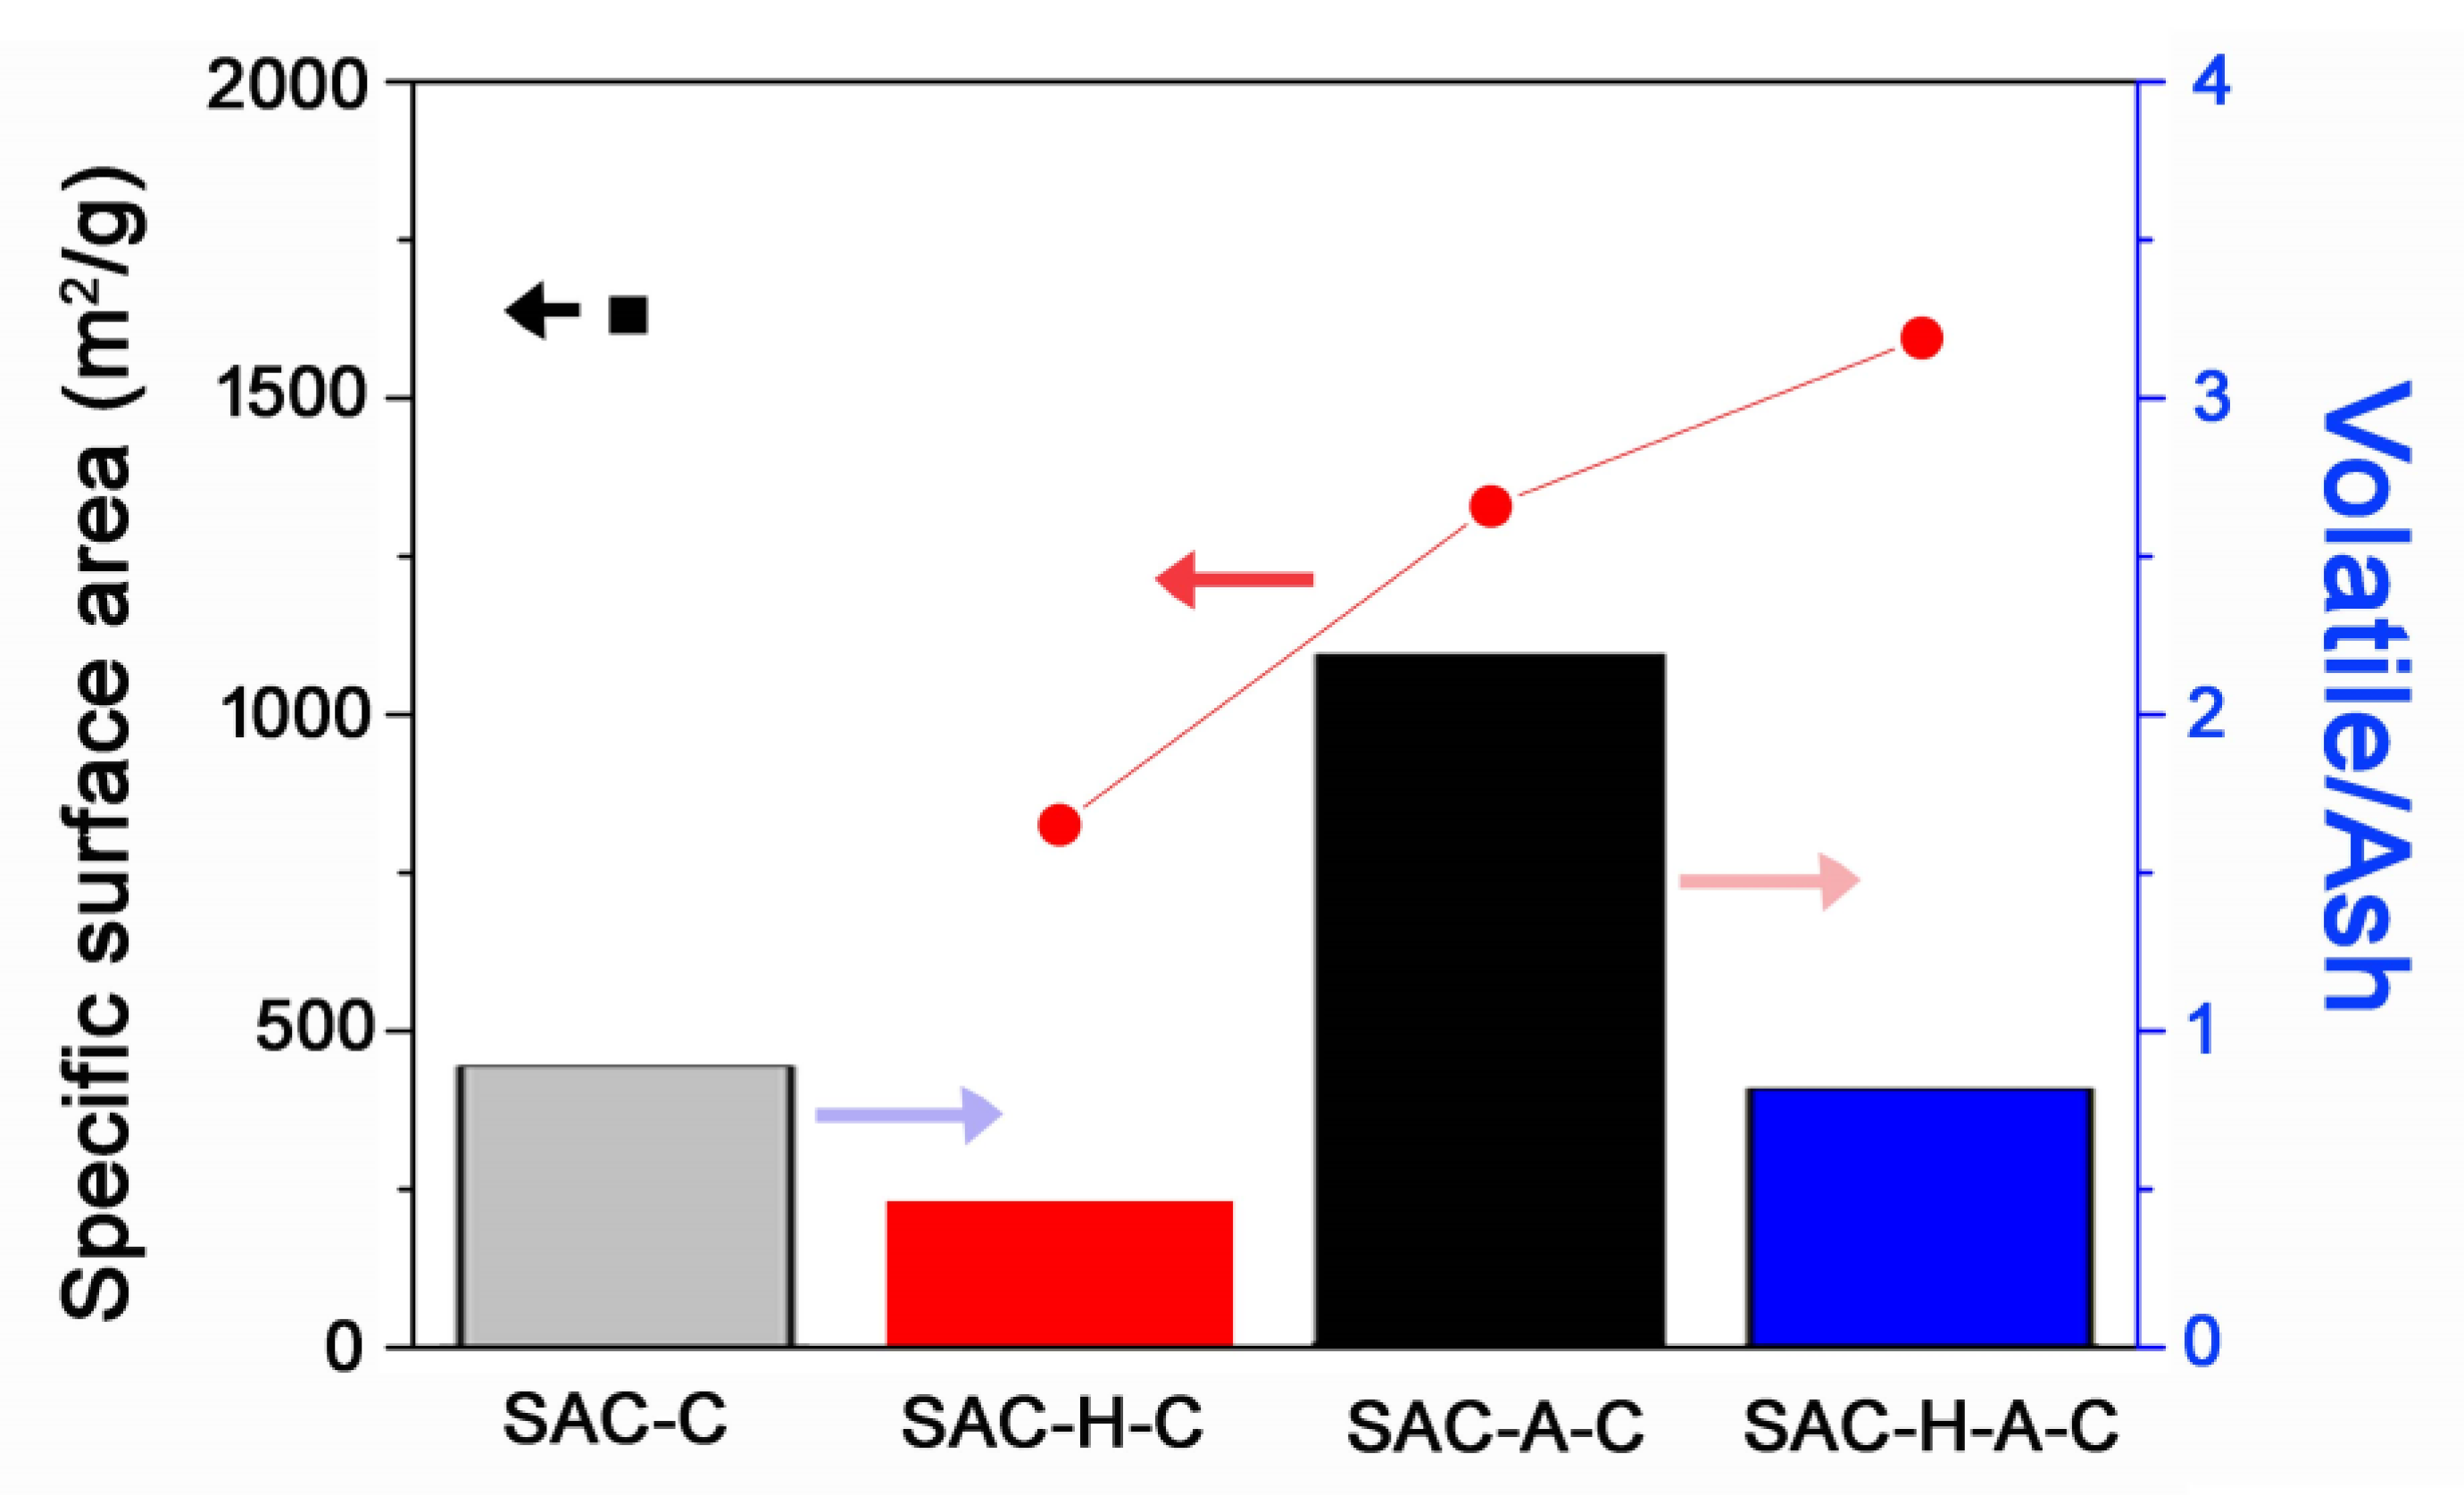
The AC obtained after the thermal pre-treatment exhibited lower volatile contents. This occurred because the process initially eliminated the oxygen functional groups from the sample surface. The specific functional groups representing the volatile compounds possibly enhanced the specific surface areas [26], but they did not significantly affect the results, as shown in Table 1. In addition, the ash amount usually affects the surface area increase [27]. The generated ashes cover the carbon active sites, which prevents the activation that increases the surface area. To confirm the effect of volatile and ash, their correlation between their ratio and surface areas are shown in Figure 2. The surface area and related ratio of volatile/ash of SAC-C and SAC-H-A-C were similar. The ratio of both samples was relatively low which indicated a lower amount of volatile and higher amount of ash content, and their surface area was comparatively high. In this case, the changes were mainly caused by the amount of volatile. Therefore, it can be concluded that the volatile/ash ratio was not directly correlated with specific surface areas.
3.2. Acid Pre-Treatment Effect
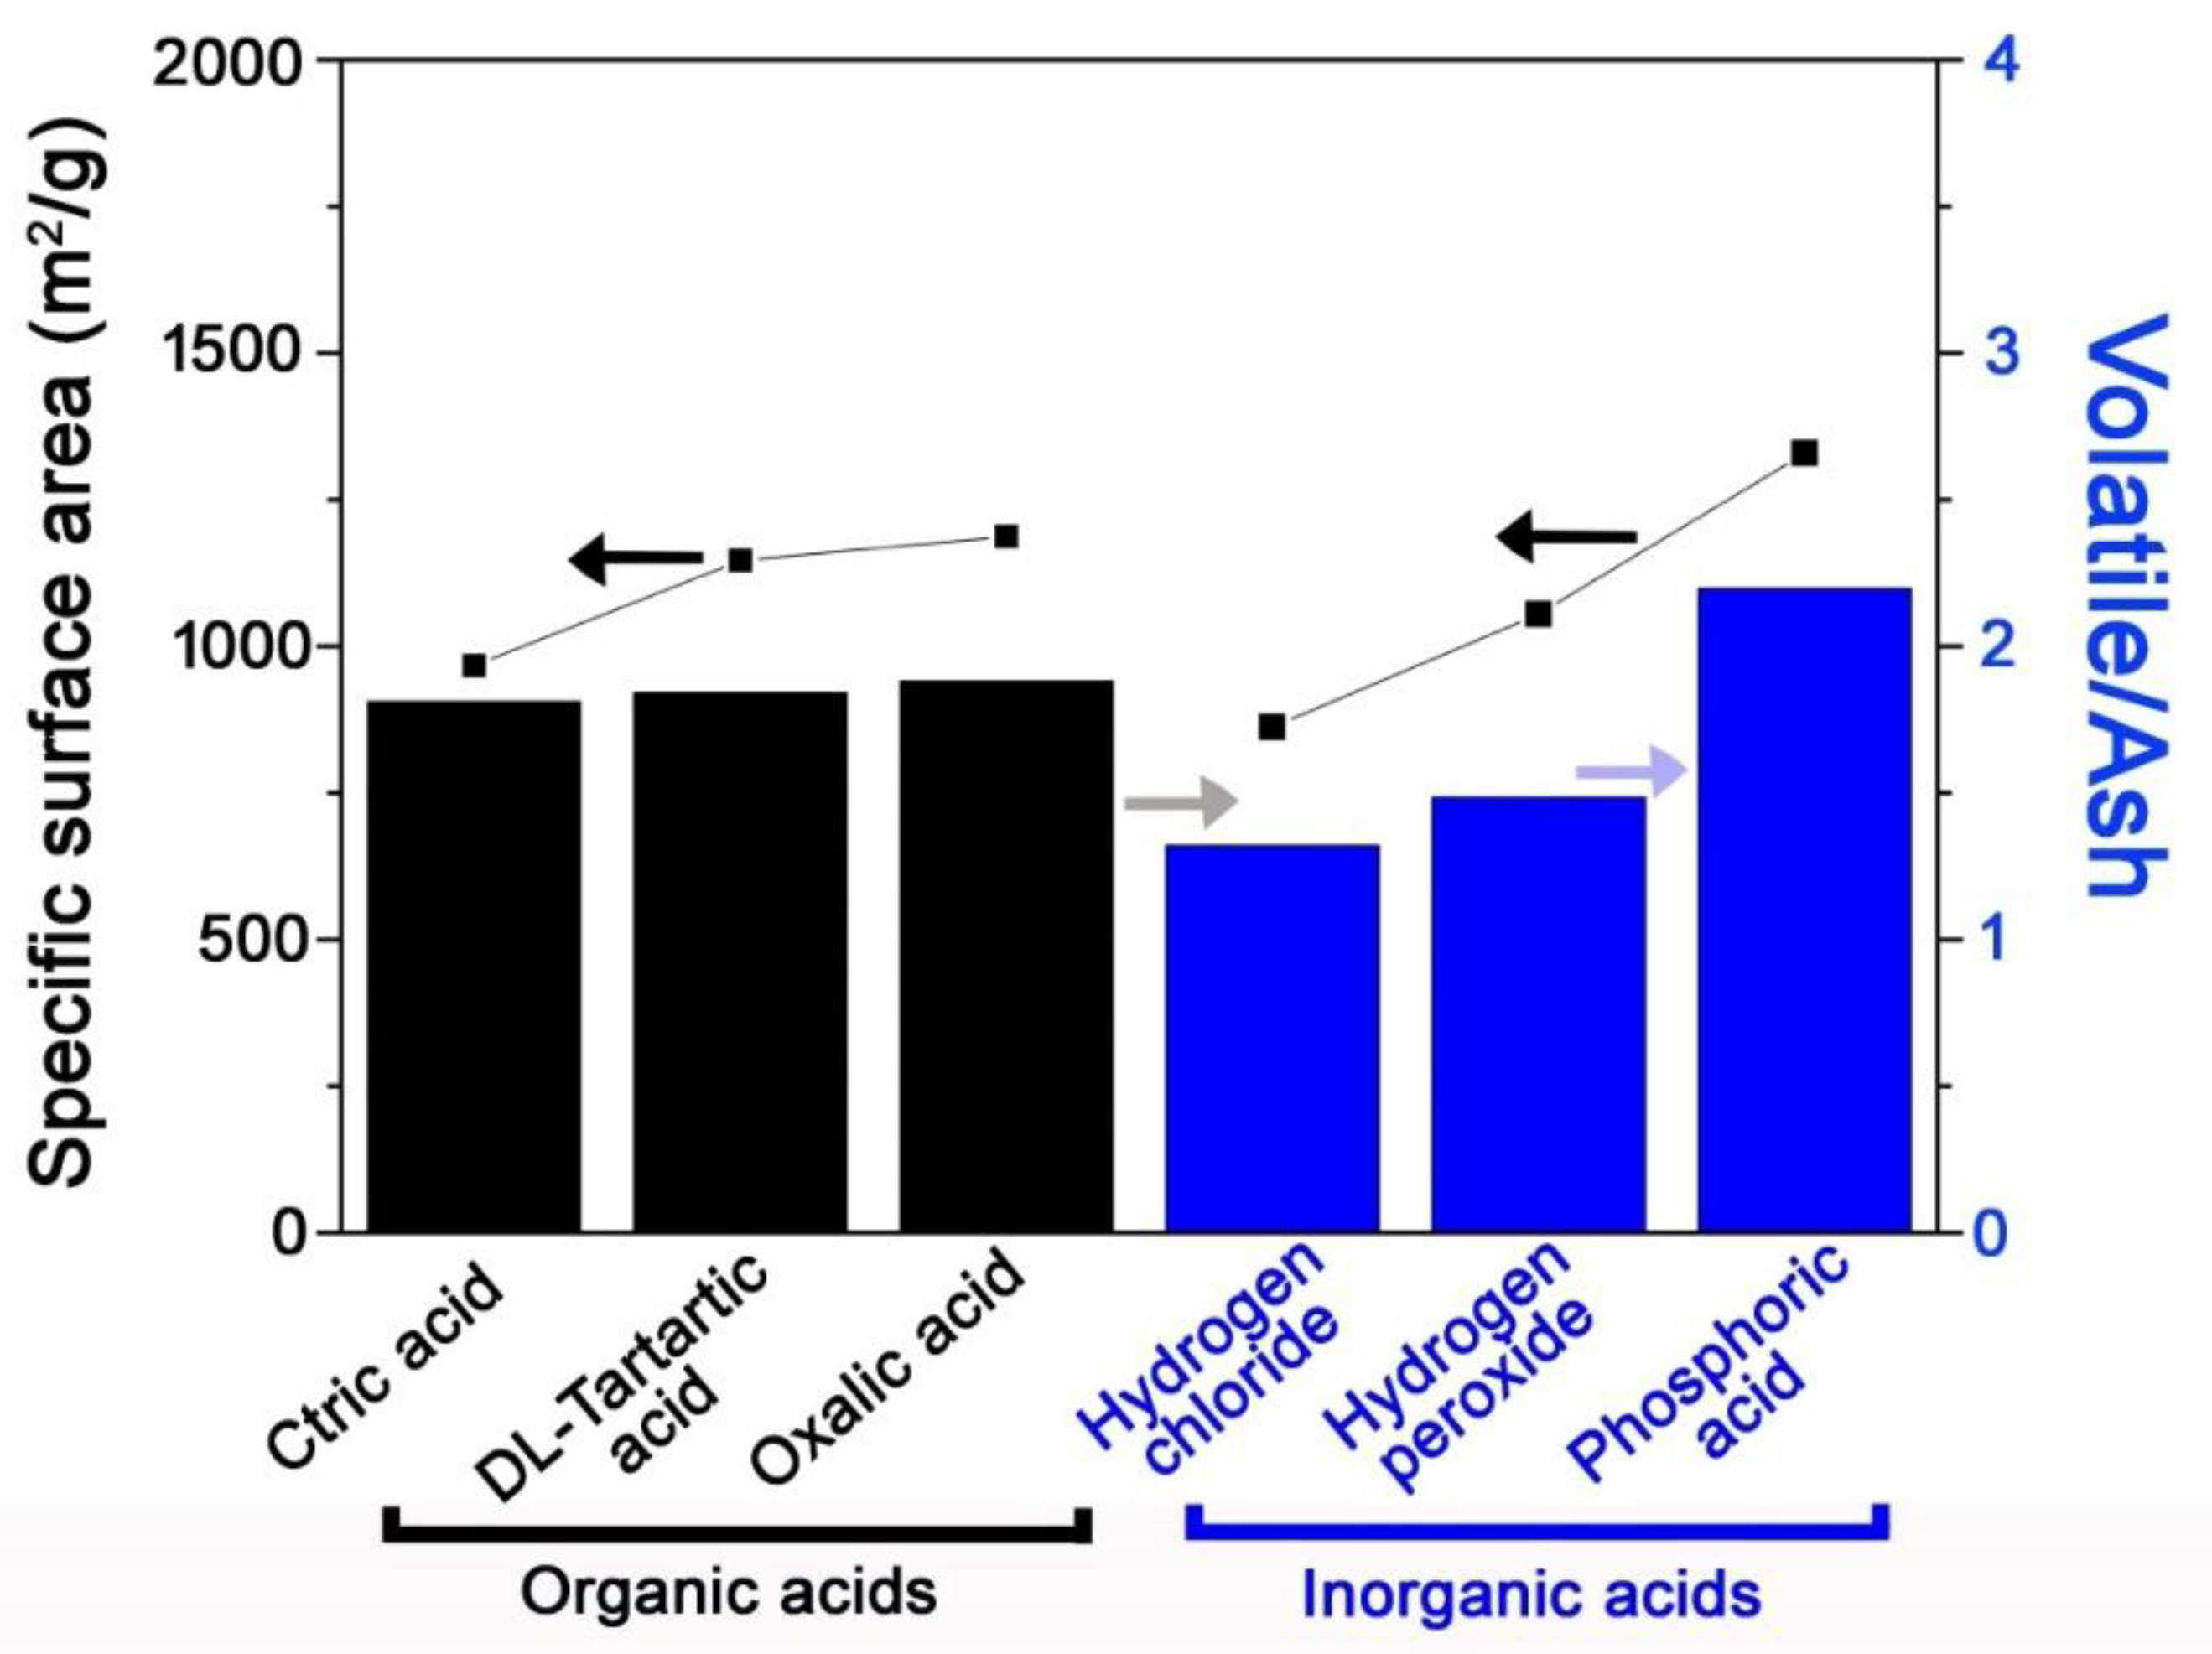
The specific surface area and proximate results of the ACs after the various acid pre-treatments are summarized in Table 2 with Supplementary Figure S3. The surface area of SAC-A-Cs after the acid pre-treatment was higher than that of SAC-H-C (825.40 m2/g). Most SAC-A-Cs, except the one treated with H3PO4, exhibited similar volatile and ash contents, and the H3PO4 pre-treatment reduced their contents. The ratio of volatile and ash vs. specific surface area are shown in Figure 3. The samples pre-treated with organic acids exhibited similar ratios, and the difference among their surface areas was within 5%. In contrast, the volatile/ash ratio of the samples pre-treated with inorganic acids increased in the following order: HCl < H2O2 < H3PO4. Particularly, the H3PO4 pre-treatment significantly increased the ratio, thus indicating that the ash content was sharply reduced, which led to the increase of specific surface area. An efficient ash removal is essential to increase the SAC surface area. Accordingly, the SAC-A-C with H3PO4 treatment, which exhibited the highest volatile/ash ratio and lowest ash content, presented the highest surface area increase. However, its surface area was still lower than that of SAC-C.
3.3. Combination of Heat and Acid Pre-Treatment
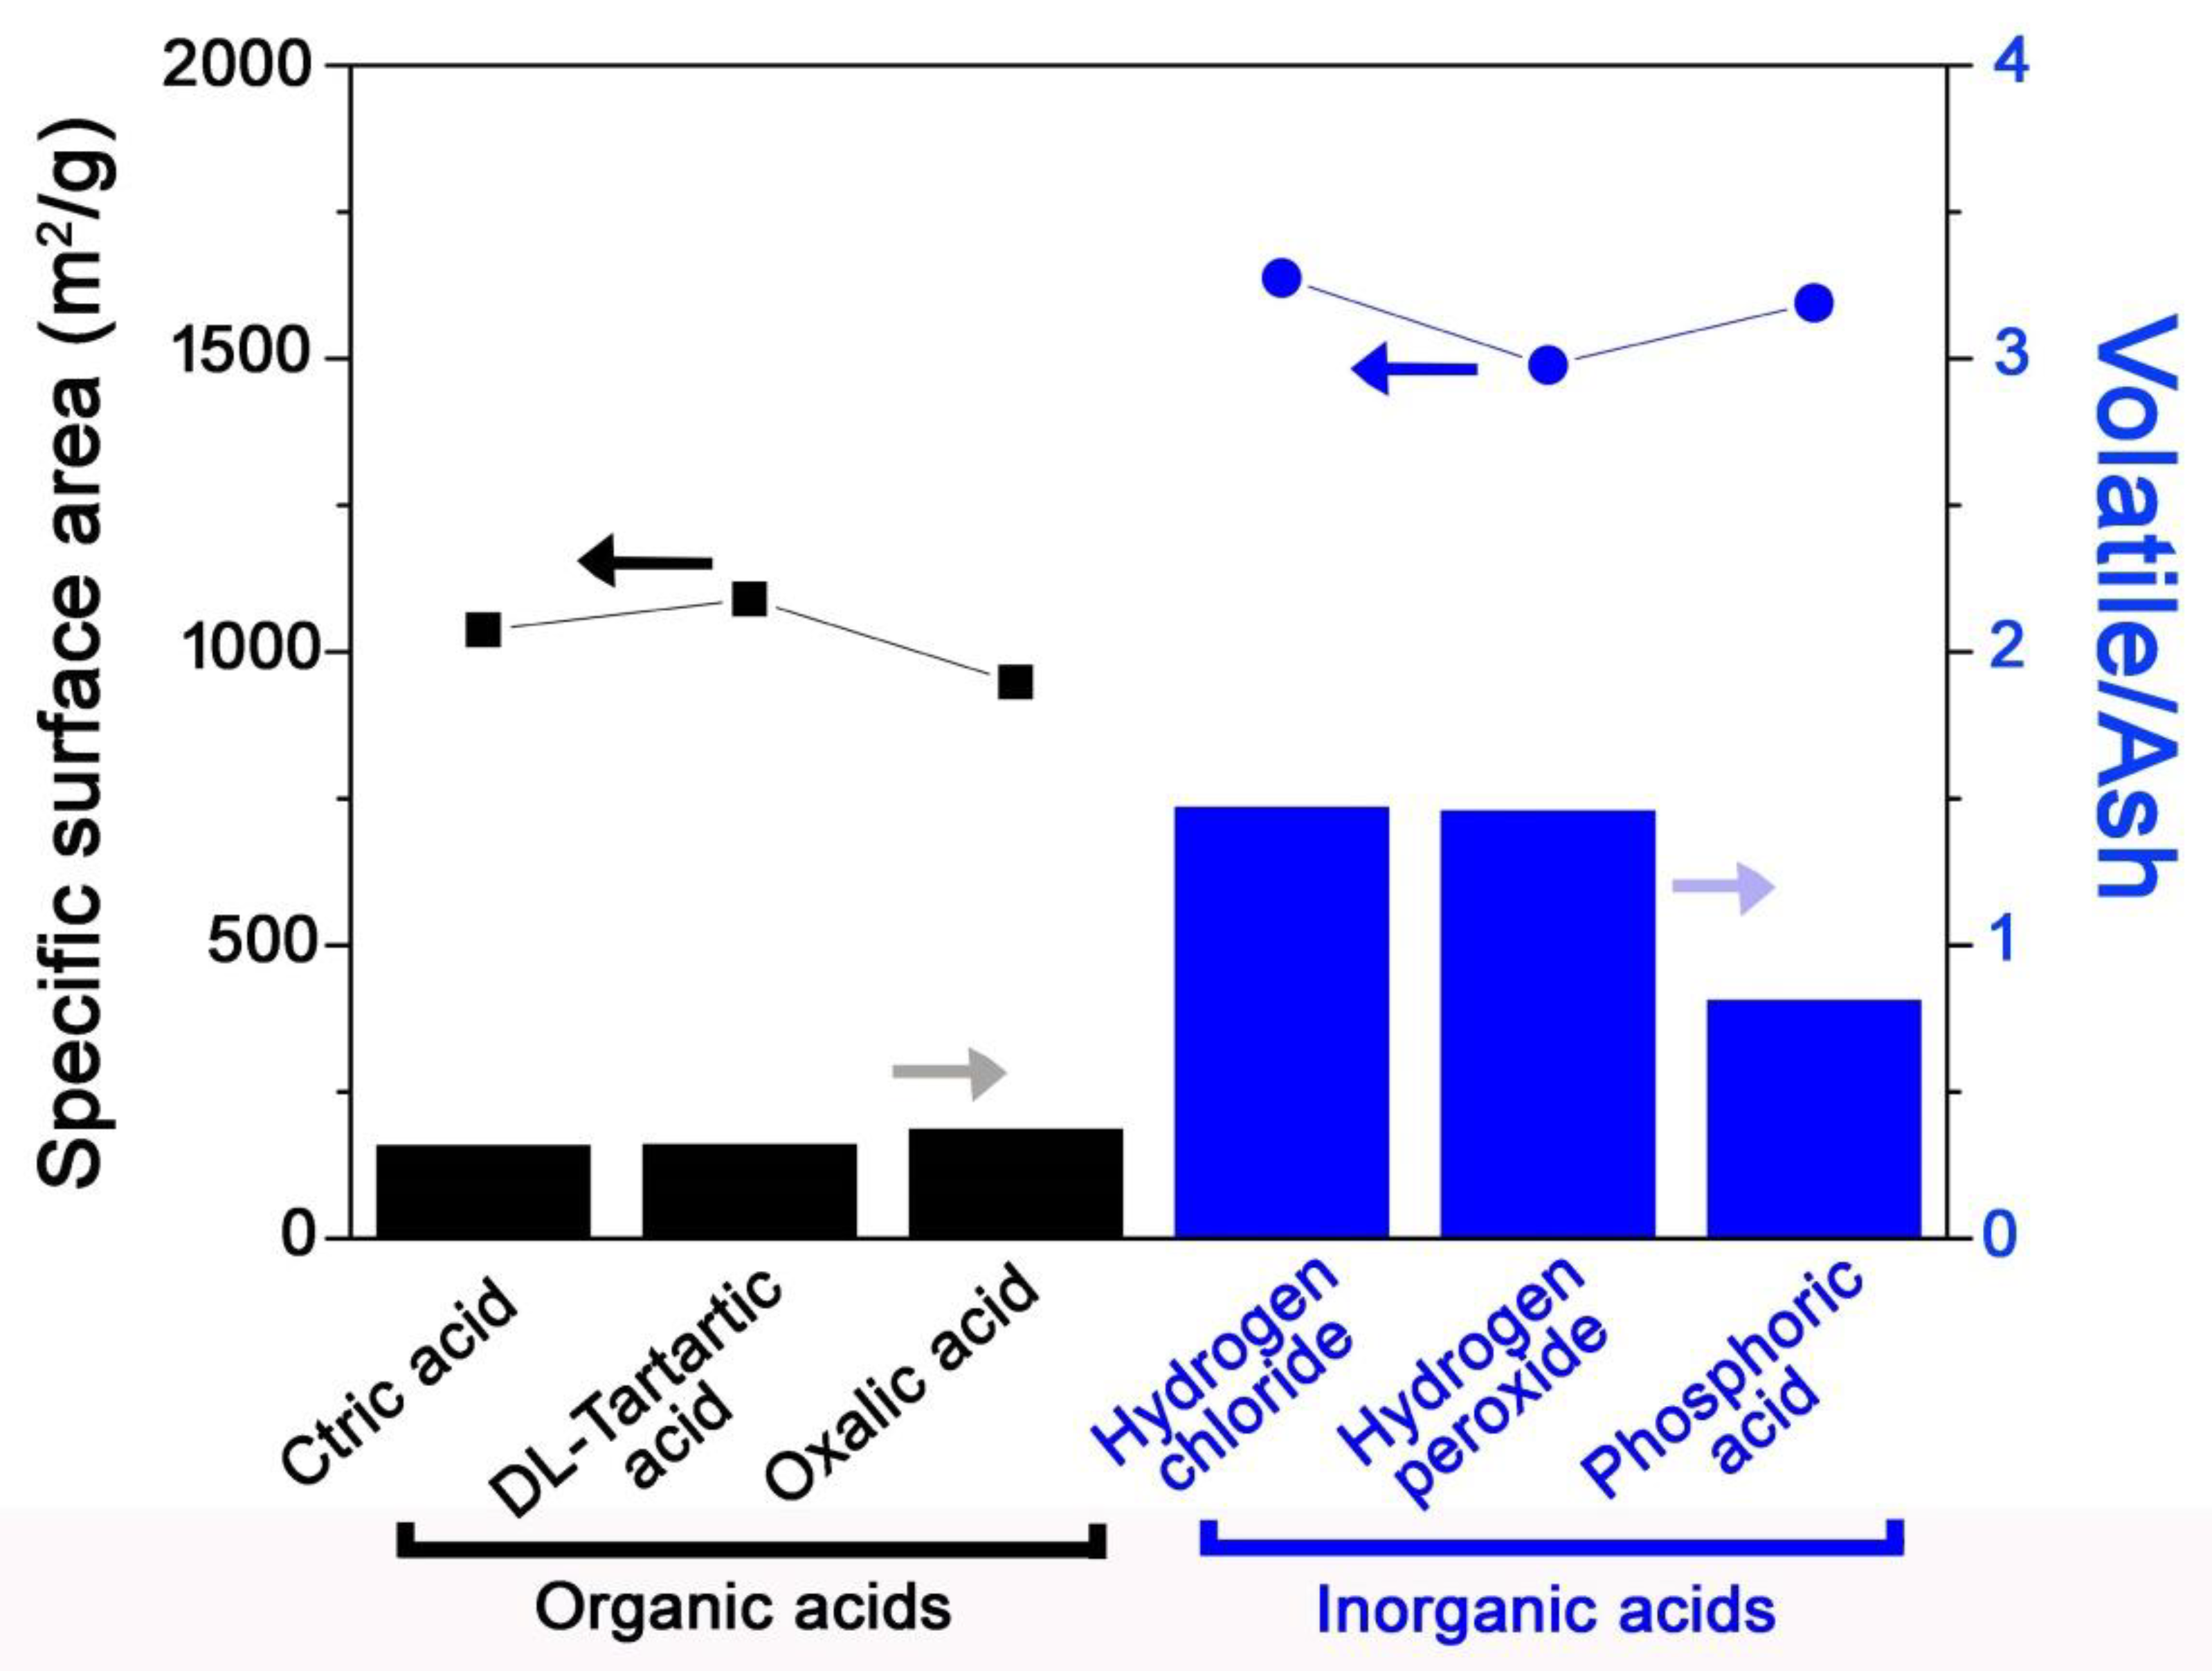
As shown in Table 1 and Figure 2, the combined heat and acid pre-treatment increased the surface area of the samples. SAC was thermally treated and then sequentially washed by an acid solution. After both pre-treatments, the SAC-H-A was chemically regenerated (activated). During the thermal treatment, the adsorbed metal ions were converted into the ashes, which led to pore blockage. However, the ashes were efficiently removed by the acid solutions, which likely improved the pore characteristics, including surface areas. To optimize the pre-treatment process, various acids were used, and the obtained surface areas were compared. The SAC-H-A-Cs properties are summarized in Table 3 and Supplementary Figure S4. The surface areas of SAC-H-A-C after inorganic acid pre-treatments were approximately 50% higher than those after organic acid pre-treatments. In addition, the organic treatments reduced the contents of volatile but also increased their ash contents. In contrast, the inorganic treatment reduced their ashes, but it did not eliminate the volatiles. Inorganic acid treatments also led to lower oxygen contents compared with the organic treatments. The results shown in Table 3 indicate that the inorganic acid efficiently removed the generated ashes from the heat treatment, thus leading to higher surface areas. Figure 4 also shows the correlation between the ratio of volatile/ash and specific surface area. The ratio for SAC-H-A-Cs after inorganic acid pre-treatment was higher than those for organic treated samples, which also represented the higher surface areas. Particularly, the H3PO4 pre-treatment reduced both volatiles and ash contents, which is similar to the results described in Section 3.2, thus leading to a ratio decrease, as shown in Figure 4. The amount of ash was more likely to affect the surface areas than the number of volatile adsorbates. The results confirm that the ash contents significantly affect the samples’ surface areas, and H3PO4 efficiently removed both adsorbed metal ions and generated ashes in the pre-treatment stages, thereby leading to higher surface areas. Therefore, it is possible that the generated ashes were correlated with specific surface areas.
3.4. Pre-Treatment Effects
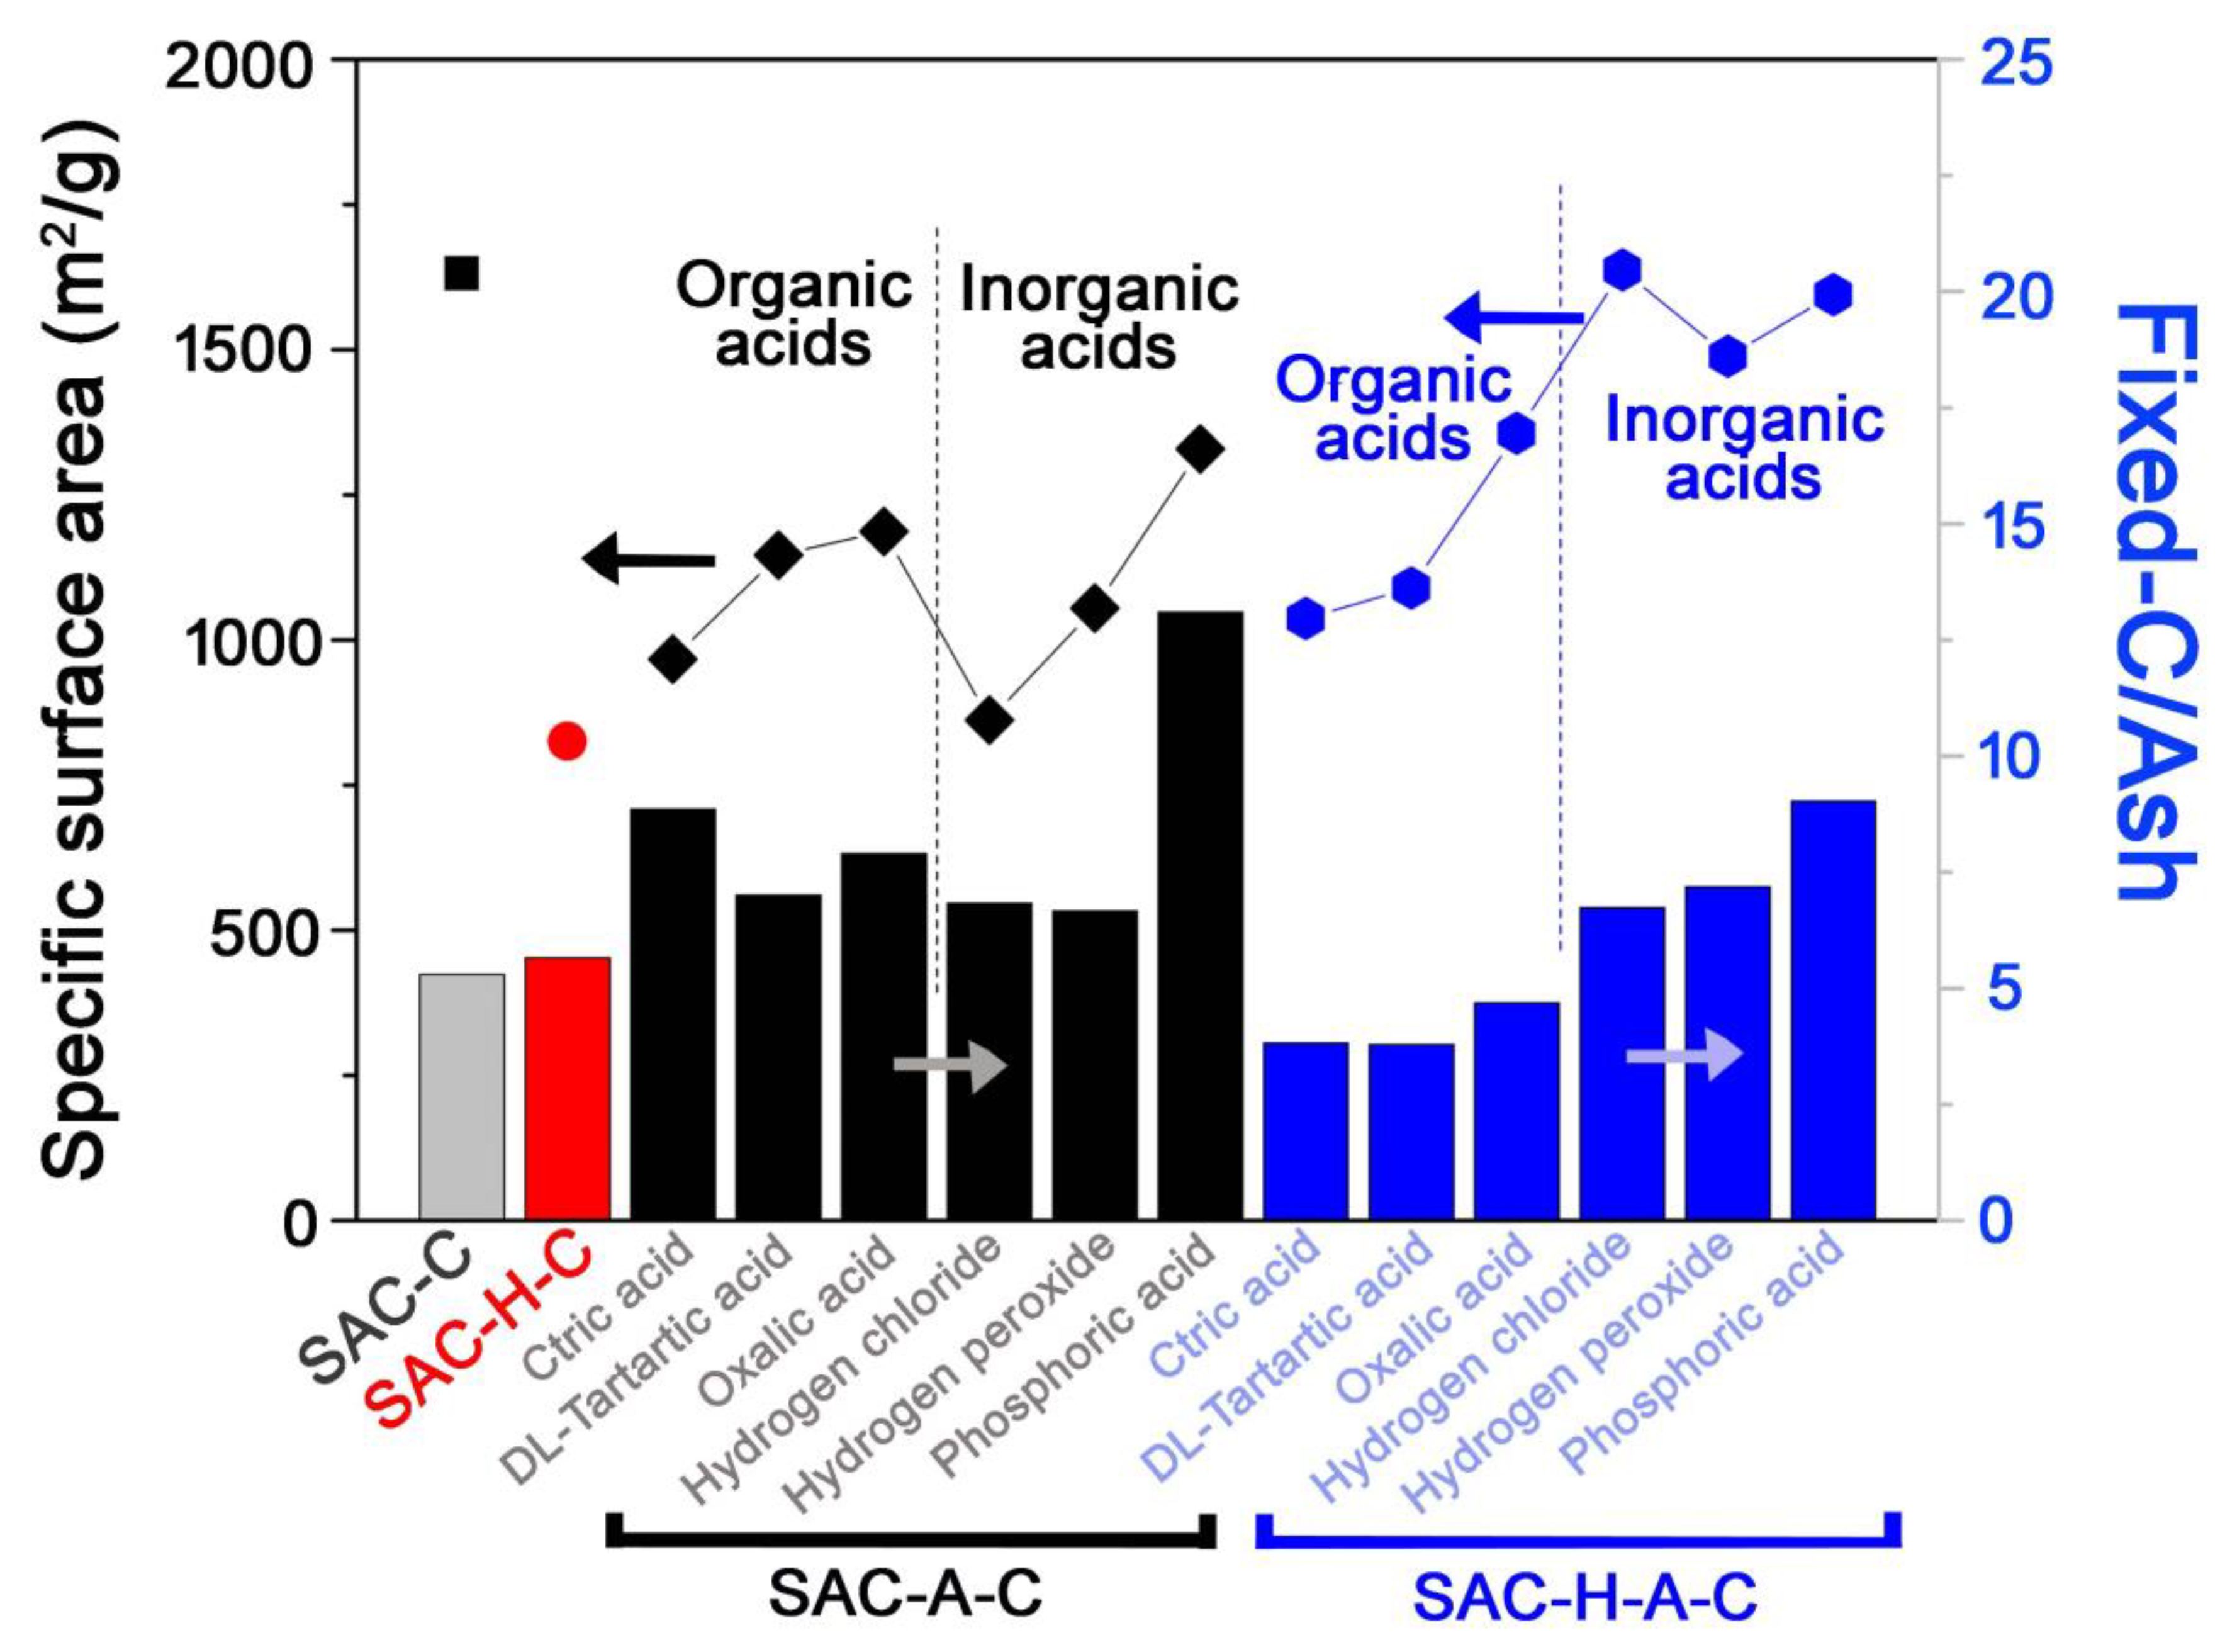
Figure 5 shows the relation between ash content and specific surface area. As mentioned above, the ash content significantly influenced the surface area, so their correlation under different pre-treatments was investigated. For a qualitatively comparison, the fixed-C/ash ratio was used, as shown in Figure 5. Overall, as the ratio increased, the surface area also increased.
Compared to other samples, the fixed-C/ash ratios in SAC-C and SAC-H-C were low, which indicated a large ash generation. In contrast, the ratio increased for samples that underwent acid pre-treatments (SAC-A-C and SAC-H-A-C). The fixed-C/ash ratio of SAC-A-C was higher than that of SAC-H-A-C, but their surface areas were not proportional. The acid pre-treatment in SAC-A-C eliminated the adsorbed metal ions, which could convert into ashes, but it simultaneously collapsed the carbon structure. Therefore, although the acid pre-treatment efficiently removed the ash, it negatively affected the surface area increase. The SAC-H-A-C, which contained both heat and acid pre-treatments, presented a lower fixed-C/ash ratio, but their surface increased. The thermal pre-treatment led to a partial graphitic structure [28], which prevented the formation of the carbon structure during the acid treatment. Moreover, the inorganic pre-treatment efficiently removed the ashes, thus leading to surface area increase. In addition, the advantage of SAC-H-A-C was the generation of high specific surface area, comparing with the previous results (Supplementary Table S4) [29,30,31]. The enhanced surface areas could increase the adsorption capacity, which also raise the product value.
According to previous reports, acid washing after chemical activation (post-treatment) can remove the generated ashes, thus leading to higher surface areas. If this acid post-treatment would be applied to the SAC-H-A-C samples of this study, the remaining ashes after the activation would likely be eliminated, thus further increasing their surface areas. The SAC-C exhibited the highest surface areas and also required the simplest process, which leads to economic benefits. The SAC-H-A-C also exhibited surface area comparable to that of SAC-C, but it required a complex process that demands additional energy for the heat treatment and produces waste acid solutions. Therefore, direct regeneration of SAC using only chemical activation would be suggested based on the results of this study.
4. Conclusions
SAC was regenerated using various treatment methods, namely heat, acid, and activation treatments. The chemical activation was already known as a simple method to regenerate SACs. In this study, different treatments were combined to further improve the properties (i.e., surface area) of SAC. Usually, the main limitation for the regeneration of SAC is the elimination of ashes from their pores. Therefore, acid washing was used as a pre-treatment process to remove the ashes prior to chemical activation. Four regeneration pathways (i.e., SAC-C, SAC-H-C, SAC-A-C, and SAC-H-A-C) were investigated, and their properties were compared. The surface areas increased in the following order: SAC-C > SAC-H-A-C > SAC-A-C > SAC-H-C. Among the pre-treated ACs, SAC-H-A-C exhibited the highest surface areas. The use of only heat or acid pre-treatment (i.e., SAC-H-C and SAC-A-C) resulted in a negative effect on the samples’ surfaces. In contrast, the SAC-H-A-C, to which both heat and acid pre-treatments were applied, led to an efficient pore development and increase of fixed carbon ratio, thus resulting in higher surface areas. Particularly, the inorganic acid was more efficient for ash removal than the organic acid. The ash removal increased the fixed-C/ash ratio, and there was a linear correlation between surface areas and fixed-C/ash.
The SAC-H-A-C samples exhibited higher surface areas, which were comparable to that of SAC-C. The pre-treatment of SAC-H-A-C required additional energy and acid solution, while the direct regeneration of SAC-C only required a chemical activation process. For a simpler process with economic benefits, the regeneration method used for SAC-C would be suggested.
Supplementary Materials
The following are available online, Table S1: Cost comparison of reactivated and virgin carbon, Table S2: Advantage, disadvantage, and operating cost of regenerated SACs, Table S3: Hypothesis and experimental results of regenerated SACs, Table S4: Summary of specific surface area of regenerated ACs, Figure S1: X-ray fluorescence (XRF) analysis of the chemical composition of SAC(green), SAC-C(gray), and SAC-H-A-C(blue) bars, Figure S2: Nitrogen adsorption and desorption isotherms of (a) SAC, (b) SAC-C, (c) SAC-H-C, Figure S3: Nitrogen adsorption and desorption isotherms of SAC-A-Cs; (a) C6H8O7, (b) C4H6O6, (c) C2H2O4, (d) HCl, (e)H2O2, (f) H3PO4, Figure S4: Nitrogen adsorption and desorption isotherms of SAC-H-A-Cs; (a) organic acids; C6H8O7, C4H6O6, C2H2O4, (b) HCl, H2O2, H3PO4.
Author Contributions
Conceptualization, investigation, data curation, writing—original draft preparation, writing—review and editing, J.E.P. and S.Y.H.; methodology, J.H.K., G.B.L.; formal analysis, data curation, J.E.P., J.H.K.; project administration and funding acquisition, B.U.H. All authors have read and agreed to the published version of the manuscript.
Funding
This subject is supported by Korean Ministry of Environment (Project No. 201902014).
Conflicts of Interest
The authors declare no conflict of interest.
References
- Lee, N. Water Policy and Institutions in the Republic of Korea; No. 985, ADBI Working Paper Series; Asian Development Bank Institute: Tokyo, Japan, 2019. [Google Scholar]
- Duan, X.-h.; Srinivasakannan, C.; Qu, W.-W.; Xin, W.; Peng, J.-h.; Zhang, L.-b. Regeneration of microwave assisted spent activated carbon: Process optimization, adsorption isotherms and kinetics. Chem. Engineer. Process. Process Intensif. 2012, 53, 53–62. [Google Scholar] [CrossRef]
- Oladejo, J.; Shi, K.; Chen, Y.; Luo, X.; Gang, Y.; Tao, W. Closing the active carbon cycle: Regeneration of spent activated carbon from a wastewater treatment facility for resource optimization. Chem. Engineer. Process. Process Intensif. 2020, 150, 107878. [Google Scholar] [CrossRef]
- Ma, A.; Zheng, X.; Liu, C.; Peng, J.; Li, S.; Zhang, L.; Liu, C. Study on regeneration of spent activated carbon by using a clean technology. Green Process. Synth. 2017, 6, 499–510. [Google Scholar] [CrossRef]
- Islam, M.S.; Rouf, M.A. Waste biomass as sources for activated carbon production-A review. Bangladesh J. Sci. Ind. Res. 2012, 47, 347–364. [Google Scholar] [CrossRef]
- Jain, A.; Balasubramanian, R.; Srinivasan, M.P. Hydrothermal conversion of biomass waste to activated carbon with high porosity: Review. Chem. Engineer. J. 2016, 283, 789–805. [Google Scholar] [CrossRef]
- Kazemipour, M.; Ansari, M.; Tajrobehkar, S.; Majdzadeh, M.; Kermani, H.R. Removal of lead, cadmium, zinc, and copper from industrial wastewater by carbon developed from walnut, hazelnut, almond, pistachio shell, and apricotstone. J. Hazard. Mater. 2008, 150, 322–327. [Google Scholar] [CrossRef]
- Nahm, S.W.; Shim, W.G.; Park, Y.-K.; Kim, S.C. Thermal and chemical regeneration of spent activated carbon and its adsorption property for toluene. Chem. Engineer. J. 2012, 210, 500–509. [Google Scholar] [CrossRef]
- Tay, J.H.; Chen, X.G.; Jeyaseelan, S. Optimising the preparation of activated carbon from digested sewage sludge and coconut busk. Chemosphere 2001, 44, 45–51. [Google Scholar] [CrossRef]
- Baseri, J.R.; Palanisamy, P.N.; Sivakumar, P. Preparation and characterization of activated carbon from Thevetia peruviana for the removal of dyes from textile waste water. Adv. Appl. Sci. Res. 2012, 3, 377–383. [Google Scholar]
- Hamura, D.; Sagayaga, A.; Babcock, R. Literature review of regeneration methods and local disposal alternatives; WRRC-98-12; Water Resources Research Center: Honolulu, HI, USA, 1998. [Google Scholar]
- Moreno-castilla, C.; Carrasco-marín, F.; Maldonado-hódar, F.J.; Rivera-utrilla, J. Effects of non-oxidant and oxidant acid treatments on the surface properties of an activated carbon with very low ash content. Carbon 1998, 36, 145–151. [Google Scholar] [CrossRef] [Green Version]
- Zhang, L.-Q.; Jiang, H.-T.; Ma, C.-Y.; Yong, D. Microwave regeneration characteristics of activated carbon for flue gas desulfurization. J. Fuel Chem. Technol. 2012, 40, 1366–1371. [Google Scholar] [CrossRef]
- Nasruddin, M.N.; Fahmi, M.R.; Azner, A.C.Z.; Yen, T.S. Regeneration of Spent Activated Carbon from wastewater treatment plant application. J. Phys. Conf. Ser. 2018, 1116, 032022. [Google Scholar] [CrossRef]
- Shah, I.K.; Pre, P.; Alappat, B.J. Effect of thermal regeneration of spent activated carbon on volatile organic compound adsorption performances. J. Taiwan Inst. Chem. Engineer. 2014, 45, 1733–1738. [Google Scholar] [CrossRef]
- Mailler, R.; Gasperi, J.; Coquet, Y.; Buleté, A.; Vulliet, E.; Deshayes, S.; Zedek, S.; Mirande-Bret, C.; Eudes, V.; Bressy, A.; et al. Removal of a wide range of emerging pollutants from wastewater treatment plant discharges by micro-grain activated carbon in fluidized bed as tertiary treatment at large pilot. Sci. Total Environ. 2016, 542, 983–996. [Google Scholar] [CrossRef] [Green Version]
- Moreno-Castilla, C.; Ferro-Garcia, M.A.; Joly, J.P.; Bautista-Toledo, I.; Carrasco-Marin, F.; Rivera-Utrilla, J. Activated Carbon Surface Modifications by Nitric Acid, Hydrogen Peroxide, and Ammonium Peroxydisulfate Treatments. Langmuir 1995, 11, 4386–4392. [Google Scholar] [CrossRef]
- Huling, S.G.; Kan, E.; Caldwell, C.; Park, S. Fenton-driven chemical regeneration of MTBE-spent granular activated carbon-A pilot study. J. Hazard. Mater. 2012, 205, 55–62. [Google Scholar] [CrossRef]
- Lee, G.B.; Park, J.E.; Hwang, S.Y.; Kim, J.H.; Kim, S.; Kim, H.; Hong, B.U. Comparison of by-product gas composition by activations of activated carbon. Carbon Lett. 2019, 29, 263–272. [Google Scholar] [CrossRef]
- Hwang, S.Y.; Lee, G.B.; Kim, H.; Park, J.E. Influence of mixed methods on the surface area and gas products of activated carbon. Carbon Lett. 2020. (in Press). [Google Scholar] [CrossRef]
- Park, J.E.; Lee, G.B.; Hong, B.U.; Hwang, S.Y. Regeneration of Activated Carbons Spent by Waste Water Treatment Using KOH Chemical Activation. Appl. Sci. 2019, 9, 5132. [Google Scholar] [CrossRef] [Green Version]
- Cazetta, A.L.; Junior, O.P.; Vargas, A.M.M.; Silva, A.P.; Zou, X.; Asefa, T.; Almeid, V.C. Thermal regeneration study of high surface area activated carbon obtained from coconut shell: Characterization and application of response surface methodology. J. Anal. Appl. Pyrolysis 2012, 101, 53–60. [Google Scholar] [CrossRef]
- Miguel, G.S.; Lambert, S.D.; Graham, N.J.D. Thermal Regeneration of Granular Activated Carbons Using Inert Atmospheric Conditions. Environ. Technol. 2002, 23, 1337–1346. [Google Scholar] [CrossRef] [PubMed]
- Van der Bruggen, B.; Vogels, G.; Van Herck, P.; Vandecasteele, C. Simulation of acid washing of municipal solid waste incineration fly ashes in order to remove heavy metals. J. Hazard. Mater. 1998, 57, 127–144. [Google Scholar] [CrossRef]
- Guo, Y.; Du, E. The Effects of Thermal Regeneration Conditions and Inorganic Compounds on the Characteristics of Activated Carbon Used in Power Plant. Energy Proced. 2012, 177, 444–449. [Google Scholar] [CrossRef] [Green Version]
- Bagreev, A.; Rahman, H.; Bandosz, T.J. Thermal regeneration of a spent activated carbon previously used as hydrogen sulfide adsorbent. Carbon 2001, 39, 1319–1326. [Google Scholar] [CrossRef]
- Lua, A.C.; Yang, T. Effect of activation temperature on the textural and chemical properties of potassium hydroxide activated carbon prepared from pistachio-nut shell. J. Colloid Interface Sci. 2004, 274, 594–601. [Google Scholar] [CrossRef] [PubMed]
- Huang, X. Fabrication and Properties of Carbon Fibers. Materials (Basel) 2009, 2, 2369–2403. [Google Scholar] [CrossRef]
- Xia, H.; Wu, J.; Xia, Y.; Zhang, L.; Peng, J.; Wang, S.; Zheng, Z.; Zhang, S. Microwave assisted regeneration of spent activated carbon from petrochemical plant using response surface methodology. J. Porous Mater. 2015, 22, 137–146. [Google Scholar] [CrossRef]
- Li, Y.; Jin, H.; Liu, W.; Su, H.; Lu, Y.; Li, J. Study on regeneration of waste powder activated carbon through pyrolysis and its adsorption capacity of phosphorus. Sci. Rep. 2018, 8, 778. [Google Scholar] [CrossRef] [Green Version]
- Cho, J.-H.; Kim, Y.-S.; Jeon, S.-B.; Seo, J.-B.; Jung, J.-H.; Oh, K.-J. Improvement of thermal regeneration of spent granular activated carbon using air agent: Application of sintering and deoxygenation. Korean J. Chem. Engineer. 2014, 31, 1641–1650. [Google Scholar] [CrossRef]
Sample Availability: Samples of the compounds are not available. |
Figure 1.
The various methods for regenerating activated carbon.

Figure 2.
Relationship between surface area and ratio of volatile/ash at different pre-treatment methods. The square (▪) and circle (•) symbols indicated the specific surface areas (left y-axis), and the SAC-C(gray), SAC-H-C(red), SAC-A-C(black), and SAC-H-A-C(blue) bars represented the ratio of volatile/ash (right y-axis).

Figure 3.
Relationship between surface area and ratio of volatile/ash using the acid pre-treatment methods. The square (▪) symbols indicated the specific surface areas (left y-axis), and the both black and blue bars represented the ratio of volatile/ash (right y-axis).
Figure 3.
Relationship between surface area and ratio of volatile/ash using the acid pre-treatment methods. The square (▪) symbols indicated the specific surface areas (left y-axis), and the both black and blue bars represented the ratio of volatile/ash (right y-axis).

Figure 4.
Relationship between surface area and ratio of volatile/ash using the combination pre-treatment (heat and acid) methods. The square (▪) and circle (•) symbols indicated the specific surface areas (left y-axis), and the both black and blue bars represented the ratio of volatile/ash (right y-axis).

Figure 5.
Correlation between surface area and ratio of fixed-C/ash at different pre-treatment methods. The symbols indicated the specific surface areas (left y-axis), and the SAC-C(gray), SAC-H-C(red), SAC-A-C(black), and SAC-H-A-C(blue) bars represented the ratio of fixed-C/ash (right y-axis).
Figure 5.
Correlation between surface area and ratio of fixed-C/ash at different pre-treatment methods. The symbols indicated the specific surface areas (left y-axis), and the SAC-C(gray), SAC-H-C(red), SAC-A-C(black), and SAC-H-A-C(blue) bars represented the ratio of fixed-C/ash (right y-axis).


Table 1.
Pre-treatment effect of regenerated SACs.
| SAC | SAC-C | SAC-H-C | SAC-A-C | SAC-H-A-C | ||
|---|---|---|---|---|---|---|
| BET surface area (m2/g) | 681.59 | 1631.70 | 825.40 | 1329.00 | 1594.76 | |
| Proximate analysis (%) | Volatile | 13.85 | 12.40 | 6.46 | 13.48 | 7.48 |
| Fixed-C | 71.28 | 73.70 | 79.49 | 80.38 | 83.30 | |
| Ash | 14.86 | 13.90 | 14.04 | 6.14 | 9.22 | |
Table 2.
Specific surface area and proximate results of regenerated ACs with acid pre-treatment effect using organic and inorganic acids (SAC-A-C).
Table 2.
Specific surface area and proximate results of regenerated ACs with acid pre-treatment effect using organic and inorganic acids (SAC-A-C).
| Organic Acid | Inorganic Acid | ||||||
|---|---|---|---|---|---|---|---|
| C6H8O7 | C4H6O6 | C2H2O4 | HCl | H2O2 | H3PO4 | ||
| Specific surface area (m2/g) | 967.19 | 1146.24 | 1187.27 | 836.87 | 980.67 | 1329.37 | |
| Proximate analysis (%) | Volatile | 15.52 | 18.69 | 17.44 | 14.43 | 16.23 | 13.48 |
| Fixed-C | 75.91 | 71.16 | 73.29 | 74.65 | 72.85 | 80.38 | |
| Ash | 8.57 | 10.15 | 9.27 | 10.92 | 10.92 | 6.14 | |
Table 3.
Specific surface area and proximate results of regenerated ACs with the combined the heat and acid pre-treatment effect using organic and inorganic acids (SAC-H-A-C).
Table 3.
Specific surface area and proximate results of regenerated ACs with the combined the heat and acid pre-treatment effect using organic and inorganic acids (SAC-H-A-C).
| Organic Acid | Inorganic Acid | ||||||
|---|---|---|---|---|---|---|---|
| C6H8O7 | C4H6O6 | C2H2O4 | HCl | H2O2 | H3PO4 | ||
| Specific surface area (m2/g) | 1037.10 | 1089.90 | 948.10 | 1637.42 | 1489.06 | 1594.76 | |
| Proximate analysis (%) | Volatile | 6.15 | 6.26 | 6.14 | 15.97 | 15.11 | 7.48 |
| Fixed-C | 74.4 | 74.14 | 77.34 | 73.25 | 74.55 | 83.30 | |
| Ash | 19.46 | 19.59 | 16.51 | 10.78 | 10.37 | 9.22 | |
| Ultimate analysis (%) | Carbon | 79.24 | 79.99 | 77.53 | 83.21 | 84.75 | 87.83 |
| Hydrogen | 1.06 | 1.37 | 1.18 | 1.02 | 0.77 | 1.06 | |
| Oxygen | 17.19 | 16.18 | 18.86 | 12.17 | 12.48 | 9.66 | |
| Nitrogen | 0.55 | 0.61 | 0.27 | 0.92 | 0.54 | 0.29 | |
| Sulfur | 0.05 | 0.06 | 0.06 | 1.33 | 0.07 | 0.08 | |
© 2020 by the authors. Licensee MDPI, Basel, Switzerland. This article is an open access article distributed under the terms and conditions of the Creative Commons Attribution (CC BY) license (http://creativecommons.org/licenses/by/4.0/).
Share and Cite
MDPI and ACS Style
Hwang, S.Y.; Lee, G.B.; Kim, J.H.; Hong, B.U.; Park, J.E. Pre-Treatment Methods for Regeneration of Spent Activated Carbon. Molecules 2020, 25, 4561. https://doi.org/10.3390/molecules25194561
AMA Style
Hwang SY, Lee GB, Kim JH, Hong BU, Park JE. Pre-Treatment Methods for Regeneration of Spent Activated Carbon. Molecules. 2020; 25(19):4561. https://doi.org/10.3390/molecules25194561
Chicago/Turabian StyleHwang, Sang Youp, Gi Bbum Lee, Ji Hyun Kim, Bum Ui Hong, and Jung Eun Park. 2020. "Pre-Treatment Methods for Regeneration of Spent Activated Carbon" Molecules 25, no. 19: 4561. https://doi.org/10.3390/molecules25194561