Influence of Polymer Charge on the Localization and Dark- and Photo-Induced Toxicity of a Potential Type I Photosensitizer in Cancer Cell Models


Abstract
:
1. Introduction
2. Results
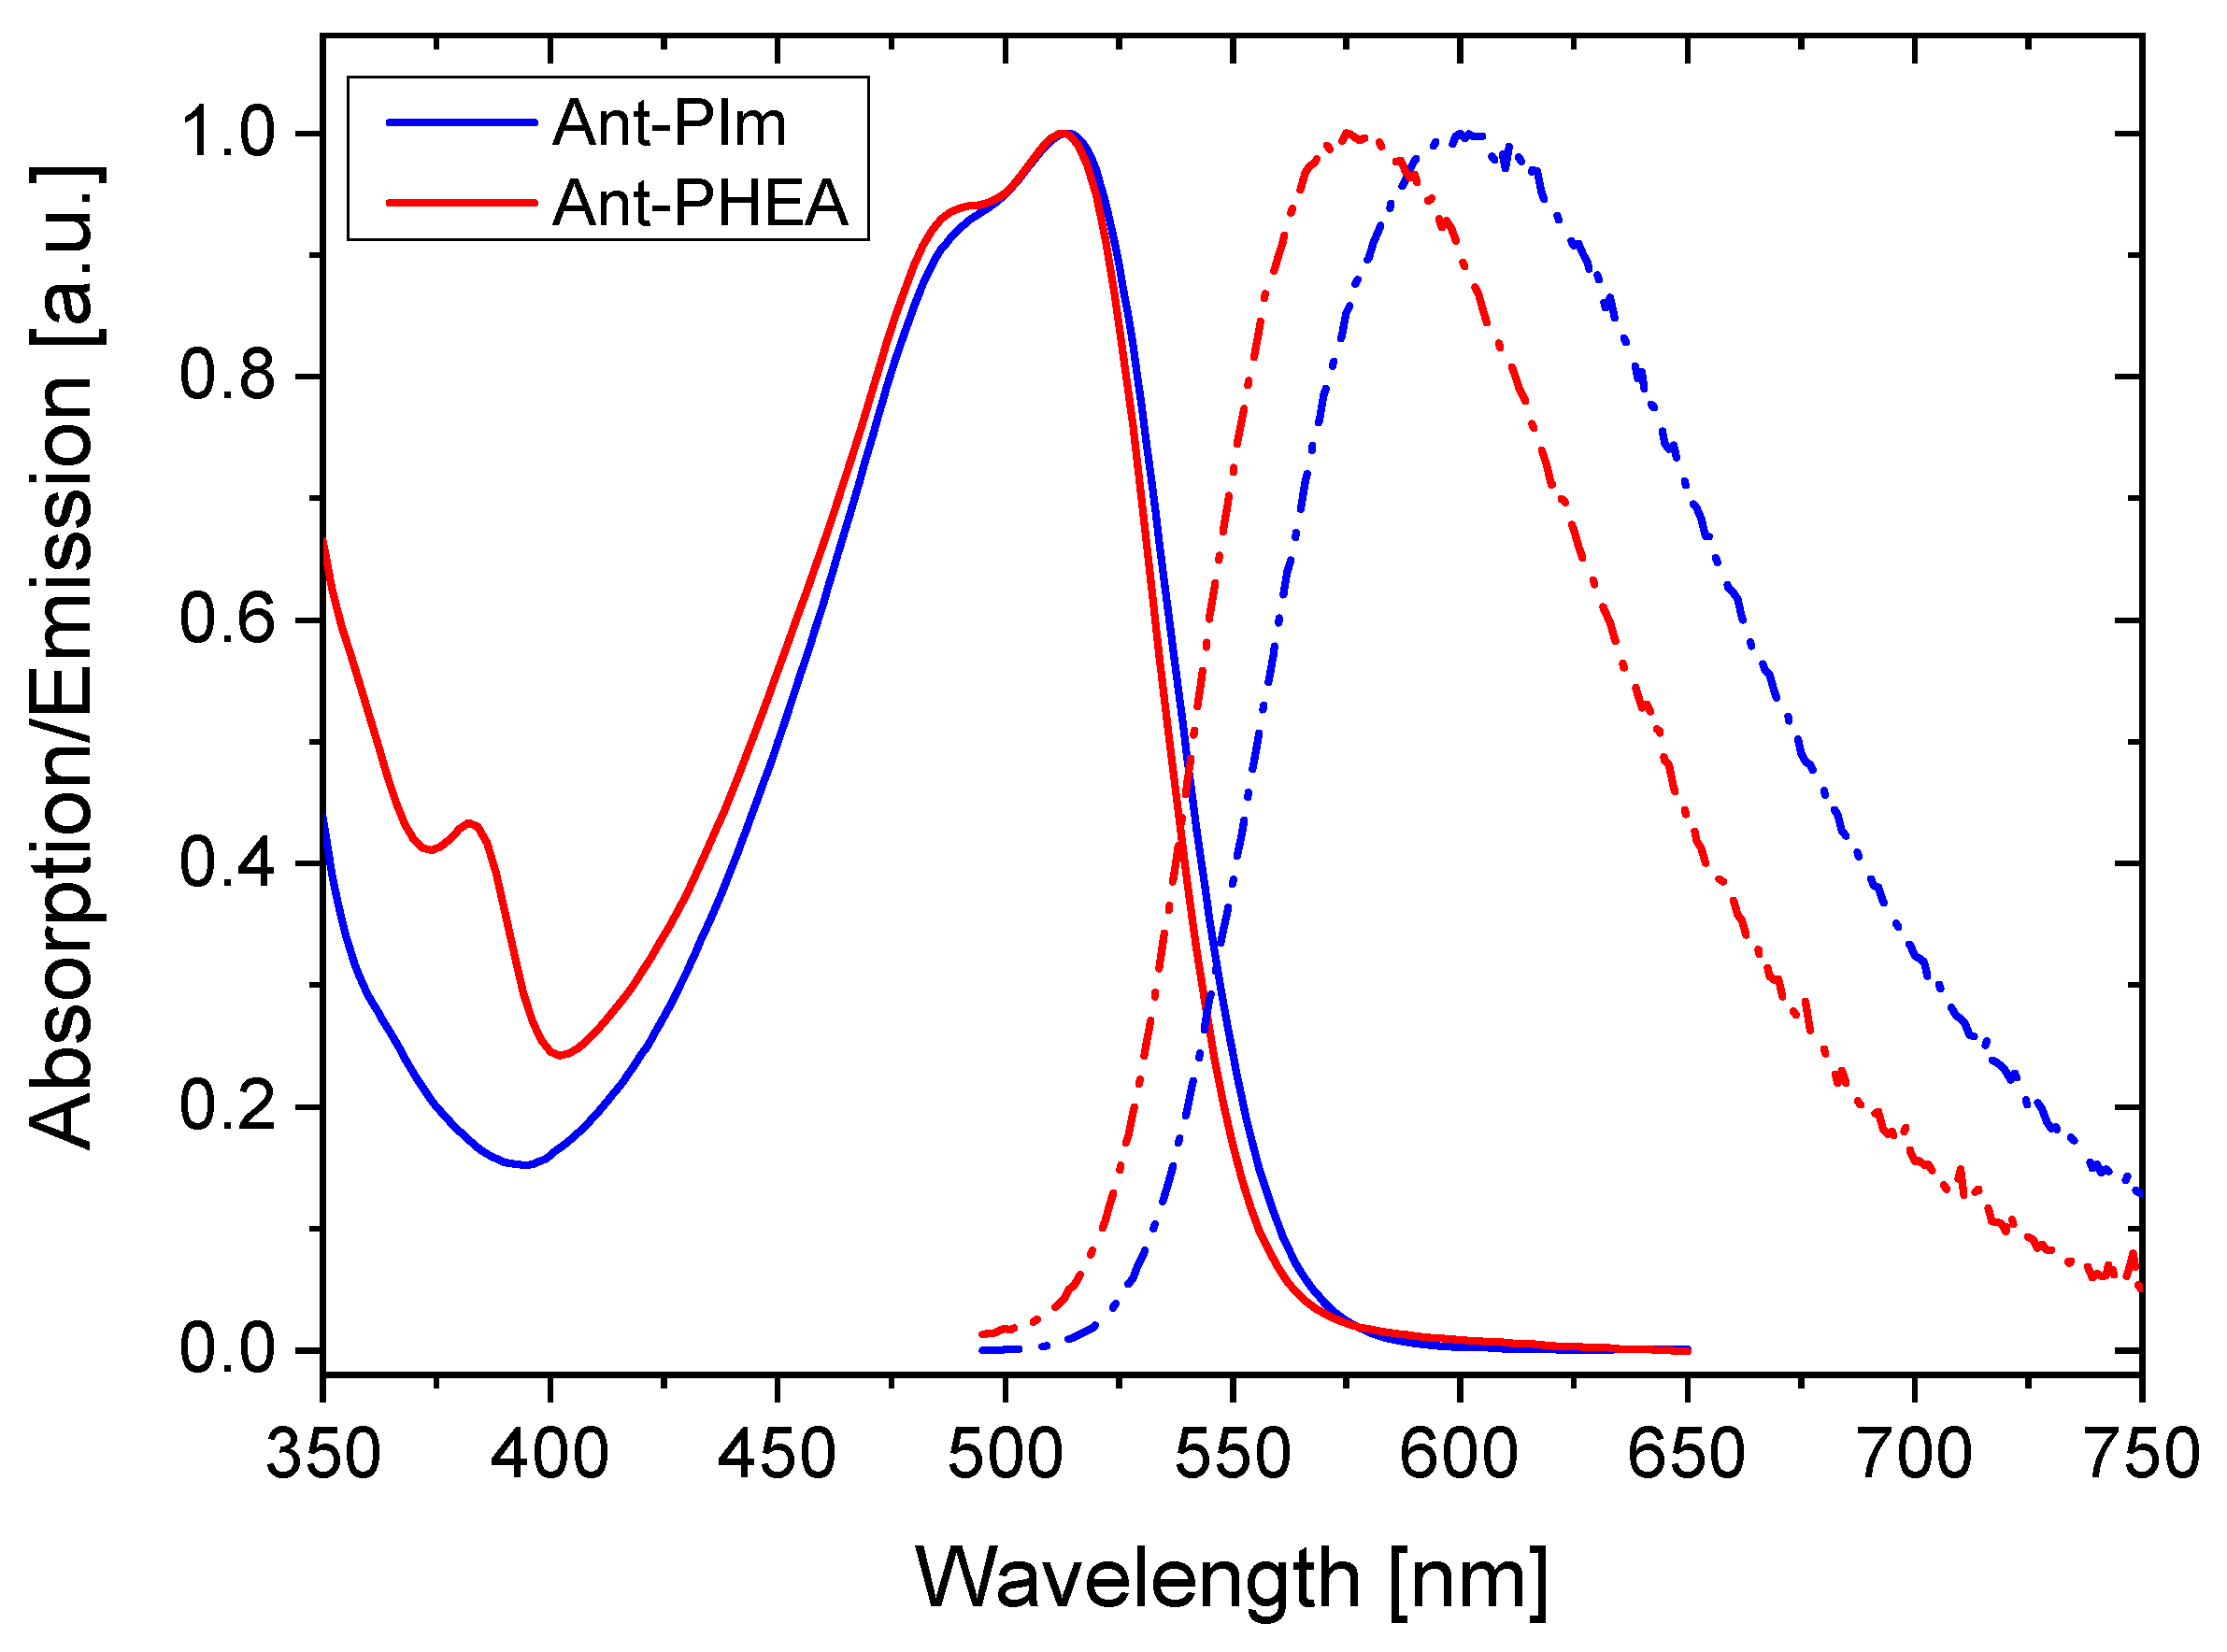
2.1. Spectroscopy
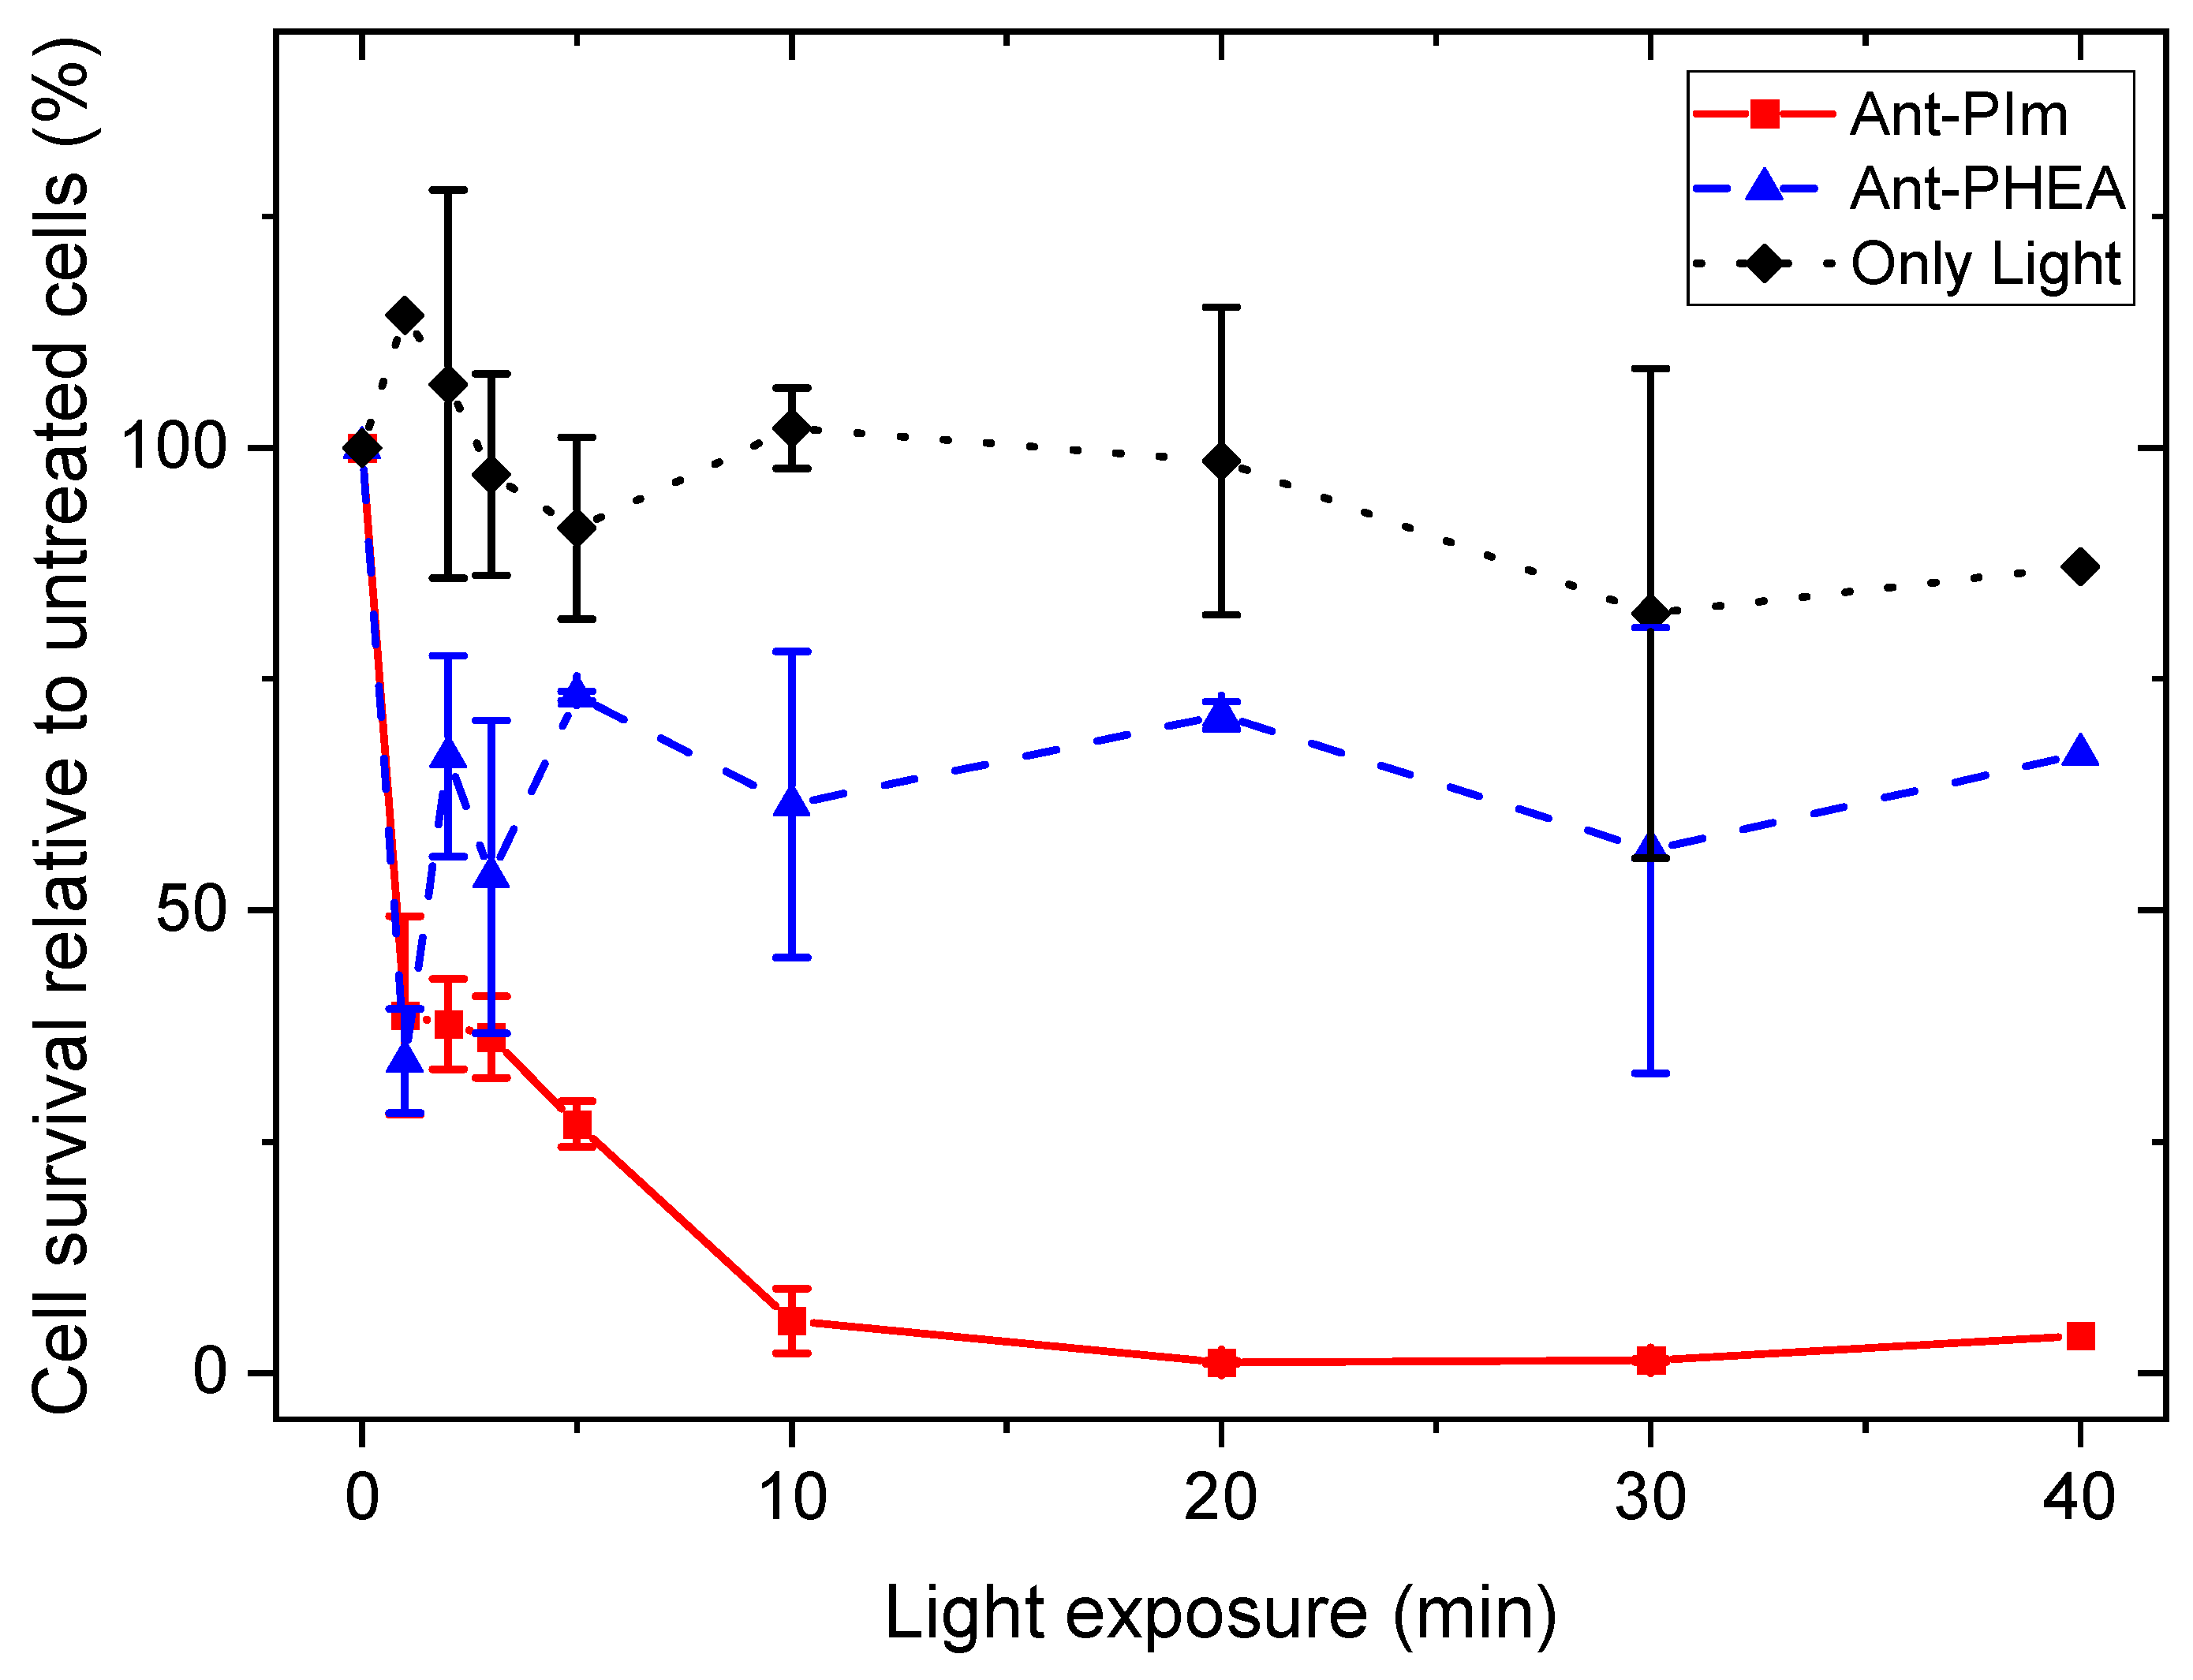
2.2. Toxicity and Phototoxicity
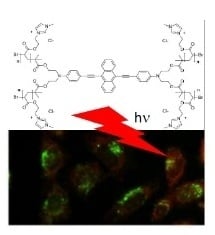
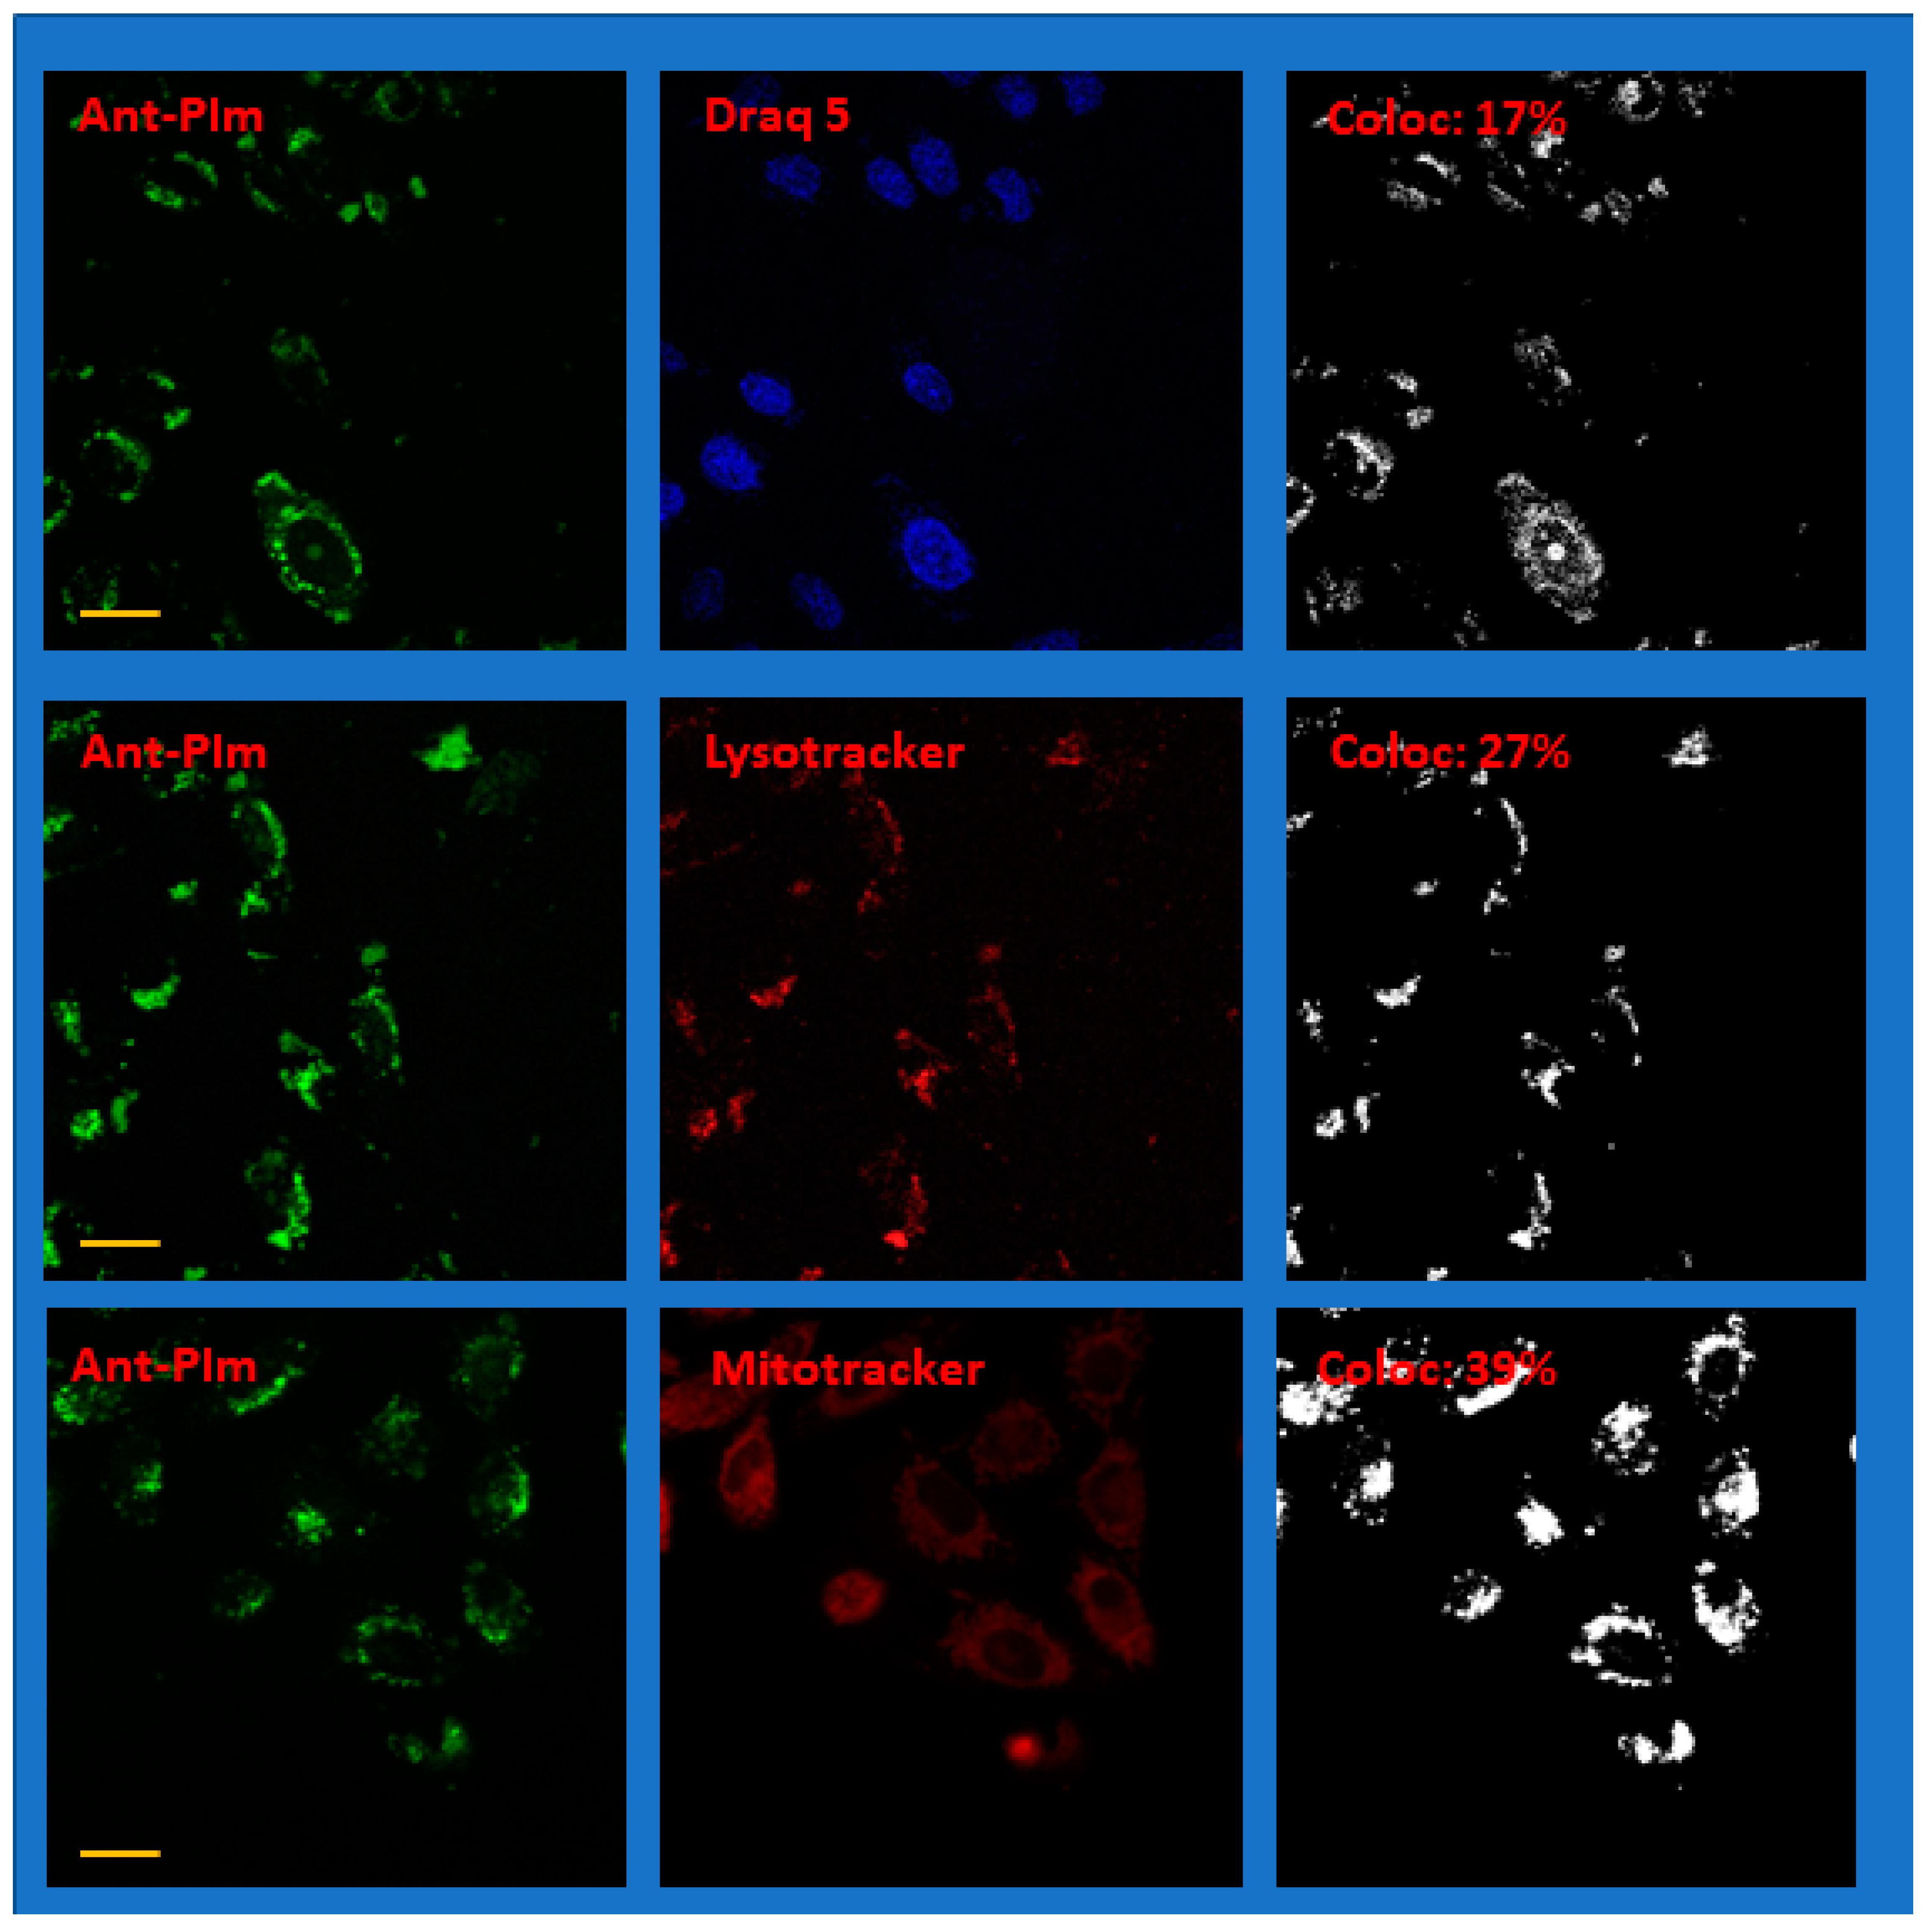
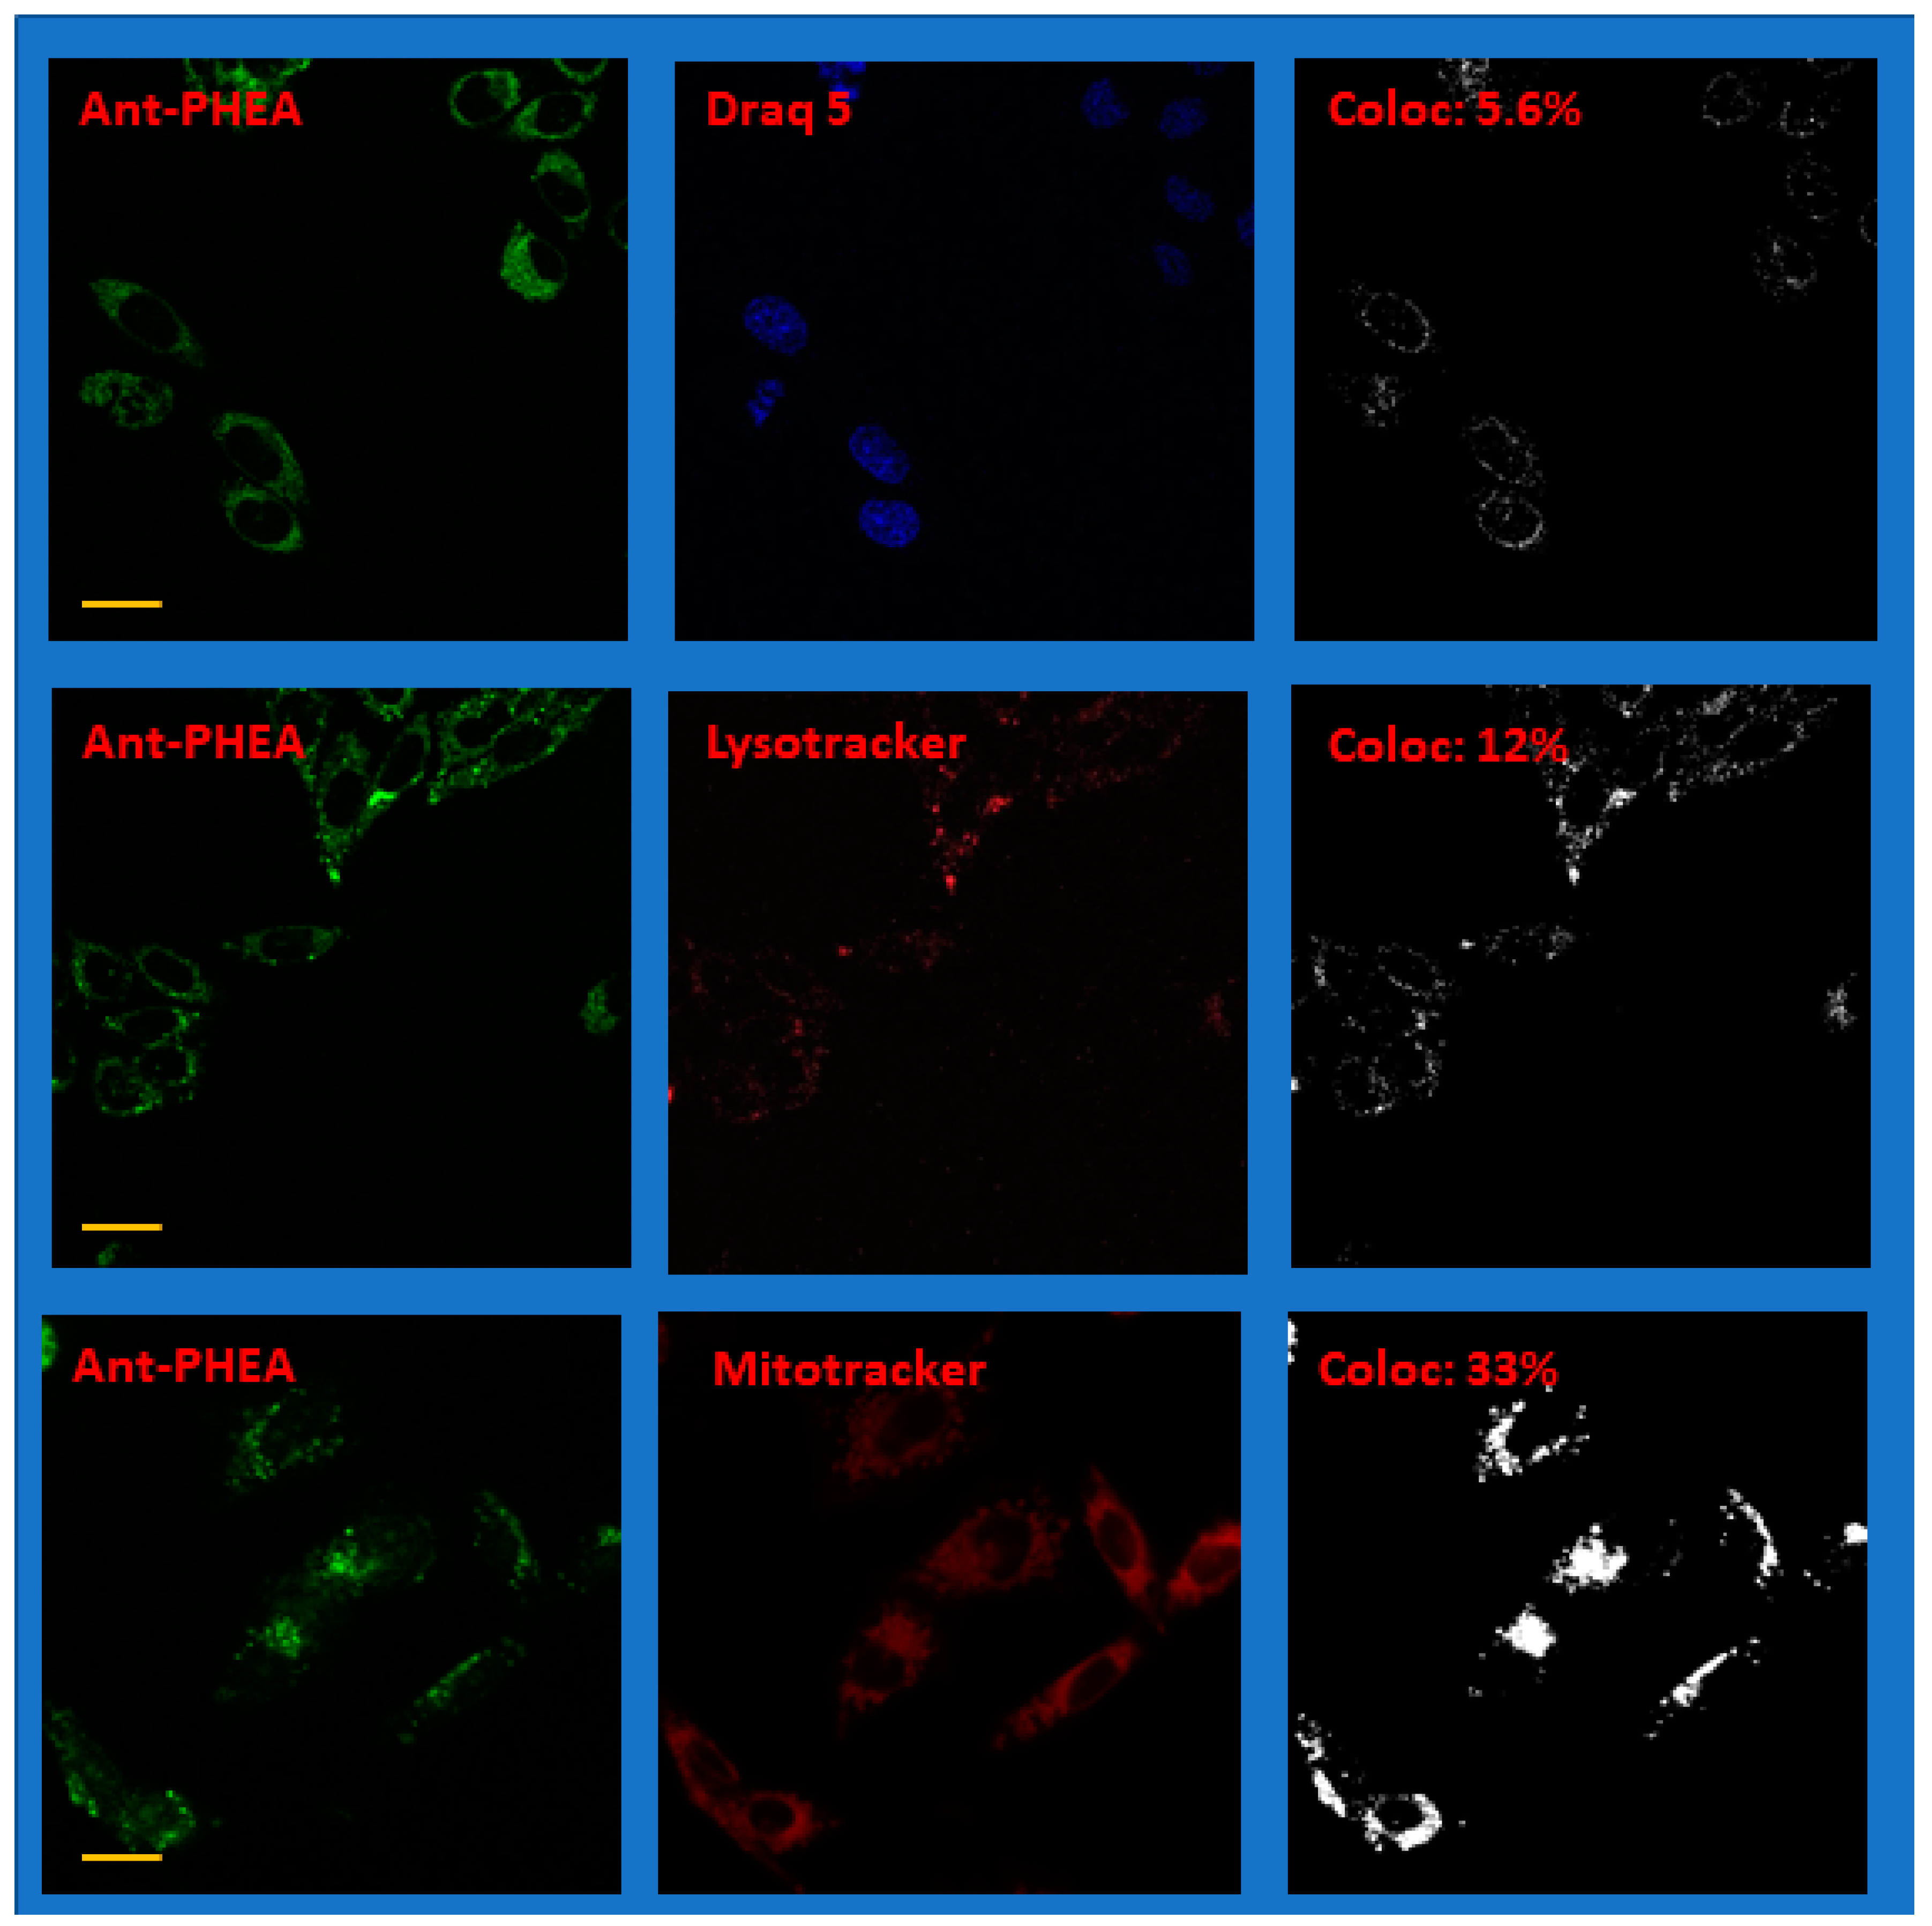
2.3. Localization of Ant-PIm and Ant-PHEA in Cells
3. Discussion
4. Materials and Methods
4.1. Chemicals
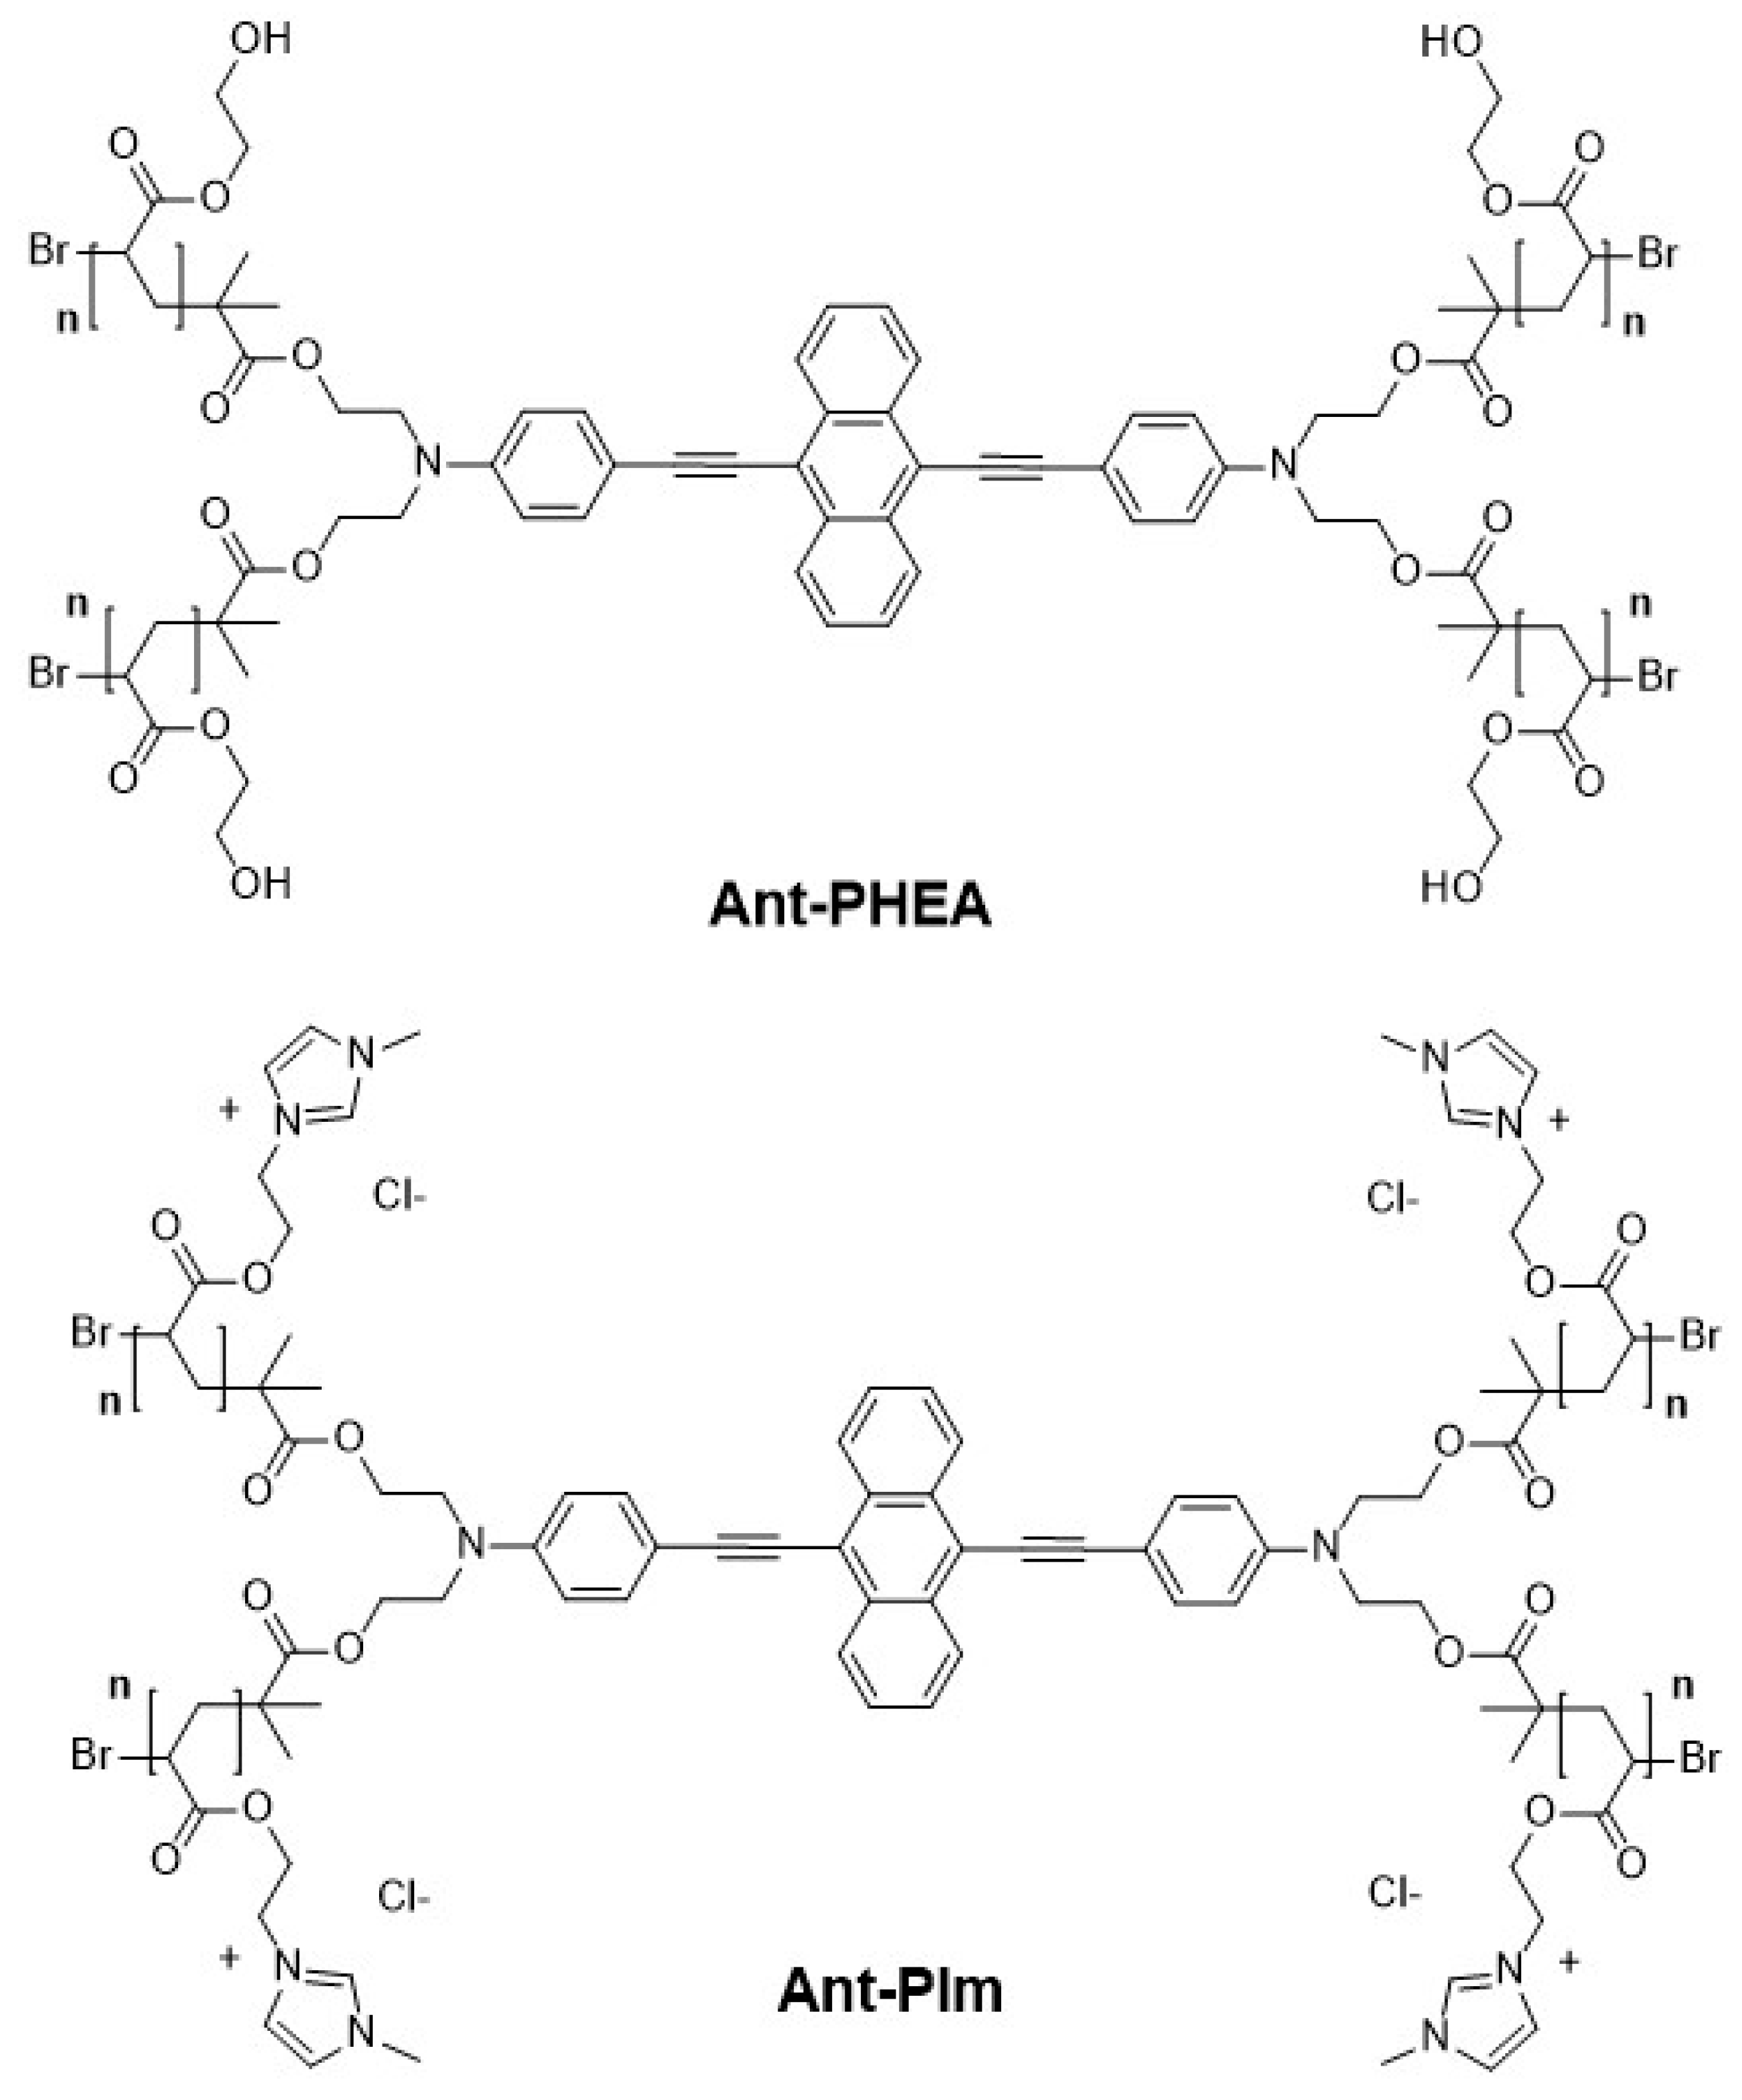
4.2. Chromophores
4.3. Cell Culture
4.4. Optical Spectroscopy
4.5. MTT Assay Cell Survival after Blue Light PDT
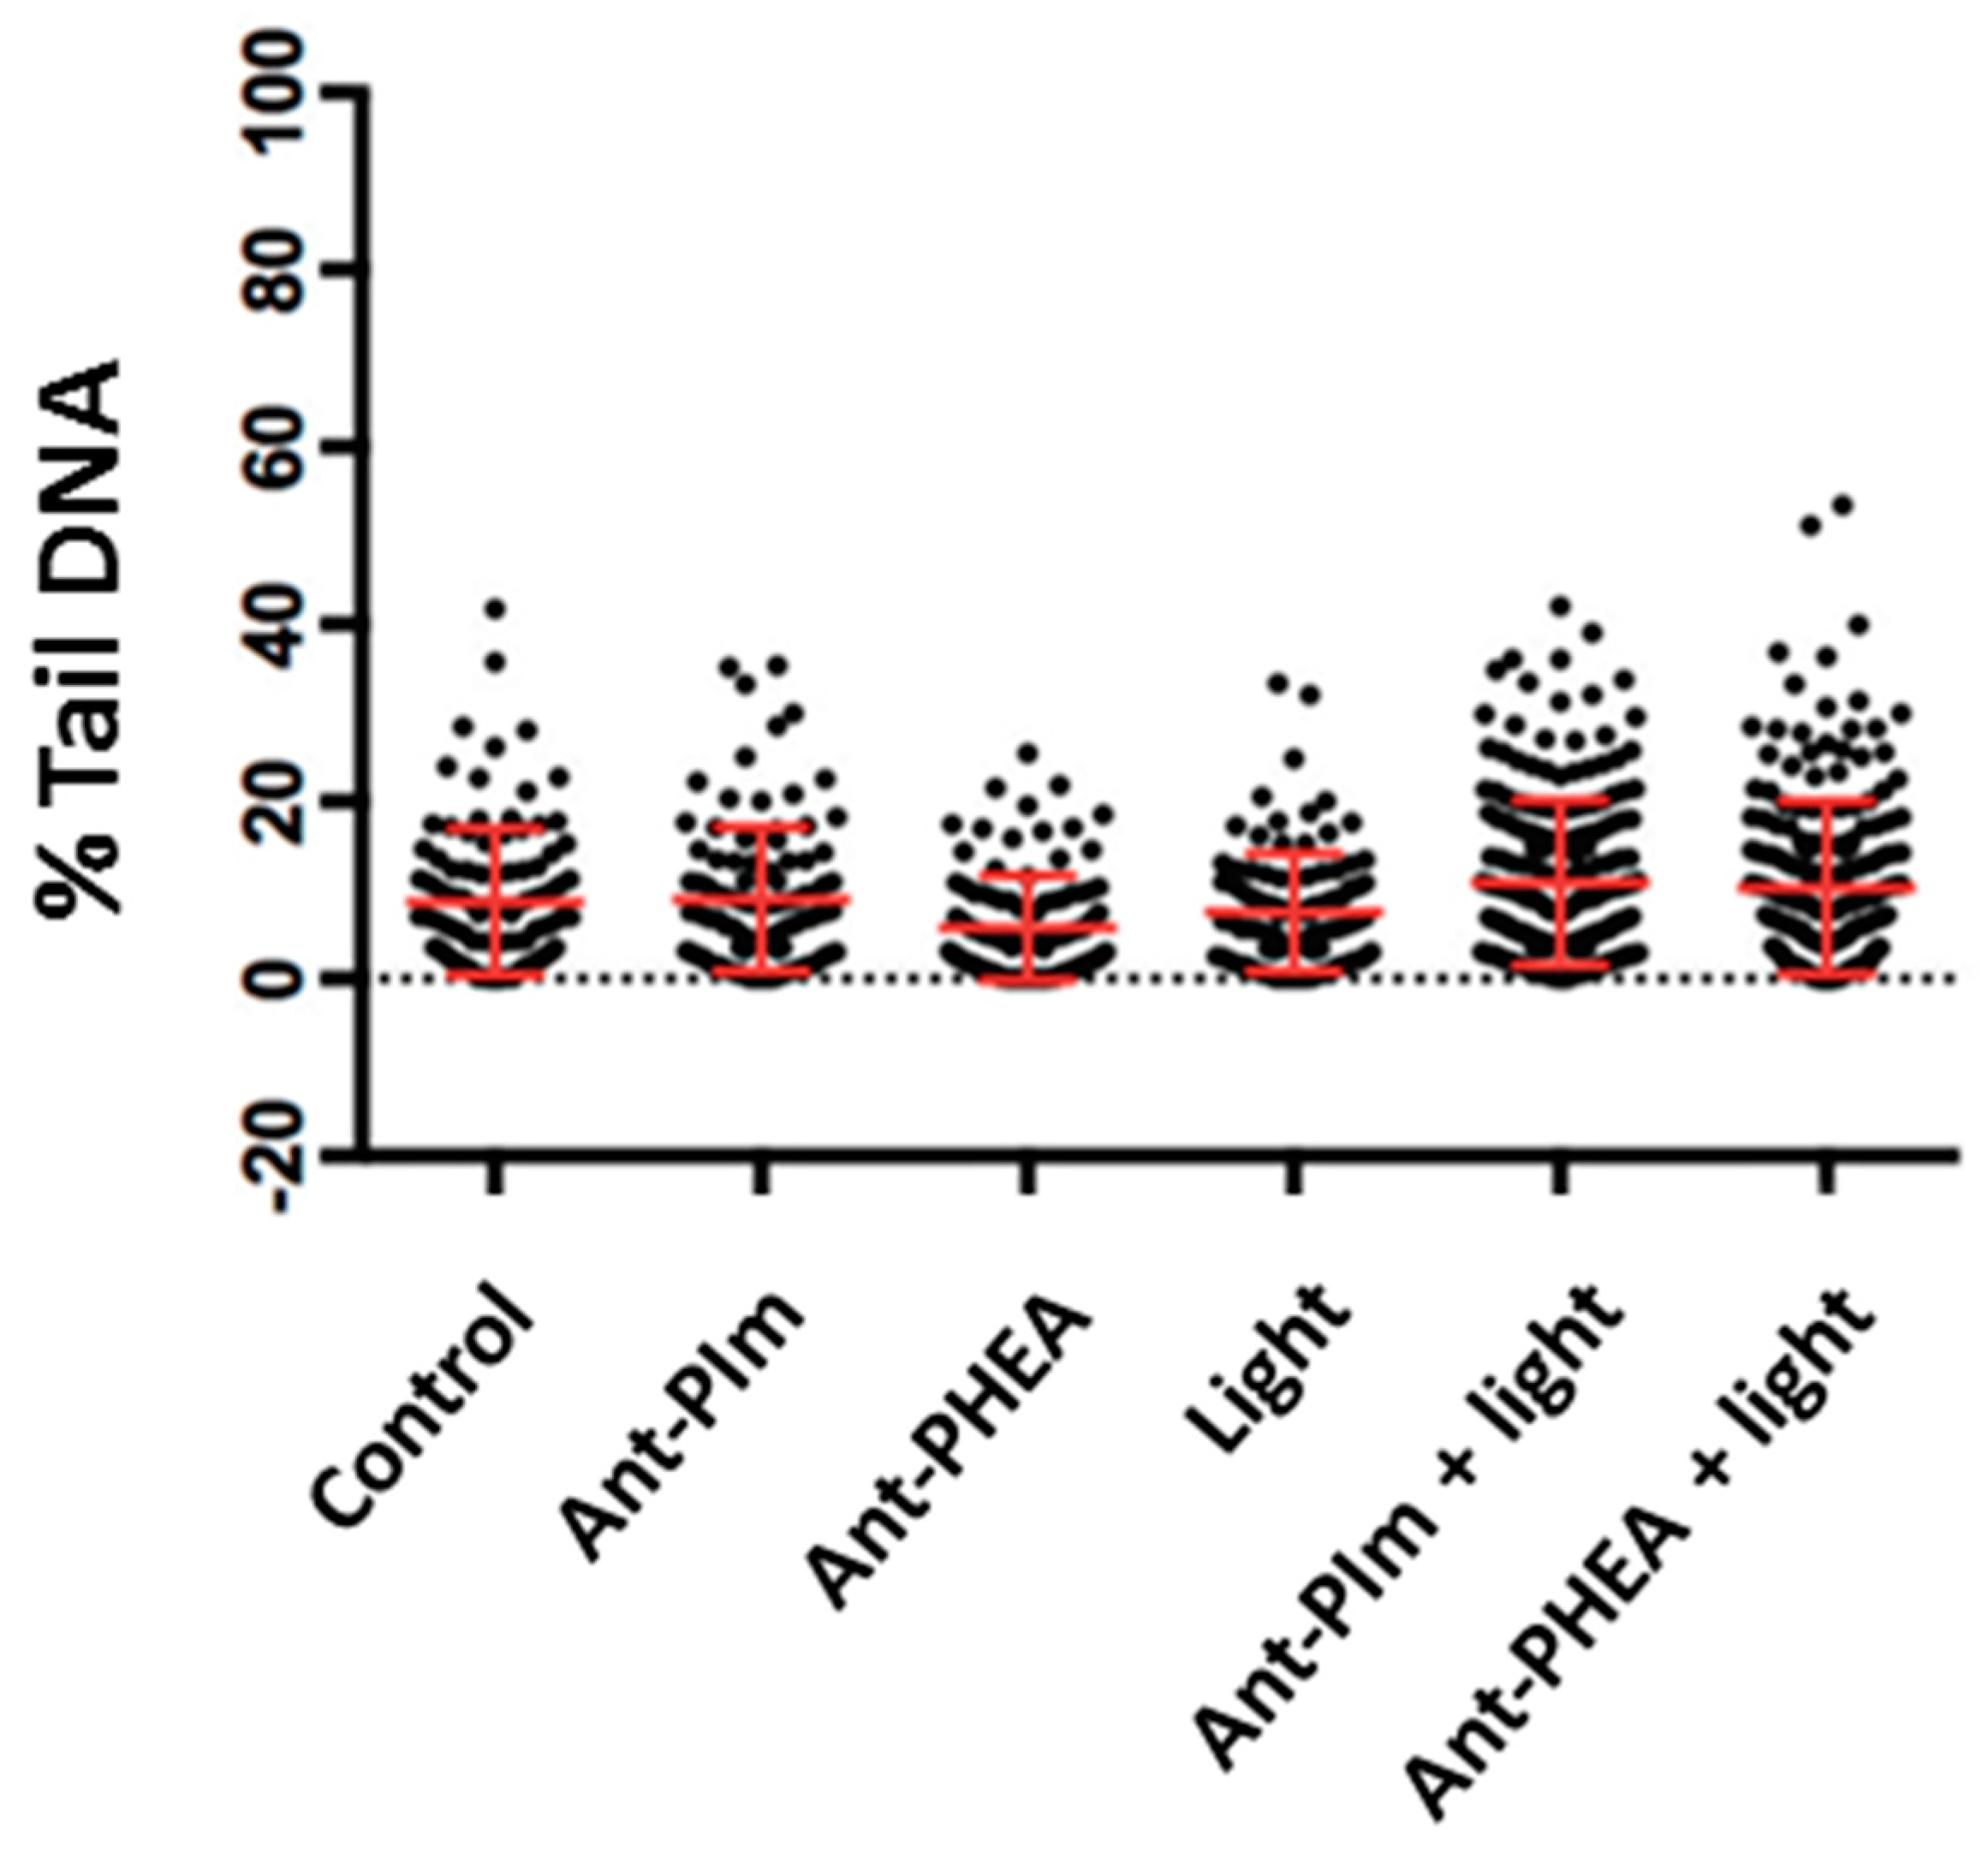
4.6. Comet Assay
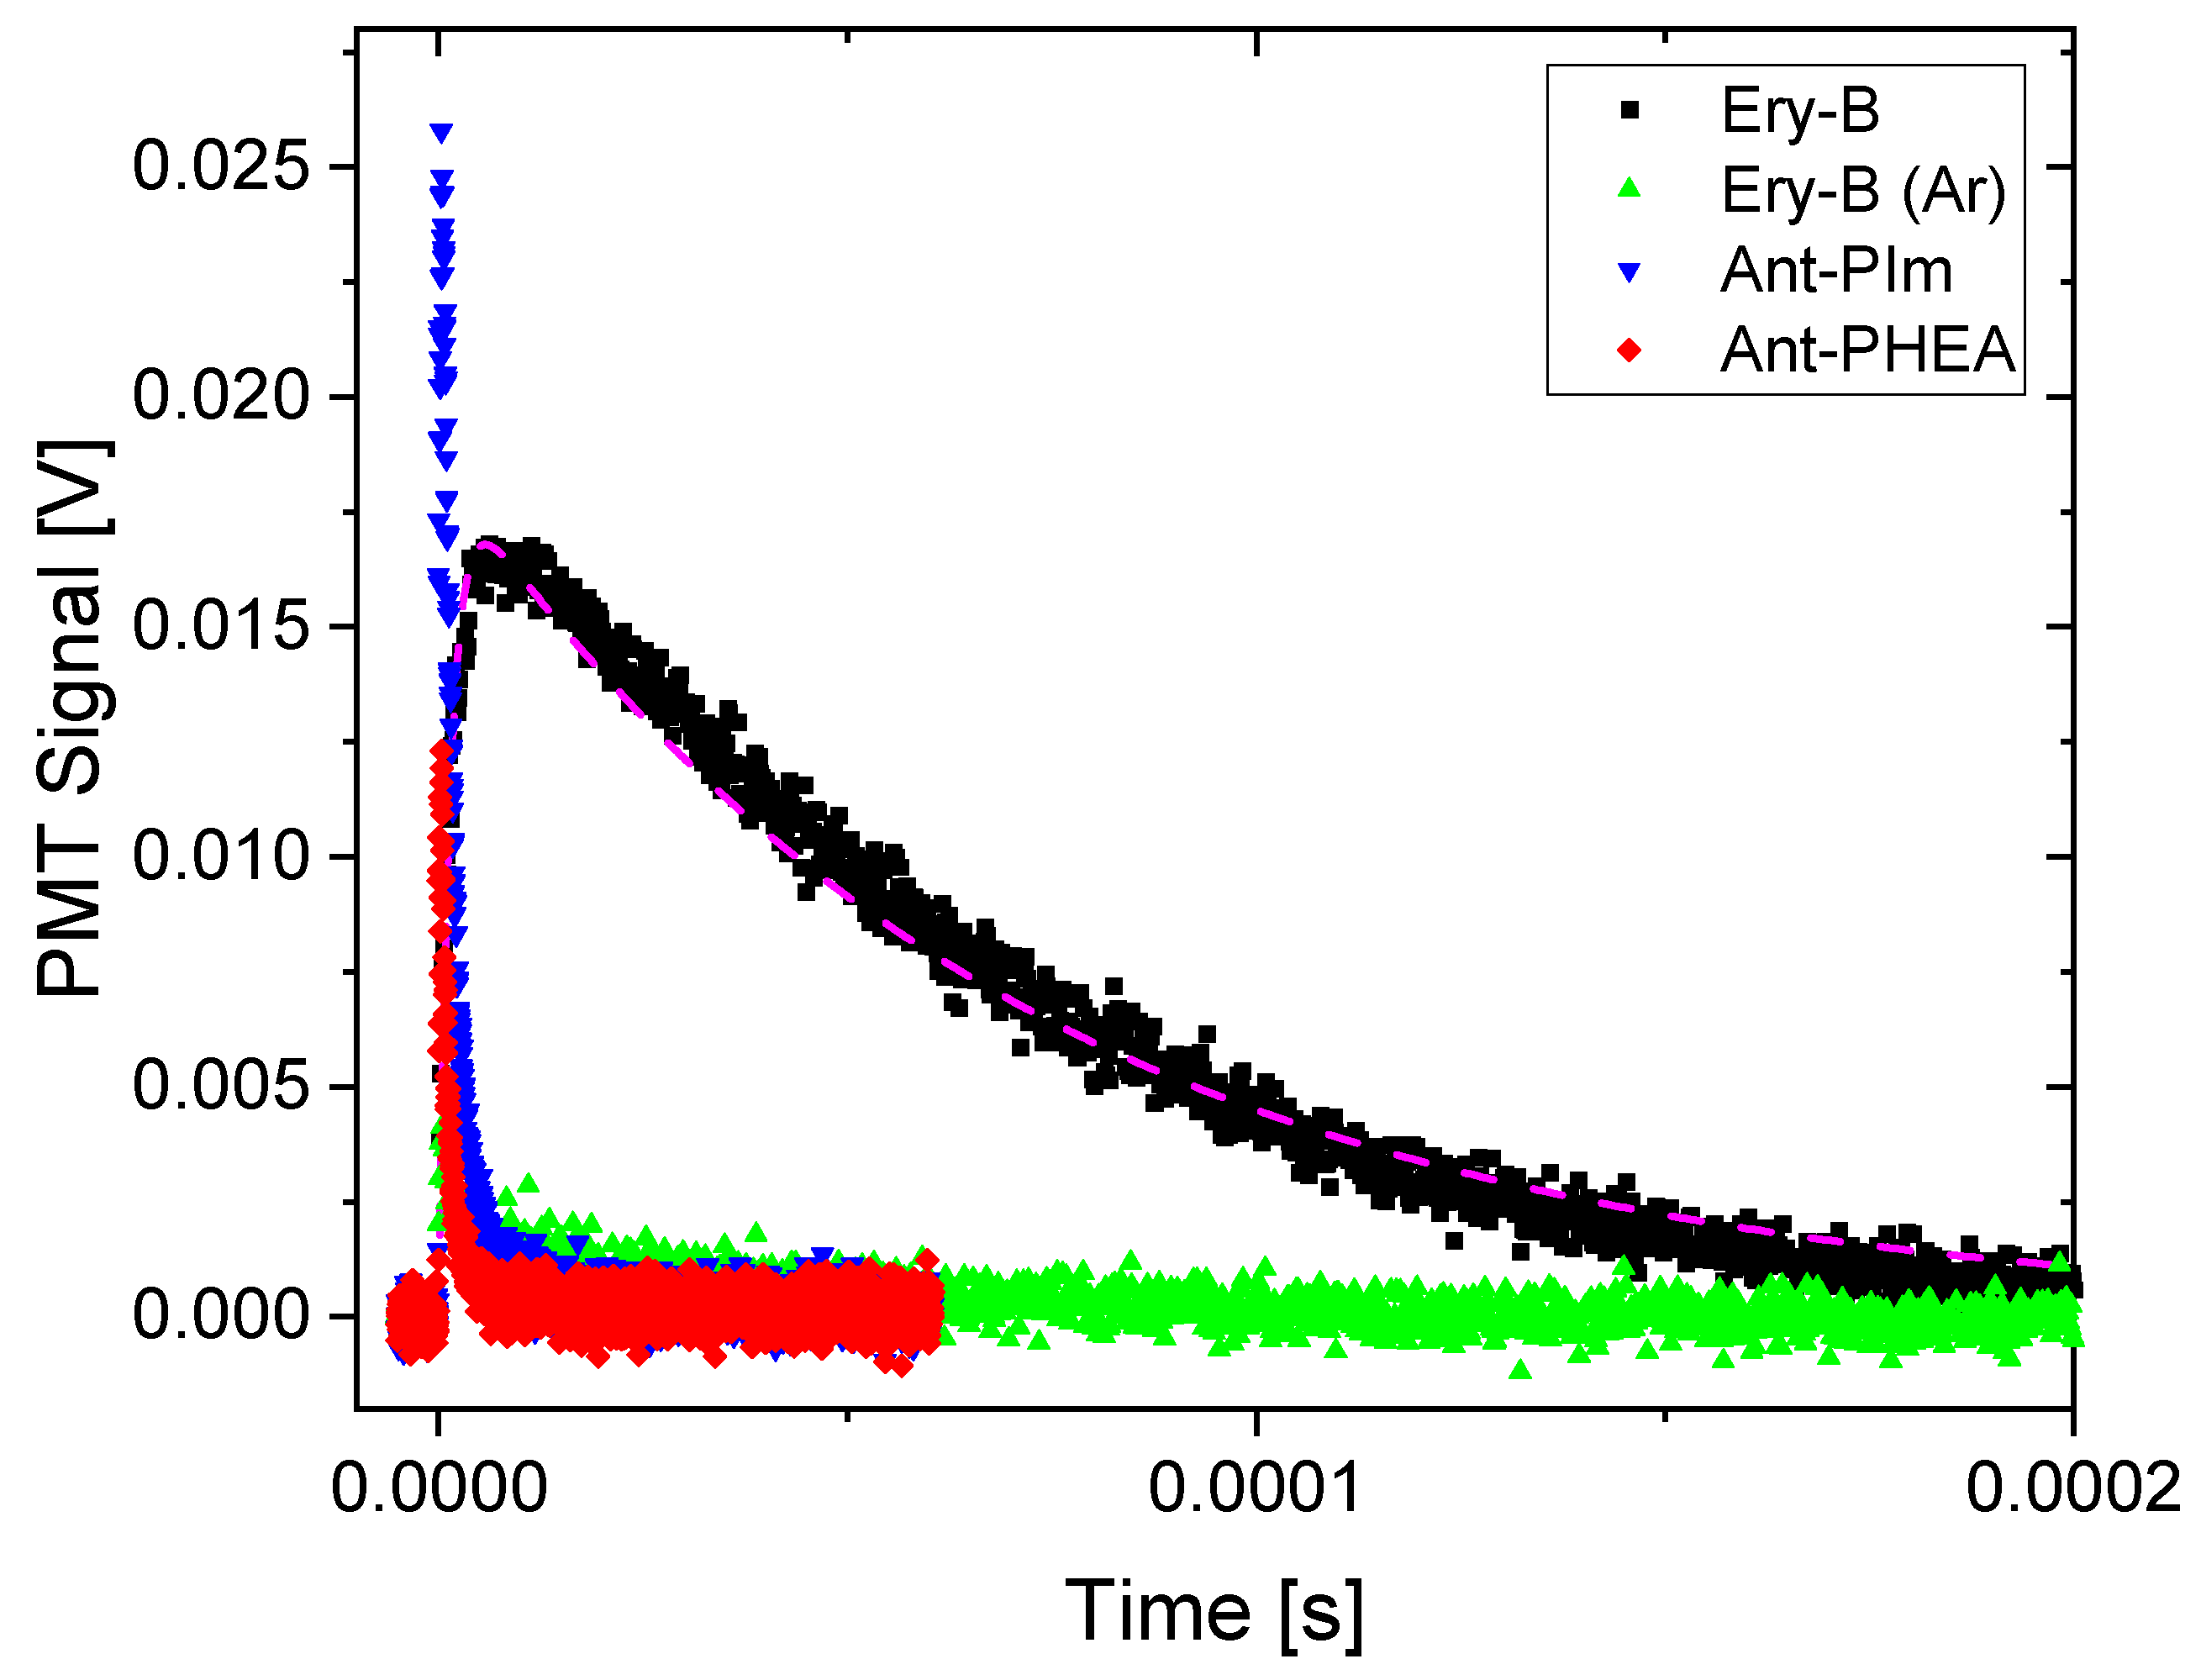
4.7. Singlet Oxygen Detection
4.8. Confocal Microscopy and Colocalization
Supplementary Materials
Author Contributions
Funding
Acknowledgments
Conflicts of Interest
References
- Allison, R.R.; Dowie, G.H.; Cuenca, R.; Hu, X.-H.; Childs, C.J.H.; Sibata, C.H. Photosensitizers in clinical PDT. Photodiagn. Photodyn. Ther. 2004, 1, 27–42. [Google Scholar] [CrossRef]
- Prasad, P.N. Introduction to Biophotonics; John Whiley and Sons: Hoboken, NJ, USA, 2003. [Google Scholar] [CrossRef]
- Petrova, V.; Annicchiarico-Petruzzelli, M.; Melino, G.; Amelio, I. The hypoxic tumour microenvironment. Oncogenesis 2018, 7, 10. [Google Scholar] [CrossRef] [PubMed]
- Wang, K.; Zhang, Z.; Lin, L.; Chen, J.; Hao, K.; Tian, H.; Chen, X. Covalent Organic Nanosheets Integrated Heterojunction with Two Strategies To Overcome Hypoxic-Tumour Photodynamic Therapy. Chem. Mater. 2019, 31, 3313–3323. [Google Scholar] [CrossRef]
- Lv, W.; Zhang, Z.; Zhang, K.Y.; Yang, H.; Liu, S.; Xu, A.; Guo, S.; Zhao, Q.; Huang, W. A Mitochondria-Targeted Photosensitizer Showing Improved Photodynamic Therapy Effects under Hypoxia. Angew. Chem. Int. Ed. 2016, 55, 9947–9951. [Google Scholar] [CrossRef] [PubMed]
- Ramakrishnan, N.; Clay, M.E.; Friedman, L.R.; Antunez, A.R.; Oleinick, N.L. Post-treatment interactions of photodynamic and radiation-induced cytotoxic lesions. Photochem. Photobiol. 1990, 52, 555–559. [Google Scholar] [CrossRef] [PubMed]
- Miller, J.D.; Baron, E.D.; Scull, H.; Hsia, A.; Berlin, J.C.; McCormick, T.; Colussi, V.; Kenney, M.E.; Cooper, K.D.; Oleinick, N.L. Photodynamic therapy with the phthalocyanine photosensitizer Pc 4: The case experience with preclinical mechanistic and early clinical-translational studies. Toxicol. Appl. Pharmacol. 2007, 224, 224–299. [Google Scholar] [CrossRef] [Green Version]
- Hall, E.J.; Giaccia, A.J. Radiobiology for the Radiologist; Wolters Kluwer, Lippincott Williams & Wilkins: Philadelphia, PA, USA, 2012. [Google Scholar]
- Bolsover, S.R.; Hyams, J.S.; Shephard, E.A.; White, H.A.; Wiedemann, C.G. Cell Biology: A Short Course; John Wiley & Sons: Hoboken, NJ, USA, 2004. [Google Scholar]
- Horobin, R.W.; Rashid-Doubell, F.; Pediani, J.D.; Milligan, G. Predicting small molecule fluorescent probe localization in living cells using QSAR modeling. 1. Overview and models for probes of structure, properties and function in single cells. Biotech. Histochem. 2013, 88, 440–460. [Google Scholar] [CrossRef]
- Monnereau, C.; Marotte, S.; Lanoe, P.-H.; Maury, O.; Baldeck, P.L.; Kreher, D.; Favier, A.; Charreyre, M.-T.; Marvel, J.; Leverrier, Y.; et al. Water-soluble chromophores with star-shaped oligomeric arms: Synthesis, spectroscopic studies and first results in bio-imaging and cell death induction. New J. Chem. 2012, 36, 2328–2333. [Google Scholar] [CrossRef]
- Massin, J.; Charaf-Eddin, A.; Appaix, F.; Bretonniere, Y.; Jacquemin, D.; van der Sanden, B.; Monnereau, C.; Andraud, C. A water soluble probe with near infrared two-photon absorption and polarity-induced fluorescence for cerebral vascular imaging. Chem. Sci. 2013, 4, 2833–2843. [Google Scholar] [CrossRef] [Green Version]
- Deiana, M.; Mettra, B.; Matczyszyn, K.; Piela, K.; Pitrat, D.; Olesiak-Banska, J.; Monnereau, C.; Andraud, C.; Samoc, M. Interactions of a biocompatible water-soluble anthracenyl polymer derivative with double-stranded DNA. Phys. Chem. Chem. Phys. 2015, 17, 30318–30327. [Google Scholar] [CrossRef]
- Hong, S.; Leroueil, P.R.; Janus, E.K.; Peters, J.L.; Kober, M.-M.; Islam, M.T.; Orr, B.G.; Baker, J.R., Jr.; Banaszak Holl, M.M. Interaction of Polycationic Polymers with Supported Lipid Bilayers and Cells: Nanoscale Hole Formation and Enhanced Membrane Permeability. Bioconjug. Chem. 2006, 17, 728–734. [Google Scholar] [CrossRef] [PubMed]
- Thomas, M.; Klibanov, A.M. Non-viral gene therapy: Polycation-mediated DNA delivery. Appl. Microbiol. Biotechnol. 2003, 62, 27–34. [Google Scholar] [CrossRef] [PubMed]
- Dickinson, B.C.; Chang, C.J. A Targetable Fluorescent Probe for Imaging Hydrogen Peroxide in the Mitochondria of Living Cells. J. Am. Chem. Soc. 2008, 130, 9638–9639. [Google Scholar] [CrossRef] [PubMed] [Green Version]
- Chyan, W.; Zhang, D.Y.; Lippard, S.J.; Radford, R.J. Reaction-based fluorescent sensor for investigating mobile Zn2+ in mitochondria of healthy versus cancerous prostate cells. Proc. Natl. Acad. Sci. USA 2014, 111, 143–148. [Google Scholar] [CrossRef] [PubMed] [Green Version]
- Lu, Y.-J.; Yan, S.-C.; Chan, F.-Y.; Zou, L.; Chung, W.-H.; Wong, W.-L.; Qiu, B.; Sun, N.; Chan, P.-H.; Huang, Z.-S.; et al. Benzothiazole-substituted benzofuroquinolinium dye: A selective switch-on fluorescent probe for G-quadruplex. Chem. Commun. 2011, 47, 4971–4973. [Google Scholar] [CrossRef] [PubMed] [Green Version]
- Pitter, D.R.G.; Brown, A.S.; Baker, J.D.; Wilson, J.N. One probe, two-channel imaging of nuclear and cytosolic compartments with orange and red emissive dyes. Org. Biomol. Chem. 2015, 13, 9477–9484. [Google Scholar] [CrossRef] [PubMed]
- Appukuttan, V.K.; Dupont, A.; Denis-Quanquin, S.; Andraud, C.; Monnereau, C. Mild and efficient bromination of poly(hydroxyethyl acrylate) and its use towards ionic-liquid containing polymers. Polym. Chem. 2012, 3, 2723–2726. [Google Scholar] [CrossRef]
- Deiana, M.; Mettra, B.; Matczyszyn, K.; Pitrat, D.; Olesiak-Banska, J.; Monnereau, C.; Andraud, C.; Samoc, M. Unravelling the Binding Mechanism of a Poly(cationic) Anthracenyl Fluorescent Probe with High Affinity toward Double-Stranded DNA. Biomacromolecules 2016, 17, 3609–3618. [Google Scholar] [CrossRef]
- Yang, Y.; Cai, Z.; Huang, Z.; Tang, X.; Zhang, X. Antimicrobial cationic polymers: From structural design to functional control. Polym. J. 2018, 50, 33–44. [Google Scholar] [CrossRef]
- Singh-Rachford, T.N.; Castellano, F.M. Photon upconversion based on sensitized triplet–triplet annihilation. Coord. Chem. Rev. 2010, 254, 2560–2573. [Google Scholar] [CrossRef]
- Chennoufi, R.; Bougherara, H.; Gagey-Eilstein, N.; Dumat, B.; Henry, E.; Subra, F.; Mahuteau-Betzer, F.; Tauc, P.; Teulade-Fichou, M.-P.; Deprez, E. Differential behaviour of cationic triphenylamine derivatives in fixed and living cells: Triggering and imaging cell death. Chem. Commun. 2015, 51, 14881–14884. [Google Scholar] [CrossRef] [PubMed]
- DeRosa, M.C.; Crutchley, R.J. Photosensitized singlet oxygen and its applications. Coord. Chem. Rev. 2002, 233, 351–371. [Google Scholar] [CrossRef]
- Snyder, J.W.; Skovsen, E.; Lambert, J.D.C.; Poulsen, L.; Ogilby, P.R. Singlet Oxygen Microscopy in Single Cells. Phys. Chem. Chem. Phys. 2006, 8, 4280–4293. [Google Scholar] [CrossRef] [PubMed]
- Ogilby, P.R. Singlet oxygen: There is indeed something new under the sun. Chem. Soc. Rev. 2010, 39, 3181–3229. [Google Scholar] [CrossRef] [PubMed]
- Bogoeva, V.; Siksjø, M.; Sæterbø, K.G.; Melø, T.B.; Bjørkøy, A.; Lindgren, M.; Gederaas, O.A. Ruthenium porphyrin-induced photodamage in bladder cancer cells. Photodiagn. Photodyn. Ther. 2016, 14, 9–17. [Google Scholar] [CrossRef] [PubMed]
- Gederaas, O.A.; Lagerberg, J.M.W.; Brekke, O.-L.; Berg, K.; Dubbelman, T.M.A.R. 5-Aminolevulinic acid induced lipid peroxidation after light exposure on human colon carcinoma cells and effects of α-tocopherol treatment. Cancer Lett. 2000, 159, 23–32. [Google Scholar] [CrossRef]
- Collins, A.R. The comet assay for DNA damage and repair: Principles, applications, and limitations. Mol. Biotechnol. 2014, 26, 249–261. [Google Scholar] [CrossRef]
- Gederaas, O.A.; Johnsson, A.; Berg, K.; Manandhar, R.; Shrestha, C.; Skåre, D.; Ekroll, D.I.K.; Høgset, A.; Hjelde, A. Photochemical internalization in bladder cancer—Development of an orthotopic in vivo model. J. Photochem. Photobiol. Sci. 2017, 16, 1664–1676. [Google Scholar] [CrossRef]
- Deiana, M.; Mettra, B.; Martinez-Fernandez, L.; Mazur, L.M.; Pawlik, K.; Andraud, C.; Samoc, M.; Improta, R.; Monnereau, C.; Matczyszyn, K. Specific Recognition of G-Quadruplexes Over Duplex-DNA by a Macromolecular NIR Two-Photon Fluorescent Probe. J. Phys. Chem. Lett. 2017, 8, 5915–5920. [Google Scholar] [CrossRef]
- Kujoth, G.C.; Hiona, A.; Pugh, T.D.; Someya, S.; Panzer, K.; Wohlgemuth, S.E.; Hofer, T.; Seo, A.Y.; Sullivan, R.; Jobling, W.A.; et al. Mitochondrial DNA mutations, oxidative stress, and apoptosis in mammalian aging. Science 2005, 309, 481–484. [Google Scholar] [CrossRef]
- Ott, M.; Gogvadze, V.; Orrenius, S.; Zhivotovsky, B. Mitochondria, oxidative stress and cell death. Apoptosis 2007, 12, 913–922. [Google Scholar] [CrossRef] [PubMed]
- Pasquali, R.C.; Taurozzi, M.P.; Bregni, C. Some considerations about the hydrophilic-lipophilic balance system. Int. J. Pharm. 2008, 356, 44–51. [Google Scholar] [CrossRef] [PubMed]
- Tice, R.R.; Agurell, E.; Anderson, D.; Burlinson, B.; Hartmann, A.; Kobayashi, H.; Miyamae, Y.; Rojas, E.; Ryu, J.-C.; Sasaki, A.F. Single cell gel/comet assay: Guidelines for in vitro and in vivo genetic toxicology testing. Environ. Mol. Mutagenesis 2000, 35, 206–221. [Google Scholar] [CrossRef]
- Baglo, Y.; Hagen, L.; Høgset, A.; Drabløs, F.; Otterlei, M.; Gederaas, O.A. Enhanced Efficacy of Bleomycin in Bladder Cancer Cells by Photochemical Internalization. Biomed Res. Int. 2014, 2014, 921296. [Google Scholar] [CrossRef] [PubMed]
- Chatzisideri, T.; Thysiadis, S.; Katsamakas, S.; Dalezis, P.; Sigala, I.; Lazarides, T.; Nikolakaki, E.; Trafalis, D.; Gederaas, O.A.; Lindgren, M.; et al. Synthesis and biological evaluation of a Platinum(II)-c(RGDyK) conjugate for integrin-targeted photodynamic therapy. Eur. J. Med. Chem. 2017, 141, 221–231. [Google Scholar] [CrossRef]
Sample Availability: Not available. |


| Chromophore | Stain | Cf (%) | SD (%), N Samples |
|---|---|---|---|
| Ant-PIm | DRAQ 5 | 13 | 4.6 (N = 6) |
| Lysotracker | 26 | 3.9 (N = 6) | |
| Mitotracker Deep Red | 29 | 6.6 (N = 10) | |
| Ant-PHEA | DRAQ 5 | 5.0 | 1.6 (N = 6) |
| Lysotracker | 7.9 | 3.5 (N = 6) | |
| Mitotracker Deep Red | 25 | 9.5 (N = 4) |
© 2020 by the authors. Licensee MDPI, Basel, Switzerland. This article is an open access article distributed under the terms and conditions of the Creative Commons Attribution (CC BY) license (http://creativecommons.org/licenses/by/4.0/).
Share and Cite
Lindgren, M.; Gederaas, O.A.; Siksjø, M.; Hansen, T.A.; Chen, L.; Mettra, B.; Andraud, C.; Monnereau, C. Influence of Polymer Charge on the Localization and Dark- and Photo-Induced Toxicity of a Potential Type I Photosensitizer in Cancer Cell Models. Molecules 2020, 25, 1127. https://doi.org/10.3390/molecules25051127
Lindgren M, Gederaas OA, Siksjø M, Hansen TA, Chen L, Mettra B, Andraud C, Monnereau C. Influence of Polymer Charge on the Localization and Dark- and Photo-Induced Toxicity of a Potential Type I Photosensitizer in Cancer Cell Models. Molecules. 2020; 25(5):1127. https://doi.org/10.3390/molecules25051127
Chicago/Turabian StyleLindgren, Mikael, Odrun A. Gederaas, Monica Siksjø, Tom A. Hansen, Lena Chen, Bastien Mettra, Chantal Andraud, and Cyrille Monnereau. 2020. "Influence of Polymer Charge on the Localization and Dark- and Photo-Induced Toxicity of a Potential Type I Photosensitizer in Cancer Cell Models" Molecules 25, no. 5: 1127. https://doi.org/10.3390/molecules25051127