Antagonistic Effects of CAPE (a Component of Propolis) on the Cytotoxicity and Genotoxicity of Irinotecan and SN38 in Human Gastrointestinal Cancer Cells In Vitro


Abstract
:1. Introduction
2. Results
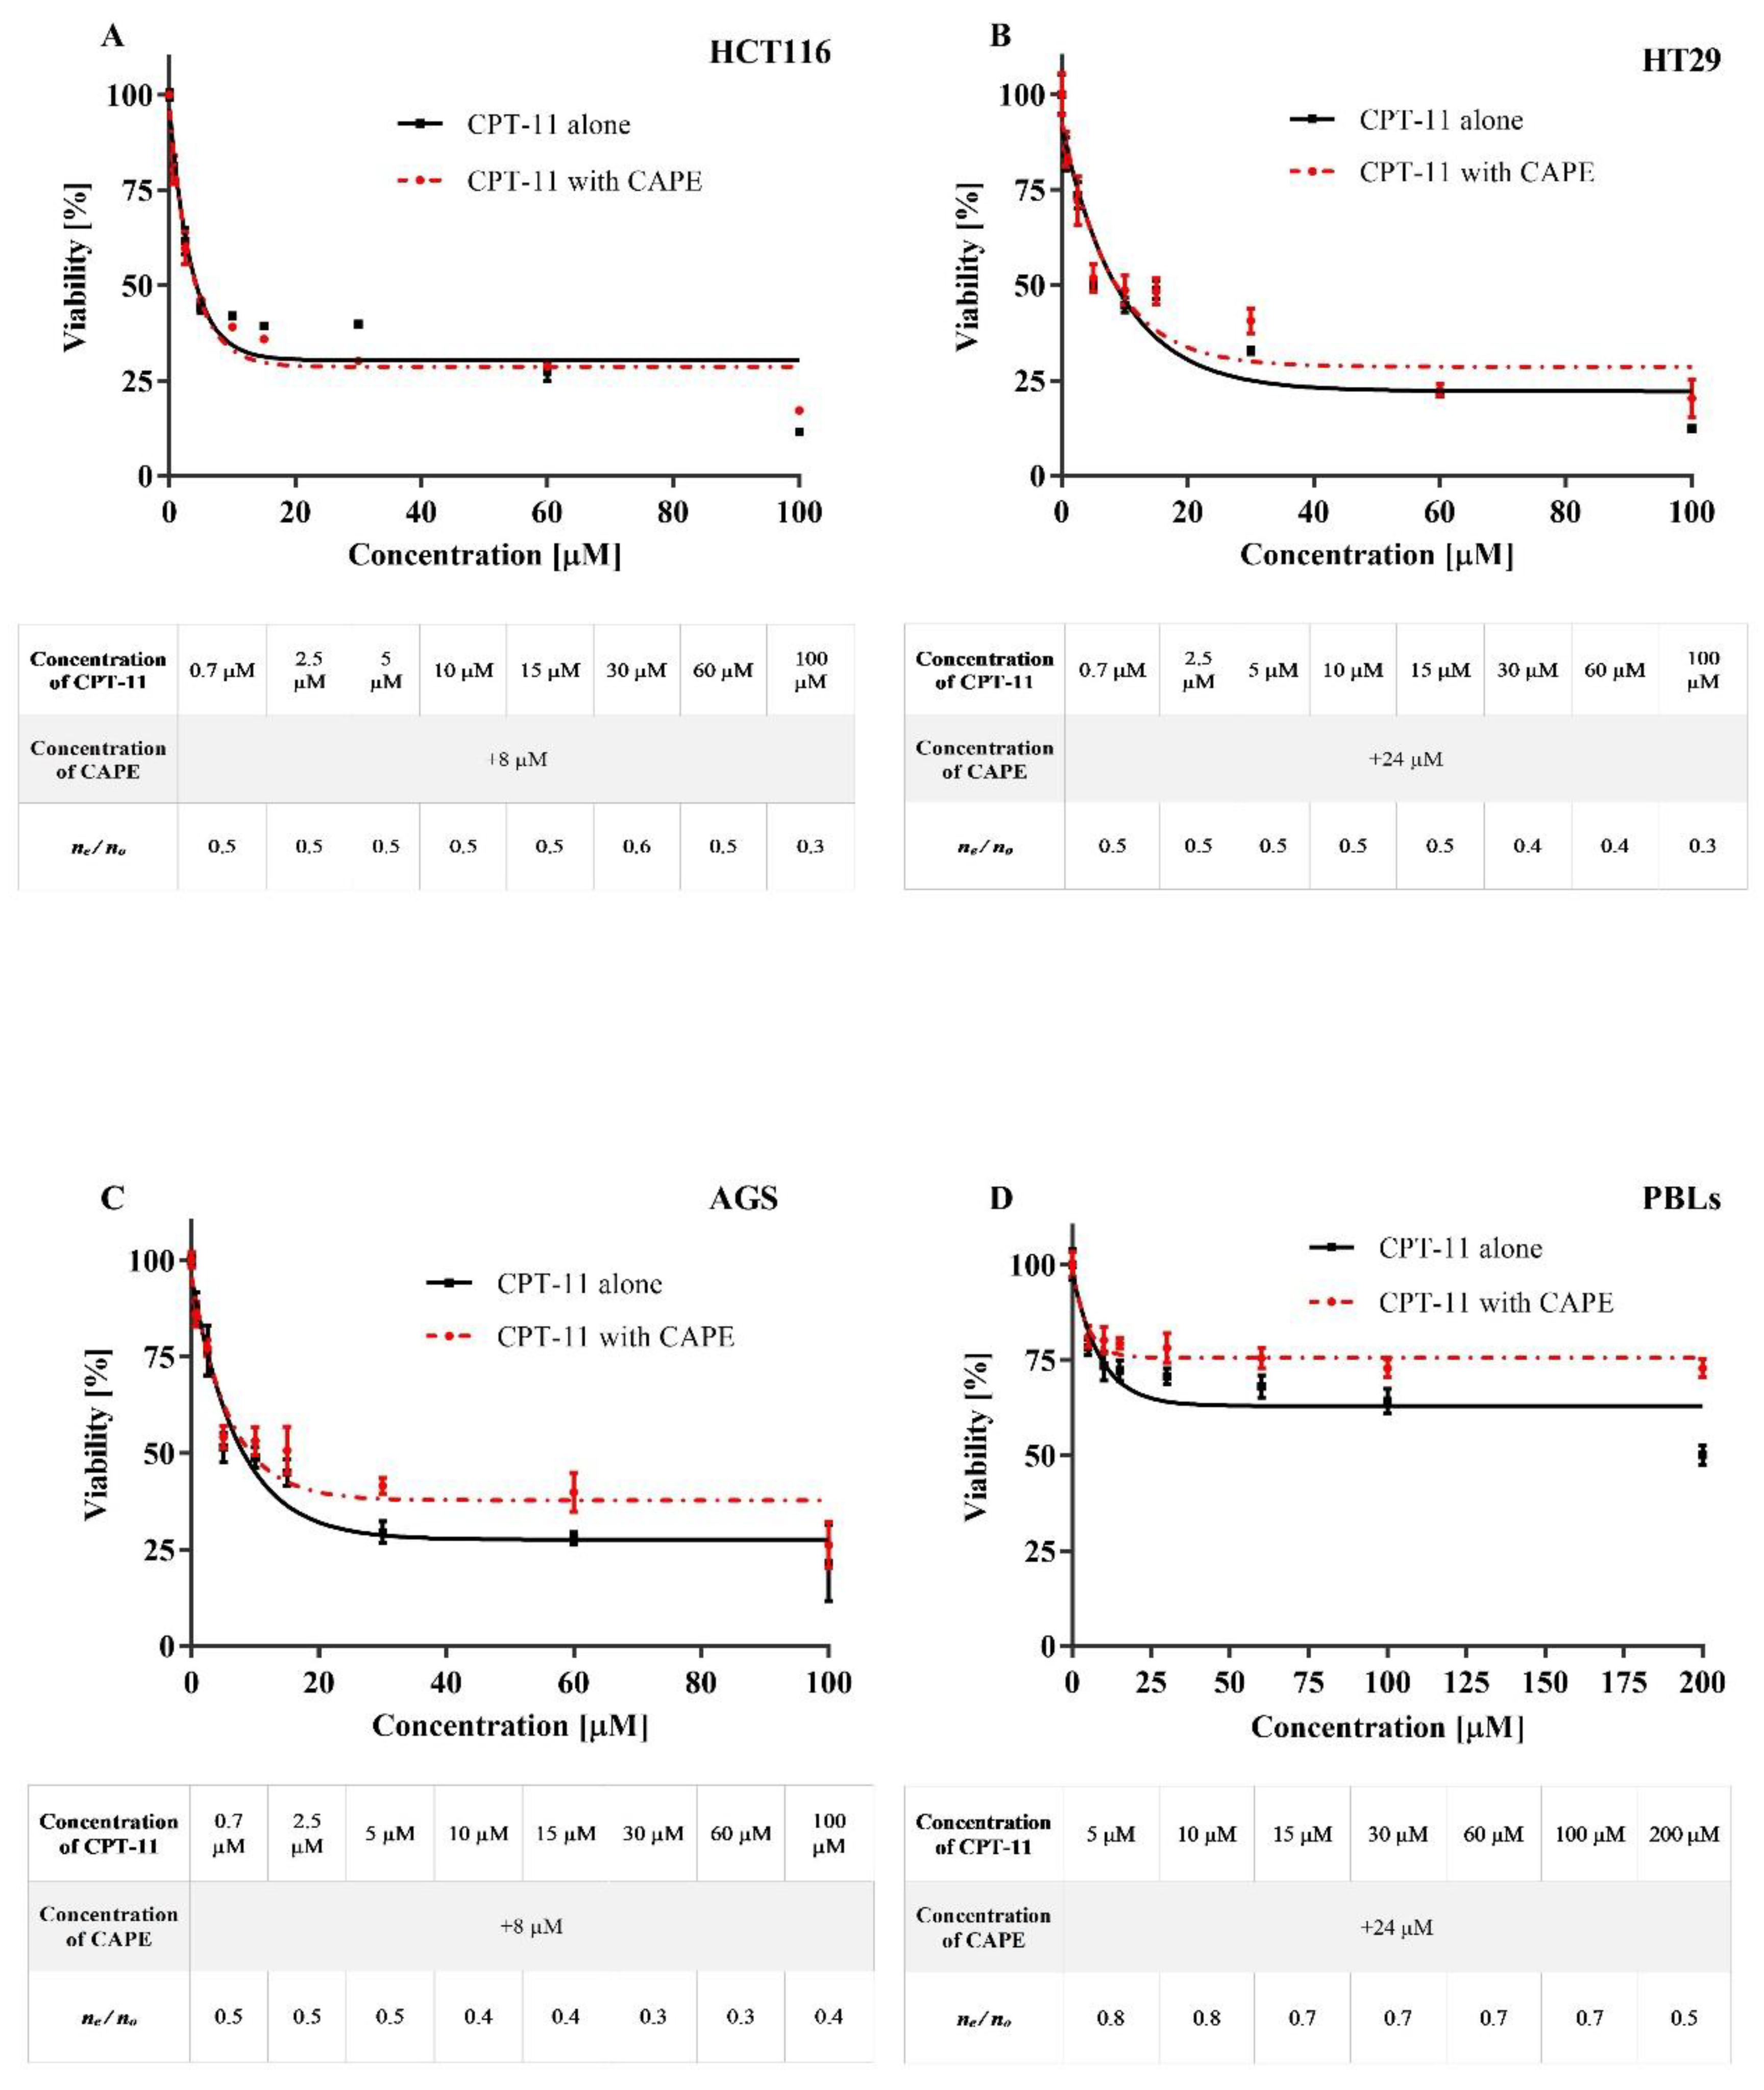
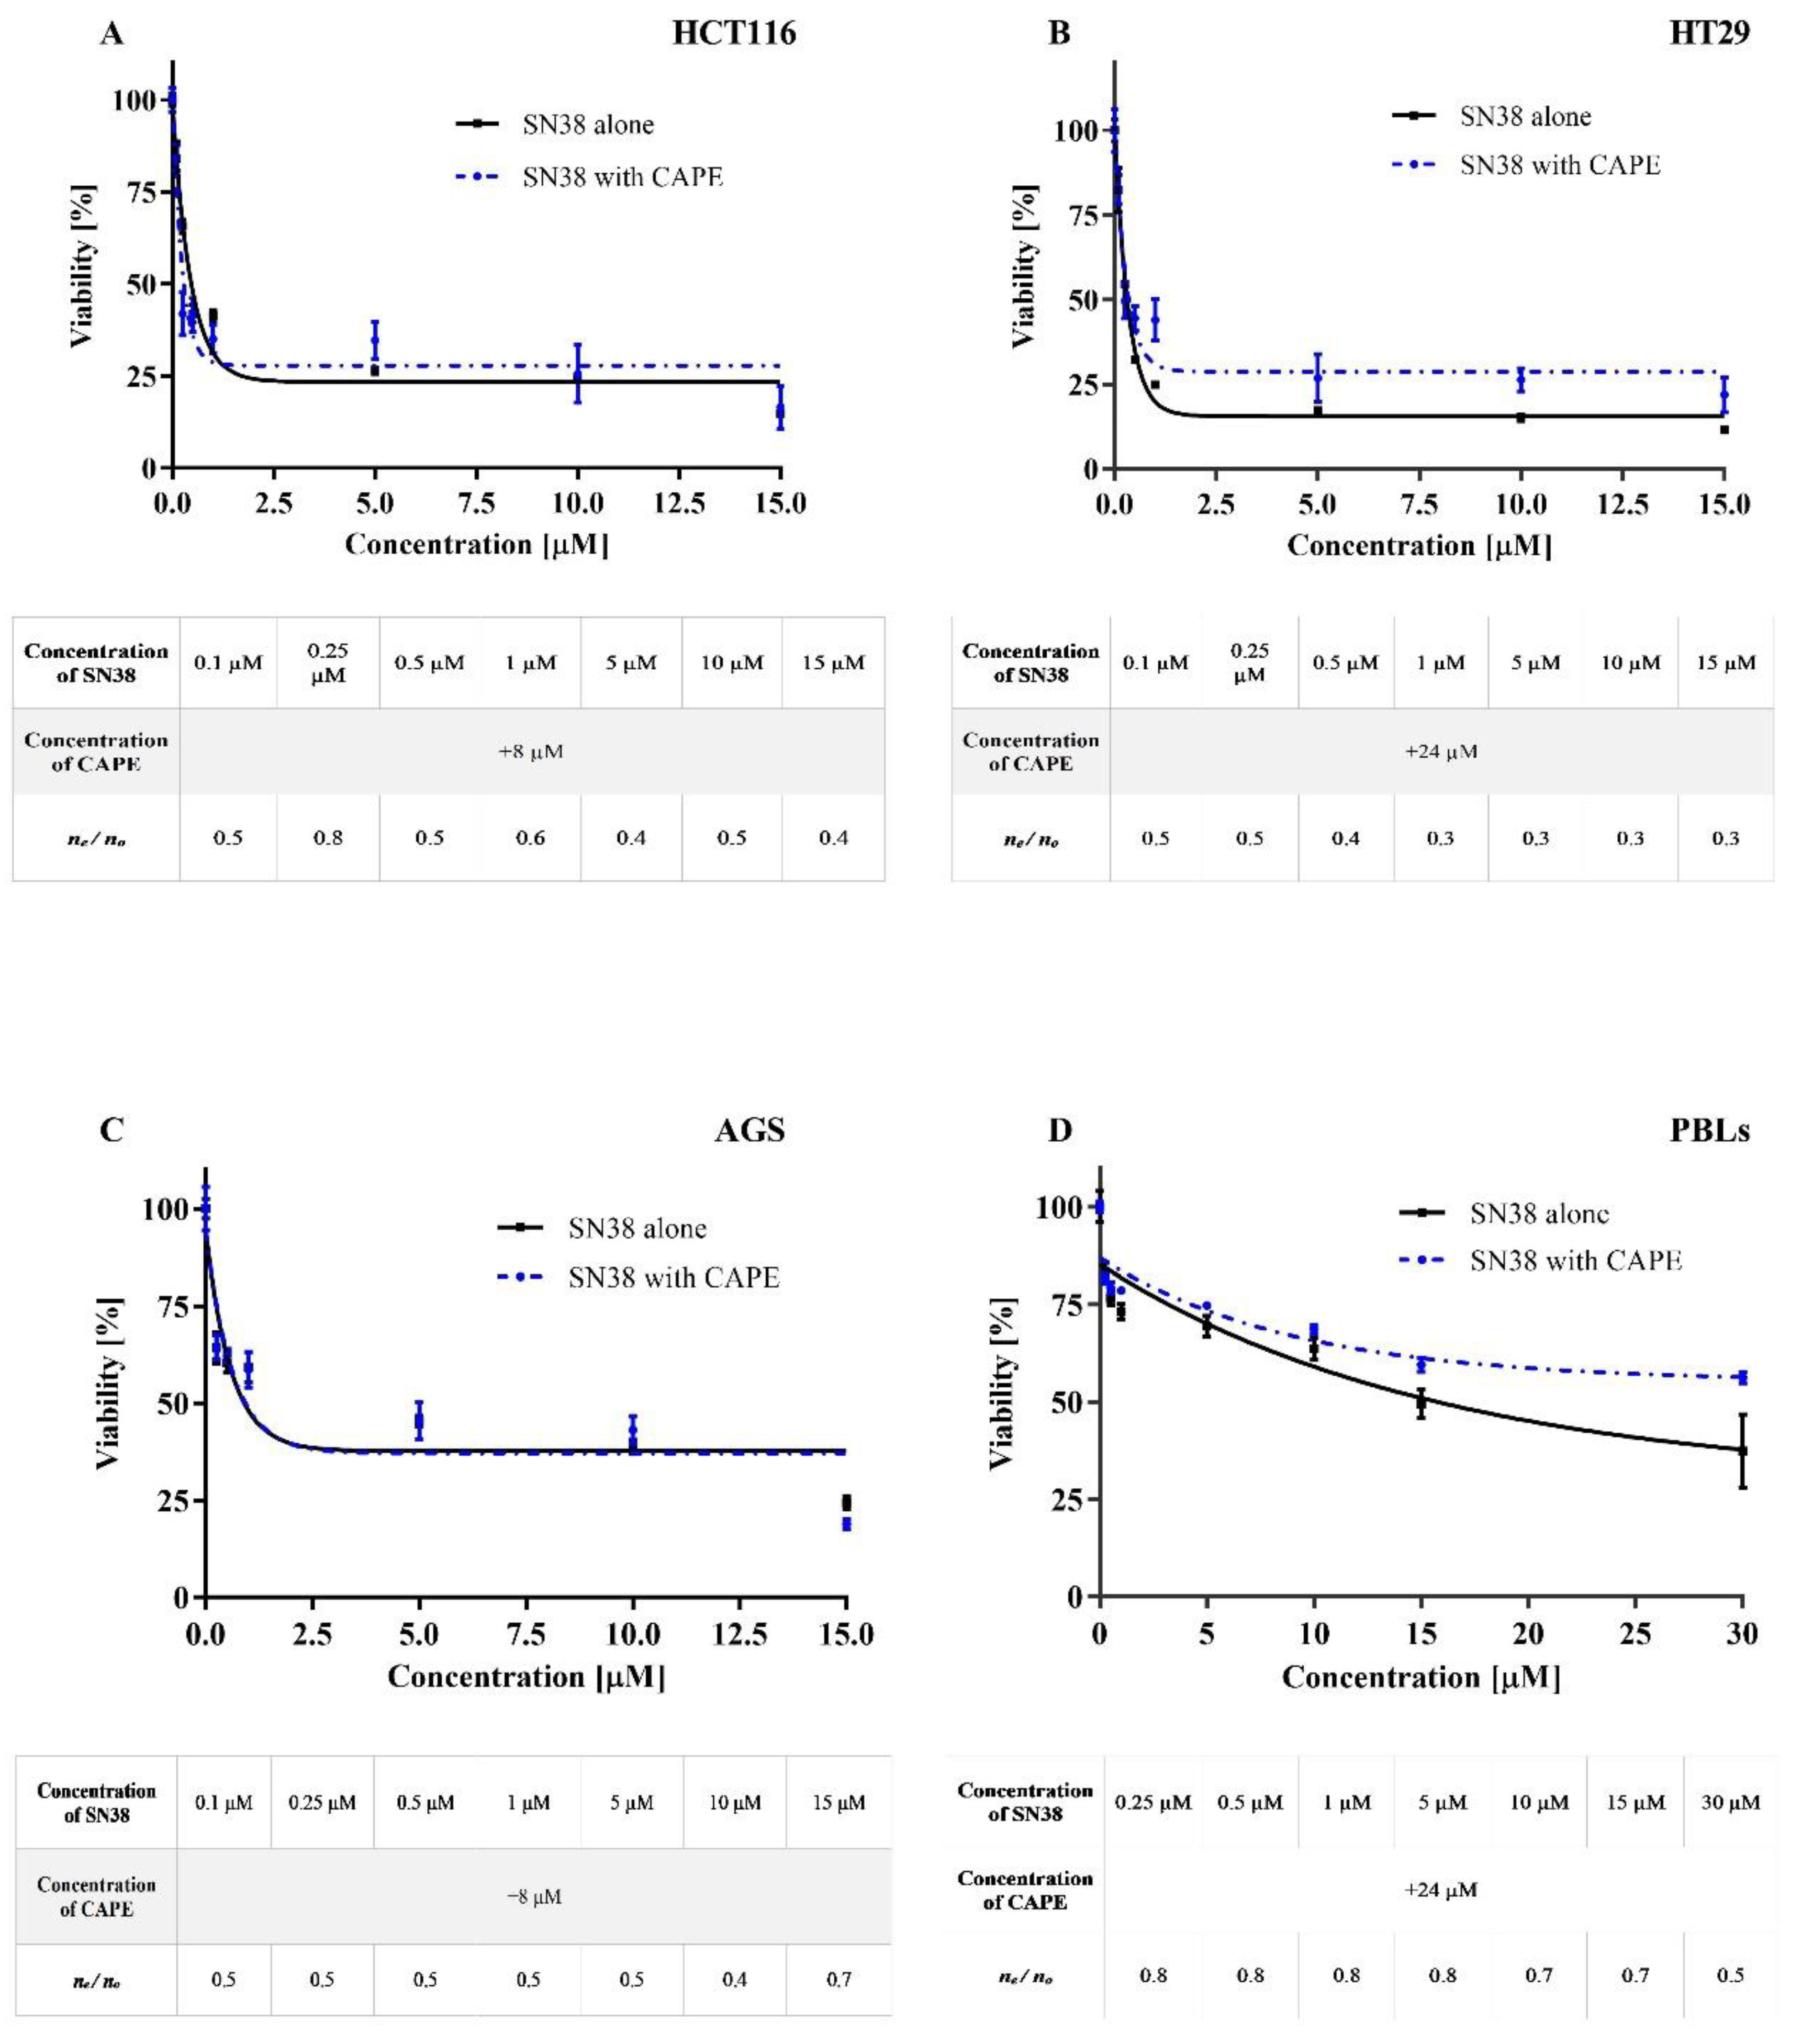
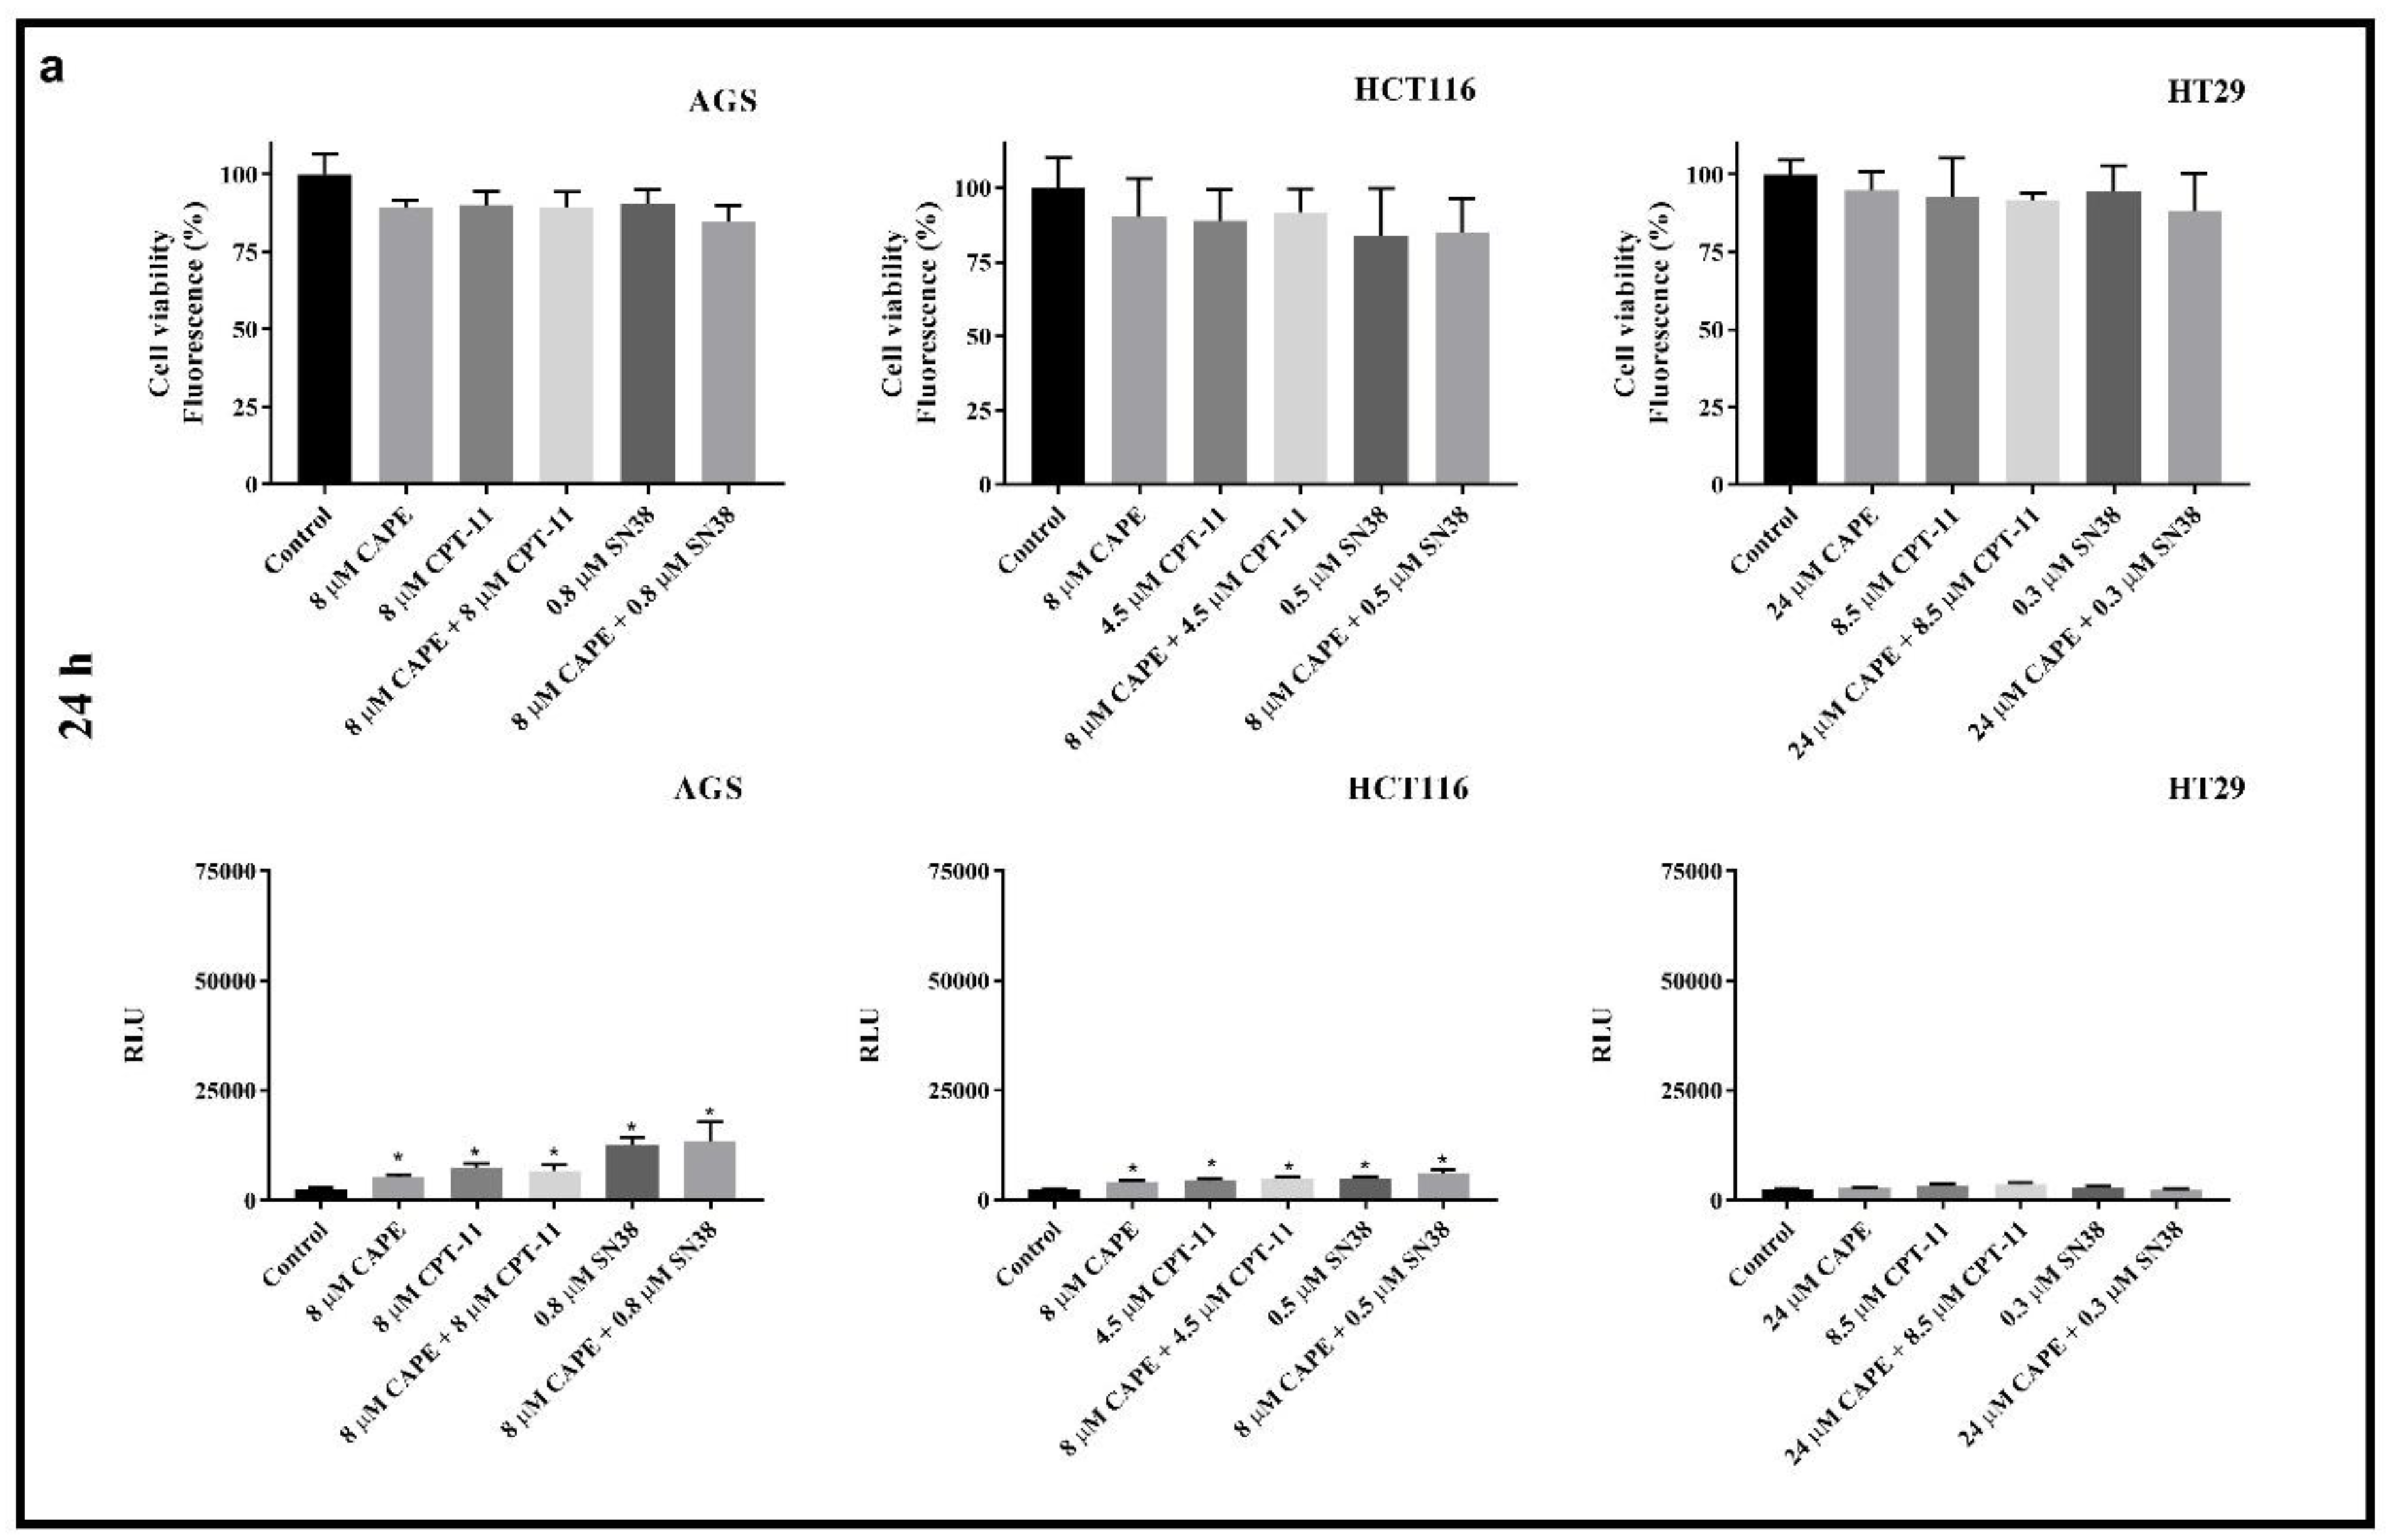
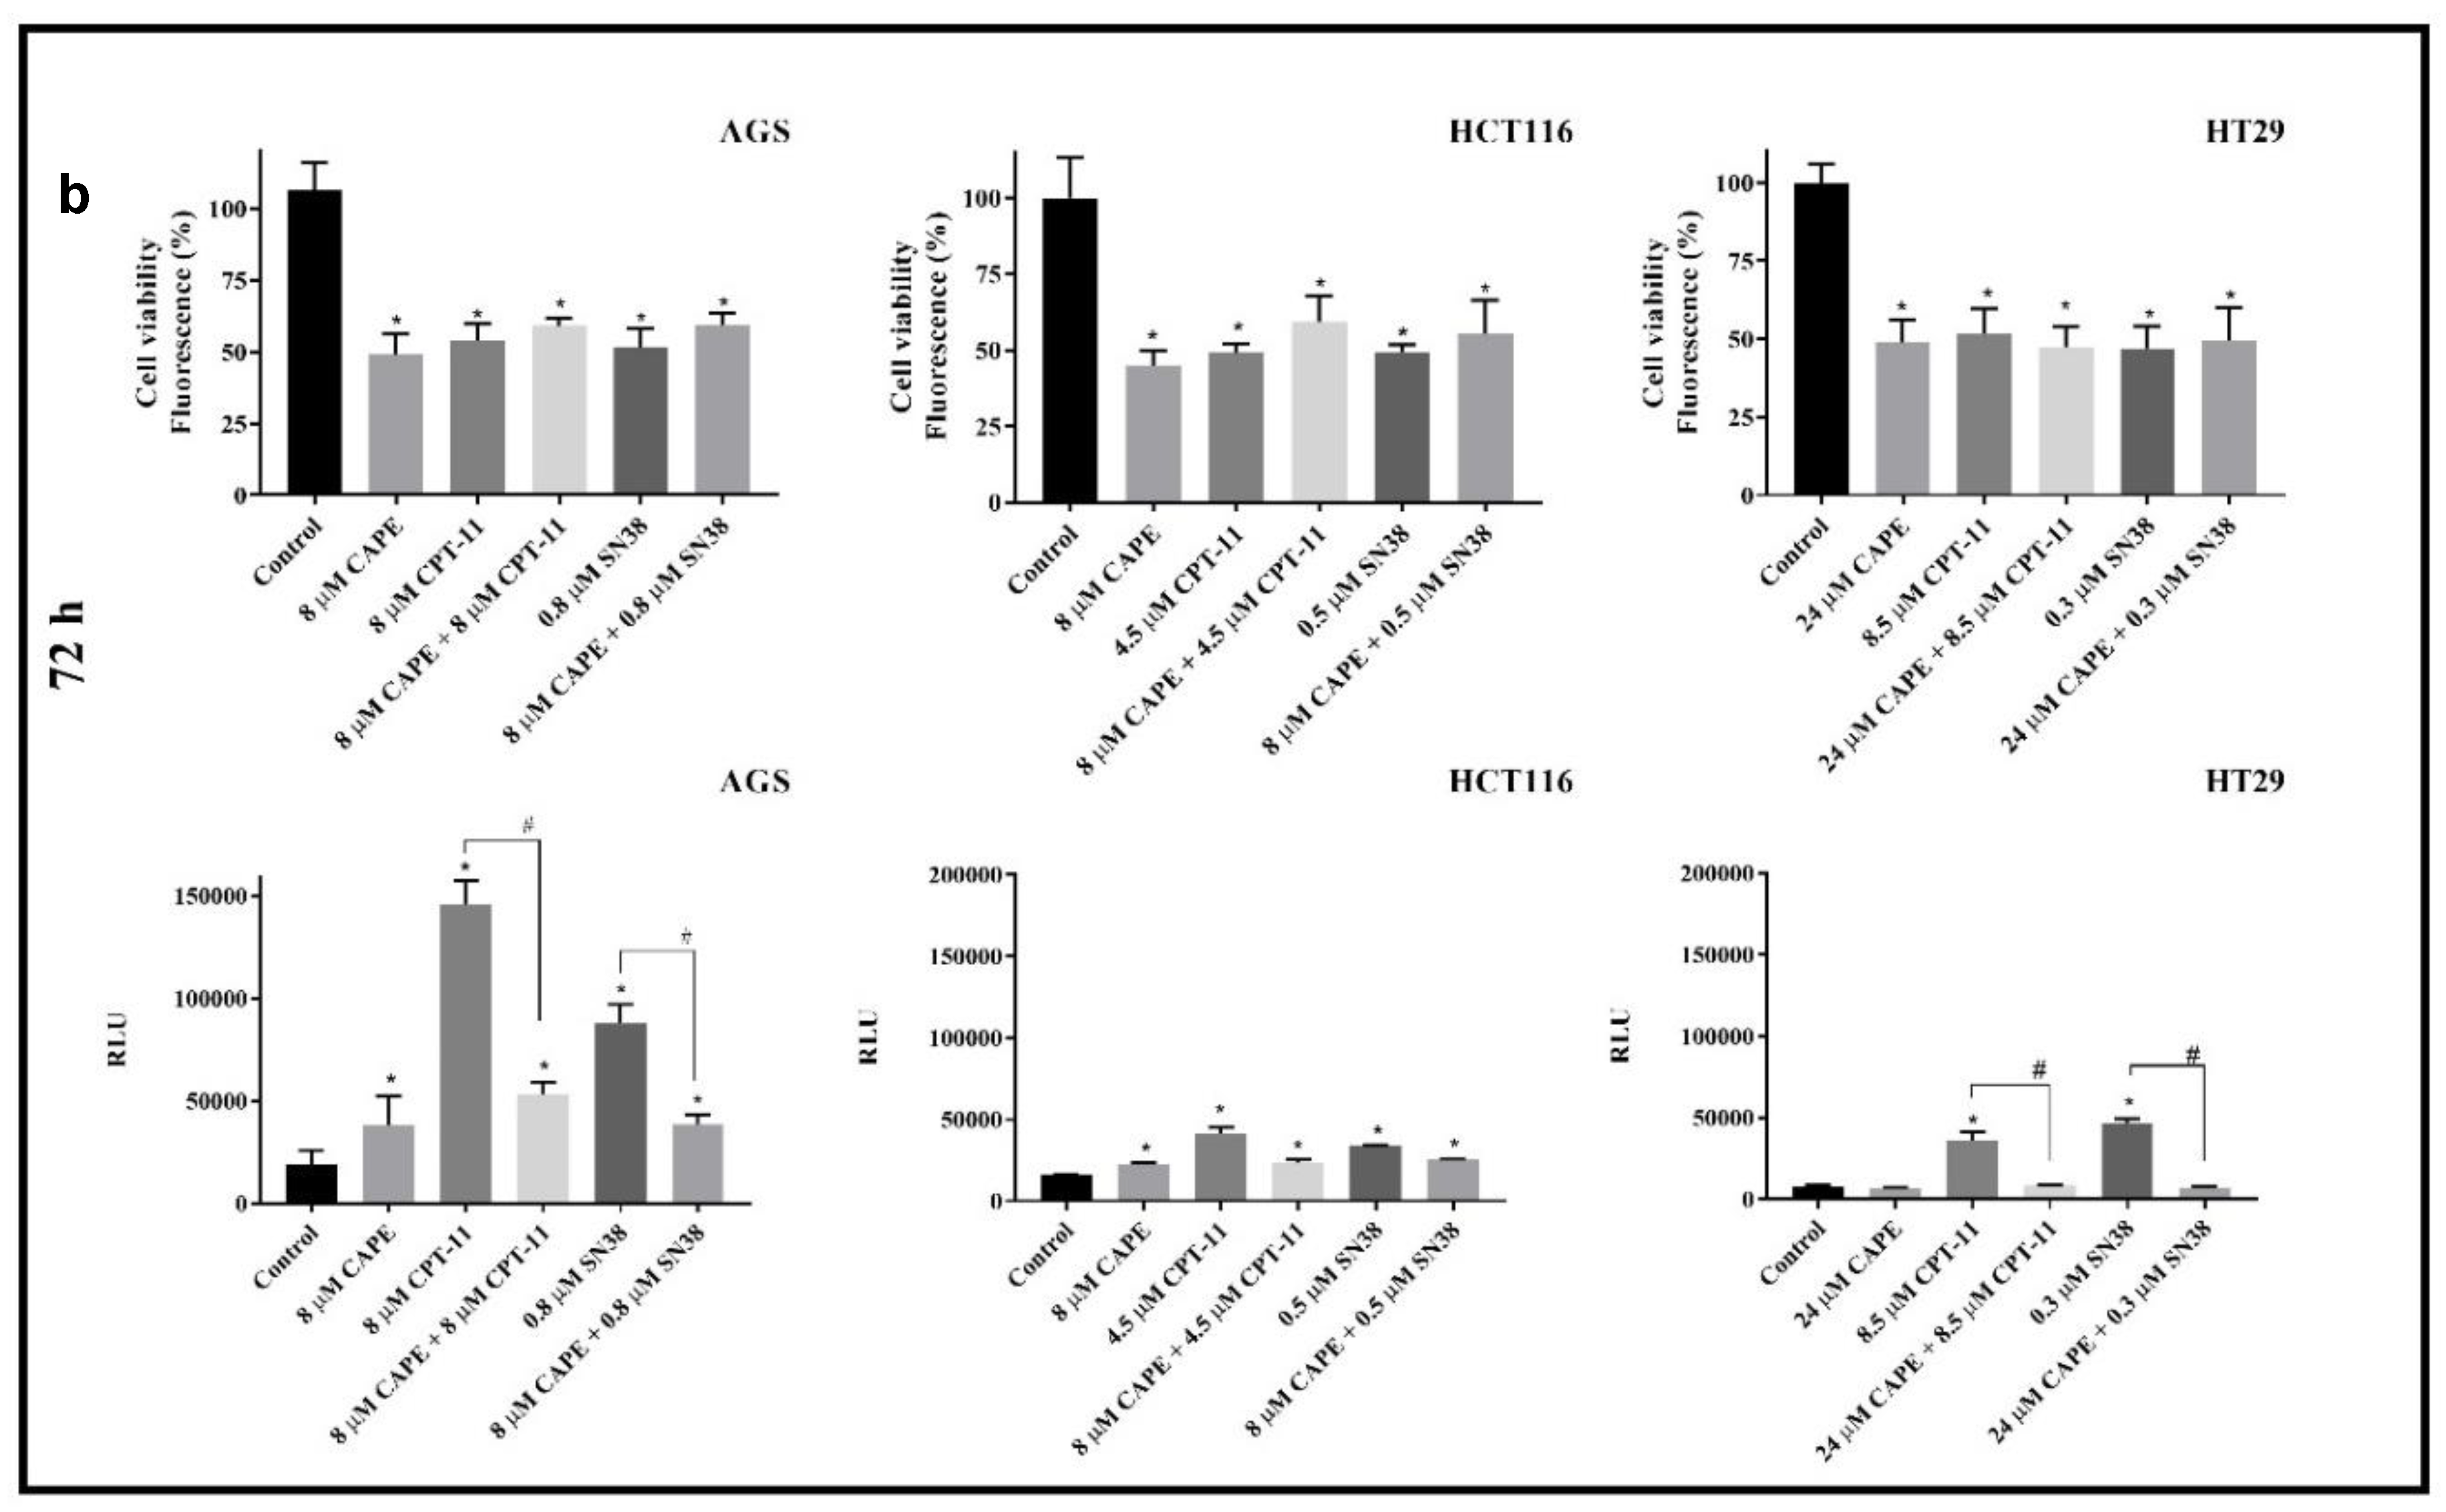
2.1. Cytotoxicity
Antagonistic Effect of CAPE on CPT-11 and SN38
2.2. Caspase 3/7 Activity
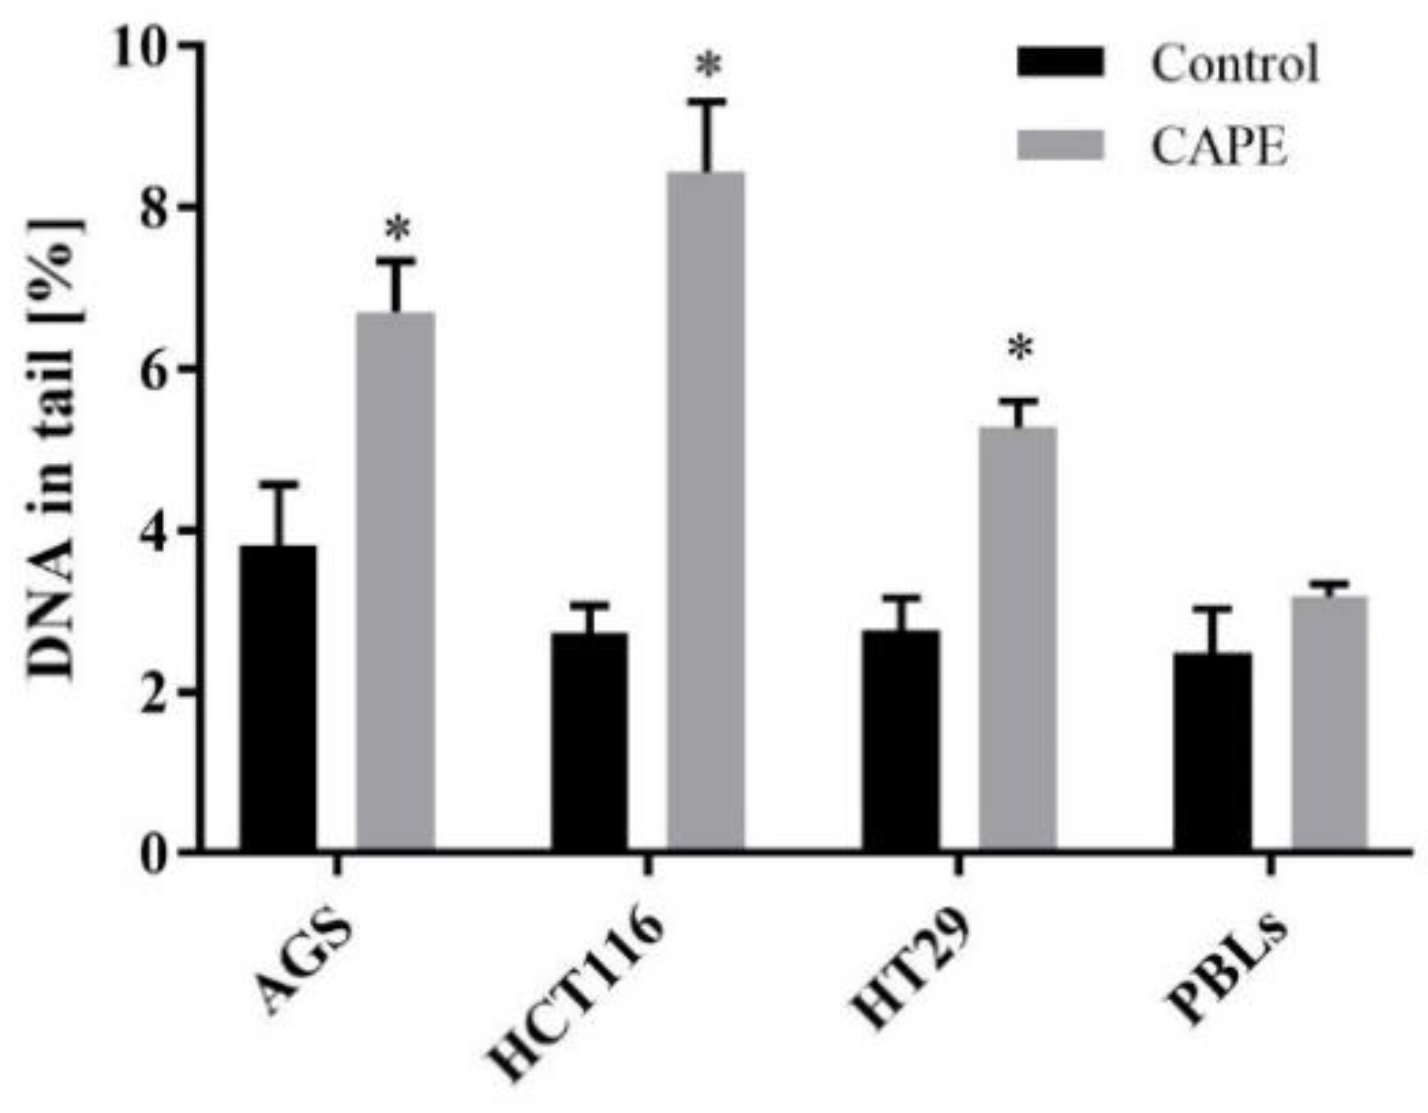
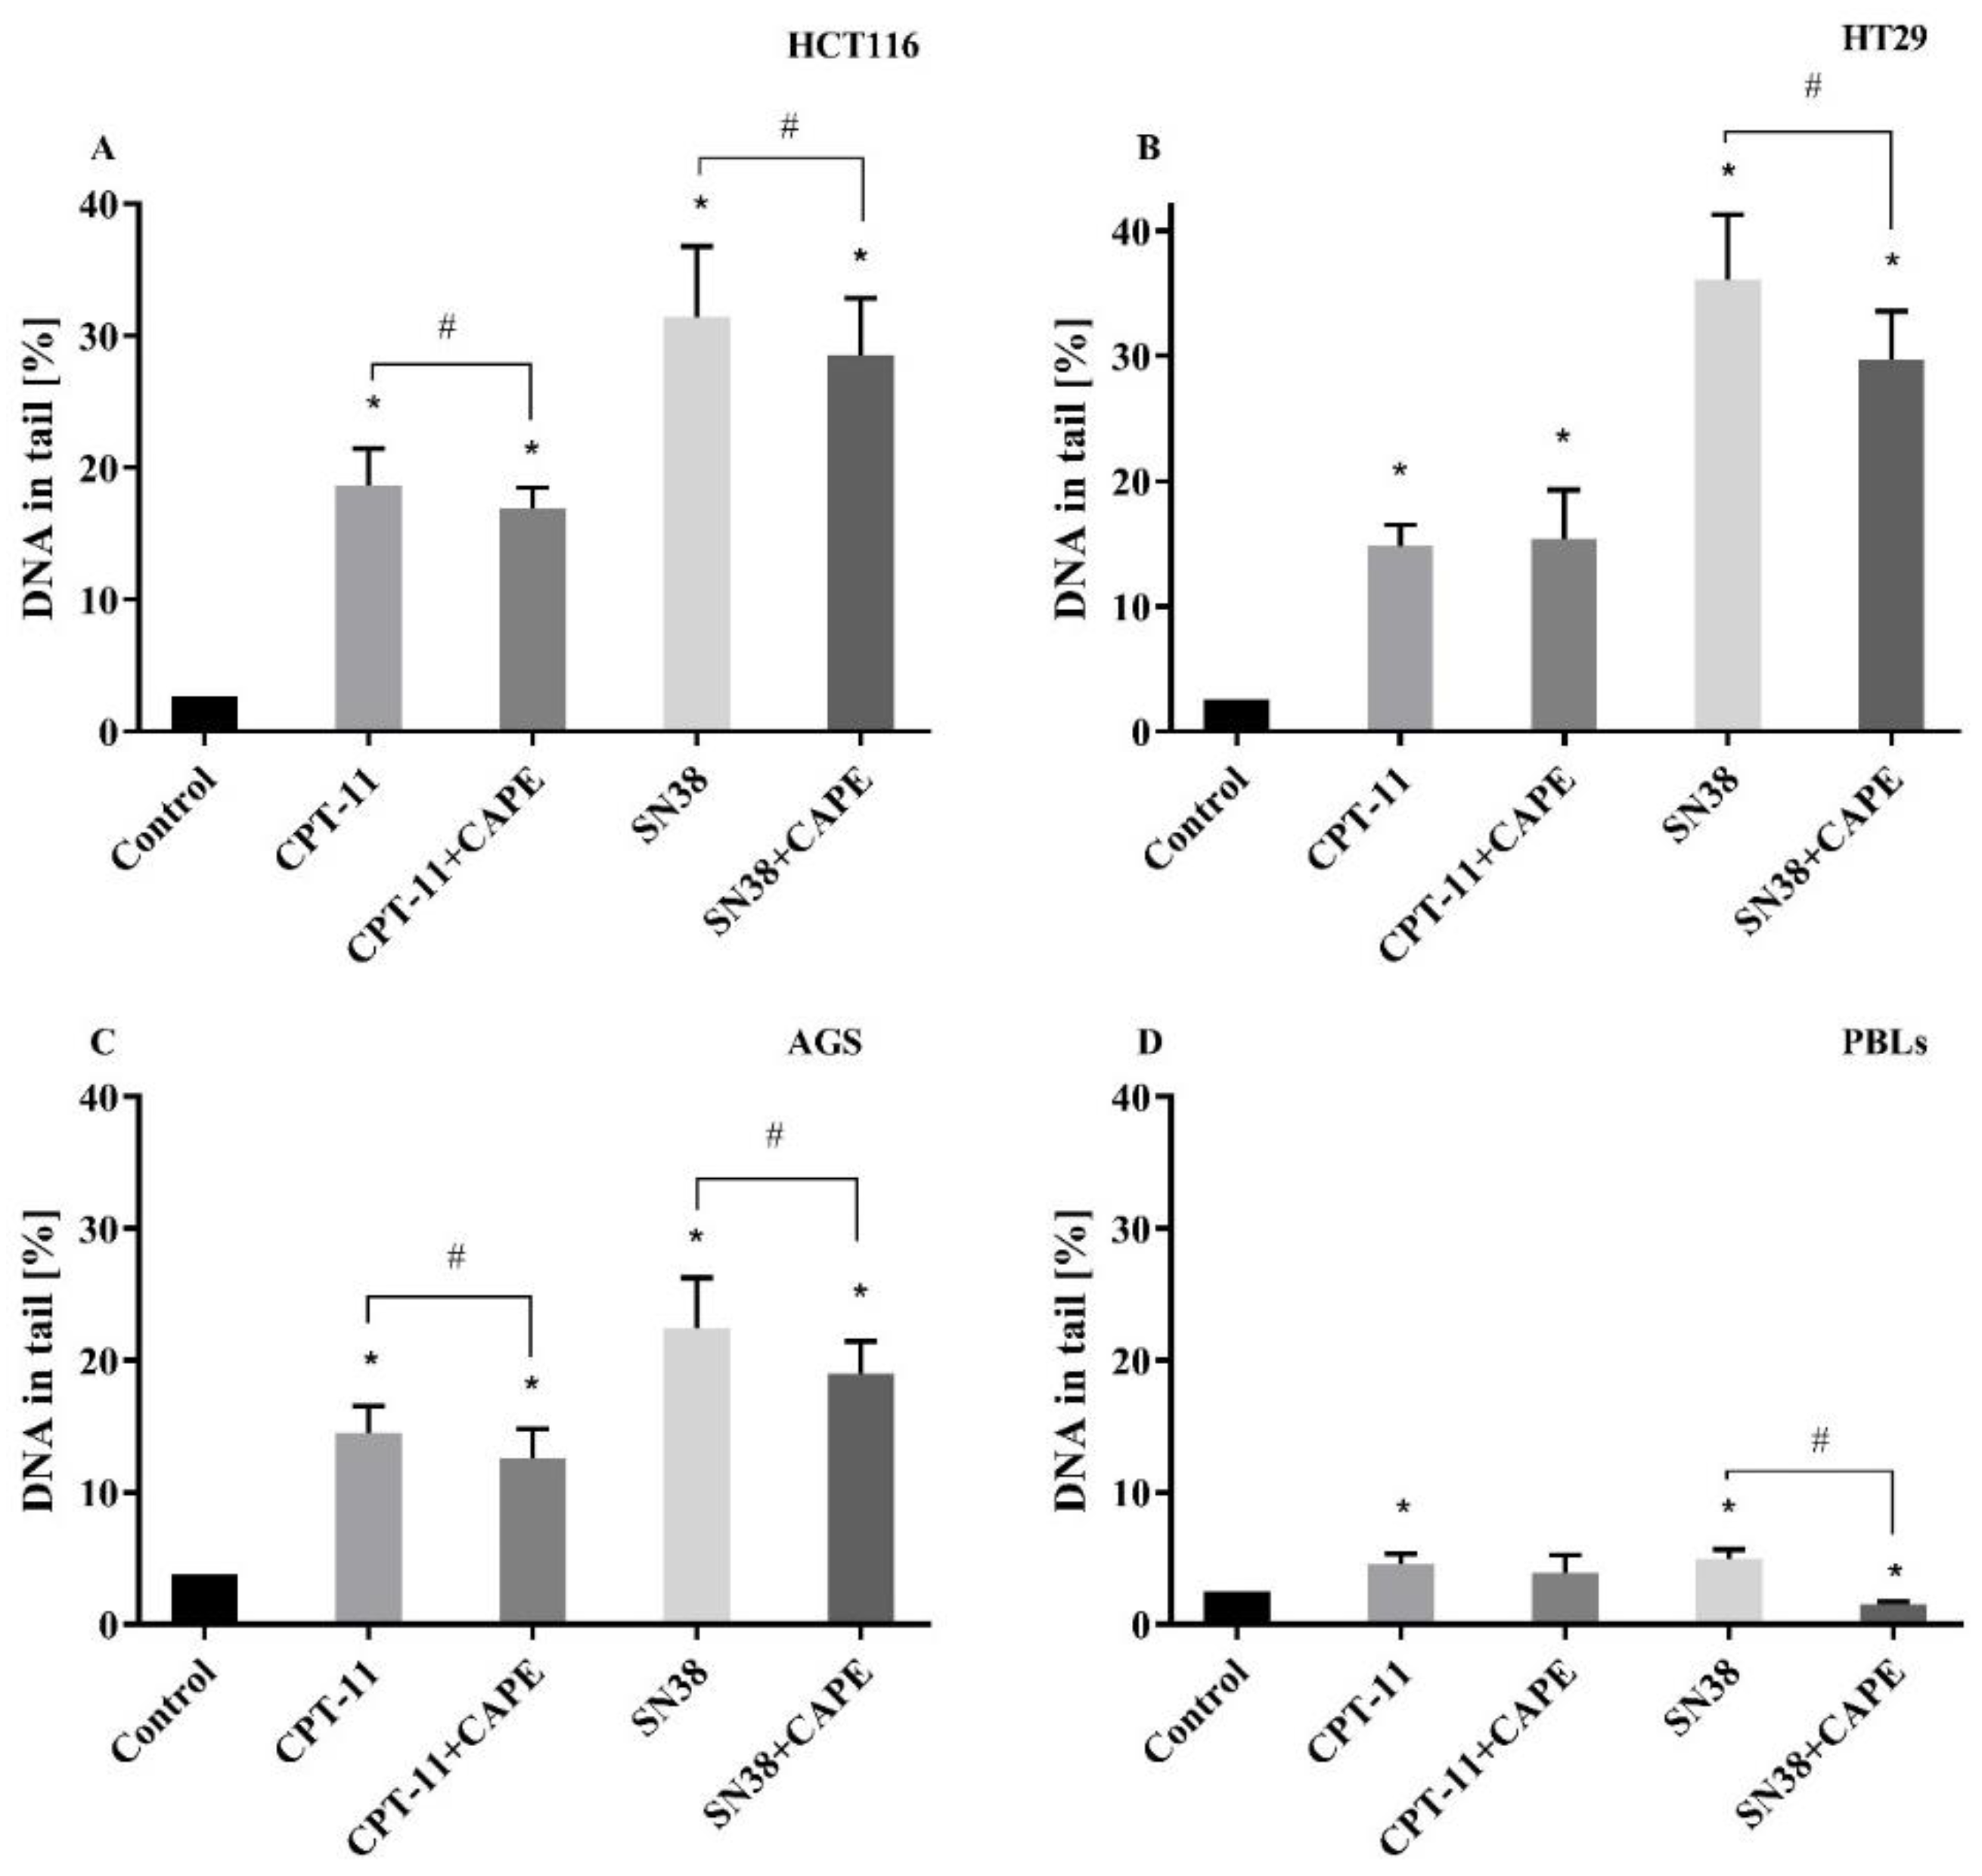
2.3. DNA Damage
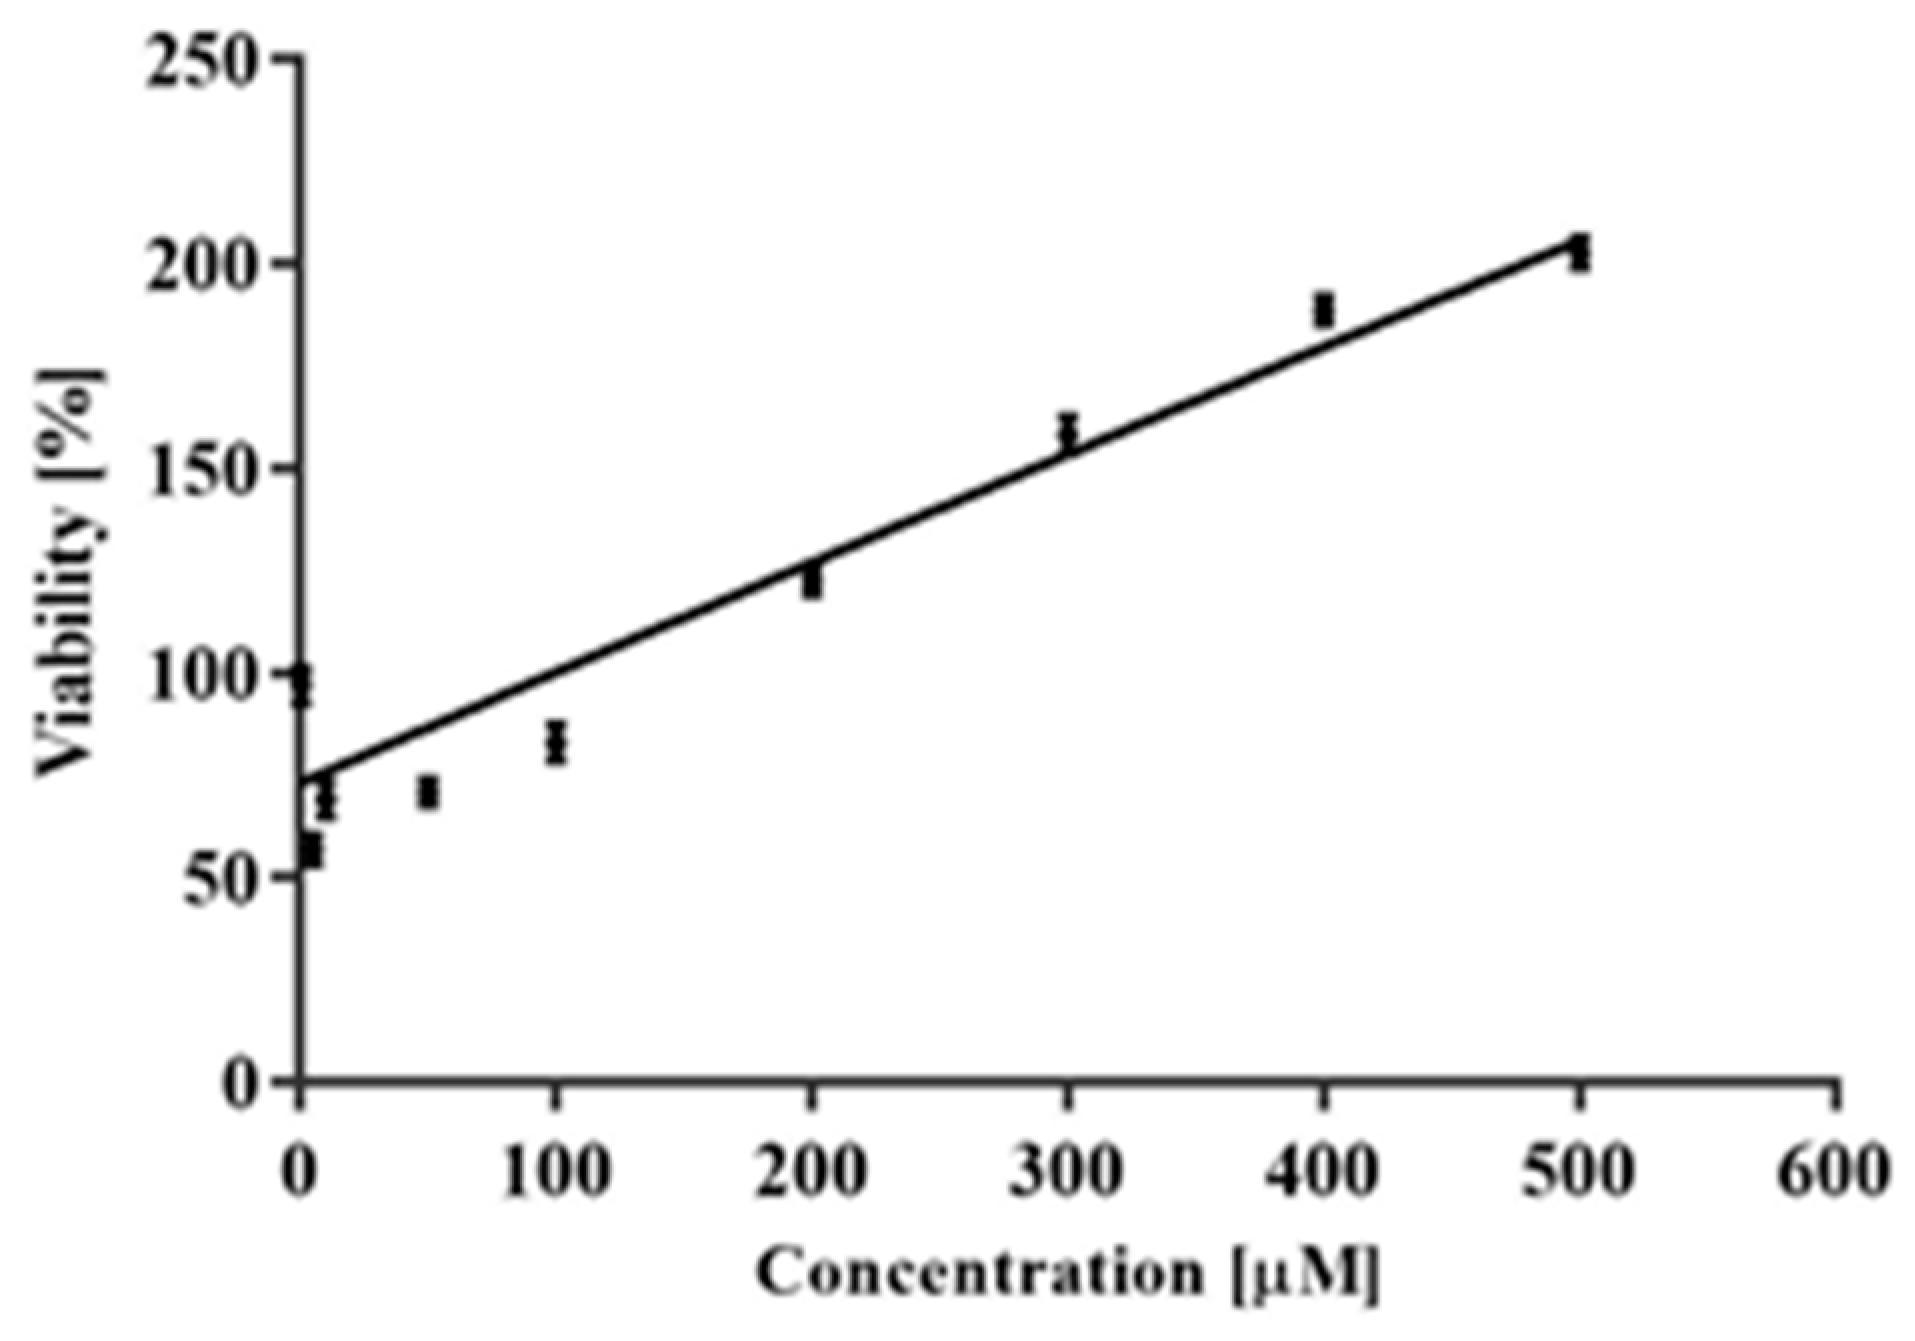
2.3.1. Genotoxicity of CAPE
2.3.2. Genotoxicity CAPE + CPT-11 and CAPE + SN38
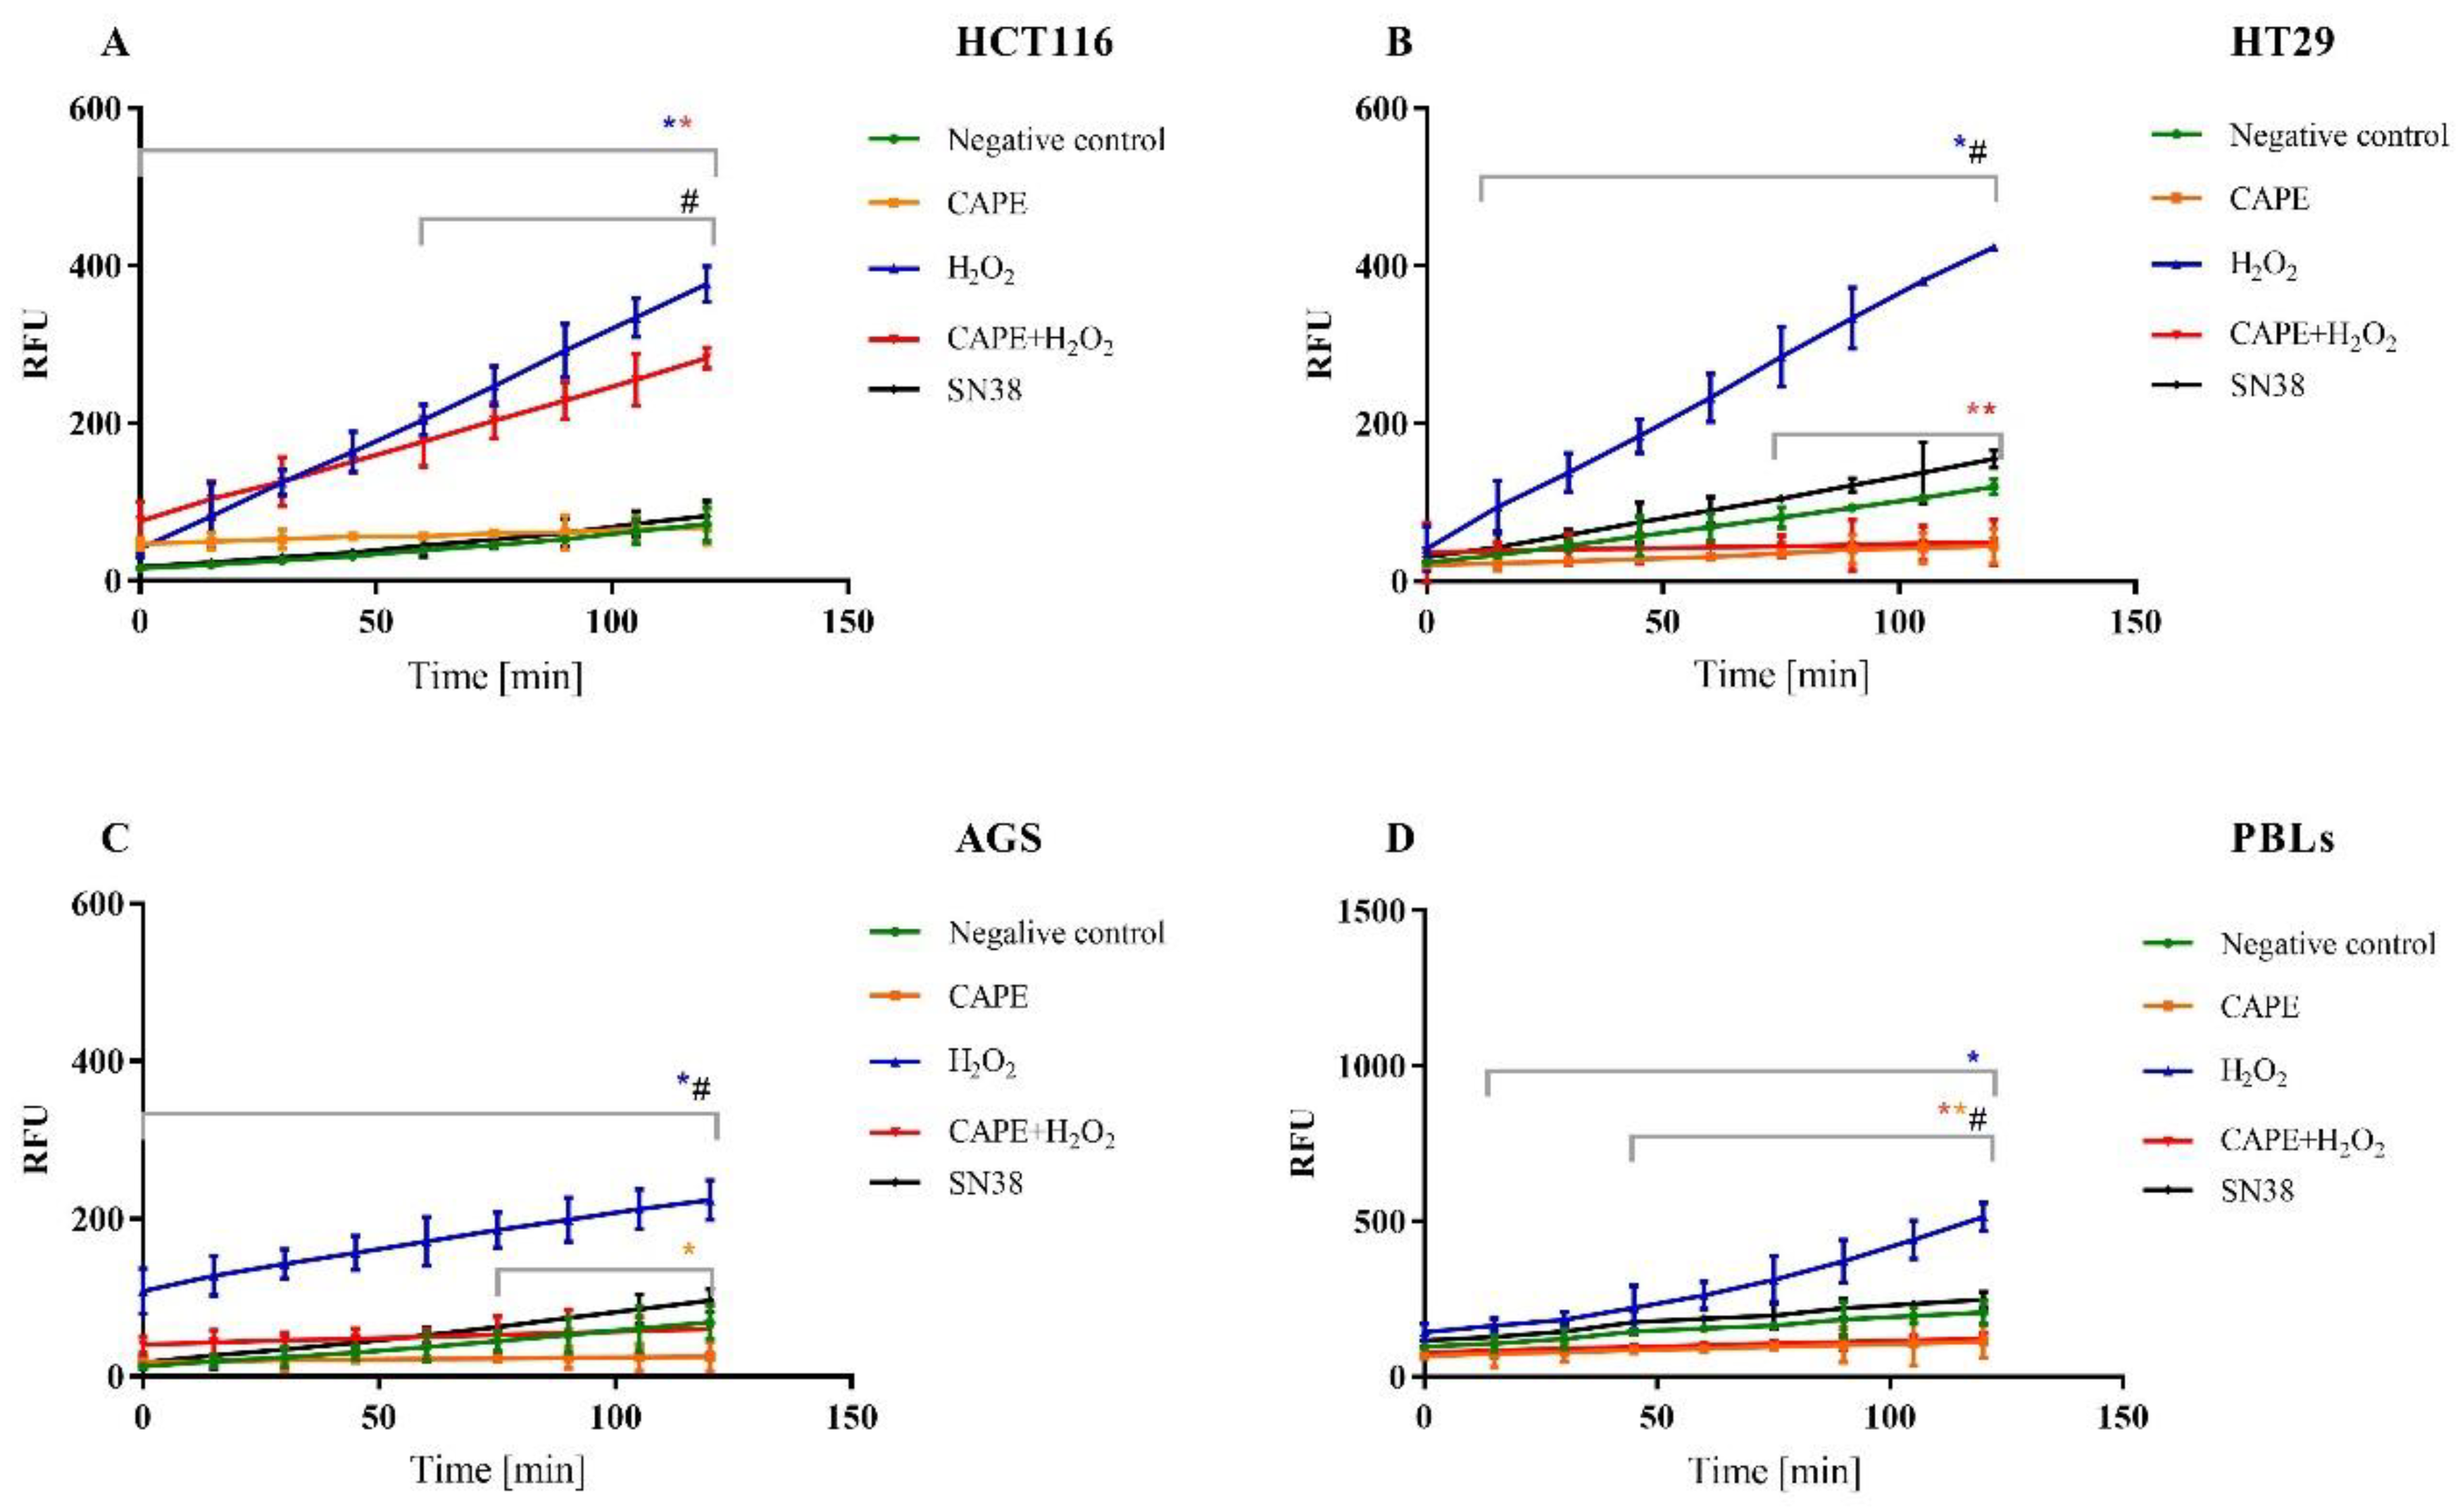
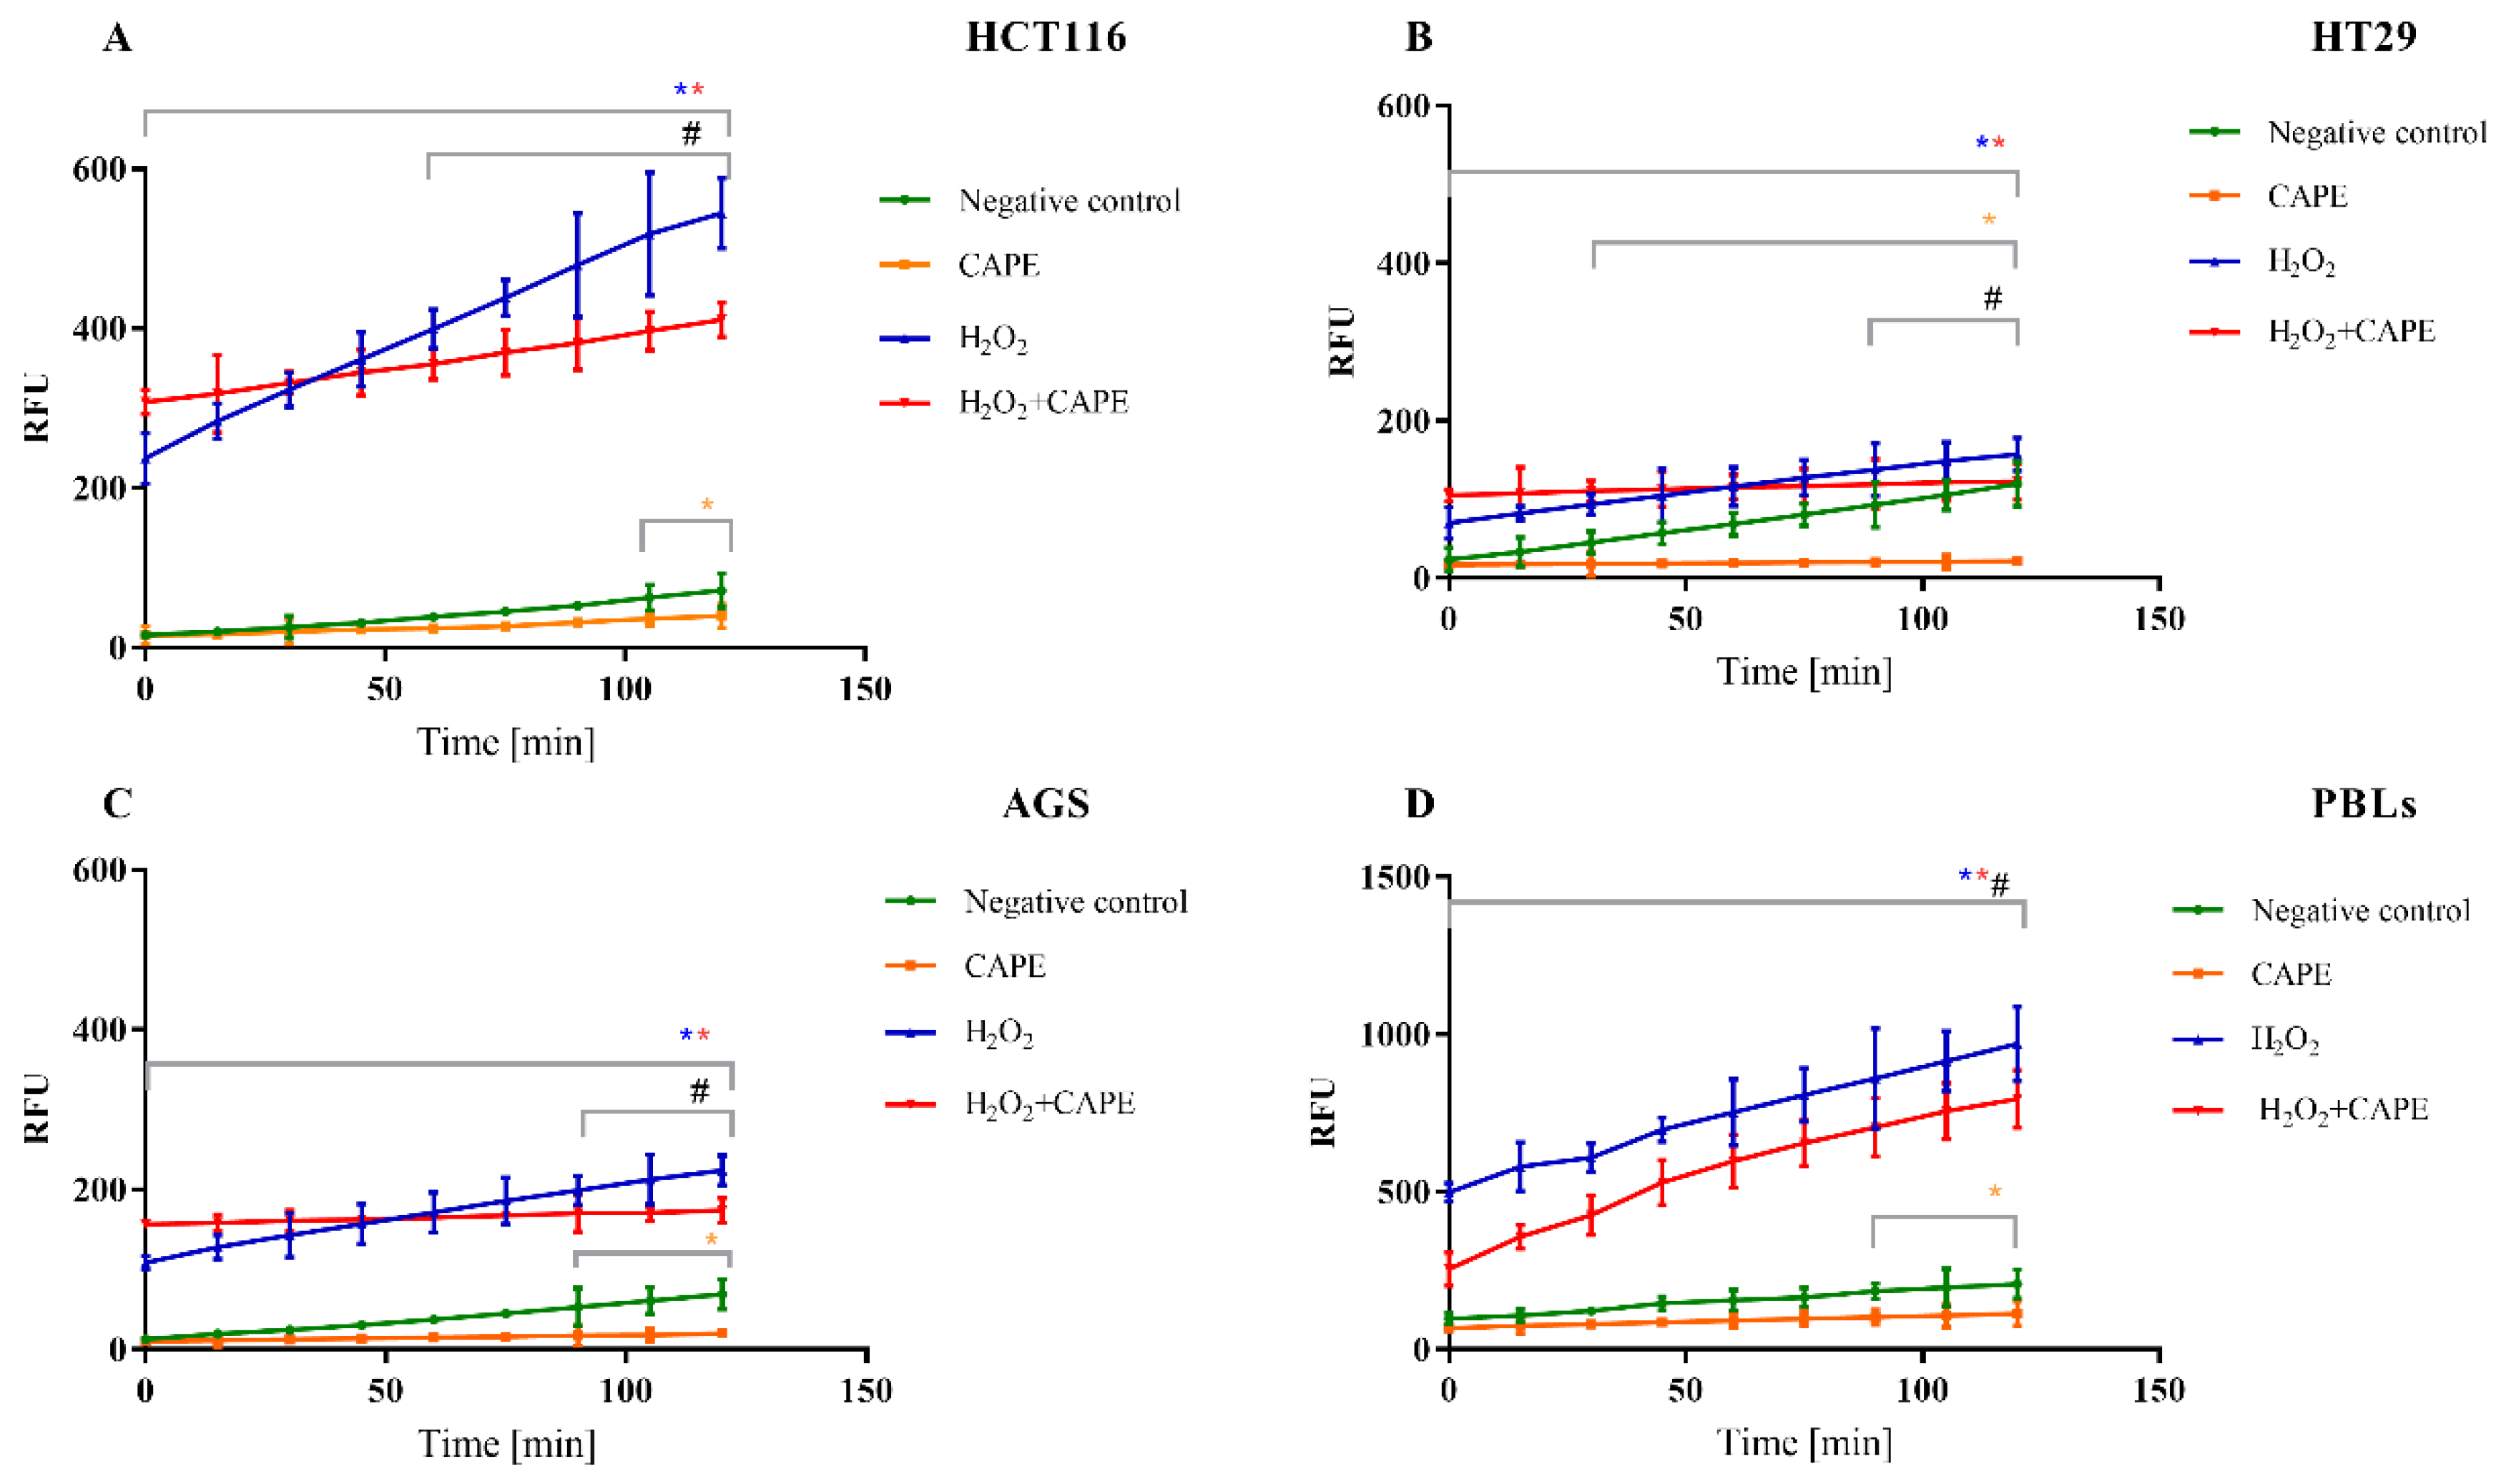
2.4. Intracellular ROS Determined by H2-DCFDA
3. Discussion
4. Materials and Methods
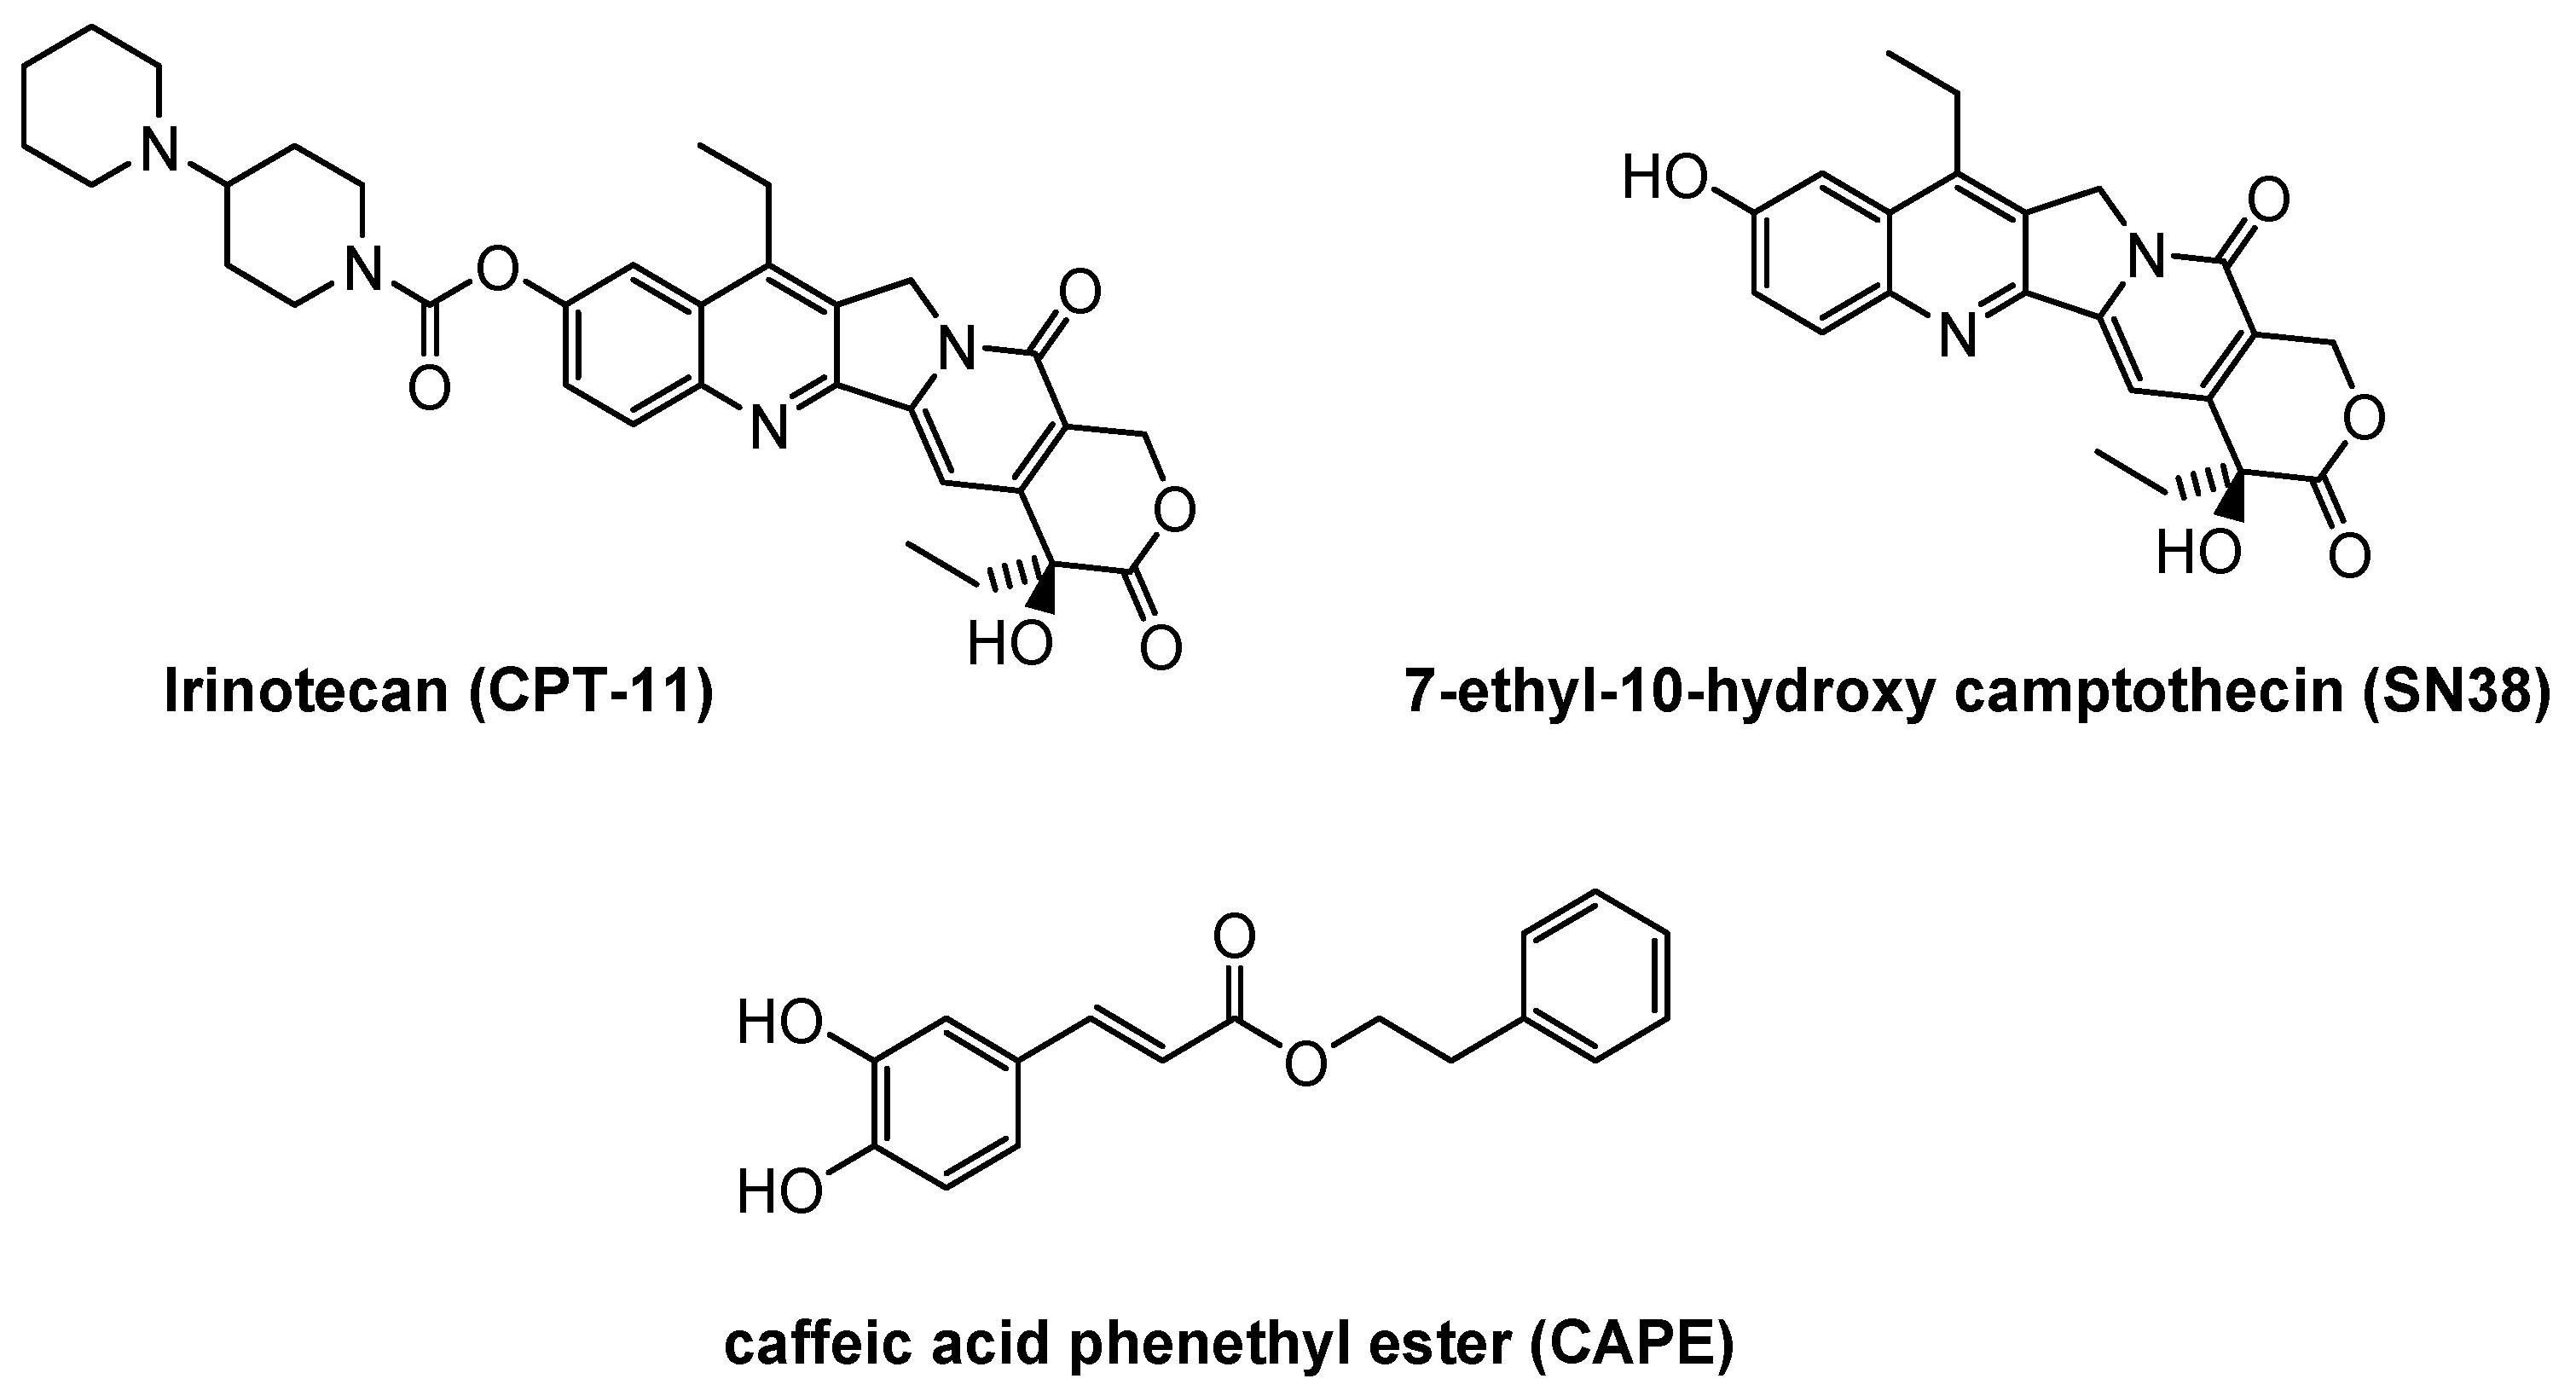
4.1. Chemicals
4.2. Cell Culture
4.2.1. Peripheral Blood Lymphocytes (PBLs)
4.2.2. Cancer Cell Lines
4.3. Cytotoxicity
Synergistic or Antagonistic Effect
4.4. Measurement of Caspase-3/7 Activity
4.5. DNA Damage–Alkaline Comet Assay
4.5.1. Samples Preparation and Lysis
4.5.2. Electrophoretic Separation and Staining
4.5.3. Analysis of Comet Assay
4.6. Measurement of Reactive Oxygen Species Generation
4.7. Statistical Analysis
5. Conclusions
Author Contributions
Funding
Acknowledgments
Conflicts of Interest
References
- Wilke, H.; Bouche, O.; Rougier, P.; Kohne, C.-H. Irinotecan for the treatment of gastric cancer. Eur. J. Cancer Suppl. 2004, 2, 48–51. [Google Scholar] [CrossRef]
- Kopjar, N.; Želježić, D.; Vrdoljak, A.L.; Radić, B.; Ramić, S.; Milić, M.; Gamulin, M.; Pavlica, V.; Fucic, A. Irinotecan Toxicity to Human Blood Cells in vitro: Relationship between Various Biomarkers. Basic Clin. Pharmacol. Toxicol. 2007, 100, 403–413. [Google Scholar] [CrossRef] [PubMed]
- Kašuba, V.; Rozgaj, R.; Gamulin, M.; Trošić, I. Assessment of Cyto/Genotoxicity of Irinotecan in V79 Cells Using the Comet, Micronucleus, and Chromosome Aberration Assay. Arch. Ind. Hyg. Toxicol. 2010, 61, 1–9. [Google Scholar] [CrossRef] [PubMed] [Green Version]
- Fuchs, C.; Marshall, J.; Mitchell, E.; Wierzbicki, R.; Ganju, V.; Jeffery, M.; Schultz, J.; Richards, D.; Wang, B.; Morrison, M. A randomized trial of first-line irinotecan/fluoropymidine combinations with or without celecoxib in metastatic colorectal cancer (BICC-C). J. Clin. Oncol. 2006, 24, 3506. [Google Scholar]
- Prasad, K.N.; Kumar, A.; Kochupillai, V.; Cole, W.C. High doses of multiple antioxidant vitamins: Essential ingredients in improving the efficacy of standard cancer therapy. J. Am. Coll. Nutr. 1999, 18, 13–25. [Google Scholar] [CrossRef]
- Lamson, D.W.; Brignall, M.S. Antioxidants in cancer therapy; their actions and interactions with oncologic therapies. Altern. Med. Rev. A J. Clin. Ther. 1999, 4, 304–329. [Google Scholar]
- Conklin, K.A. Dietary Antioxidants During Cancer Chemotherapy: Impact on Chemotherapeutic Effectiveness and Development of Side Effects. Nutr. Cancer 2000, 37, 1–18. [Google Scholar] [CrossRef]
- Labriola, D.; Livingston, R. Possible interactions between dietary antioxidants and chemotherapy. Oncology 1999, 13, 1003–1008. [Google Scholar]
- Kong, Q.; Lillehei, K. Antioxidant inhibitors for cancer therapy. Med. Hypotheses 1998, 51, 405–409. [Google Scholar] [CrossRef]
- Pietta, P.; Gardana, C.; Pietta, A. Analytical methods for quality control of propolis. Fitoterapia 2002, 73, S7–S20. [Google Scholar] [CrossRef]
- Kujumgiev, A.; Tsvetkova, I.; Serkedjieva, Y.; Bankova, V.; Christov, R.; Popov, S. Antibacterial, antifungal and antiviral activity of propolis of different geographic origin. J. Ethnopharmacol. 1999, 64, 235–240. [Google Scholar] [CrossRef]
- Trusheva, B.; Todorov, I.; Ninova, M.; Najdenski, H.; Daneshmand, A.; Bankova, V. Antibacterial mono- and sesquiterpene esters of benzoic acids from Iranian propolis. Chem. Central J. 2010, 4, 8. [Google Scholar] [CrossRef] [PubMed] [Green Version]
- Silici, S.; Unlu, M.; Vardar-Ünlü, G. Antibacterial activity and phytochemical evidence for the plant origin of Turkish propolis from different regions. World J. Microbiol. Biotechnol. 2007, 23, 1797–1803. [Google Scholar] [CrossRef] [PubMed]
- Cunha, I.B.D.S.; Salomão, K.; Shimizu, M.; Bankova, V.S.; Custódio, A.R.; De Castro, S.L.; Marcucci, M.C. Antitrypanosomal activity of Brazilian propolis from Apis mellifera. Chem. Pharm. Bull. 2004, 52, 602–604. [Google Scholar] [CrossRef] [PubMed] [Green Version]
- Russo, A.; Longo, R.; Vanella, A. Antioxidant activity of propolis: Role of caffeic acid phenethyl ester and galangin. Fitoterapia 2002, 73, S21–S29. [Google Scholar] [CrossRef]
- Kumazawa, S.; Ahn, M.-R.; Fujimoto, T.; Kato, M. Radical-scavenging activity and phenolic constituents of propolis from different regions of Argentina. Nat. Prod. Res. 2010, 24, 804–812. [Google Scholar] [CrossRef]
- Wang, X.; Stavchansky, S.; Bowman, P.D.; Kerwin, S.M. Cytoprotective effect of caffeic acid phenethyl ester (CAPE) and catechol ring-fluorinated CAPE derivatives against menadione-induced oxidative stress in human endothelial cells. Bioorg. Med. Chem. 2006, 14, 4879–4887. [Google Scholar] [CrossRef]
- Natarajan, K.; Singh, S.; Burke, T.R.; Grunberger, D.; Aggarwal, B.B. Caffeic acid phenethyl ester is a potent and specific inhibitor of activation of nuclear transcription factor NF-kappa B. Proc. Natl. Acad. Sci. USA 1996, 93, 9090–9095. [Google Scholar] [CrossRef] [Green Version]
- Krześlak, A. Akt kinase: A key regulator of metabolism and progression of tumors. Postępy Higieny i Medycyny Doświadczalnej 2010, 64, 490–503. [Google Scholar]
- Lee, K.J.; Choi, J.H.; Khanal, T.; Hwang, Y.P.; Chung, Y.C.; Jeong, H.G. Protective effect of caffeic acid phenethyl ester against carbon tetrachloride-induced hepatotoxicity in mice. Toxicology 2008, 248, 18–24. [Google Scholar] [CrossRef]
- Wu, J.; Omene, C.; Karkoszka, J.; Bosland, M.; Eckard, J.; Klein, C.B.; Frenkel, K. Caffeic acid phenethyl ester (CAPE), derived from a honeybee product propolis, exhibits a diversity of anti-tumor effects in pre-clinical models of human breast cancer. Cancer Lett. 2011, 308, 43–53. [Google Scholar] [CrossRef] [PubMed] [Green Version]
- Chuu, C.-P.; Lin, H.-P.; Ciaccio, M.F.; Kokontis, J.M.; Hause, R.J.; Hiipakka, R.A.; Liao, S.; Jones, R.B. Caffeic acid phenethyl ester suppresses the proliferation of human prostate cancer cells through inhibition of p70S6K and Akt signaling networks. Cancer Prev. Res. 2012, 5, 788–797. [Google Scholar] [CrossRef] [PubMed] [Green Version]
- He, Y.-J.; Liu, B.-H.; Xiang, D.-B.; Qiao, Z.-Y.; Fu, T. Inhibitory effect of caffeic acid phenethyl ester on the growth of SW480 colorectal tumor cells involves beta-catenin associated signaling pathway down-regulation. World J. Gastroenterol. 2006, 12, 4981–4985. [Google Scholar] [CrossRef] [PubMed]
- Xiang, D.; Wang, D.; He, Y.; Xie, J.; Zhong, Z.; Li, Z.; Xie, J. Caffeic acid phenethyl ester induces growth arrest and apoptosis of colon cancer cells via the β-catenin/T-cell factor signaling. Anticancer Drugs 2006, 17, 753–762. [Google Scholar] [CrossRef]
- Grunberger, D.; Banerjee, R.; Eisinger, K.; Oltz, E.M.; Efros, L.; Caldwell, M.; Estevez, V.; Nakanishi, K. Preferential cytotoxicity on tumor cells by caffeic acid phenethyl ester isolated from propolis. Cell. Mol. Life Sci. 1988, 44, 230–232. [Google Scholar] [CrossRef]
- Park, Y.; Han, D.-W.; Suh, H.; Ryu, G.; Hyon, S.-H.; Cho, B.; Park, J.-C. Protective effects of green tea polyphenol against reactive oxygen species-induced oxidative stress in cultured rat calvarial osteoblast. Cell Biol. Toxicol. 2003, 19, 325–337. [Google Scholar] [CrossRef]
- Borek, C. Aging and antioxidants. Fruits and vegetables are powerful armor. Adv. Nurse Pract. 2006, 14, 35–38. [Google Scholar]
- O’Byrne, D.J.; Devaraj, S.; Grundy, S.M.; Jialal, I. Comparison of the antioxidant effects of Concord grape juice flavonoids alpha-tocopherol on markers of oxidative stress in healthy adults. Am. J. Clin. Nutr. 2002, 76, 1367–1374. [Google Scholar] [CrossRef]
- Norman, G.R.; Sloan, J.A.; Wyrwich, K.W. Interpretation of changes in health-related quality of life: The remarkable Universality of half a standard deviation. Med. Care 2003, 41, 582–592. [Google Scholar] [CrossRef]
- Borek, C. Dietary Antioxidants and Human Cancer. Integr. Cancer Ther. 2004, 3, 333–341. [Google Scholar] [CrossRef]
- Kuo, H.-C.; Kuo, W.-H.; Lee, Y.-J.; Lin, W.-L.; Chou, F.-P.; Tseng, T.-H. Inhibitory effect of caffeic acid phenethyl ester on the growth of C6 glioma cells in vitro and in vivo. Cancer Lett. 2006, 234, 199–208. [Google Scholar] [CrossRef] [PubMed]
- Chen, M.-F.; Wu, C.-T.; Chen, Y.-J.; Keng, P.C.; Chen, W.-C. Cell killing and radiosensitization by caffeic acid phenethyl ester (CAPE) in lung cancer cells. J. Radiat. Res. 2004, 45, 253–260. [Google Scholar] [CrossRef] [PubMed]
- Chen, M.-J.; Chang, W.-H.; Lin, C.-C.; Liu, C.-Y.; Wang, T.-E.; Chu, C.-H.; Shih, S.-C.; Chen, Y.-J. Caffeic Acid Phenethyl Ester Induces Apoptosis of Human Pancreatic Cancer Cells Involving Caspase and Mitochondrial Dysfunction. Pancreatology 2008, 8, 558–565. [Google Scholar] [CrossRef] [PubMed]
- Dellerba, C.; Chiavarina, B.; Fenoglio, C.; Petrillo, G.; Cordazzo, C.; Boncompagni, E.; Spinelli, D.; Ognio, E.; Aiello, C.; Mariggio, M. Inhibition of cell proliferation, cytotoxicity and induction of apoptosis of 1,4-bis(1-naphthyl)-2,3-dinitro-1,3-butadiene in gastrointestinal tumour cell lines and preliminary evaluation of its toxicity in vivo. Pharmacol. Res. 2005, 52, 271–282. [Google Scholar] [CrossRef] [PubMed]
- Van Gorkom, G.N.Y.; Klein Wolterink, R.G.J.; Van Elssen, C.H.M.J.; Wieten, L.; Germeraad, W.T.V.; Bos, G.M.J. Influence of Vitamin C on Lymphocytes: An Overview. Antioxidants 2018, 7, 41. [Google Scholar] [CrossRef] [PubMed] [Green Version]
- Campbell, J.D.; Cole, M.; Bunditrutavorn, B.; Vella, A.T. Ascorbic acid is a potent inhibitor of various forms of T cell apoptosis. Cell Immunol. 1999, 194, 1–5. [Google Scholar] [CrossRef]
- Kennes, B.; Dumont, I.; Brohee, D.; Hubert, C.; Neve, P. Effect of vitamin C supplements on cell-mediated immunity in old people. Gerontology 1983, 29, 305–310. [Google Scholar] [CrossRef]
- Chen, L.; Liu, Y.; Dong, L.; Chu, X. Edaravone protects human peripheral blood lymphocytes from γ-irradiation-induced apoptosis and DNA damage. Cell Stress Chaperones 2015, 20, 289–295. [Google Scholar] [CrossRef] [Green Version]
- Lin, H.-P.; Jiang, S.S.; Chuu, C.-P. Caffeic Acid Phenethyl Ester Causes p21Cip1 Induction, Akt Signaling Reduction, and Growth Inhibition in PC-3 Human Prostate Cancer Cells. PLoS ONE 2012, 7, e31286. [Google Scholar] [CrossRef] [Green Version]
- Tolba, M.F.; Esmat, A.; Al-Abd, A.M.; Azab, S.S.; Khalifa, A.E.; Mosli, H.A.; Abdel-Rahman, S.Z.; Abdel-Naim, A.B. Caffeic acid phenethyl ester synergistically enhances docetaxel and paclitaxel cytotoxicity in prostate cancer cells. IUBMB Life 2013, 65, 716–729. [Google Scholar] [CrossRef]
- Fadillioglu, E.; Öztaş, E.; Erdoğan, H.; Yagmurca, M.; Sogut, S.; Ucar, M.; Irmak, M.K. Protective effects of caffeic acid phenethyl ester on doxorubicin-induced cardiotoxicity in rats. J. Appl. Toxicol. 2004, 24, 47–52. [Google Scholar] [CrossRef] [PubMed]
- Ozen, S.; Akyol, Ö.; Iraz, M.; Sogut, S.; Özuğurlu, F.; Ozyurt, H.; Odacı, E.; Yildirim, Z. Role of caffeic acid phenethyl ester, an active component of propolis, against cisplatin-induced nephrotoxicity in rats. J. Appl. Toxicol. 2004, 24, 27–35. [Google Scholar] [CrossRef] [PubMed]
- Kizilay, A.; Kalcioglu, M.; Özerol, E.; Iraz, M.; Güleç, M.; Akyol, O.; Ozturan, O. Caffeic Acid Phenethyl Ester Ameliorated Ototoxicity Induced by Cisplatin in Rats. J. Chemother. 2004, 16, 381–387. [Google Scholar] [CrossRef] [PubMed]
- Armagan, A.; Uz, E.; Kutluhan, S.; Soyupek, S.; Cam, H.; Uzar, E.; Yilmaz, H.; Koyuncuoglu, H.; Serel, T. Caffeic acid phenethyl ester modulates methotrexate-induced oxidative stress in testes of rat. Hum. Exp. Toxicol. 2008, 27, 547–552. [Google Scholar] [CrossRef] [PubMed]
- Yu, H.-J.; Shin, J.-A.; Yang, I.-H.; Won, D.-H.; Ahn, C.H.; Kwon, H.-J.; Lee, J.-S.; Cho, N.-P.; Kim, E.-C.; Yoon, H.-J.; et al. Apoptosis induced by caffeic acid phenethyl ester in human oral cancer cell lines: Involvement of Puma and Bax activation. Arch. Oral Biol. 2017, 84, 94–99. [Google Scholar] [CrossRef]
- Kabała-Dzik, A.; Rzepecka-Stojko, A.; Kubina, R.; Jastrzębska-Stojko, Ż.; Stojko, R.; Wojtyczka, R.D.; Stojko, J. Comparison of Two Components of Propolis: Caffeic Acid (CA) and Caffeic Acid Phenethyl Ester (CAPE) Induce Apoptosis and Cell Cycle Arrest of Breast Cancer Cells MDA-MB-231. Molecules 2017, 22, 1554. [Google Scholar] [CrossRef] [Green Version]
- Dziedzic, A.; Kubina, R.; Kabała-Dzik, A.; Tanasiewicz, M. Induction of Cell Cycle Arrest and Apoptotic Response of Head and Neck Squamous Carcinoma Cells (Detroit 562) by Caffeic Acid and Caffeic Acid Phenethyl Ester Derivative. Evid.-Based Complement. Altern. Med. 2017, 2017, 1–10. [Google Scholar] [CrossRef]
- Beauregard, A.-P.; Harquail, J.; Lassalle-Claux, G.; Belbraouet, M.; Jean-François, J.; Touaibia, M.; Robichaud, G.A. CAPE Analogs Induce Growth Arrest and Apoptosis in Breast Cancer Cells. Molecules 2015, 20, 12576–12589. [Google Scholar] [CrossRef] [Green Version]
- Watabe, M.; Hishikawa, K.; Takayanagi, A.; Shimizu, N.; Nakaki, T. Caffeic acid phenethyl ester induces apoptosis by inhibition of NFkappaB and activation of Fas in human breast cancer MCF-7 cells. J. Biol. Chem. 2004, 279, 6017–6026. [Google Scholar] [CrossRef] [Green Version]
- Yilmaz, H.R.; Uz, E.; Altunbasak, A.; Sakalli, E.; Ozçelik, N. Anticlastogenic effect of caffeic acid phenethyl ester on cisplatin-induced chromosome aberrations in rat bone marrow cells. Toxicol. Ind. Health 2010, 26, 33–37. [Google Scholar] [CrossRef]
- Santoro, V.; Jia, R.; Thompson, H.; Nijhuis, A.; Jeffery, R.; Kiakos, K.; Silver, A.R.; Hartley, J.A.; Hochhauser, D. Role of Reactive Oxygen Species in the Abrogation of Oxaliplatin Activity by Cetuximab in Colorectal Cancer. J. Natl. Cancer Inst. 2015, 108. [Google Scholar] [CrossRef] [PubMed] [Green Version]
- Bao, X.; Wu, J.; Kim, S.; LoRusso, P.; Li, J. Pharmacometabolomics Reveals Irinotecan Mechanism of Action in Cancer Patients. J. Clin. Pharmacol. 2019, 59, 20–34. [Google Scholar] [CrossRef] [Green Version]
- Chen, H.; Tran, J.-T.A.; Anderson, R.E.; Mandal, N.A. Caffeic acid phenethyl ester protects 661W cells from H2O2-mediated cell death and enhances electroretinography response in dim-reared albino rats. Mol. Vis. 2012, 18, 1325–1338. [Google Scholar]
- Sun, L.; Wang, K.; Xu, X.; Ge, M.; Chen, Y.; Hu, F. Potential Protective Effects of Bioactive Constituents from Chinese Propolis against Acute Oxidative Stress Induced by Hydrogen Peroxide in Cardiac H9c2 Cells. Evid.-Based Complement. Altern. Med. 2017, 2017, 1–10. [Google Scholar] [CrossRef] [PubMed]
- Chen, Y.-J.; Huang, A.-C.; Chang, H.-H.; Liao, H.-F.; Jiang, C.-M.; Lai, L.-Y.; Chan, J.-T.; Chen, Y.-Y.; Chiang, J. Caffeic Acid Phenethyl Ester, an Antioxidant from Propolis, Protects Peripheral Blood Mononuclear Cells of Competitive Cyclists against Hyperthermal Stress. J. Food Sci. 2009, 74, H162–H167. [Google Scholar] [CrossRef] [PubMed]
- Mosmann, T. Rapid colorimetric assay for cellular growth and survival: Application to proliferation and cytotoxicity assays. J. Immunol. Methods 1983, 65, 55–63. [Google Scholar] [CrossRef]
- Asadi-Samani, M.; Rafieian-Kopaei, M.; Lorigooini, Z.; Shirzad, H. The effect of Euphorbia szovitsii Fisch. & C.A.Mey extract on the viability and the proliferation of MDA-MB-231 cell line. Biosci. Rep. 2019, 39. [Google Scholar] [CrossRef] [Green Version]
- Kontek, R.; Matławska-Wasowska, K.; Kalinowska-Lis, U.; Kontek, B.; Ochocki, J. Evaluation of cytotoxicity of new trans-palladium(II) complex in human cells in vitro. Acta Pol. Pharm. 2011, 68, 127–136. [Google Scholar]
- Pecio, Ł.; Hassan, E.M.; Omer, E.A.; Gajek, G.; Kontek, R.; Sobieraj, A.; Stochmal, A.; Oleszek, W. Cytotoxic Cardenolides from the Leaves of Acokanthera oblongifolia. Planta Med. 2019, 85, 965–972. [Google Scholar] [CrossRef] [Green Version]
- Singh, N.P.; McCoy, M.T.; Tice, R.R.; Schneider, E.L. A simple technique for quantitation of low levels of DNA damage in individual cells. Exp. Cell Res. 1988, 175, 184–191. [Google Scholar] [CrossRef] [Green Version]
- Kontek, R.; Drozda, R.; Sliwinski, M.; Grzegorczyk, K. Genotoxicity of irinotecan and its modulation by vitamins A, C and E in human lymphocytes from healthy individuals and cancer patients. Toxicol. In Vitro 2010, 24, 417–424. [Google Scholar] [CrossRef] [PubMed]
- Liao, W.; McNutt, M.A.; Zhu, W.-G. The comet assay: A sensitive method for detecting DNA damage in individual cells. Methods 2009, 48, 46–53. [Google Scholar] [CrossRef] [PubMed]
- Końca, K.; Lankoff, A.; Banasik, A.; Lisowska, H.; Kuszewski, T.; Góźdź, S.; Koza, Z.; Wojcik, A. A cross-platform public domain PC image-analysis program for the comet assay. Mutat. Res. Mol. Mech. Mutagen. 2003, 534, 15–20. [Google Scholar] [CrossRef]
- Tice, R.R.; Agurell, E.; Anderson, D.; Burlinson, B.; Hartmann, A.; Kobayashi, H.; Miyamae, Y.; Rojas, E.; Ryu, J.C.; Sasaki, Y.F. Single cell gel/comet assay: Guidelines for in vitro and in vivo genetic toxicology testing. Environ. Mol. Mutagen. 2000, 35, 206–221. [Google Scholar] [CrossRef]
- Ruiz-Leal, M.; George, S. An in vitro procedure for evaluation of early stage oxidative stress in an established fish cell line applied to investigation of PHAH and pesticide toxicity. Mar. Environ. Res. 2004, 58, 631–635. [Google Scholar] [CrossRef] [PubMed]
Sample Availability: Samples of the compound are not available from the authors. |


| IC50 a | |||||
|---|---|---|---|---|---|
| CAPE | CPT-11 | SN38 | CAPE + CPT-11 | CAPE + SN38 | |
| AGS | 8.0 ± 1.8 µM | 8.0 ± 2.4 µM | 0.8 ± 1.6 µM | 8 ± 1.7 µM | 0.9 ± 0.3 µM |
| HCT116 | 8.0 ± 2.1 µM | 4.5 ± 1.9 µM | 0.5 ± 0. 9 µM | 5 ± 2.1 µM | 0.5 ± 0.7 µM |
| HT29 | 24.0 ± 2.4 µM | 8.5 ± 2.9 µM | 0.3 ± 1.0µM | 8.5 ± 1.1 µM | 0.25 ± 0.8 µM |
| PBLs | ni | 200 ± 5.2 µM | 16 ± 3.2 µM | ni | ni |
© 2020 by the authors. Licensee MDPI, Basel, Switzerland. This article is an open access article distributed under the terms and conditions of the Creative Commons Attribution (CC BY) license (http://creativecommons.org/licenses/by/4.0/).
Share and Cite
Gajek, G.; Marciniak, B.; Lewkowski, J.; Kontek, R. Antagonistic Effects of CAPE (a Component of Propolis) on the Cytotoxicity and Genotoxicity of Irinotecan and SN38 in Human Gastrointestinal Cancer Cells In Vitro. Molecules 2020, 25, 658. https://doi.org/10.3390/molecules25030658
Gajek G, Marciniak B, Lewkowski J, Kontek R. Antagonistic Effects of CAPE (a Component of Propolis) on the Cytotoxicity and Genotoxicity of Irinotecan and SN38 in Human Gastrointestinal Cancer Cells In Vitro. Molecules. 2020; 25(3):658. https://doi.org/10.3390/molecules25030658
Chicago/Turabian StyleGajek, Gabriela, Beata Marciniak, Jarosław Lewkowski, and Renata Kontek. 2020. "Antagonistic Effects of CAPE (a Component of Propolis) on the Cytotoxicity and Genotoxicity of Irinotecan and SN38 in Human Gastrointestinal Cancer Cells In Vitro" Molecules 25, no. 3: 658. https://doi.org/10.3390/molecules25030658