Article

In Depth Analysis of Photovoltaic Performance of Chlorophyll Derivative-Based “All Solid-State” Dye-Sensitized Solar Cells

1
ICGM, Univ. Montpellier, CNRS, ENSCM, CC1701, Place Eugène Bataillon, 34095 Montpellier, France
2
Service des Matériaux Polymères et Composites (SMPC), Centre d’Innovation et de Recherche en Matériaux et Polymères (CIRMAP), Université de Mons, 20 Place du Parc, 7000 Mons, Belgium
3
Department of Pure and Applied Sciences (DiSPeA), University of Urbino, 61029 Urbino, Italy
4
Laboratory for Chemistry of Novel Materials, CIRMAP, University of Mons UMONS, 20 Place du Parc, 7000 Mons, Belgium
5
CNRS, Univ. Limoges, XLIM, UMR 7252, F-87000 Limoges, France
*
Authors to whom correspondence should be addressed.
Molecules 2020, 25(1), 198; https://doi.org/10.3390/molecules25010198
Submission received: 27 November 2019 / Revised: 21 December 2019 / Accepted: 28 December 2019 / Published: 3 January 2020
(This article belongs to the Special Issue Sol-Gel Chemistry. From Molecule to Functional Materials)

Abstract

:
Chlorophyll a derivatives were integrated in “all solid-state” dye sensitized solar cells (DSSCs) with a mesoporous TiO2 electrode and 2′,2′,7,7′-tetrakis[N,N-di(4-methoxyphenyl)amino]-9,9′-spirobifluorene as the hole-transport material. Despite modest power conversion efficiencies (PCEs) between 0.26% and 0.55% achieved for these chlorin dyes, a systematic investigation was carried out in order to elucidate their main limitations. To provide a comprehensive understanding of the parameters (structure, nature of the anchoring group, adsorption …) and their relationship with the PCEs, density functional theory (DFT) calculations, optical and photovoltaic studies and electron paramagnetic resonance analysis exploiting the 4-carboxy-TEMPO spin probe were combined. The recombination kinetics, the frontier molecular orbitals of these DSSCs and the adsorption efficiency onto the TiO2 surface were found to be the key parameters that govern their photovoltaic response.

Graphical Abstract

1. Introduction

Fossil fuel resource exhaustion, increasing energy demands and environmental problems have triggered an intensification of research for sustainable energy sources, which lead to the development of photovoltaic devices, fuel cells, wind turbines, etc. Photovoltaic conversion of solar energy is considered to be one of the most significant ways of addressing the growing global energy crisis [1]. In this context, utilizing biomass resources for the conversion of solar energy has been receiving increasing attention from industry, academia and governments and will become a major challenge of our future [2,3,4]. Biomass has a great potential as a renewable feedstock for producing solar energy [5,6]. Indeed, protein-pigment complexes in plants, green algae, and cyanobacteria convert solar energy into chemical energy through oxygenic photosynthesis with high efficiency [7,8,9]. Calvin showed through a model based on a photosynthetic electron transport system containing membranes, carotenoids and pigments that electric energy can be obtained by conversion of sunlight [10]. A similar approach based on an artificial photosynthesis led in 1991 to dye-sensitized solar cells (DSSCs, also known as Grätzel cells) [11]. A DSSC consists of a mesoporous nanocrystalline n-type semiconductor (typically TiO2) sensitized with a dye, deposited onto an anode and immersed in redox active electrolyte (generally triiodide/iodide), completed by a counter-electrode (cathode) [12]. Upon illumination, dye molecules anchored onto the TiO2 surface absorb incoming photons, allowing the photoinduced electron-transfer from their excited state into the TiO2 conduction band. Then, the electrons are transferred to the counter electrode, thus creating a current. The redox electrolyte reduces the oxidized dye molecules back to their ground state to enable continuous electron production. Even if power conversion efficiencies (PCEs) above 13% have been reached for liquid-electrolyte DSSCs [13,14], improvements are still required in order to be commercially viable.
First, there is a crucial need for solid-state approaches since the use of liquid electrolytes is a major hurdle for commercialization by industry due to the corrosive nature of the commonly used I3/I redox shuttle [15,16]. DSSCs incorporating solid-state hole transport materials (HTMs) have been actively investigated [17,18,19], and decent efficiencies close to 12% have been already achieved by molecular and inorganic HTMs combined with state-of-the-art organic dyes [20,21]. Additionally, solid-state DSSCs (ssDSSCs) led to a major breakthrough by using hybrid lead halide perovskite sensitizers such as CH3NH3PbIxCl3-x, enabling the advent of perovskite solar cells with efficiencies now above 25% [22]. However, important issues concerning the device stability and the toxicity of the components still remain.
Secondly, it is highly required to use efficient and cost-effective dyes in place of expensive and scarce ruthenium complexes [23,24] or elaborated organic dyes requiring numerous synthetic steps [15,25]. In contrast, natural organic dyes and their derivatives are promising candidates for developing DSSCs due to their low cost, abundance and non-toxicity [5]. An important biomass resource developed in the south of France is spirulina, a green algae mainly used as food supplement. One of the most valuable compound that can be extracted from spirulina is chlorophyll a, (Chl a—12 g/kg) [26] a photo- and electroactive chlorin-type macrocycle involved in photosynthesis, because it efficiently absorbs light in the 400–450 nm and the 600–700 nm regions and up to 800 nm depending of its aggregation state [27]. The use of chlorophyll derivatives as sensitizers has been investigated in liquid electrolyte-based DSSCs leading to energy-to-electricity conversion efficiency (η) up to around 8% [28,29,30]. Concerning solid-state DSSC, there are only a few reports in the literature describing the use of chlorophyll a derivatives as dye [31,32,33].
Herein, we report the preparation of all-solid state DSSCs using a series of Chl a derivatives (Figure 1) as sensitizers with different anchoring groups to graft to the TiO2 surface and 2′,2′,7,7′-tetrakis[N,N-di(4-methoxyphenyl)amino]-9,9′-spirobifluorene (spiro-OMeTAD) as HTM. The choice of spiro-OMeTAD HTM was motivated by its facile implementation and high performance rendering it particularly suitable for testing DSSCs. To elucidate the relationship between the molecular structure of the dye and the photovoltaic efficiency, UV-Vis absorption spectroscopy, density functional theory (DFT) calculations, incident photon-to-current efficiency (IPCE), transient photovoltage decay measurements and EPR analysis exploiting the spin probe 4-carboxy-2,2,6,6-tetramethylpiperidine 1-oxyl (4-carboxy-TEMPO, indicated as 4C-T) have been carried out.

2. Results

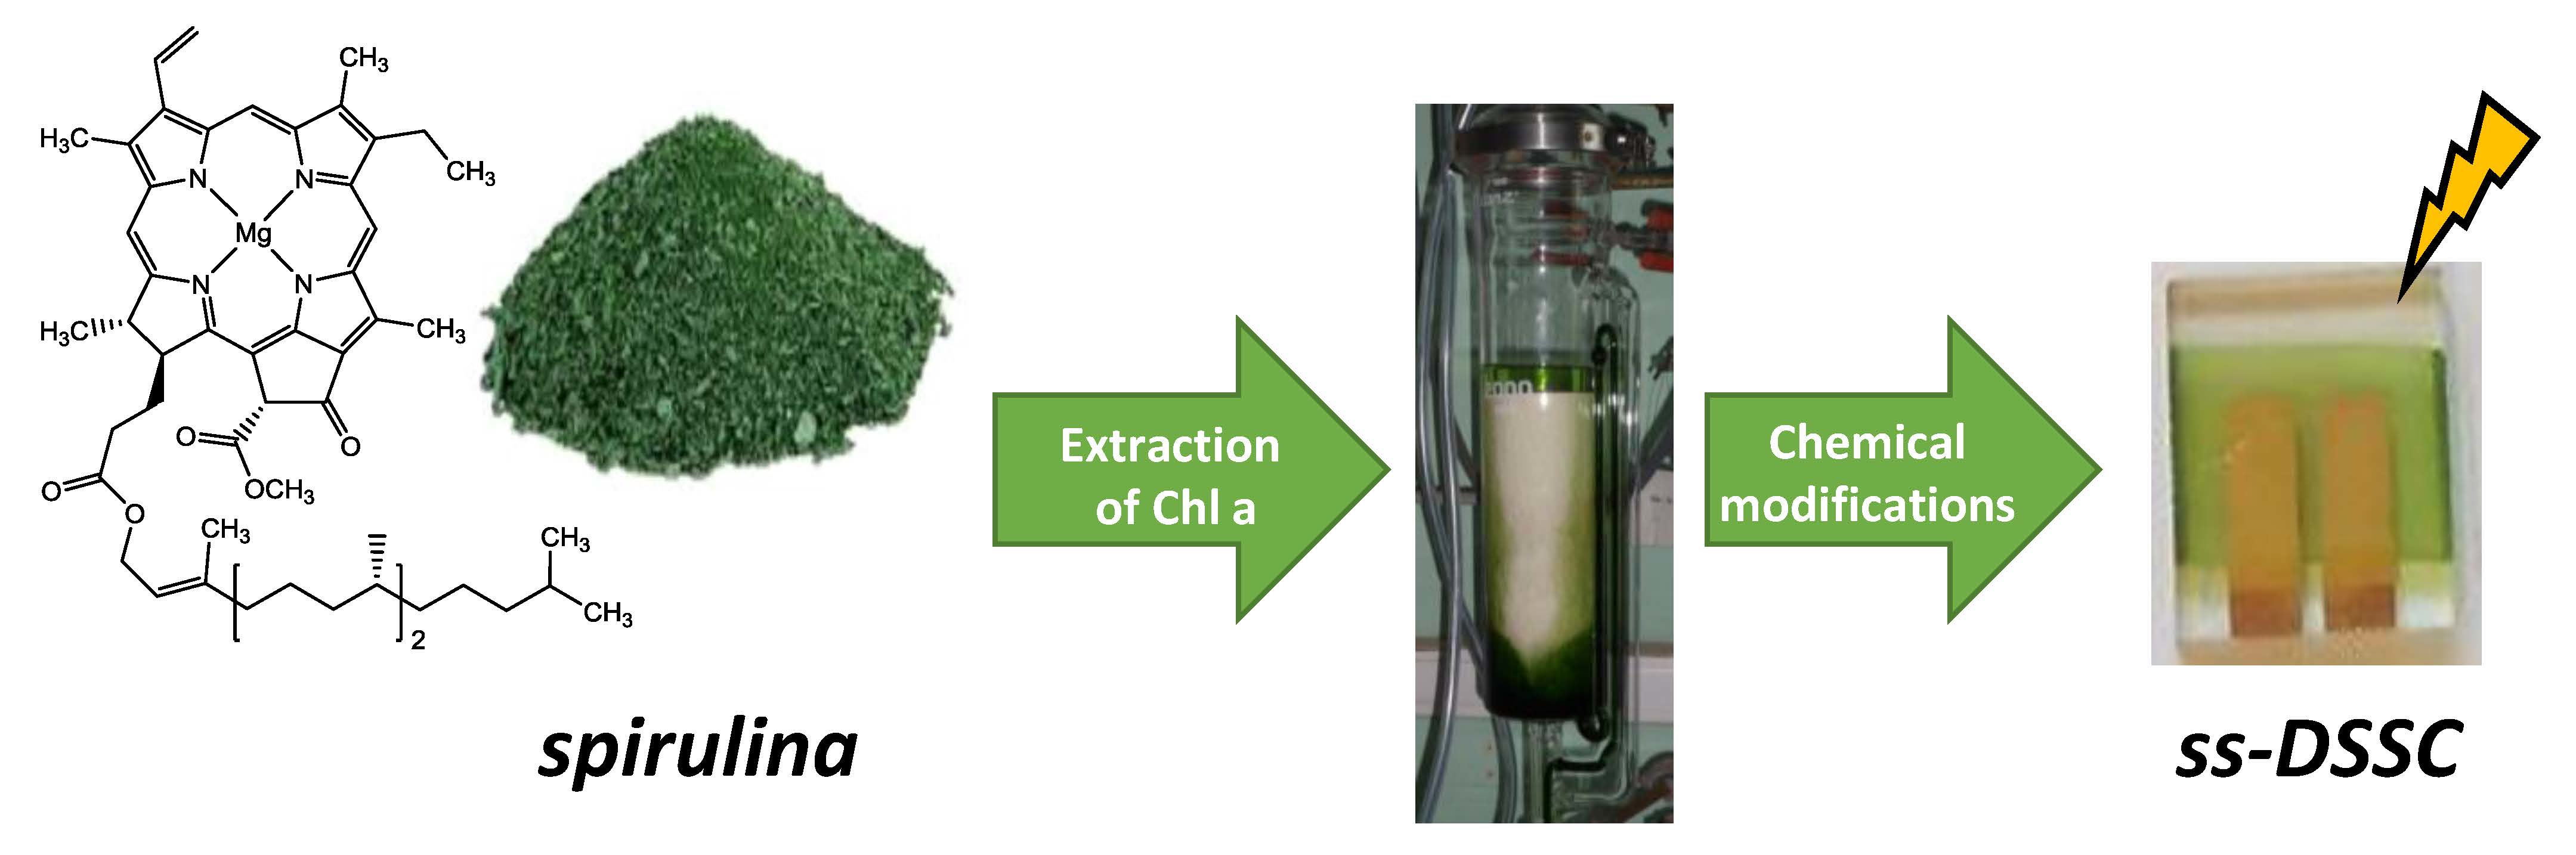
2.1. Synthesis of the Dyes Derived from Chlorophyll a

The chemical structures of chlorophyll a-based dye sensitizers depicted in Scheme 1 were obtained from methyl pyropheophorbide-a (MPPa). MPPa was prepared in four steps: (i) extraction of Chl a from spirulina biomass with ethanol, (ii) demetallation of Chl a, (iii) acid-catalyzed transesterification of the phytyl chain in methanol, and (iv) decarboxylation of the ester moiety located on the 13-position with 2,4,6-collidine [34,35]. Three families of corresponding free-base and zinc chlorins can be distinguished depending on the localization of the anchoring group. All the chlorins have one carboxylic acid for grafting onto the TiO2 surface. Chlorins M1M2 exhibit a non-conjugated alkyl anchoring group while the others possess either a conjugated vinyl anchoring group (M3M4) or a cyanoacrylic group along the Qy axis of the chlorin skeleton (M5M6).
M1 was synthesized through the acid hydrolysis of MPPa with hydrochloric acid in acetone. Methyl pyropheophorbide-d (MPPd) was prepared by cleavage of the alkene in the presence of osmium tetroxide (OsO4) and sodium periodate (NaIO4) [35]. Trans-32-carboxy-pyropheophorbide-a (M3) was synthesized in two steps: (a) a Wittig reaction with MPPd and (b) the hydrolysis with TFA of the corresponding Chlorin-1. A Knoevenagel reaction of MPPd with cyanoacetic acid in piperidine/THF yielded chlorin M5. Finally, metalation reactions of the free base chlorins M1, M3, and M5 with Zn(OAc)2 in MeOH/THF afforded the corresponding zinc complexes M2, M4, and M6.

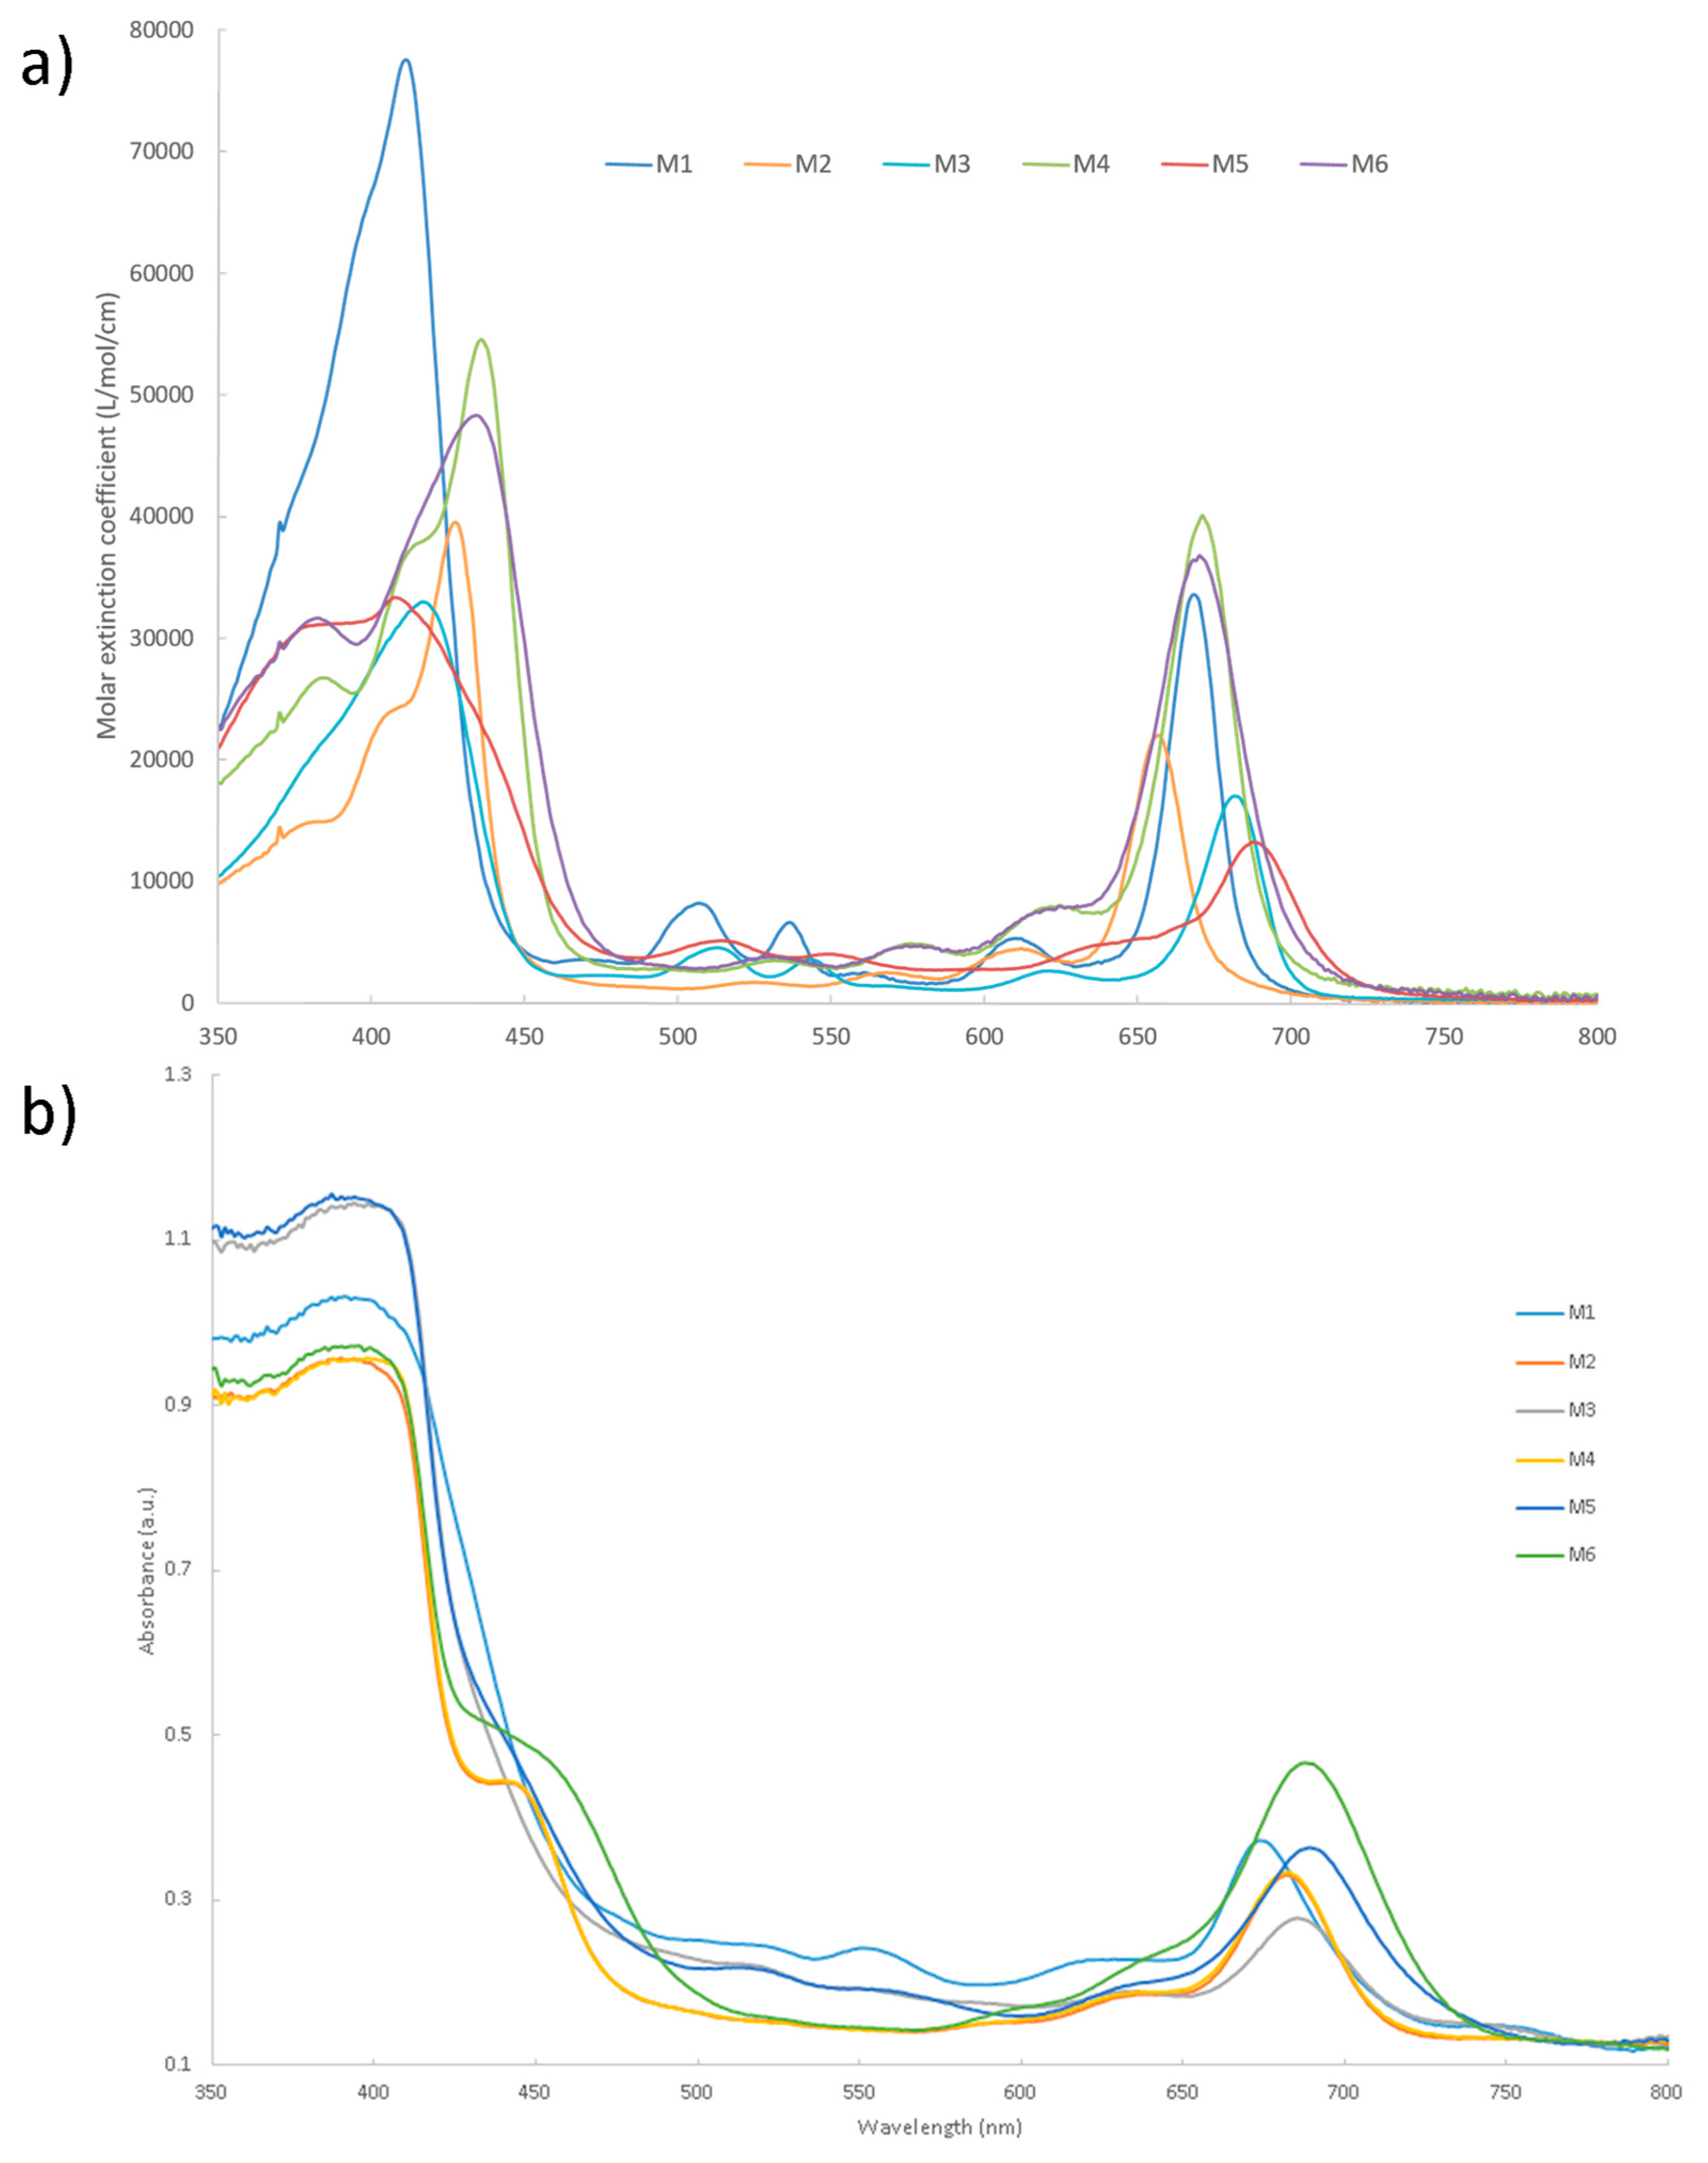
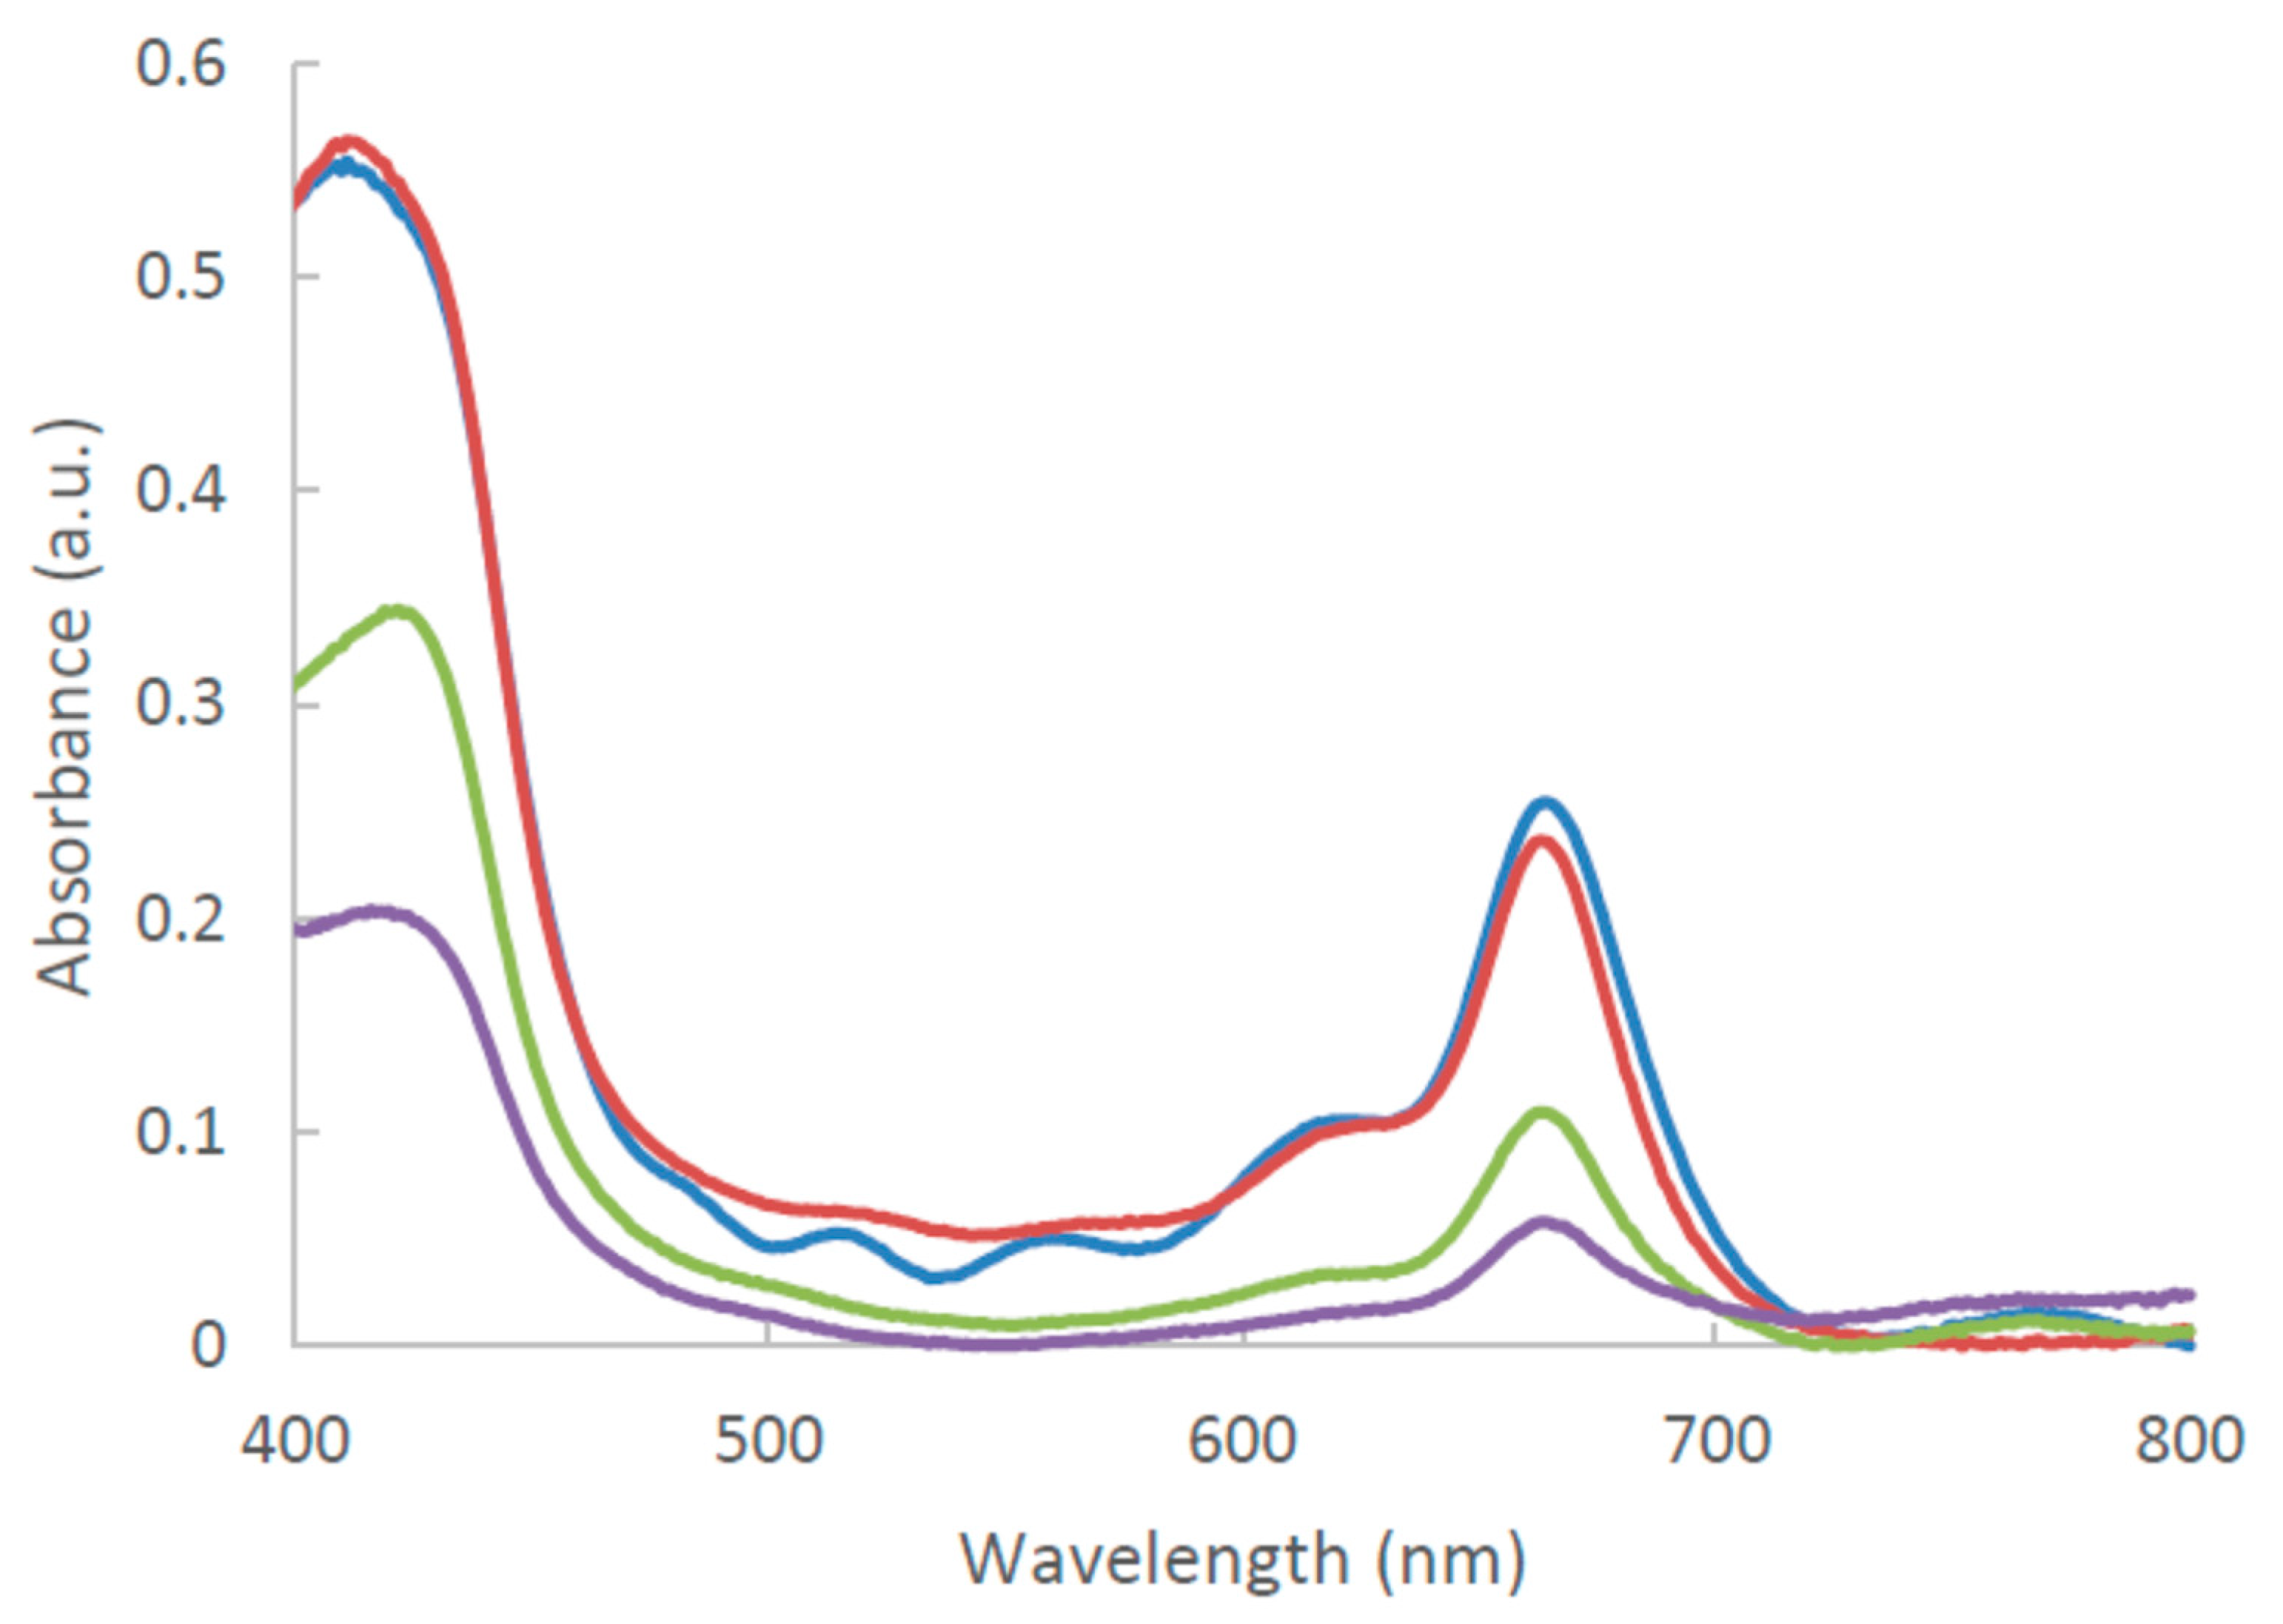
2.2. Optical Properties of Chlorin Derivatives

The UV-Visible absorption spectra of chlorins M1M6 both in THF and grafted on the TiO2 surface through carboxylate bonding are presented in Figure 1. Table 1 summarizes their characteristics in THF and on TiO2. The shape of the UV-Visible absorption spectra in THF are relatively similar, with five observed bands when going from blue to red: Soret, Qx (0,1), Qx (0,0), Qy(0,1), and Qy(0,0). The Qy peaks position of the vinyl-substituted chlorins M3M6 are redshifted by about 10–20 nm in comparison with chlorins M1M2 due to the introduction of electron-withdrawing groups on the vinyl moiety at the C3 position. The bathochromic shifts of the Qy peaks of chlorins M5M6 are larger than those observed for M3 (7–15 nm) and M4 (1–4 nm) because of the higher electron-withdrawing ability of the cyano group. Upon zinc metalation, the Soret absorption bands are redshifted (chlorins M2, M4, and M6), implying an increase of the conjugated π-electron delocalization along X axis while the hypsochromic shift of the Qy indicates a decrease of the extent of conjugated π-electron delocalization along Y axis [36].
Figure 1. (a) UV-Visible absorption spectra of chlorins M1M6 in THF and (b) grafted onto the TiO2 surface.
Molecules 25 00198 g001
The binding of the chlorin dyes onto the TiO2 surface leads to a broadening of the absorption bands, probably due to π stacking interactions between chlorin dye molecules, as extensively studied in previous investigations [37]. The comparison of the chlorin absorption spectra in THF solutions as the monomeric species (Figure 1a) and on TiO2 as aggregates also reveal that the QY bands shift to longer wavelengths suggesting the formation of J aggregates [31].

2.3. Photovoltaic Performance of Chlorin Derivatives

2.3.1. Influence of the Co-Adsorbent

The π stacking of dyes when grafted onto the TiO2 surface was evidenced from the UV-Visible absorption spectra, as discussed above. Such aggregation is known to affect the photoelectron injection efficiency and thus, the overall conversion efficiency [38,39]. A typical way to lower the dye aggregation at the semiconductor interface consists in using co-adsorbents such as chenodeoxycholic acid (CDCA), the most commonly used additive in DSSC preparation [40,41,42]. Indeed, its strong binding to the TiO2 surface partly displaces dye molecules, reducing their self-aggregation. Nevertheless, the addition of co-adsorbent molecules also reduces the dye loading and thus, photon harvesting. It is therefore crucial to judiciously adjust the amount of co-adsorbent used during the impregnation. To optimize the loading of the co-adsorbent in the dye solution, the impregnation was performed for 15 h using different concentrations of CDCA (from 0 to 3 mM) in a 0.3 mM THF solution of the dye. The choice of THF was motivated by the good solubility of the free-base and zinc-metalated chlorin in that solvent.
To determine the amount of dye M2 grafted onto the TiO2 surface as a function of the concentration of co-adsorbent, UV-Visible absorption measurements were performed (Figure 2). Dye M2 grafted from a 0.3 mM solution shows an absorbance of 0.55 for the Soret absorption band at around 420 nm and 0.25 for the lower energy Q band at around 665 nm. This value dramatically decreased when the concentration of co-adsorbent was increased up to 3 mM and this spectral evolution is in good agreement with previous studies reported in the literature [43,44]. Indeed, the co-adsorbent tends to decrease the adsorption of dye M2 via a competitive anchoring process, thereby decreasing the dye concentration and thus, the dye aggregation onto the TiO2 surface.
The current density–voltage (J–V) characteristics of the corresponding devices were then measured and are depicted in Figure 3. The extracted photovoltaic parameters are presented in Table 2. To evaluate the efficiency of our fabrication process and thus, the accuracy of the collected data, a solar cell based on the well-known organic dye, D102, was used as reference [45,46].
The performance obtained for the reference cell is in agreement with those previously reported in the literature [45,46]. Modest photovoltaic performances are observed for dye M2 compared to liquid DSSCs, where the short-circuit current density (JSC) was found to be reduced by a factor of about 10. This finding could mainly be attributed to the reduction in the electrode thickness for solid-state devices, leading to a lower light harvesting efficiency of the active layer. The devices where the TiO2 electrode was sensitized with the dye M2 alone, gave photovoltaic efficiencies of 0.19%. When M2 was combined with CDCA, the PCE increased up to 0.56% for the 1:5 molar ratio. Further increase in co-adsorbent to the 1:10 molar ratio caused a decrease in efficiency (η = 0.42%), attributed to the dye loading reduction.
The incident photon-to-current efficiency (IPCE) recorded for the above mentioned ssDSSCs indicates that the photocurrent response of M2-based DSSC impregnated with 1.5 mM of co-adsorbent exceeds 4% for the last Q band at 675 nm, which is higher than the response without co-adsorbent (2% at the same wavelength; Figure 4). The estimated photocurrent, obtained by integrating the IPCE spectra over the AM1.5G solar spectrum, was consistent with the photocurrent measured under solar simulator and reported in Table 2. Adding 1.5 mM of co-adsorbent for the impregnation enabled to double the current density value from 0.60 to 1.30 mA·cm−2 (0.73 vs. 1.73 mA·cm−2 in Table 2, respectively). The increased quantum yield was ascribed to the reduction of dye aggregation in the presence of CDCA as co-adsorbent, which minimized the intermolecular energy transfer and increased the electron injection efficiency. This effect compensated the loss of light harvesting caused by the lower dye content of the TiO2 photoanode with CDCA as co-adsorbent and led to the improvement of the current density. Based on this result, a concentration of 1.5 mM of co-adsorbent was chosen for the preparation of ssDSSCs since it offered the best compromise between light harvesting and power conversion efficiency.

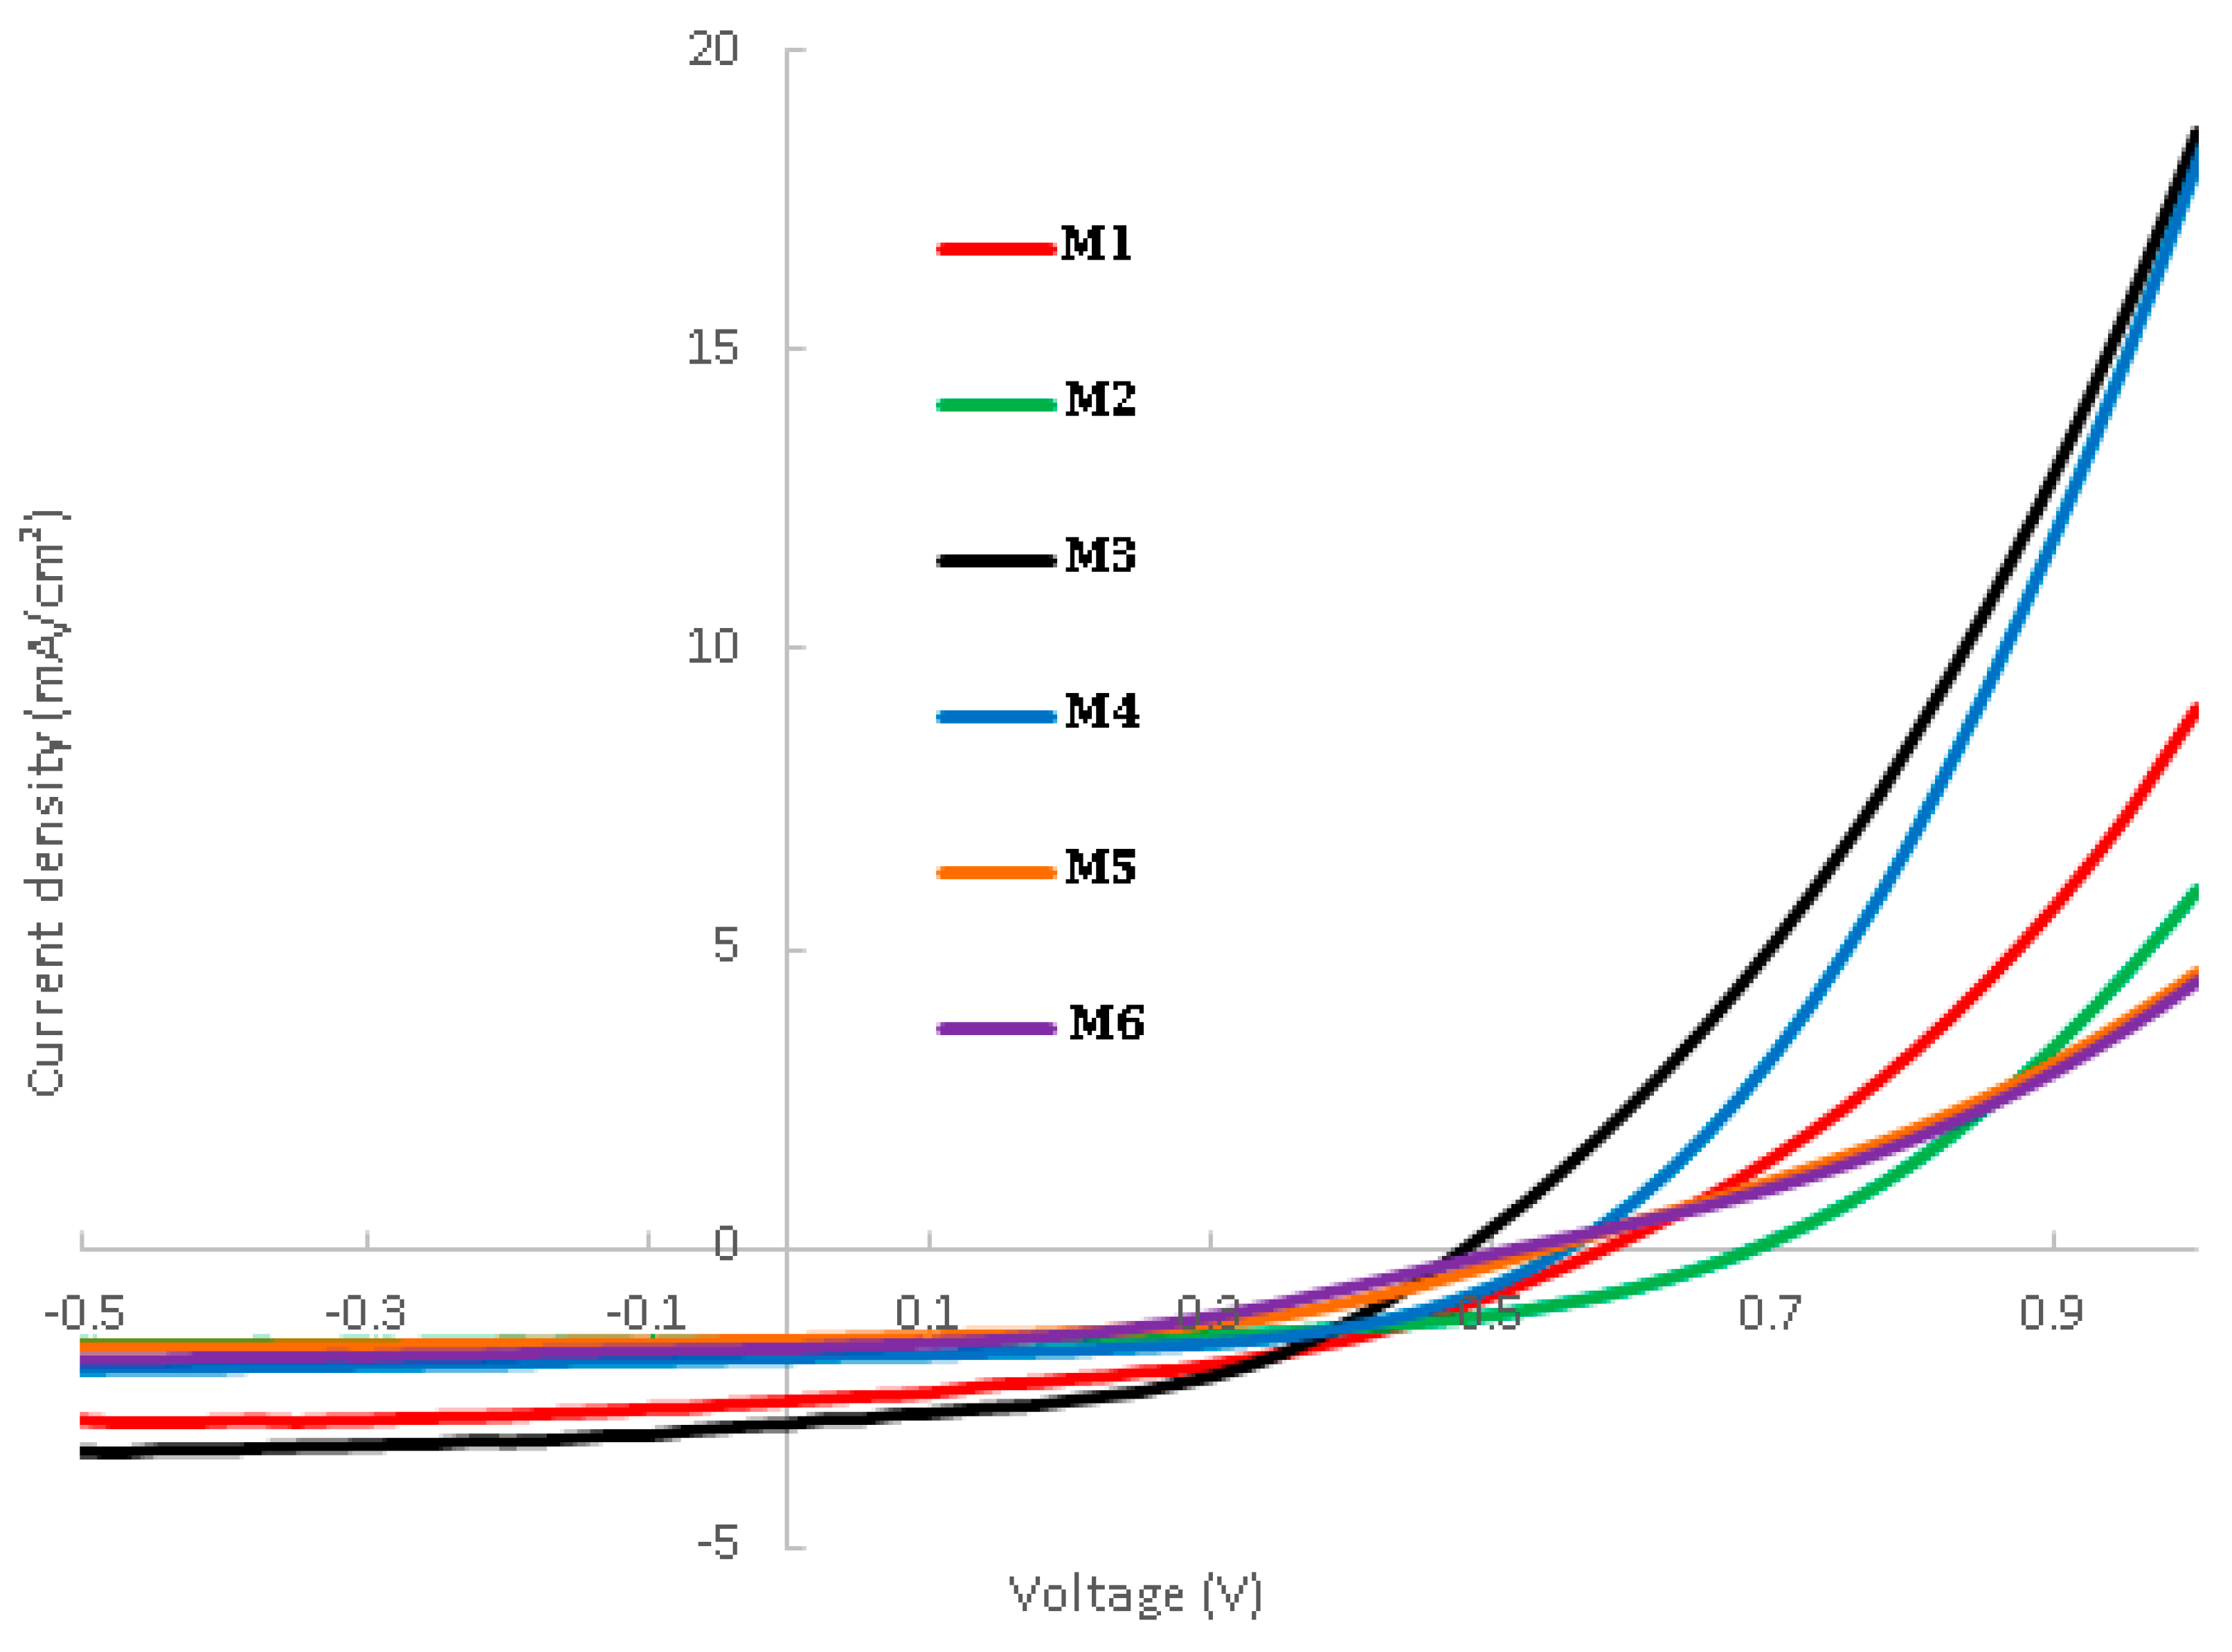
2.3.2. Photovoltaic Measurements for the Other Chlorin Derivatives

Figure 5 shows the J–V characteristics of the ssDSSCs prepared from dyes M1 to M6 (0.3 mM in THF) and CDCA co-adsorbent (1.5 mM in THF). The corresponding photovoltaic data are listed in Table 3.
Compared to the D102 performances, those obtained with chlorin dyes were low (Table 3). Nevertheless, only a few publications have described the fabrication of ssDSSCs with chlorophyll derivatives and the values obtained here are in line with those reported [31]. They were even better than the performances obtained in some liquid-DSSCs with other chlorophyll derivatives [47,48,49,50]. ssDSSCs based on dye M3 gave the highest PCE (0.67%) due to the highest short-circuit current (JSC), while the open-circuit photovoltage (VOC) and fill factors (FF) were found to be similar to other chlorin dyes, except for M2, which showed the highest VOC value. In terms of grafting groups, the PCE values for ssDSSCs based on chlorin dyes exceed 0.26% in the following order: acrylic acid > alkyl acid > cyanoacrylic acid. The introduction of cyano electron-withdrawing groups in chlorins M5M6 indeed strongly decreased the JSC values, resulting in the ssDSSCs with the lower performances. This trend has been already observed when such chlorin dyes were used in liquid DSSCs [51]. Nevertheless, the difference observed in ssDSSCs was not as dramatic as in liquid DSSCs. For instance, the presence of cyano groups on the free base chlorin M3 drastically decreased the PCE in liquid DSSCs by around 75% while the decrease represents only 37% in ssDSSCs.

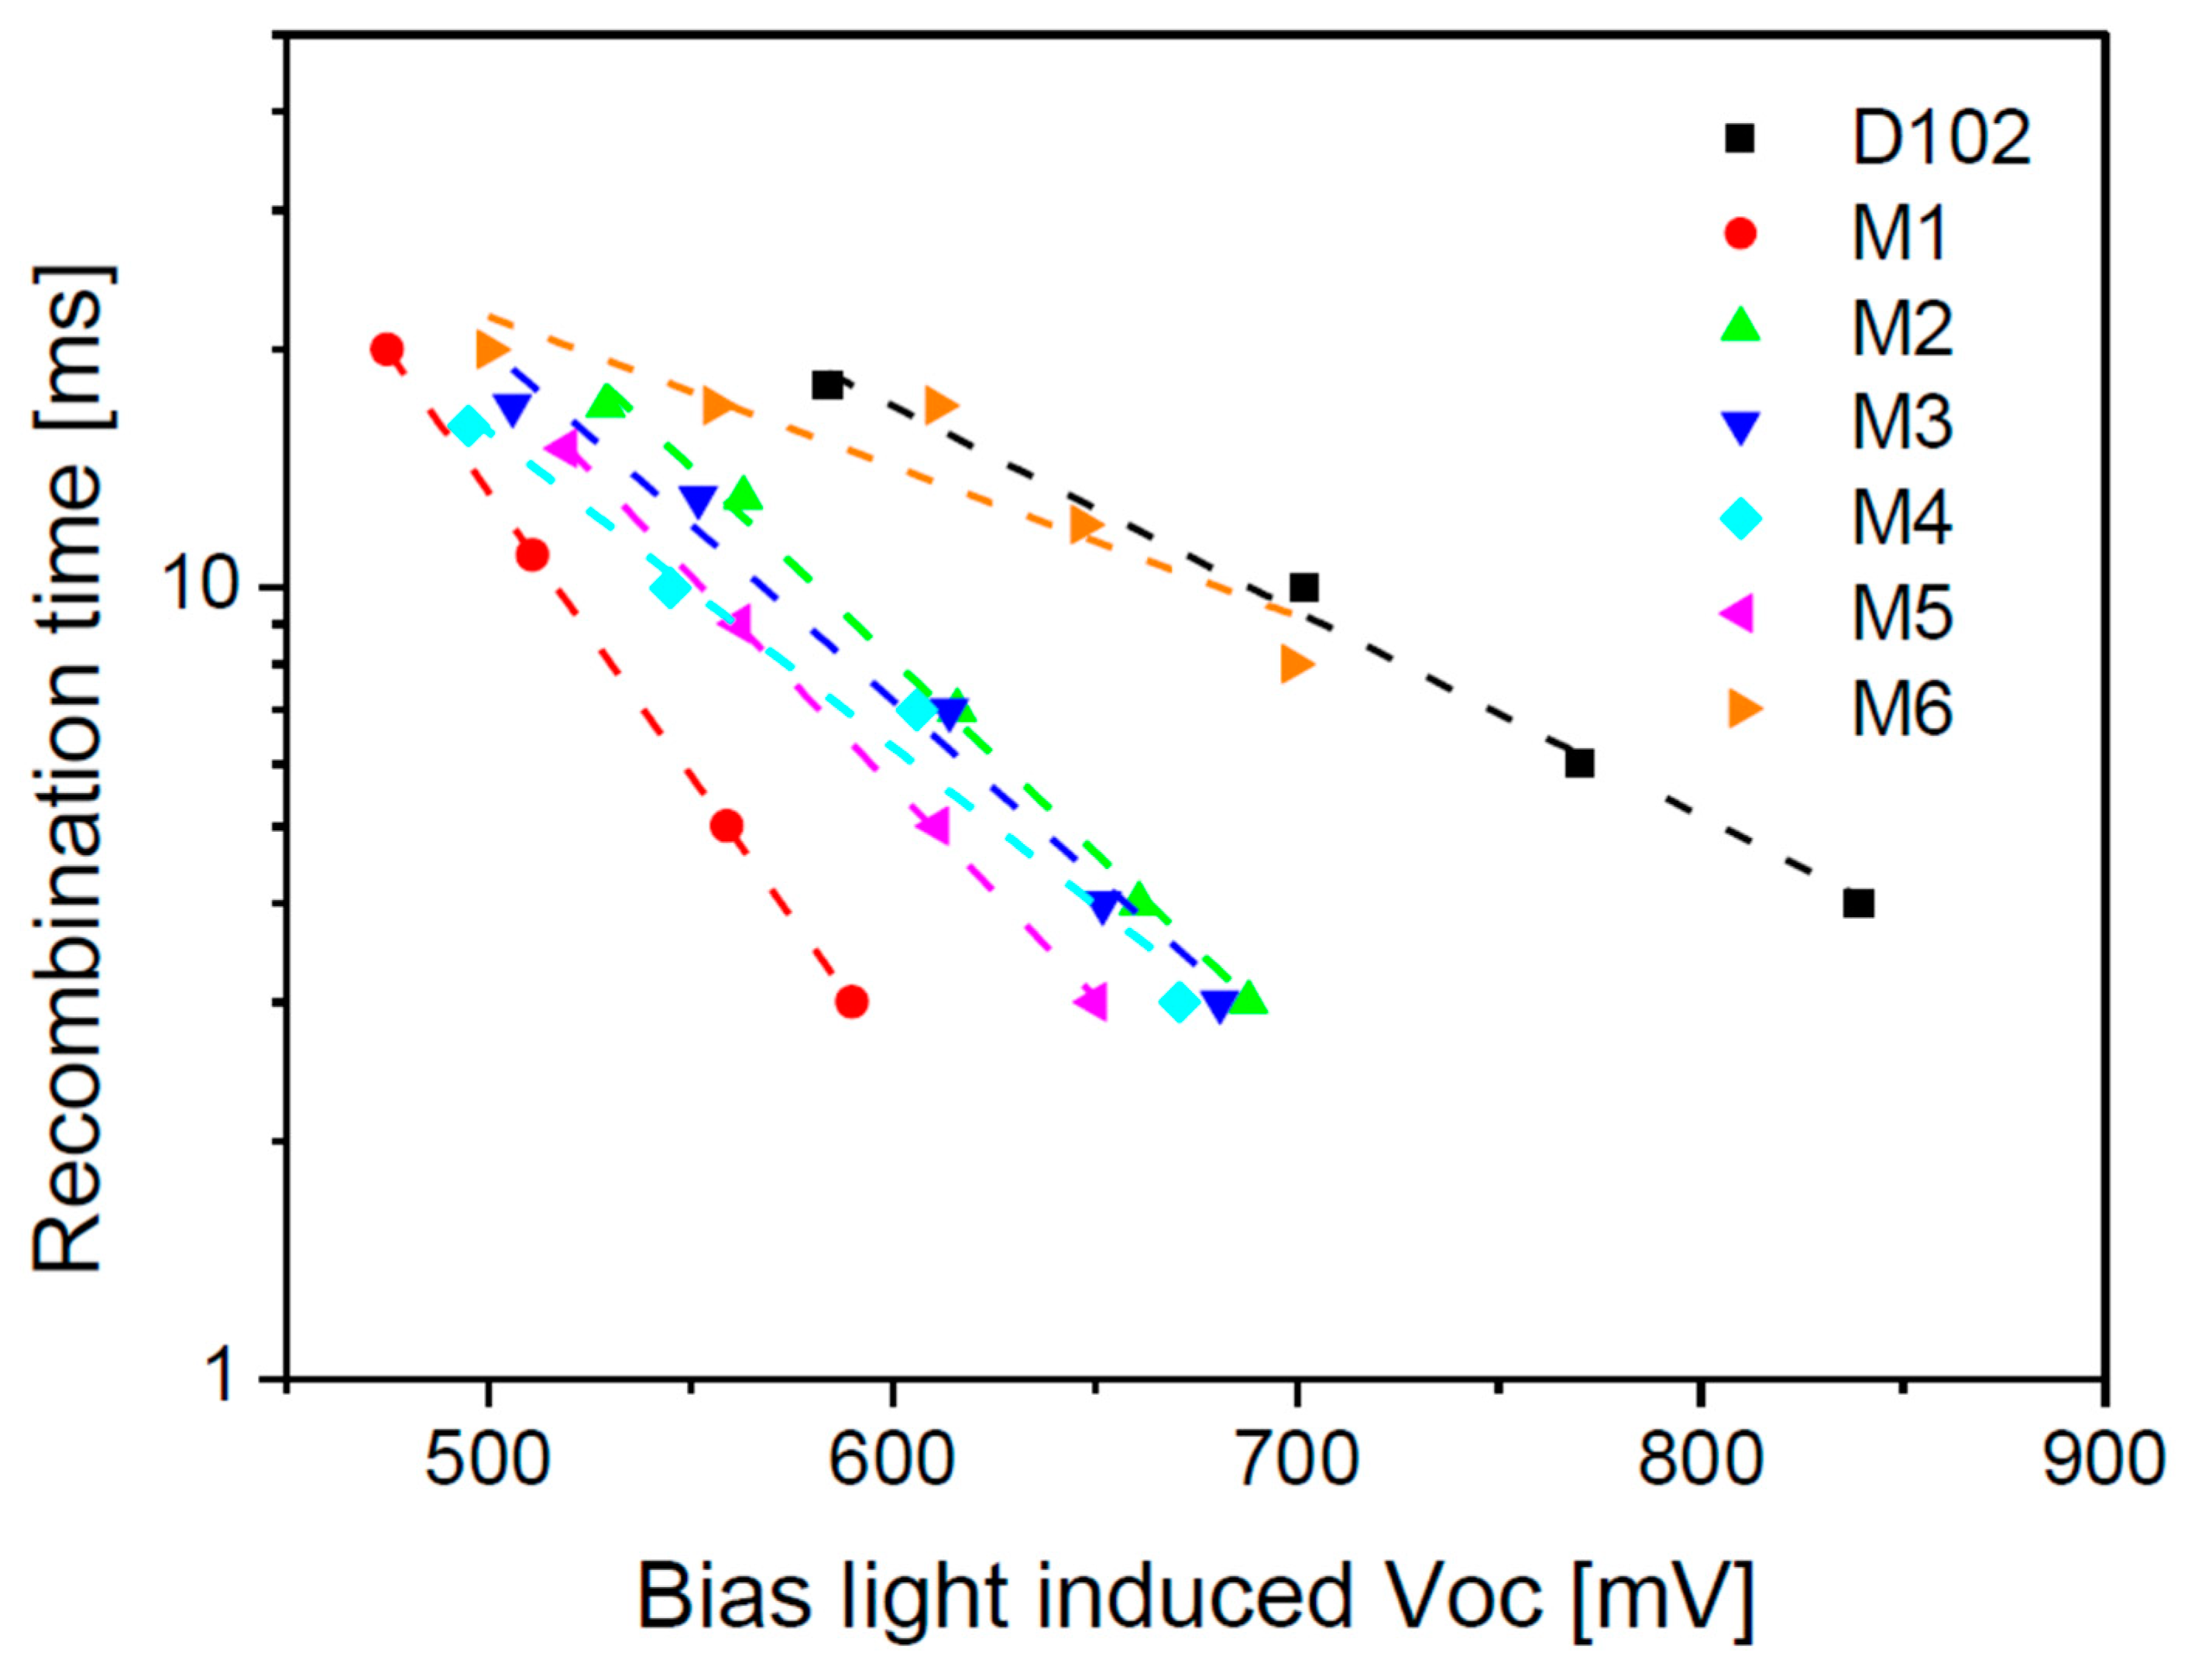
2.3.3. Recombination Kinetics

To examine the recombination kinetics of chlorin-based ssDSSCs, transient photovoltage decay measurements (TPV) measurements were carried out and compared to D102. Since the porous electrode and the anchoring groups of the dyes are quite similar (i.e., same fabrication process and only one carboxylic anchoring function on each dye), TPV measurements reflect the direct influence of the dye on the TiO2/dye/spiro-OMeTAD interface. The observed differences in recombination kinetics could mainly be attributed to the chemical nature and/or steric conformation of the dye at the TiO2 surface as well as the contribution from the dye/spiro-OMeTAD interface. The observed difference in slope between D102 and the chlorin dye sensitizers indicates that different recombination mechanisms took place in ssDSSCs sensitized with these compounds (Figure 6). The recombinations for chlorin-sensitized solar cells appeared to be faster than that with D102, thus leading to a VOC loss. This result was coherent with the photovoltaic parameters obtained under illumination. Indeed, chlorin-based ssDSSCs exhibited VOC values around 550 mV, except for M2 whereas that based on the D102 dye sensitizer led to a VOC of 760 mV.
Besides, chlorin dyes M3 and M5 show an enhanced electron lifetime in comparison with the M1 analog. Electron lifetime associated with dye M3 was also slightly larger than that of dye M5, which suggests acrylic acid anchoring group was more favorable than cyanoacrylic acid anchoring group to decrease the charge recombination at the TiO2/electrolyte interface. However, the performances of ssDSSCs based on M5 were lower than those based on M1. Since the dye M1 contains a non-conjugated anchoring group, M1 may lie rather flat on the TiO2 surface due the larger flexibility of the alkyl spacer, whereas the more rigid conjugated spacer of M3 and M5 probably favors tilted or up-right adsorption. Finally, the influence of the zinc metal center was more difficult to interpret: on one hand, M2 presented a significant increase in electron lifetime compared to M1; on the other hand, M3 and M4 were in the same range. These findings were coherent with the photovoltaic parameters obtained under illumination. As discussed above, M2 exhibited a higher Voc than M1 while the Voc was approximately the same for M3 and M4.

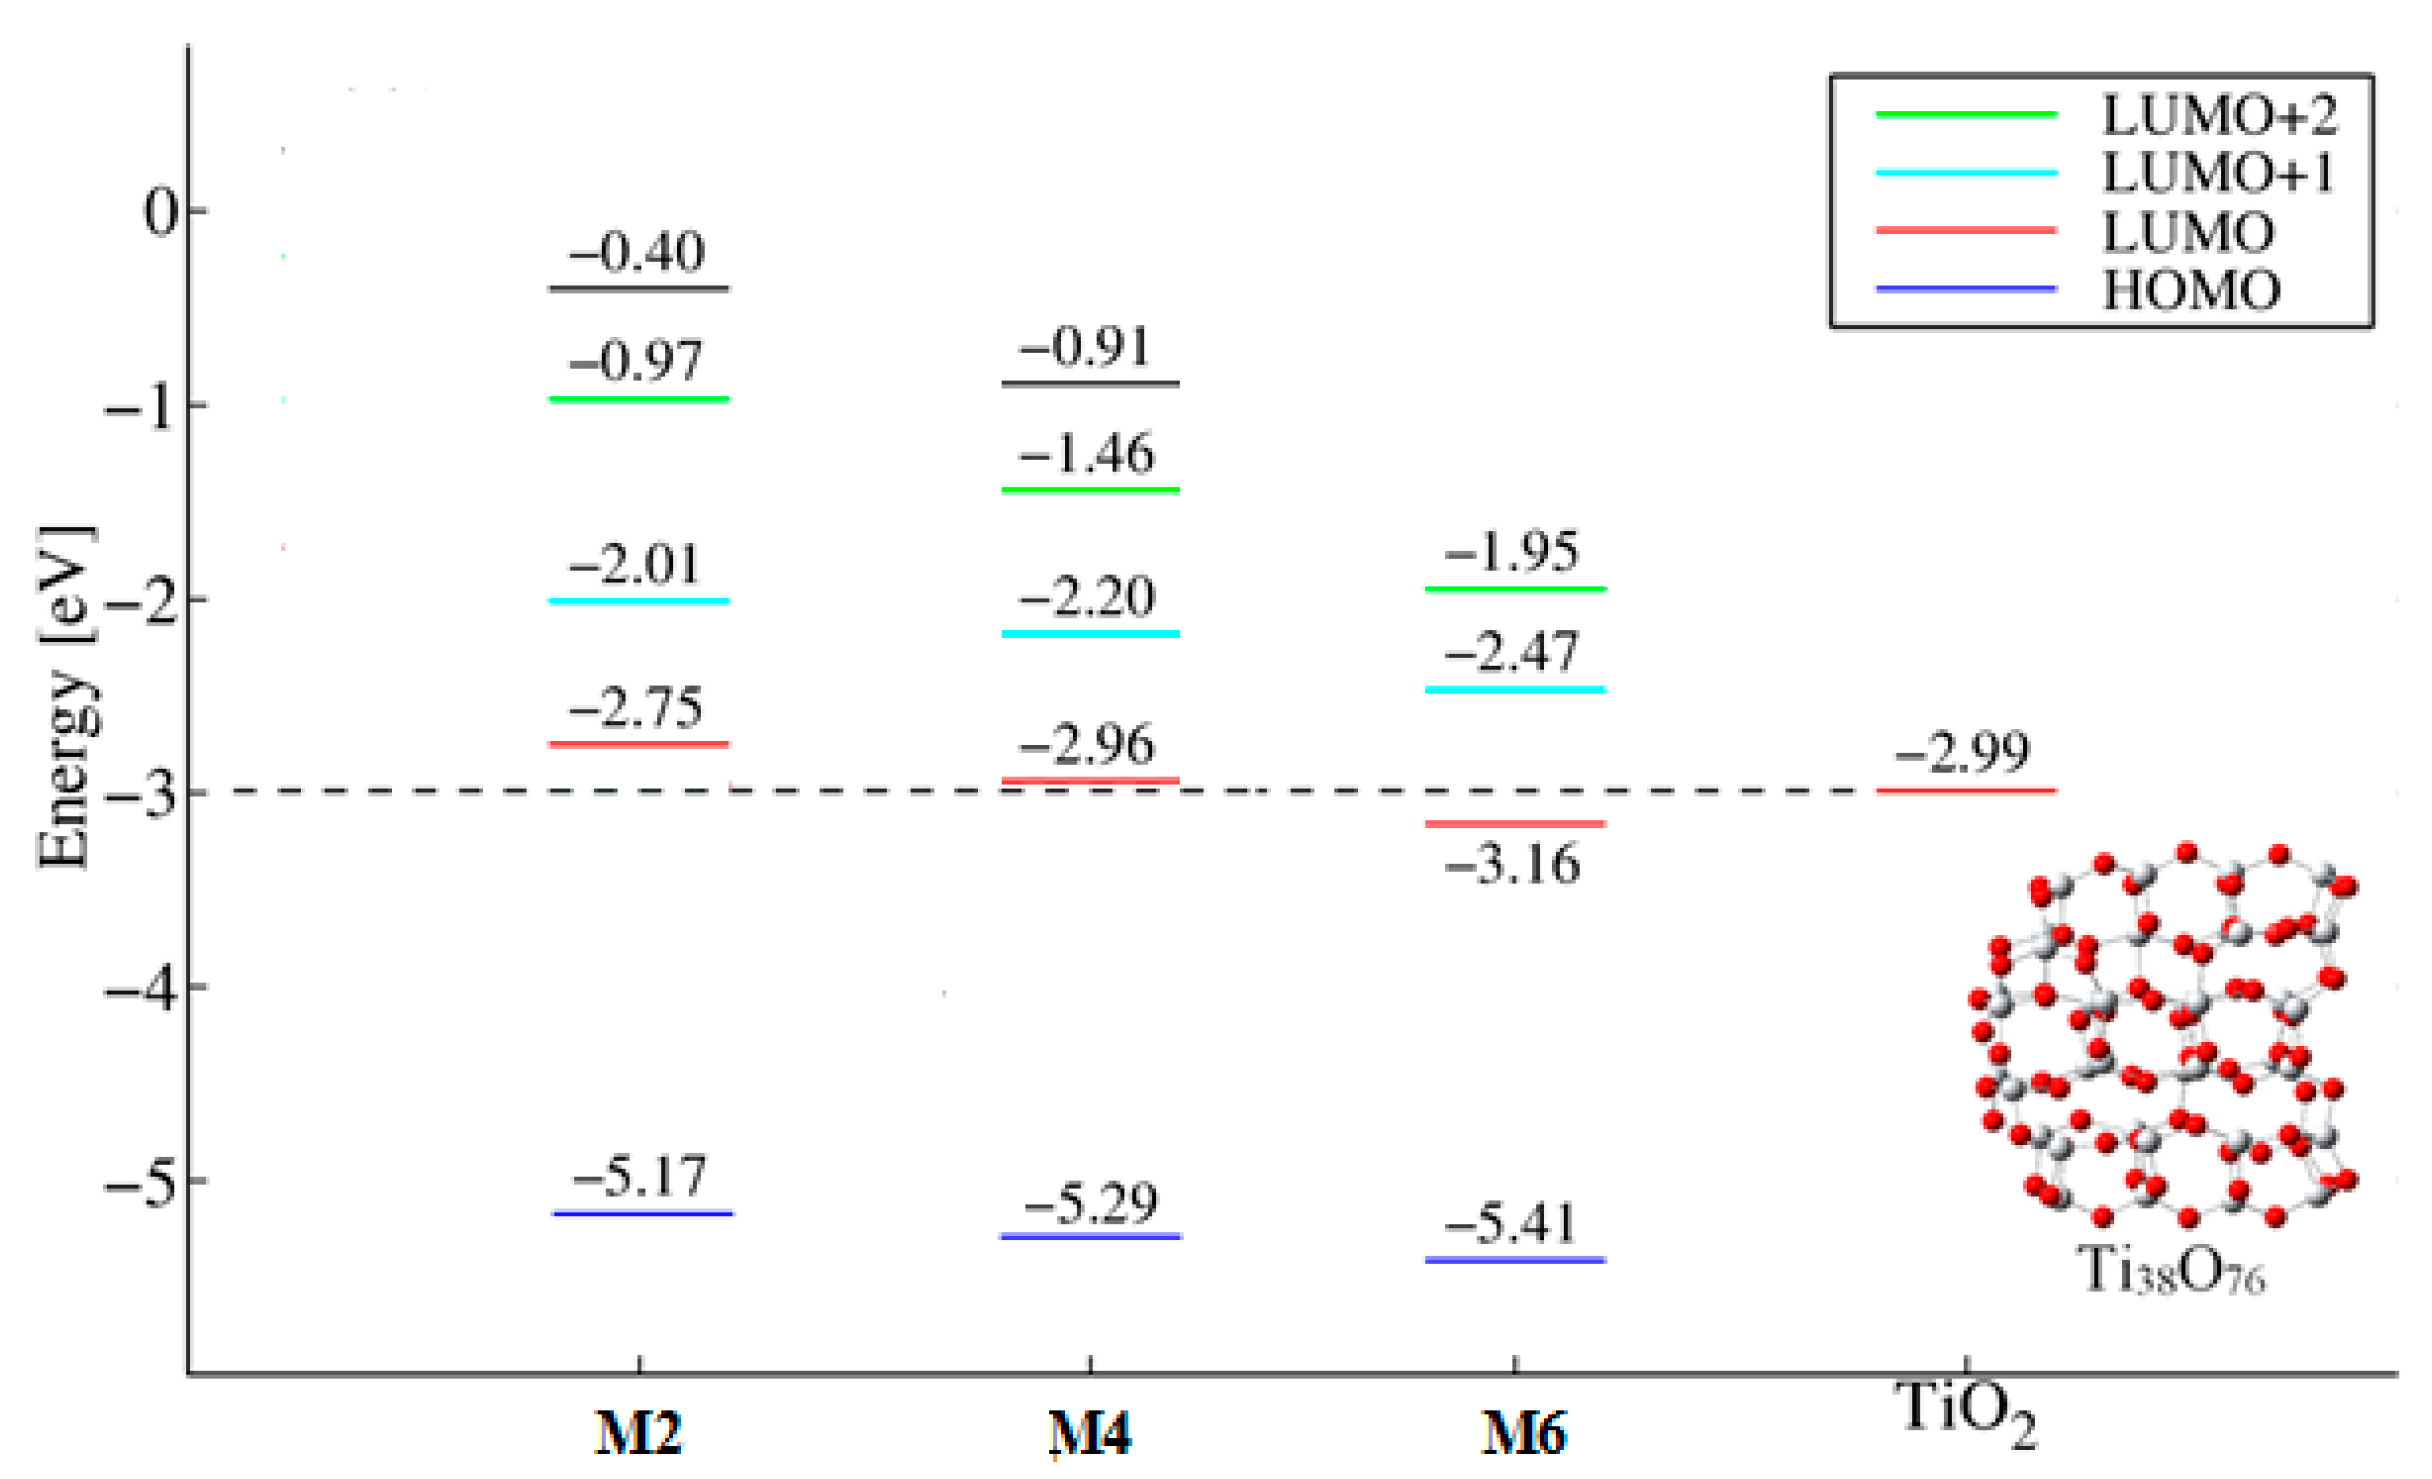
2.4. DFT Calculations

To elucidate the relationship between the nature of the anchoring group and the photovoltaic performances observed, density functional theory (DFT) calculations were performed. The calculations show that all the LUMO + n orbitals had a significant contribution from the acrylic group for M4 and from the cyanoacrylic acid group for M6 while only the LUMO + 3 orbital covered the alkyl carboxylic group for M2 (Figure 7). This is critically important since the orbital overlap between the LUMO + n of the dye and the TiO2 conduction band edge should be as large as possible in order to maximize the electron transfer probability. M4 and M6 dyes exhibited similar π-electron systems leading to similar electron density on the π-conjugated anchoring group for LUMO, LUMO + 1, and LUMO + 2 orbitals.
However, introducing the electron-withdrawing cyano group on the acrylic acid anchoring results in a strong stabilization of the unoccupied orbitals (Figure 8). Indeed, the M6 LUMO moved down below the TiO2 conduction band edge energy level, no longer allowing exergonic electron injection to TiO2 upon (HOMO → LUMO) optical transition, thus, explaining the decrease in PCE of M6 compared to M4. The energy levels of HOMO and LUMO of M2, M4, and M6 dyes are in the same range as those previously reported in the literature [31,33,52].

2.5. Dye Adsorption

To get insight into the relationship between the observed performances and the dye structure, the dye adsorption of free-base chlorins M1, M3, and M5 was investigated by the use of electron paramagnetic resonance spectroscopy (EPR). This experimental technique allowed us to compare the cells performance with the dye adsorption on the TiO2 thanks to a paramagnetic radical probe 4-carboxy TEMPO (coded as 4C-T). This molecule grafts onto the TiO2 surface without perturbing the system and is able to monitor its molecular surrounding through spin–spin interactions. As described more in depth elsewhere [53], the main parameters extracted from the spectra are as follows: (i) Aii, which is the component of the hyperfine coupling tensor between the electronic and nuclear spin that provides a measurement of the probe environmental polarity; (ii) the correlation time for the radical rotational diffusion motion, τ, that is related to the radical environmental microviscosity, which, in turn, increases due to interactions between the radical and its environment; (iii) the intrinsic line width, its increment in slow motion conditions being due to dipole−dipole spin−spin interactions (through this parameter, interactive close sites can be identified); and (iv) the Heisenberg exchange frequency, Wex, which increases when radicals swap each other the unpaired electrons due to collisions in a fluid medium (this parameter is related to a high radical local concentration on the TiO2 surface). In many cases, the EPR spectra are constituted by two well-identifiable components characterized by probes at different polarity and mobility. In order to extract the two components and to evaluate the relative percentages, experimental spectra were subtracted from each other and then the components were separately simulated and doubly integrated to evaluate the relative percentages. If subtraction of experimental spectra cannot be performed, one component is simulated and the other one is determined by subtraction of the simulated spectrum from the total one. Afterwards, the second component is also simulated. The accuracy for all the parameters in the EPR analysis was between 2% and 3%, based on the fitting between the experimental and the computed line shapes, slightly increasing if line broadening occurs.
Figure 9 shows the EPR spectra obtained for DSSCs built with the different dyes M1, M3, and M5 and containing the spin probe 4C-T. These spectra were considered good if reproducible at least for three different cells built in the same experimental conditions.
From Figure 9, we could determine that: (i) the intensity significantly decreased for DSSC-M5 with respect to the other DSSC-dyes. The intensity was evaluated by double integrating the spectra (Table 1). We also noticed that the intensity largely decreased when compared to devices containing only the spin probe (results not shown) and (ii) the spectra were constituted by two components whose main features are indicated in the figure. These two components were extracted and quantified (Table 4).
Each component was then computed as shown in Figure 10 for the different cells. The figure also shows the main parameters used for the computation, which are the <A> value (=(Axx + Ayy + Azz)/3) measuring the polarity, the correlation time for the rotational motion, τ, measuring the interactions on the basis of the slowing down of mobility, and the line width, measuring the local concentration of the radicals. Based on the correlation time for the rotational motion, τ, obtained from the computations, the two components were termed “fast” and “slow”, since they originated from spin probes quite free to move at the interface and interacting with the TiO2 surface, respectively.
The low intensity of the spectrum of DSSC-M5 if compared to the other DSSCs clarified the behavior of these dyes: M5 was poorly adsorbed, but the probes and M5 preferentially interacted with the surface (slow component) and only a small amount of dyes remained at the interface (free component). In other words, the total amount of adsorbed dye M5 as well as the amount of interacting probes + M5-dyes were small. That amount was obviously smaller than the amount of probes and dye M3 adsorbed at the TiO2 surface. Considering the slow component, it was the same for M5 and M3 corresponding to strongly interacting dyes at polar, quite close sites. Conversely, the fast component shows a high mobility and the environment was less polar than that of the slow component. These results also explained why dye M3 exhibited better performances than M5. M1 was the less interacting dye, not only marked by the lowest percentage of slow (interacting) component compared to the other dyes, but also because the slow component is slower (lower τ) in comparison with the other dyes. It is also interesting to note that the fast component for M1 shows a slightly lower mobility, lower polarity and higher line width compared to the fast component from the other dyes. This indicates a higher local concentration of M1 dyes in solution, in line with a lower adsorption at the TiO2 surface.

3. Materials and Methods

3.1. Instrumentation and Methods

Spirulina powder was provided from Phyco-Biotech (Montpellier, France). Titania paste (99% anatase), titanium(IV) chloride (99,9%), chenodeoxycholic acid (96%), bis(trifluoromethane)sulfonimide lithium salt (99%), 4-tert-butylpyridine (98%) were purchased from Sigma-Aldrich Chemie S.a.r.l. (Saint-Quentin Fallavie, France). Spiro-OMeTAD and FTO-coated conducting glass substrates were purchased from Solaronix SA (Aubonne, Switzerland). Reactions were performed under argon using oven-dried glassware and Schlenk techniques. Dry solvents were obtained by using a solvent purification system, PureSolve MD5 purchased from Inert Technology (Amesbury, MA, USA). 1H and 13C{1H} NMR spectra were recorded either on a Bruker Avance-300, 400, or 600 spectrometers (Bruker, Billerica, MA, USA) for each synthetic intermediates and were calibrated to tetramethylsilane (TMS) on the basis of the relative chemical shift of the solvent as an internal standard. Chemical shifts (δ) are expressed in parts per million (ppm) and coupling constants (J) are expressed in Hertz. Abbreviations used for 1H-NMR spectra are as follow: s singlet, d doublet, and m multiplet. Mass spectra (MS) were recorded on MicroTOF QII t and RAPIFLEX instruments (Bruker France SAS, Marne la Vallée, France) in the positive mode for ESI and MALDI-ToF, respectively. UV-Visible absorption spectra were obtained at room temperature on a Shimadzu UV2401 PC (Shimadzu Corporation, Kyoto, Japan) and on a SAFAS D.E.S. PC UV/Vis scanning spectrometers (Safas, Monaco).

3.2. Synthesis of Dyes M1, M3, and M5

Methyl pheophorbide-a [34], methyl pyropheophorbide-a (MPPa) [34], methyl pyropheophorbide-d (MPPd) [35], M1 [28], M2 [54], M3 [28], M4 [55], M5 [56], and M6 [55] were synthesized as reported in the literature (see Scheme 1 for the synthetic route).
M1: Methyl pyropheophorbide-a (150 mg, 2.74 mmol) was dissolved in acetone (15 mL) and concentrated hydrochloric acid (HCl 37%, 5 mL) was added slowly. After 30 min under stirring, the mixture was poured into water and extracted with CH2Cl2. The organic layer was then washed with a saturated solution of NaHCO3 and water until neutrality. The organic layer was dried over MgSO4, filtered, and concentrated under reduced pressure. The obtained solid was then recrystallized from a CH2Cl2/n-pentane mixture to give the title compound as a dark solid (129 mg, 88%). 1H-NMR (300 MHz, CDCl3): δ = 9.50, 9.39, 8.58 (s, each 1H, 5-, 10-, and, 20-H), 7.98 (dd, 3JH-H = 17.8, 11.5 Hz, 1H, 31-H), 6.22 (m, 2H, 32-CH), 5.18 (m, 2H, 132-CH2), 4.49, 4.41 (m, each 1H, 17- and 18-H), 3.64 (m, 3H, 81-CH2 and 121-CH3), 3.40 (2-CH3), 3.23 (s, 3H, 7-CH3), 2.70–2.30 (m, 4H, 171 and 172-CH2), 1.82 (d, 3JH-H = 7.1 Hz, 3H, 181-CH3), 1.68 (t, 3JH-H = 7.5 Hz, 4H, 82-CH3) ppm. 13C{1H} NMR (101 MHz, pyridine-d5): δ = 196.0, 176.1, 172.8, 162.4, 155.7, 151.7, 149.5, 145.8, 142.0, 138.7, 137.0, 136.7, 136.3, 132.5, 131.7, 130.0, 128.9, 123.0, 107.4, 104.9, 97.9, 94.5, 52.7, 50.7, 48.8, 32.3, 31.1, 23.7, 20.0, 18.1, 12.5, 12.3, 11.6 ppm. Maldi-ToF MS: calcd for C33H34N4O3 m/z 534.263, found 534.290. UV-Visible (THF): λmax (ε) 414 (77500), 507 (8200), 536 (6600), 310 (5300), 668 (33600) nm.
M3: Chlorin-1 (117 mg, 0.180 mmol) was dissolved in trifluoroacetic acid (6.5 mL). The green solution was stirred for 3 h at room temperature and then, poured into water. The organic layer was extracted with CH2Cl2, dried over MgSO4, filtered and concentrated under reduced pressure. The brown residue was purified by column chromatography on silica gel (CH2Cl2/MeOH, 19:1) to give the title compound as a black solid (68 mg, 64%). 1H-NMR (600 MHz, CDCl3/pyridine-d5): δ = 9.41 (s, 1H, 10-H), 9.37 (s, 1H, 5-H), 9.03 (d, 1H, 3JH-H = 16.1 Hz, 32-CH), 8.56 (s, 1H, 20-H), 7.04 (d, 1H, 3JH-H = 16.1 Hz, 31-CH), 5.17, 5.01 (d, each 1H, 3JH-H = 19.2 Hz, 132-CH2), 4.40, 4.20 (m, each 1H, 17-, and 18-H), 3.54, 3.48, 3.36, 3.10 (s, each 3H, 21-, 71-, and 121-CH3, 172-COOMe), 3.53 (m, 2H, 81-CH2), 2.60, 2.50 (m, each 1H, 172-CH2), 2.20 (m, 2H, 171-CH2), 1.72 (d, 3H, J = 7.5 Hz, 181-CH3), 1.57 (t, 3H, 3JH-H = 7.7 Hz, 82-CH3), 0.08, −1.97 (s, each 1H, NH) ppm. 13C{1H} NMR (151 MHz, CDCl3/Pyr): δ = 195.6, 173.1, 170.7, 169.1, 160.7, 154.7, 151.0, 149.4, 148.5, 144.7, 140.3, 138.1, 136.3, 135.5, 135.4, 133.5, 131.9, 130.7, 128.5, 126.3, 123.2, 106.2, 103.6, 96.7, 93.5, 51.6, 51.3, 49.6, 47.8, 30.7, 29.6, 22.9, 19.2, 17.2, 12.4, 11.8, 11.0 ppm. ESI-ToF HR-MS: calcd for C35H36N4O5 [M + H]+ m/z 593.2841, found 593.2845. UV-Visible (THF): λmax (ε) 417 (33000), 513 (4600), 545 (3600), 621 (2700), 681 (17000) nm.
M5: To a solution of methyl pyropheophorbide-d (200 mg, 0.363 mmol) and cyanoacetic acid (6.18 g, 72.6 mmol) in THF (20 mL) was added ammonium acetate (2.80 g, 36.3 mmol). The mixture was refluxed for 1 h, poured into water and extracted with CH2Cl2. The extract was dried over MgSO4, filtered, and concentrated under vacuum. The residue was then recrystallized from a CH2Cl2/n-pentane mixture to give the title compound as a dark solid (145 mg, 65%). 1H NMR (400 MHz, DMSO-d6): δ = 9.62, 9.32, 9.13, 8.62 (s, each 1H, 5-, 10-, and 20-H, 31-CH), 5.14, 5.06 (d, each 1H, 3JH-H = 19.9 Hz, 131-CH2), 5.06, 4.54 (m, each 1H, 17-, and 18-H), 3.75 (m, 2H, 81-CH2), 3.59, 3.53, 3.31, 3.23 (s, each 3H, 21-, 71-, and 121-CH3, 172-COOMe), 2.60, 2.24 (m, each 2H, 171-, and 172-CH2), 1.77 (d, 3H, 3JH-H = 7.5 Hz, 181-CH3), 1.67 (t, 3H, 3JH-H = 7.7 Hz, 82-CH3) ppm. 13C{1H} NMR (101 MHz, DMSO-d6): δ = 195.2, 176.5, 172.9, 167.7, 163.2, 160.1, 156.6, 152.0, 149.8, 147.1, 145.3, 145.0, 143.0, 142.7, 137.2, 135.1, 133.1, 132.9, 131.6, 120.5, 119.1, 105.3, 105.1, 98.4, 92.7, 66.4, 66.2, 66.0, 65.7, 65.5, 51.0, 50.1, 47.7, 47.6, 29.9, 29.2, 24.0, 23.8, 23.6, 23.5, 23.4, 23.0, 18.5, 17.2, 13.2, 12.0, 10.4 ppm. ESI-ToF HR-MS: calcd for C36H36N5O5 [M + H]+ m/z 618.2716, found 618.2717. UV-Visible (THF): λmax (ε) 409 (33000), 515 (5000), 550 (4000), 636 (4500), 688 (13000) nm.

3.3. General Procedure for the Zinc Metalation to Obtain Dyes M2, M4 and M6

A saturated methanol solution of zinc acetate dihydrate (Zn(OAc)2 2H2O; 10 mL) was added to a solution of metal-free chlorin (50 mg) in THF (50 mL). After stirring overnight, the solution turned from brown to green. The mixture was filtered off and the filtrate was concentrated under vacuum. The crude material was then recrystallized from a CH2Cl2/n-pentane mixture to afford the desired zinc complex.
M2: (80%). 1H-NMR (400 MHz, Pyridine-d5): δ = 9.84, 9.69, 8.83 (each s, each 1H, 5-, 10-, and 20-H), 8.19 (dd, 3JH-H = 17.8, 11.6 Hz, 1H, 31-H), 6.35, 6.15 (m, each 1H, 32-CH2), 5.56, 4.61 (m, each 1H,132-CH2), 4.61, 4.48 (m, each 1H, 17-, and 18-H), 3.70 (m, 5H, 81-CH2, and 121-CH3), 3.36 (21-CH3), 3.22 (s, 3H, 71-CH3), 2.93, 2.73 (m, each 2H, 171-, and 172-CH2), 1.85 (d, 3JH-H = 7.2 Hz, 3H, 181-CH3), 1.67 (t, 3JH-H = 7.6 Hz, 4H, 82-CH3) ppm. MALDI-ToF MS: calcd for C33H32N4O3Zn m/z 596.177, found 596.180. UV-Visible (THF): λmax (ε) 405 (23800), 427 (39500), 570 (2500), 609 (4400), 657 (22000) nm.
M4: (87%). 1H-NMR (400 MHz, CDCl3/Pyridine-d5): δ = 9.41 (s, 1H, 10-H), 9.37 (s, 1H, 5-H), 9.03 (d, 1H, 3JH-H = 16.1 Hz, 32-CH), 8.56 (s, 1H, 20-H), 7.04 (d, 1H, 3JH-H = 16.1 Hz, 31-CH), 5.17, 5.01 (d, each 1H, 3JH-H = 19.2 Hz, 132-CH2), 4.40, 4.20 (m, each 1H, 17-, and 18-H), 3.54, 3.48, 3.36, 3.10 (s, each 3H, 21-, 71-, and 121-CH3, 172-COOMe), 3.53 (m, 2H, 81-CH2), 2.60, 2.50 (m, each 1H, 172-CH2), 2.20 (m, 2H, 171-CH2), 1.72 (d, 3H, 3JH-H = 7.5 Hz, 181-CH3), 1.57 (t, 3H, 3JH-H = 7.7 Hz, 82-CH3) ppm. ESI-ToF HR-MS: calcd for C35H34N4O5Zn [M + H]+ m/z 655.1899, found 655.1901. UV-Visible (THF): λmax (ε) 414 (37600), 436 (54500), 531 (3500), 576 (4900), 621 (7900), 671 (40100) nm.
M6: (78%). 1H-NMR (400 MHz, DMSO-d6): δ = 9.62, 9.13, 8.62 (s, 1H each, 5-, 10-, 15-, and 20-H), 9.32 (s, 1H, 3′-H), 5.14, 5.05 (d, 1H each, 3JH-H = 19.9 Hz, 15′-H), 4.55 (dd, 1H, 3JH-H = 7.4, 2.5 Hz, 18-H), 4.28 (d, 1H, 3JH-H = 8.2 Hz, 17-H), 3.59, 3.53, 3.31, 3.23 (s, 3H each), 2.60, 2.24 (m, 4H), 1.76 (d, 3H, 3JH-H = 7.7 Hz, 181-CH3), 1.65 (t, 3H, 3JH-H = 7.6 Hz, 82-CH3) ppm. ESI-ToF HR-MS: calcd for C36H35N5O5Zn [M + H]+ m/z 680.1852, found 680.1851. UV-Visible (THF): λmax (ε) 434 (48300), 532 (3800), 579 (4700), 625 (7900), 670 (36800) nm.

3.4. DFT Calculations

The ground-state geometry and electronic structure of all dyes and a large TiO2 cluster (representative of the bulk) were obtained at the density functional theory (DFT) level using the B3LYP hybrid functional and the 6-311G(d,p) basis set. All calculations were performed using Gaussian09 [57]. Solvent effects were taken into account by employing the polarizable continuum model (PCM) using the chloroform solvent as a proxy for the dielectric effects in the DSSC device.

3.5. Fabrication of Solar Cells

FTO-coated conducting glass substrates were cleaned by an ultrasonic treatment with water, acetone and isopropanol for 10 min each before being treated for 5 min by UV-ozone. A compact layer of TiO2 was deposited by spray-pyrolysis at 450 °C from a solution of titanium tetra-isopropoxide and acetylacetone in ethanol following by annealing at 450 °C for 20 min (Film thickness 200 nm). A nanoporous TiO2 layer was applied by spin-coating from a solution of a commercial TiO2 paste (DSL 18NRT, Dyesol) in ethanol containing nano-sized anatase particles (Film thickness 1.6 μm). The layers were then gradually annealed from 250 to 500 °C over 45 min. The substrates were then treated in a 0.02 M TiCl4 aqueous solution for 2 h, rinsed with water and annealed at 450 °C for 45 min. The electrodes were finally immersed in dye solutions that may hold chenodeoxycholic acid as co-adsorbent for 15 h in the dark. After rinsing the electrodes, the hole conductor layer was deposited by spin-coating from a spiro-OMeTAD (Solaronix) solution in chlorobenzene (180 mg.mL−1) containing tert-butylpyridine and LiTFSI as additives, following a reported recipe [45]. Gold top electrodes were finally evaporated under vacuum (10−6 mbar) using shadow masks that define two active areas per substrate (around 0.15 cm2 each).

3.6. Characterization of Solar Cells

The J–V measurements, in the dark and under illumination, were performed in air using a Keithley model 2400 digital source meter by applying independent external voltage to the cell and by measuring the photogenerated current out from the cell. The spectral mismatch between the emission solar simulator (Newport 1600W) and the global AM1.5G solar spectrum was corrected using a mismatch factor and the solar simulator irradiance was adjusted accordingly using a certified silicon reference cell in order to achieve an equivalent AM1.5G irradiance of one sun (100 mW·cm−2) on the test cells. The incident photon to current efficiency (IPCE) was estimated using a monochromated 75 W xenon lamp (Newport). The photocurrent, measured in static regime by a calibrated picoammeter (Keithley 485), was compared to the calibration current response recorded using a certified calibrated photodiode (Newport). All data shown in this work were the average values of at least four parallel tests.

3.7. Fabrication of Solar Cells for EPR Experiments

FTO slides were washed and sonicated five times for 15 min each in water, ethanol, twice in isopropanol and finally, analytical grade ethanol. FTO–TiO2 (18 NRT Solaronix) films were prepared by “doctor blading” (uniformly spreading TiO2 paste on a pre-defined area of 1.25 cm2 on FTO glass with a glass bar). The FTO electrode was then left for 30 min on an oven at 450 °C in order to sinter the anatase crystals. The dye adsorption on FTO–TiO2 film electrodes was carried out by heating the electrodes for 10 min at 75 °C on a hot plate, followed by immersion into a single dye solution in 50% acetonitrile 50% tBuOH for a given time of 16 h. The DSSCs were electrically characterized by the use of a solar simulator (Newport model 96,000 Oriel), equipped with a 150 W ozone free xenon lamp, and a digital multimeter (Keithley 2600A) connected to a computer that used dedicated software for test running.

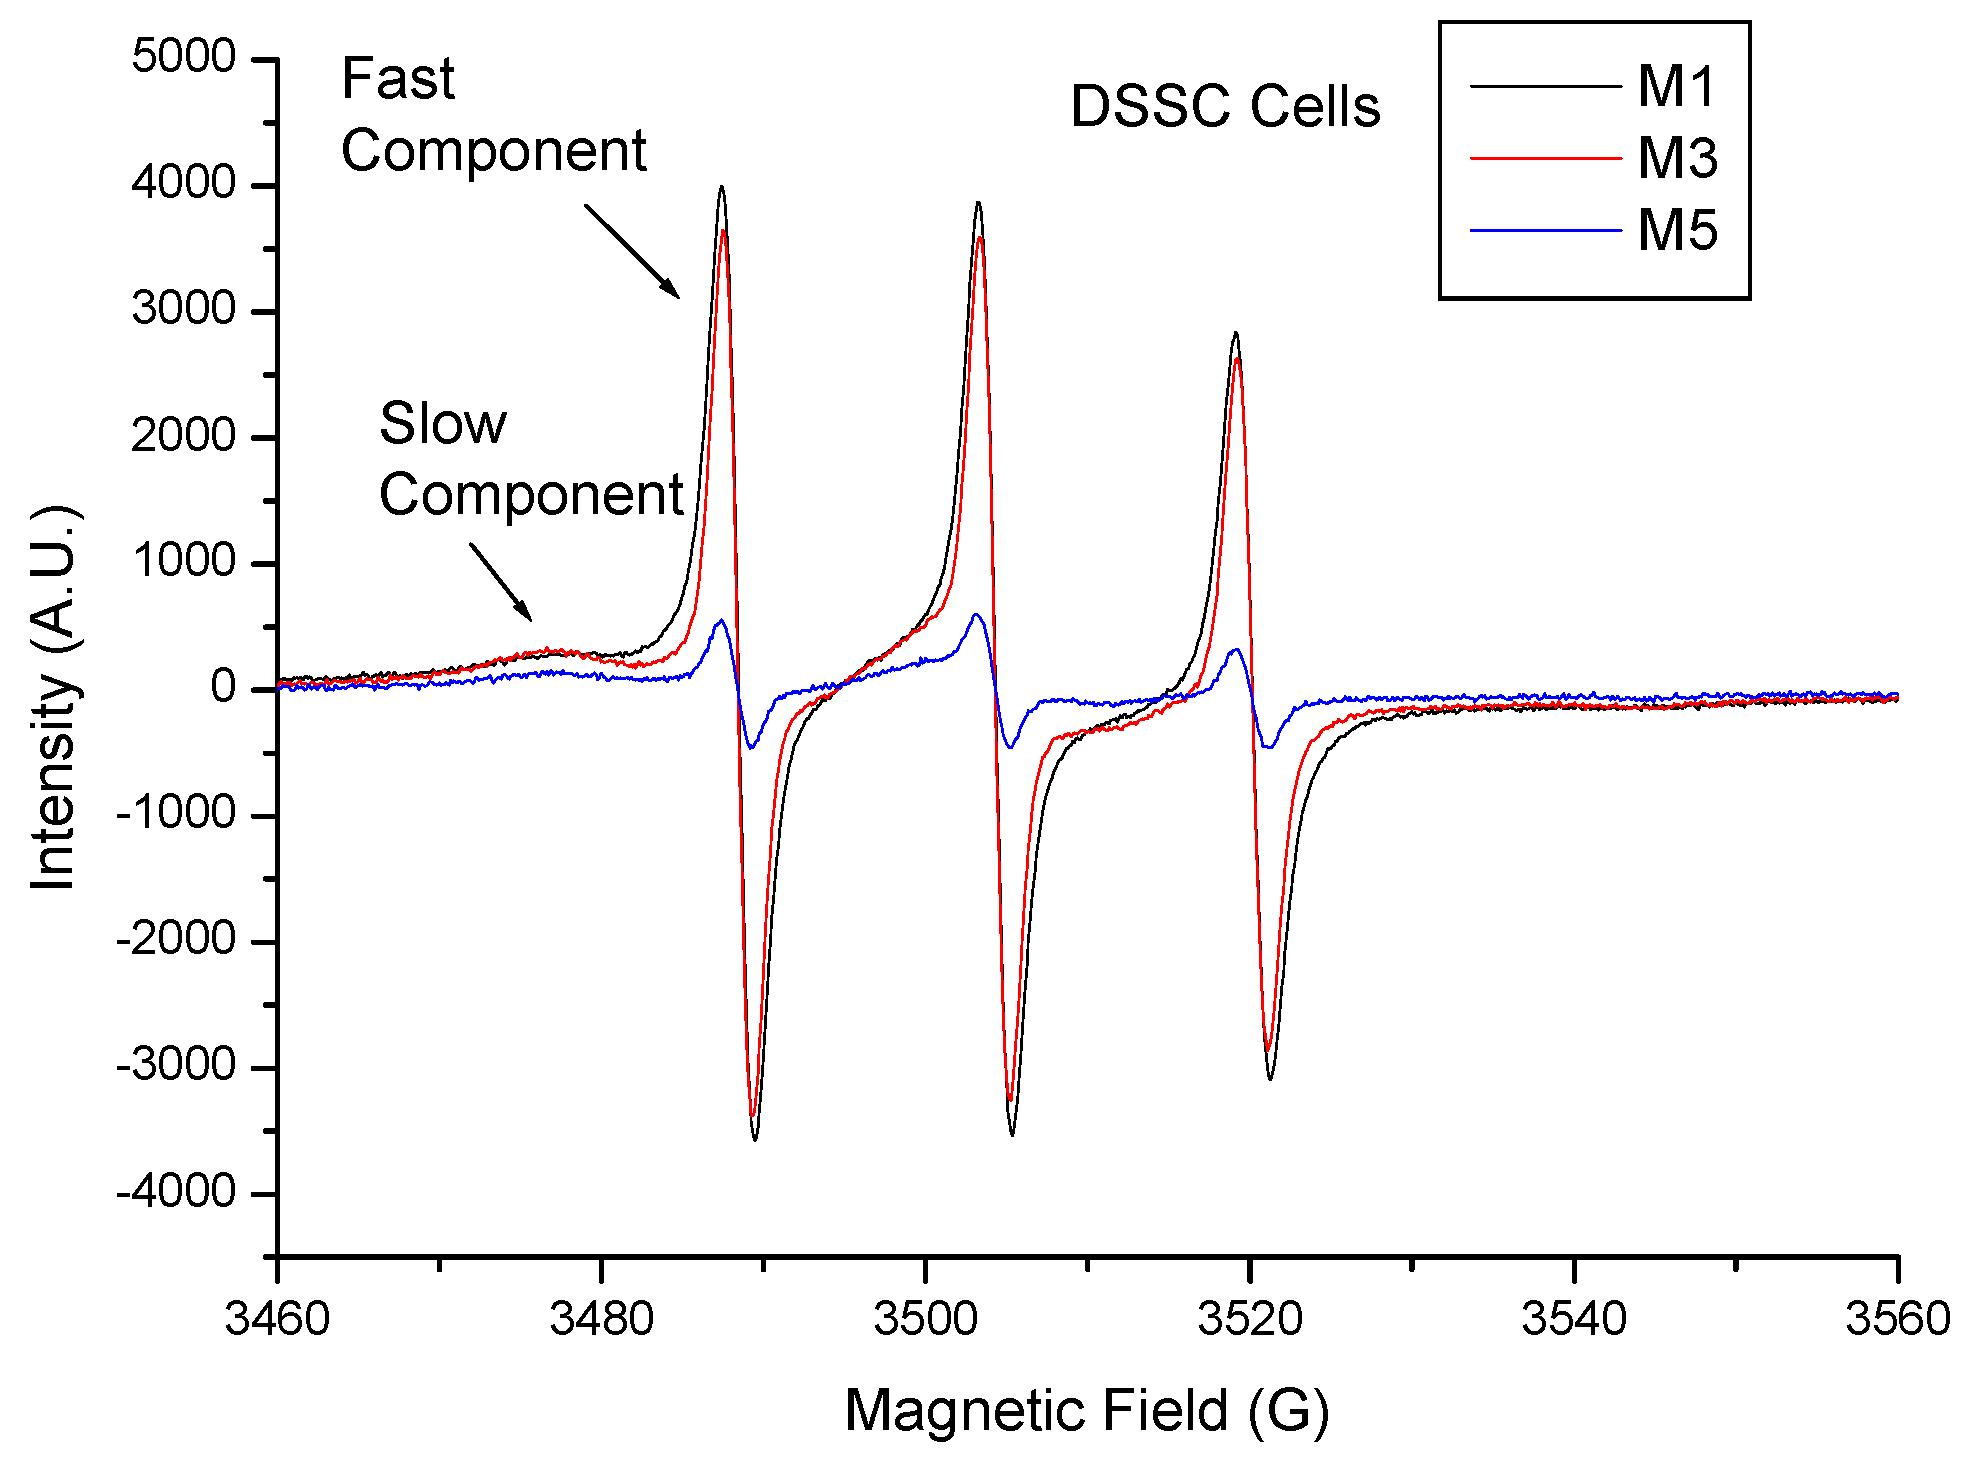
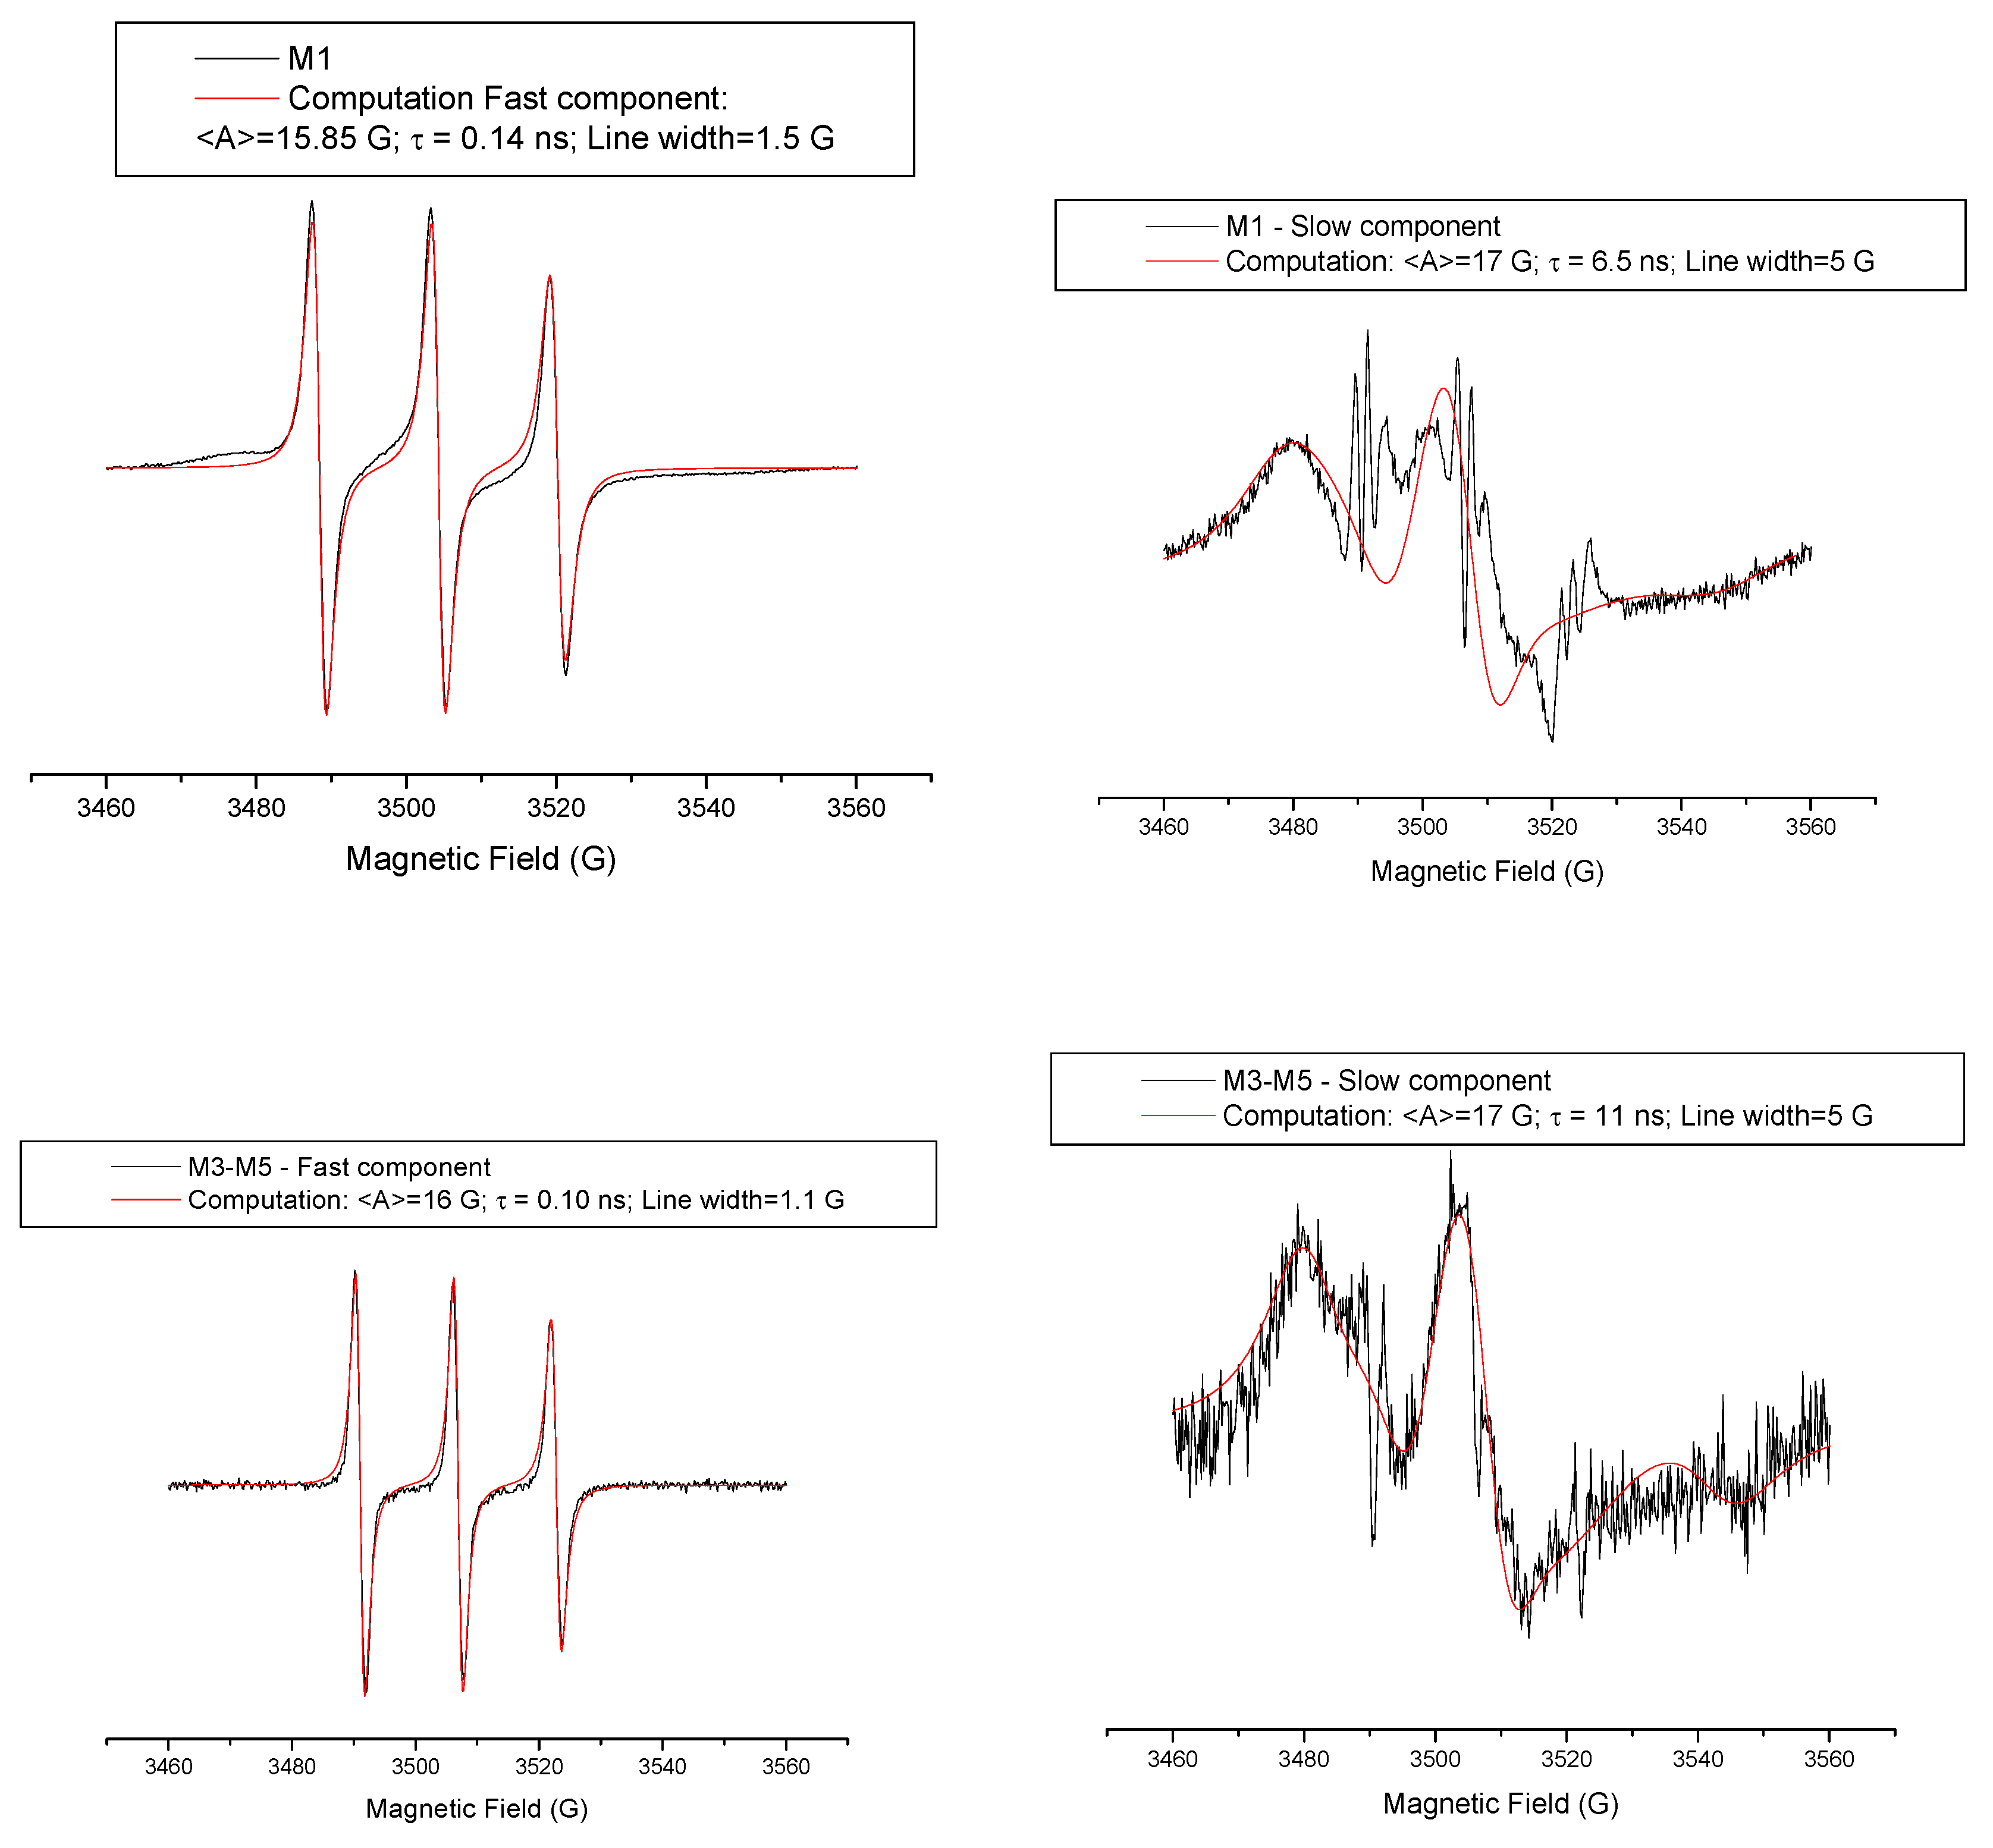
3.8. EPR Characterization of Solar Cells

Before performing the EPR analysis of the complete DSSC, it was necessary to measure the solar cell electrical performance in the absence and the presence of the spin probe. Indeed, only cells showing well-measurable and reproducible electrical performances (not reported) were tested by EPR. After measuring their electrical functionality, the cells were placed on the EPR cavity where a static magnetic field is applied while a source of microwaves is also applied to the sample. This allows the resonance condition that is necessary to promote the probe (4C-T) signal. EPR spectra were recorded with an EMX-Bruker spectrometer operating at the X band (9.5 GHz) and interfaced with a PC (software from Bruker for handling and recording the EPR spectra). The EPR spectra were simulated with the NLSL software [58].

3.9. Transient Photovoltage Decay Mesurements

Transient photovoltage measurements were done on the cells illuminated by a bias light provided by white LED of variable intensity [59]. An additional light pulse was superimposed using a 550 nm green LED, and the transient electrical response of the cell was recorded in open-circuit conditions using the high impedance input of a digital oscilloscope (Tektronix DPO4032, Tektronix, Bracknell, UK) Transient photovoltage curves were fitted using mono-exponential functions, ensuring a perturbing regime where the transient photogenerated charge density was kept below 1% of the stead-state photogenerated charge density.

4. Conclusions

A series of chlorophyll derivatives M1M6 equipped with either a non-conjugated carboxy or a conjugated acrylic or cyanoacrylic anchoring group was prepared for their use as dye component in all-solid state DSSCs. The use of a co-adsorbent was found to be crucial to improve the device performance by avoiding the chlorin dye aggregation. The solar energy conversion efficiencies of DSSCs bearing the acrylic group (M3M4) were larger than those bearing the cyanoacrylic group (M5M6). The weakest performances of M5M6 compared to M3M4 were attributed to several factors: (i) a faster recombination kinetic at the titania/electrolyte interface, (ii) the position of the LUMO below the TiO2 conduction band is not suitable for electron injection, and (iii) a lower amount adsorbed onto the TiO2 surface. Nevertheless, although M1M2 exhibited not suitable features in terms of recombination kinetics and dye adsorption, higher PCEs were obtained which may suggest that M1M2 molecules have a suitable orientation on the TiO2 surface due the larger flexibility of the alkyl spacer, which may lead to improved charge transfer. This question will be addressed in future investigations as well as their long-term stability.

Author Contributions

M.C. (Michèle Chevrier) carried out the synthesis of the chlorophyll derivatives, prepared the chlorin-based DSSCs, analyzed their photovoltaic performances and wrote a part of this paper. C.K. and C.R. participated to the synthesis of MPPa precursor. M.S. participated to the study of the optical properties of the chlorin dyes. A.F. performed the EPR analysis and wrote the related part in the manuscript. M.C. (Michela Cangiotti) helped to record the EPR spectra. M.F.O. simulate the EPR spectra. L.L. and D.B. performed the DFT calculations. R.L. (PhD co-supervisor of M.C. (Michèle Chevrier) in Belgium), P.D. (PhD co-supervisor of M.C. (Michèle Chevrier) in Belgium) and A.M. (PhD supervisor of M.C. (Michèle Chevrier) in France) participated to the early research. J.B. supervised the ssDSSC fabrication and characterization, including TPV measurements. S.R. and S.C. participated to the early research, supervised the research and wrote the paper. All authors have read and agreed to the published version of the manuscript.

Funding

This research was funded by CNRS, PEPS “Caesar” from the 2017 call from l’INSIS and Région Languedoc-Roussillon (Research Grant “Chercheur(se)s d’Avenir-2015–005984) and the FEDER program (Fonds Européen de Développement Régional).

Acknowledgments

The authors thank the Université de Montpellier for financial support. S.R and S.C. also thanks Phyco-biotech for providing spirulina. Research in Mons is supported by FNRS-FRFC (through the Excellence of Science ‘2Dto3D’ project and Consortium des Equipements de Calcul Intensif—CECI) and the European Commission and Région Wallonne (through the FEDER BIORG-EL project). M.S and D.B. are FNRS senior research associate and research director, respectively. J.B. acknowledges the PLATINOM technologic platform at XLIM (and common facility of the University of Limoges), as well as the SIGMALIM Laboratory of Excellence.

Conflicts of Interest

The authors declare no conflict of interest.

References and Note

  1. Barnham, K.W.J.; Mazzer, M.; Clive, B. Resolving the energy crisis: Nuclear or photovoltaics? Nat. Mater. 2006, 5, 161–164. [Google Scholar] [CrossRef]
  2. Blankenship, R.E.; Tiede, D.M.; Barber, J.; Brudvig, G.W.; Fleming, G.; Ghirardi, M.; Gunner, M.R.; Junge, W.; Kramer, D.M.; Melis, A.; et al. Comparing Photosynthetic and Photovoltaic Efficiencies and Recognizing the Potential for Improvement. Science 2011, 332, 805. [Google Scholar] [CrossRef] [PubMed] [Green Version]
  3. Zhang, T.; Liu, C.; Dong, W.; Wang, W.; Sun, Y.; Chen, X.; Yang, C.; Dai, N. Photoelectrochemical Complexes of Fucoxanthin-Chlorophyll Protein for Bio-Photovoltaic Conversion with a High Open-Circuit Photovoltage. Chem. Asian J. 2017, 12, 2996–2999. [Google Scholar] [CrossRef] [PubMed]
  4. Yu, Z.; You, S.; Wang, C.; Bu, C.; Bai, S.; Zhou, Z.; Tai, Q.; Liu, W.; Guo, S.; Zhao, X.-z. Efficient dye-sensitized solar cells employing highly environmentally-friendly ubiquinone 10 based I2-free electrolyte inspired by photosynthesis. J. Mater. Chem. A 2014, 2, 9007–9010. [Google Scholar] [CrossRef]
  5. Calogero, G.; Bartolotta, A.; Di Marco, G.; Di Carlo, A.; Bonaccorso, F. Vegetable-based dye-sensitized solar cells. Chem. Soc. Rev. 2015, 44, 3244–3294. [Google Scholar] [CrossRef] [PubMed]
  6. Ammar, A.M.; Mohamed, H.S.H.; Yousef, M.M.K.; Abdel-Hafez, G.M.; Hassanien, A.S.; Khalil, A.S.G. Dye-Sensitized Solar Cells (DSSCs) Based on Extracted Natural Dyes. J. Nanomater. 2019, 2019, 10. [Google Scholar] [CrossRef] [Green Version]
  7. Quintana, N.; Van der Kooy, F.; Van de Rhee, M.D.; Voshol, G.P.; Verpoorte, R. Renewable energy from Cyanobacteria: Energy production optimization by metabolic pathway engineering. Appl. Microbiol. Biotechnol. 2011, 91, 471–490. [Google Scholar] [CrossRef] [Green Version]
  8. Sarma, M.K.; Kaushik, S.; Goswami, P. Cyanobacteria: A metabolic power house for harvesting solar energy to produce bio-electricity and biofuels. Biomass Bioenergy 2016, 90, 187–201. [Google Scholar] [CrossRef]
  9. Wondraczek, L.; Batentschuk, M.; Schmidt, M.A.; Borchardt, R.; Scheiner, S.; Seemann, B.; Schweizer, P.; Brabec, C.J. Solar spectral conversion for improving the photosynthetic activity in algae reactors. Nat. Commun. 2013, 4, 2047. [Google Scholar] [CrossRef]
  10. Calvin, M. Solar Energy by Photosynthesis. Science 1974, 184, 375. [Google Scholar] [CrossRef]
  11. O’Regan, B.; Grätzel, M. A low-cost, high-efficiency solar cell based on dye-sensitized colloidal TiO2 films. Nature 1991, 353, 737–740. [Google Scholar] [CrossRef]
  12. Grätzel, M. Recent Advances in Sensitized Mesoscopic Solar Cells. Acc. Chem. Res. 2009, 42, 1788–1798. [Google Scholar] [CrossRef] [PubMed]
  13. Mathew, S.; Yella, A.; Gao, P.; Humphry-Baker, R.; Curchod, B.F.E.; Ashari-Astani, N.; Tavernelli, I.; Rothlisberger, U.; Nazeeruddin, M.K.; Grätzel, M. Dye-sensitized solar cells with 13% efficiency achieved through the molecular engineering of porphyrin sensitizers. Nat. Chem. 2014, 6, 242. [Google Scholar] [CrossRef] [Green Version]
  14. Kakiage, K.; Aoyama, Y.; Yano, T.; Oya, K.; Fujisawa, J.-i.; Hanaya, M. Highly-efficient dye-sensitized solar cells with collaborative sensitization by silyl-anchor and carboxy-anchor dyes. Chem. Commun. 2015, 51, 15894–15897. [Google Scholar] [CrossRef] [PubMed]
  15. Hardin, B.E.; Snaith, H.J.; McGehee, M.D. The renaissance of dye-sensitized solar cells. Nat. Photonics 2012, 6, 162–169. [Google Scholar] [CrossRef]
  16. Jung, H.S.; Lee, J.-K. Dye Sensitized Solar Cells for Economically Viable Photovoltaic Systems. J. Phys. Chem. Lett. 2013, 4, 1682–1693. [Google Scholar] [CrossRef] [PubMed]
  17. Chevrier, M.; Hawashin, H.; Richeter, S.; Mehdi, A.; Surin, M.; Lazzaroni, R.; Dubois, P.; Ratier, B.; Bouclé, J.; Clément, S. Well-designed poly(3-hexylthiophene) as hole transporting material: A new opportunity for solid-state dye-sensitized solar cells. Synth. Met. 2017, 226, 157–163. [Google Scholar] [CrossRef]
  18. Benesperi, I.; Michaels, H.; Freitag, M. The researcher’s guide to solid-state dye-sensitized solar cells. J. Mater. Chem. C 2018, 6, 11903–11942. [Google Scholar] [CrossRef] [Green Version]
  19. Bouclé, J.; Ackermann, J. Solid-state dye-sensitized and bulk heterojunction solar cells using TiO2 and ZnO nanostructures: Recent progress and new concepts at the borderline. Polym. Int. 2012, 61, 355–373. [Google Scholar] [CrossRef]
  20. Cao, Y.; Saygili, Y.; Ummadisingu, A.; Teuscher, J.; Luo, J.; Pellet, N.; Giordano, F.; Zakeeruddin, S.M.; Moser, J.E.; Freitag, M.; et al. 11% efficiency solid-state dye-sensitized solar cells with copper(II/I) hole transport materials. Nat. Commun. 2017, 8, 15390. [Google Scholar] [CrossRef] [Green Version]
  21. Zhang, W.; Wu, Y.; Bahng, H.W.; Cao, Y.; Yi, C.; Saygili, Y.; Luo, J.; Liu, Y.; Kavan, L.; Moser, J.-E.; et al. Comprehensive control of voltage loss enables 11.7% efficient solid-state dye-sensitized solar cells. Energy Environ. Sci. 2018, 11, 1779–1787. [Google Scholar] [CrossRef] [Green Version]
  22. Best Research-Cell Efficiencies. Available online: https://www.nrel.gov/pv/assets/pdfs/best-research-cell-efficiencies.20190923.pdf (accessed on 2 January 2019).
  23. Adeloye, A.O.; Ajibade, P.A. Towards the Development of Functionalized PolypyridineLigands for Ru(II) Complexes as Photosensitizers inDye-Sensitized Solar Cells (DSSCs). Molecules 2014, 19, 12421–12460. [Google Scholar] [CrossRef] [Green Version]
  24. Qin, Y.; Peng, Q. Ruthenium Sensitizers and Their Applications in Dye-Sensitized Solar Cells. Int. J. Photoenergy 2012, 2012, 21. [Google Scholar] [CrossRef] [Green Version]
  25. Ji, J.-M.; Zhou, H.; Kim, H.K. Rational design criteria for D–π–A structured organic and porphyrin sensitizers for highly efficient dye-sensitized solar cells. J. Mater. Chem. A 2018, 6, 14518–14545. [Google Scholar] [CrossRef]
  26. The yield of 12 g of chlorophyll an extracted from 1 kg of spirulina is based on an ethanolic extraction of spirulina obtained as a dry green powder from Algosud®.
  27. Agostiano, A.; Catucci, L.; Cosma, P.; Fini, P. Aggregation processes and photophysical properties of chlorophyll a in aqueous solutions modulated by the presence of cyclodextrins. Phys. Chem. Chem. Phys. 2003, 5, 2122–2128. [Google Scholar] [CrossRef]
  28. Wang, X.-F.; Tamiaki, H.; Wang, L.; Tamai, N.; Kitao, O.; Zhou, H.; Sasaki, S.-I. Chlorophyll-a Derivatives with Various Hydrocarbon Ester Groups for Efficient Dye-Sensitized Solar Cells: Static and Ultrafast Evaluations on Electron Injection and Charge Collection Processes. Langmuir 2010, 26, 6320–6327. [Google Scholar] [CrossRef]
  29. Sasaki, S.-i.; Wang, X.-F.; Ikeuchi, T.; Tamiaki, H. Synthesis of carboxylated chlorophylls and their application as functional materials. J. Porphyr. Phthalocyanines 2015, 19, 517–526. [Google Scholar] [CrossRef]
  30. Tamiaki, H.; Hagio, N.; Tsuzuki, S.; Cui, Y.; Zouta, T.; Wang, X.-F.; Kinoshita, Y. Synthesis of carboxylated chlorophyll derivatives and their activities in dye-sensitized solar cells. Tetrahedron 2018, 74, 4078–4085. [Google Scholar] [CrossRef]
  31. Li, Y.; Zhao, W.; Li, M.; Chen, G.; Wang, X.-F.; Fu, X.; Kitao, O.; Tamiaki, H.; Sakai, K.; Ikeuchi, T.; et al. Chlorophyll-Based Organic–Inorganic Heterojunction Solar Cells. Chem. Eur. J. 2017, 23, 10886–10892. [Google Scholar] [CrossRef]
  32. Zhao, W.; Sasaki, S.-I.; Tamiaki, H.; Sanehira, Y.; Wei, Y.; Chen, G.; Wang, X.-F. Enhancement of performance in chlorophyll-based bulk-heterojunction organic-inorganic solar cells upon aggregate management via solvent engineering. Org. Electron. 2018, 59, 419–426. [Google Scholar] [CrossRef]
  33. Cui, Y.; Zhao, W.; Ogasawara, S.; Wang, X.-F.; Tamiaki, H. Fabrication and performance of all-solid-state dye-sensitized solar cells using synthetic carboxylated and pyridylated chlorophyll derivatives. J. Photochem. Photobiol. A 2018, 353, 625–630. [Google Scholar] [CrossRef]
  34. Smith, K.M.; Goff, D.A.; Simpson, D.J. The meso substitution of chlorophyll derivatives: Direct route for transformation of bacteriopheophorbides d into bacteriopheophorbides c. J. Am. Chem. Soc. 1985, 107, 4946–4954. [Google Scholar] [CrossRef]
  35. Tamiaki, H.; Amakawa, M.; Shimono, Y.; Tanikaga, R.; Holzwarth, A.R.; Schaffner, K. Synthetic Zinc and Magnesium Chlorin Aggregates as Models for Supramolecular Antenna Complexes in Chlorosomes of Green Photosynthetic Bacteria. Photochem. Photobiol. 1996, 63, 92–99. [Google Scholar] [CrossRef]
  36. Sun, L.; Wang, S. Spectral and nonlinear optical properties of chlorophyll b depends on distortion of two-dimensional electron configuration along one axis. Dyes Pigm. 2004, 61, 273–278. [Google Scholar] [CrossRef]
  37. Li, Y.; Sasaki, S.-i.; Tamiaki, H.; Liu, C.-L.; Song, J.; Tian, W.; Zheng, E.; Wei, Y.; Chen, G.; Fu, X.; et al. Zinc chlorophyll aggregates as hole transporters for biocompatible, natural-photosynthesis-inspired solar cells. J. Power Sources 2015, 297, 519–524. [Google Scholar] [CrossRef]
  38. Jungsuttiwong, S.; Sirithip, K.; Prachumrak, N.; Tarsang, R.; Sudyoadsuk, T.; Namuangruk, S.; Kungwan, N.; Promarak, V.; Keawin, T. Significant enhancement in the performance of porphyrin for dye-sensitized solar cells: Aggregation control using chenodeoxycholic acid. New J. Chem. 2017, 41, 7081–7091. [Google Scholar] [CrossRef]
  39. Kay, A.; Graetzel, M. Artificial photosynthesis. 1. Photosensitization of titania solar cells with chlorophyll derivatives and related natural porphyrins. J. Phys. Chem. 1993, 97, 6272–6277. [Google Scholar] [CrossRef]
  40. Lee, K.-M.; Suryanarayanan, V.; Ho, K.-C.; Justin Thomas, K.R.; Lin, J.T. Effects of co-adsorbate and additive on the performance of dye-sensitized solar cells: A photophysical study. Sol. Energy Mat. Sol. Cells 2007, 91, 1426–1431. [Google Scholar] [CrossRef]
  41. Yum, J.-H.; Jang, S.-r.; Humphry-Baker, R.; Grätzel, M.; Cid, J.-J.; Torres, T.; Nazeeruddin, M.K. Effect of Coadsorbent on the Photovoltaic Performance of Zinc Pthalocyanine-Sensitized Solar Cells. Langmuir 2008, 24, 5636–5640. [Google Scholar] [CrossRef]
  42. Lu, H.-P.; Tsai, C.-Y.; Yen, W.-N.; Hsieh, C.-P.; Lee, C.-W.; Yeh, C.-Y.; Diau, E.W.-G. Control of Dye Aggregation and Electron Injection for Highly Efficient Porphyrin Sensitizers Adsorbed on Semiconductor Films with Varying Ratios of Coadsorbate. J. Phys. Chem. C 2009, 113, 20990–20997. [Google Scholar] [CrossRef] [Green Version]
  43. Qu, S.; Wu, W.; Hua, J.; Kong, C.; Long, Y.; Tian, H. New Diketopyrrolopyrrole (DPP) Dyes for Efficient Dye-Sensitized Solar Cells. J. Phys. Chem. C 2010, 114, 1343–1349. [Google Scholar] [CrossRef]
  44. Nazeeruddin, M.K.; Humphry-Baker, R.; GrÄTzel, M.; WÖHrle, D.; Schnurpfeil, G.; Schneider, G.; Hirth, A.; Trombach, N. Efficient Near-IR Sensitization of Nanocrystalline TiO2 Films by Zinc and Aluminum Phthalocyanines. J. Porphyr. Phthalocyanines 1999, 3, 230–237. [Google Scholar] [CrossRef]
  45. Melhem, H.; Simon, P.; Beouch, L.; Goubard, F.; Boucharef, M.; Di Bin, C.; Leconte, Y.; Ratier, B.; Herlin-Boime, N.; Bouclé, J. TiO2 Nanocrystals Synthesized by Laser Pyrolysis for the Up-Scaling of Efficient Solid-State Dye-Sensitized Solar Cells. Adv. Energy Mater. 2011, 1, 908–916. [Google Scholar] [CrossRef]
  46. Schmidt-Mende, L.; Bach, U.; Humphry-Baker, R.; Horiuchi, T.; Miura, H.; Ito, S.; Uchida, S.; Grätzel, M. Organic Dye for Highly Efficient Solid-State Dye-Sensitized Solar Cells. Adv. Mater. 2005, 17, 813–815. [Google Scholar] [CrossRef]
  47. Erten-Ela, S.; Ocakoglu, K.; Tarnowska, A.; Vakuliuk, O.; Gryko, D.T. Performance of zinc chlorophyll based molecules for dye sensitized solar cell. Dyes Pigm. 2015, 114, 129–137. [Google Scholar] [CrossRef]
  48. Ocakoglu, K.; Erten-Ela, S.; Saleem Joya, K.; Harputlu, E. Artificial zinc chlorin dyes for dye sensitized solar cell. Inorg. Chim. Acta 2016, 439, 30–34. [Google Scholar] [CrossRef]
  49. Dhafina, W.A.; Daud, M.Z.; Salleh, H. The sensitization effect of anthocyanin and chlorophyll dyes on optical and photovoltaic properties of zinc oxide based dye-sensitized solar cells. Optik 2019, 163808. [Google Scholar] [CrossRef]
  50. Panda, B.B.; Mahapatra, P.K.; Ghosh, M.K. Application of Chlorophyll as Sensitizer for ZnS Photoanode in a Dye-Sensitized Solar Cell (DSSC). J. Electron. Mater. 2018, 47, 3657–3665. [Google Scholar] [CrossRef]
  51. Wang, X.-F.; Kitao, O.; Zhou, H.; Tamiaki, H.; Sasaki, S.-i. Extension of π-conjugation length along the Qy axis of a chlorophylla derivative for efficient dye-sensitized solar cells. Chem. Commun. 2009, 1523–1525. [Google Scholar] [CrossRef]
  52. Sun, Y.; Wang, X.-F.; Chen, G.; Zhan, C.-H.; Kitao, O.; Tamiaki, H.; Sasaki, S.-i. Near-infrared absorption carboxylated chlorophyll-a derivatives for biocompatible dye-sensitized hydrogen evolution. Int. J. Hydrog. Energy 2017, 42, 15731–15738. [Google Scholar] [CrossRef]
  53. Fattori, A.; Cangiotti, M.; Fiorani, L.; Lucchi, S.; Ottaviani, M.F. Characterization of the TiO2/Dye/Electrolyte Interfaces in Dye-Sensitized Solar Cells by Means of a Titania-Binding Nitroxide. Langmuir 2014, 30, 13570–13580. [Google Scholar] [CrossRef] [PubMed]
  54. Boucher, L.J.; Katz, J.J. Aggregation of metallochlorophylls. J. Am. Chem. Soc. 1967, 89, 4703–4708. [Google Scholar] [CrossRef]
  55. Tamiaki, H.; Yagai, S.; Miyatake, T. Synthetic zinc tetrapyrroles complexing with pyridine as a single axial ligand. Bioorg. Med. Chem. 1998, 6, 2171–2178. [Google Scholar] [CrossRef]
  56. Wang, X.-F.; Koyama, Y.; Wada, Y.; Sasaki, S.-i.; Tamiaki, H. A dye-sensitized solar cell using pheophytin–carotenoid adduct: Enhancement of photocurrent by electron and singlet-energy transfer and by suppression of singlet–triplet annihilation due to the presence of the carotenoid moiety. Chem. Phys. Lett. 2007, 439, 115–120. [Google Scholar] [CrossRef]
  57. Frisch, M.J.; Trucks, G.W.; Schlegel, H.B.; Scuseria, G.E.; Robb, M.A.; Cheeseman, J.R.; Scalmani, G.; Barone, V.; Mennucci, B.; Petersson, G.A.; et al. Electronic Supplementary Material(ESI) for Chemical Science. Available online: http://www.rsc.org/suppdata/c5/sc/c5sc02423d/c5sc02423d1.pdf (accessed on 2 January 2019).
  58. Khairy, K.; Budil, D.; Fajer, P. Nonlinear-least-squares analysis of slow motional regime EPR spectra. J. Magn. Reson. 2006, 183, 152–159. [Google Scholar] [CrossRef]
  59. O’Regan, B.C.; Lenzmann, F. Charge Transport and Recombination in a Nanoscale Interpenetrating Network of n-Type and p-Type Semiconductors:  Transient Photocurrent and Photovoltage Studies of TiO2/Dye/CuSCN Photovoltaic Cells. J. Phys. Chem. B 2004, 108, 4342–4350. [Google Scholar] [CrossRef]
Sample Availability: Samples of the compounds M1M6 are available from the authors.
Scheme 1. Synthesis of chlorins M1M6 from MPPa: (a) HCl, acetone; (b) Zn(OAc)2·2H2O, MeOH/THF; (c) OsO4, NaIO4, dioxane-AcOH-water; (d) Ph3P=CHCOOtBu, CH2Cl2; (e) CF3COOH; and (f) NCCH2COOH, piperidine-THF.
Molecules 25 00198 sch001
Figure 2. UV-Visible absorption spectra of TiO2 films impregnated with M2 (0.3 mM in THF) and increasing co-adsorbent concentration (0 mM: blue line; 0.3 mM: red line; 1.5 mM: green line, and 3 mM: purple line in THF).
Molecules 25 00198 g002
Figure 3. Current–voltage characteristics of solid-state dye sensitized solar cells (ssDSSCs) sensitized with dye M2 depending on the co-adsorbent concentration.
Molecules 25 00198 g003
Figure 4. Incident photon-to-current efficiency (IPCE) spectra of all-solid state DSSCs sensitized with M2 in the presence/absence of co-adsorbent.
Molecules 25 00198 g004
Figure 5. Current-voltage characteristics of ssDSSCs sensitized with chlorins M1M6 under illumination.
Molecules 25 00198 g005
Figure 6. Electron recombination lifetime as a function of Voc in chlorin- and D102 based ssDSSCs.
Molecules 25 00198 g006
Figure 7. HOMO-1, HOMO, LUMO, LUMO + 1, LUMO + 2, and LUMO + 3 molecular orbitals for M2 (top) and M4 (middle) and M6 (bottom) dyes. The anchoring groups are circled in black.
Molecules 25 00198 g007
Figure 8. LUMO, LUMO + 1, and LUMO + 2 energy levels of chlorin dyes M2, M4, and M6. The values for the conduction band edge of the semiconductor calculated from a Ti38O76 cluster is added for comparison (dashed line).
Molecules 25 00198 g008
Figure 9. Electron paramagnetic resonance spectroscopy (EPR) spectra of DSSCs sensitized with the chlorine dyes M1 (black line), M3 (red line) and M5 (blue line). The relative fast component and free component of the spectra are shown in the graph.
Molecules 25 00198 g009
Figure 10. Experimental and computed spectra (extracted slow and fast component) for the probe 4C-T interacting with the dyes M1, M3, and M5.
Molecules 25 00198 g010
Table 1. Spectral characteristics of chlorin derivatives M1M6 in THF solution and grafted on the TiO2 surface.
CompoundSolventλmax/nm
SoretQx(0,1)/(0,0)QY(0,1)/(0,0)
M1THF414507/536610/668
TiO2 520/553620/673
M2THF427524/570609/657
TiO2 524/541633/681
M3THF417513/545621/681
TiO2 518/560632/685
M4THF436531/576621/671
TiO2 524/541631/681
M5THF409515/550636/688
TiO2 518/560632/691
M6THF434532/579625/672
TiO2 527/595635/689
Table 2. Photovoltaic parameters of ssDSSCs sensitized with M2 or D102 under simulated solar emission (100 mW·cm−2, AM1.5G) as a function of the co-adsorbent concentration: short-circuit current density (JSC), open-circuit voltage (VOC); fill factor (FF), and power conversion efficiency (η).
ConcentrationVOC (V)JSC (mA·cm−2)FFηBest η
0 mM0.54 ± 0.010.73 ± 0.1047 ± 40.18 ± 0.010.19
0.3 mM0.52 ± 0.021.27 ± 0.2436 ± 30.23 ± 0.020.25
1.5 mM0.65 ± 0.031.73 ± 0.1948 ± 50.53 ± 0.030.56
3 mM0.56 ± 0.021.96 ± 0.2440 ± 00.39 ± 0.030.42
D1020.76 ± 0.0110.01 ± 0.1949 ± 33.73 ± 0.263.99
Table 3. Photovoltaic parameters of ssDSSCs sensitized with chlorins M1–M6 and D102 under simulated solar emission (100 mW·cm−2, AM 1.5G): short-circuit current density (JSC), open-circuit voltage (VOC), fill factor (FF), and power conversion efficiency (η).
CompoundVOC (V)JSC (mA·cm−2)FFηBest η
M10.54 ± 0.031.99 ± 0.2742 ± 30.45 ± 0.150.60
M20.65 ± 0.031.73 ± 0.1948 ± 50.53 ± 0.030.56
M30.53 ± 0.052.31 ± 0.6346 ± 40.55 ± 0.120.67
M40.54 ± 0.041.62 ± 0.2049 ± 40.43 ± 0.080.51
M50.54 ± 0.021.16 ± 0.1254 ± 60.34 ± 0.050.39
M60.53 ± 0.020.97 ± 0.1552 ± 40.26 ± 0.070.33
Table 4. Values of the total intensity and the relative percentage for the slow and fast component.
DyeTotal Intensity (Integrated; Arbitrary Unit)% of Slow Component with Respect to the Fast% of Slow Component with Respect to the Total
M16453
M3523518
M5146910

