
Corrections of Molecular Morphology and Hydrogen Bond for Improved Crystal Density Prediction
by
 and
and
Linyuan Wang
1, 
Miao Zhang
1,2,
Jie Chen
3,
Liang Su
3,
Shicao Zhao
4,
Chaoyang Zhang
2,
Jian Liu
2,* and
Chunyan Chen
1 1
School of Chemistry and Chemical Engineering, Southwest Petroleum University, Chengdu 610500, China
2
Institute of Chemical Materials, China Academy of Engineering Physics (CAEP), P.O. Box 919-311, Mianyang 621999, China
3
College of Computer Science and Technology, Southwest University of Science & Technology, Mianyang 621010, China
4
Institute of Computer Applications, China Academy of Engineering Physics (CAEP), P.O. Box 919-1201, Mianyang 621999, China
*
Author to whom correspondence should be addressed.
Molecules 2020, 25(1), 161; https://doi.org/10.3390/molecules25010161
Submission received: 19 November 2019
/
Revised: 22 December 2019
/
Accepted: 25 December 2019
/
Published: 31 December 2019
(This article belongs to the Special Issue Advanced Chemistry of Energetic Materials)
Abstract
:Density prediction is of great significance for molecular design of energetic materials, since detonation velocity linearly with density and detonation pressure increases with the density squared. However, the accuracy and generalization of former reported prediction models need further improvement, because most of them are derived from small data sets and few molecular descriptors. As shown in this paper, for molecules presenting brick-like shape or containing more hydrogen-bond donors the predicted densities have large negative deviations from experimental values. Thus, a molecular morphology descriptor η and a hydrogen-bond descriptor Hb are introduced as correction items to build 3 new QSPR models. Besides, 3694 nitro compounds are adopted as data set by this work. The accuracies are obviously improved, and the generalizations are verified by an independent test set. At the level of B3PW91/6-31G(d,p), the effective ratios (ERs) of the 3 Equations, for Δρ < 5%, are 92.7%, 91.8%, and 93.3%; for Δρ < 2%, the values are 53.5%, 51.3%, and 54.7%. At the level of B3LYP/6-31G**, for Δρ < 5%, the values are 92.3%, 91.4% and 92.9%; for Δρ < 2%, the values are 53.7%, 51.4% and 53.2%.
1. Introduction
Crystal density is an intrinsic characteristic for solids, which is used as an index to reveal material properties including mechanistic, thermodynamic, etc. [1,2,3,4,5,6,7,8,9,10,11,12]. As computational chemistry and computational physics are becoming increasingly indispensable in the field of material design, accurate density prediction is of great significance for materials with density-sensitive properties. For instance, to predict a proper detonation performance of an energetic material, it would be necessary to have a reliable estimation of density while considering that the velocity of detonation linearly with density and the detonation pressure increases with the density squared [13].
Since reliable density prediction is the utmost important for estimation of detonation performances, various approaches have been developed to predict densities of energetic compounds over the decades [14,15,16,17,18,19,20,21,22,23,24]. In general, methods for density prediction of organic crystals can be summarized as (i) to obtain the density of single crystal via crystal structure prediction (CSP), (ii) directly calculate via empirical formula based on “group addition” methods (GAM), (iii) combined methods of density functional theory (DFT) and quantitative structure-property relationship (QSPR). In the third category, DFT calculations are applied to obtain chemical descriptors for QSPR.
In all of the above methods, CSP is the most reliable one to calculate crystal density. CSP aims at predicting an unknown crystal structure based on a given molecular structure. The procedures of CSP include random sampling, structure optimization, and energy ranking [25] in which the accuracy of energy calculation is the decisive factor [26]. CSP has been proved to be effective in predicting the structure of inorganic or metallic crystals, but it is not good at dealing with crystals composed of organic molecules [13,27,28,29]. For one thing, conformations and orientations of molecular crystals involving more structural freedom than inorganic or metallic crystals, even powerful supercomputers struggle to provide enough computing resources to achieve effective predictions. For another, the calculation of the weak interaction energy between molecules is a most formidable task, whether through first principle or molecular mechanics, unfortunately The packing patterns of molecules are greatly influenced by these intermolecular interactions [30]. Using CSP to predict the density of organic molecules remains a difficult task, since predicting crystal structures of these materials remains a challenging work [31].
The easiest method to perform density prediction is GAM, which requires only a set of group volumes that can be summed to estimate an effective molecular volume through empirical and simple theoretical function [14,15,24,32,33,34,35,36]. GAM can obtain the effective volume and density of molecules in a relatively short time, its inherent disadvantage is but the low accuracy. In most of the GAM expressions, the descriptors, such as molecular configuration, conformation, and non-bond interaction that have decisive influences on packing pattern of molecules, are missing, and the density prediction errors affected by them are difficult to be corrected through simple empirical formulas. Besides, GAM requires the manual identification of substructures due to the detailed classification of chemical groups and substructures, thus it is not capable of automatic machine predicting when large quantities of compounds need to be marked. [25] In other words, the intelligent algorithms for molecular disassembly must be available before GAM being applied to computer programs, but to achieve these algorithms has been proved to be a challengeable work [31,37,38,39,40,41,42].
DFT + QSPR is the most widely accepted method for density prediction, by which the molecular volume Vm can be readily derived from contour of the molecular electronic density (CMED) that obtained via DFT calculation, and then it will be extrapolated to the crystal density via a given QSPR model. [14,15] The most common used value of electronic density in drawing CMED is 0.001 electrons/bohr3 [17,18,19,20,43,44,45,46,47,48]. Politzer et al. calculated the CMED of 36 neutral molecules at the calculation level of B3PW91/6-31G(d,p), and they introduced positive and negative charge separation as a correction item in their QSPR model, in which the prediction error of 78% compounds was within 0.050 g/cm3. [21] Rice et al. fitted a QSPR model using 180 neutral and 23 ionic molecules at the calculation level of B3LYP/6-31G**, in which the root mean square (RMS) percent deviation and average absolute error of density prediction are 2.7% and 0.035 g/cm3, respectively [23].
Although the density prediction method of DFT + QSPR has been widely used in molecule design and performance prediction, its accuracy needs further improvement. For most of the reported DFT + QSPR methods, the training set is less than 300 samples, with very few molecular descriptors. These hindrances will affect the training accuracy and generalization of the QSPR models. Current work intends to improve density prediction models of DFT + QSPR to perform better accuracy and generalization than before, by introduces new molecular descriptors and extends training set to thousands of samples. As is known to all, the density of organic crystals is not only determined by molecular volume and charge, but also influenced by morphology [19,49], hydrogen bond [50], π-π packing [51], and other factors. The effects of molecular morphology and hydrogen bond on crystal density were not considered by the reported DFT + QSPR methods, which is likely to have an impact on the accuracy of the density prediction.
To improve the accuracy of the model in density prediction of energetic compounds the effects of molecular morphology and hydrogen bond were quantitatively described and introduced into the DFT + QSPR models. The training set and testing set used in this study were 3694 nitro compounds extracted from Cambridge Crystallographic Data Centre (CCDC), among which the training set and testing set accounted for 50%, respectively. In order to quantitatively describe the molecular morphology and the effect of hydrogen bond, a molecular morphology descriptor η and a hydrogen bond descriptor Hb were defined. The results show that η and Hb were significantly correlated with the negative deviation of predicted densities. For molecules presenting brick-like shape or containing more hydrogen-bond donors, the predicted densities tend to be lower than the experimental values. Therefore, the two new molecular descriptors, η and Hb, were introduced into the former formulas [21,22,23] as correction terms (see Section 3.2 and Section 3.3). 3 QSPR models were proposed by using both the descriptors separately and together. The former reported two calculation levels B3PW91/6-31G(d,p) and B3LYP/6-31G** were applied, both considering D3 correction. The models and the levels were mixed to 6 working conditions. For all the working conditions fitted by this work, the computational accuracy was greatly improved compared with all the previous reports of DFT + QSPR. The prediction accuracy of the testing set agrees perfectly with that of the training set, to prove that the models of the work have good generalization.
2. Results and Discussion
2.1. Corrections Ananysis on Prediction Error
To evaluate the influence of η and Hb on prediction error, the relationships between each descriptor and the prediction error are analyzed (Figure 1), using relative error Δρ between the predicted density ρcal via Equation (11) [47,48] and the experimental density ρexp.
The negative deviation of Δρ increasing with the increase of η and Hb, indicating that density values of the molecules with greater η or Hb are more underestimated. It has been reported that planarity [21] and hydrogen-bond [50] are the most important two factors beneficial to dense packing of crystal. Therefore, Equations, without considering these two factors will result in lower density prediction values, especially for molecules with more ‘bricklike’ shape or more hydrogen bonds. Adding η and Hb as correction items in the conventional QSPR Equations is expected to improve the accuracy of density prediction, which is performed in subsequent fitting works.
2.2. Construction of Correction Formulas
The fitting works are performed according to Equations (1)–(3).
For the case that molecular morphology alone influences density prediction, η is added as a correction term in Equation (1). For the case that hydrogen bond alone influences density prediction, Hb is added as a correction term in Equation (2). Considering the coupling influences from molecular morphology and hydrogen bond, where both η and Hb are added as correction terms in Equation (3). The correction items , η and Hb have enough physical meanings, so the system correction factor α can be shielded, and all the values of α are set to 1 in the following fitting works.
2.3. Fitting Results
According to the 3 Equations and 2 calculation levels in Section 2.2, the following 6 working conditions can be obtained to perform fitting works (Table 1).
The fitting works are performed using Orthogonal Distance Regression [52], and the results are illustrated in Figure 2, by comparing the calculated density ρexp with the experimental density ρexp.
As shown in Figure 2 that the density values that were obtained from QSPR, for all the 6 working conditions, are in good agreement with that of experiments. Overall, the values of MSE are less than (12), indicating that the averaged fitting error of Δρ, which can be easily evaluated from quadratic root of the MSE, for each of the 6 conditions is less than 3%. The orders of MSI(III) < MSI(I) < MSI(II) and MSI(VI) < MSI(IV) < MSI(V) indicate that the training accuracy of the 3 Equations are ranked as (3), (1) and (2). Equation (3), corrected by both η and Hb, presents the best training accuracy, while the training accuracy of Equation (1) with correction of η alone is better than that of Equation (2) with correction of Hb alone. For each of the 3 Equations, there is no significant difference in the fitting errors obtained by different calculation levels.
All the fitted parameters of the 6 conditions are listed in Figure 1. Besides, to evaluate the effective boundaries of all the 6 conditions, the maximum absolute error Δρmax of each condition is calculated out and listed behind the fitted parameters.
As shown in Table 2, for the calculation level of B3PW91/6-31G(d,p), Δρmax calculated by Equations (1)–(3) are 0.15 g/cm3, 0.17 g/cm3 and 0.15 g/cm3, respectively, for the calculation level of B3LYP/6-31G**, they are 0.15 g/cm3, 0.16 g/cm3 and 0.15 g/cm3, respectively. The results of Δρmax are in accordance with the orders and comparisons demonstrated by Figure 2.
2.4. Evaluation of Accuracy and Generalization
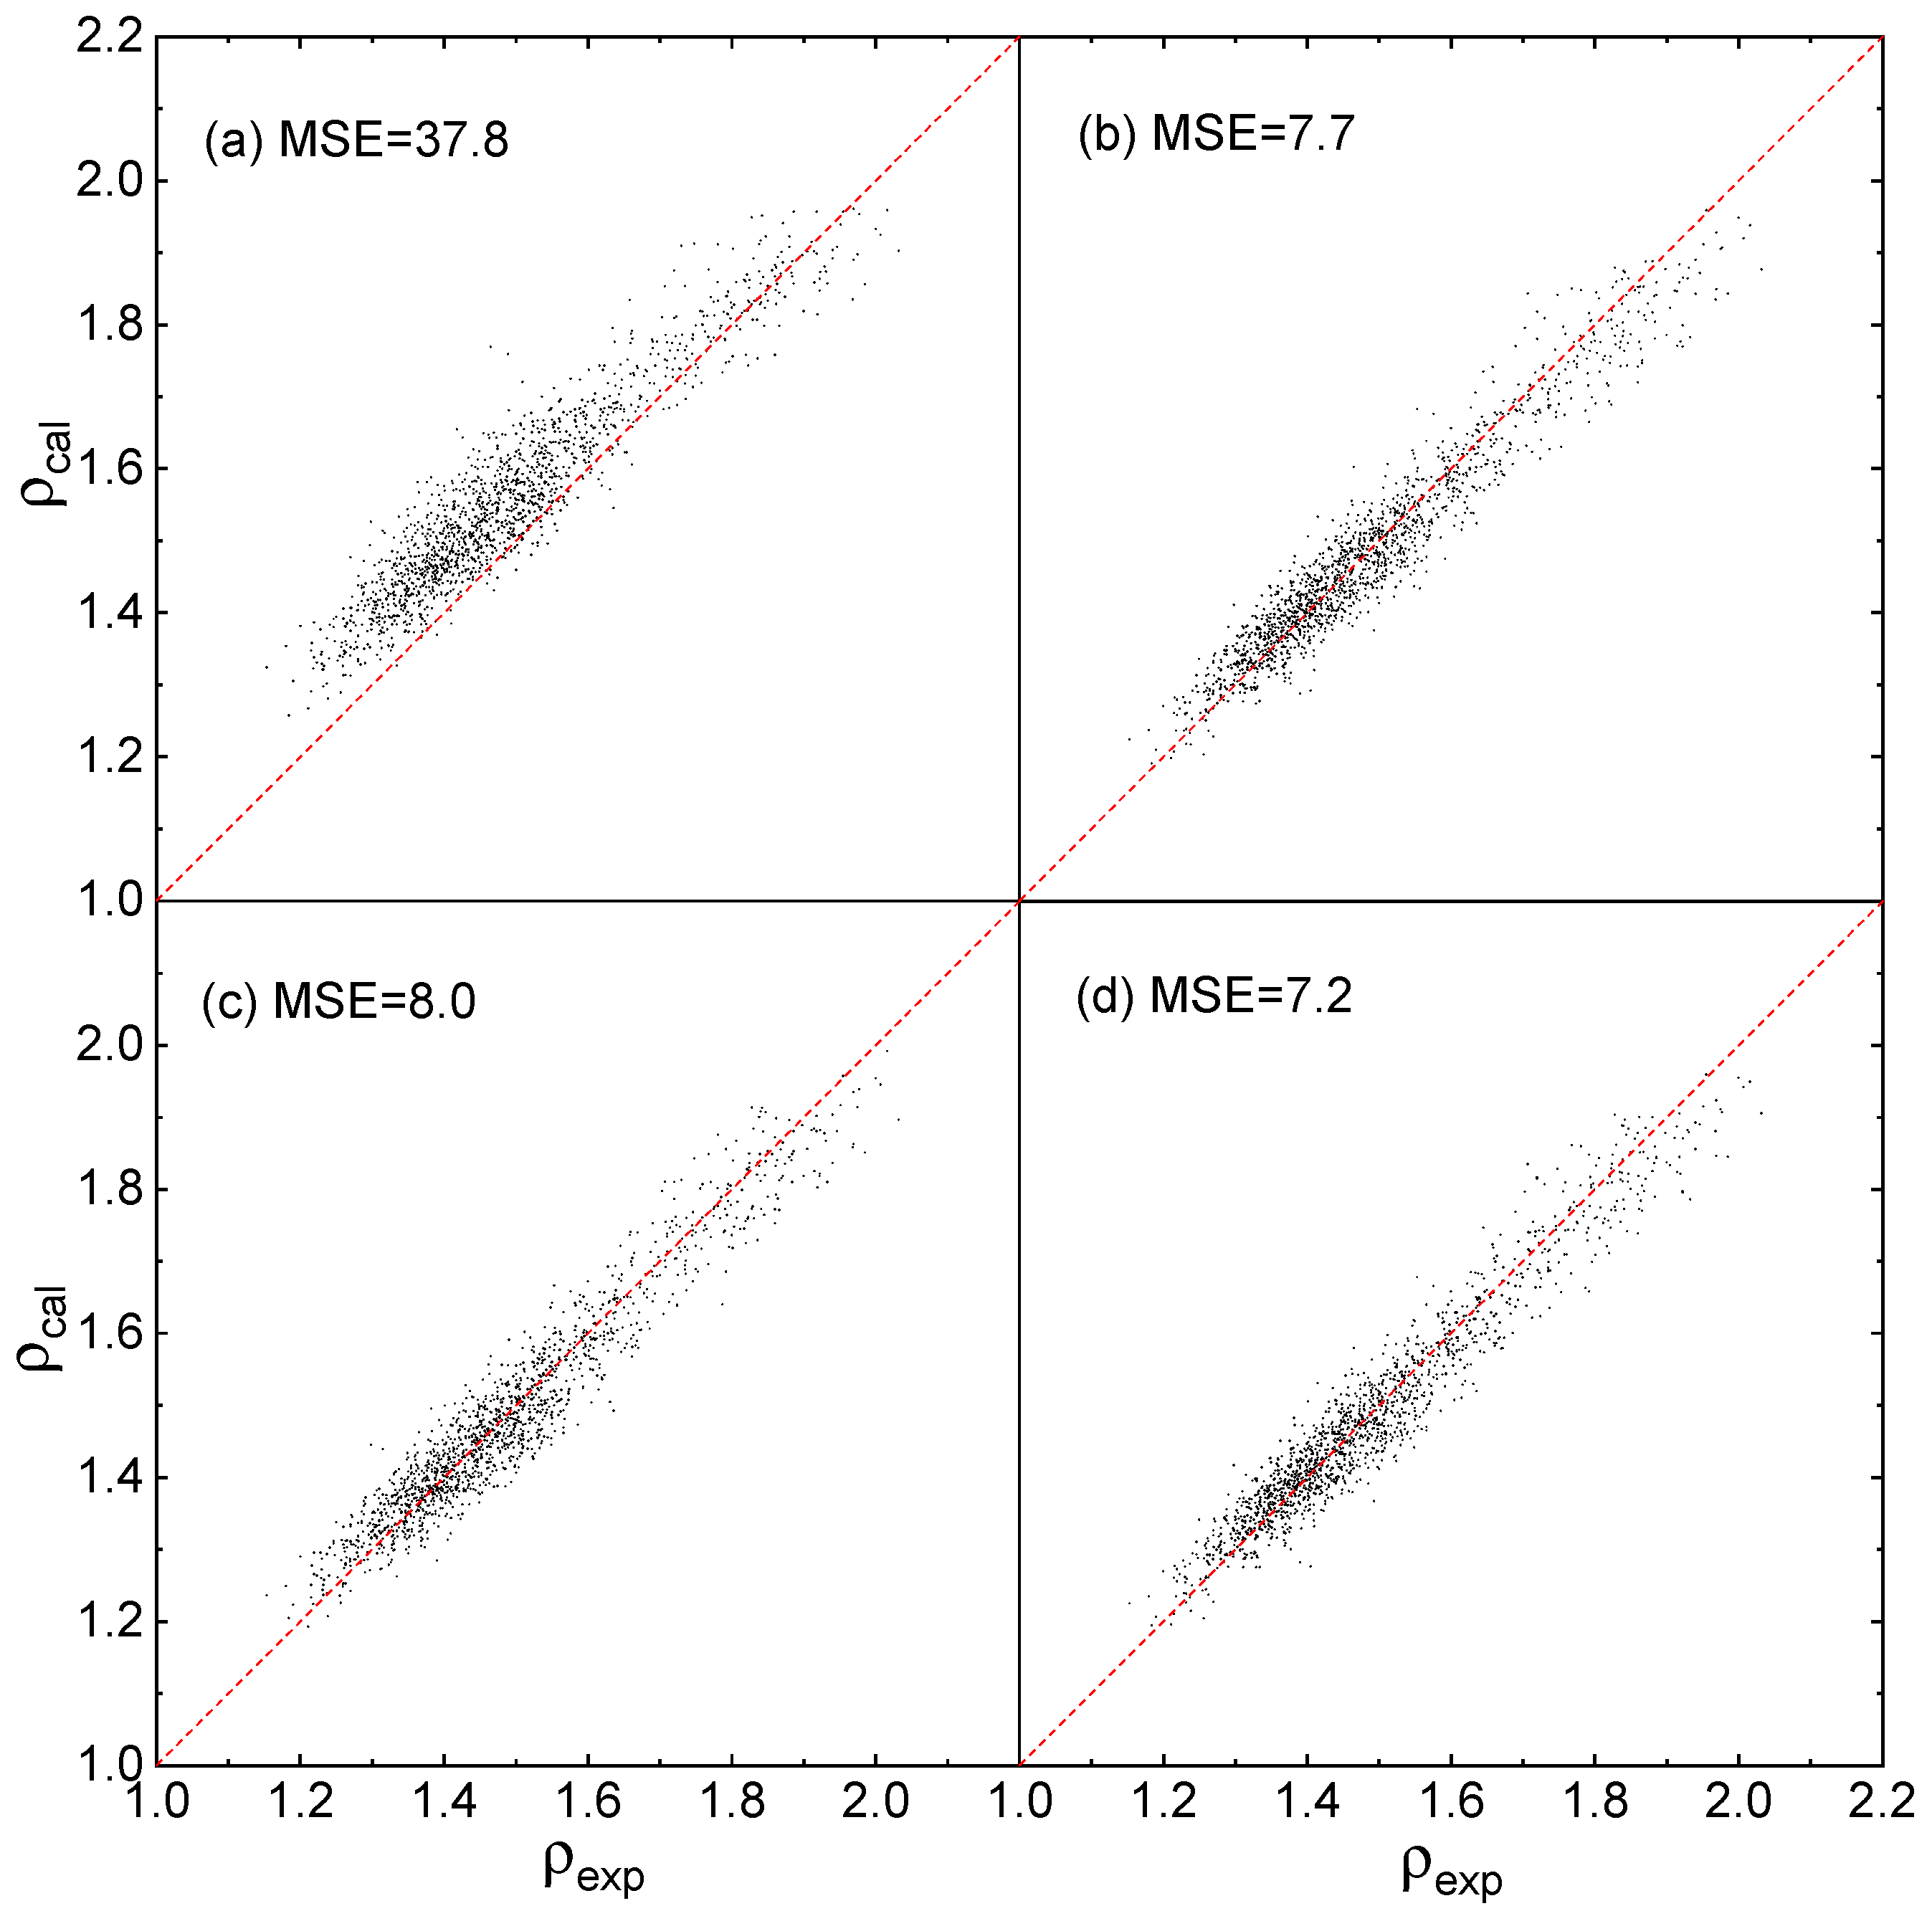
To evaluate the accuracy and generalization of each Equation in Section 2.3, the 1847 compounds in the testing set are used to perform accuracy test. The former reported density prediction Equations and parameters, using above mentioned 2 calculation levels separately [20,21], are introduced as benchmarks to evaluate the accuracies of this work, as show in Figure 3.
As shown in Figure 3a that the predicted densities via Equation (12) using the parameters reported by Politzer et al. [21] are deviate from the experimental densities, especially when the densities are less than 1.6, and its EMS value is 37.8, a far greater value than that calculated by this work. As shown in Figure 3b–d that the predicted densities via the 3 Equations proposed by this work are close to the experimental densities, and the prediction MSEs via Equations (1)–(3) are 7.7, 8.0, and 7.2, respectively. For all 3 Equations, the MSE values are closer to that in Figure 2I–III, indicating that the prediction accuracy are perfectly in agreement with the training accuracy.
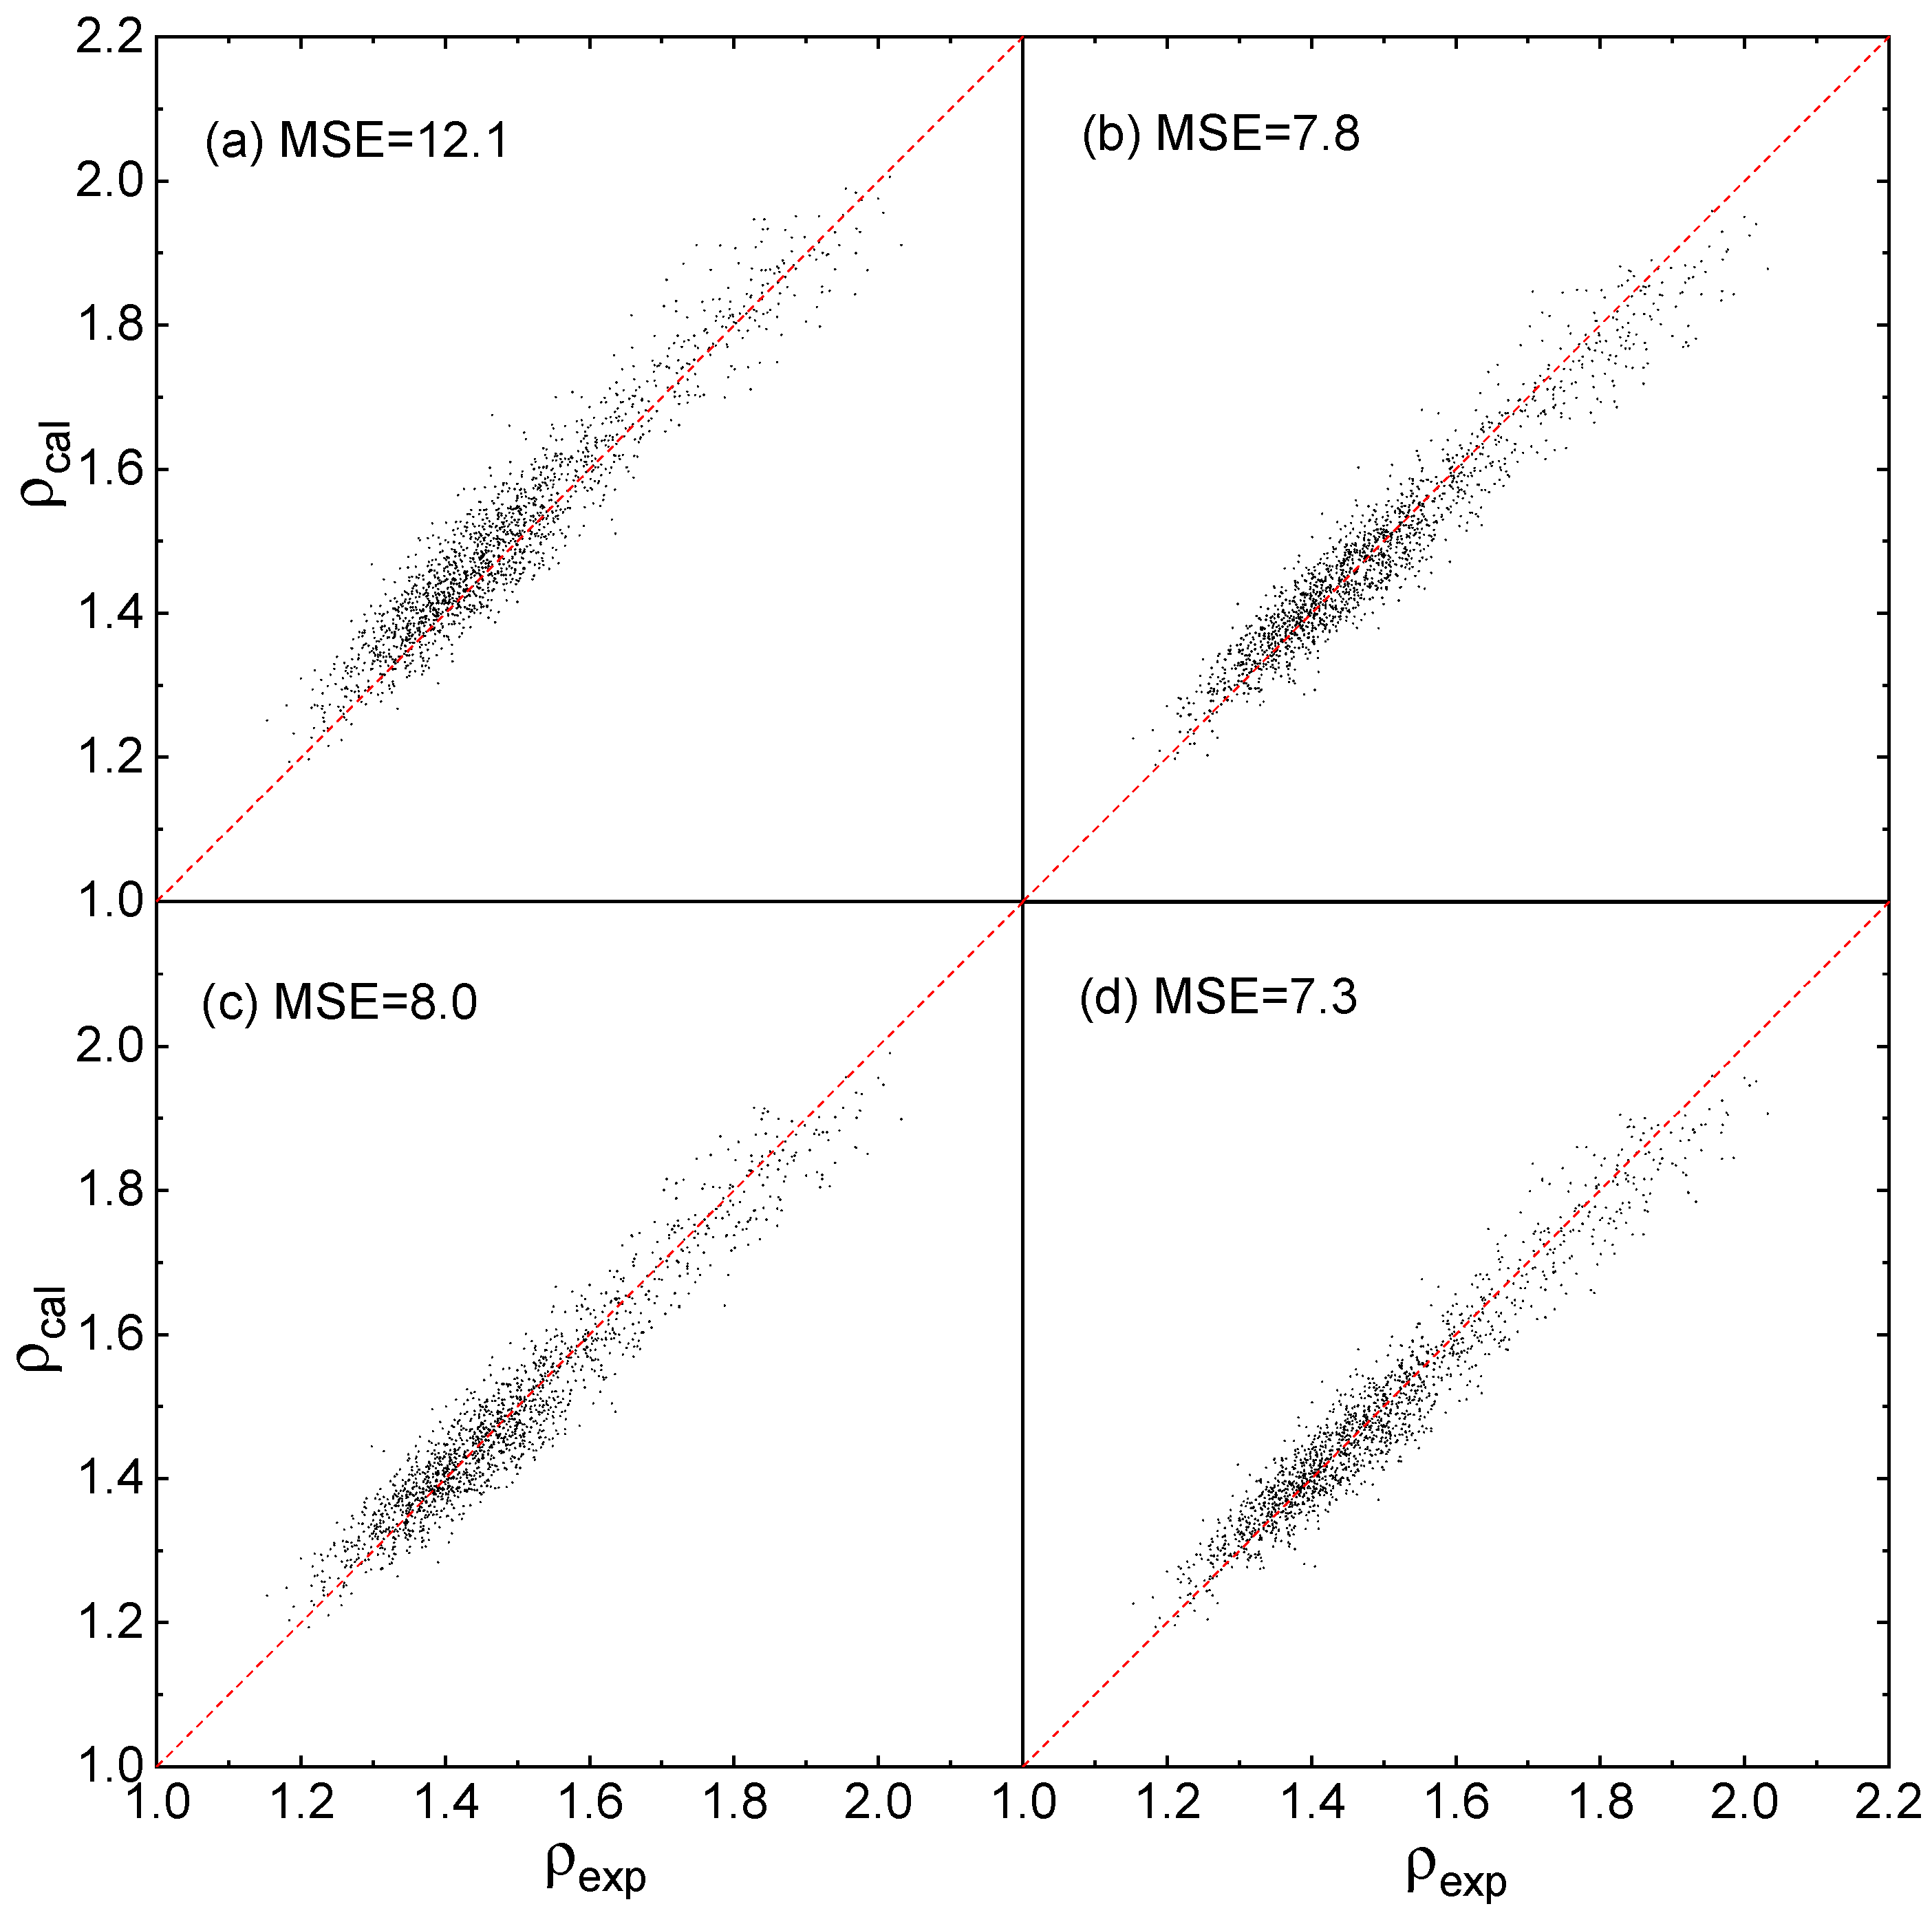
As shown in Figure 4a–d that the predicted densities, via Equation (12) using the parameters reported by Rice et al. [23] and the 3 Equations proposed by this work, are close to the experimental densities. The predicted MSEs via Equations (1)–(3) and (12) are 7.8, 8.0, 7.3 and 12.1, respectively, and the MSE values of Equations (1)–(3) are as good as that in Figure 2IV–VI. Figure 4 indicate that, for all the 3 Equations, the prediction accuracy is in good agreement with the training accuracy.
The effective boundaries of the above Equations and parameters to the testing set are evaluated via the maximum absolute error Δρmax of each condition in Figure 3 and Figure 4, and the values are listed in Table 3.
Table 3 shows that, for the QSPR of density prediction, Δρmax obtained by the parameters fitted based on Equations (1)–(3) are significantly smaller than that based on Equation (12) reported previously, whether the data set is calculated at B3PW91/6-31G(d,p) or B3LYP/6-31G**. Besides, for the three Equations proposed by this work, the values of Δρmax in Table 3 are very comparable with that in Table 2.
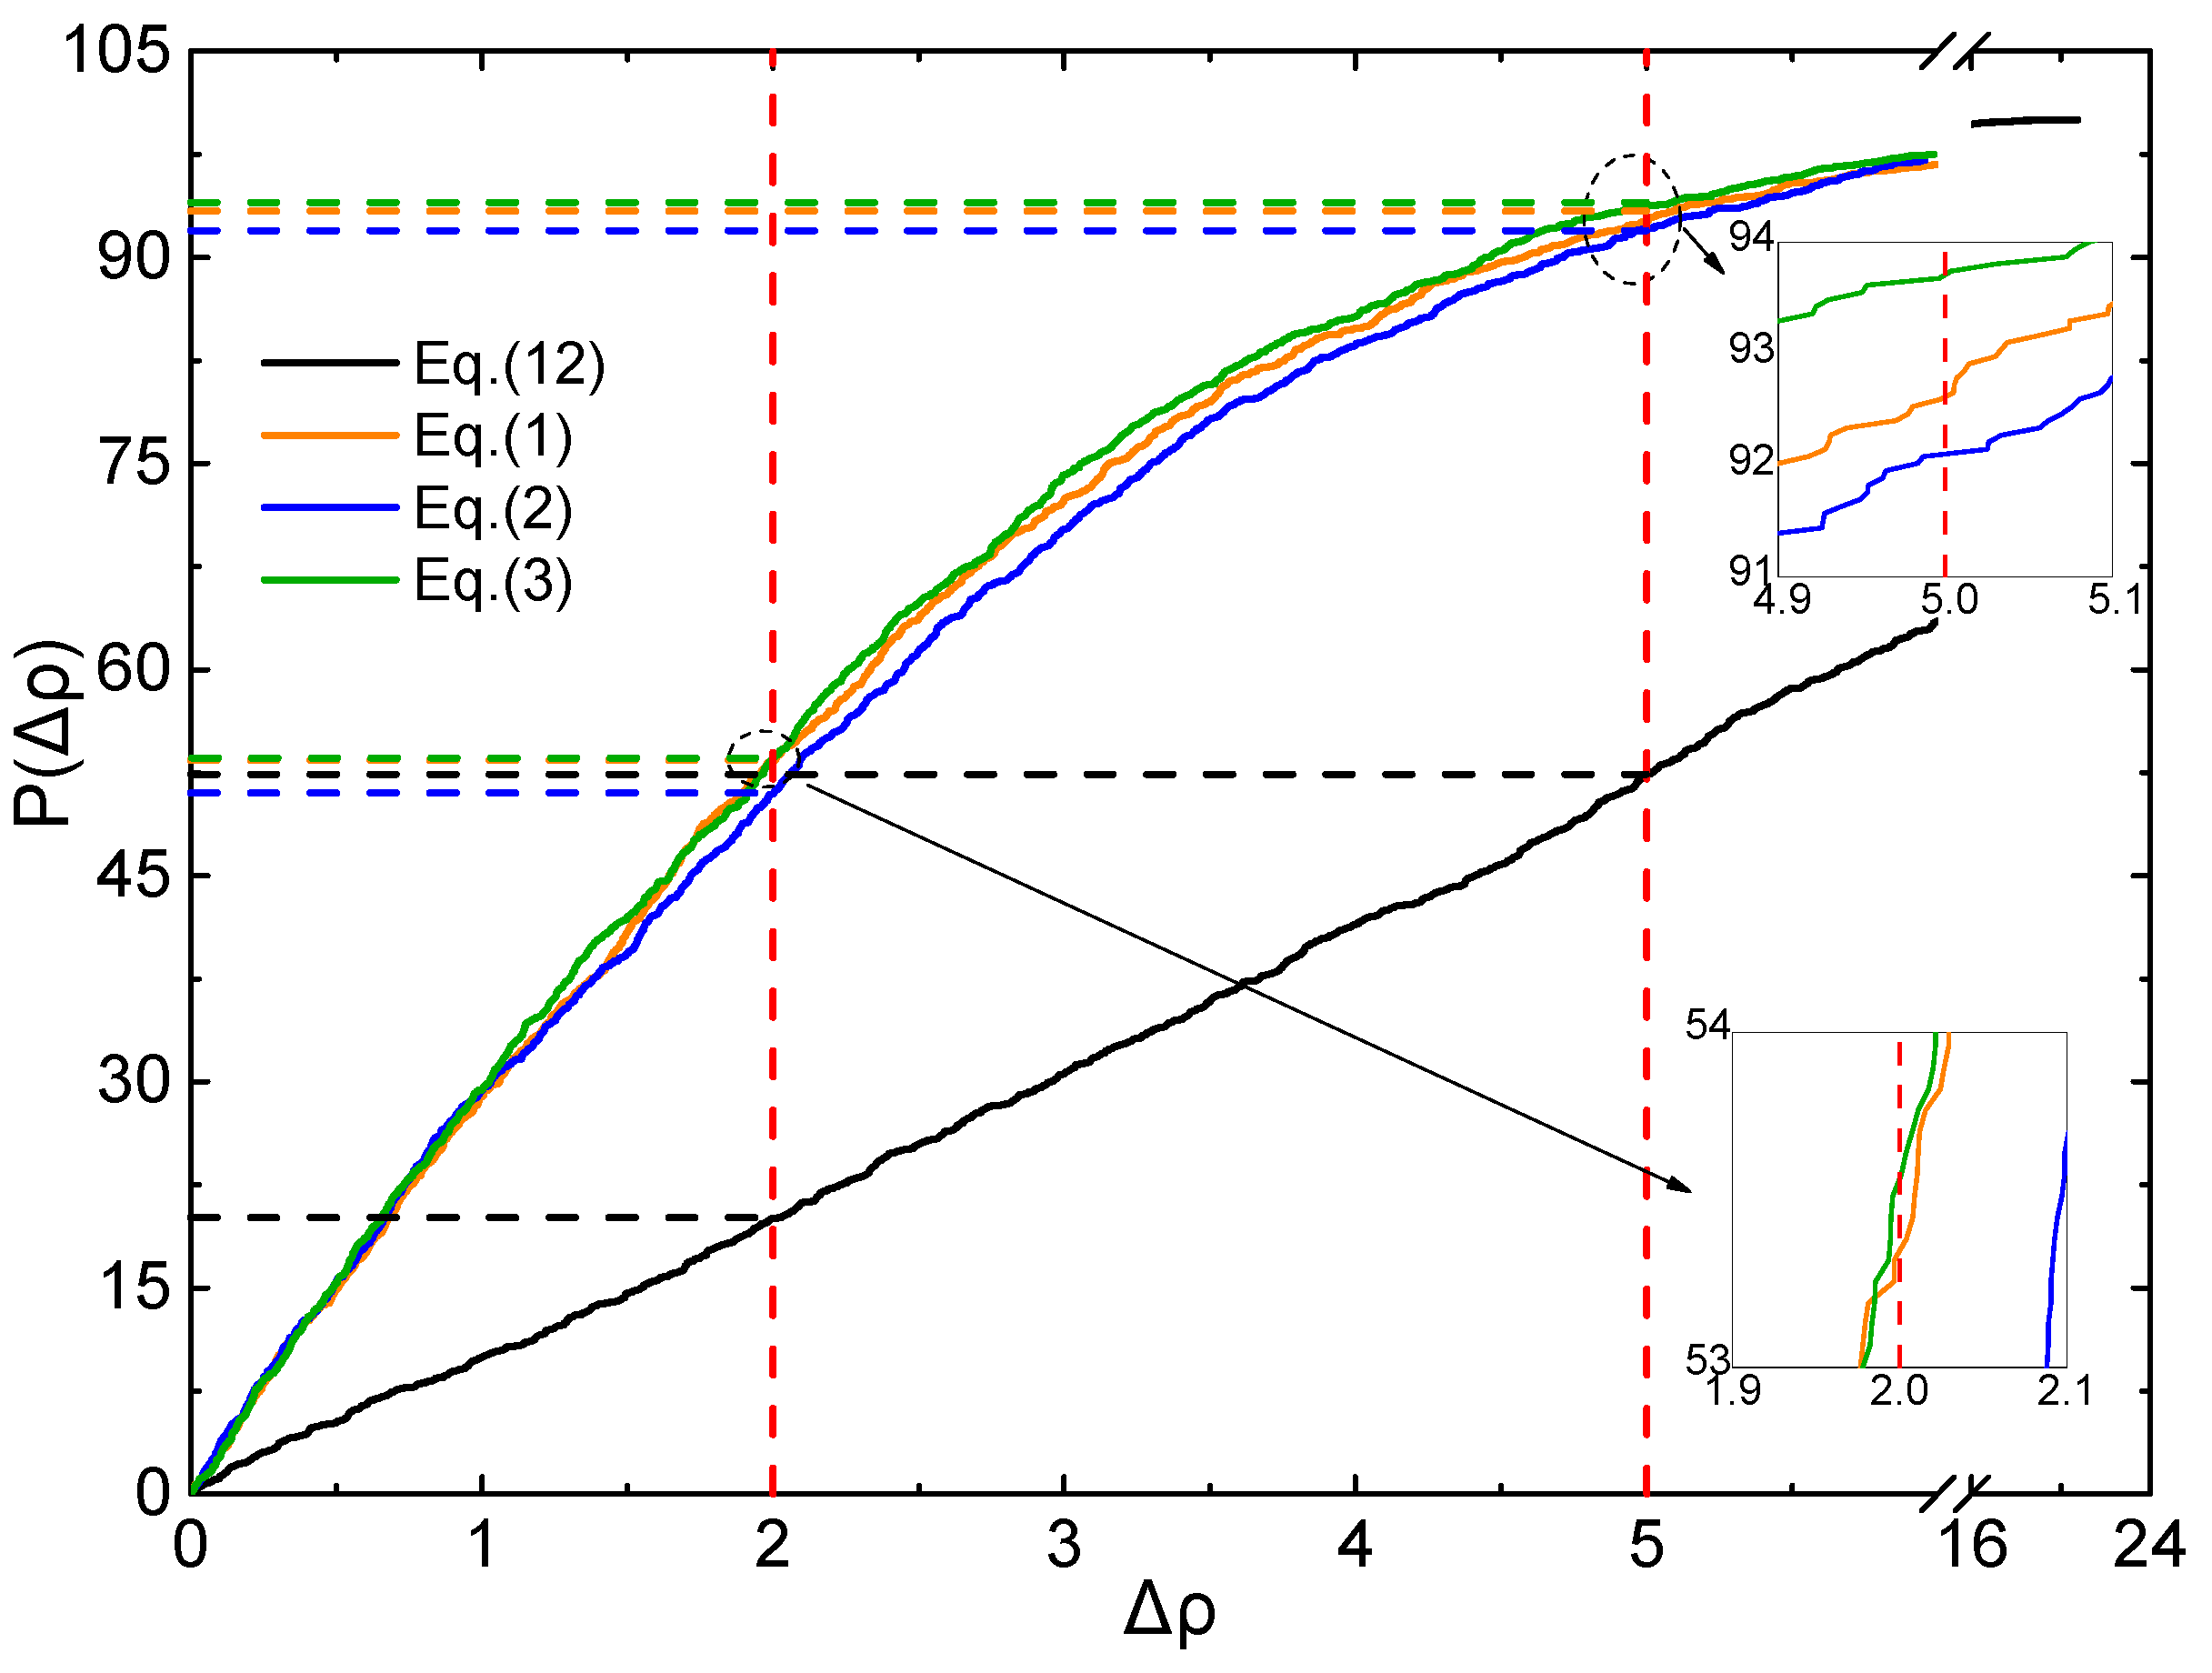
To judge the effective ratio (ER) of all the above mentioned Equations and parameters, the CDF profiles of Δρ are plotted using the testing set, as displayed in Figure 5 and Figure 6.
As shown in Figure 5, for Δρ < 5%, ER of Equations (1)–(3) and (12) are 92. 5%, 92.3%, 93.6%, and 52.4%, respectively. For Δρ < 2%, ER of Equations (1)–(3) and (12) are 53.4%, 51.0%, 53.6%, and 20.1%, respectively. It is clearly that all the ER values of (1)–(3) are much better than that of Equation (12) at the level of B3PW91/6-31G(d,p).
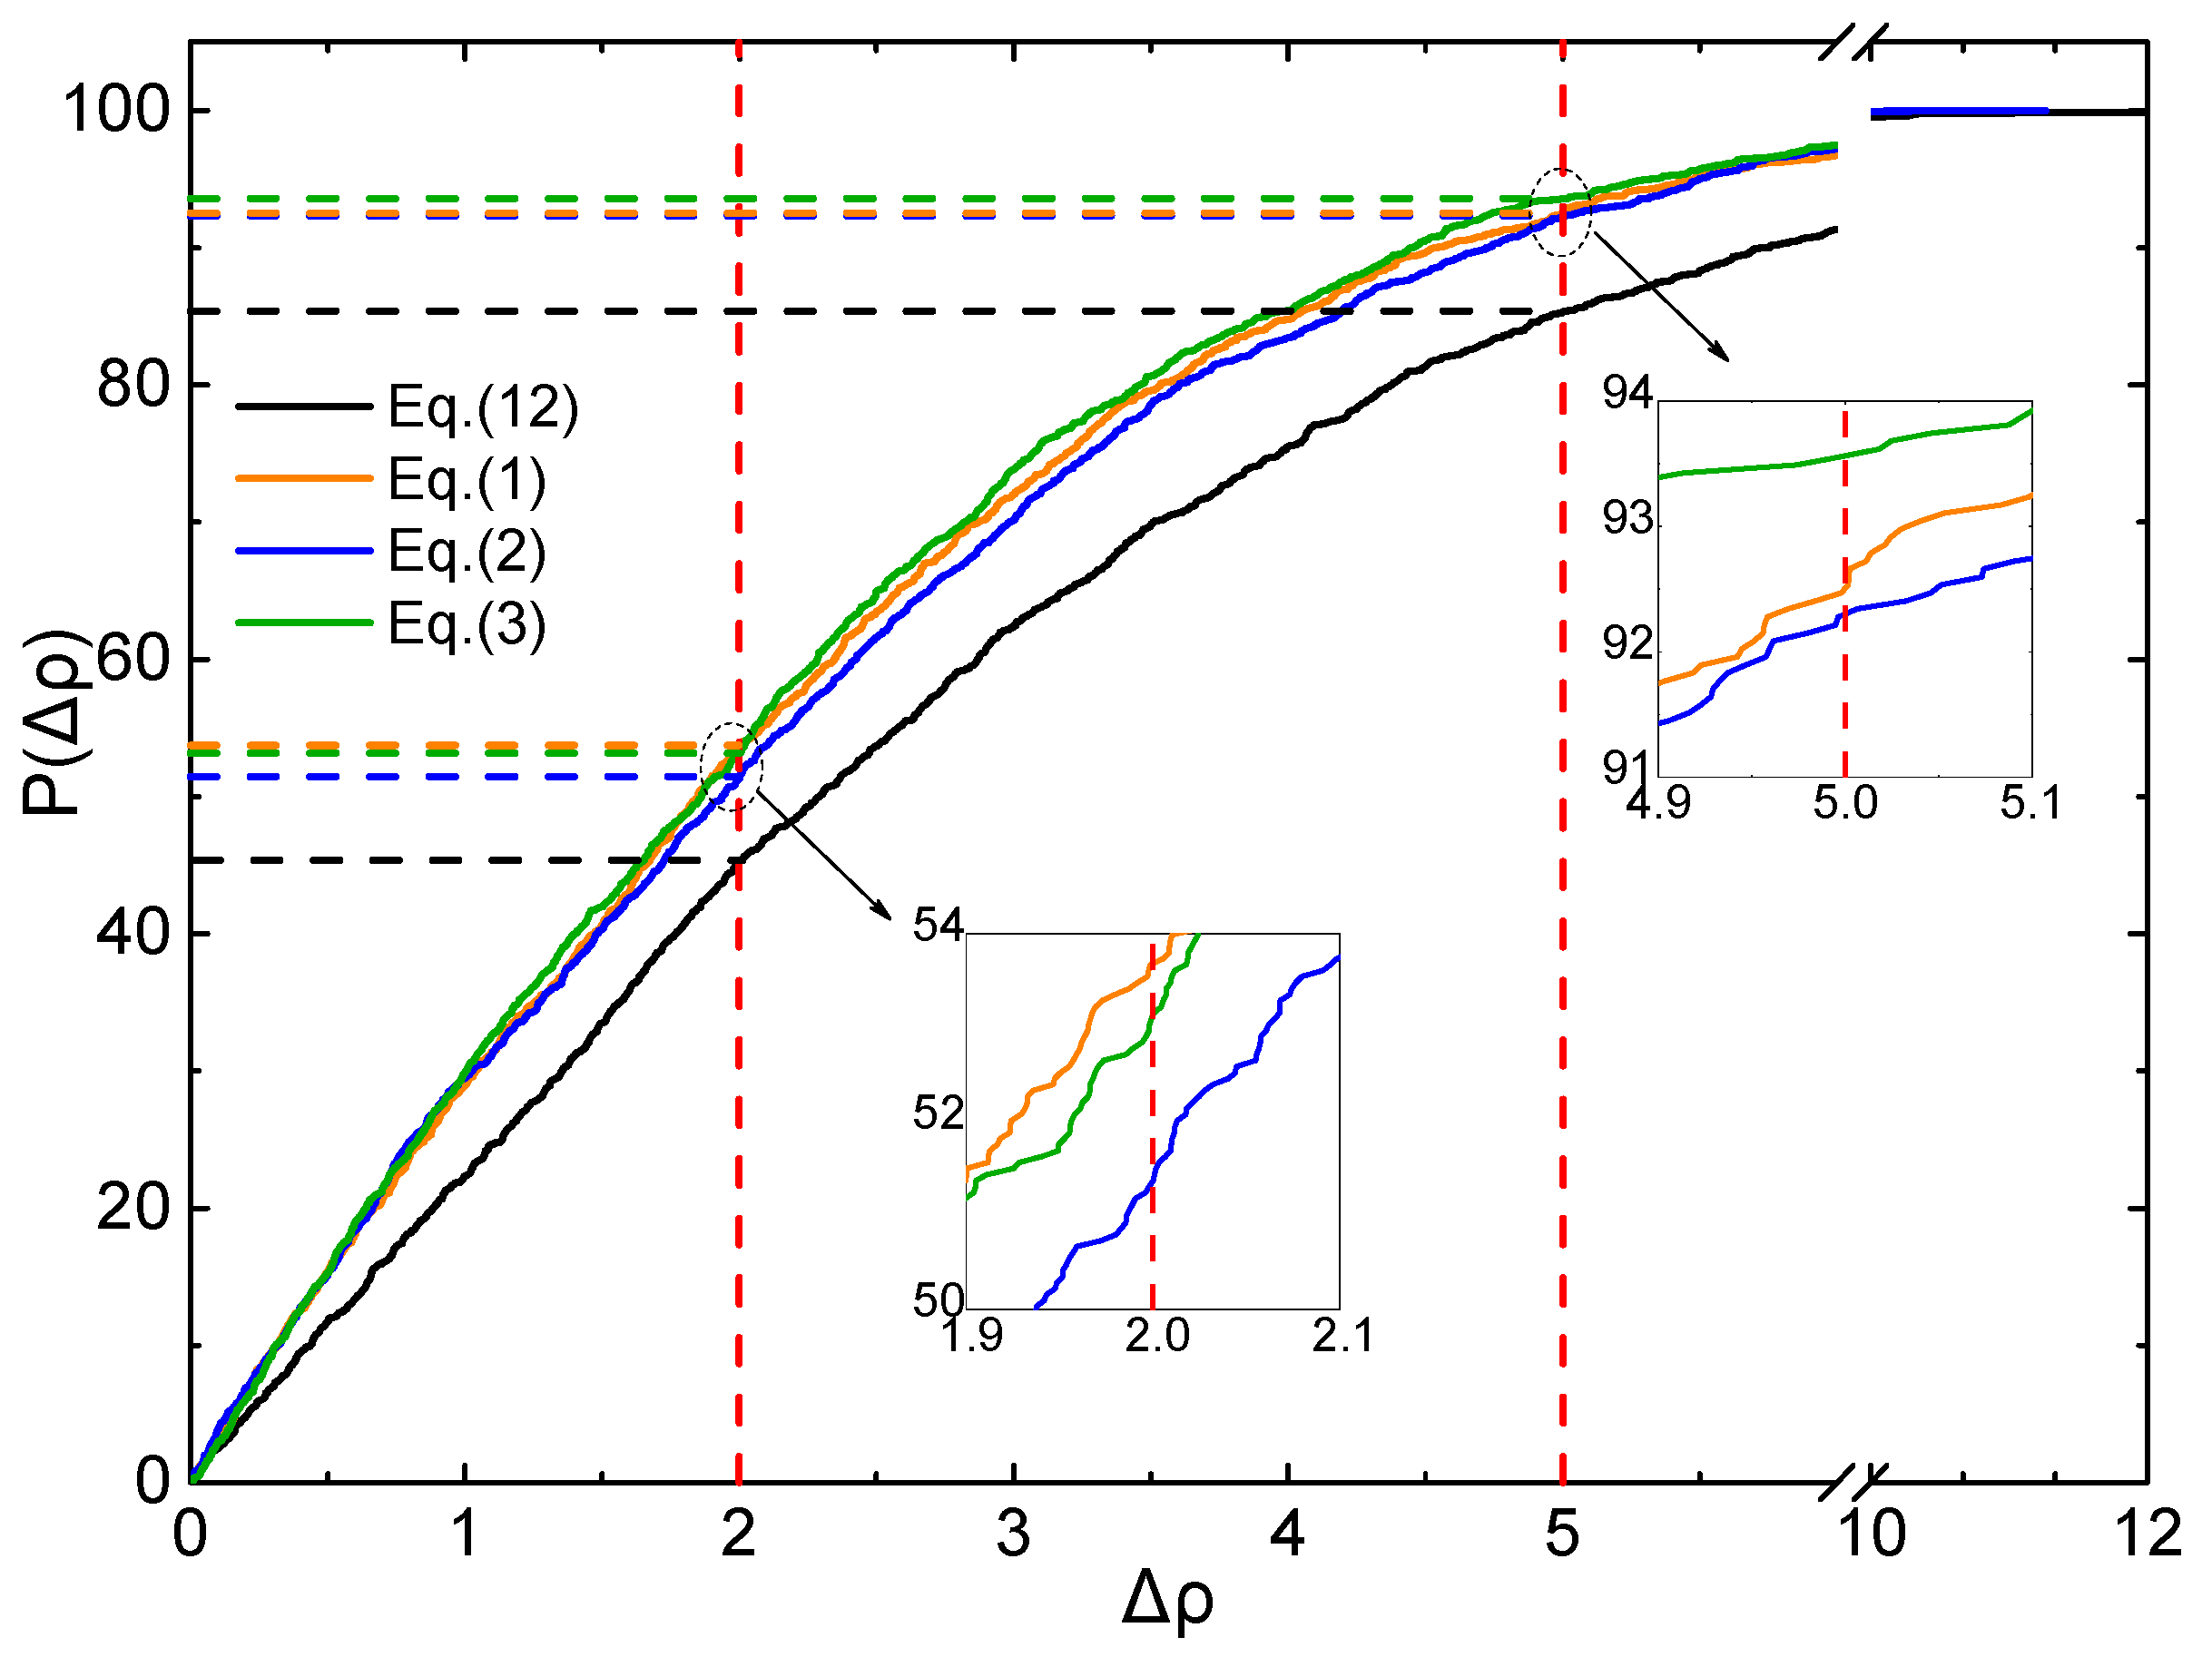
The same features are found in Figure 6, for Δρ < 5%, ER of Equations (1)–(3) and (12) are 92.3%, 91.4%, 92.9% and 85.4%, respectively. For Δρ < 2%, ER of Equations (1)–(3) and (12) are 53.7%, 51.4%, 53.2% and 45.4%, respectively. It is clearly that all the ER values of Equations (1)–(3) are better than that of Equation (12) at the level of B3LYP/6-31G**.
The results of this segment indicate that, for each of the Equations (1)–(3), the accuracy fitting from the training set can be perfectly reproduced by the testing set, and the accuracy of them are better than previous reported works fitted via Equation (12). It is verified that the accuracy of density prediction can be obviously improved by add molecular morphology η and hydrogen bond Hb as correction terms in QSPR formulas. Equation (3) considering the coupling influences from molecular morphology and hydrogen bond is a reliable condition for density prediction of crystals. Both of the calculation level of B3PW91/6-31G(d,p) and B3LPY/6-31G** are capable of density prediction.
3. Theory and Method
3.1. Preparation of Data Set
The fundamental data set for training and testing used in this study were nitro compounds collected from the CCDC crystal database. The data set was built in four steps: (I) Crystal structure searching, (II) Data cleaning, (III) Molecular structure identification and (IV) DFT calculation.
Using –NO2 as substructure, more than 60,000 crystal structures were searched out from CCDC via step (I). Then the crystals containing elements outside the range of C, H, O and N or whose density values been measured under non-ambient conditions were removed in step (II). Step (III) extract individual molecules from each ‘cif’ file to identify and remove unreasonable compounds, including ionic, co-crystals, and molecules with H atoms missing. Finally, 3694 compounds have been kept after the first 3 steps. At step (IV), DFT calculation are performed at two calculation levels, B3PW91/6-31G(d,p) and B3LPY/6-31G**, in accordance with the previous reports [20,21], and both using D3BJ to preform surface analysis were applied using Multiwfn software [53,54] to get the degree of charge separation and CMED.
The training set was built by randomly picked out 50% of compounds from the data set, and the left 50% were used as testing set. The steps of (II), (III), and (IV) were performed on a high-throughput computing integration platform specially used for energetic materials, called Energetic Materials Studio1.0 (EMS 1.0) developed by Institute of Chemical Materials and Institute of Computer Applications. With the application of EMS 1.0, all the procedures of calculations and analysis were performed automatically.
3.2. Morphology Descriptor and Calculation Method
In a Cartesian coordinate system, any plane can be expressed as a universal Equation as
The distance between an atom in a molecule and a given plane can be expressed as
where (xi, yi, zi) is the coordinates of atom i, and ri is distance between atom i and the plane. The sum of ri2 of all atoms in the molecule is reasonable to evaluate the degree of coincidence between the shape of the molecule and the plane, which is expressed as
Suppose there is a plane in space to get the minimize value of , and the value can be used to measure how well the molecule shape matches a plane. Thus, a parameter to characterize the planarity of a molecule can be defined as
where p is planarity parameter, N is the total number of atoms in a molecule. It is implied by Equation (7), that small p vale means good planarity, and p = 0 means that all the atoms of the molecule are in the same plane. To solve the value of p, Particle Swarm Optimization algorithm [55] was applied, and the corresponding code is shown in the Supplementary Materials.
In fact, it is not enough to use p as a single descriptor to evaluate planarity, and molecule size should be taken into account. As shown in Figure 7, among the molecules with similar p, large molecules are more plane-like than small ones.
Therefore, we introduced the distance between the farthest two atoms in a molecule to characterize molecule size
where rij is the distance between any two atoms in a molecule, and rmax is the distance between the farthest two atoms. Planarity and molecular size are considered simultaneously in the morphology of a molecule, by define a morphological descriptor η as
and the closer η gets to 1, the more planar the molecule is.
3.3. Hydrogen Bond Descriptor and Its Calculation Method
To quantitatively describe the hydrogen-bond environment of a molecule, a hydrogen-bond descriptor Hb was introduced, which is concerned with the total number of hydrogen-bond donors of a molecule. In this study, we chose the H atoms connected with N atoms or O atoms as Hydrogen-bonded donors, and the hydrogen-bond descriptor Hb is calculated via
where HN and HO are the H atoms connected to N atoms and O atoms, respectively, and N is the total number of atoms in the molecule. The corresponding code to calculate Hb can be seen in Supplementary Materials).
3.4. Functional Forms
The accuracy of density prediction is corrected and improved remarkably by introducing charge separation of positive and negative [21]
where M is the molecular mass, Vm is the van der Waals volume of a molecule, is the variance of the total electrostatic potential on the molecular surface, is the charge balance degree. All the 3 descriptors are analyzed via Multiwfn software, where is treated as one descriptor, and Vm is acquire by calculate contour surface of electronic density with 0.001 electrons/bohr3 using an improved Marching Tetrahedron algorithm.
By evaluate the correlation between each descriptor and prediction errors, we introduce η and Hb as new descriptors to correct function (12), and the new universal functional form for density prediction can be expressed as
3.5. Accuracy Evaluatiom
Mean square error (MSE) analysis method is used for accuracy evaluation, and the relative percent error Δρ (%) between calculated density ρcal and experimental density ρexp is defined as
To evaluate the generalization of all the QSPR functions, the cumulative distribution function (CDF) is applied by calculate the integral of the probability density function of Δρ via
where, P(Δρ) is the CDF of Δρ, N is the total number of molecules of the whole testing set, Nt is the number of molecules at a given error t.
4. Conclusions
The influence of the two descriptors η and Hb on prediction error indicated that Equations without considering these two factors will result in lower density prediction values, especially for molecules with more ‘bricklike’ shape or more hydrogen bonds. Adding η and Hb as correction items in the conventional QSPR is expected to improve the accuracy of density prediction.
There are 6 working conditions were built considering the 3 QSPR models proposed by this work, and two calculation levels of B3PW91/6-31G(d,p) and B3LYP/6-31G**. The fitting result indicated that all the 3 Equations result in good accuracy with MSE < 9, and the calculation level of B3PW91/6-31G(d,p) is as good as B3LYP/6-31G**.
The accuracy and generalization of each Equation was verified by the 1847 compounds in the testing set. The accuracy of the 3 Equations fitting from the training set were perfectly reproduced by the testing set, and the accuracy and generalization of them are better than previous reported works fitted via Equation (12). At the level of B3PW91/6-31G(d,p), the ERs of the 3 Equations, for Δρ < 5%, are 92.5%, 92.3%, and 93.6%; for Δρ < 2%, the values are 53.4%, 51.0%, and 53.6%. At the level of B3LYP/6-31G**, for Δρ < 5%, the values are 92.3%, 91.4%, and 92.9%; for Δρ < 2%, the values are 53.7%, 51.4%, and 53.2%.
The accuracy of density prediction can be obviously improved by add molecular morphology η and hydrogen bond Hb as correction terms in QSPR formulas. Considering both of η and Hb, Equation (3) is a reliable condition for density prediction, and both B3PW91/6-31G(d,p) and B3LYP/6-31G** are applicable in density prediction.
Supplementary Materials
The Supplementary Materials are available online.
Author Contributions
Conceptualization, J.L.; software, L.S.; formal analysis, M.Z.; resources, S.Z.; data curation, L.W., J.C.; writing—original draft preparation, L.W., M.Z.; writing—review and editing, J.L.; supervision C.Z.; project administration, C.C. All authors have read and agreed to the published version of the manuscript.
Funding
This work was supported by National Key Research and Development Program of China (2018YFB0703903), National Science Funds and Science Challenge Project (TZ2018004).
Conflicts of Interest
The authors declare no conflict of interest
References
- Politzer, P.; Murray, J.S. Impact sensitivity and crystal lattice compressibility/free space. J. Mol. Model. 2014, 20, 2223–2231. [Google Scholar] [CrossRef] [PubMed]
- Keshavarz, M.H. Simple Determination of Performance of Explosives without Using Any Experimental Data. J. Hazard. Mater. 2005, 119, 25–29. [Google Scholar] [CrossRef] [PubMed]
- Keshavarz, M.H. Novel Method for Predicting Densities of Polynitro Arene and Polynitro Heteroarene Explosives in order to Evaluate Their Detonation Performance. J. Hazard. Mater. 2009, 165, 579–588. [Google Scholar] [CrossRef]
- Kamlet, M.J.; Jacobs, S.J.J. Chemistry of Detonations. I. A Simple Method for Calculating Detonation Properties of C-H-N-O Explosives. Chem. Phys. 1968, 48, 23–35. [Google Scholar] [CrossRef]
- Zhang, Q.-H.; Zhang, J.-H.; Qi, X.-J.; Shreeve, J.M. Molecular Design and Property Prediction of High Density Polynitro[3.3.3]-Propellane-Derivatized Frameworks as Potential High Explosives. J. Phys. Chem. A 2014, 118, 10857–10865. [Google Scholar] [CrossRef]
- Fei, T.; Du, Y.; Pang, S.-P. Theoretical Design and Prediction of Properties for Dinitromethyl, Fluorodinitromethyl, and (Difluoroamino)dinitromethyl Derivatives of Triazole and Tetrazole. RSC. Adv. 2018, 8, 10215–10227. [Google Scholar] [CrossRef] [Green Version]
- Pan, Y.; Li, J.-S.; Cheng, B.-B.; Zhu, W.-H.; Xiao, H.-M. Computational Studies on The Heats of Formation, Energetic Properties, and Thermal Stability of Energetic Nitrogen-rich Furazano[3,4-b]pyrazine-based Derivatives. Comput. Theor. Chem. 2012, 992, 110–119. [Google Scholar] [CrossRef]
- Zhang, X.-W.; Xiao, H.-M. Theoretical Studies on Heats of Formation, Detonation Properties, and Bond Dissociation Energies of Monofurazan Derivatives. Int. J. Quant. Chem. 2010, 110, 1549–1558. [Google Scholar] [CrossRef]
- Zhang, X.-W.; Zhu, W.-H.; Xiao, H.-M. Comparative Theoretical Studies of Energetic Carbon-and Nireogen-bridged Difurazans. J. Phys. Chem. A 2010, 114, 603–612. [Google Scholar] [CrossRef]
- Liu, Z.-C.; Wu, Q.; Zhu, W.-H.; Xiao, H.-M. Theoretical Study of Energetic Trinitromethylsubstituted Tetrazole and Tetrazine Derivatives. J. Phys. Org. Chem. 2013, 26, 939–947. [Google Scholar] [CrossRef]
- Wang, F.; Wang, G.-X.; Du, H.-C.; Zhang, J.-Y.; Gong, X.-D. Theoretical Studies on the Heats of Formation, Detonation Properties, and Pyrolysis Mechanisms of Energetic Cyclic Nitramines. J. Phys. Chem. A 2011, 115, 13858–13864. [Google Scholar] [CrossRef] [PubMed]
- Wei, T.; Wu, J.-Z.; Zhu, W.-H.; Zhang, C.-C.; Xiao, H.-M. Characterization of Nitrogen-bridged 1,2,4,5-tetrazine-, furazan-, and 1H-tetrazole-based Polyheterocyclic Compounds: Heats of Formation, Thermal Stability, and Detonation Properties. J. Mol. Model. 2012, 18, 3467–3479. [Google Scholar] [CrossRef]
- Somayazulu, M.; Ahart, M.; Mishra, A.K.; Geballe, Z.M.; Baldini, M.; Meng, Y.; Struzhkin, V.V.; Hemley, R. Evidence for Superconductivity above 260 K in Lanthanum Superhydride at Megabar Pressures. J. Phys. Rev. Lett. 2019, 122, 027001. [Google Scholar] [CrossRef] [PubMed] [Green Version]
- Tarver, C.M. Density Estimations for Explosives and Related Compounds Using the Group Sdditivity Spproach. J. Chem. Eng. Data 1979, 24, 136–145. [Google Scholar] [CrossRef]
- Exner, O. Additive Physical Properties. II. Molar Volume as an Additive Property. Collect. Czech. Chem. Commun. 1967, 32, 1–23. [Google Scholar] [CrossRef]
- Dewar, M.J.S.; Thiel, W.T. Group States of Molecules. 38. The MNDD Method. Approximations and Parameters. J. Am. Chem. Soc. 1977, 99, 4899–4907. [Google Scholar] [CrossRef]
- Politzer, P.; Murray, J.S.; Brinck, T.; Lane, P. ACS Symp. Ser. 586; Nelson, J.O., Karu, A.E., Wong, R.B., Eds.; American Chemical Society: Washington, DC, USA, 1994. [Google Scholar]
- Wang, G.-X.; Xiao, H.-M.; Xu, X.-J.; Ju, X.-H. Detonation Velocities and Pressures, and Their Relationships with Electric Spark Sensitivities for Nitramines. Propell. Explos. Pyrot. 2006, 31, 102–109. [Google Scholar] [CrossRef]
- Qiu, L.; Xiao, H.-M.; Gong, X.-D.; Ju, X.-H.; Zhu, W.-H. Theoretical Studies on the Structures, Thermodynamic Properties, Detonation Properties, and Pyrolysis Mechanisms of Spiro Nitramines. J. Phys. Chem. A 2006, 110, 3797–3807. [Google Scholar] [CrossRef]
- Rice, B.M.; Hare, J.J.; Byrd, E.F.C. Accurate Predictions of Crystal Densities Using Quantum Mechanical Molecular Volumes. J. Phys. Chem. A 2007, 111, 10874–10879. [Google Scholar] [CrossRef]
- Politzer, P.; Martinez, J.; Murray, J.S.; Concha, M.C.; Alejandro, T.L. An Electrostatic Interaction Correction for Improved Crystal Density Prediction. Mol. Phys. 2009, 19, 2095–2101. [Google Scholar] [CrossRef]
- Keshavarz, M.H.; Soury, H.; Motamedoshariati, H.; Dashtizadeh, A. Improved Method for Prediction of Density of Energetic Compounds Using Their Molecular Structure. Struct. Chem. 2015, 26, 455–466. [Google Scholar] [CrossRef]
- Rice, B.M.; Byrd, E.F.C. Evaluation of Electrostatic Descriptors for Predicting Crystalline Density. J. Comput. Chem. 2013, 34, 2146–2151. [Google Scholar] [CrossRef] [PubMed]
- Ammon, H.L. Updated Atom/functional Group and Atom Code Volume Additivity Parameters for The Calculation of Crystal Densities of Single Molecules, Organic Salts, and Multi-fragment Materials Containing, H, C, B, N, O, F, S, P, Cl, Br and I. Propell. Explos. Pyrot. 2008, 33, 92–102. [Google Scholar] [CrossRef]
- Yang, J.; De, S.; Campell, J.E.; Li, S.; Ceriotti, M.; Day, G.M. Large-Scale Computational Screening of Molecular Organic Semiconductors Using Crystal Structure Prediction. Chem. Mater. 2018, 30, 4361–4371. [Google Scholar] [CrossRef] [Green Version]
- Curtis, F.; Li, X.-Y.; Rose, T.; Álvaro, V.M.; Bhattacharya, S.; Ghiringhelli, L.M.; Marom, N. GAtor: A First-Principles Genetic Algorithm for Molecular Crystal Structure Prediction. J. Chem. Theory Comput. 2018, 14, 2246–2264. [Google Scholar] [CrossRef]
- Semenok, D.V.; Kvashnin, A.G.I.; Kruglov, A.A.; Oganov, R. Actinium Hydrides AcH10, AcH12, and AcH16 as High-Temperature Conventional Superconductors. J. Phys. Chem. Lett. 2018, 9, 1920–1926. [Google Scholar] [CrossRef] [Green Version]
- Lepeshkin, S.V.; Baturin, V.S.; Uspenskii, Y.A.; Oganov, A.R. Simultaneous Prediction of Atomic Structure and Stability of Nanoclusters in A Wide Area of Compositions. J. Phys. Chem. Lett. 2019, 10, 102–106. [Google Scholar] [CrossRef] [Green Version]
- Monserrat, B.; Drummond, N.D.; Philip, D.S.; Howie, R.-S.; Ríos, P.L.; Gregoryanz, E.; Pickard, C.J.; Needs, R.J. Structure and Metallicity of Phase V of Hydrogen. Phys. Rev. Lett. 2018, 120, 255701. [Google Scholar] [CrossRef] [Green Version]
- Podryabinkin, E.V.; Tikhonov, E.V.; Shapeev, A.V.; Oganov, A.R. Accelerating Crystal Structure Prediction by Machine-learning Interatomic Potentials with Active Learning. Phys. Rev. B 2019, 99, 064114. [Google Scholar] [CrossRef] [Green Version]
- Oganov, A.R.; Pickard, C.J.; Zhu, Q.; Needs, R.J. Struture Prediction Drives Materials Discovery. Nat. Rev. Mater. 2019, 4, 331–348. [Google Scholar] [CrossRef]
- Nielsen, A.T. Calculation of Densities of Fuel and Explosives from Molar Volume Additive Increments, Naval Weapons Center Report: NWC TP 5452. February 1973. Available online: https://www.osti.gov/biblio/7225584 (accessed on 1 February 1973).
- Immirzi, A.; Perini, B. Prediction of Density in Organic Crystals. Acta. Cryst. A 1977, 33, 216–218. [Google Scholar] [CrossRef]
- Kitiagorodsky, A.I. Molecular Crystals and Molecules; Academic Press: New York, NY, USA, 1973; pp. 18–21. [Google Scholar]
- Ammon, H.L.; Mitchell, S. A new Atom/functional Group Volume Additivity Data Base for The Calculation of the Crystal Densities of C, H, N, O and F-containing Compounds. Propell. Explos. Pyrot. 1998, 23, 260–265. [Google Scholar] [CrossRef]
- Stine, J.R. Prediction of Crystal Densities of Organic Explosives by Group Aadditivity; Los Alamos National Laboratory’s Report: New Mexico, NM, USA, 1981. Available online: https://www.osti.gov/biblio/6254123 (accessed on 1 August 1981).
- Keshavarz, M.H. Predictions of Densities of Acyclic and Cyclic Nitramines, Nitrateesters and Nitroaliphatic Compounds for Evaluation of Their Detonation Performance. J. Hazard. Mater. 2007, 143, 437–442. [Google Scholar] [CrossRef] [PubMed]
- Naef, R.; Acree, W. Calculation of the Surface Tension of Ordinary Organic and Ionic Liquids by Means of a Generally Applicable Computer Algorithm Based on the Group-Additivity Method. Molecules 2018, 23, 1224. [Google Scholar] [CrossRef] [PubMed] [Green Version]
- Rautio, J.; Meanwell, N.A.; Li, D.; Hageman, M.J. The Expanding Role of Prodrugs in Contemporary Drug Design and Fevelopment. Nat. Rev. Drug Discov. 2018, 17, 559–587. [Google Scholar] [CrossRef] [PubMed]
- Janbazi, H.; Hasemann, O.; Schulz, C.; Kempf, A.; Wlokas, I.; Peukert, S.I. Response Surface and Group Additivity Methodology for Estimation of Thermodynamic Properties of Organosilanes. J. Chem. Kinet. 2018, 50, 681–690. [Google Scholar] [CrossRef]
- Rudolf, N.; William, A. Application of a General Computer Algorithm Based on the Group-Additivity Method for the Calculation of Two Molecular Descriptors at Both Ends of Dilution: Liquid Viscosity and Activity Coefficient in Water at Infinite Dilution. Molecules 2018, 23, 5. [Google Scholar]
- Reynolds, C.H.; Reynolds, R.C. Group Additivity in Ligand Binding Affinity: An Alternative Approach to Ligand Efficiency. J. Chem. Inf. Model. 2017, 57, 3086–3093. [Google Scholar] [CrossRef]
- Murray, J.S.; Politzer, P. Theoretical and Computational Chemistry; Politzer, P., Murray, J.S., Eds.; Elsevier Scientific: Amsterdam, The Netherlands, 1994. [Google Scholar]
- Murray, J.S.; Brinck, T.; Politzer, P. Relationships of Molecular Surface Electrostatic Potentials to Some Macroscopic Properties. Chem. Phys. 1996, 204, 289–299. [Google Scholar] [CrossRef]
- Wang, G.-X.; Xiao, H.-M.; Ju, X.-H.; Gong, X.-D. Calculation of Detonation Velocity, Pressure, and Electric Sensitivity of Nitro Arenes Based on Quantum Chemistry. Propell. Explos. Pyrot. 2006, 31, 361–368. [Google Scholar] [CrossRef]
- Xu, X.-J.; Xiao, H.-M.; Ju, X.-H.; Gong, X.-D.; Zhu, W.-H. Computational Studies on Polynitrohexaazaadmantanes as Potential High Energy Density Materials. J. Phys. Chem. A 2006, 110, 5929–5993. [Google Scholar] [CrossRef] [PubMed]
- Qiu, L.; Xiao, H.-M.; Gong, X.-D.; Ju, X.-H.; Zhu, W.-H. Crystal Density Predictions for Nitramines Based on Quantum Chemistry. J. Hazard. Mater. 2007, 141, 280–288. [Google Scholar] [CrossRef] [PubMed]
- Murray, J.S.; Brinck, T.; Lane, P.; Paulsen, K.; Politzer, P. Statistically-based Interaction Indices Derived from Molecular Surface Electrostatic Potentials: A General Interaction Properties Function (GIPF). J. Mol. Struct. Theochem. 1994, 307, 55–64. [Google Scholar] [CrossRef]
- Politzer, P.; Murray, J.S. Perspectives on the Crystal Densities and Packing Coefficients of Explosive Compounds. Struct. Chem. 2016, 7, 401–408. [Google Scholar] [CrossRef]
- Zhang, Y.-Q.; Zhang, D.-C. Hydrogen Bond in the Crystals of Substituted Ntrrobenzenes. J. Suzhou. U-Nat. Sci. 1996, 12, 55–61. [Google Scholar]
- Ma, Y.; Zhang, A.-B.; Xue, X.-G.; Jiang, D.-J.; Zhu, Y.-Q.; Zhang, C.-Y. Crystal Packing of Impact-Sensitive High-Energy Explosives. Cryst. Growth. Des. 2014, 14, 6101–6114. [Google Scholar] [CrossRef]
- Boggs, P.T.; Byrd, R.H.; Schnabel, R.B. A stable and efficient algorithm for nonlinear orthogonal distance regression. SIAM J. Sci. Stat. Comp. 1987, 8, 1052–1078. [Google Scholar] [CrossRef]
- Lu, T.; Chen, F.-W. Multiwfn: A Multifunctional Wavefunction Analyzer. J. Comput. Chem. 2012, 33, 580–592. [Google Scholar] [CrossRef]
- Lu, T.; Chen, F.-W. Quantitative Analysis of Molecular Surface Based on Improved Marching Tetrahedra Algorithm. J. Mol. Graph. Model. 2012, 38, 314–323. [Google Scholar] [CrossRef]
- Taherkhani, M.; Safabakhsh, R. A Novel Stability-Based Adaptive Inertia Weight for Particle Swarm Optimization. Appl. Soft Comput. 2016, 38, 281–295. [Google Scholar] [CrossRef]
Sample Availability: Samples of the compounds refer to the computational models and results are available from the authors. |
Figure 1.
Relationships between the two descriptors and prediction errors, (a) Δρ versus η; and, (b) Δρ versus Hb.
Figure 1.
Relationships between the two descriptors and prediction errors, (a) Δρ versus η; and, (b) Δρ versus Hb.

Figure 2.
Calculated densities ρcal versus experimental densities ρexp.

Figure 3.
Predicted densities ρcal versus experimental densities ρexp at B3PW91/6-31G(d,p), (a) fitted by Politzer et al. [21] using Equation (12), (b–d) fitted by this work using Equations (1)–(3), respectively.
Figure 3.
Predicted densities ρcal versus experimental densities ρexp at B3PW91/6-31G(d,p), (a) fitted by Politzer et al. [21] using Equation (12), (b–d) fitted by this work using Equations (1)–(3), respectively.

Figure 4.
Predicted densities ρcal versus experimental densities (ρexp) at B3LYP/6-31G**, (a) fitted by Rice et al. [20] using Equation (12), (b–d) fitted by this work using Equations (1)–(3) respectively.
Figure 4.
Predicted densities ρcal versus experimental densities (ρexp) at B3LYP/6-31G**, (a) fitted by Rice et al. [20] using Equation (12), (b–d) fitted by this work using Equations (1)–(3) respectively.

Figure 5.
Profile of the CDF of Δρ for testing set (B3PW91/6-31G(d,p)).

Figure 6.
Profile of the CDF of Δρ for testing set (B3LYP/6-31G**).

Figure 7.
Planarity parameter p for smaller molecules (a) and bigger molecules; (b) displayed as side projections and front projections. The C, H, O, and N atoms are colored in gray, white, red, and blue, respectively.
Figure 7.
Planarity parameter p for smaller molecules (a) and bigger molecules; (b) displayed as side projections and front projections. The C, H, O, and N atoms are colored in gray, white, red, and blue, respectively.


Table 1.
Working conditions for parameters fitting.
| Condition | Equation | DFT Level |
|---|---|---|
| I | (1) | B3PW91/6-31G(d,p) |
| II | (2) | B3PW91/6-31G(d,p) |
| III | (3) | B3PW91/6-31G(d,p) |
| IV | (1) | B3LYP/6-31G** |
| V | (2) | B3LYP/6-31G** |
| VI | (3) | B3LYP/6-31G** |
Table 2.
Result parameters and maximum absolute error Δρmax.
| Condition | α | β | β1 | β2 | γ | Δρmax (g/cm3) |
|---|---|---|---|---|---|---|
| I | 1 | 0.0010 | 0.1960 | - | −0.2549 | 0.15 |
| II | 1 | 0.0006 | - | 0.0036 | −0.0825 | 0.17 |
| III | 1 | 0.0005 | 0.1836 | 0.0033 | −0.2342 | 0.15 |
| IV | 1 | 0.0010 | 0.1802 | - | −0.2320 | 0.15 |
| V | 1 | 0.0006 | - | 0.0036 | −0.0721 | 0.16 |
| VI | 1 | 0.0005 | 0.1670 | 0.0033 | −0.2105 | 0.15 |
Table 3.
Maximum absolute error Δρmax for different calculation levels and fitting Equations.
| Equation | B3PW91/6-31G(d,p) | B3LYP/6-31G** |
|---|---|---|
| (12) | 0.33 | 0.21 |
| (1) | 0.16 | 0.15 |
| (2) | 0.15 | 0.15 |
| (3) | 0.15 | 0.15 |
© 2019 by the authors. Licensee MDPI, Basel, Switzerland. This article is an open access article distributed under the terms and conditions of the Creative Commons Attribution (CC BY) license (http://creativecommons.org/licenses/by/4.0/).
Share and Cite
MDPI and ACS Style
Wang, L.; Zhang, M.; Chen, J.; Su, L.; Zhao, S.; Zhang, C.; Liu, J.; Chen, C. Corrections of Molecular Morphology and Hydrogen Bond for Improved Crystal Density Prediction. Molecules 2020, 25, 161. https://doi.org/10.3390/molecules25010161
AMA Style
Wang L, Zhang M, Chen J, Su L, Zhao S, Zhang C, Liu J, Chen C. Corrections of Molecular Morphology and Hydrogen Bond for Improved Crystal Density Prediction. Molecules. 2020; 25(1):161. https://doi.org/10.3390/molecules25010161
Chicago/Turabian StyleWang, Linyuan, Miao Zhang, Jie Chen, Liang Su, Shicao Zhao, Chaoyang Zhang, Jian Liu, and Chunyan Chen. 2020. "Corrections of Molecular Morphology and Hydrogen Bond for Improved Crystal Density Prediction" Molecules 25, no. 1: 161. https://doi.org/10.3390/molecules25010161