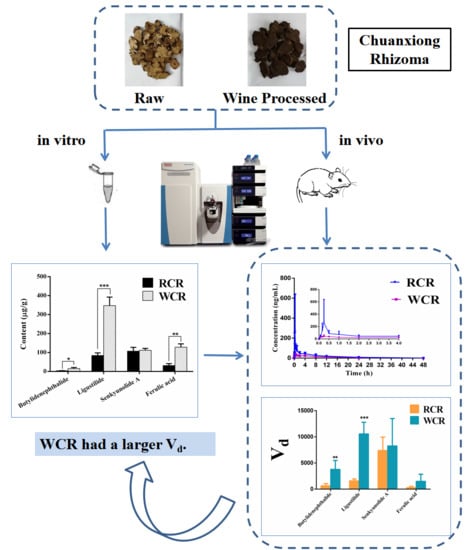
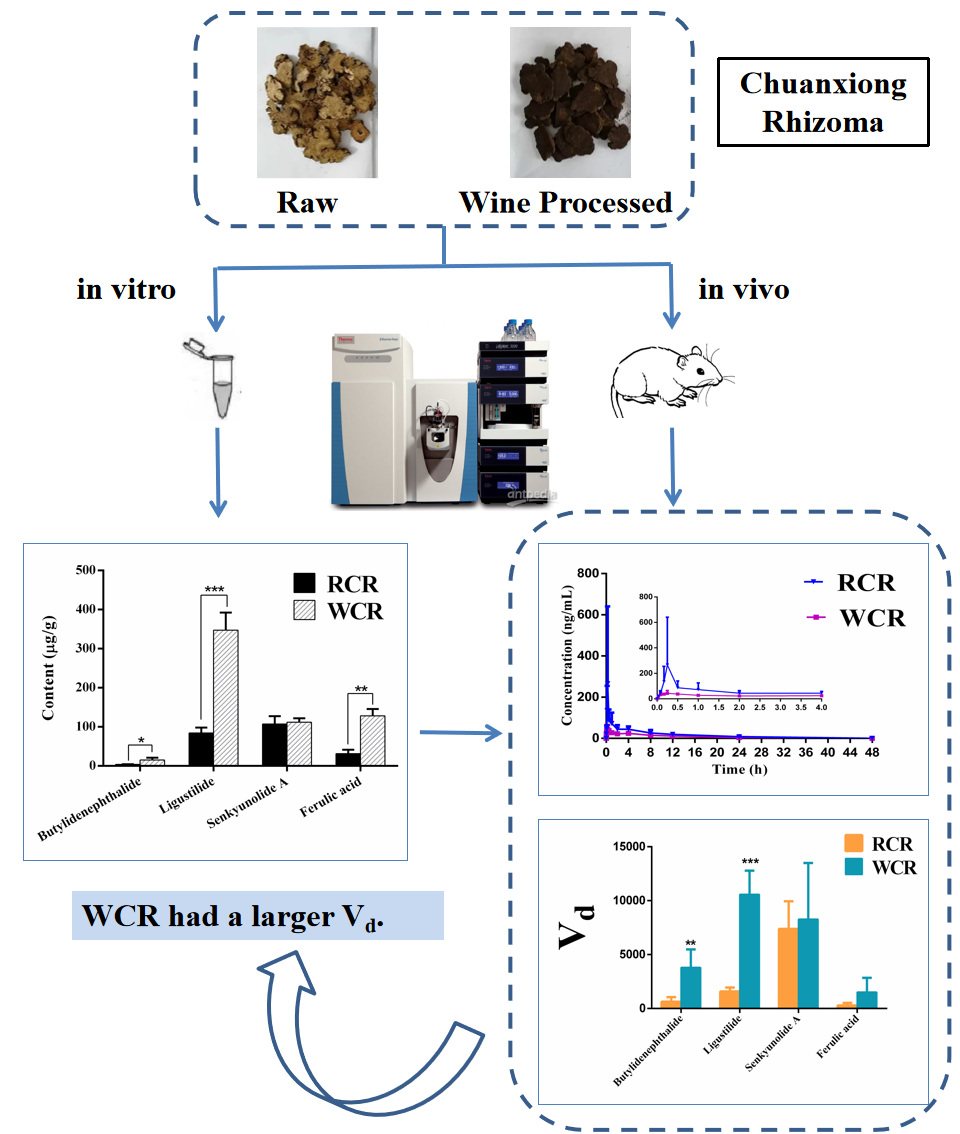
Comparative Study on Pharmacokinetics of Four Active Compounds in Rat Plasma after Oral Administration of Raw and Wine Processed Chuanxiong Rhizoma

 ,
,
Abstract
:
1. Introduction
2. Results and Discussion
2.1. Optimization of Chromatographic and Mass Spectrum Conditions
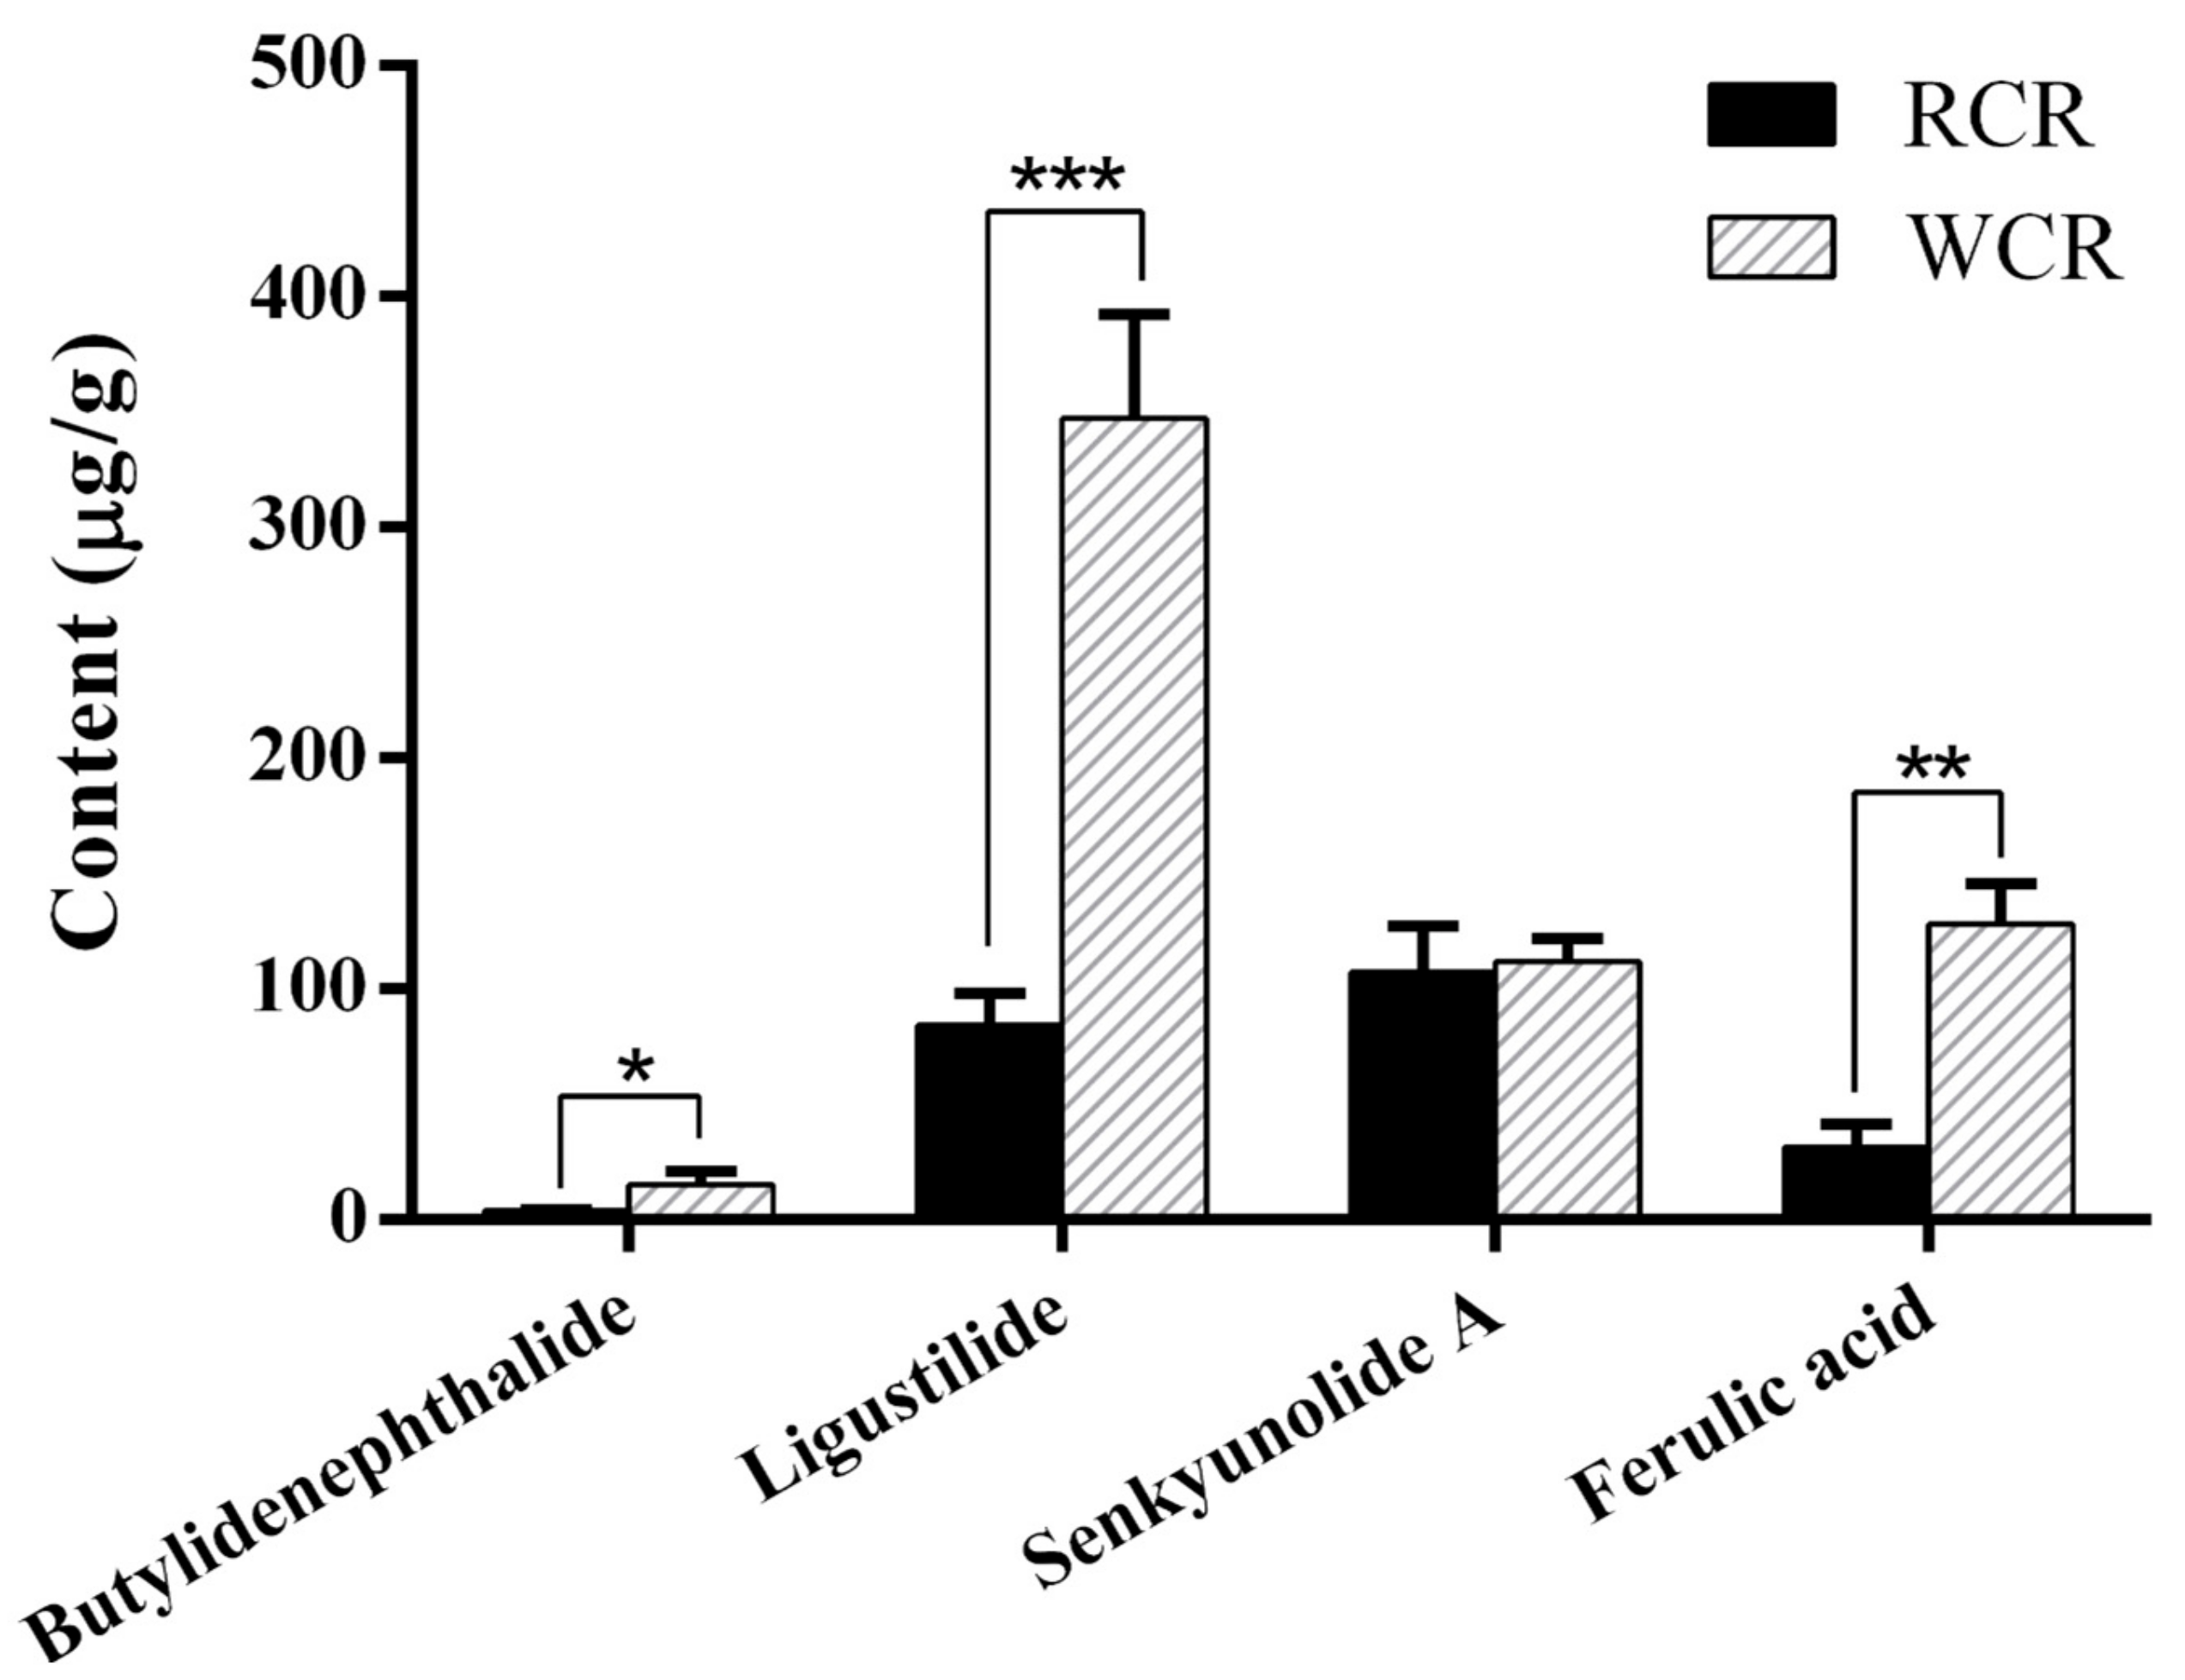
2.2. The Quantitative Analysis of Four Compounds in Oral Liquid Medicine of RCR and WCR
2.3. Sample Preparation
2.4. Method Validation
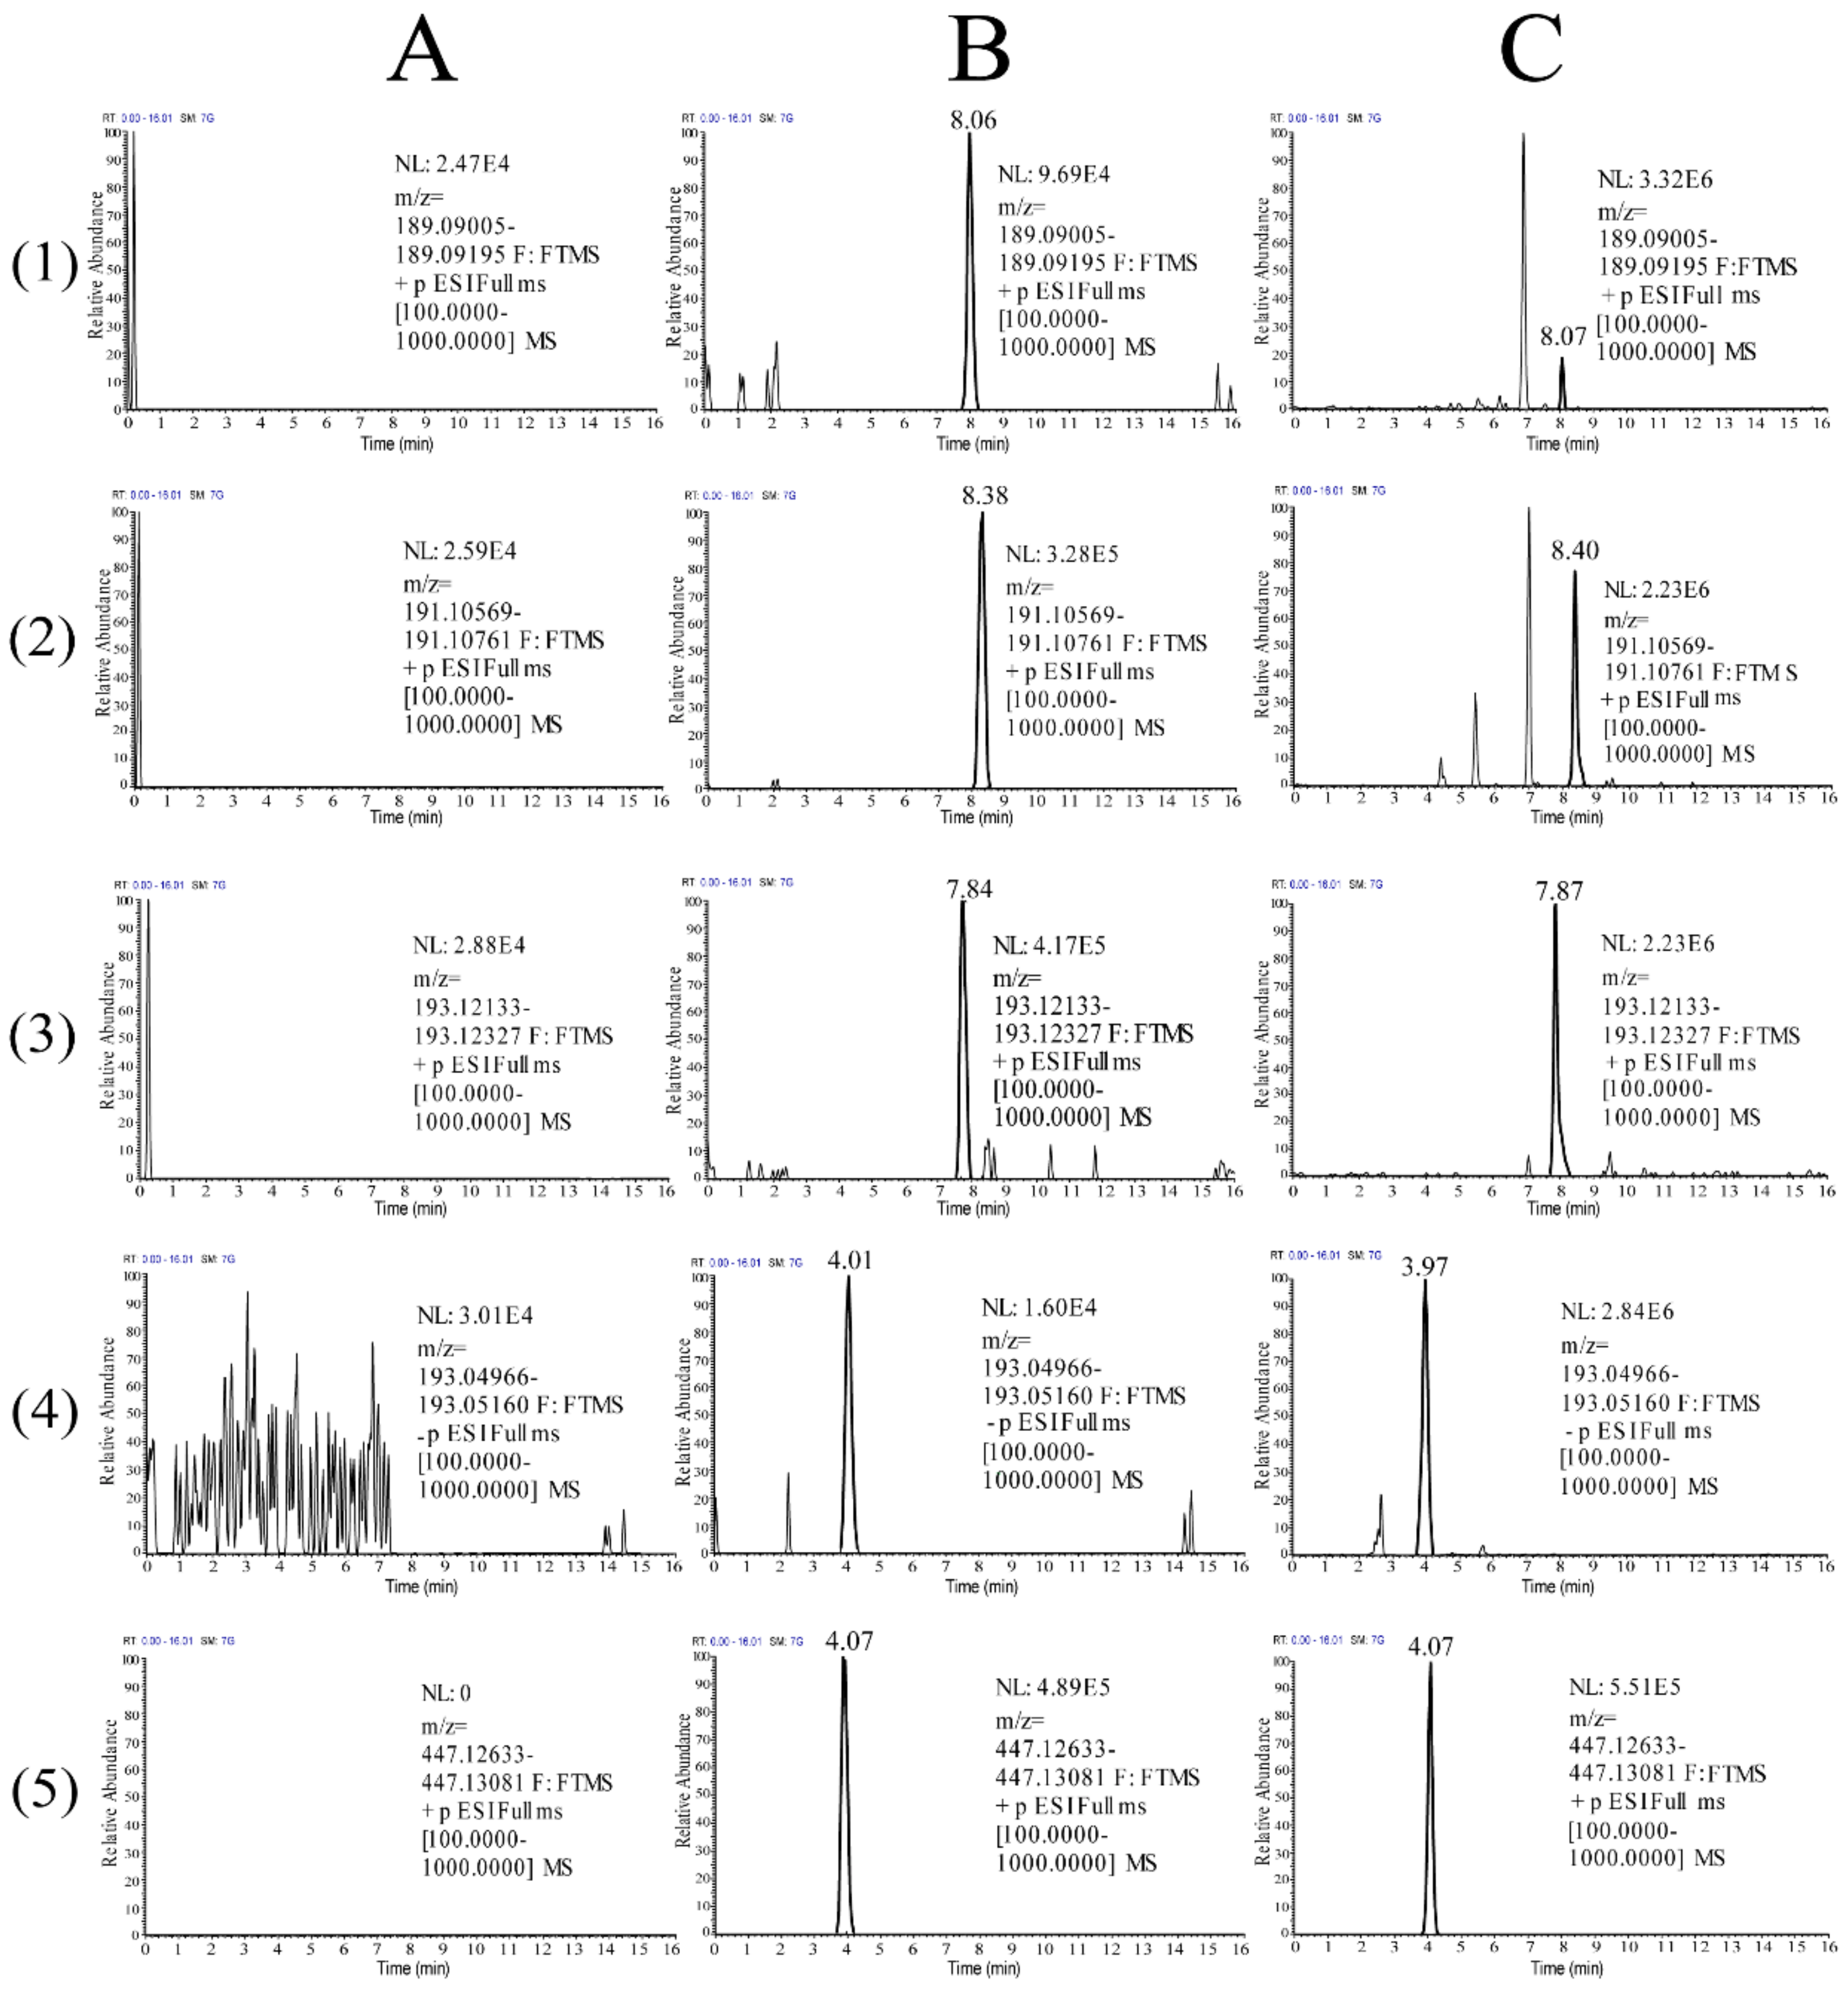
2.4.1. Specificity
2.4.2. Linearity and LLOQ
2.4.3. Precision and Accuracy
2.4.4. Extraction Recovery and Matrix Effect
2.4.5. Stability
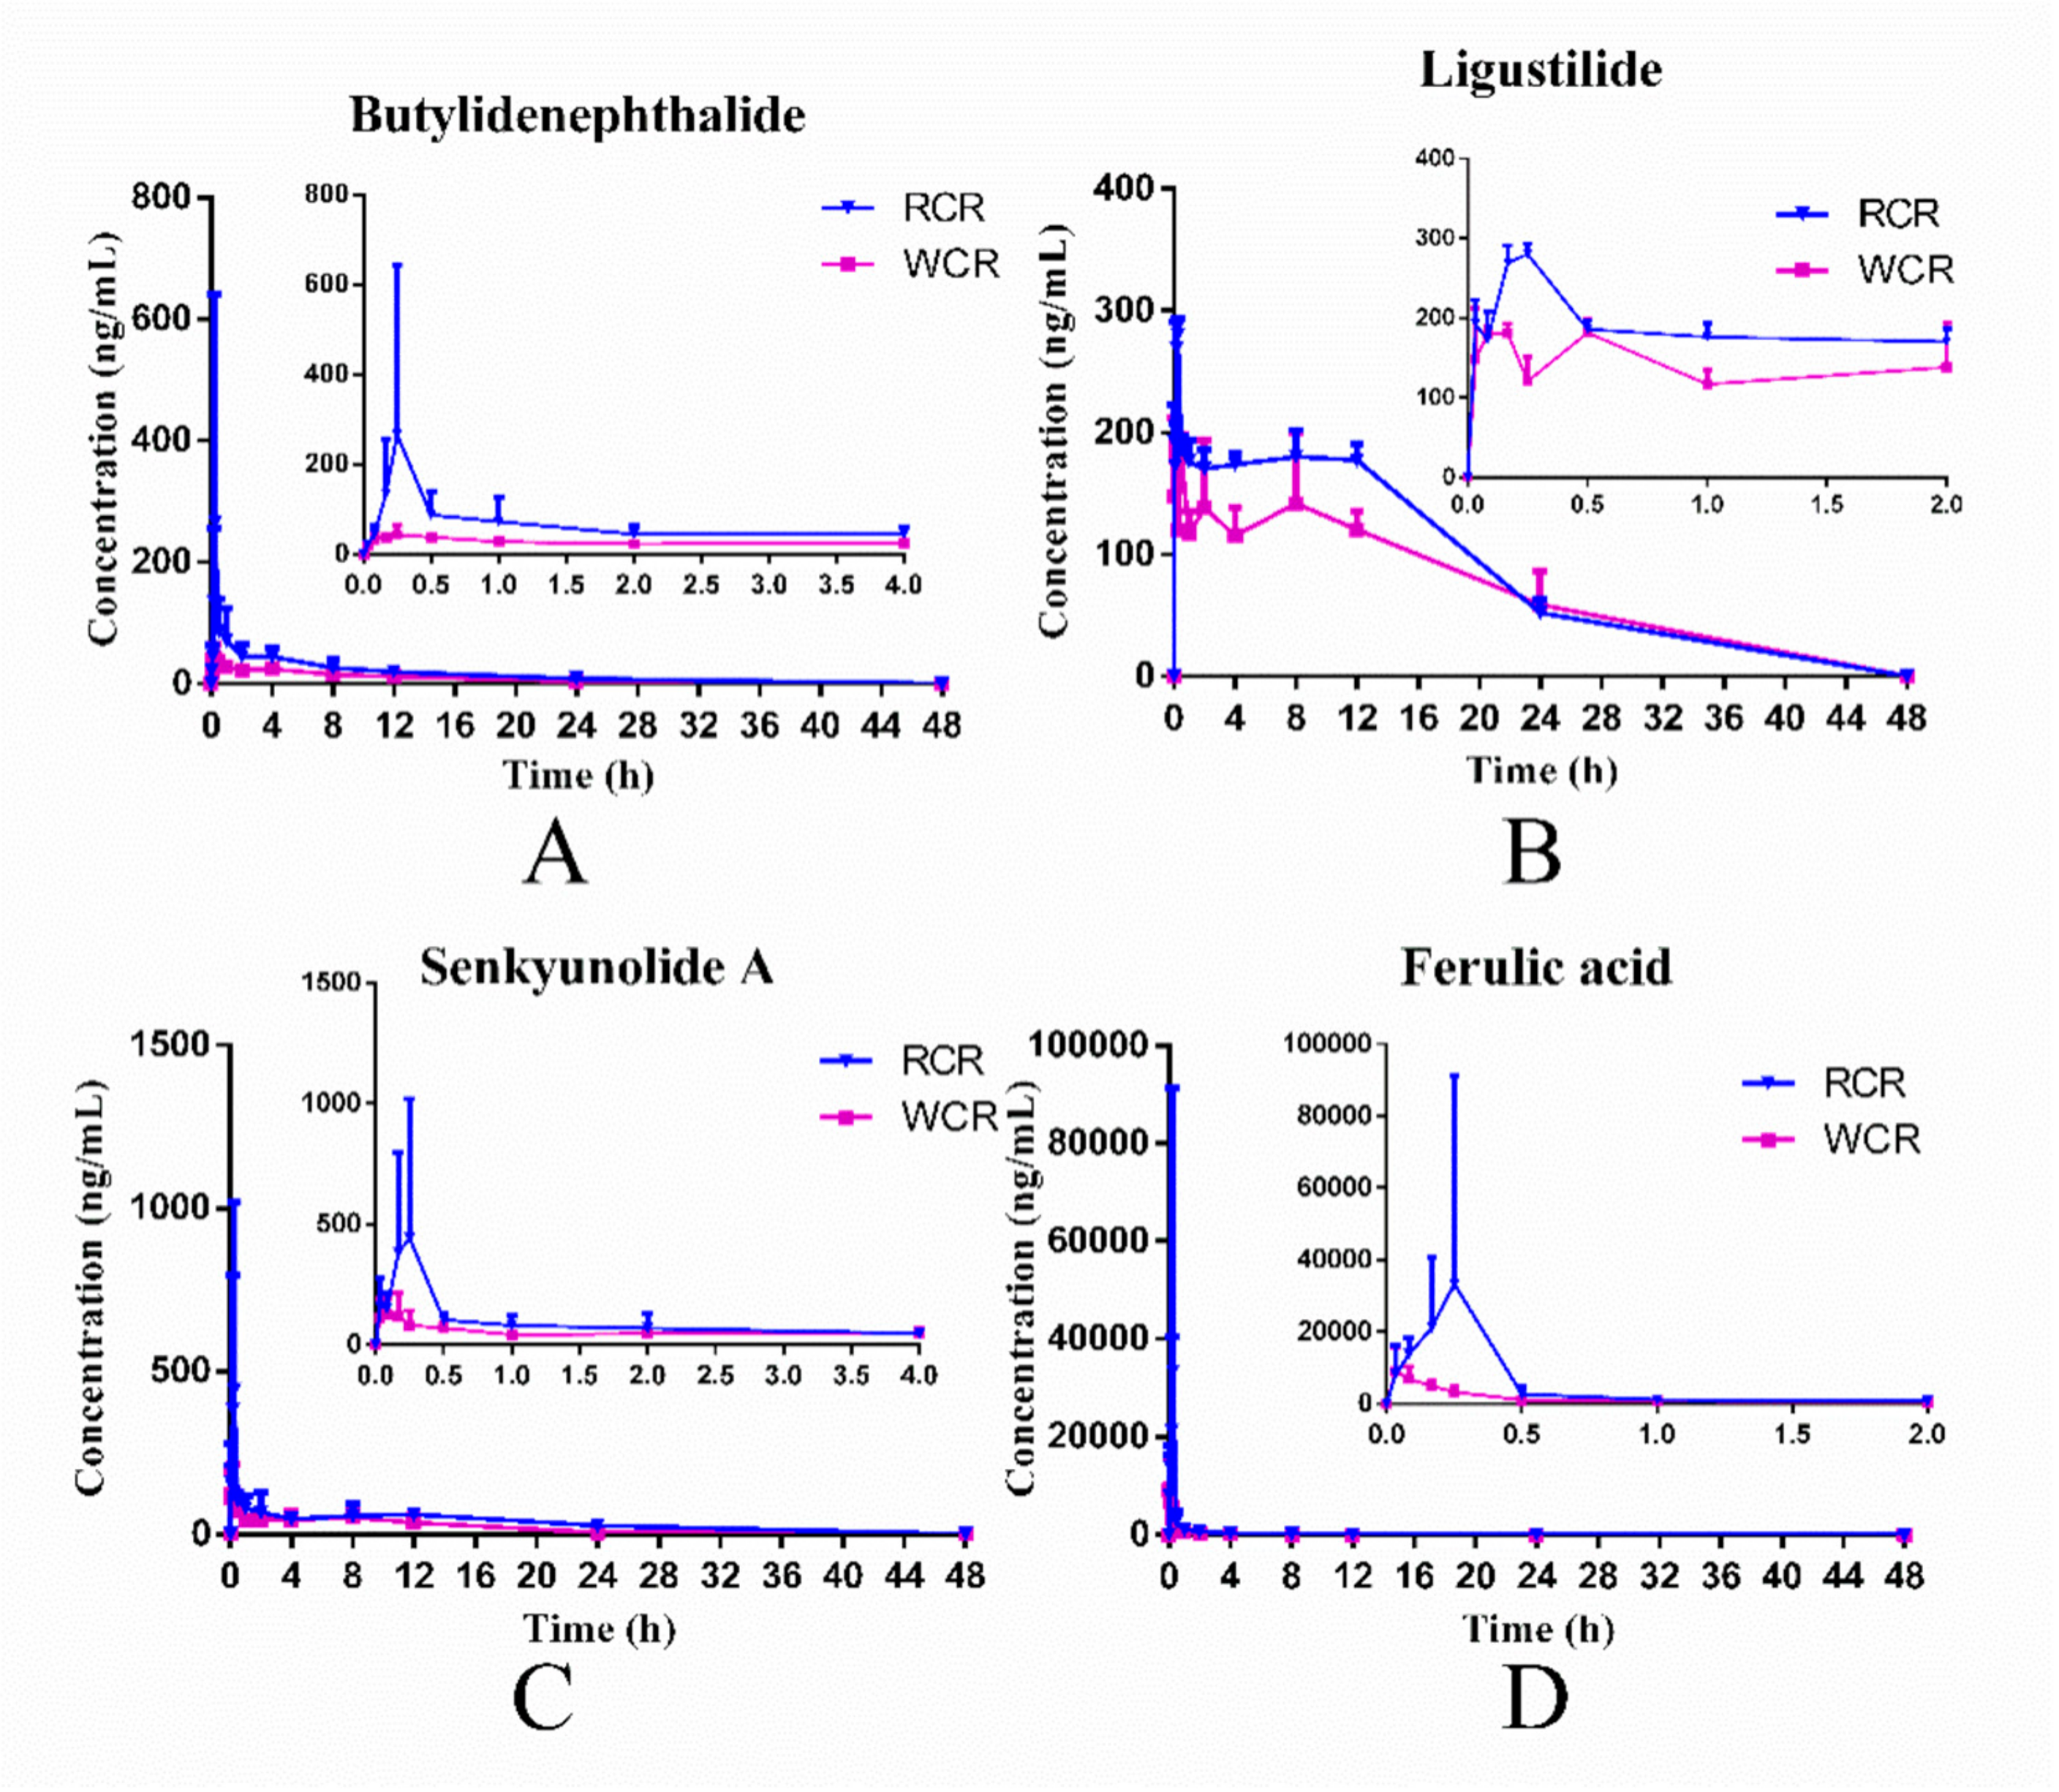
2.5. Pharmacokinetic Application and Discussion
3. Materials and Methods
3.1. Chemicals and Reagents
3.2. WCR Preparation
3.3. Oral Liquid Medicine of RCR and WCR Preparation
3.4. Animals
3.5. UHPLC-Q-Exactive-Orbitrap/MS Introduction
3.5.1. Liquid Chromatography
3.5.2. Mass Spectrometer
3.6. Preparation of Standard and Quality Control Samples
3.7. Plasma Sample Preparation
3.8. Method Validation
3.8.1. Specificity
3.8.2. Linearity and Lower Limit of Quantitation (LLOQ)
3.8.3. Precision and Accuracy
3.8.4. Extraction Recovery and Matrix Effect
3.8.5. Stability
3.9. Pharmacokinetic Study
3.10. Statistical Analysis
4. Conclusions
Author Contributions
Funding
Conflicts of Interest
References
- State Pharmacopoeia Commission. Chinese Pharmacopoeia; Chinese Medical Science Press: Beijing, China, 2015; Volume 1, p. 41. [Google Scholar]
- Dang, X.; Miao, J.J.; Chen, A.Q.; Li, P.; Chen, L.; Liang, J.R.; Xie, R.M.; Zhao, Y. The antithrombotic effect of RSNK in blood-stasis model rats. J. Ethnopharmacol. 2015, 173, 266–272. [Google Scholar] [CrossRef] [PubMed]
- Li, C.M.; Guo, Y.Q.; Dong, X.L.; Li, H.; Wang, B.; Wu, J.H.; Wong, M.S.; Chan, S.W. Ethanolic extract of rhizome of Ligusticum chuanxiong Hort. (chuanxiong) enhances endothelium-dependent vascular reactivity in ovariectomized rats fed with high-fat diet. Food Funct. 2014, 5, 2475–2485. [Google Scholar] [CrossRef]
- Xiao, Y.; Wang, Y.C.; Li, L.L.; Jin, Y.C.; Sironi, L.; Wang, Y. Lactones from Ligusticum chuanxiong Hort. reduces atherosclerotic lesions in apoE-deficient mice via inhibiting over expression of NF-kB-dependent adhesion molecules. Fitoterapia 2014, 95, 240–246. [Google Scholar] [CrossRef]
- He, Y.F.; Li, Q.; Bi, K.S. Simultaneous determination of six active components by a single standard to determine multicomponents combined with fingerprint analysis for the quality control of Rhizoma Chuanxiong. J. Sep. Sci. 2015, 38, 1090–1099. [Google Scholar] [CrossRef] [PubMed]
- Hou, Y.Z.; Zhao, G.R.; Yang, J.; Yuan, Y.J.; Zhu, G.G.; Hiltunen, R. Protective effect of Ligusticum chuanxiong and Angelica sinensis on endothelial cell damage induced by hydrogen peroxide. Life Sci. 2004, 75, 1775–1786. [Google Scholar] [CrossRef] [PubMed]
- Yuan, J.F.; Zhang, Z.Q.; Fan, Z.C.; Yang, J.X. Antioxidant effects and cytotoxicity of three purified polysaccharides from Ligusticum chuanxiong Hort. Carbohydr. Polym. 2008, 74, 822–827. [Google Scholar] [CrossRef]
- Huang, C.; Cao, X.Y.; Chen, X.F.; Fu, Y.P.; Zhu, Y.G.; Chen, Z.L.; Luo, Q.H.; Li, L.X.; Song, X.; Jia, R.Y.; et al. A pectic polysaccharide from Ligusticum chuanxiong promotes intestine antioxidant defense in aged mice. Carbohydr. Polym. 2017, 174, 915–922. [Google Scholar] [CrossRef]
- Kao, T.K.; Ou, Y.C.; Kuo, J.S.; Chen, W.Y.; Liao, S.L.; Wu, C.W.; Chen, C.J.; Jing, N.N.; Zhang, Y.H.; Peng, W.H. Neuroprotection by tetramethylpyrazine against ischemic brain injury in rats. Neurochem. Int. 2006, 48, 166–176. [Google Scholar] [CrossRef]
- Lin, Y.L.; Lin, C.Y.; Chi, C.W.; Huang, Y.T. Study on antifibrotic effects of curcumin in rat hepatic stellate cells. Phytother. Res. 2009, 23, 927–932. [Google Scholar] [CrossRef]
- Yu, J.; Dai, T.J.; Duan, S.M.; Zeng, Y.M. Effects of intrathecal administration of strychnine on propofol induced antinociception. Chin. Pharmacol. Bull. 2004, 20, 528–531. [Google Scholar]
- Or, T.C.T.; Yang, C.L.H.; Law, A.H.Y.; Li, J.C.B.; Lau, A.S.Y. Isolation and identification of anti-inflammatory constituents from Ligusticum chuanxiong and their underlying mechanisms of action on microglia. Neuropharmacology 2011, 60, 823–831. [Google Scholar] [CrossRef] [PubMed]
- Li, X.L.; Li, X.R.; Wang, L.J.; Li, Y.H.; Xu, Y.X.; Xue, M. Simultaneous determination of danshensu, ferulic acid, cryptotanshinone and tanshinone IIA in rabbit plasma by HPLC and their pharmacokinetic application in danxiongfang. J. Pharm. Biomed. Anal. 2007, 44, 1106–1112. [Google Scholar] [CrossRef] [PubMed]
- Li, H.X.; Ding, M.Y.; Yu, J.Y. Separation and identification of the phthalic anhydride derivatives of Liqusticum Chuanxiong Hort by GC-MS, TLC, HPLC-DAD, and HPLC-MS. J. Chromatogr. Sci. 2002, 40, 156–161. [Google Scholar] [CrossRef] [PubMed] [Green Version]
- Chan, S.S.K.; Choi, A.O.K.; Jones, R.L.; Lin, G. Mechanisms underlying the vasorelaxing effects of butylidenephthalide, an active constituent of Ligusticum chuanxiong, in rat isolated aorta. Eur. J. Pharmacol. 2006, 537, 111–117. [Google Scholar] [CrossRef]
- Chen, K.J.; Chen, K. Ischemic stroke treated with Ligusticum chuanxiong. Chin. Med. J. 1992, 105, 870–873. [Google Scholar]
- Chan, S.S.K.; Cheng, T.Y.; Lin, G. Relaxation effects of ligustilide and senkyunolide A, two main constituents of Ligusticum chuanxiong, in rat isolated aorta. J. Ethnopharmacol. 2007, 111, 677–680. [Google Scholar] [CrossRef]
- Wei, Y.; Hu, J.; Li, H.; Liu, J.G. Preparative isolation and purification of senkyunolide-I, senkyunolide-H and ferulic acid from Rhizoma Chuanxiong using counter-current chromatography. J. Sep. Sci. 2011, 34, 3426–3432. [Google Scholar] [CrossRef]
- Zhao, Z.Z.; Liang, Z.T.; Chan, K.; Lu, G.H.; Lee, E.L.M.; Chen, H.B.; Li, L. A unique issue in the standardization of Chinese materia medica: Processing. Planta Med. 2010, 76, 1975–1986. [Google Scholar] [CrossRef]
- Wu, H.W.; Waldbauer, K.; Tang, L.Y.; Xie, L.W.; McKinnon, R.; Zehl, M.; Yang, H.J.; Xu, H.Y.; Kopp, B. Influence of vinegar and wine processing on the alkaloid content and composition of the traditional Chinese medicine Corydalis Rhizoma (Yanhusuo). Molecules 2014, 19, 11487–11504. [Google Scholar] [CrossRef] [Green Version]
- Li, S.L.; Yan, R.; Tam, Y.K.; Lin, G. Post-Harvest Alteration of the Main Chemical Ingredients in Ligusticum chuanxiong HORT. (Rhizoma Chuanxiong). Chem. Pharm. Bull. 2007, 55, 140–144. [Google Scholar] [CrossRef] [Green Version]
- Xie, Z.D.; Yi, D.Y.; Fang, Y.Q.; Guo, J.S. Studies on Traditional Pharmaceutical Processing for Chuanxiong Rhizoma in Medical History and Modern Research. Chin. J. Exp. Tradit. Med. Formulae 2012, 18, 290–293. [Google Scholar]
- Wang, X.J. Progress and future developing of the serum pharmacochemistry of traditional Chinese medicine. China J. Chin. Mater. Med. 2006, 31, 789–792. [Google Scholar] [PubMed]
- Pei, K.; Cai, H.; Liu, X.; Tu, S.C.; Cao, G.; Li, H.; Zhao, Y.Y.; Song, X.Q.; Lou, Y.J.; Qiao, F.X.; et al. Evaluation of the influence of sulfur fumigation on the pharmacokinetics of four active ingredients in Si Wu Tang. J. Sep. Sci. 2015, 38, 25–33. [Google Scholar] [CrossRef] [PubMed]
- Wang, M.; Wang, D.; Gao, C.J.; Li, X.Z.; Sha, L.P.; Zhao, Q.; Gao, H.Y.; Wu, Z.H. Pharmacokinetic and tissue distribution studies of cassane diterpenoids, in rats through an ultra-high-performance liquid chromatography–Q exactive hybrid quadrupole–Orbitrap high-resolution accurate mass spectrometry. Biomed. Chromatogr. 2019, 33, e4610. [Google Scholar] [CrossRef]
- Qiu, X.J.; Zhao, J.L.; Wang, Z.; Xu, Z.S.; Xu, R.A. Simultaneous determination of bosentan and glimepiride in human plasma by ultra performance liquid chromatography tandem mass spectrometry and its application to a pharmacokinetic study. J. Pharm. Biomed. Anal. 2014, 95, 207–212. [Google Scholar] [CrossRef]
- Qiu, X.J.; Wang, Z.; Wang, B.; Zhan, H.; Pan, X.F.; Xu, R.A. Simultaneous determination of irbesartan and hydrochlorothiazide in human plasma by ultra high performance liquid chromatography tandem mass spectrometry and its application to a bioequivalence study. J. Chromatogr. B 2014, 957, 110–115. [Google Scholar] [CrossRef]
- Ma, W.; Wang, W.H.; Peng, Y.; Bian, Q.X.; Wang, N.N.; Lee, D.; Dai, R.H. Ultra-high performance liquid chromatography with tandem mass spectrometry method for the simultaneous quantitation of five phthalides in rat plasma: Application to a comparative pharmacokinetic study of Huo Luo Xiao Ling Dan and herb-pair extract. J. Sep. Sci. 2016, 39, 2057–2067. [Google Scholar] [CrossRef]
- Guan, J.; Wang, L.M.; Jin, J.; Chang, S.; Xiao, X.; Feng, B.; Zhu, H.Y. Simultaneous determination of calycosin-7-O-β-D-glucoside, cinnamic acid, paeoniflorin and albiflorin in rat plasma by UHPLC-MS/MS and its application to a pharmacokinetic study of Huangqi Guizhi Wuwu Decoction. J. Pharm. Biomed. Anal. 2019, 170, 1–7. [Google Scholar] [CrossRef]
Sample Availability: Samples of the compounds are available from the authors. |


| Analyte | TR | Molecular Formula | Ion Mode | Theoretical Mass (m/z) | Measured Mass (m/z) | Mass Error (ppm) |
|---|---|---|---|---|---|---|
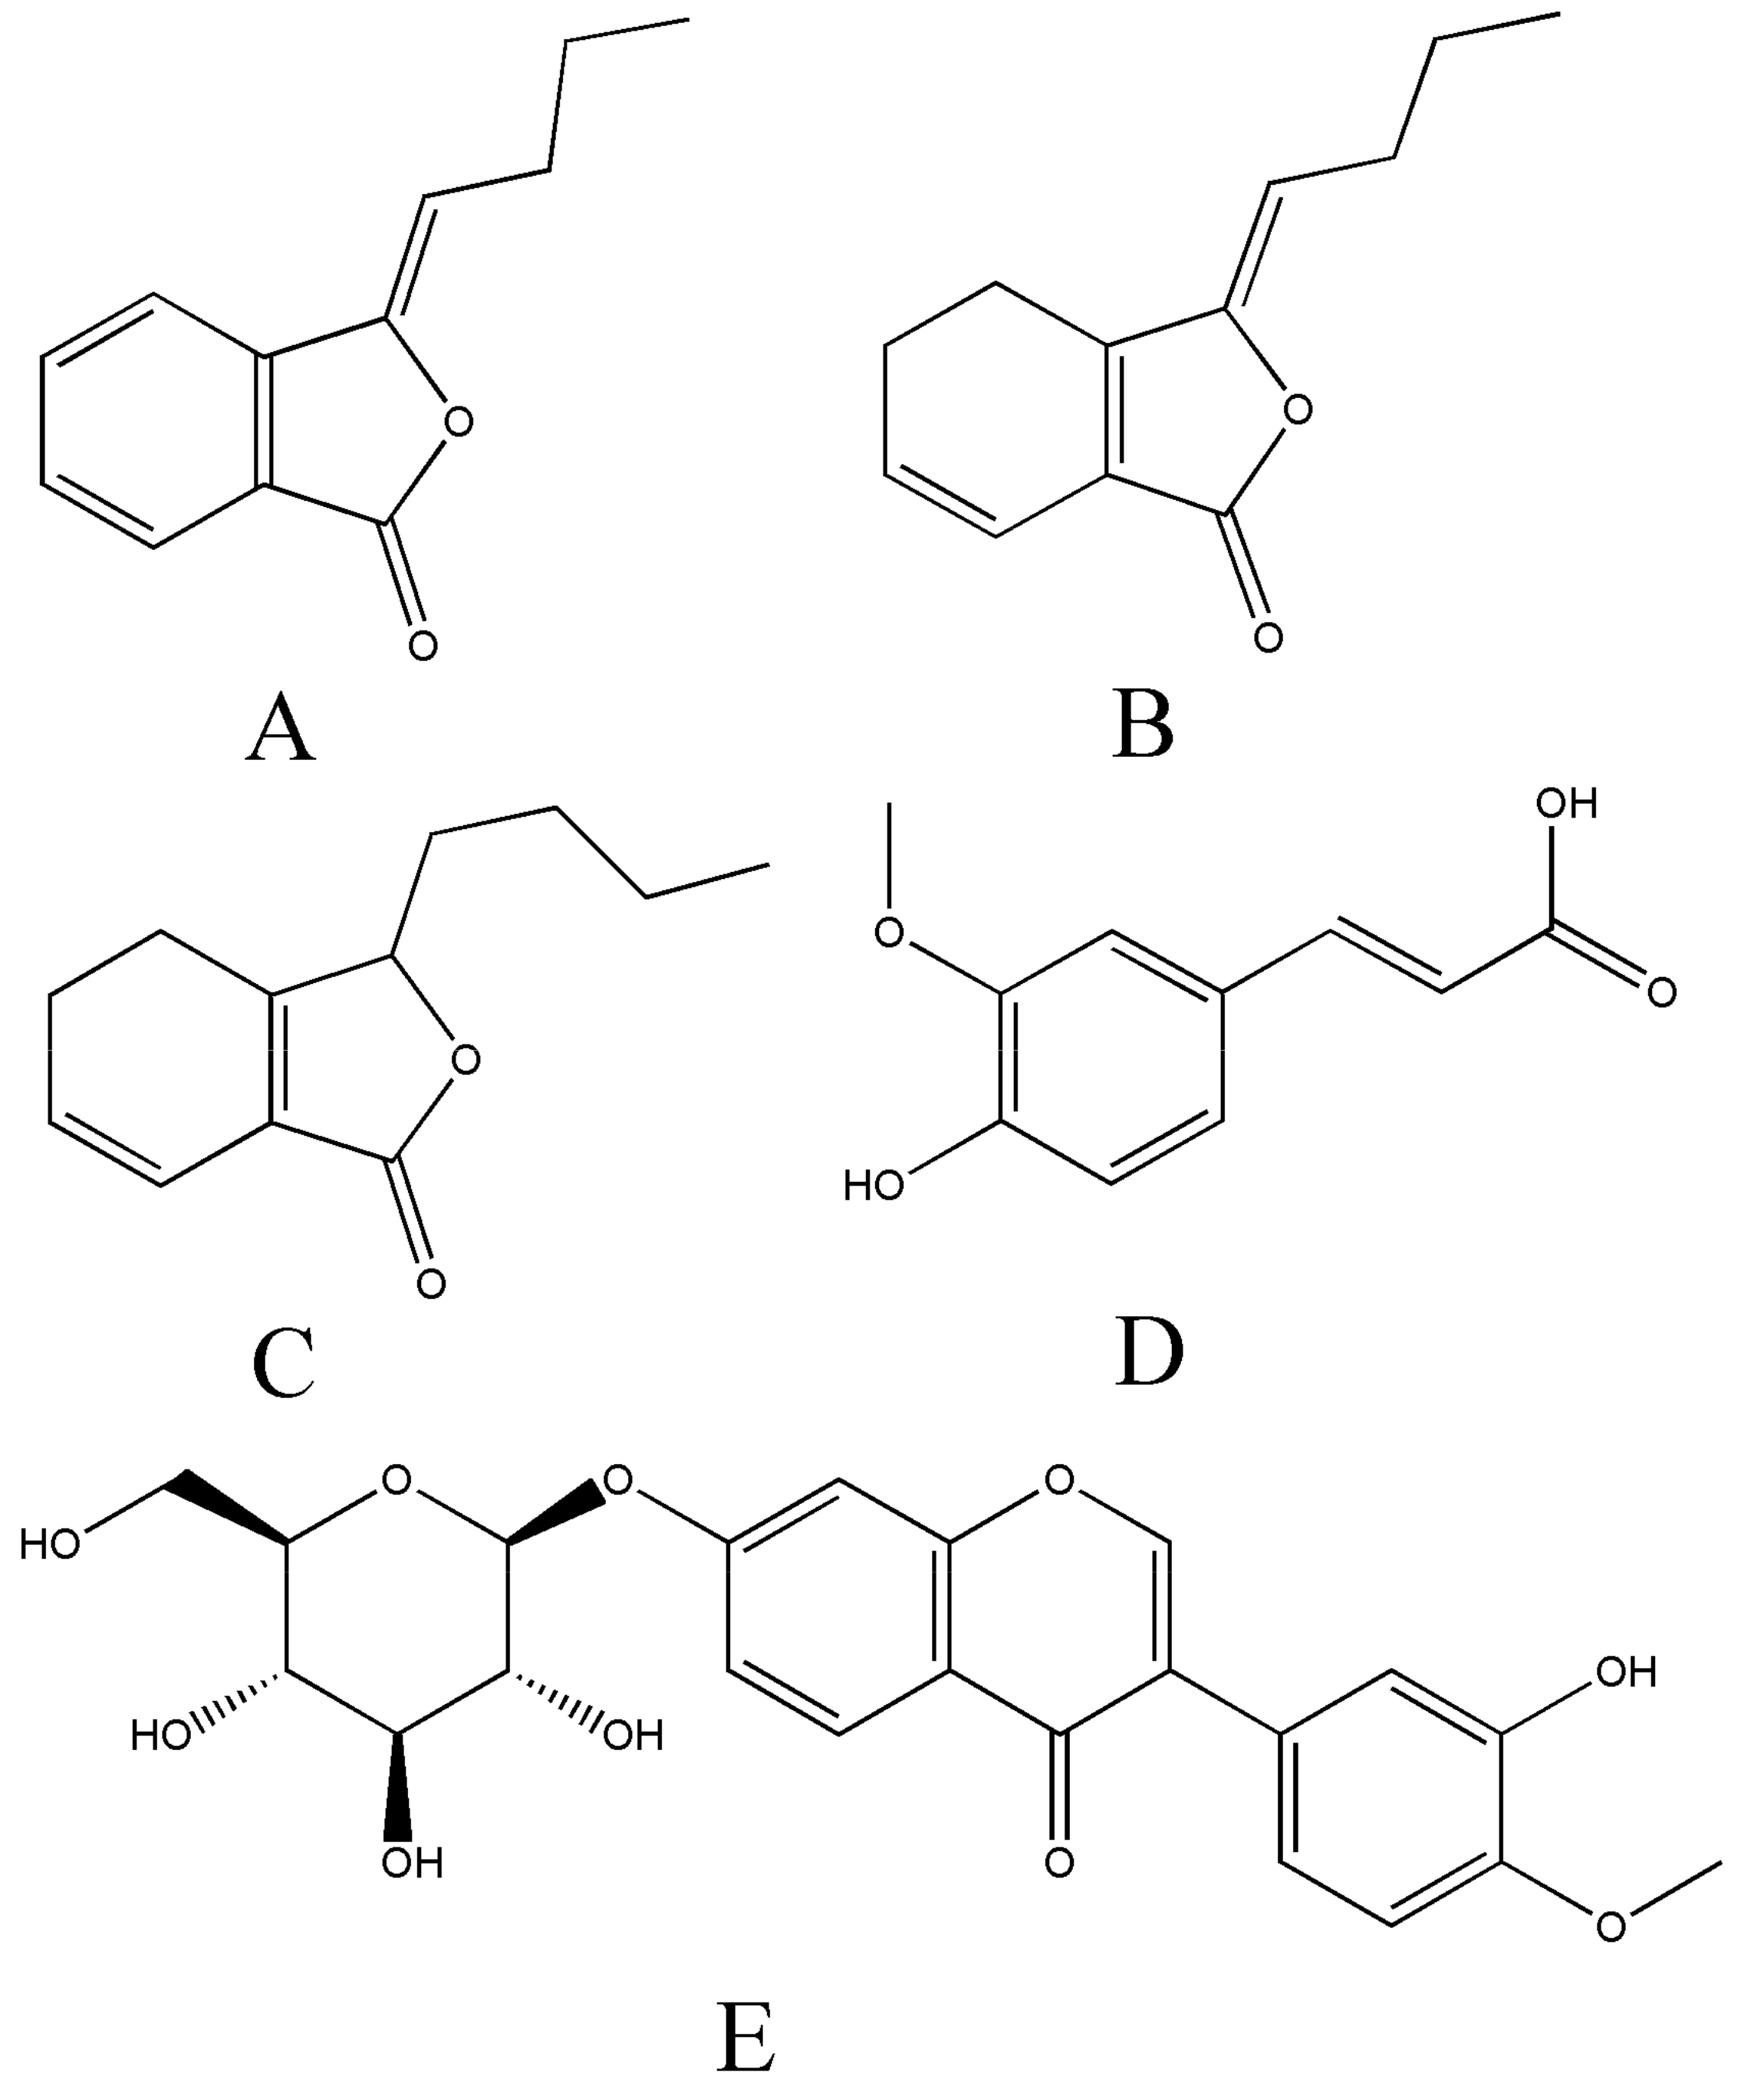
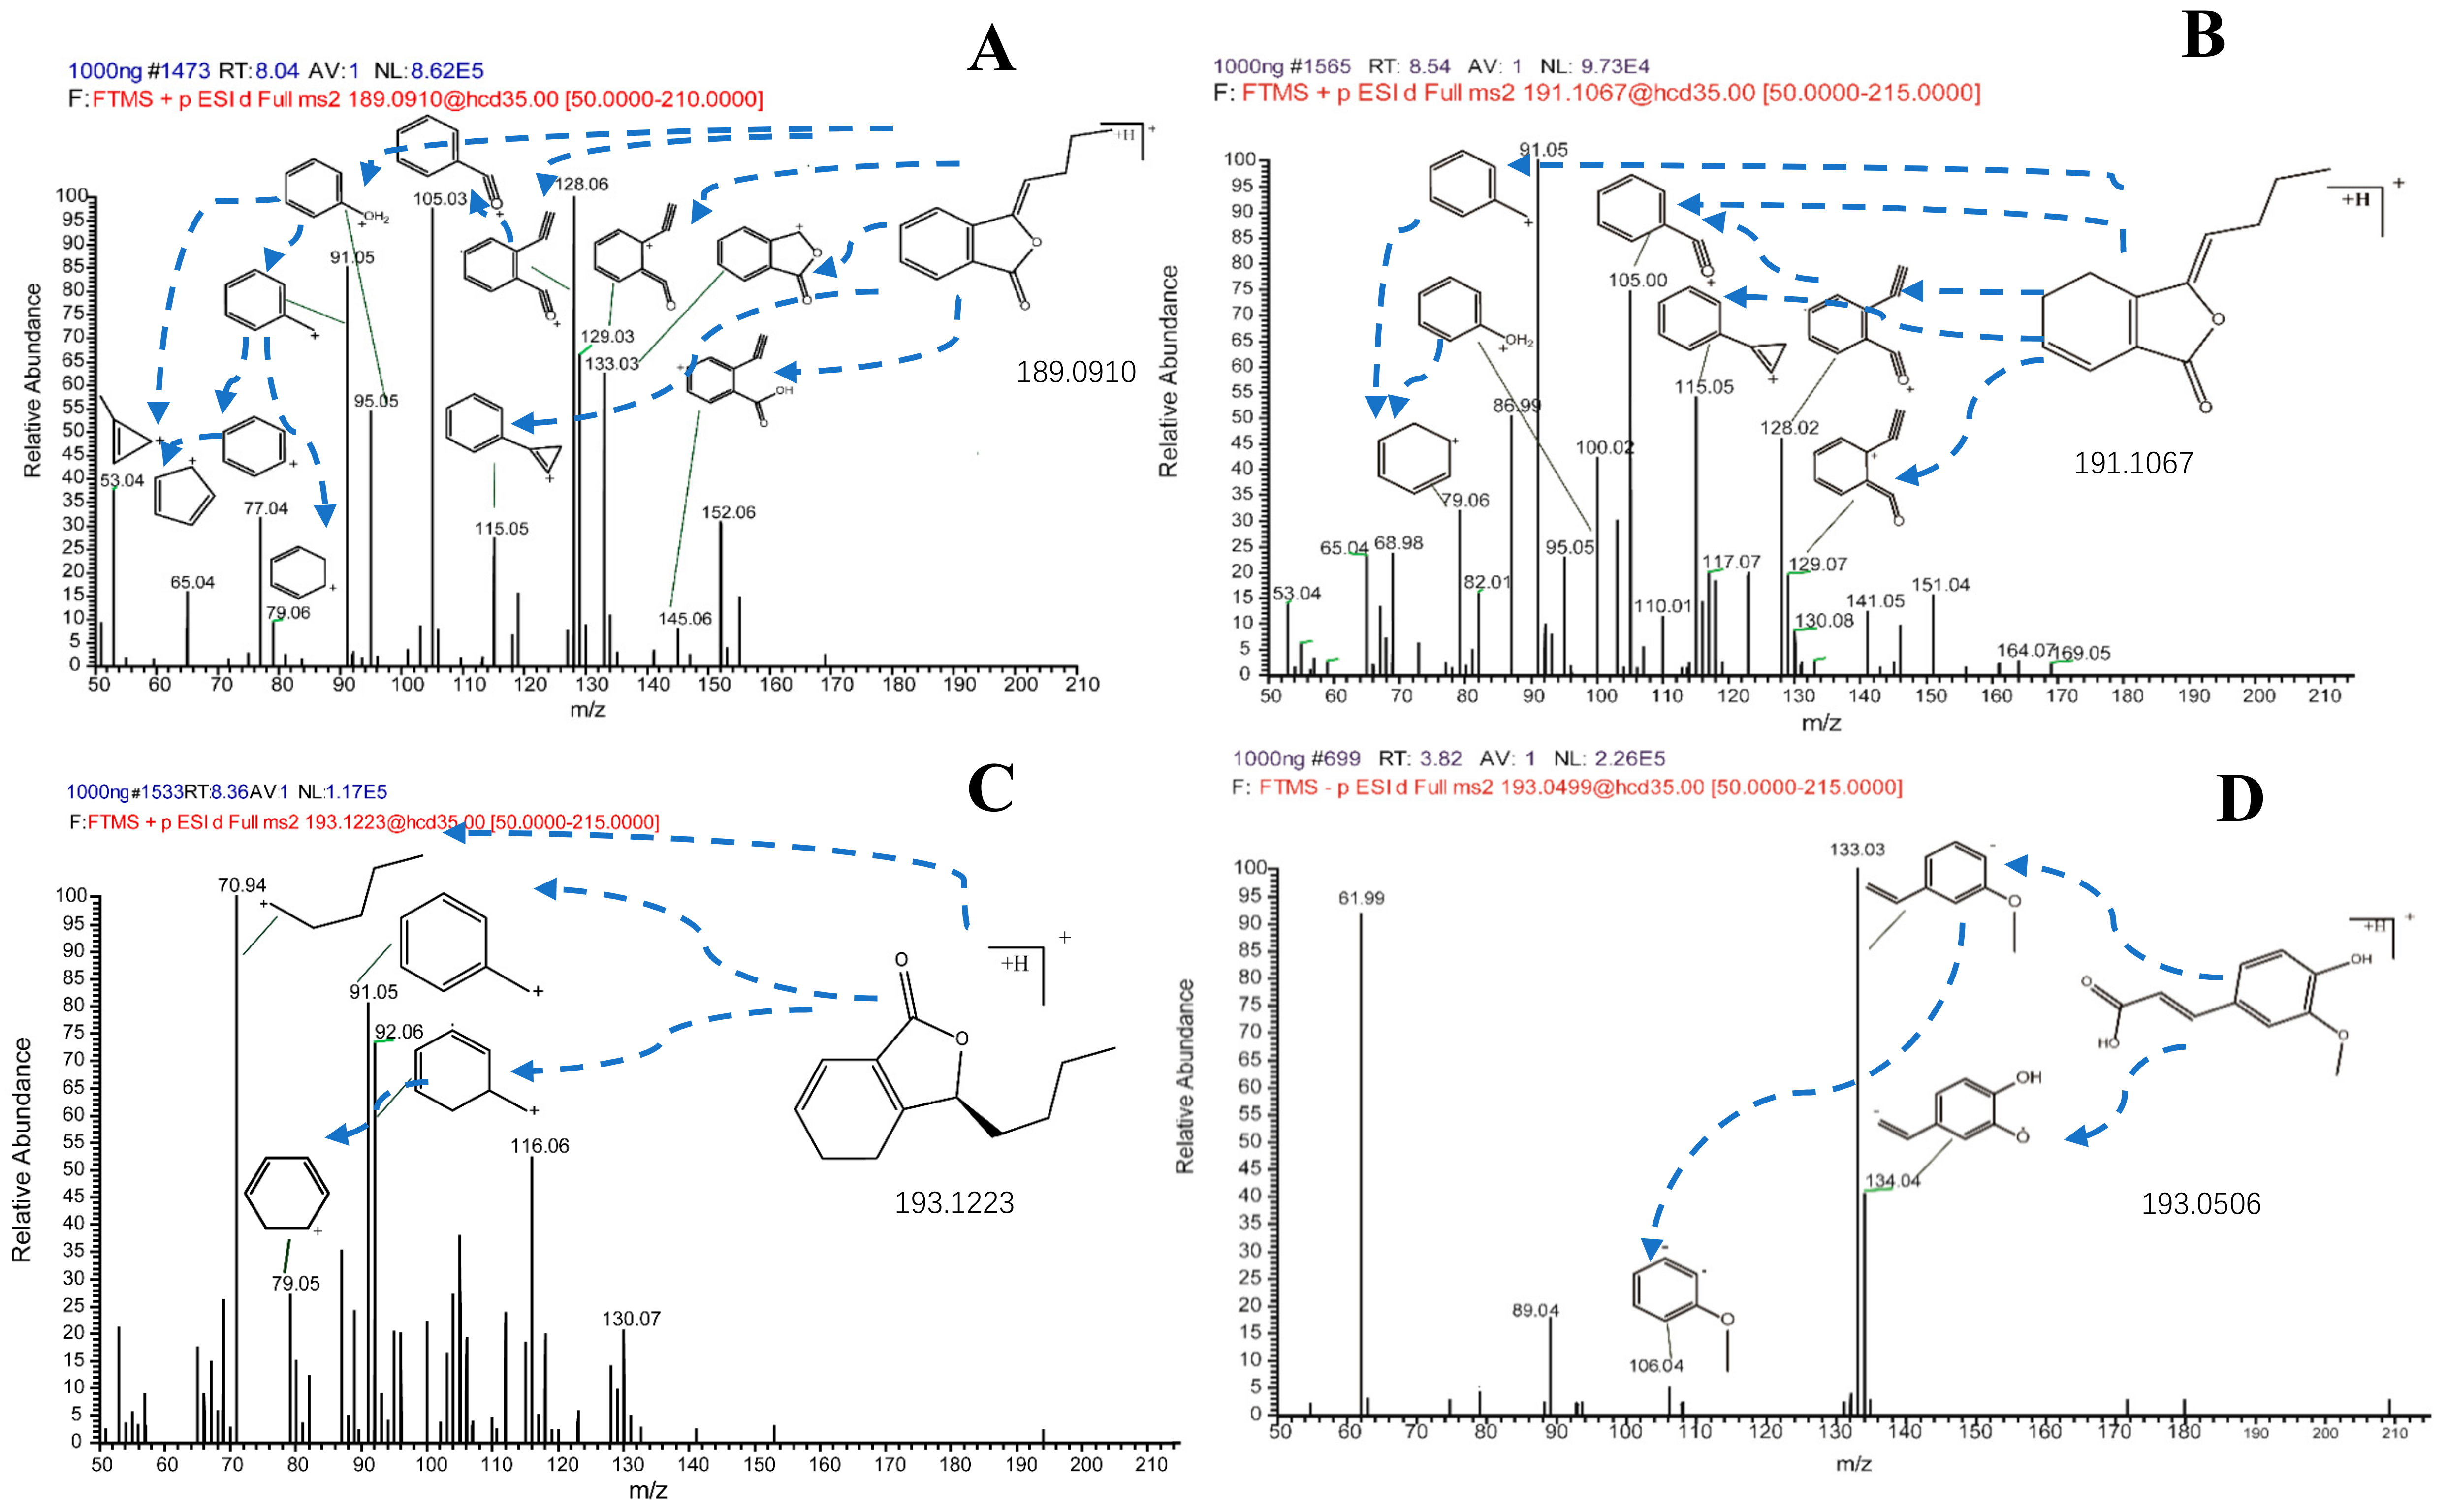
| Butylidenephthalide | 8.05 | C12H12O2 | [M + H]+ | 189.09100 | 189.09105 | 0.26 |
| Ligustilide | 8.38 | C12H14O2 | [M + H]+ | 191.10665 | 191.10664 | 0.05 |
| Senkyunolide A | 7.86 | C12H16O2 | [M + H]+ | 193.12230 | 193.12244 | 0.72 |
| Ferulic acid | 3.99 | C10H10O4 | [M − H]− | 193.05063 | 193.04997 | 3.41 |
| Calycosin-7-O-β-d-glucoside (IS) | 4.05 | C22H22O10 | [M + H]+ | 447.12857 | 447.12817 | 0.89 |
| Component | Added (ng/mL) | Precision (RSD%) | Accuracy (RE%) | Extraction Recovery | Matrix Effect | |||
|---|---|---|---|---|---|---|---|---|
| Intraday | Interday | Mean (%) | RSD (%) | Mean (%) | RSD (%) | |||
| Butylidene-phthalide | 7.08 | 8.49 | 10.97 | 4.77 | 106.38 | 2.22 | 93.82 | 9.06 |
| 141.50 | 11.05 | 12.71 | 11.70 | 103.41 | 9.33 | 100.88 | 6.38 | |
| 1132.00 | 12.88 | 10.07 | 4.83 | 105.70 | 3.57 | 95.63 | 4.68 | |
| Ligustilide | 5.22 | 6.94 | 11.39 | 1.87 | 92.61 | 3.68 | 98.13 | 5.00 |
| 104.40 | 11.04 | 10.25 | 7.85 | 94.71 | 3.05 | 100.01 | 3.39 | |
| 835.20 | 9.49 | 11.44 | −2.75 | 97.58 | 2.80 | 93.07 | 2.43 | |
| Senkyuno-lide A | 6.55 | 5.17 | 7.40 | 6.54 | 101.54 | 2.76 | 92.29 | 3.38 |
| 131.00 | 11.16 | 10.92 | 8.05 | 110.78 | 6.32 | 92.00 | 2.41 | |
| 1048.00 | 10.84 | 9.67 | 0.82 | 98.14 | 2.43 | 98.47 | 1.28 | |
| Ferulic acid | 6.68 | 5.70 | 8.06 | −8.14 | 109.05 | 12.39 | 105.63 | 1.34 |
| 667.50 | 8.55 | 6.43 | 9.00 | 101.69 | 6.69 | 95.48 | 2.57 | |
| 10680.00 | 6.18 | 9.36 | 1.26 | 107.63 | 5.81 | 91.23 | 3.42 | |
| Component | Added (ng/mL) | Bench-Top Stability | Freeze-Thaw Stability | Post-Preparative Stability | Long-Term Stability | ||||
|---|---|---|---|---|---|---|---|---|---|
| RSD (%) | RE (%) | RSD (%) | RE (%) | RSD (%) | RE (%) | RSD (%) | RE (%) | ||
| Butylidene-phthalide | 7.08 | 3.84 | 1.88 | 3.36 | −10.99 | 5.39 | 6.90 | 8.82 | 4.03 |
| 141.50 | 5.23 | 11.97 | 3.55 | 6.03 | 9.24 | 2.22 | 6.50 | −11.51 | |
| 1132.00 | 4.12 | 5.99 | 2.68 | 9.56 | 2.33 | −5.45 | 8.93 | 6.65 | |
| Ligustilide | 5.22 | 10.87 | −4.49 | 7.63 | 2.45 | 4.22 | 6.32 | 6.56 | −5.89 |
| 104.40 | 11.70 | 5.17 | 9.25 | 1.98 | 9.25 | 4.70 | 7.24 | 11.82 | |
| 835.20 | 6.31 | 2.20 | 11.22 | −3.59 | 2.85 | −3.00 | 11.07 | 8.02 | |
| Senkyuno-lide A | 6.55 | 9.48 | 5.21 | 3.35 | 7.70 | 10.64 | −9.98 | 4.07 | 4.23 |
| 131.00 | 4.01 | 9.44 | 7.38 | 11.86 | 3.58 | −8.14 | 7.46 | 6.84 | |
| 1048.00 | 4.78 | 8.16 | 4.01 | 1.25 | 1.03 | 2.41 | 8.68 | −5.75 | |
| Ferulic acid | 6.68 | 2.21 | 7.26 | 6.30 | −3.62 | 1.74 | −6.55 | 1.74 | −9.60 |
| 667.50 | 2.87 | 10.16 | 5.32 | 6.02 | 6.79 | −2.49 | 9.84 | 5.22 | |
| 10680.00 | 7.00 | 3.89 | 2.77 | −2.01 | 0.57 | 7.42 | 6.75 | 3.92 | |
| Parameter | Butylidenephthalide | Ligustilide | Senkyunolide A | Ferulic Acid | ||||
|---|---|---|---|---|---|---|---|---|
| RCR | WCR | RCR | WCR | RCR | WCR | RCR | WCR | |
| AUC0→t (h ng/mL) | 743.30 ± 279.26 | 384.39 ± 90.92 * | 4082.55 ± 201.34 | 3309.08 ± 578.87 * | 1641.80 ± 438.09 | 803.64 ± 279.05 ** | 13,057.50 ± 12,329.37 | 4455.25 ± 1235.73 |
| AUC0→∞ (h*ng/mL) | 781.82 ± 251.72 | 401.58 ± 77.07 * | 4112.55 ± 284.83 | 4043.32 ± 1481.63 | 1842.76 ± 500.73 | 860.81 ± 266.71 ** | 13,366.56 ± 12,420.74 | 4622.02 ± 1287.10 |
| Cl (mL/h) | 36.61 ± 16.33 | 234.35 ± 44.10 *** | 128.76 ± 19.21 | 568.93 ± 184.86 ** | 392.87 ± 142.41 | 859.38 ± 319.21 * | 24.08 ± 14.39 | 178.84 ± 54.46 ** |
| Cmax (ng/mL) | 288.43 ± 369.89 | 52.14 ± 16.63 | 289.42 ± 8.10 | 192.21 ± 8.48 *** | 653.35 ± 580.97 | 151.03 ± 84.32 | 47,747.78 ± 51,447.40 | 9527.87 ± 6496.42 |
| t1/2 (h) | 11.41 ± 5.88 | 11.01 ± 3.75 | 8.50 ± 1.41 | 14.61 ± 7.56 | 13.44 ± 3.56 | 6.32 ± 1.72 ** | 8.57 ± 4.42 | 5.33 ± 2.97 |
| MRT (h) | 14.11 ± 6.54 | 13.94 ± 3.63 | 13.46 ± 1.74 | 21.94 ± 11.17 | 18.84 ± 4.24 | 9.86 ± 1.53 ** | 3.21 ± 1.66 | 4.05 ± 1.07 |
| Tmax (h) | 0.25 ± 0.14 | 0.27 ± 0.14 | 0.22 ± 0.05 | 0.30 ± 0.18 | 0.11 ± 0.09 | 0.18 ± 0.07 | 0.12 ± 0.09 | 0.06 ± 0.03 |
| Vd (mL) | 633.78 ± 424.90 | 3802.37 ± 1676.69 ** | 1579.29 ± 363.96 | 10,580.62 ± 2206.75 *** | 7378.16 ± 2565.01 | 8275.68 ± 5216.70 | 283.95 ± 234.10 | 1519.30 ± 1321.97 |
© 2019 by the authors. Licensee MDPI, Basel, Switzerland. This article is an open access article distributed under the terms and conditions of the Creative Commons Attribution (CC BY) license (http://creativecommons.org/licenses/by/4.0/).
Share and Cite
Ning, Y.; Pei, K.; Cao, G.; Cai, H.; Liu, X.; Cao, L.; Zhang, S.; Cai, B. Comparative Study on Pharmacokinetics of Four Active Compounds in Rat Plasma after Oral Administration of Raw and Wine Processed Chuanxiong Rhizoma. Molecules 2020, 25, 93. https://doi.org/10.3390/molecules25010093
Ning Y, Pei K, Cao G, Cai H, Liu X, Cao L, Zhang S, Cai B. Comparative Study on Pharmacokinetics of Four Active Compounds in Rat Plasma after Oral Administration of Raw and Wine Processed Chuanxiong Rhizoma. Molecules. 2020; 25(1):93. https://doi.org/10.3390/molecules25010093
Chicago/Turabian StyleNing, Yan, Ke Pei, Gang Cao, Hao Cai, Xiao Liu, Lilong Cao, Shuosheng Zhang, and Baochang Cai. 2020. "Comparative Study on Pharmacokinetics of Four Active Compounds in Rat Plasma after Oral Administration of Raw and Wine Processed Chuanxiong Rhizoma" Molecules 25, no. 1: 93. https://doi.org/10.3390/molecules25010093