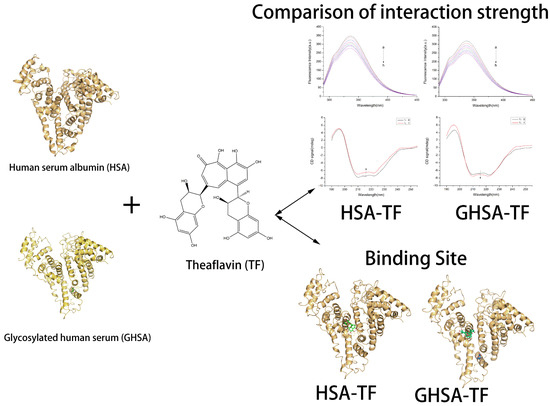
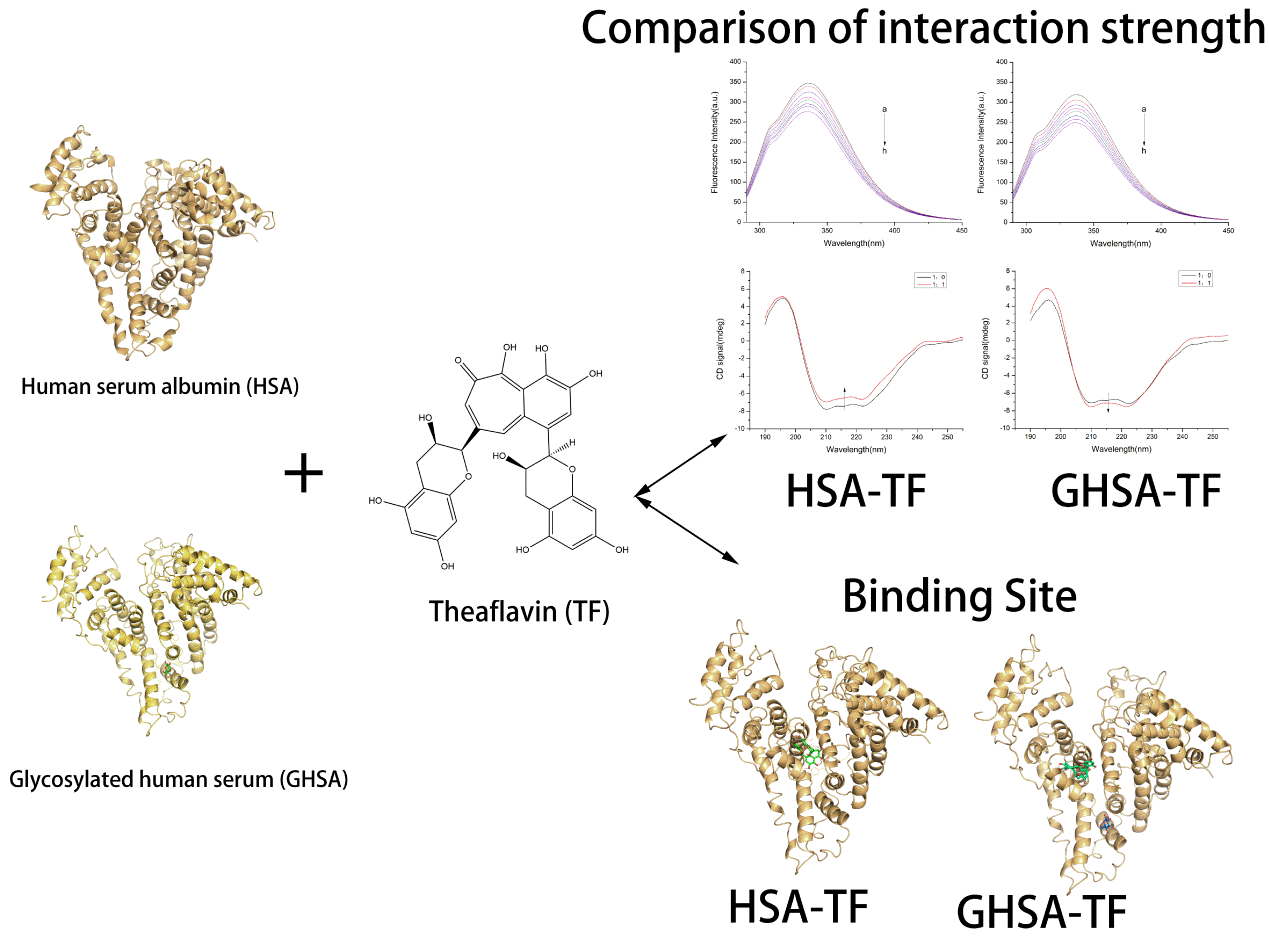
Spectroscopic Technique-Based Comparative Investigation on the Interaction of Theaflavins with Native and Glycated Human Serum Albumin

Abstract
:
1. Introduction
2. Results
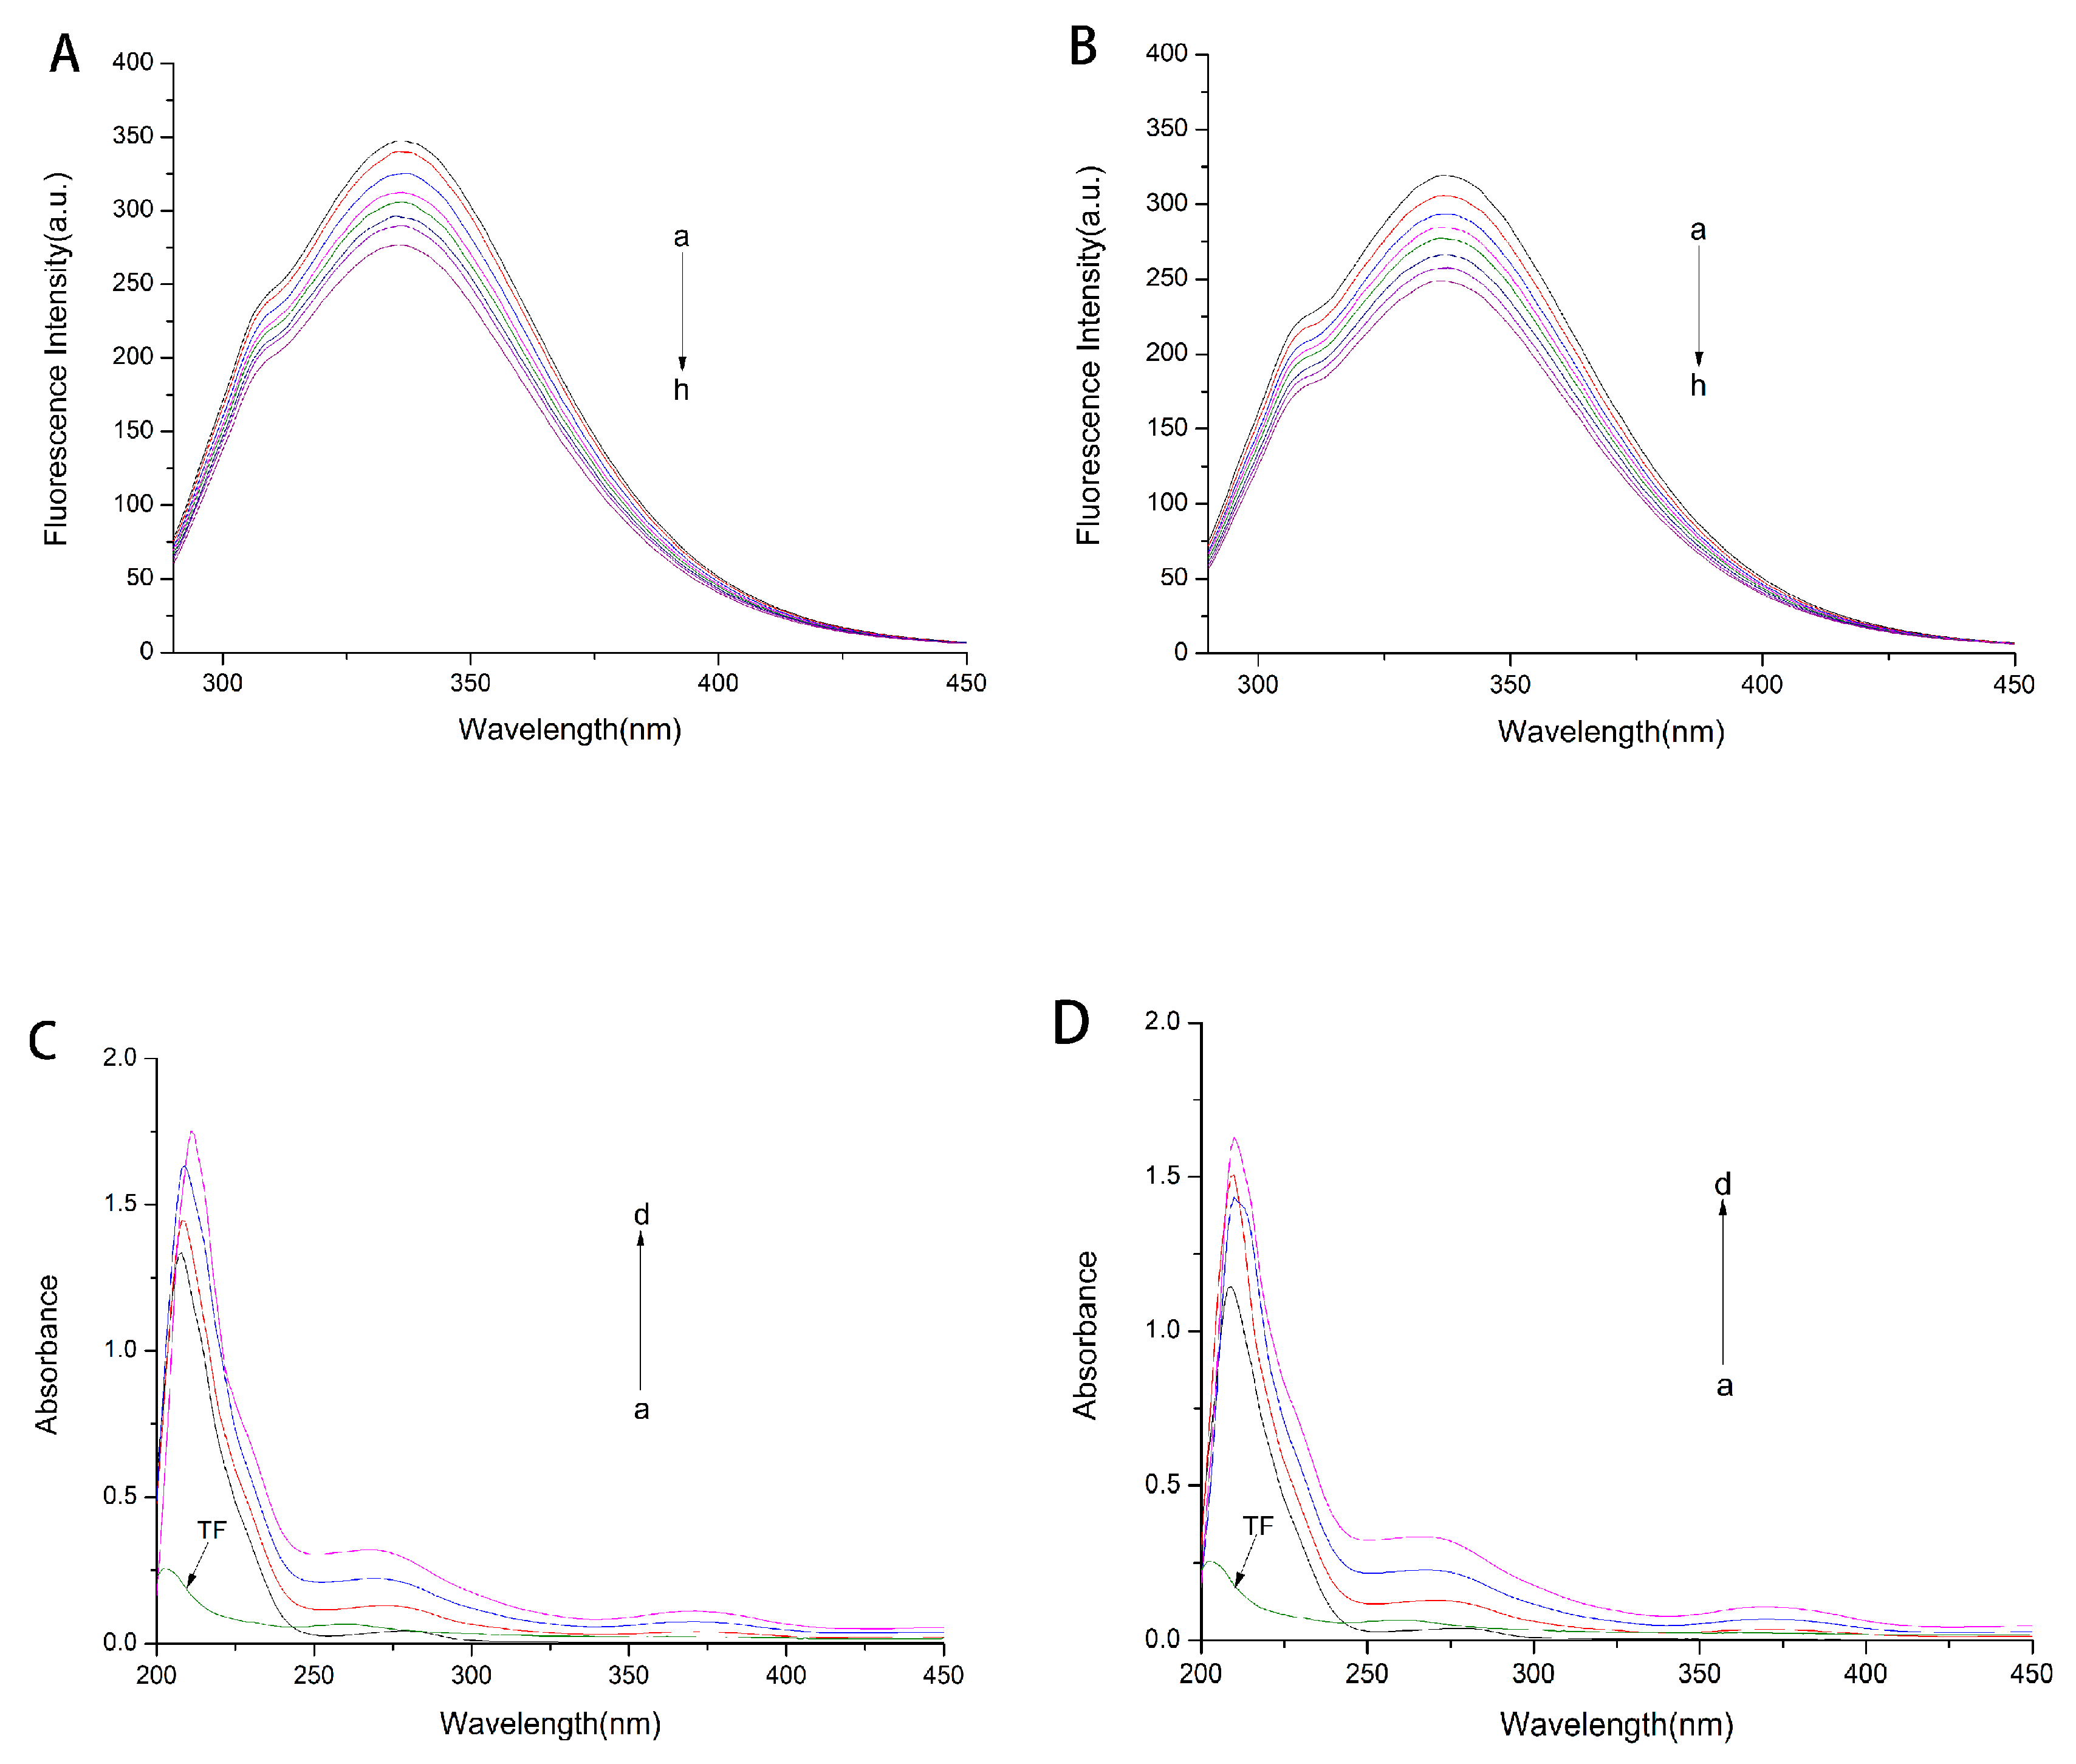
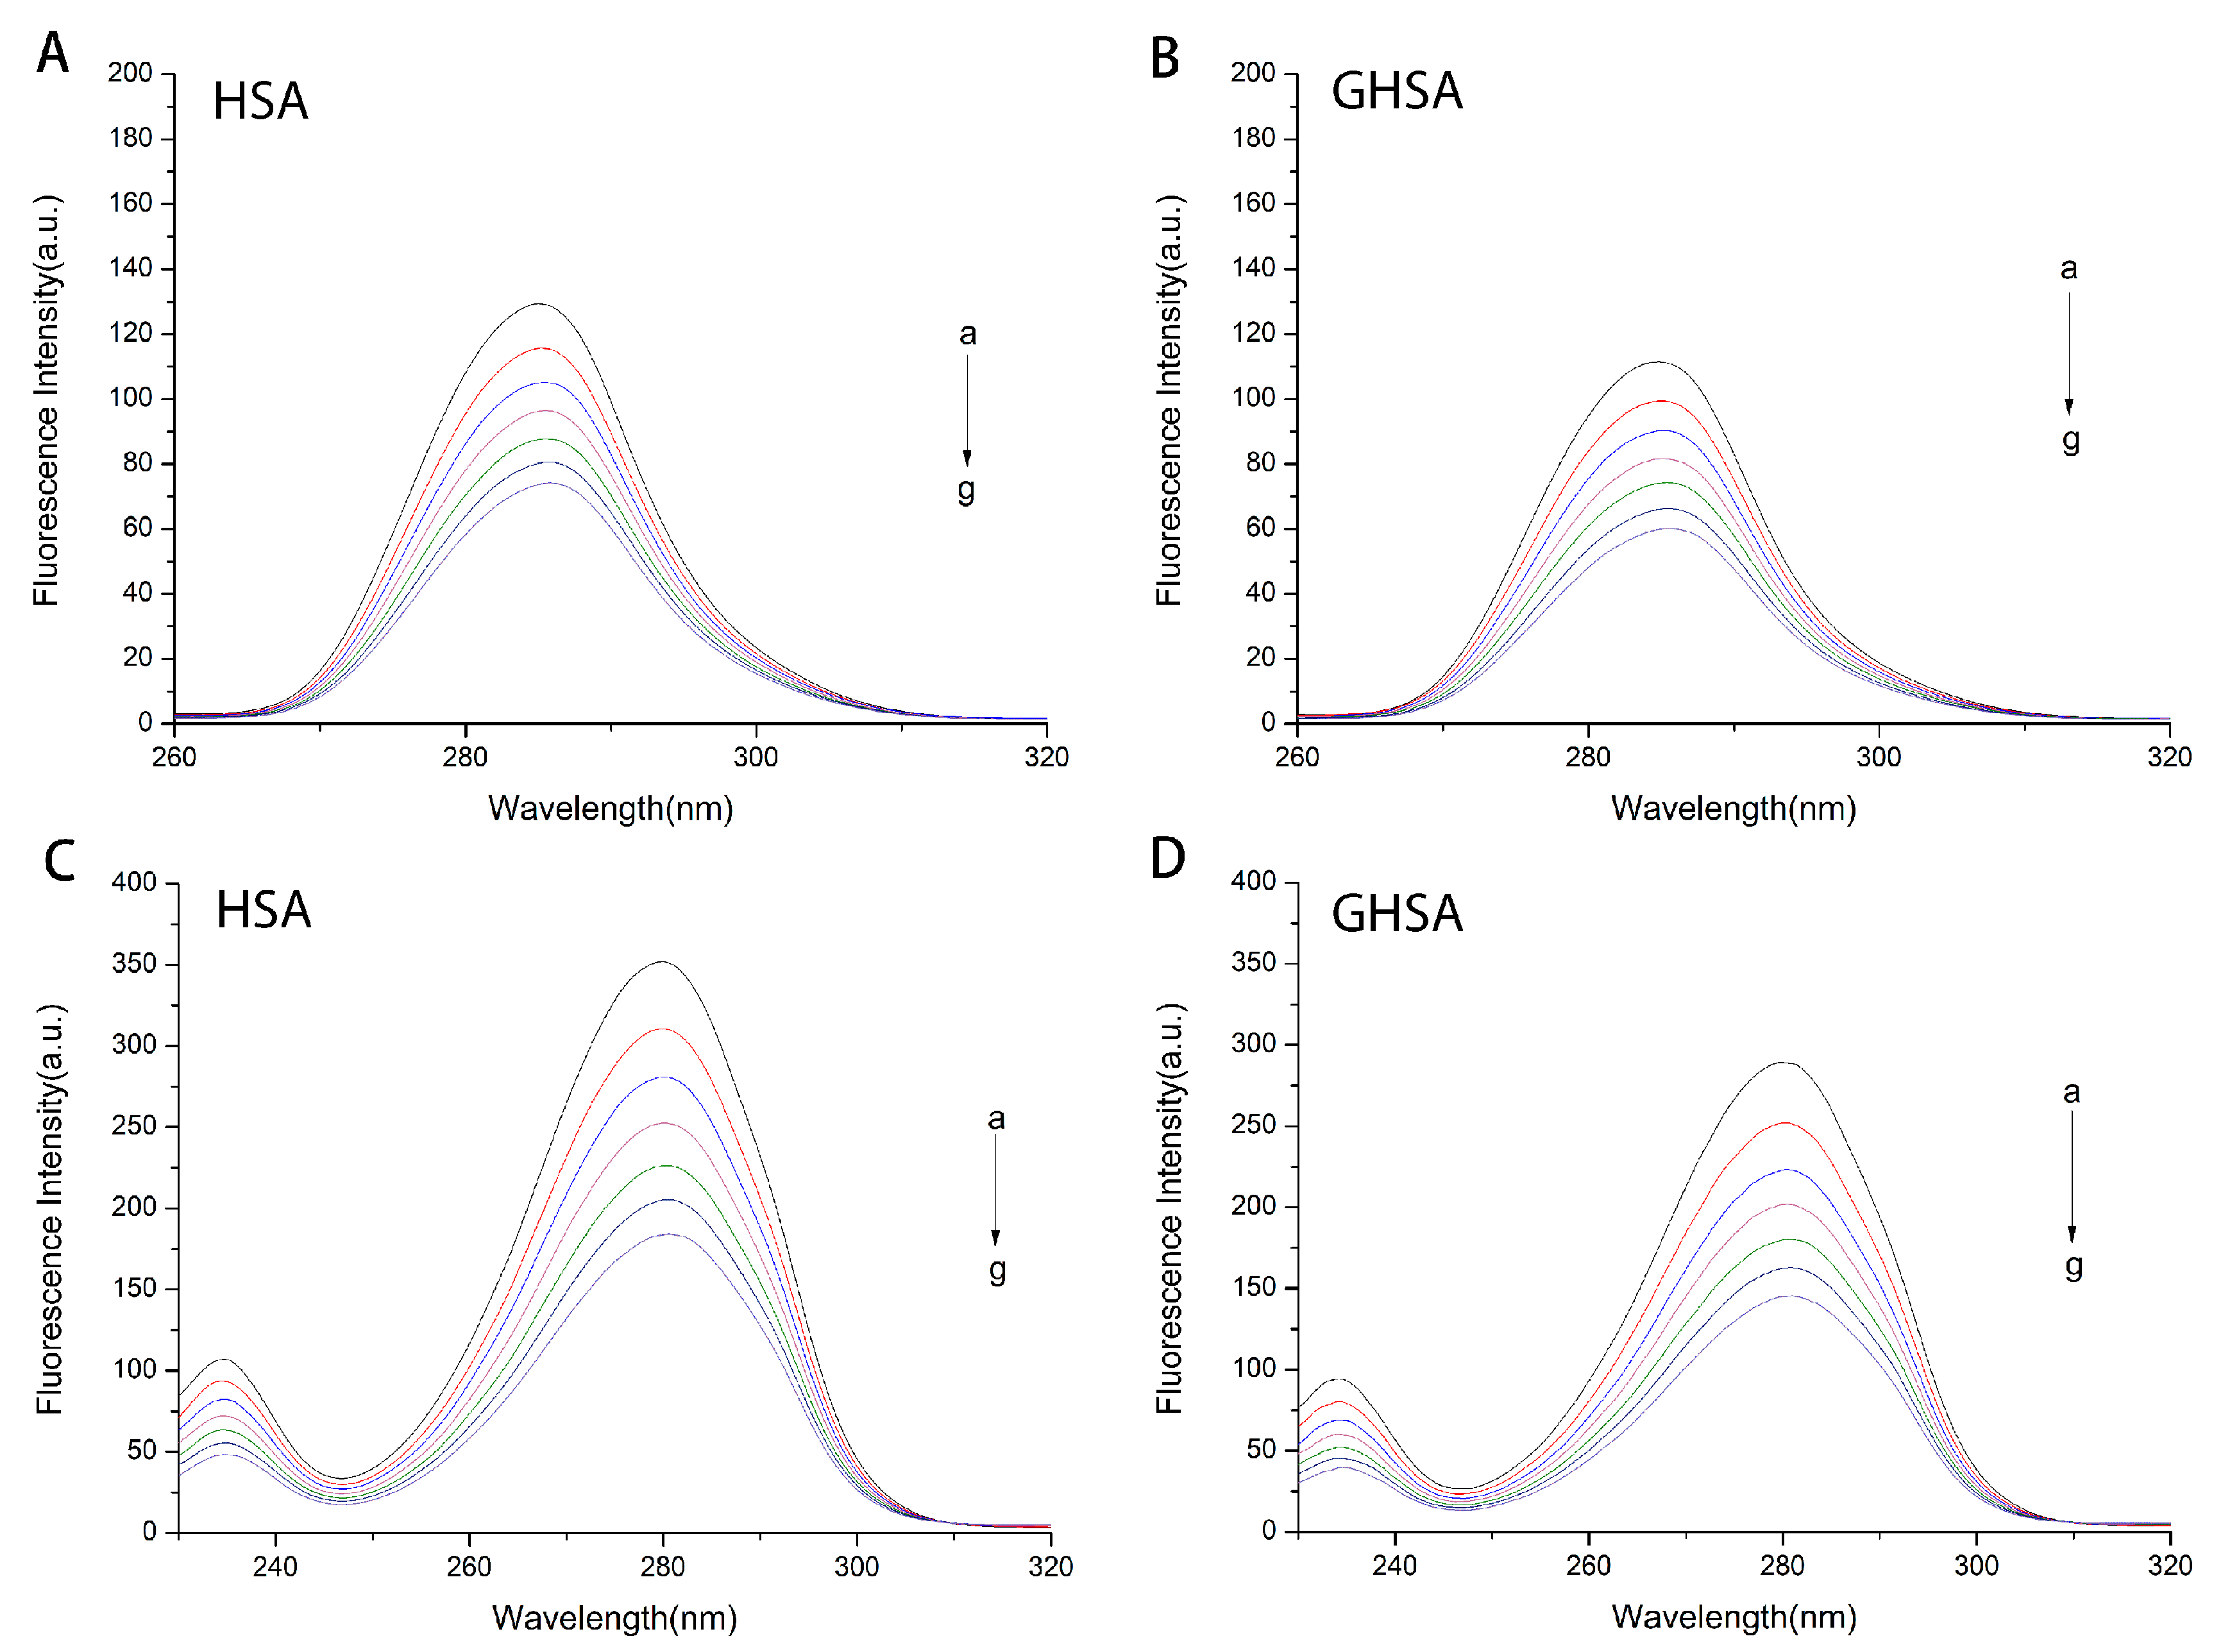
2.1. Fluorescence and UV-Vis Spectra of HSA and GHSA after Addition of TF
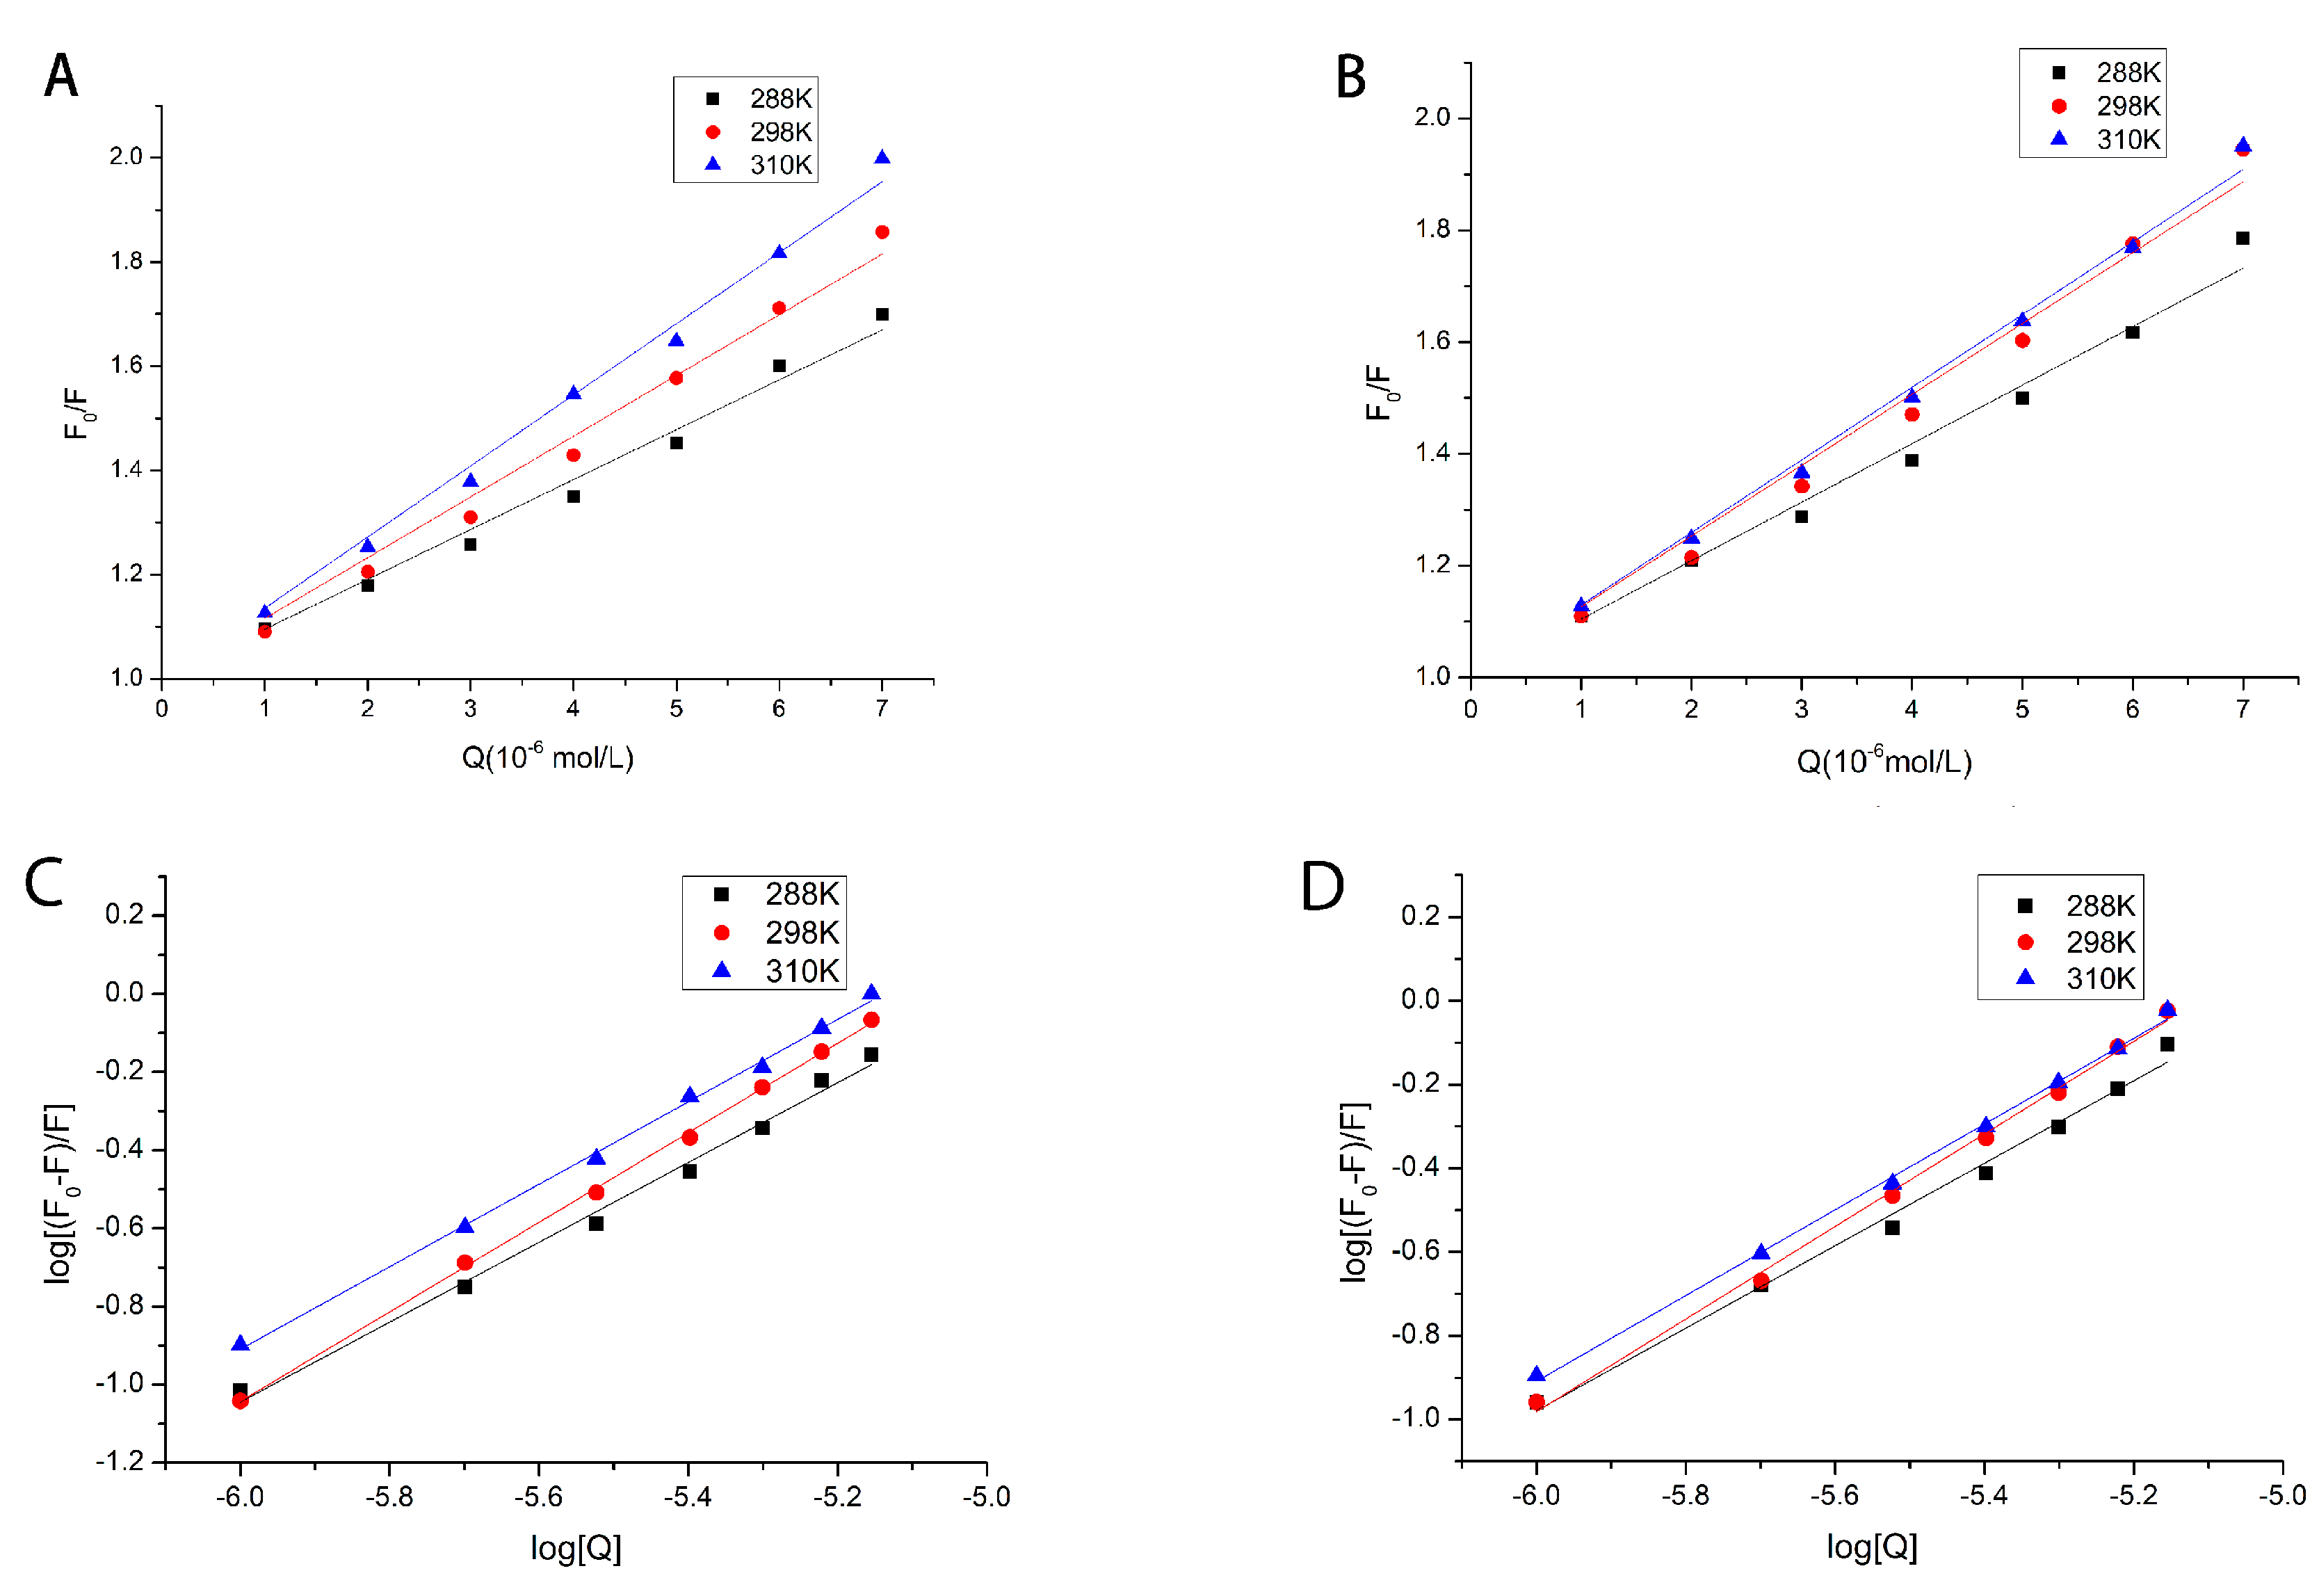
2.2. Fluorescence Quenching Mechanism of Reaction
2.3. Calculation and Analysis of Binding Site Number and Binding Constant
2.4. Thermodynamic Parameters and Properties of Binding Forces
2.5. Determination of Amino Acid Icroenvironment Changes by Synchronous Fluorescence Spectroscopy
2.6. Study on the Change of Protein Structure in Complexes
2.6.1. Zeta Potential and Particle Size
2.6.2. Three-Dimensional Fluorescence
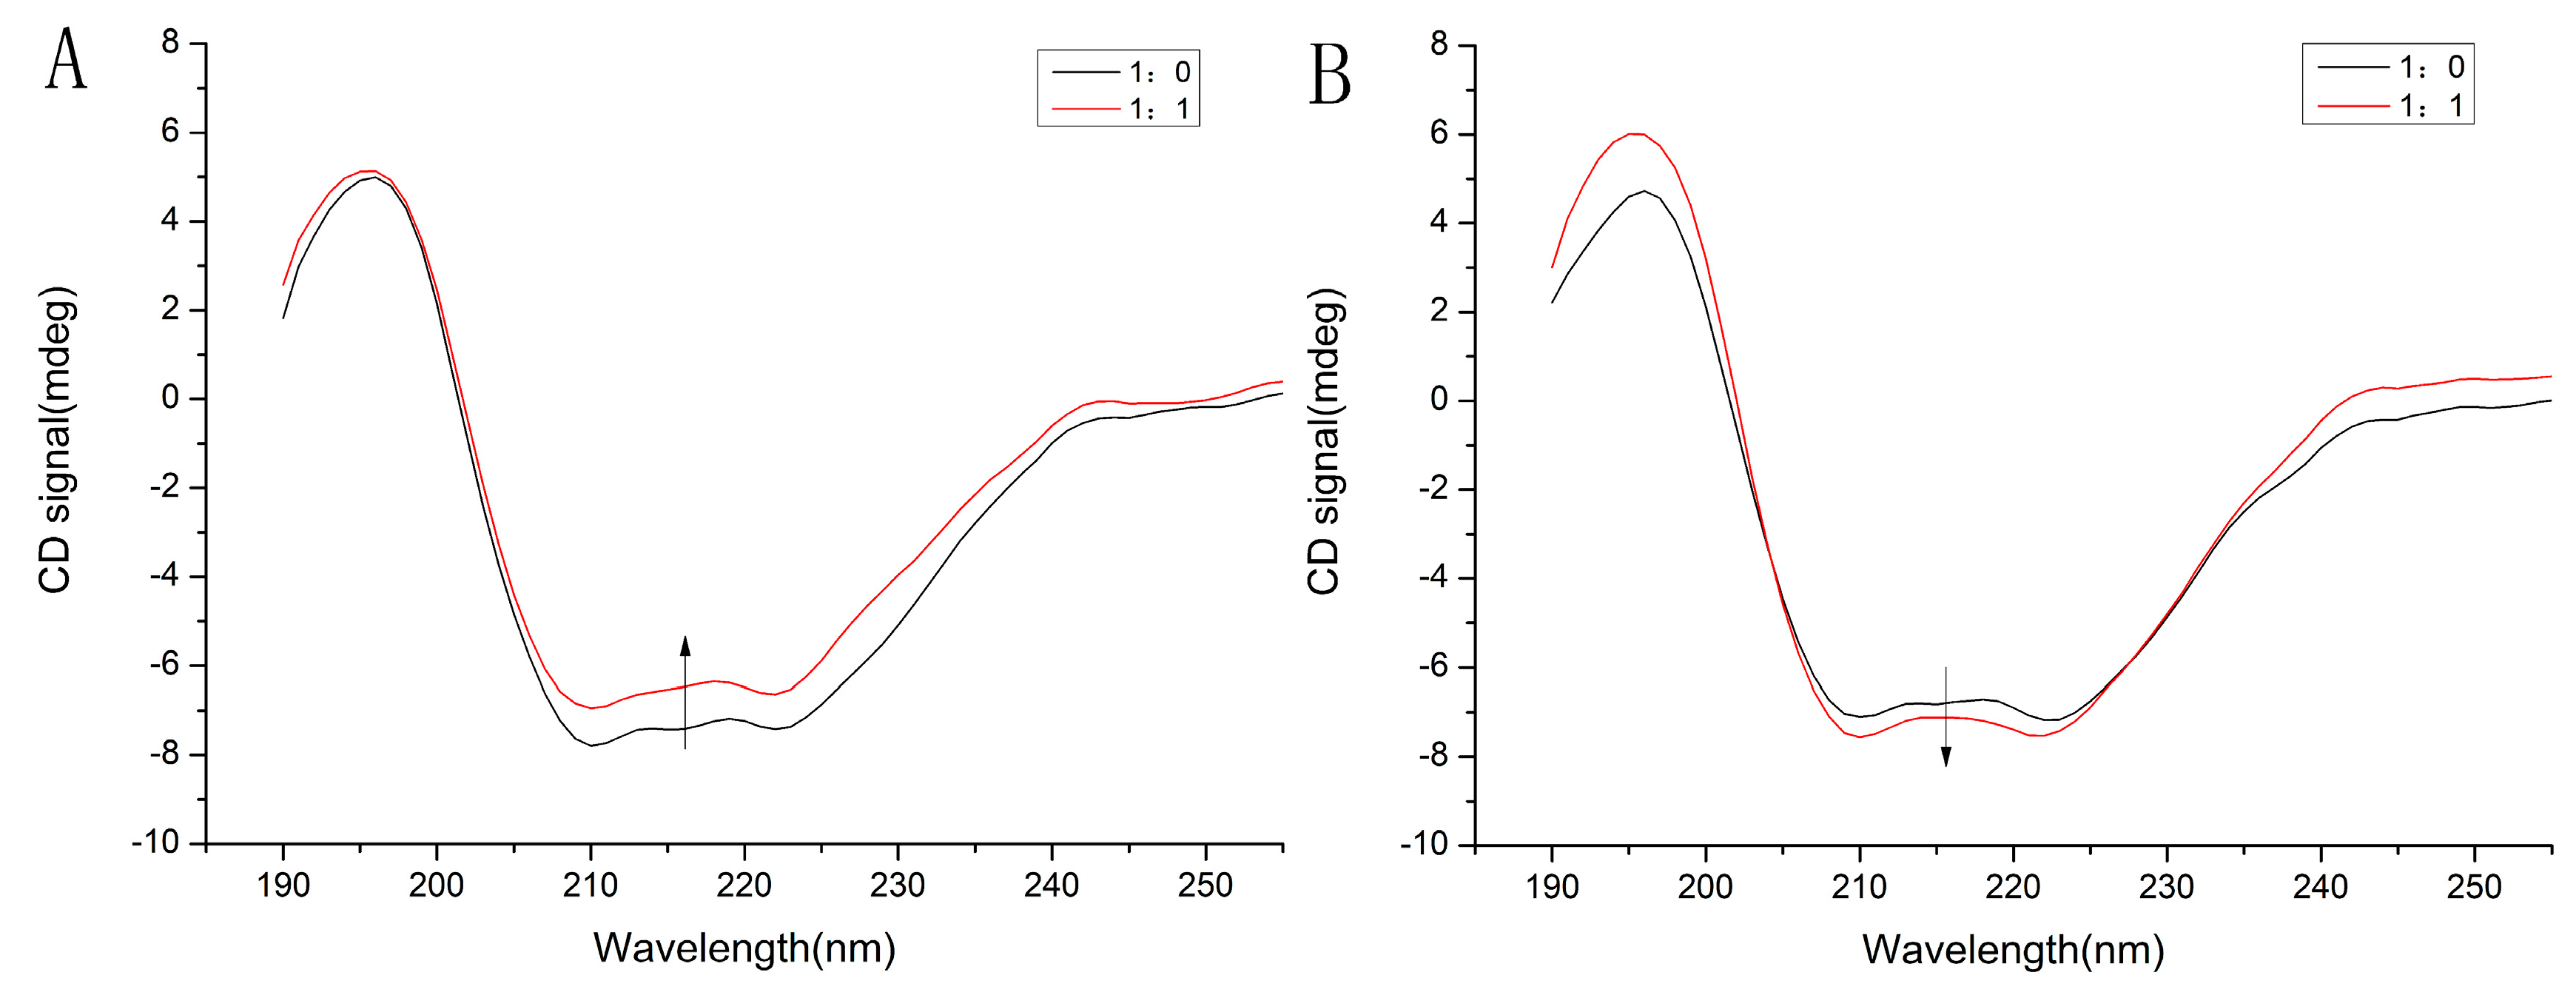
2.6.3. Circular Dichroism
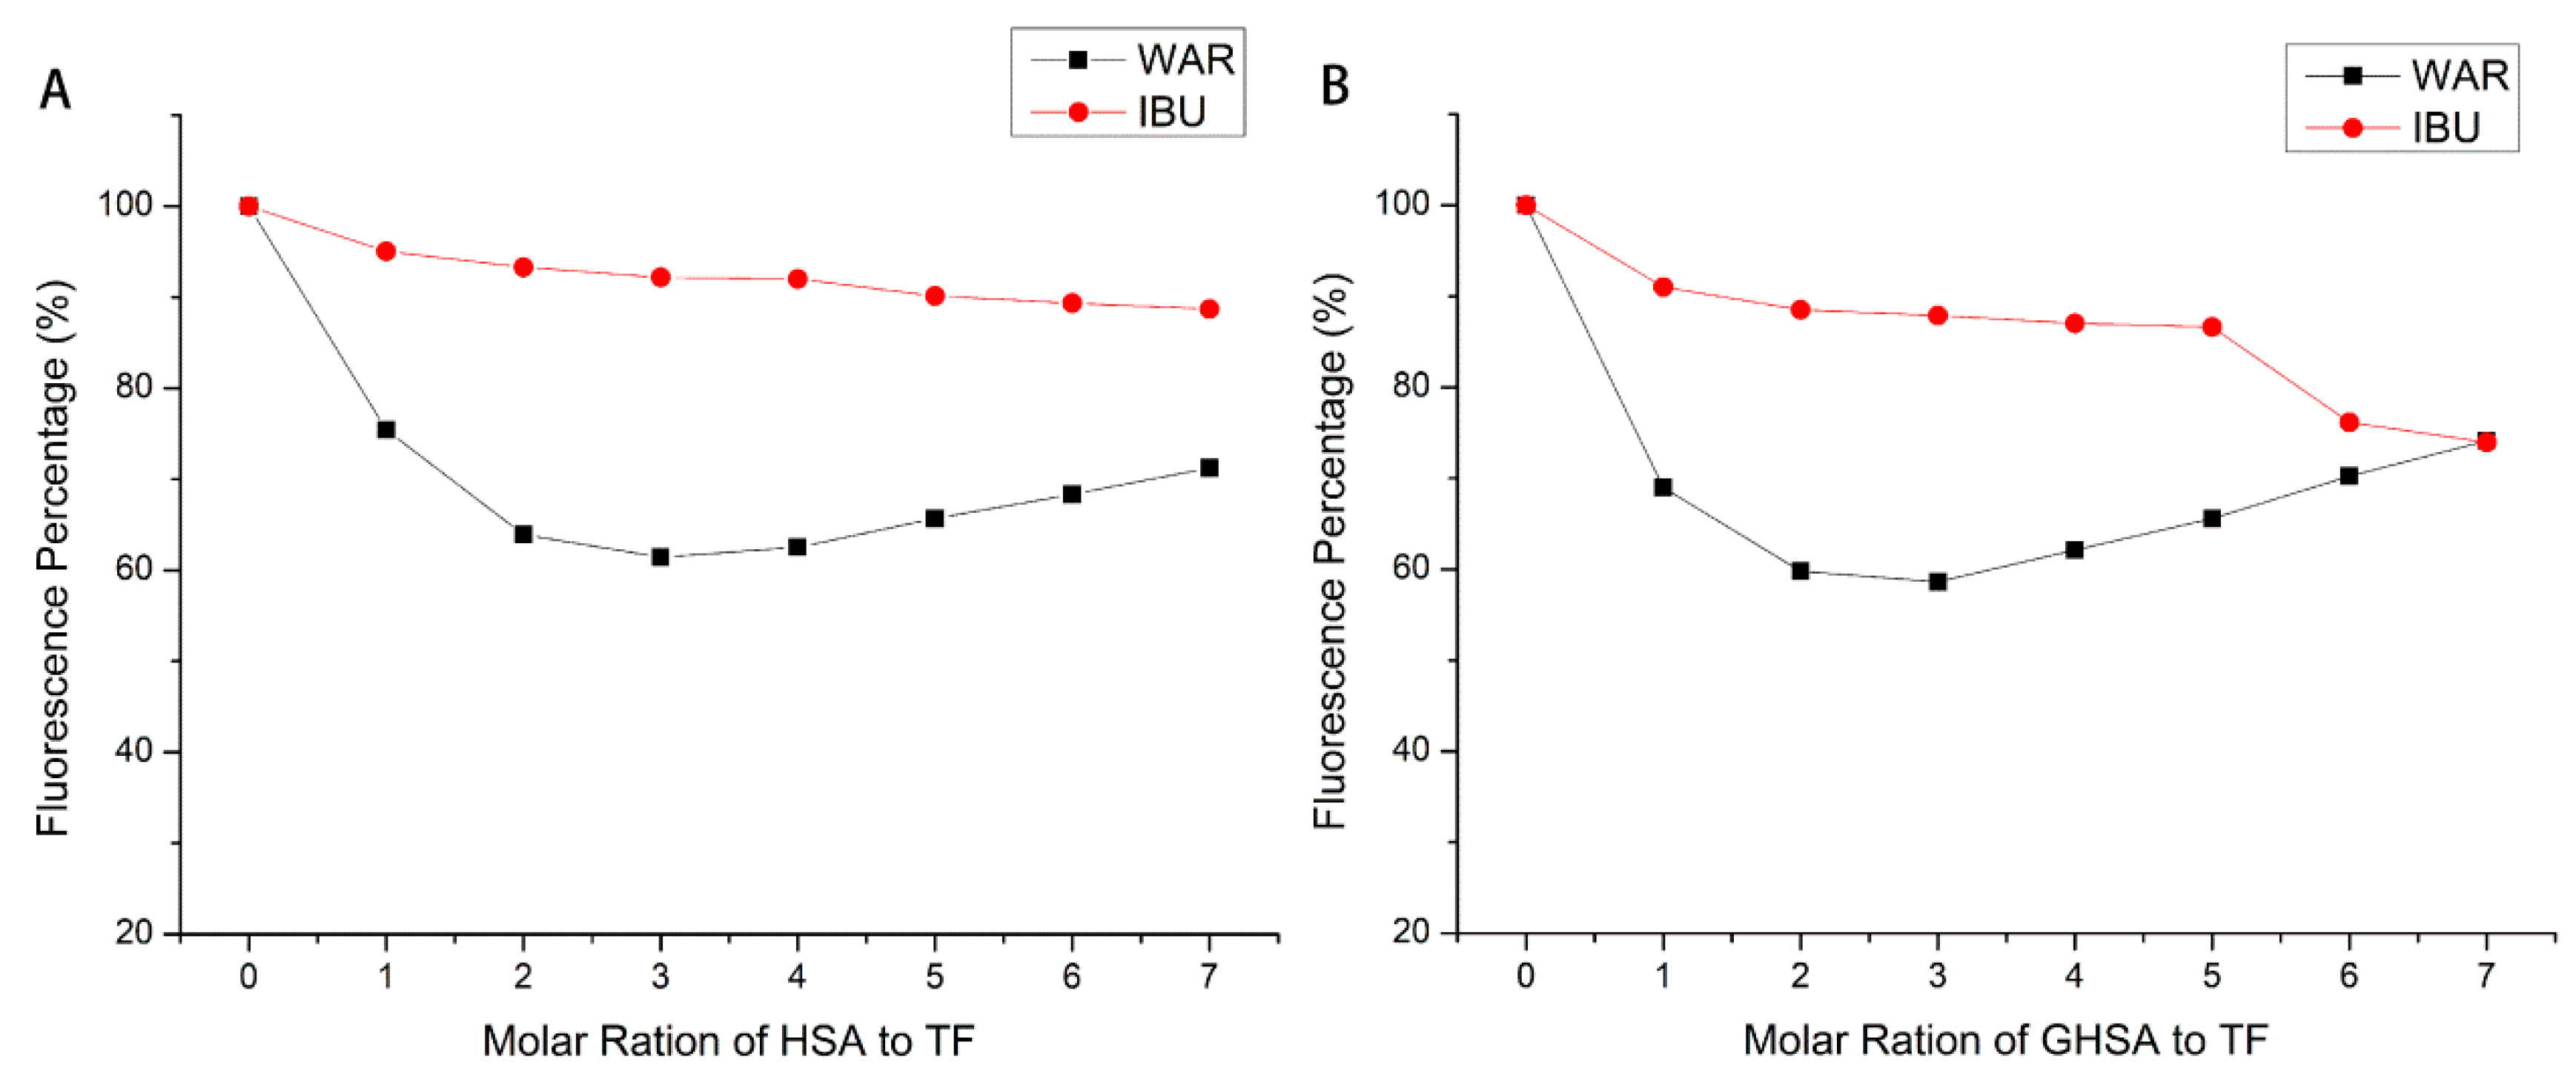
2.7. Site Marker Competition Experiments
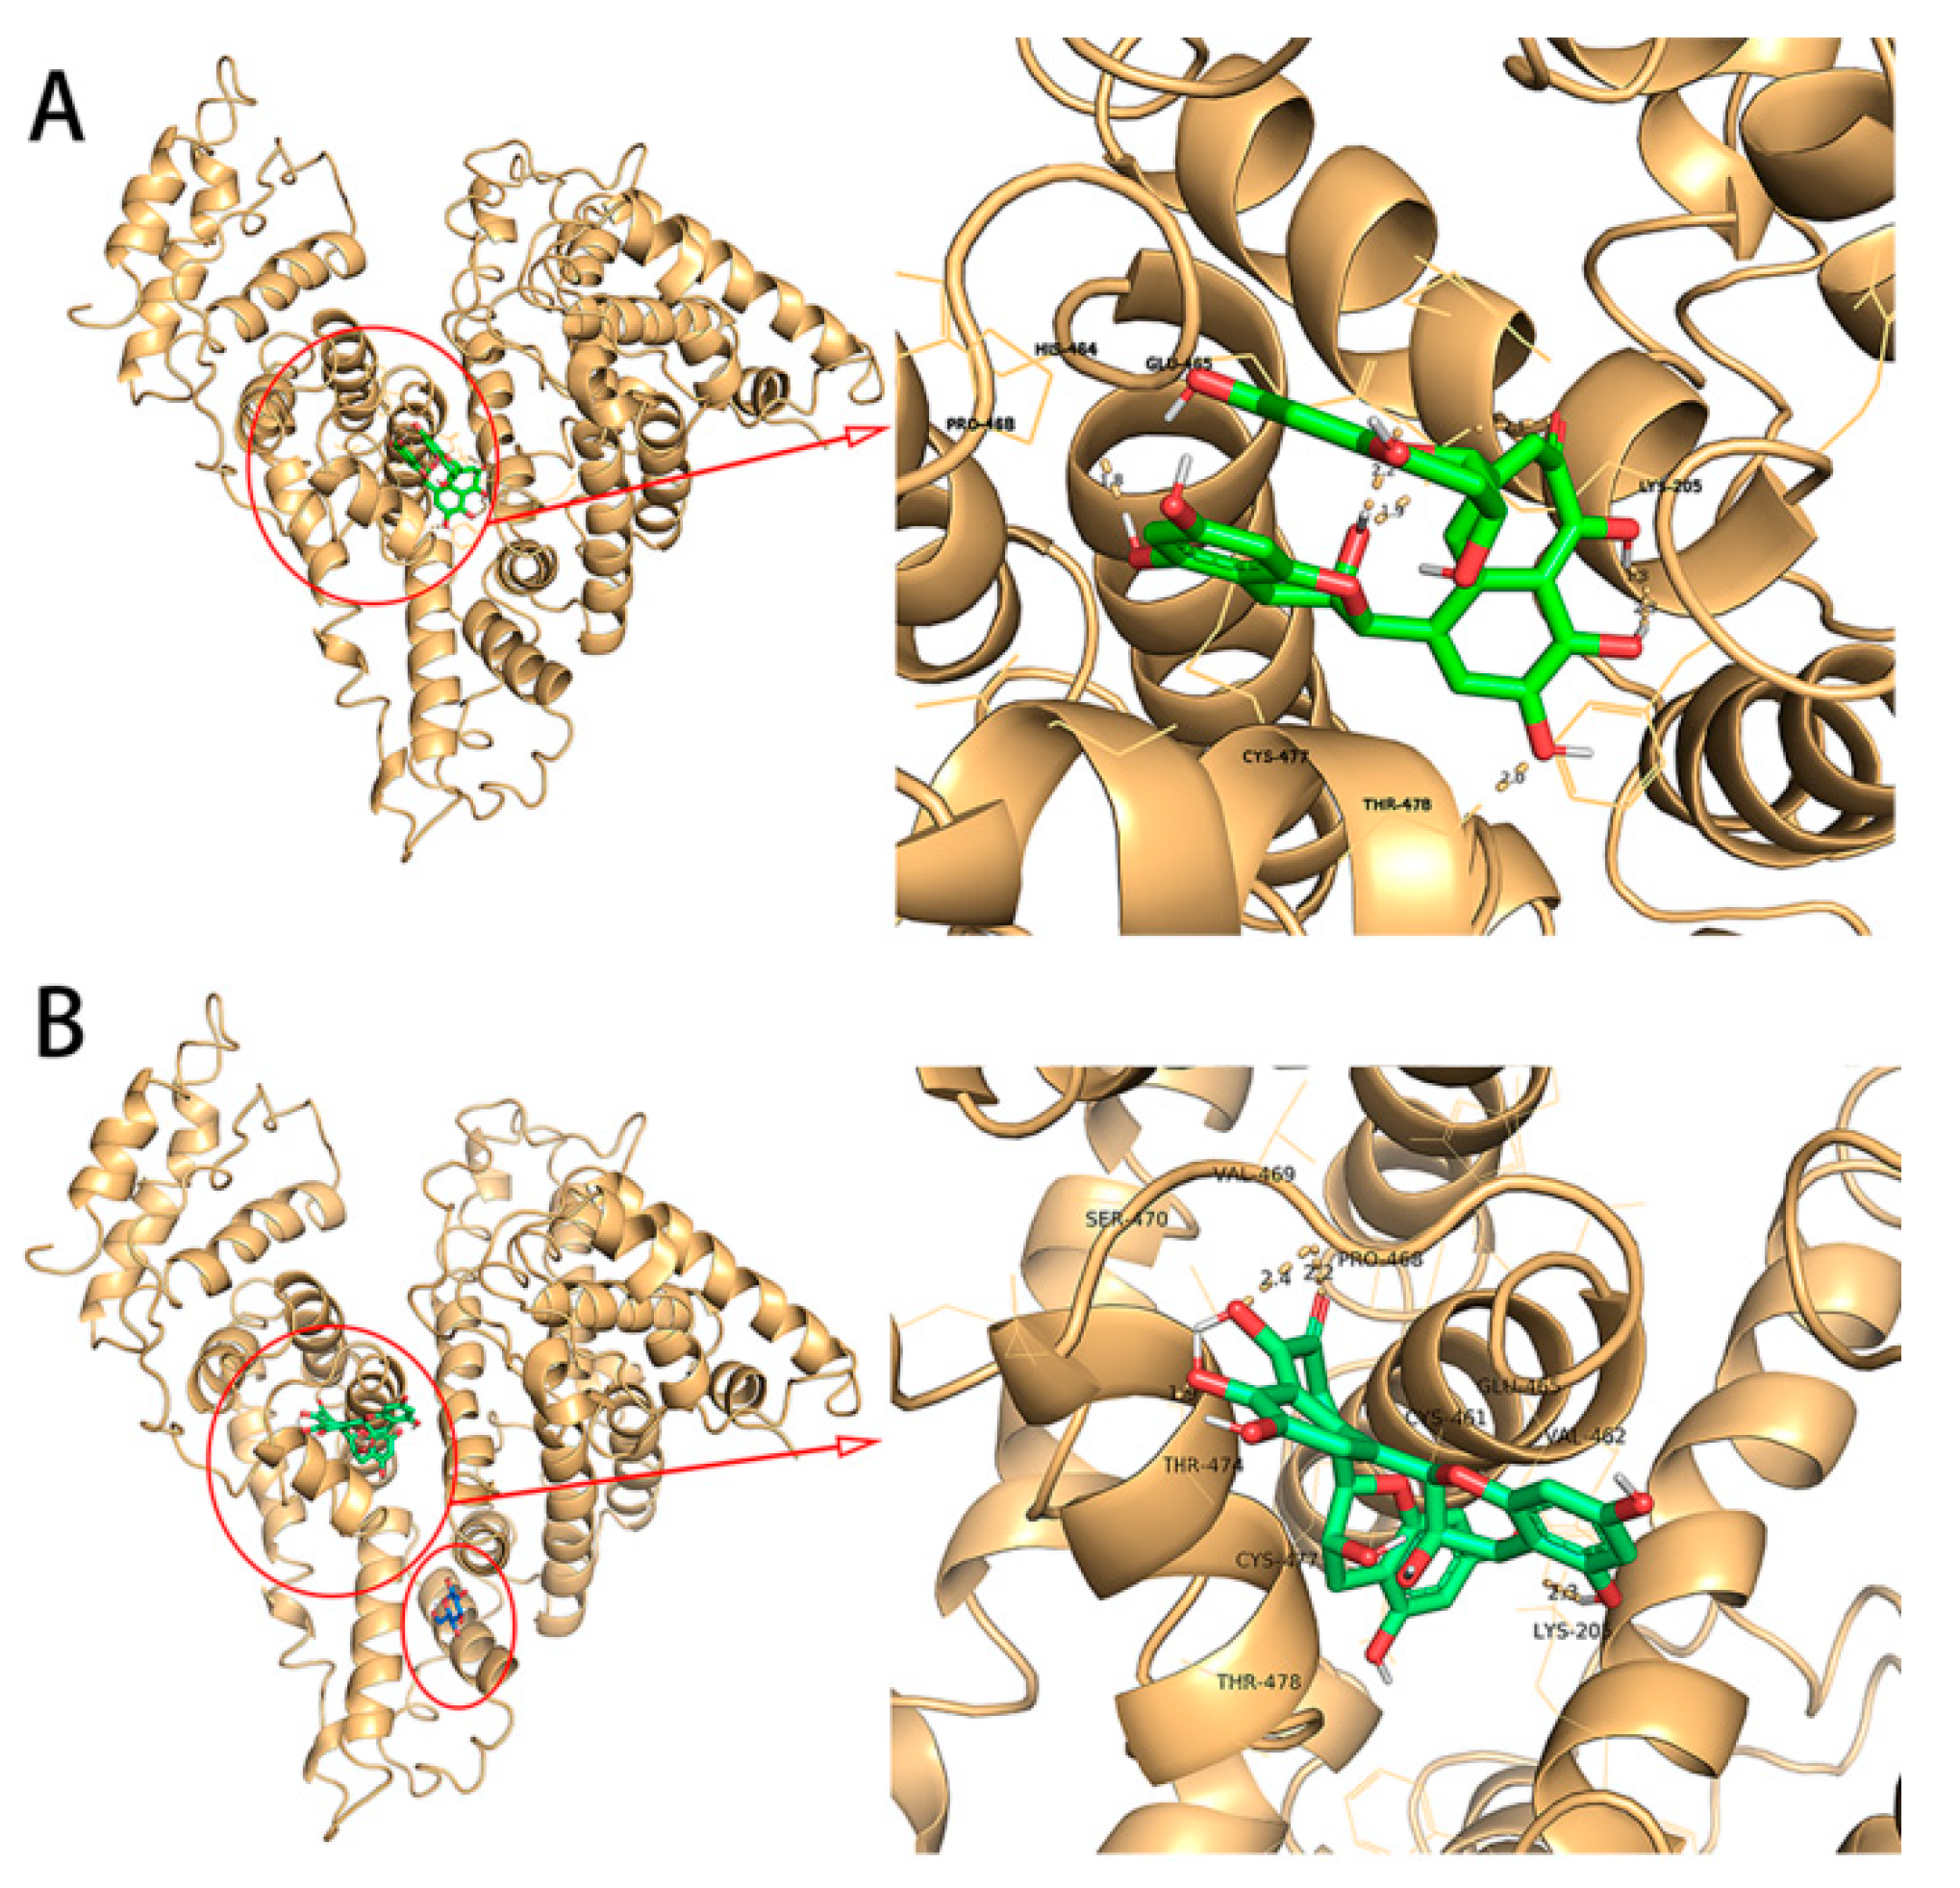
2.8. Molecular Docking Experiment
3. Discussion
4. Materials and Method
4.1. Materials and Equipment
4.2. Sample Preparation
4.3. Fluorescence Quenching Measurements
4.4. UV-Visible Absorption Spectroscopy
4.5. Zeta Potential and Particle Size
4.6. Circular Dichroism
4.7. Site Marker Competitive Experiments
4.8. Molecular Docking
5. Conclusions
Author Contributions
Funding
Acknowledgments
Conflicts of Interest
Ethics Statement
Abbreviations
| CD | Circular Dichroism |
| GHSA | glycated human serum albumin |
| HSA | human serum albumin |
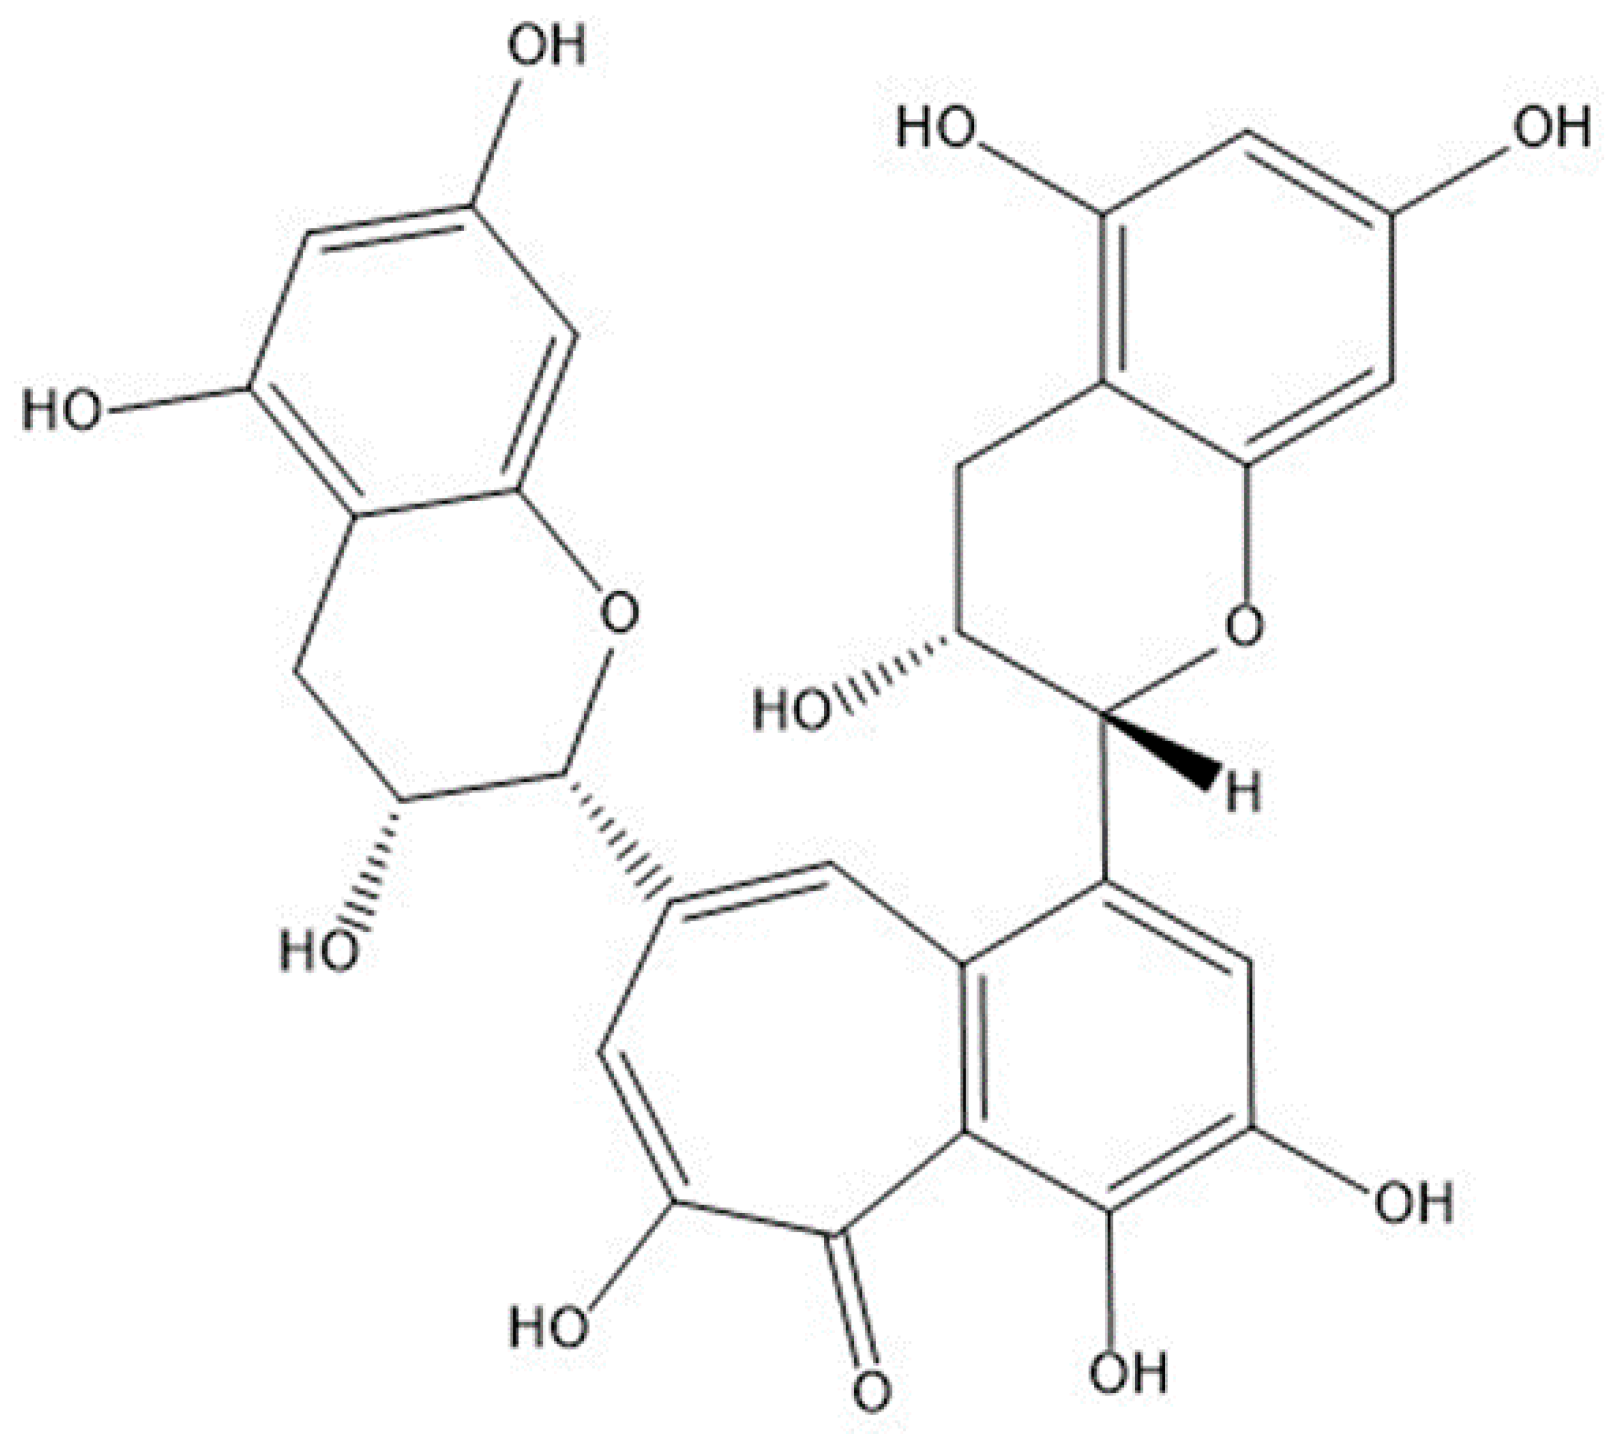
| TF | theaflavin |
| UV-Vis | ultraviolet visible |
References
- Łuczaj, W.; Skrzydlewska, E. Antioxidative properties of black tea. Prev. Med. 2005, 40, 910–918. [Google Scholar] [CrossRef] [PubMed]
- Roberts, E.A.H.; Cartwright, R.A.; Oldschool, M. The phenolic substances of manufactured tea. I.—Fractionation and paper chromatography of water-soluble substances. J. Sci. Food Agric. 1957, 8, 72–80. [Google Scholar] [CrossRef]
- He, H.-F. Research progress on theaflavins: Efficacy, formation, and preparation. Food Nutr. Res. 2017, 61. [Google Scholar] [CrossRef] [PubMed]
- Glisan, S.L.; Grove, K.A.; Yennawar, N.H.; Lambert, J.D. Inhibition of pancreatic lipase by black tea theaflavins: Comparative enzymology and in silico modeling studies. Food Chem. 2017, 216, 296–300. [Google Scholar] [CrossRef] [PubMed]
- Wang, K.; Liu, Z.; Huang, J.; Bekhit, A.e.-d.; Liu, F.; Dong, X.; Gong, Y.; Fu, D. The inhibitory effects of pure black tea theaflavins on the growth of four selected human cancer CELLS. J. Food Biochem. 2011, 35, 1561–1567. [Google Scholar] [CrossRef]
- Huang, M.-T.; Liu, Y.; Ramji, D.; Lo, C.-Y.; Ghai, G.; Dushenkov, S.; Ho, C.-T. Inhibitory effects of black tea theaflavin derivatives on 12-O-tetradecanoylphorbol-13-acetate-induced inflammation and arachidonic acid metabolism in mouse ears. Mol. Nutr. Food Res. 2006, 50, 115–122. [Google Scholar] [CrossRef]
- Collier, P.D.; Bryce, T.; Mallows, R.; Thomas, P.E.; Frost, D.J.; Korver, O.; Wilkins, C.K. The theaflavins of black tea. Tetrahedron 1973, 29, 125–142. [Google Scholar] [CrossRef]
- Xie, S.; Zhou, J. Harnessing Plant Biodiversity for the Discovery of Novel Anticancer Drugs Targeting Microtubules. Frontiers Plant Sci. 2017, 8, 720. [Google Scholar] [CrossRef] [Green Version]
- Skrzypczak-Jankun, E.; Jankun, J. Theaflavin digallate inactivates plasminogen activator inhibitor: Could tea help in Alzheimer’s disease and obesity? Int. J. Mol. Med. 2010, 26, 45–50. [Google Scholar]
- Braud, L.; Battault, S.; Meyer, G.; Nascimento, A.; Gaillard, S.; De Sousa, G.; Rahmani, R.; Riva, C.; Armand, M.; Reboul, C.; et al. 0149: Antioxidant molecules of tea (Camellia sinensis) decrease hepatic lipogenesis and steatosis in a high fat-sucrose diet NAFLD rat model. Arch. Cardiovasc. Dis. Suppl. 2016, 8, 213. [Google Scholar] [CrossRef]
- Takemoto, M.; Takemoto, H.; Sakurada, A. Synthesis of theaflavins with Camellia sinensis cell culture and inhibition of increase in blood sugar values in high-fat diet mice subjected to sucrose or glucose loading. Tetrahedron Lett. 2014, 55, 5038–5040. [Google Scholar] [CrossRef] [Green Version]
- Peters, T. Serum Albumin. In Advances in Protein Chemistry; Anfinsen, C.B., Edsall, J.T., Richards, F.M., Eds.; Academic Press: Amsterdam, The Netherlands, 1985; Volume 37, pp. 161–245. [Google Scholar]
- Kragh-Hansen, U. Molecular aspects of ligand binding to serum albumin. Pharmacol. Rev. 1981, 33, 17–53. [Google Scholar] [PubMed]
- Carter, D.C.; Ho, J.X. Structure of Serum Albumin. In Advances in Protein Chemistry; Anfinsen, C.B., Edsall, J.T., Richards, F.M., Eisenberg, D.S., Eds.; Academic Press: Amsterdam, The Netherlands, 1994; Volume 45, pp. 153–203. [Google Scholar]
- Liao, C.; Li, F.; Huang, S.; Zheng, B.; Du, J.; Xiao, D. A specific and biocompatible fluorescent sensor based on the hybrid of GFP chromophore and peptide for HSA detection. Biosens. Bioelectron. 2016, 86, 489–495. [Google Scholar] [CrossRef] [PubMed]
- Anguizola, J.; Matsuda, R.; Barnaby, O.S.; Hoy, K.S.; Wa, C.; Debolt, E.; Koke, M.; Hage, D.S. Review: Glycation of human serum albumin. Clin. Chim. Acta 2013, 425, 64–76. [Google Scholar] [CrossRef] [PubMed] [Green Version]
- Abolfazl, B.; Ali, A.M.-M.; Naghmeh, S.; Mohammad, A.H.-F.; Mohammad, A.; Faizan, A.; Ali, A.S.; Mohammad, R.G.; Parviz, N. Spectroscopic studies of the effects of glycation of human serum albumin on L-trp binding. Protein Pept. Lett. 2007, 14, 13–18. [Google Scholar]
- Goldfarb, A.R.; Saidel, L.J.; Mosovich, E. The ultraviolet absorption spectra of proteins. J. Biol. Chem. 1951, 193, 397–404. [Google Scholar] [CrossRef]
- Lakowicz, J.R. Principles of Fluorescence Spectroscopy, 3rd ed.; SPIE: Heidelberg/Berlin, Germany, 2008; Volume 13, p. 029901. [Google Scholar]
- Nasruddin, A.N.; Feroz, S.R.; Mukarram, A.K.; Mohamad, S.B.; Tayyab, S. Fluorometric and molecular docking investigation on the binding characteristics of SB202190 to human serum albumin. J. Lumin. 2016, 174, 77–84. [Google Scholar] [CrossRef]
- Gao, X.; Bi, H.; Jia, J.; Tang, L. Spectroscopic and in silico study of binding mechanism of cynidine-3-O-glucoside with human serum albumin and glycated human serum albumin. Luminescence 2017, 32, 640–651. [Google Scholar] [CrossRef]
- Lei, S.; Xu, D.; Saeeduddin, M.; Riaz, A.; Zeng, X. Characterization of molecular structures of theaflavins and the interactions with bovine serum albumin. J. Food Sci. Technol. 2017, 54, 3421–3432. [Google Scholar] [CrossRef]
- Ross, P.D.; Subramanian, S. Thermodynamics of protein association reactions: Forces contributing to stability. Biochemistry 1981, 20, 3096–3102. [Google Scholar] [CrossRef]
- Tang, L.; Zuo, H.; Shu, L. Comparison of the interaction between three anthocyanins and human serum albumins by spectroscopy. J. Lumin. 2014, 153, 54–63. [Google Scholar] [CrossRef]
- Burstein, E.A.; Vedenkina, N.S.; Ivkova, M.N. Fluorescence and the location of tryptophan residues in protein molecules. Photochem. Photobiol. 1973, 18, 263–279. [Google Scholar] [CrossRef] [PubMed]
- Chen, Y.; Zhou, Y.; Chen, M.; Xie, B.; Yang, J.; Chen, J.; Sun, Z. Isorenieratene interaction with human serum albumin: Multi-spectroscopic analyses and docking simulation. Food Chem. 2018, 258, 393–399. [Google Scholar] [CrossRef] [PubMed]
- Zhang, D.; Zhang, X.; Liu, Y.-C.; Huang, S.-C.; Ouyang, Y.; Hu, Y.-J. Investigations of the molecular interactions between nisoldipine and human serum albumin in vitro using multi-spectroscopy, electrochemistry and docking studies. J. Mol. Liq. 2018, 258, 155–162. [Google Scholar] [CrossRef]
- Li, T.; Hu, P.; Dai, T.; Li, P.; Ye, X.; Chen, J.; Liu, C. Comparing the binding interaction between β-lactoglobulin and flavonoids with different structure by multi-spectroscopy analysis and molecular docking. Spectrochim. Acta Part A Mol. Biomol. Spectrosc. 2018, 201, 197–206. [Google Scholar] [CrossRef] [PubMed]
- Xie, L.; Wehling, R.L.; Ciftci, O.; Zhang, Y. Formation of complexes between tannic acid with bovine serum albumin, egg ovalbumin and bovine beta-lactoglobulin. Food Res. Int. 2017, 102, 195–202. [Google Scholar] [CrossRef] [PubMed]
- Ghuman, J.; Zunszain, P.A.; Petitpas, I.; Bhattacharya, A.A.; Otagiri, M.; Curry, S. Structural Basis of the Drug-binding Specificity of Human Serum Albumin. J. Mol. Biol. 2005, 353, 38–52. [Google Scholar] [CrossRef] [PubMed]
- Kawai, A.; Yamasaki, K.; Enokida, T.; Miyamoto, S.; Otagiri, M. Crystal structure analysis of human serum albumin complexed with sodium 4-phenylbutyrate. Biochem. Biophys. Rep. 2018, 13, 78–82. [Google Scholar] [CrossRef]
- Sudlow, G.; Birkett, D.J.; Wade, D.N. Further characterization of specific drug binding sites on human serum albumin. Mol. Pharmacol. 1976, 12, 1052–1061. [Google Scholar]
- Carter, D.; He, X.; Munson, S.; Twigg, P.; Gernert, K.; Broom, M.; Miller, T. Three-dimensional structure of human serum albumin. Science 1989, 244, 1195–1198. [Google Scholar] [CrossRef]
- Liu, C.; Yang, W.; Gao, Q.; Du, J.; Luo, H.; Liu, Y.; Yang, C. Differential recognition and quantification of HSA and BSA based on two red-NIR fluorescent probes. J. Lumin. 2018, 197, 193–199. [Google Scholar] [CrossRef]
- Bagheri, M.; Fatemi, M.H. Fluorescence spectroscopy, molecular docking and molecular dynamic simulation studies of HSA-Aflatoxin B1 and G1 interactions. J. Lumin. 2018, 202, 345–353. [Google Scholar] [CrossRef]
- Figge, J.; Rossing, T.H.; Fencl, V. The role of serum proteins in acid-base equilibria. J. Lab. Clin. Med. 1991, 117, 453–467. [Google Scholar] [PubMed]
- Rondeau, P.; Bourdon, E. The glycation of albumin: Structural and functional impacts. Biochimie 2011, 93, 645–658. [Google Scholar] [CrossRef] [PubMed]
- Chaves, O.A.; da Silva, V.A.; Sant’Anna, C.M.R.; Ferreira, A.B.B.; Ribeiro, T.A.N.; de Carvalho, M.G.; Cesarin-Sobrinho, D.; Netto-Ferreira, J.C. Binding studies of lophirone B with bovine serum albumin (BSA): Combination of spectroscopic and molecular docking techniques. J. Mol. Struct. 2017, 1128, 606–611. [Google Scholar] [CrossRef]
- Chitpan, M.; Wang, X.; Ho, C.-T.; Huang, Q. Monitoring the binding processes of black tea thearubigin to the bovine serum albumin surface using quartz crystal microbalance with dissipation monitoring. J. Agric. Food Chem. 2007, 55, 10110–10116. [Google Scholar] [CrossRef] [PubMed]
- Rahnama, E.; Mahmoodian-Moghaddam, M.; Khorsand-Ahmadi, S.; Saberi, M.R.; Chamani, J. Binding site identification of metformin to human serum albumin and glycated human serum albumin by spectroscopic and molecular modeling techniques: A comparison study. J. Biomol. Struct. Dyn. 2015, 33, 513–533. [Google Scholar] [CrossRef]
- Amézqueta, S.; Bolioli, A.M.; Beltrán, J.L.; Ràfols, C. Evaluation of the interactions between human serum albumin (HSA) and warfarin or diflunisal by using molecular fluorescence using two approaches. Admet Dmpk 2018, 6, 47–54. [Google Scholar] [CrossRef] [Green Version]
- Xu, L.; Hu, Y.-X.; Li, Y.-C.; Liu, Y.-F.; Zhang, L.; Ai, H.-X.; Liu, H.-S. Study on the interaction of paeoniflorin with human serum albumin (HSA) by spectroscopic and molecular docking techniques. Chem. Cent. J. 2017, 11. [Google Scholar] [CrossRef]
Sample Availability: Samples of the compounds TF-HSA and TF-GHSA are available from the authors. |


| Compound | T(K) | Ksv (105Lmol−1) | Kq (1013Lmol−1s−1) | R2 | Ka (105Lmol−1) | n | R2 | ΔH (KJmol−1) | ΔS (Jmol−1K−1) | ΔG (KJmol−1) |
|---|---|---|---|---|---|---|---|---|---|---|
| HAS + TF | 288 | 0.9568 | 0.9568 | 0.9996 | 1.2191 | 1.0218 | 0.9909 | 123.0949 | 500.8975 | −21.1639 |
| 298 | 1.1647 | 1.1647 | 0.9995 | 6.8431 | 1.1464 | 0.9991 | −26.1728 | |||
| 310 | 1.3631 | 1.3631 | 0.9997 | 2.6491 | 1.0554 | 0.9978 | −32.1836 | |||
| GHSA + TF | 288 | 1.0463 | 1.0463 | 0.9996 | 0.8563 | 0.9853 | 0.9907 | 118.561 | 482.6962 | −20.4555 |
| 298 | 1.2669 | 1.2669 | 0.9993 | 4.5107 | 1.1059 | 0.9964 | −25.2825 | |||
| 310 | 1.2986 | 1.2986 | 0.9998 | 1.7229 | 1.0242 | 0.9979 | −31.0748 |
| Compound | Peak a | Peak b | ||
|---|---|---|---|---|
| Peak Position | Intensity F0 | Peak Position | Intensity F0 | |
| λex/λem (nm/nm) | λex/λem (nm/nm) | |||
| HSA | 225/335 | 266.9 | 280/337 | 239.5 |
| HSA-TF | 225/335 | 243.6 | 280/337 | 226.5 |
| GHSA | 225/339 | 267.7 | 280/339 | 238.7 |
| GHSA-TF | 225/337 | 237.4 | 280/338 | 217.8 |
| Compound | α-Helix (%) | Antiparallel (%) | Parallel (%) | β-Turn (%) | Random Coil (%) |
|---|---|---|---|---|---|
| HSA | 41.5 | 6.3 | 7.0 | 15.4 | 28.0 |
| HSA-TF | 37.0 | 7.1 | 8.0 | 16.1 | 30.8 |
| GHSA | 38.6 | 6.8 | 7.6 | 15.8 | 29.8 |
| GHSA-TF | 41.5 | 6.3 | 7.0 | 15.4 | 28.0 |
© 2019 by the authors. Licensee MDPI, Basel, Switzerland. This article is an open access article distributed under the terms and conditions of the Creative Commons Attribution (CC BY) license (http://creativecommons.org/licenses/by/4.0/).
Share and Cite
Xu, J.; Wang, M.; Zheng, Y.; Tang, L. Spectroscopic Technique-Based Comparative Investigation on the Interaction of Theaflavins with Native and Glycated Human Serum Albumin. Molecules 2019, 24, 3171. https://doi.org/10.3390/molecules24173171
Xu J, Wang M, Zheng Y, Tang L. Spectroscopic Technique-Based Comparative Investigation on the Interaction of Theaflavins with Native and Glycated Human Serum Albumin. Molecules. 2019; 24(17):3171. https://doi.org/10.3390/molecules24173171
Chicago/Turabian StyleXu, Jinhui, Mengyuan Wang, Yizhe Zheng, and Lin Tang. 2019. "Spectroscopic Technique-Based Comparative Investigation on the Interaction of Theaflavins with Native and Glycated Human Serum Albumin" Molecules 24, no. 17: 3171. https://doi.org/10.3390/molecules24173171