The Effect of Pressure on Halogen Bonding in 4-Iodobenzonitrile

 , , , , , ,
Abstract
:
1. Introduction
2. Results and Discussion
2.1. Ambient Pressure Structure and the First Coordination Sphere
2.2. Response of Phase I to Pressure
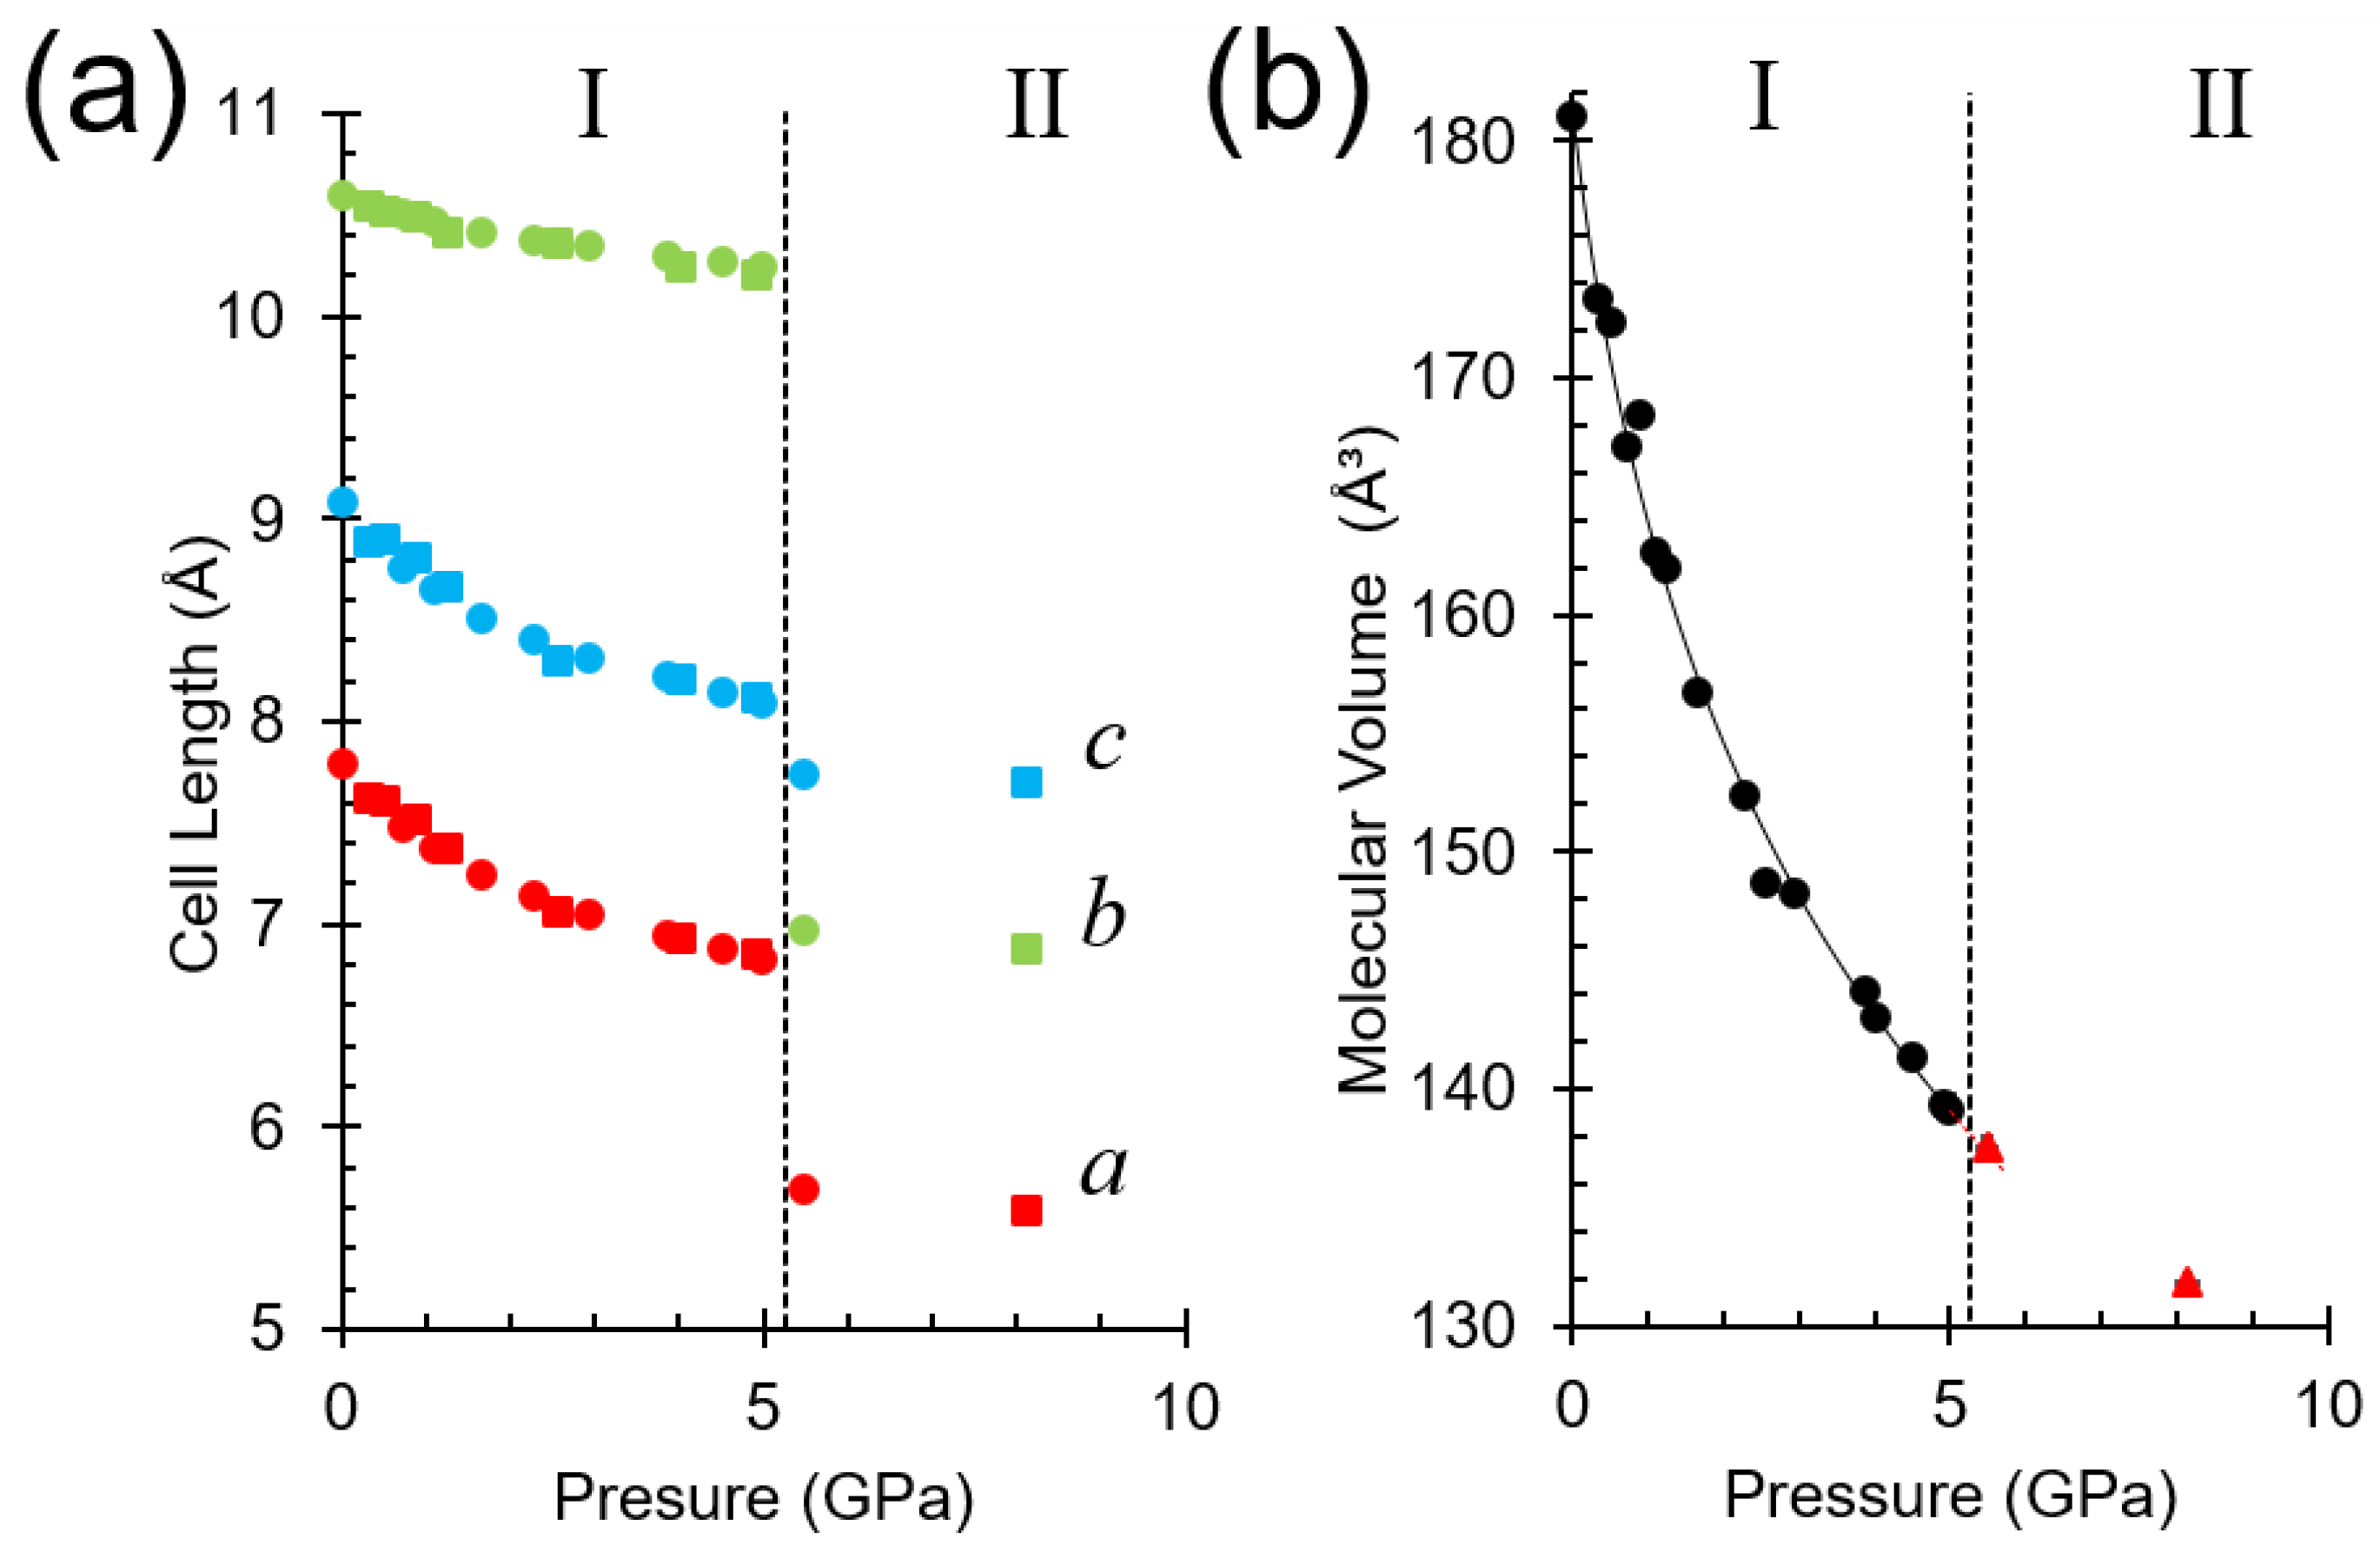
2.3. Unit Cell Compression
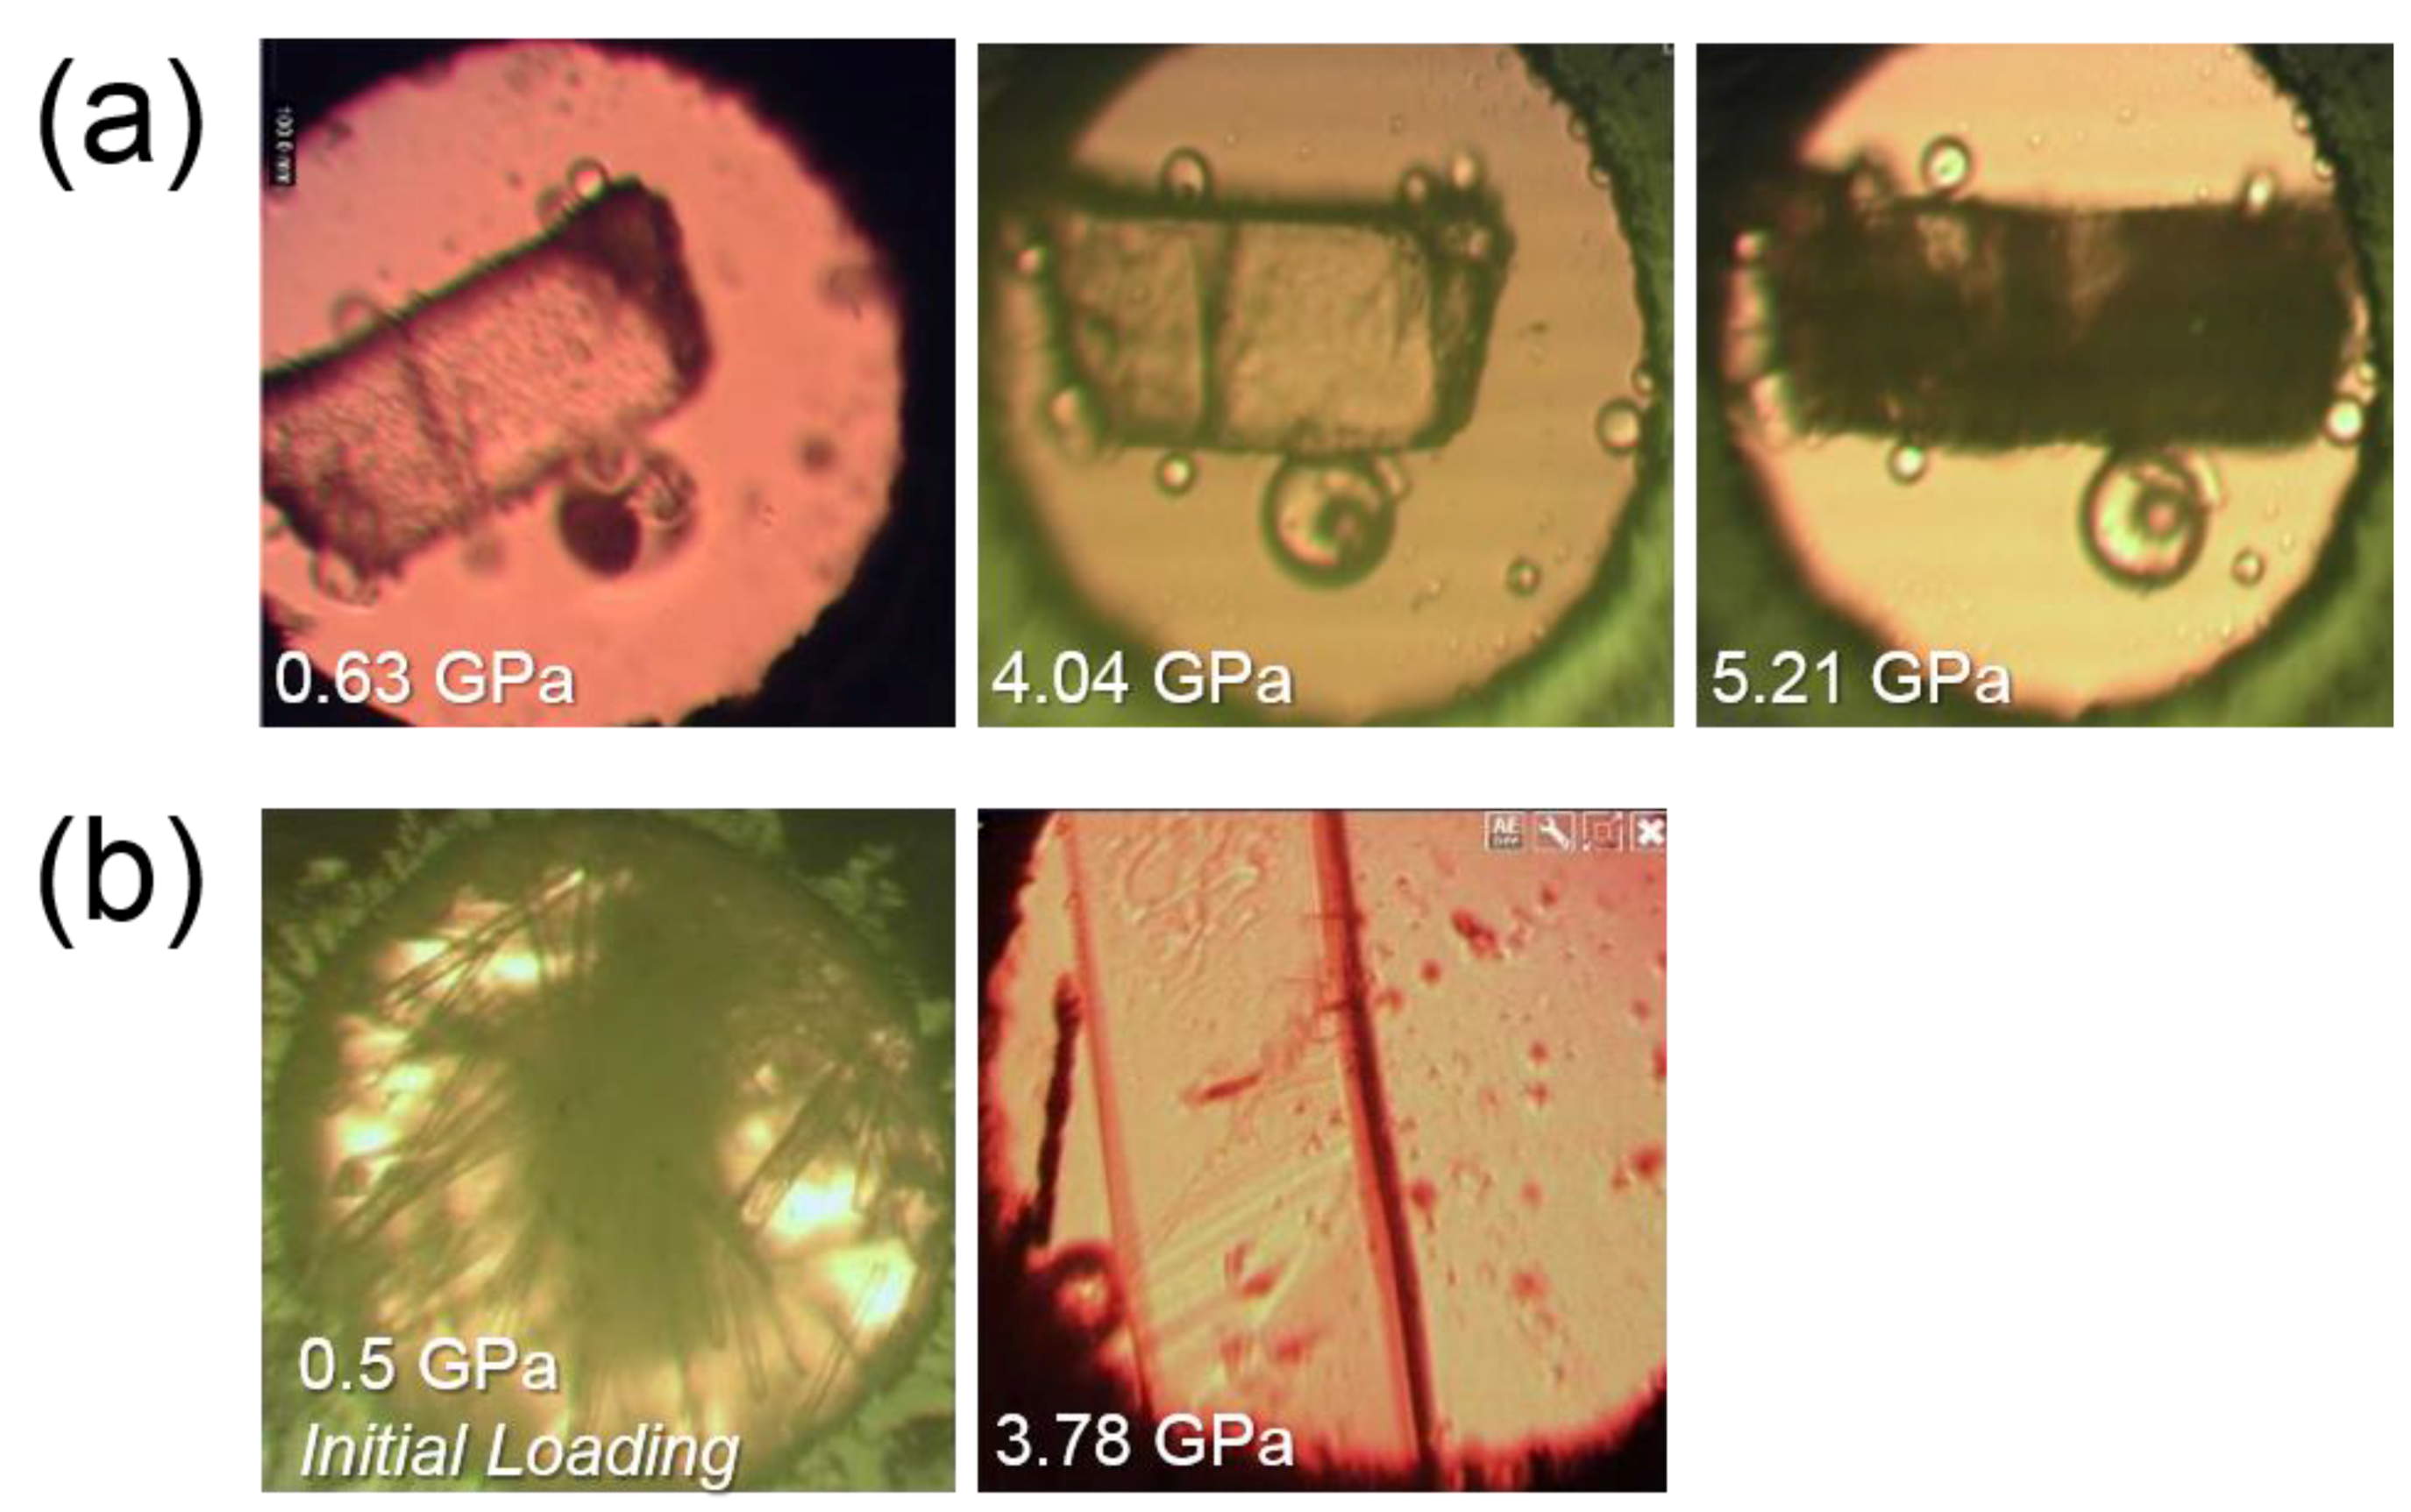
2.4. Formation of Phase II
2.5. The Crystal Structure of Phase II
2.6. The Driving Force of the Phase I-to-II Transition
3. Conclusions
4. Experimental
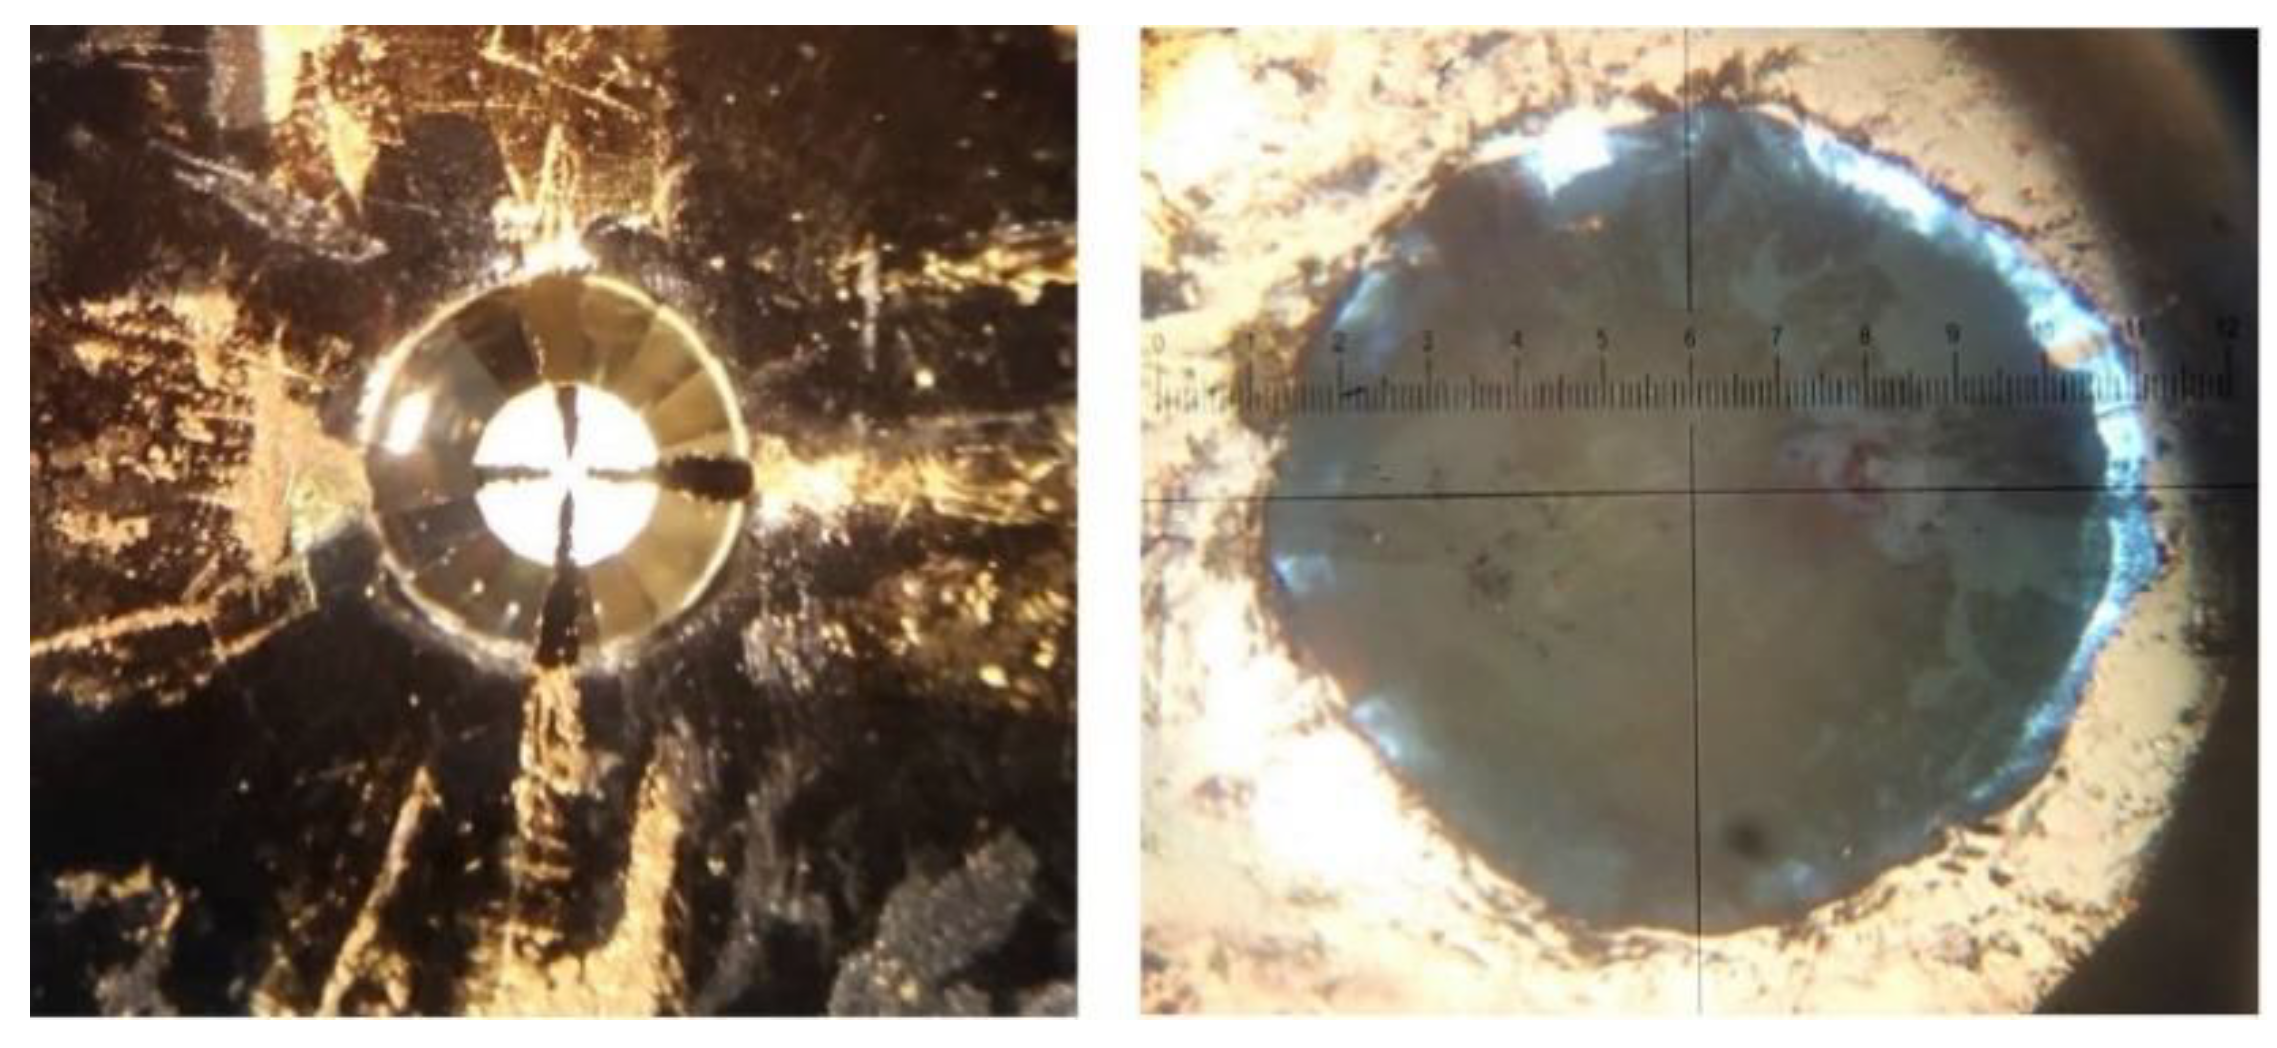
4.1. High-Pressure Experiments
4.2. Recrystallizations and Compression Conditions
4.3. Single Crystal X-ray Diffraction
4.4. Raman and UV-Vis Spectroscopy
4.5. High-Pressure Conductivity Measurements
4.6. PIXEL Energy Calculations
4.7. Periodic Density Functional Theory (DFT) Calculations
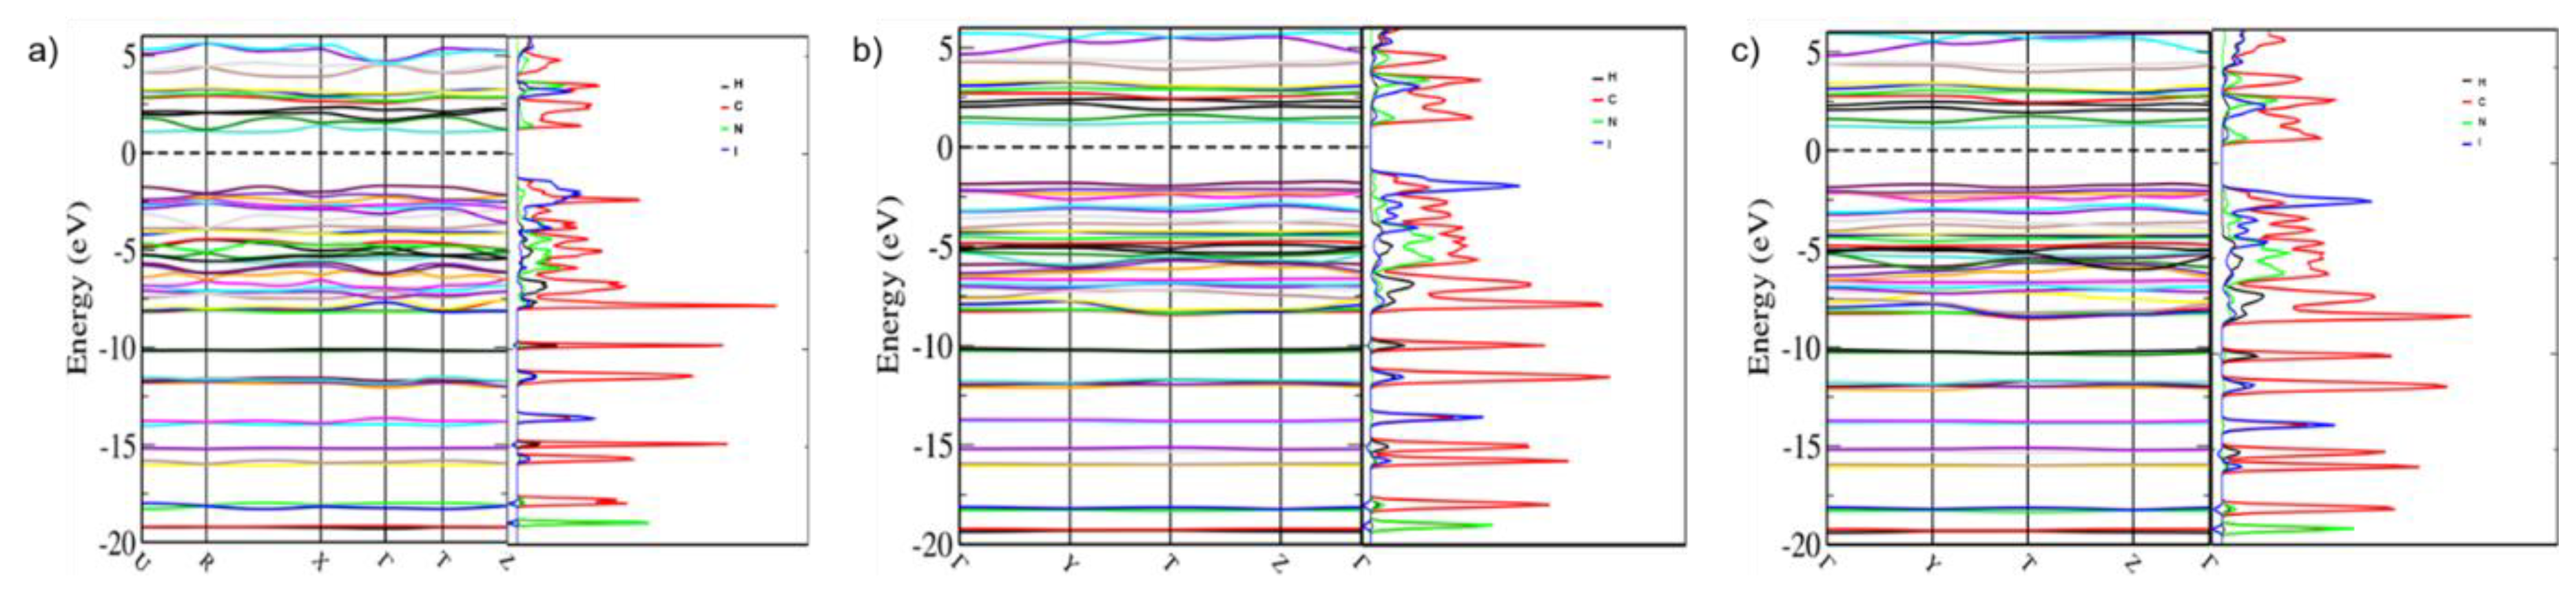
4.8. Band Structure Calculations
4.9. Other Programs Used
Supplementary Materials
Author Contributions
Funding
Acknowledgments
Conflicts of Interest
References
- Putkonen, M.-L.; Feld, R.; Vettier, C.; Lehmann, M.S. Powder neutron diffraction analysis of the hydrogen bonding in deutero-oxalic acid dihydrate at high pressures. Acta Crystallogr. Sect. B 1985, 41, 77–79. [Google Scholar] [CrossRef]
- Görbitz, C.H. Crystal structures of amino acids: From bond lengths in glycine to metal complexes and high-pressure polymorphs. Crystallogr. Rev. 2015, 21, 160–212. [Google Scholar] [CrossRef]
- Boldyreva, E.V. High-pressure diffraction studies of molecular organic solids. A personal view. Acta Crystallogr. Sect. A 2008, 64, 218–231. [Google Scholar] [CrossRef]
- Moggach, S.A.; Parsons, S.; Wood, P.A. High-pressure polymorphism in amino acids. Crystallogr. Rev. 2008, 14, 143–184. [Google Scholar] [CrossRef]
- Katrusiak, A. High-pressure X-ray diffraction study on the structure and phase transition of 1,3-cyclohexanedione crystals. Acta Crystallogr. Sect. B 1990, 46, 246–256. [Google Scholar] [CrossRef]
- Casati, N.; Macchi, P.; Sironi, A. Hydrogen migration in oxalic acid di-hydrate at high pressure? Chem. Commun. 2009, 2679–2681. [Google Scholar] [CrossRef] [PubMed]
- Macchi, P.; Casati, N.; Marshall, W.G.; Sironi, A. The alpha and beta forms of oxalic acid di-hydrate at high pressure: A theoretical simulation and a neutron diffraction study. CrystEngComm 2010, 12, 2596–2603. [Google Scholar] [CrossRef]
- Politzer, P.; Murray, J.S.; Clark, T. Halogen bonding and other σ-hole interactions: A perspective. Phys. Chem. Chem. Phys. 2013, 15, 11178–11189. [Google Scholar] [CrossRef]
- Olejniczak, A.; Katrusiak, A. Structure–property relations in chloroacetonitriles. CrystEngComm 2011, 13, 5212–5219. [Google Scholar] [CrossRef]
- Podsiadło, M.; Olejniczak, A.; Katrusiak, A. Halogen⋯halogen contra C–H⋯halogen interactions. CrystEngComm 2014, 16, 8279–8285. [Google Scholar] [CrossRef]
- Wesela-Bauman, G.; Parsons, S.; Serwatowski, J.; Wozniak, K. Effect of high pressure on the crystal structure and charge transport properties of the (2-fluoro-3-pyridyl)(4-iodophenyl)borinic 8-oxyquinolinate complex. CrystEngComm 2014, 16, 10780–10790. [Google Scholar] [CrossRef] [Green Version]
- Tian, D.; Winter, S.M.; Mailman, A.; Wong, J.W.L.; Yong, W.; Yamaguchi, H.; Jia, Y.; Tse, J.S.; Desgreniers, S.; Secco, R.A.; et al. The Metallic State in Neutral Radical Conductors: Dimensionality, Pressure and Multiple Orbital Effects. J. Am. Chem. Soc. 2015, 137, 14136–14148. [Google Scholar] [CrossRef] [Green Version]
- Wilhelm, C.; Boyd, S.A.; Chawda, S.; Fowler, F.W.; Goroff, N.S.; Halada, G.P.; Grey, C.P.; Lauher, J.W.; Luo, L.; Martin, C.D.; et al. Pressure-Induced Polymerization of Diiodobutadiyne in Assembled Cocrystals. J. Am. Chem. Soc. 2008, 130, 4415–4420. [Google Scholar] [CrossRef]
- Brinck, T.; Murray, J.S.; Politzer, P. Molecular surface electrostatic potentials and local ionization energies of Group V–VII hydrides and their anions: Relationships for aqueous and gas-phase acidities. International J. Quantum Chem. 1993, 48, 73–88. [Google Scholar] [CrossRef]
- Carlucci, L.; Gavezzotti, A. A quantitative measure of halogen bond activation in cocrystallization. Phys. Chem. Chem. Phys. 2017, 19, 18383–18388. [Google Scholar] [CrossRef] [PubMed]
- Politzer, P.; Murray, J.S.; Clark, T.; Resnati, G. The σ-hole revisited. Phys. Chem. Chem. Phys. 2017, 19, 32166–32178. [Google Scholar] [CrossRef]
- Clark, T.; Hennemann, M.; Murray, J.S.; Politzer, P. Halogen bonding: The σ-hole. J. Mol. Model. 2007, 13, 291–296. [Google Scholar] [CrossRef] [PubMed]
- Forni, A.; Metrangolo, P.; Pilati, T.; Resnati, G. Halogen bond distance as a function of temperature. Cryst. Growth Des. 2004, 4, 291–295. [Google Scholar] [CrossRef]
- Alvarez, S. A cartography of the van der Waals territories. Dalton Trans. 2013, 42, 8617–8636. [Google Scholar] [CrossRef] [Green Version]
- Riggleman, B.M.; Drickamer, H.G. Approach to the Metallic State as Obtained from Optical and Electrical Measurements. J. Chem. Phys. 1963, 38, 2721–2724. [Google Scholar] [CrossRef]
- Poręba, T.; Ernst, M.; Zimmer, D.; Macchi, P.; Casati, N. Pressure-Induced Polymerization and Electrical Conductivity of a Polyiodide. Angew. Chem. 2019, 131, 6697–6701. [Google Scholar] [CrossRef]
- Schlemper, E.O.; Britton, D. The crystal structure of p-iodobenzonitrile. Acta Crystallogr. 1965, 18, 419–424. [Google Scholar] [CrossRef]
- Desiraju, G.R.; Harlow, R.L. Cyano-halogen interactions and their role in the crystal structures of the 4-halobenzonitriles. J. Am. Chem. Soc. 1989, 111, 6757–6764. [Google Scholar] [CrossRef]
- Merz, K. Substitution Effect on Crystal Packings of Iodobenzonitriles and Iodophenols. Cryst. Growth Des. 2006, 6, 1615–1619. [Google Scholar] [CrossRef]
- Likhacheva, A.Y.; Rashchenko, S.V.; Chanyshev, A.D.; Inerbaev, T.M.; Litasov, K.D.; Kilin, D.S. Thermal equation of state of solid naphthalene to 13 GPa and 773 K: In situ X-ray diffraction study and first principles calculations. J. Chem. Phys. 2014, 140, 8. [Google Scholar] [CrossRef]
- Slebodnick, C.; Zhao, J.; Angel, R.; Hanson, B.E.; Song, Y.; Liu, Z.X.; Hemley, R.J. High pressure study of Ru3(CO)12 by X-ray diffraction, Raman, and infrared spectroscopy. Inorg. Chem. 2004, 43, 5245–5252. [Google Scholar] [CrossRef]
- Harty, E.L.; Ha, A.R.; Warren, M.R.; Thompson, A.L.; Allan, D.R.; Goodwin, A.L.; Funnell, N.P. Reversible piezochromism in a molecular wine-rack. Chem. Commun. 2015, 51, 10608–10611. [Google Scholar] [CrossRef]
- Funnell, N.P.; Bull, C.L.; Ridley, C.J.; Capelli, S. Structural behaviour of OP-ROY at extreme conditions. CrystEngComm 2019. [Google Scholar] [CrossRef]
- Eikeland, E.; Thomsen, M.K.; Madsen, S.R.; Overgaard, J.; Spackman, M.A.; Iversen, B.B. Structural Collapse of the Hydroquinone–Formic Acid Clathrate: A Pressure-Medium-Dependent Phase Transition. Chem. Eur. J. 2016, 22, 4061–4069. [Google Scholar] [CrossRef]
- Fortes, A.D.; Funnell, N.P.; Bull, C.L. Thermoelastic properties of deuterated melamine, C3N6D6, between 4.2-320 K at 5 kPa and between 0.1-5.0 GPa at 295 K from neutron powder diffraction and DFT calculations. High. Pressure Res. 2019, 39, 160–178. [Google Scholar] [CrossRef]
- Funnell, N.P.; Dawson, A.; Marshall, W.G.; Parsons, S. Destabilisation of hydrogen bonding and the phase stability of aniline at high pressure. CrystEngComm 2013, 15, 1047–1060. [Google Scholar] [CrossRef]
- Hutchison, I.B.; Delori, A.; Wang, X.; Kamenev, K.V.; Urquhart, A.J.; Oswald, I.D.H. Polymorphism of a polymer precursor: Metastable glycolide polymorph recovered via large scale high-pressure experiments. CrystEngComm 2015, 17, 1778–1782. [Google Scholar] [CrossRef]
- Abbas, N.; Oswald, I.D.H.; Pulham, C.R. Accessing Mefenamic Acid Form II through High-Pressure Recrystallisation. Pharmaceutics 2017, 9, 11. [Google Scholar] [CrossRef] [PubMed]
- Ward, M.R.; Younis, S.; Cruz-Cabeza, A.J.; Bull, C.L.; Funnell, N.P.; Oswald, I.D.H. Discovery and recovery of delta p-aminobenzoic acid. CrystEngComm 2019, 21, 2058–2066. [Google Scholar] [CrossRef] [Green Version]
- Casati, N.; Kleppe, A.; Jephcoat, A.P.; Macchi, P. Putting pressure on aromaticity along with in situ experimental electron density of a molecular crystal. Nat. Commun. 2016, 7, 8. [Google Scholar] [CrossRef]
- Angel, R.J.; Alvaro, M.; Gonzalez-Platas, J. EosFit7c and a Fortran module (library) for equation of state calculations. Z. Krist. -Cryst. Mater. 2014, 229, 405. [Google Scholar] [CrossRef]
- Taylor, R. Which intermolecular interactions have a significant influence on crystal packing? CrystEngComm 2014, 16, 6852–6865. [Google Scholar] [CrossRef]
- Satthaphut, N.; Sutcliffe, O.B.; Oswald, I.D.H. Putting the squeeze on mephedrone hydrogen sulfate. Z. Krist.-Cryst. Mater. 2014, 229, 101–111. [Google Scholar] [CrossRef] [Green Version]
- Wood, P.A.; Francis, D.; Marshall, W.G.; Moggach, S.A.; Parsons, S.; Pidcock, E.; Rohl, A.L. A study of the high-pressure polymorphs of L-serine using ab initio structures and PIXEL calculations. CrystEngComm 2008, 10, 1154–1166. [Google Scholar] [CrossRef]
- Rychkov, D.A.; Stare, J.; Boldyreva, E.V. Pressure-driven phase transition mechanisms revealed by quantum chemistry: L-serine polymorphs. Phys. Chem. Chem. Phys. 2017, 19, 6671–6676. [Google Scholar] [CrossRef]
- Wood, P.A.; Forgan, R.S.; Henderson, D.; Parsons, S.; Pidcock, E.; Tasker, P.A.; Warren, J.E. Effect of pressure on the crystal structure of salicylaldoxime-I, and the structure of salicylaldoxime-II at 5.93 GPa. Acta Crystallogr. Sect. B 2006, 62, 1099–1111. [Google Scholar] [CrossRef] [PubMed]
- Mao, H.K.; Bell, P.M.; Shaner, J.W.; Steinberg, D.J. Specific volume measurements of Cu, Mo, Pd, and Ag and calibration of the ruby R1 fluorescence pressure gauge from 0.06 to 1 Mbar. J. Appl. Phys. 1978, 49, 3276–3283. [Google Scholar] [CrossRef]
- Klotz, S.; Chervin, J.C.; Munsch, P.; Le Marchand, G. Hydrostatic limits of 11 pressure transmitting media. J. Phys. D Appl. Phys. 2009, 42, 7. [Google Scholar] [CrossRef]
- Parsons, S. ECLIPSE—Program for Masking High-pressure Diffraction Images and Conversion between CCD Image Formats; The University of Edinburgh: Edinburgh, UK, 2014. [Google Scholar]
- SAINT, Version 8.34A; Bruker, Bruker AXS Inc.: Madison, WI, USA, 2014.
- SADABS, Version 2014/15; Bruker, Bruker AXS Inc.: Madison, WI, USA, 2015.
- Sheldrick, G. SHELXT - Integrated space-group and crystal-structure determination. Acta Crystallogr. Sect. A 2015, 71, 3–8. [Google Scholar] [CrossRef]
- David, W.I.F.; Shankland, K.; van de Streek, J.; Pidcock, E.; Motherwell, W.D.S.; Cole, J.C. DASH: A program for crystal structure determination from powder diffraction data. J. Appl. Crystallogr. 2006, 39, 910–915. [Google Scholar] [CrossRef]
- Sheldrick, G. Crystal structure refinement with SHELXL. Acta Crystallogr. Sect. C 2015, 71, 3–8. [Google Scholar] [CrossRef]
- Hubschle, C.B.; Sheldrick, G.M.; Dittrich, B. ShelXle: A Qt graphical user interface for SHELXL. J. Appl. Crystallogr. 2011, 44, 1281–1284. [Google Scholar] [CrossRef]
- The Cambridge Crystallographic Data Centre. Available online: www.ccdc.cam.ac.uk/structures (accessed on 29 April 2019).
- Frisch, M.J.; Trucks, G.W.; Schlegel, H.B.; Scuseria, G.E.; Robb, M.A.; Cheeseman, J.R.; Scalmani, G.; Barone, V.; Petersson, G.A.; Nakatsuji, H.; et al. Gaussian 09, Revision E.01. Gaussian, Inc.: Wallingford, CT, USA, 2016.
- Gavezzotti, A. Calculation of lattice energies of organic crystals: The PIXEL integration method in comparison with more traditional methods. Z. Krist.-Cryst. Mater. 2005, 220, 499–510. [Google Scholar] [CrossRef]
- Gavezzotti, A. Efficient computer modeling of organic materials. The atom–atom, Coulomb–London–Pauli (AA-CLP) model for intermolecular electrostatic-polarization, dispersion and repulsion energies. New J. Chem. 2011, 35, 1360–1368. [Google Scholar] [CrossRef]
- Gavezzotti, A. Non-conventional bonding between organic molecules. The ‘halogen bond’ in crystalline systems. Mol. Phys. 2008, 106, 1473–1485. [Google Scholar] [CrossRef]
- Rocha, I.M.; Ribeiro da Silva, M.D.M.C.; Ribeiro da Silva, M.A.V. Thermodynamic and aromaticity studies for the assessment of the halogen⋯cyano interactions on Iodobenzonitrile. J. Chem. Thermodyn. 2013, 65, 204–212. [Google Scholar] [CrossRef]
- Clark, S.J.; Segall, M.D.; Pickard, C.J.; Hasnip, P.J.; Probert, M.J.; Refson, K.; Payne, M.C. First principles methods using CASTEP. Z. Krist. 2005, 220, 567–570. [Google Scholar] [CrossRef] [Green Version]
- Dassault Systèmes, BIOVIA, Version 2017; Materials Studio: San Diego, CA, USA, 2017.
- Perdew, J.P.; Burke, K.; Ernzerhof, M. Generalized Gradient Approximation Made Simple. Phys. Rev. Lett. 1996, 77, 3865–3868. [Google Scholar] [CrossRef] [Green Version]
- Monkhorst, H.J.; Pack, J.D. Special points for Brillouin-zone integrations. Phys. Rev. B 1976, 13, 5188–5192. [Google Scholar] [CrossRef]
- Tkatchenko, A.; Scheffler, M. Accurate Molecular Van Der Waals Interactions from Ground-State Electron Density and Free-Atom Reference Data. Phys. Rev. Lett. 2009, 102, 073005. [Google Scholar] [CrossRef]
- Gonze, X.; Charlier, J.C.; Allan, D.C.; Teter, M.P. Interatomic force constants from first principles: The case of alpha-quartz. Phys. Rev. B 1994, 50, 13035–13038. [Google Scholar] [CrossRef]
- Morris, A.J.; Nicholls, R.J.; Pickard, C.J.; Yates, J.R. OptaDOS: A tool for obtaining density of states, core-level and optical spectra from electronic structure codes. Comput. Phys. Commun. 2014, 185, 1477–1485. [Google Scholar] [CrossRef]
- Yates, J.R.; Wang, X.; Vanderbilt, D.; Souza, I. Spectral and Fermi surface properties from Wannier interpolation. Phys. Rev. B 2007, 75, 195121. [Google Scholar] [CrossRef] [Green Version]
- Dolomanov, O.V.; Bourhis, L.J.; Gildea, R.J.; Howard, J.A.K.; Puschmann, H. OLEX2: A complete structure solution, refinement and analysis program. J. Appl. Crystallogr. 2009, 42, 339–341. [Google Scholar] [CrossRef]
- Macrae, C.F.; Bruno, I.J.; Chisholm, J.A.; Edgington, P.R.; McCabe, P.; Pidcock, E.; Rodriguez-Monge, R.; Taylor, R.; van de Streek, J.; Wood, P.A. Mercury CSD 2.0: New features for the visualization and investigation of crystal structures. J. Appl. Crystallogr. 2008, 41, 466–470. [Google Scholar] [CrossRef]
- Spek, A. Structure validation in chemical crystallography. Acta Crystallogr. Sect. D 2009, 65, 148–155. [Google Scholar] [CrossRef]
- Bruno, I.J.; Cole, J.C.; Kessler, M.; Luo, J.; Motherwell, W.D.S.; Purkis, L.H.; Smith, B.R.; Taylor, R.; Cooper, R.I.; Harris, S.E.; et al. Retrieval of Crystallographically-Derived Molecular Geometry Information. J. Chem. Inf. Comput. Sci. 2004, 44, 2133–2144. [Google Scholar] [CrossRef]
- Bruno, I.J.; Cole, J.C.; Edgington, P.R.; Kessler, M.; Macrae, C.F.; McCabe, P.; Pearson, J.; Taylor, R. New software for searching the Cambridge Structural Database and visualizing crystal structures. Acta Crystallogr. Sect. B 2002, 58, 389–397. [Google Scholar] [CrossRef]
- Groom, C.R.; Bruno, I.J.; Lightfoot, M.P.; Ward, S.C. The Cambridge Structural Database. Acta Crystallogr. Sect. B 2016, 72, 171–179. [Google Scholar] [CrossRef]
Sample Availability: Samples of the compounds are not available from the authors. |


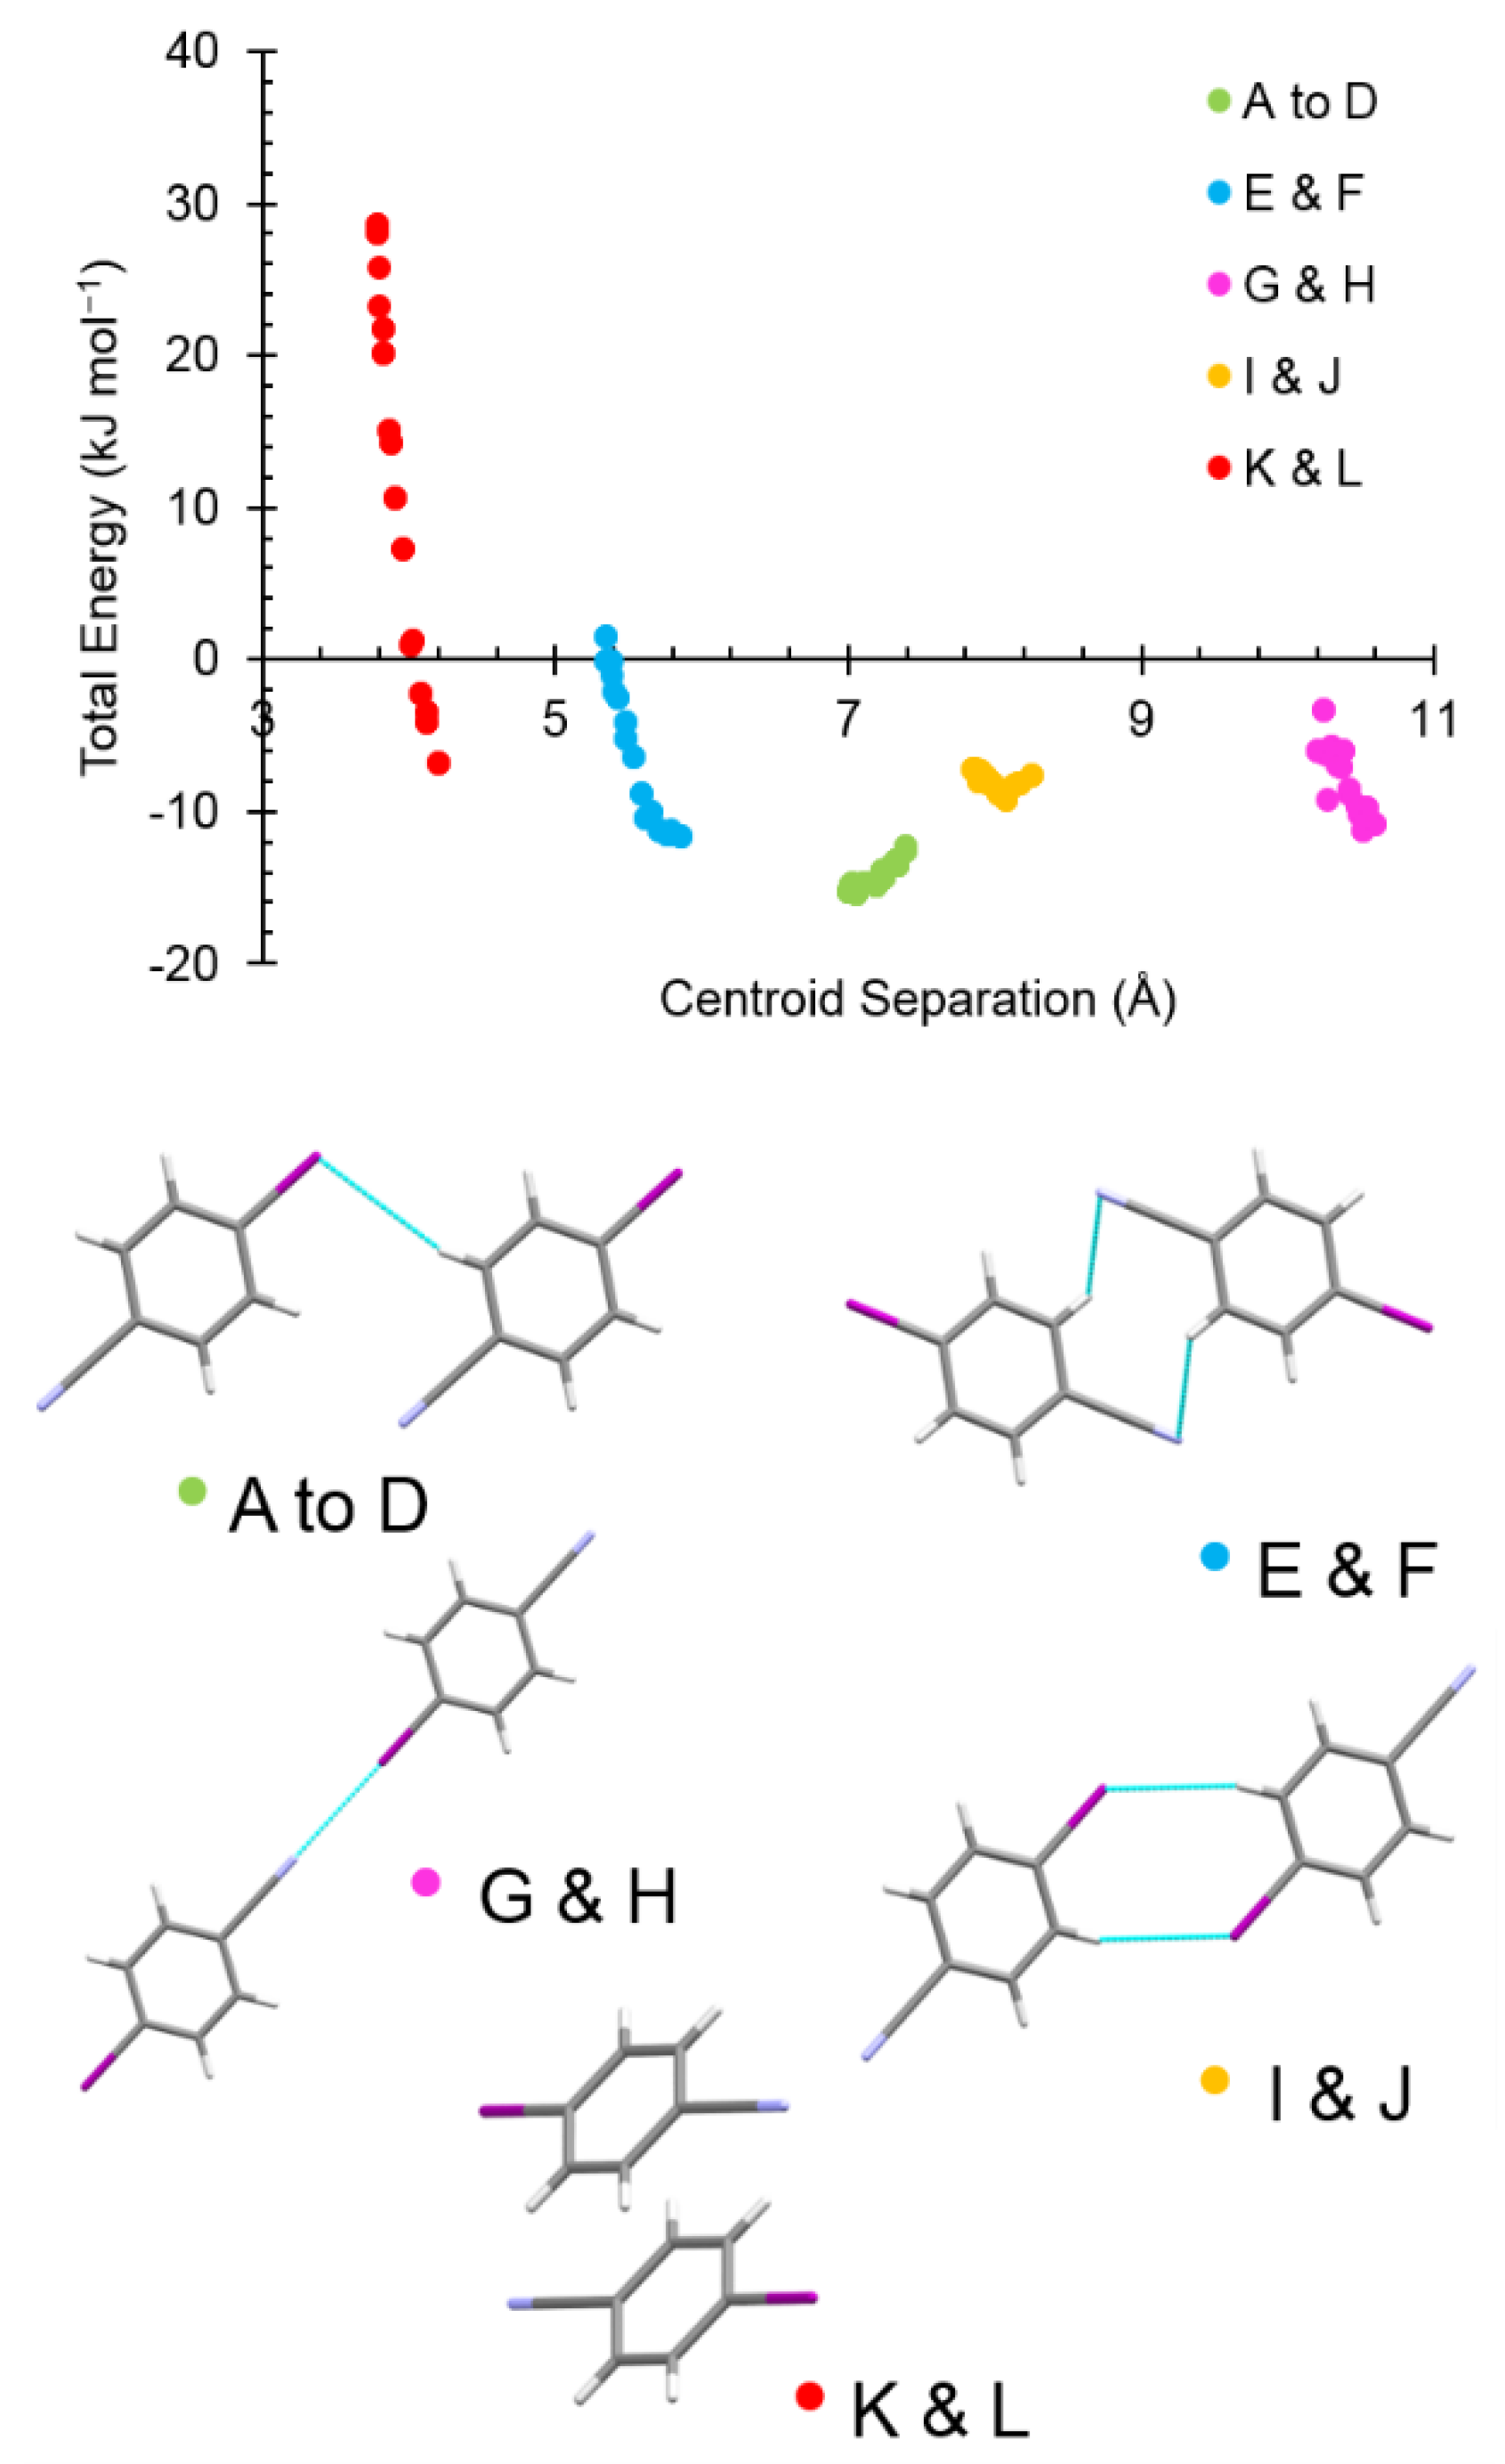
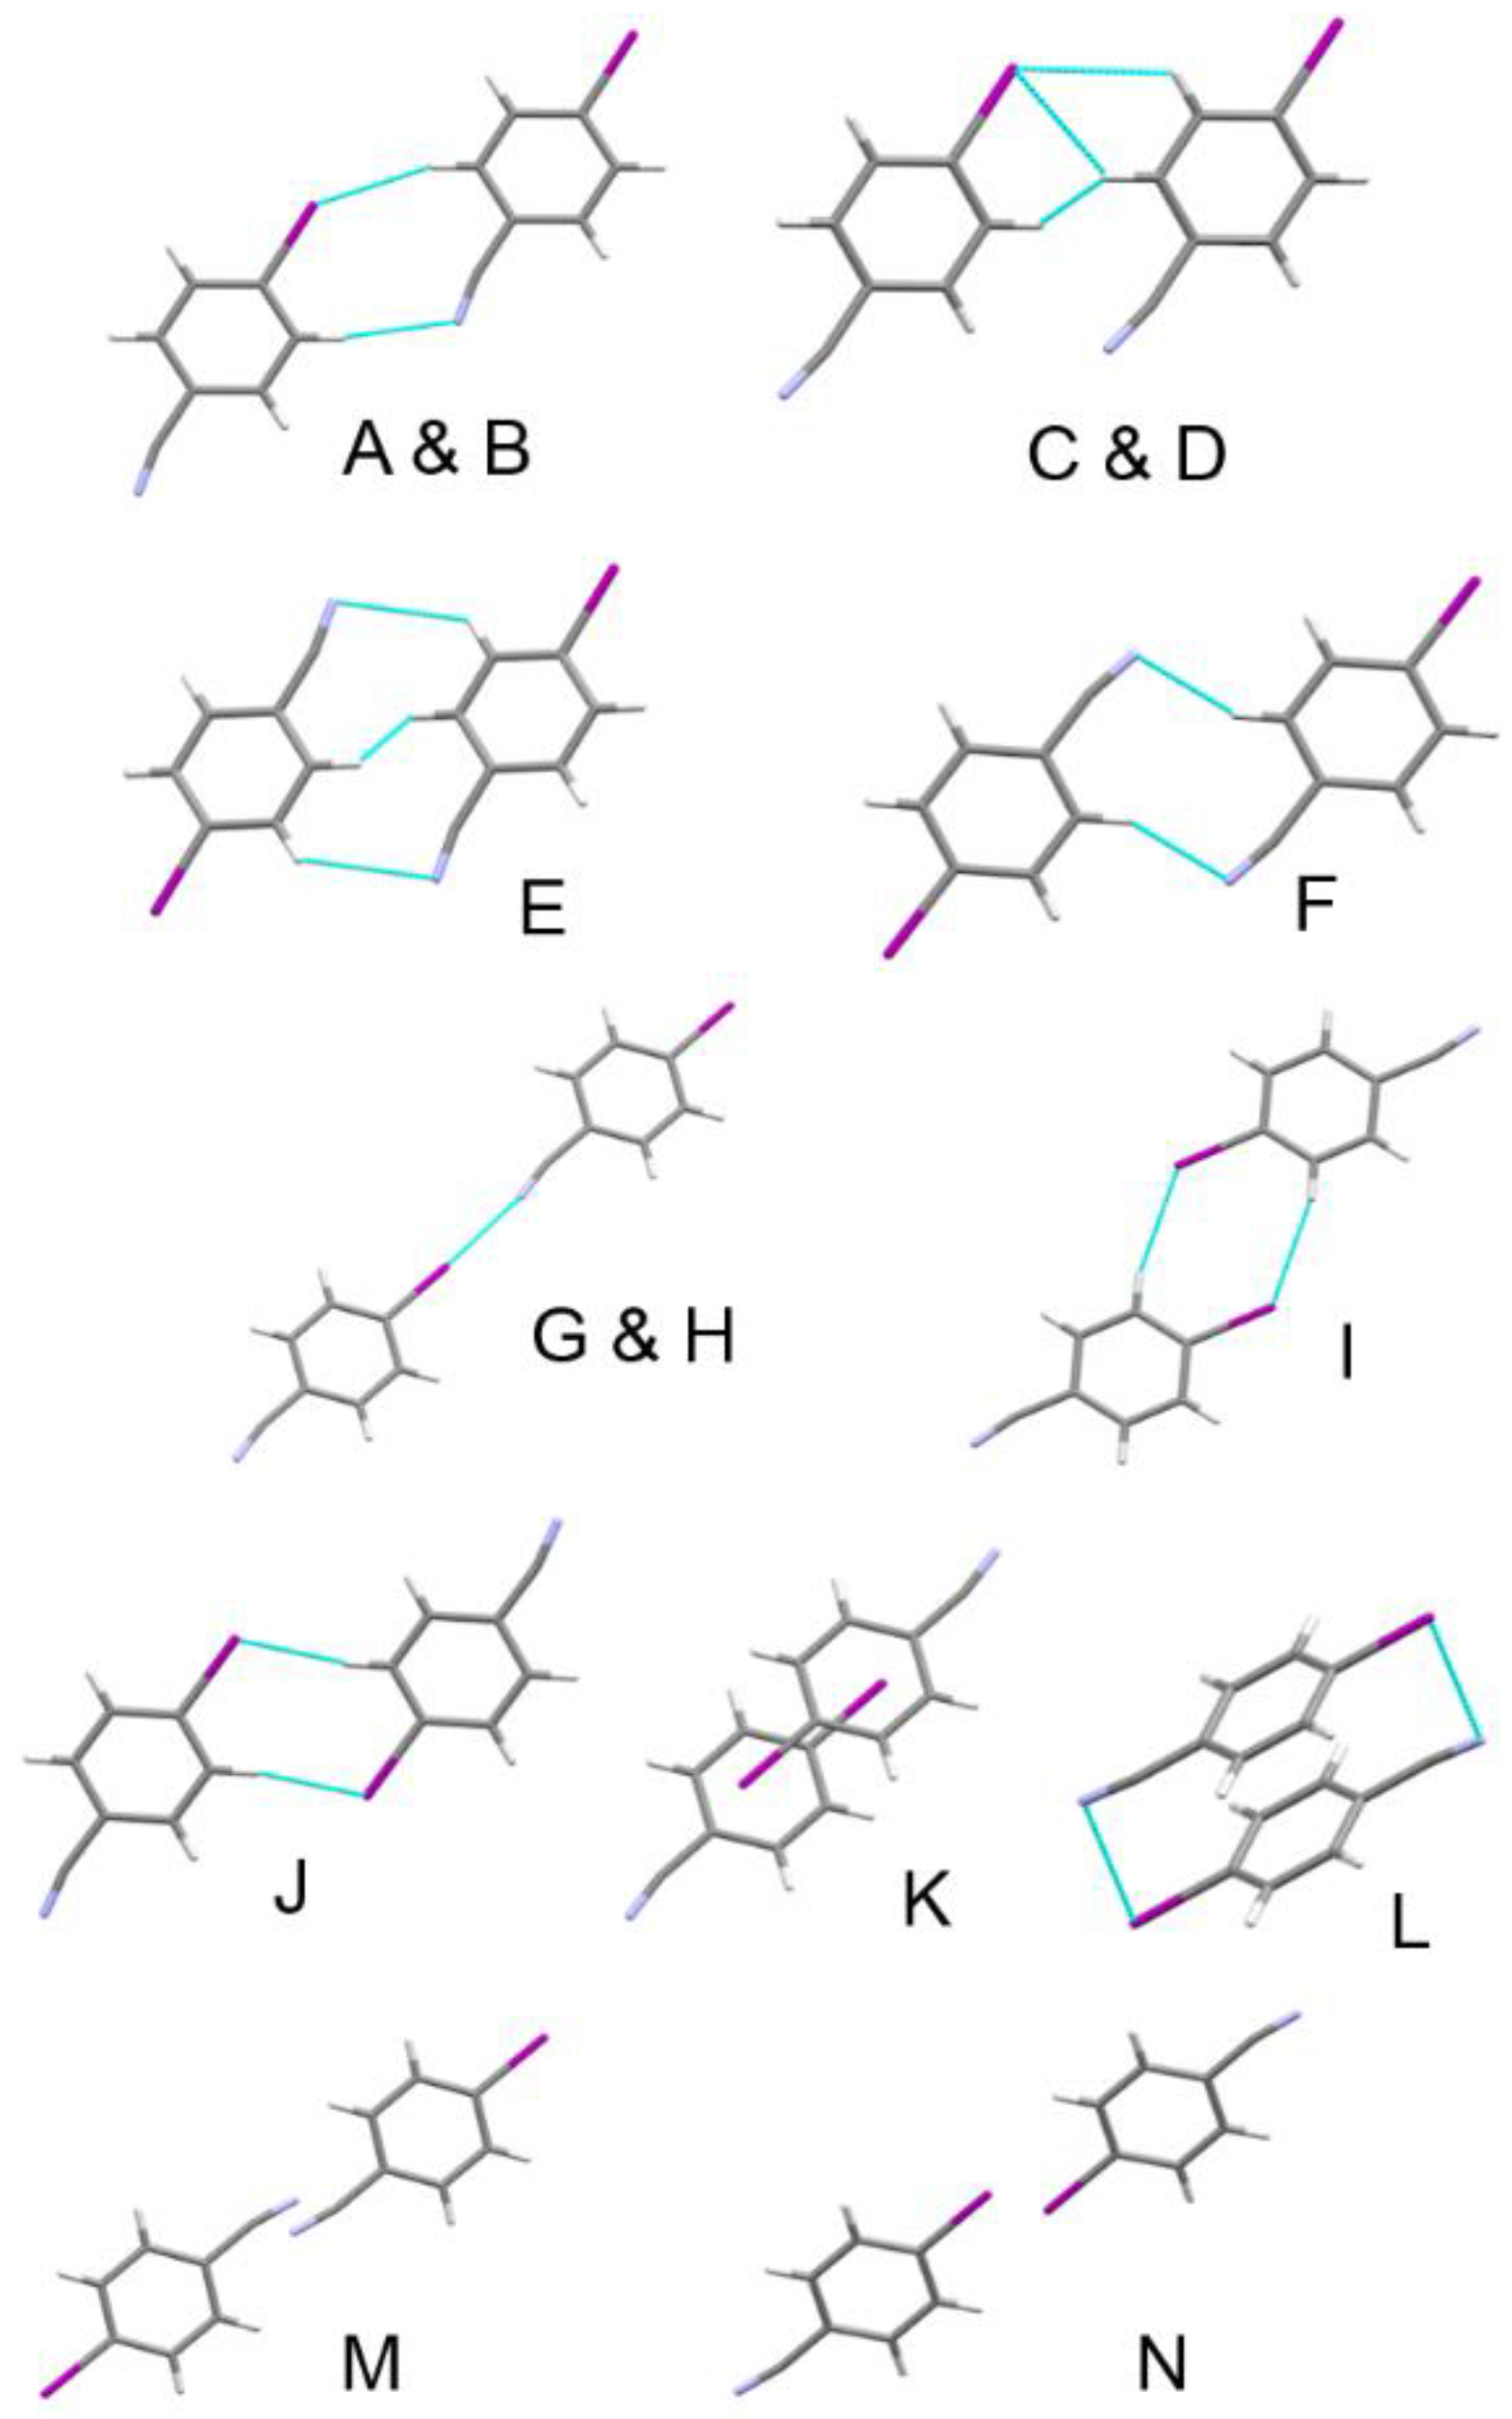
| Label | Centroid Distance (Å) | Symmetry | Coulombic | Polarization | Dispersion | Repulsion | Total | Contacts |
|---|---|---|---|---|---|---|---|---|
| A | 7.398 | −1/2+x,1/2+y,−1/2+z | −8.4 | −3.2 | −10.6 | 9.6 | −12.6 | I1∙∙∙H4C4 = 3.29 Å |
| B | 1/2+x,−1/2+y,1/2+z | |||||||
| C | −1/2+x,−1/2+y,−1/2+z | |||||||
| D | 1/2+x,1/2+y,1/2+z | |||||||
| E | 5.864 | 1/2−x,3/2−y,1/2−z | −7.6 | −3.1 | −12.6 | 11.6 | −11.7 | 2 × long N7∙∙∙H4C4 = |
| F | 1/2−x,3/2−y,3/2−z | 2 × 3.27 Å | ||||||
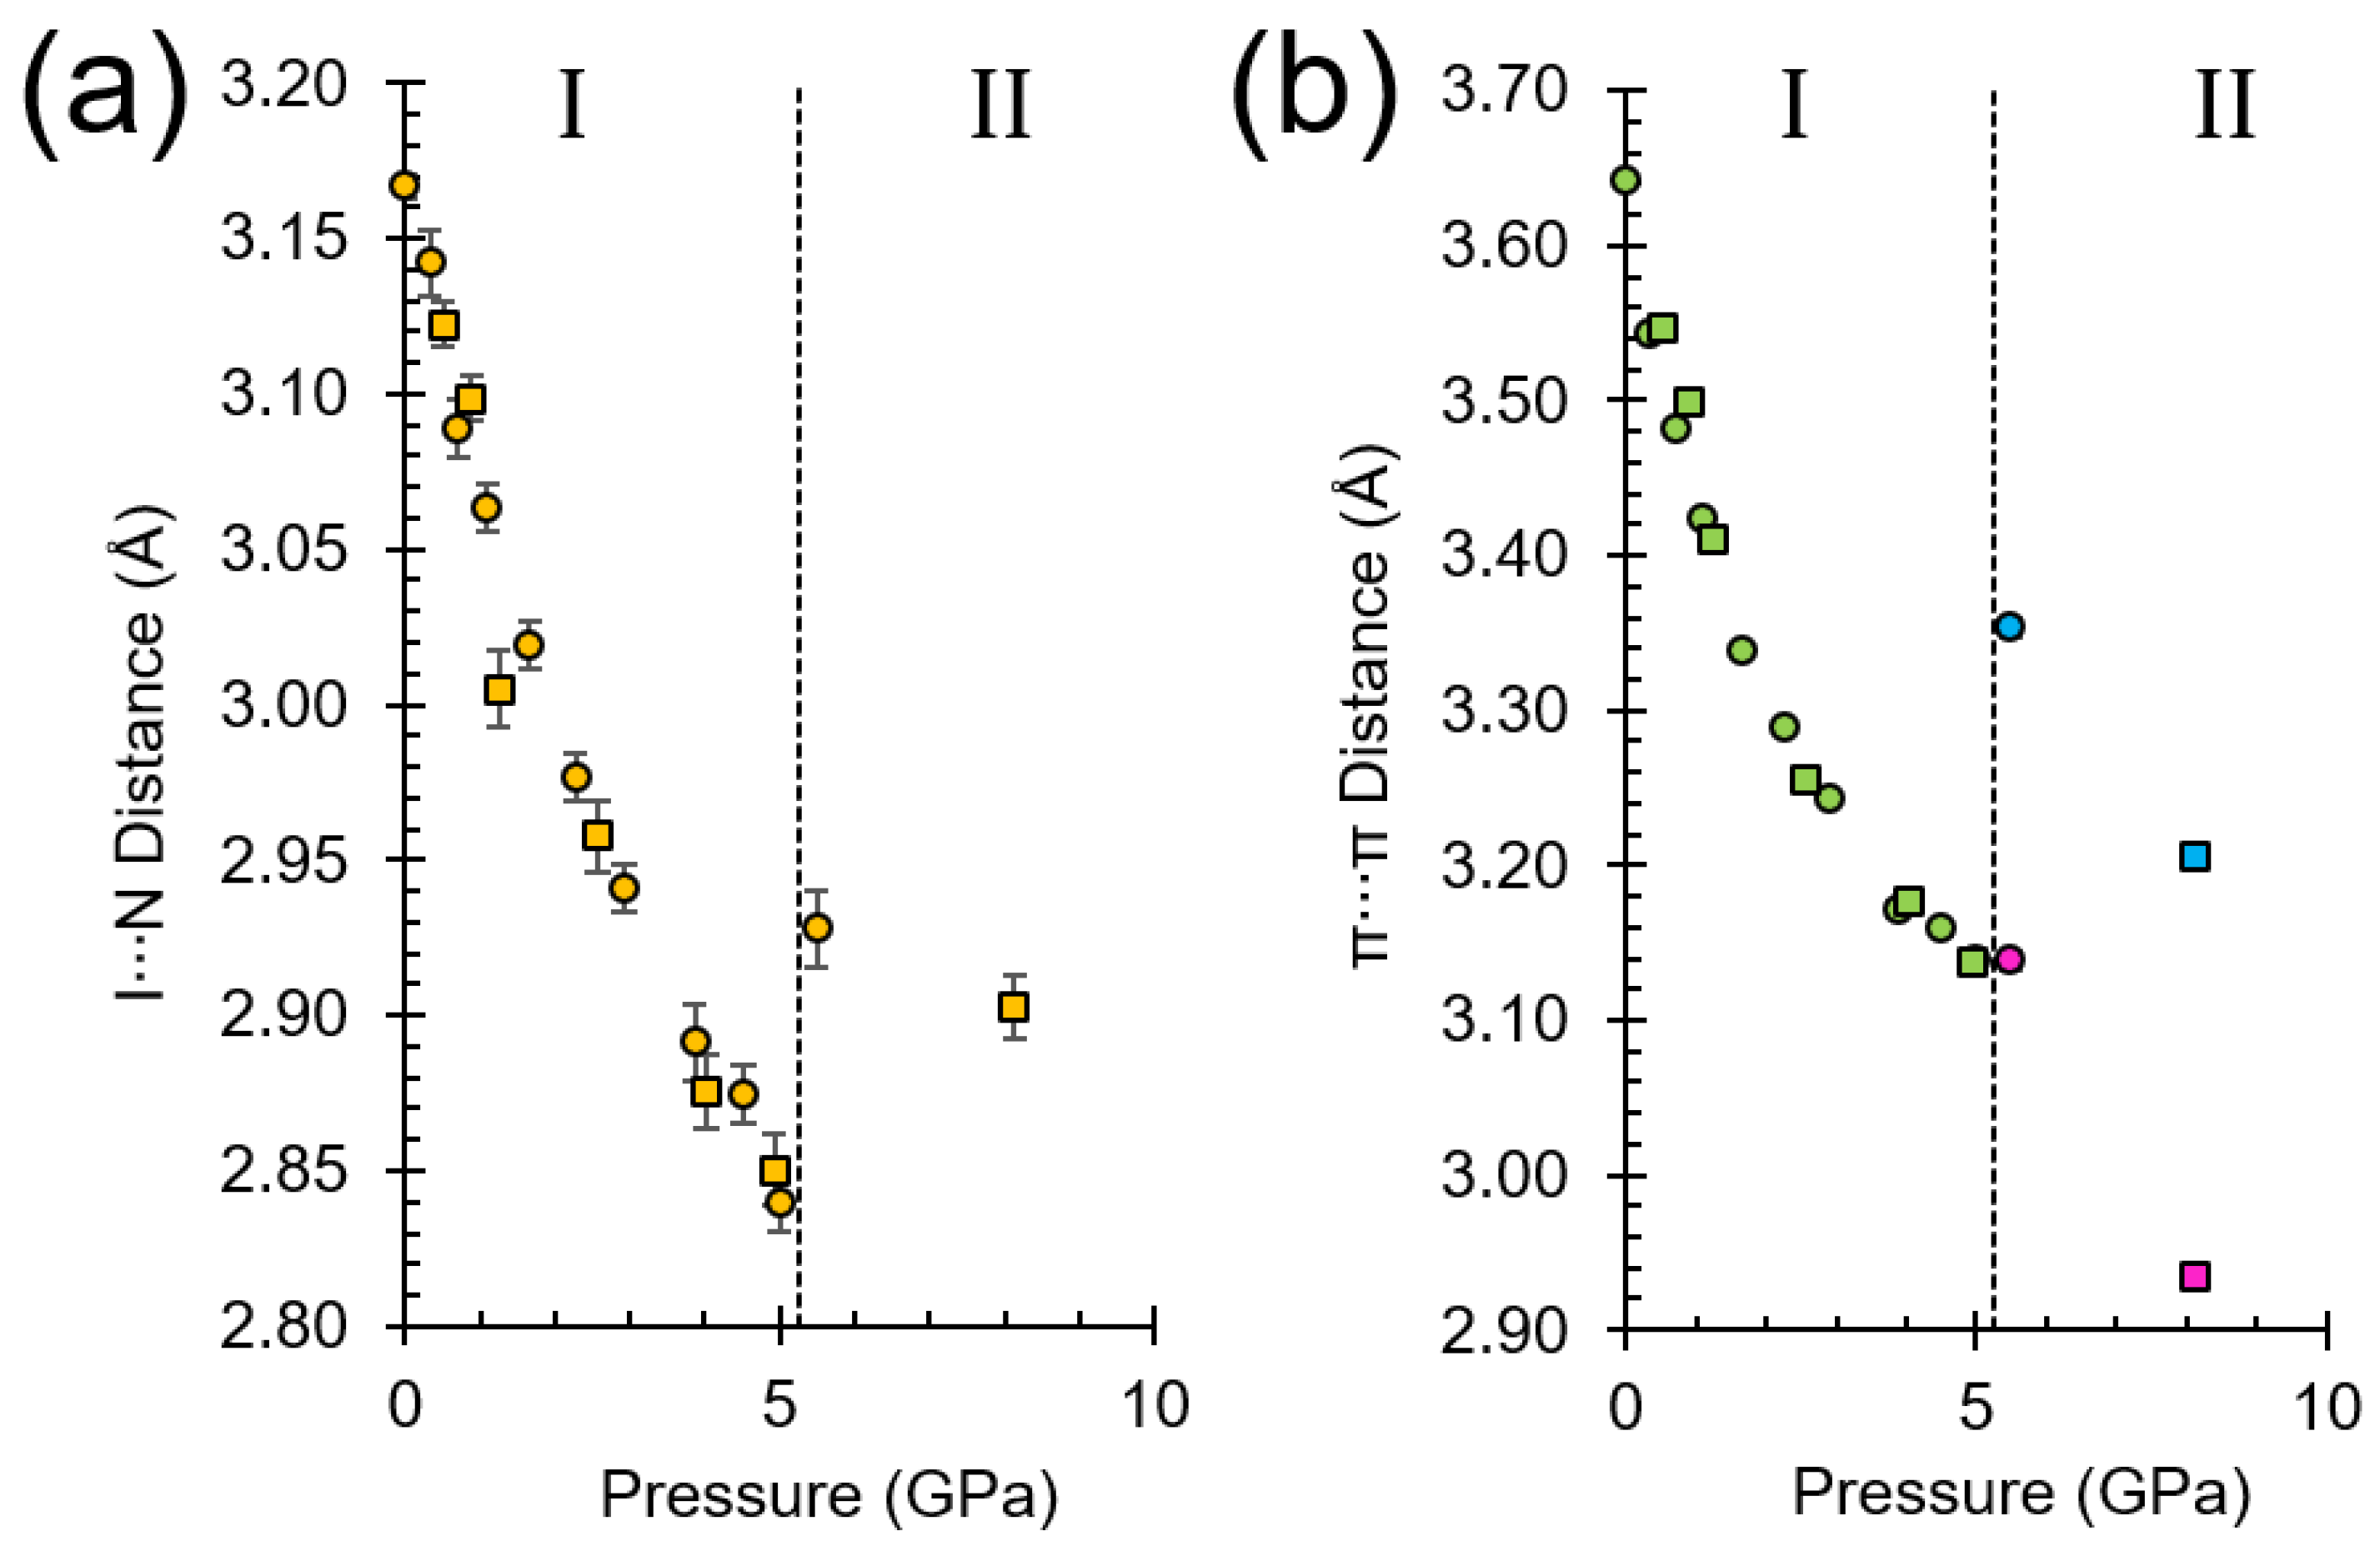
| G | 10.592 | x,−1+y,z | −19.0 | −6.6 | −8.8 | 23.6 | −10.8 | I1∙∙∙N7 = 3.168(4) Å |
| H | x,1+y,z | |||||||
| I | 8.248 | 1/2−x,1/2−y,1/2−z | −5.4 | −2.0 | −12.5 | 12.3 | −7.6 | 2 × long I1∙∙∙H3C3 = |
| J | 1/2−x,1/2−y,3/2−z | 2 × 3.59 Å | ||||||
| K | 4.205 | 1−x,1−y,1−z | −15.7 | −5.8 | −30.9 | 45.6 | −6.8 | Cg∙∙∙Cg = 4.040(2) Å |
| L | −x,1−y,1−z |
| Label | Centroid Distance (Å) | Symmetry | Coulombic | Polarization | Dispersion | Repulsion | Total | Contacts |
|---|---|---|---|---|---|---|---|---|
| A | 7.009 | −1/2+x,1/2+y, −1/2+z | −19.5 | −10.7 | −20.3 | 35.6 | −14.9 | I1∙∙∙H4 = 2.88 Å & |
| B | 1/2+x, −1/2+y,1/2+z | N7∙∙∙H3 = 2.83 Å | ||||||
| C | −1/2+x, −1/2+y, −1/2+z | |||||||
| D | 1/2+x,1/2+y,1/2+z | |||||||
| E | 5.349 | 1/2−x,3/2−y,1/2−z | −28.0 | −14.6 | −29.6 | 73.7 | 1.5 | 2 × long N7∙∙∙H3C3 = 2 × 2.90 Å |
| F | 1/2−x,3/2−y,3/2−z | 2 × N7∙∙∙H4C4 = 2 × 2.84 Å | ||||||
| G | 10.239 | x, −1+y,z | −43.7 | −17.5 | −15.3 | 73.2 | −3.3 | I1∙∙∙N7 = 2.840(1) Å |
| H | x,1+y,z | |||||||
| I | 7.862 | 1/2−x,1/2−y,1/2−z | −24.0 | −10.4 | −27.4 | 54.4 | −7.4 | 2 × I1∙∙∙H3C3 = 2 × 3.09 Å |
| J | 1/2−x, 1/2−y, 3/2−z | |||||||
| K | 3.781 | 1−x,1−y,1−z | −78.7 | −28.4 | −65.2 | 200.4 | 28.1 | Cg∙∙∙Cg = 3.593(6) Å |
| L | −x,1−y 1−z |
| Label | Centroid Distance (Å) | Symmetry | Coulombic | Polarization | Dispersion | Repulsion | Total | Contacts |
|---|---|---|---|---|---|---|---|---|
| A | 7.728 | x,y,1+z | −17.8 | −8.9 | −18.3 | 32.6 | −12.5 | I1∙∙∙H4 = 2.94 Å & |
| B | x,y,−1+z | N7∙∙∙H9 = 2.77 Å | ||||||
| C | 5.692 | −1+x,y,z | −37.5 | −17.4 | −40.7 | 98.6 | 3.0 | I1∙∙∙H8C8/H9C9 = 2.98/3.07 Å & |
| D | 1+x,y,z | H3∙∙∙H8 = 2.38 Å | ||||||
| E | 5.242 | 2−x, 1−y,1−z | −25.4 | −15.1 | −31.2 | 71.6 | −0.1 | 2 × N7∙∙∙H3 = 2 × 2.88 Å & |
| H4∙∙∙H8 = 2 × 2.44 Å | ||||||||
| F | 6.474 | 3−x,−y,1−z | −24.3 | −9.4 | −18.5 | 34.0 | −18.2 | 2 × N7∙∙∙H8 = 2 × 2.50 Å |
| G | 10.292 | −1+x,y,−1+z | −33.9 | −13.7 | −13.2 | 55.3 | −5.6 | I1∙∙∙N7 = 2.928(10) Å |
| H | 1+x,y,1+z | |||||||
| I | 8.287 | 1−x,1−y,−z | −14.9 | −8.6 | −23.8 | 41.1 | −6.3 | 2 × I1∙∙∙H3 = 2 × 3.09 Å |
| J | 7.240 | 2−x,−y,−z | −29.8 | −17 | −31.1 | 72.6 | −5.2 | 2 × I1∙∙∙H9 = 2 x2.87 Å |
| K | 4.894 | 2−x,1−y,−z | −70.5 | −23.6 | −56.8 | 172.5 | 21.6 | 2 × I1∙∙∙Cg = 3.38(2) |
| L | 3.337 | 2−x,−y,1−z | −59.6 | −24.2 | −57.7 | 188.3 | 46.7 | Cg∙∙∙Cg = 3.530(8) Å & |
| I1∙∙∙N7 = 3.33(2) Å | ||||||||
| M | 7.832 | 3−x,1−y,1−z | −1.8 | −0.7 | −2.6 | 0.6 | −4.4 | long N7∙∙∙N7 = 4.10(4) Å |
| N | 10.011 | 1−x,−y,−z | −4.6 | −1.4 | −7.3 | 11.8 | −1.5 | long I1∙∙∙I1 = 4.241(7) Å |
| Phase I at 5.5 GPa | Phase II at 5.5 GPa | Δ(II-I) | ||||
|---|---|---|---|---|---|---|
| Contact | Distance | Total Energy | Contact | Distance | Total Energy | |
| A | 6.984 | −13.8 | A | 7.728 | −12.2 | 1.6 |
| B | 6.984 | −13.8 | B | 7.728 | −12.2 | 1.6 |
| C | 6.984 | −13.5 | C | 5.692 | 1.2 | 14.7 |
| D | 6.984 | −13.5 | D | 5.692 | 1.2 | 14.7 |
| E | 5.381 | 3.4 | E | 5.296 | −4.9 | −8.3 |
| F | 5.382 | 2.5 | F | 6.606 | −18.6 | −21.1 |
| G | 10.22 | −0.1 | G | 10.292 | −6.3 | −6.2 |
| H | 10.22 | −3.7 | H | 10.292 | −6.3 | −2.6 |
| I | 7.774 | −5.3 | I | 8.145 | −6.1 | −0.8 |
| J | 7.774 | −5.3 | J | 7.158 | −4.9 | 0.4 |
| K | 3.729 | 33.1 | K | 4.805 | 16.8 | −16.3 |
| L | 3.729 | 35.3 | L | 3.375 | 50.4 | 15.1 |
| M | 7.962 | −3.7 | −3.7 | |||
| N | 9.878 | −2.0 | −2.0 | |||
| Totals | 5.3 | −7.6 | −12.9 | |||
| Pressure (GPa) | 0.00 | 5.00 | 5.49 |
|---|---|---|---|
| Phase | I | I | II |
| Crystal data | |||
| Crystal system, space group | Monoclinic, I2/a | Monoclinic, I2/a | Triclinic, |
| a, b, c (Å) | 7.788 (2), 10.592 (3), 9.086 (3) | 6.8316 (3), 10.2395 (6), 8.0931 (18) | 5.692 (5), 6.9674 (11), 7.7283 (12) |
| α, β, γ (°) | 90, 104.934 (9), 90 | 90, 100.696 (7), 90 | 65.412 (13), 80.98 (4), 87.77 (3) |
| V (Å3) | 724.2 (4) | 556.29 (13) | 275.1 (3) |
| Z | 4 | 4 | 2 |
| Radiation type | Synchrotron, λ = 0.7749 Å | Mo Kα | Synchrotron, λ = 0.7749 Å |
| µ (mm−1) | 5.39 | 5.63 | 7.09 |
| Crystal size (mm) | 0.20 × 0.02 × 0.02 | 0.20 × 0.10 × 0.10 | 0.1 × 0.1 × 0.1 |
| Diffractometer | Bruker D8 with Photon II detector | Bruker APEX 2 | Bruker D8 with Photon II detector |
| Tmin, Tmax | 0.533, 0.746 | 0.601, 0.745 | 0.390, 0.745 |
| No. of measured, independent and observed [I > 2σ(I)] reflections | 3052, 741, 703 | 1028, 192, 189 | 549, 236, 197 |
| Rint | 0.027 | 0.039 | 0.041 |
| (sin θ/λ)max (Å−1) | 0.626 | 0.622 | 0.575 |
| R1[F2 > 2σ(F2)], wR2(F2), S | 0.016, 0.038, 1.13 | 0.043, 0.114, 1.19 | 0.111, 0.293, 1.34 |
| No. of parameters | 44 | 22 | 30 |
| No. of restraints | 0 | 13 | 34 |
| Δρmax, Δρmin (e Å−3) | 0.22, −0.53 | 1.19, −0.56 | 1.87, −1.16 |
© 2019 by the authors. Licensee MDPI, Basel, Switzerland. This article is an open access article distributed under the terms and conditions of the Creative Commons Attribution (CC BY) license (http://creativecommons.org/licenses/by/4.0/).
Share and Cite
Giordano, N.; Afanasjevs, S.; Beavers, C.M.; Hobday, C.L.; Kamenev, K.V.; O’Bannon, E.F.; Ruiz-Fuertes, J.; Teat, S.J.; Valiente, R.; Parsons, S. The Effect of Pressure on Halogen Bonding in 4-Iodobenzonitrile. Molecules 2019, 24, 2018. https://doi.org/10.3390/molecules24102018
Giordano N, Afanasjevs S, Beavers CM, Hobday CL, Kamenev KV, O’Bannon EF, Ruiz-Fuertes J, Teat SJ, Valiente R, Parsons S. The Effect of Pressure on Halogen Bonding in 4-Iodobenzonitrile. Molecules. 2019; 24(10):2018. https://doi.org/10.3390/molecules24102018
Chicago/Turabian StyleGiordano, Nico, Sergejs Afanasjevs, Christine M. Beavers, Claire L. Hobday, Konstantin V. Kamenev, Earl F. O’Bannon, Javier Ruiz-Fuertes, Simon J. Teat, Rafael Valiente, and Simon Parsons. 2019. "The Effect of Pressure on Halogen Bonding in 4-Iodobenzonitrile" Molecules 24, no. 10: 2018. https://doi.org/10.3390/molecules24102018