Efficient Degradation of High-Molecular-Weight Hyaluronic Acid by a Combination of Ultrasound, Hydrogen Peroxide, and Copper Ion

School of Pharmaceutical Sciences, State Key Laboratory of Materials-Oriented Chemical Engineering, Nanjing Tech University, Nanjing 210009, China
*
Author to whom correspondence should be addressed.
Molecules 2019, 24(3), 617; https://doi.org/10.3390/molecules24030617
Submission received: 1 January 2019
/
Revised: 1 February 2019
/
Accepted: 6 February 2019
/
Published: 11 February 2019
(This article belongs to the Section Macromolecular Chemistry)
Abstract
:Hyaluronic acid (HA) was depolymerized by a combination of ultrasound, hydrogen peroxide and copper ion. The structures of high-molecular-weight hyaluronic acid (HMW-HA) and low-molecular-weight hyaluronic acid (LMW-HA) were determined by Fourier transform infrared (FTIR) spectroscopy, circular dichroism (CD) spectroscopy, and UV-VIS absorption spectroscopy. The degradations of HMW-HA using a physical method, a chemical method, and a combination of physical and chemical method were compared. The results show that HA can be effectively degraded by a combinatorial method involving ultrasound, hydrogen peroxide, and copper ion. Under the degradation conditions of 50 mM H2O2, 5.0 μM CuCl2, 160 W, pH 4.0, and reaction at 50 °C for 30 min, the content of glucuronic acid was 36.56%, and the yield of LMW-HA was 81.71%. The FTIR, CD, and UV-VIS absorption spectra of HA did not change with the decrease in molecular weight, indicating that the structure of HA remained intact during the degradation.
1. Introduction
Hyaluronic acid (HA) is a linear polysaccharide consisting of two alternating units, β-1,4-d-glucuronic acid and β-1,3-N-acetyl-d-glucosamine; HA is the main component of extracellular matrix [1,2]. HA is also present in the skin, joints, and cornea at high concentrations. HA is a homogeneous polymer, and the molecular size is widely distributed (105–107 Da). High-molecular-weight hyaluronic acid (HMW-HA) inhibits cell proliferation, migration of vascular endothelial cell, and angiogenesis, whereas low-molecular-weight hyaluronic acid (LMW-HA) with completely different physiological functions promotes the adhesion and proliferation of endothelial cells [3,4,5,6].
The molecular weight of hyaluronic acid usually exceeds 106 Da. Various methods have been reported to produce LMW-HA, including chemical degradation, physical degradation, and enzymatic degradation [7,8,9]. Methods of chemical degradation mainly include acid hydrolysis, alkaline hydrolysis, and oxidative degradation [10,11,12]. Acid, alkali, and oxidant react with HMW-HA at different reaction sites. Thus, the glycosidic bond is broken, and HA is degraded. In some oxidative degradation systems, metal catalysts are also added to increase the activity of radicals such as OH·, O·, and H·. Using a system containing H2O2 plus CuCl2, the dynamic viscosity of the HA solution indicated that the degradation of biopolymer decreased faster than the system containing only H2O2 [13]. Ultrasonication is a common method of physical degradation to obtain LMW-HA. Ultrasonic irradiation may decrease the molecular weight, viscosity, molecular radius, and pH of HA [14]. In this study, H2O2, CuCl2, and ultrasonication were first combined and used to degrade HMW-HA. The molecular weight of HA was measured by size exclusion chromatography coupled with a multiangle laser light scattering photometer (SEC-MALLS). The effects of degradation methods on the HA structure were observed by FT-IR, circular dichroism (CD), and UV-VIS absorption spectroscopy.
2. Results and Discussion
2.1. Effects of Different Degradation Conditions
2.1.1. Effects of Hydrogen Peroxide Concentration on HA Degradation
In the reaction system, hydrogen peroxide would produce free radicals such as H·, O·, and OH·. Through the action of free radicals with the molecular chains of HA, the reaction sites are activated, leading to the cleavage of glycosidic bond to degrade HMW-HA [15].
Six different concentrations of hydrogen peroxide were screened to catalyze this degradation reaction, and the results are shown in Table 1. A total of 50 mM (Table 1, entry 5) was identified to be the best concentration of hydrogen peroxide to promote the degradation of HMW-HA by comparing the weight-average molecular weight of LMW-HA. The values of dispersity indices (Mw/Mn) range from 1.063 to 1.106, i.e., the molecular weight distribution of LMW-HA is narrow.
2.1.2. Effects of Copper Ion Concentration on HA Degradation
Hydrogen peroxide plus copper ions is an efficient system for the degradation of high-molecular-weight polysaccharides. In the presence of copper ions, the efficiency of hydrogen peroxide producing free radicals is greatly improved. The reaction mechanism suggests that hydrogen peroxide and copper ions would form peroxo–metal complexes; subsequent self-decomposition results in oxygen evolution [16]. The reactions of hydrogen peroxide and copper ions can be expressed as follows:
H2O2 acts as a reductant, and Cu2+ is reduced to Cu+ with the production of oxygen (Equation (1)). Then, Cu+ immediately reacts with H2O2 in a Fenton-like reaction (Equation (2)). It can also be re-oxidized by oxygen to produce superoxide anion (Equation (3)) and subsequent hydroperoxyl radicals (Equation (4)). Cu+ is stable in the reaction system because of the presence of chloride ions (Equation (5)). The combination of Equations (1)–(4) describes the formation of reactive radical species (Equation (6)).
Different concentrations of copper ions were studied to increase the degradation rate of HMW-HA. As shown in Table 2, with the increase in the concentration of CuCl2, the HA degradation effect was better within certain limits. This clearly shows that 5.0 μM CuCl2 had the best catalytic efficiency for the degradation of HMW-HA.
2.1.3. Effects of pH on HA Degradation
Five different pH values were screened; the results are shown in Table 3. As shown in Table 3, when pH is equal to 4, the degradation rate of HMW-HA is the fastest. Above pH 4.0, the higher the pH, the lower the degradation efficiency of HMW-HA. Studies have shown that pH affects the stability of hydrogen peroxide. When the pH increases, the stability of hydrogen peroxide decreases. Under alkaline conditions, hydrogen peroxide may decompose rapidly, thus decreasing its ability to produce free radicals; therefore, the degradation efficiency of hyaluronic acid was reduced.
2.1.4. Effects of Temperature on HA Degradation
To rule out the effect of temperature on the experiment, temperatures of 20, 30, 40, 50, and 60 °C were investigated. The results are shown in Table 4. The degradation rate increased as the temperature increased. The molecular weight of LMW-HA obtained at a reaction temperature of 50 °C was not different from that obtained at a reaction temperature of 60 °C. A very high temperature will affect the stability of hydrogen peroxide. Finally, 50 °C was selected for the degradation experiments.
2.1.5. Effects of Ultrasonic Power on HA Degradation
Ultrasound is a conventional method to obtain low-molecular-weight polymers by degrading high-molecular-weight polymers. Many mechanisms have been proposed; recent studies show that the main mechanism of ultrasonic depolymerization involves mechanical bond breaking and free radical redox reactions [14,17]. The propagation of sound energy causes a rapid pressure change, thus creating small bubbles in the liquid. The formation and subsequent collapse of bubbles produce intense and rapid change in mechanical motion, and then the molecules in the medium are degraded by the action of high-speed vibration and shear force. Mechanical effects that increase with the increase in relative molecular mass of substances are more significant for polymer substances. A free-radical REDOX reaction is mainly caused by the cavitation effect of liquid under ultrasonic wave. Free radicals and thermal effects are more effective for relatively low-molecular-weight substances. Four different ultrasonic powers were examined. The results shown in Table 5 clearly indicate that 160 W was the best ultrasonic power to promote the degradation of HMW-HA. Based on the above investigations, the optimal degradation conditions were 50 mM H2O2, 5.0 μM CuCl2, pH 4.0, 160 W ultrasonic power, and the reaction temperature 50 °C.
2.1.6. Comparison of Degradation Efficiency of Hyaluronic Acid under Different Conditions
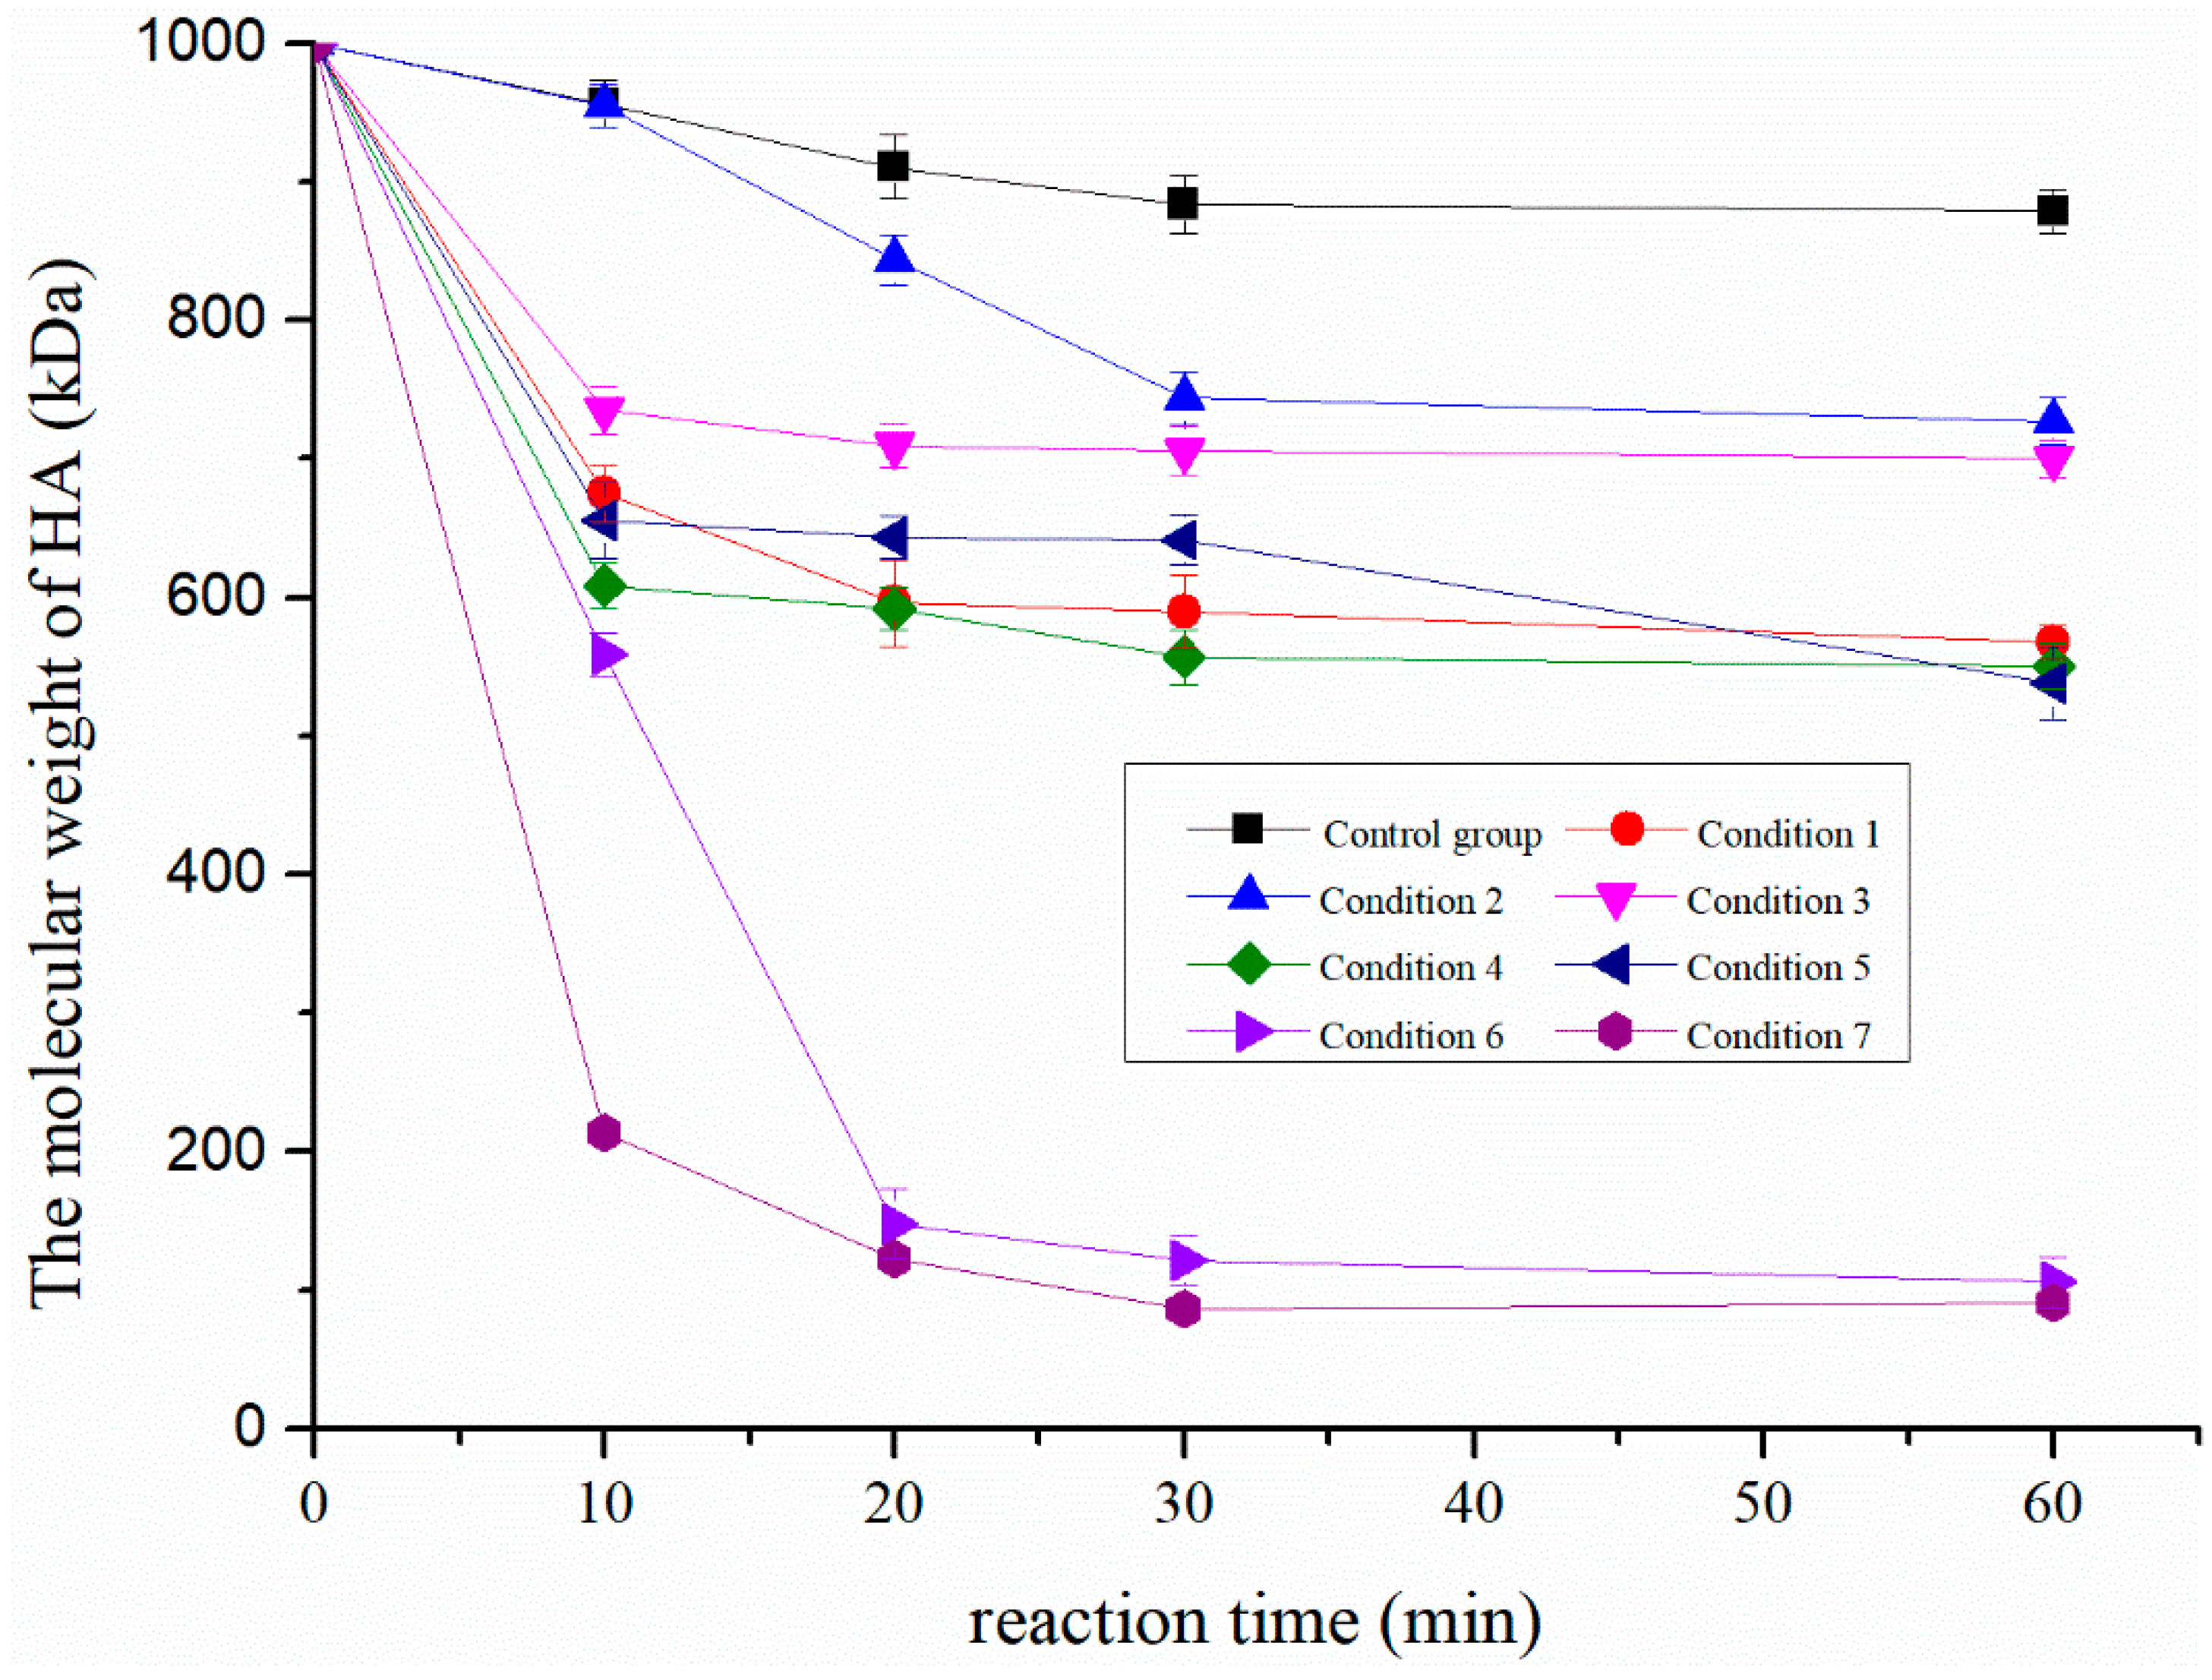
As shown in Figure 1, seven different degradation conditions were compared. Ultrasound (condition 1), copper ions (condition 2), and hydrogen peroxide (condition 3). All of them had catalytic effects on the degradation of hyaluronic acid. The combination of ultrasound and copper ions (condition 4), ultrasound and hydrogen peroxide (condition 5), and hydrogen peroxide and copper ions (condition 6) had synergistic effects on the degradation of HA. Among the seven conditions, the catalytic efficiency of condition 6 was the best. However, the combination of ultrasound, hydrogen peroxide, and copper ion (condition 7) showed better degradation efficiency; 30 min later, LMW-HA with a molecular weight of 74.9 kDa was obtained. This is probably because ultrasound promotes the production of free radicals to some extent [18], and when the molecular weight of hyaluronic acid is relatively high, the mechanical effect of ultrasound on HMW-HA is significant.
2.2. Structural Analysis of LMW-HA
2.2.1. Content of Glucuronic Acid in LMW-HA
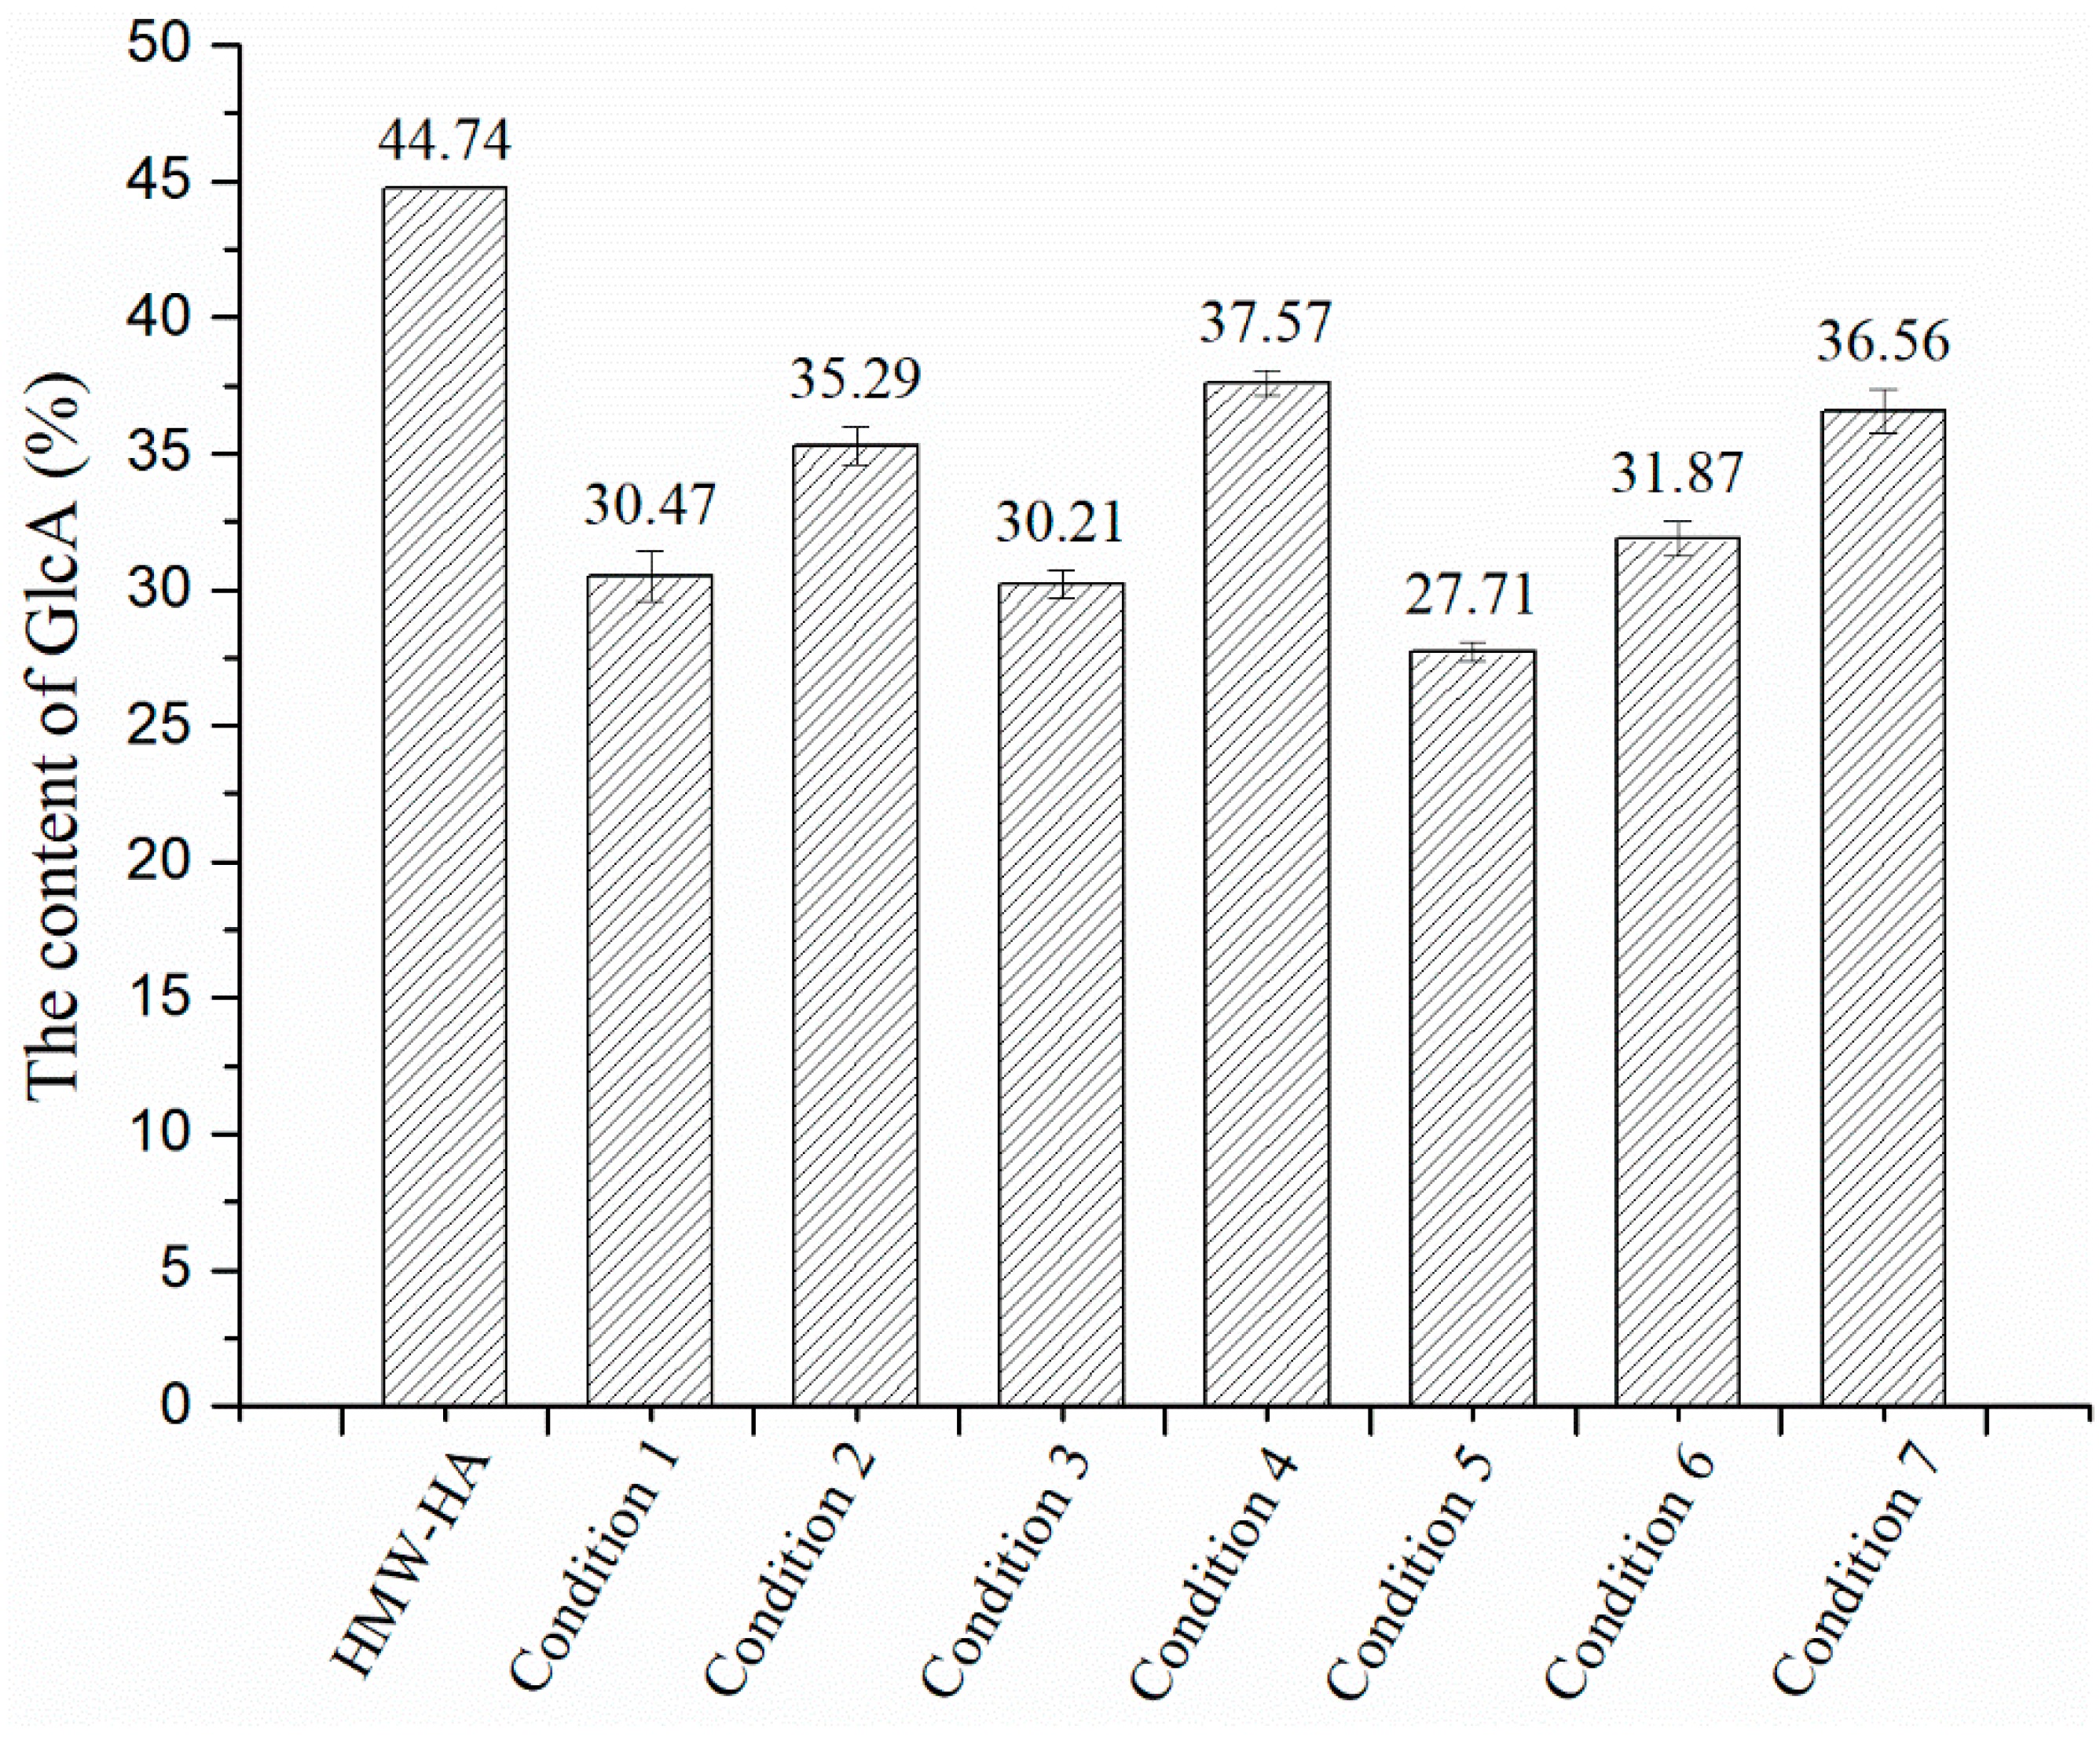
Bitter–Muir method was used to measure the content of glucuronic acid in LMW-HA, which was degraded under the seven conditions described in Section 3.3.6 for 30 min. The results are shown in Figure 2. The content of glucuronic acid in LMW-HA degraded under the optimal degradation condition was 36.56%, slightly lower than the content of glucuronic acid in LMW-HA, which was 44.74%. This indicates that the sugar ring of HA is slightly damaged during the degradation. The yield of degraded HA was 81.71%, slightly higher than the content of glucuronic acid (77.43%) in LMW-HA degraded using a combinatorial method of microwave, hydrogen peroxide, and ascorbic acid [19]. Figure 2 shows that although condition 6 also had a high degradation efficiency, the content of glucuronic acid in the degradation products was lower than that in condition 7, indicating that the combination of ultrasound, hydrogen peroxide, and copper ions in this research could significantly improve the degradation efficiency of HMW-HA and helped to maintain the integrity of product structure.
2.2.2. FTIR Spectra of HA and LMW-HA
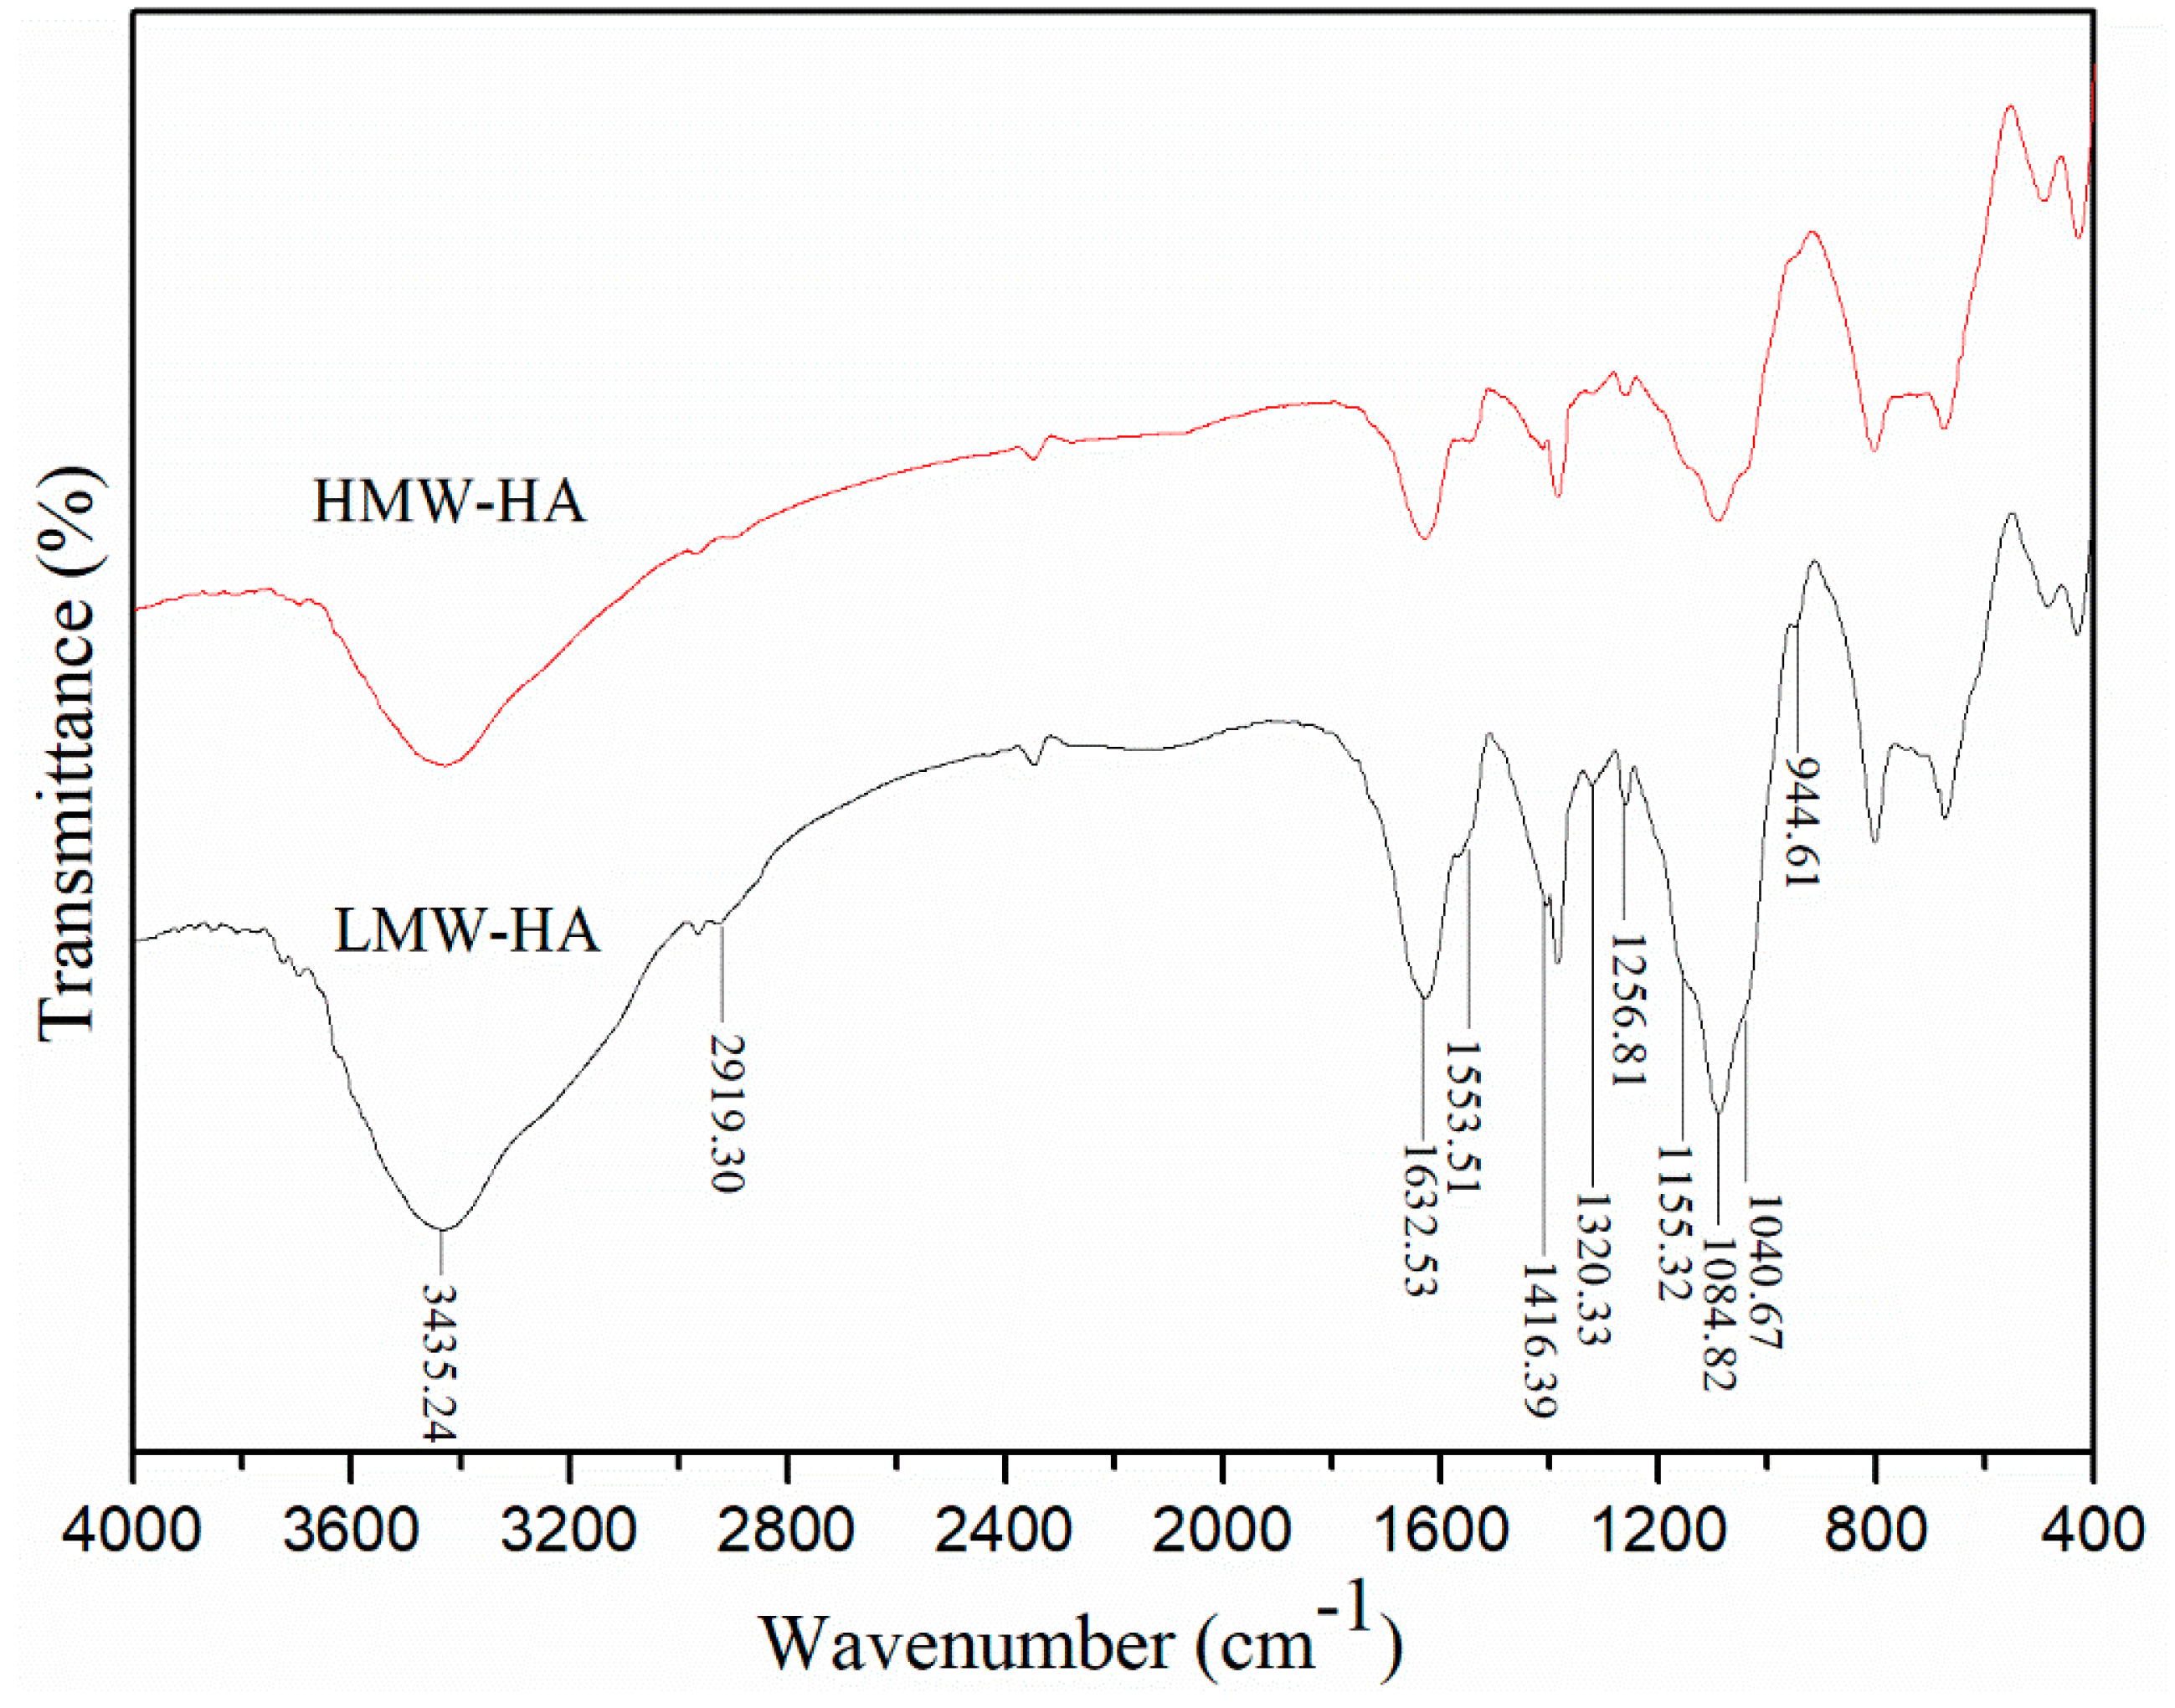
Figure 3 shows FTIR spectra of HMW-HA and LMW-HA obtained using the final degradation method. No obvious difference was observed from the FTIR spectra of HMW-HA and LMW-HA, i.e., the structure of LMW-HA was not affected by the degradation method. A strong absorption band was observed at 3435.24 cm−1, indicating OH and NH stretching vibrations; the band at 2919.30 cm−1 indicates CH symmetrical and CH2 asymmetrical stretching; the band at 1256.81 cm−1 can be attributed to v(C-O) (of COOH). The absorption bands at ~1155.32 cm−1, 1084.82 cm−1, 1040.67 cm−1, and 944.61 cm−1 are typical for carbohydrates, and the bands at 1632.53 cm−1, 1553.51 cm−1, and 1320.33 cm−1 can be assigned to amide I, II, and III. The band at 1416.39 cm−1 is assigned to symmetric C-O stretching vibrations [20].
2.2.3. CD Spectrum of HA and LMW-HA
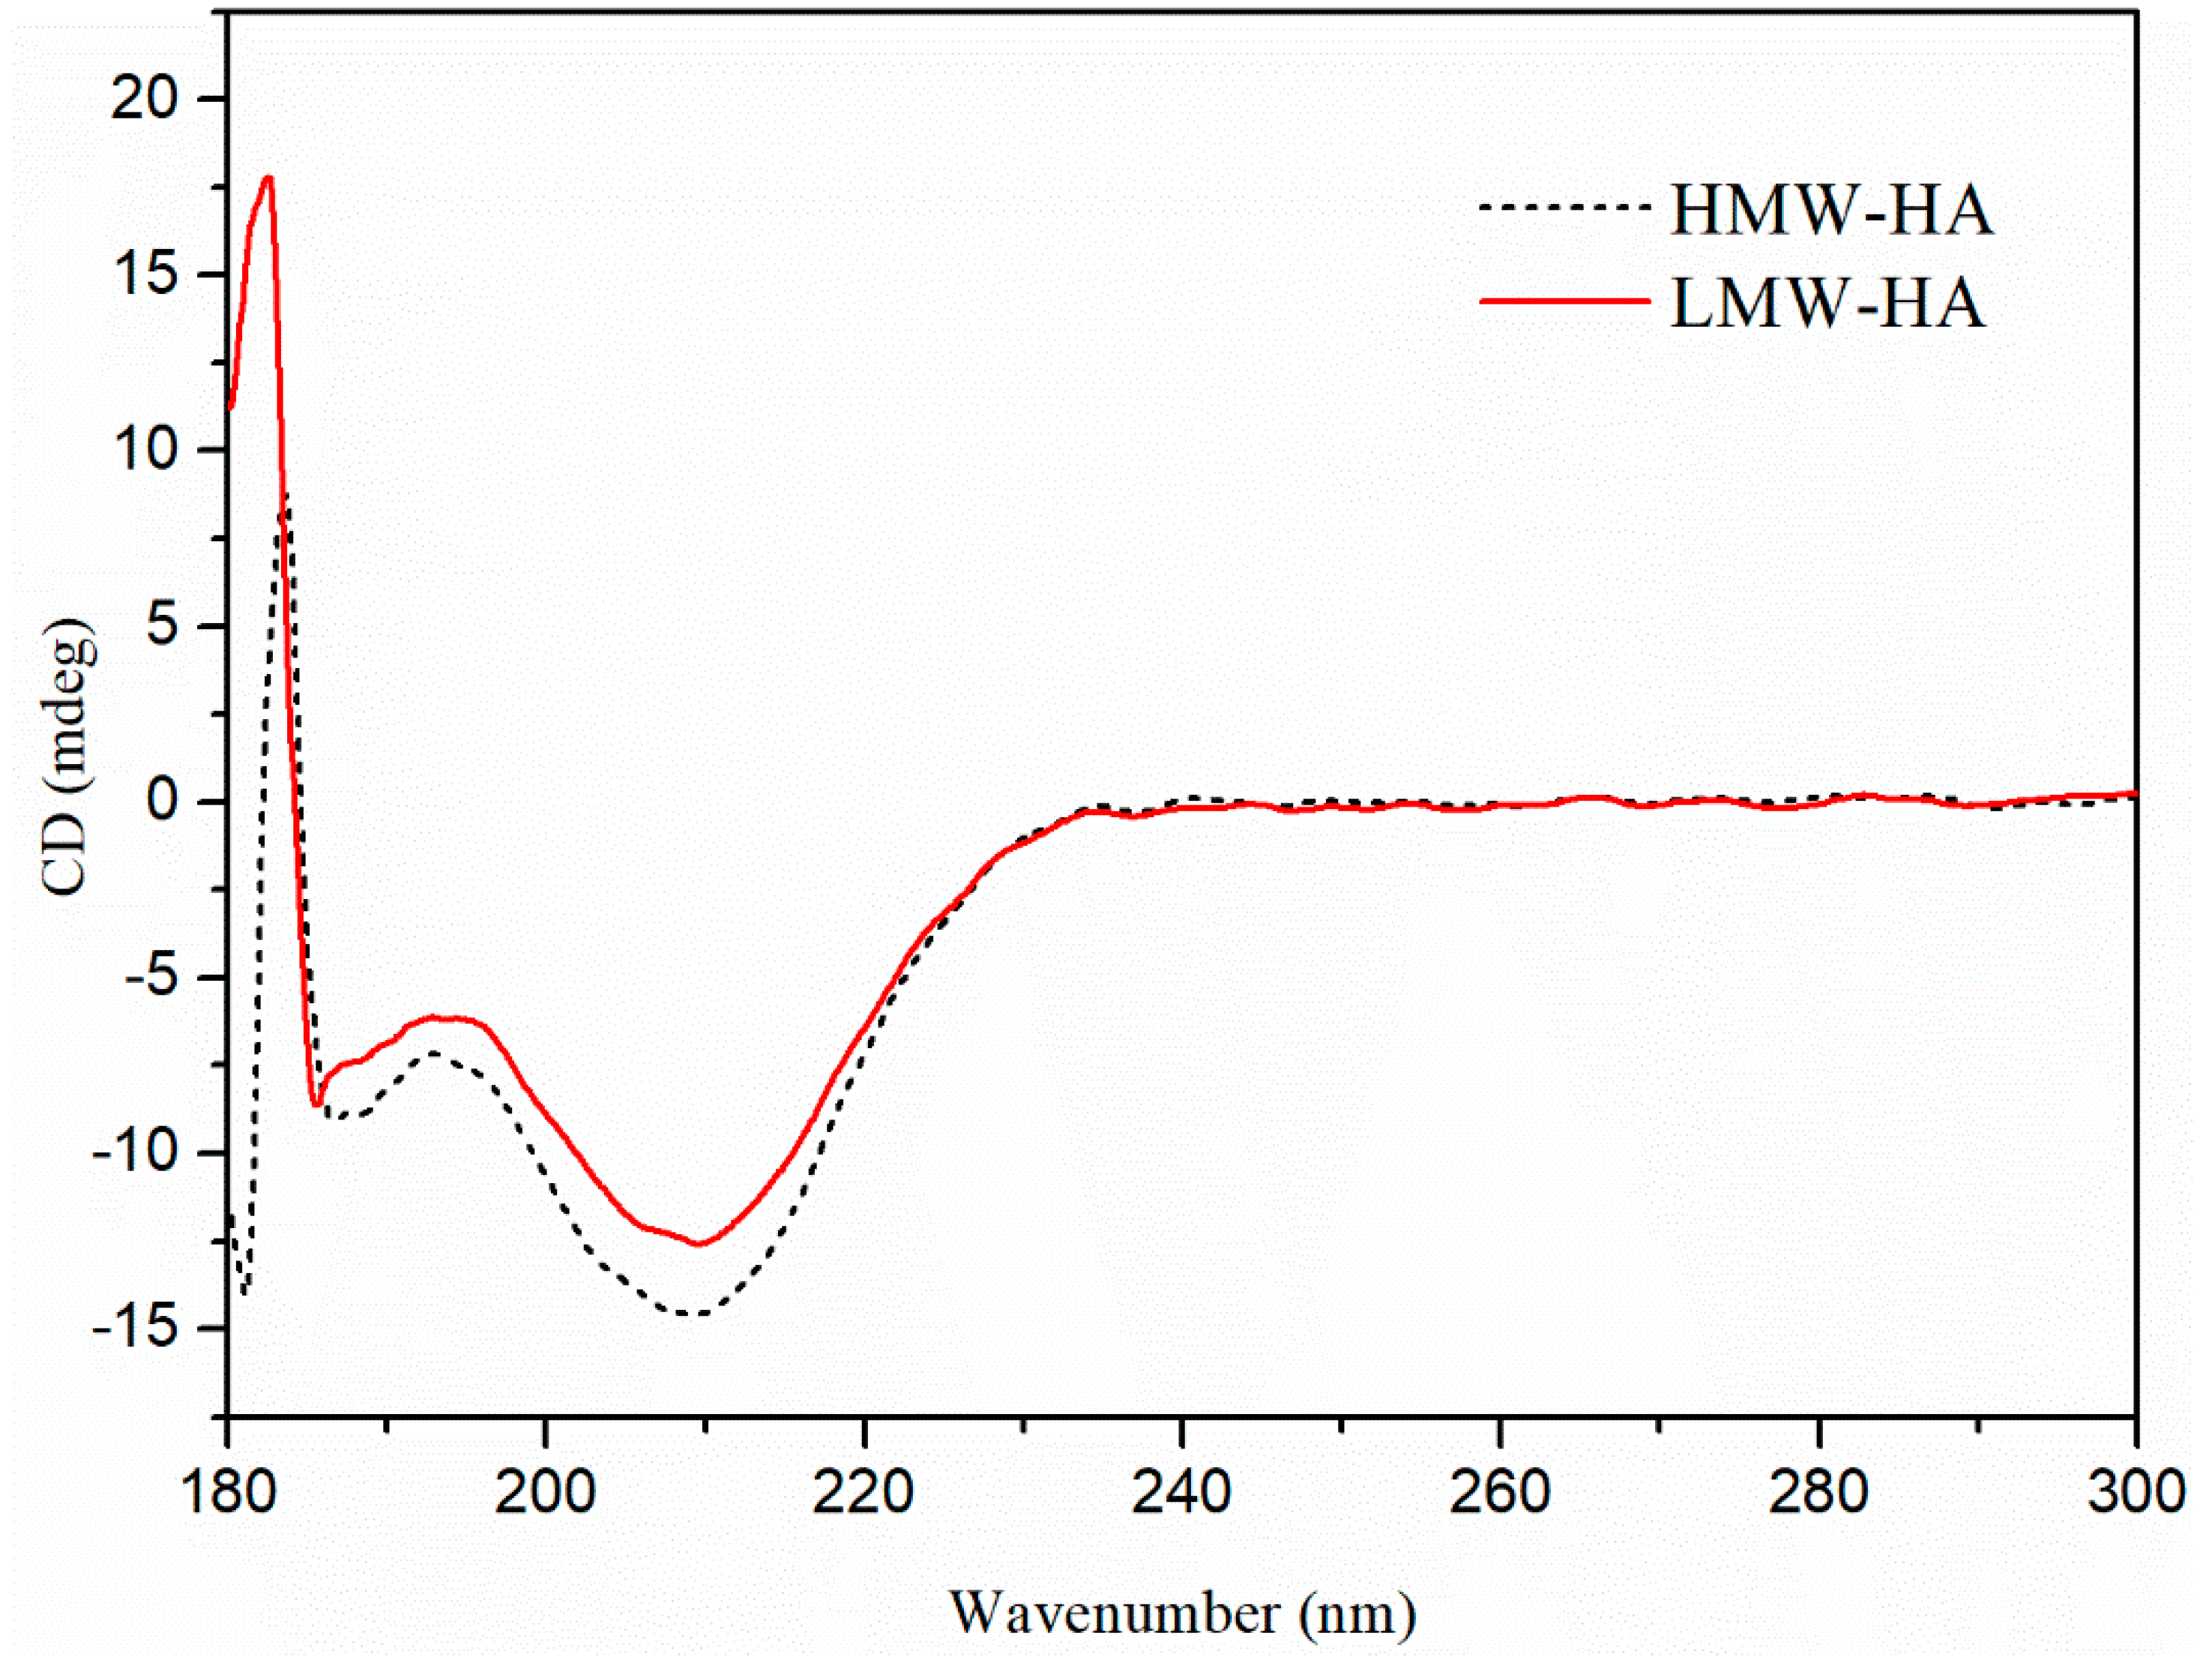
The CD spectra of HMW-HA and LMW-HA obtained under the optimal degradation conditions are shown in Figure 4; no obvious difference was observed. The CD spectrum of polysaccharides is related to the molecular structure and conformation. The chiral double helix structure of a CD spectrum is very sensitive, and the negative peak in a CD spectrum indicates that the molecule has β-sheet conformation. The 183 nm band could be attributed to the carboxyl π–π* transition in the molecule, the negative peak at 187 nm could be attributed to the π–π* transition of GlcNAc in HA, and the negative peak at 210 nm corresponds to the n–π* transition of carboxyl group [21]. The results of CD spectra are consistent with the results of FTIR spectra and the determination of GlcA content, indicating that the structure of LMW-HA remained intact and unchanged during the degradation.
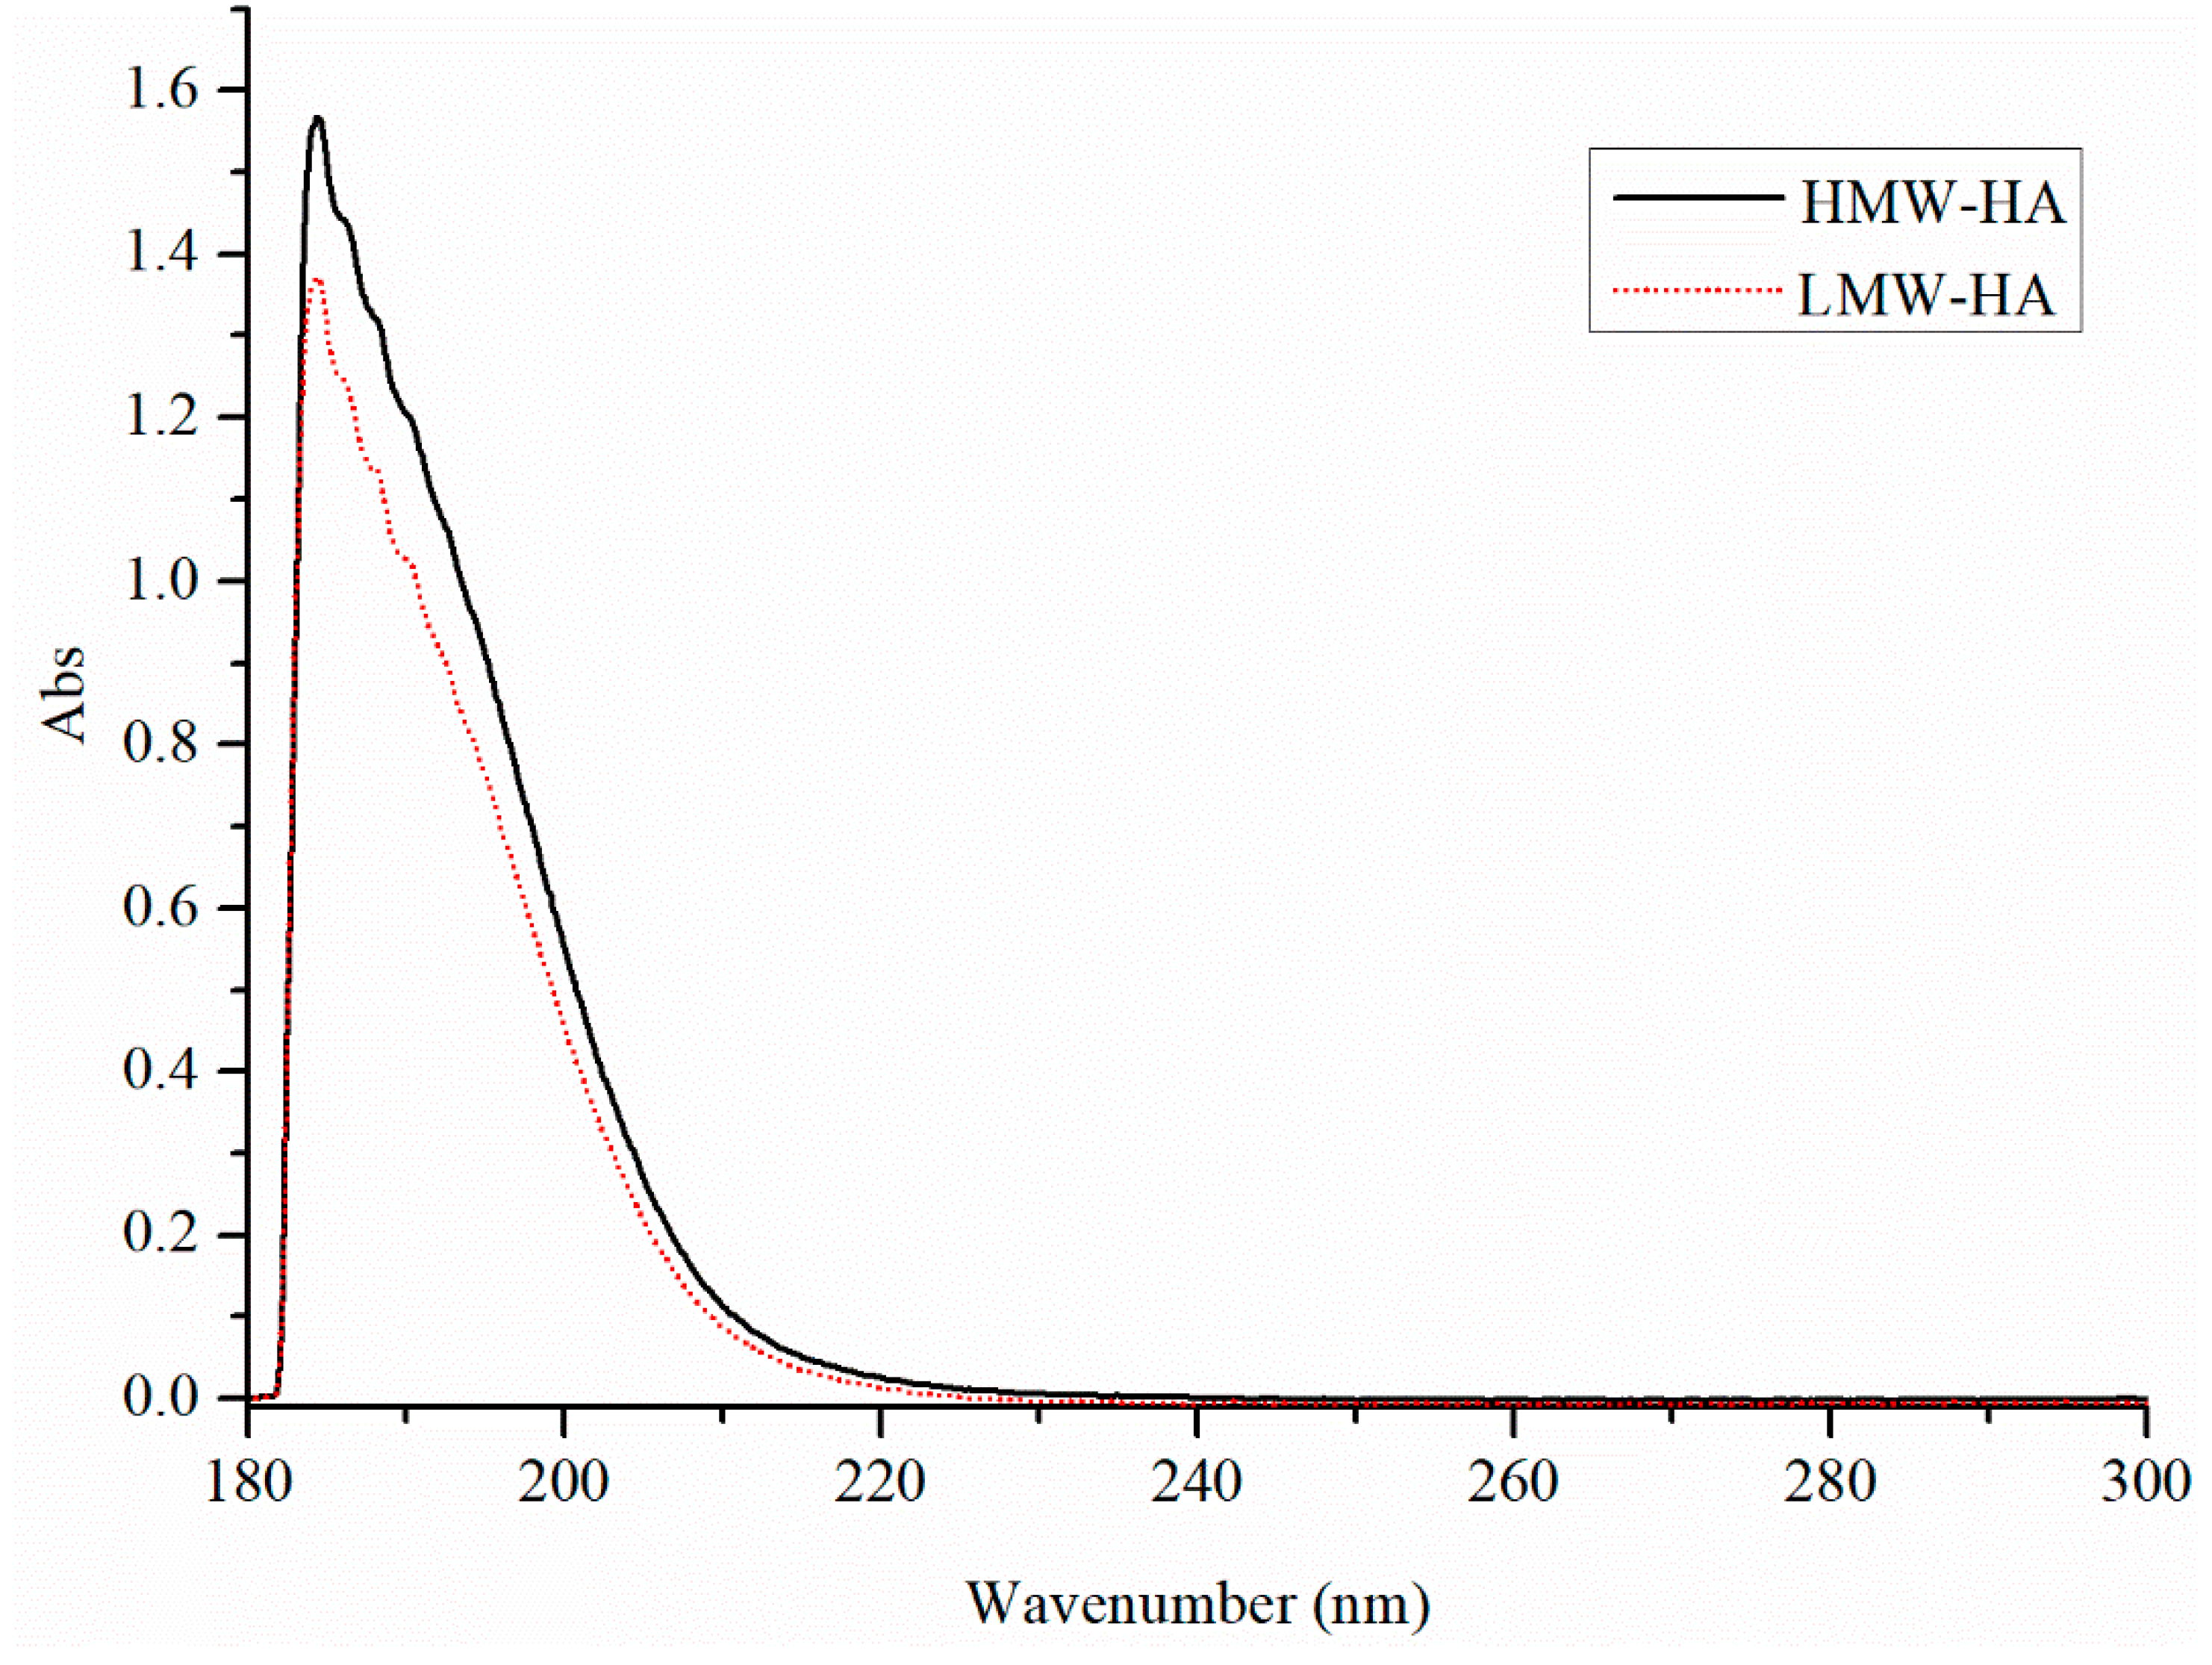
2.2.4. UV–VIS Absorption Spectra
3. Materials and Methods
3.1. Materials
The high-molecular-weight HA sample (1000 kDa) used throughout the study was purchased from Bloomage Freda Biopharm Co. Ltd. (Shandong, China) NaCl and NaOH were purchased from Xilong scientific (Guangzhou, China). CuCl2·2H2O was purchased from Energy Chemical (Shanghai, China); hydrochloric acid and H2O2 were purchased from Shanghai Lingfeng Chemical Reagent Co. Ltd (Shanghai, China). All the chemicals were of analytical grade.
3.2. Analytical Methods
The molecular weight of HA fragment was determined by SEC-MALLS. The chromatography system consisted of an AKTA Purifier pump (P-900), a rheodyne injection valve (INV-907) fitted with a 100 μL loop and Shodex SB-804-HQ column. Eluent identical to the solvent used to dissolve the samples was monitored using a DAWN EOS Multiangle Laser Light Scattering Instrument (Wyatt Technology, Santa Barbara, CA, USA) and RefractoMax521 Refractive Index Detector (Thermo Scientific, Waltham, MA, USA). The refractive index increment (dn/dc) was 0.150 mL/g [23]. Vacuum degassed mobile phase aqueous 0.9% NaCl solution was pumped at a flow rate of 0.5 mL/min. Samples were dissolved in the mobile phase aqueous solution to the required concentration. Prior to analysis, the samples were filtered through a 0.22 μm nylon filter. Signals from the Multiangle Laser Light Scattering Instrument and Refractive Index Detector were captured and analyzed using ASTRA software (Version 5.3.4, Wyatt Technology, Santa Barbara, CA, USA) supplied by the manufacturer.
Bitter–Muir method to measure the content of glucuronic acid could be used to determine the hyaluronic acid content as 100 g hyaluronic acid contained about 46.32 g glucuronic acid [24]. FT-IR spectra were obtained in the transmission mode using a Thermo NICOLET IS 10 infrared spectrophotometer in the range of 400–4000 cm−1. Samples were prepared as a film using the KBr pellet technique. CD spectra were measured using a JASCOJ810 spectropolarimeter (Jasco, Tokyo, Japan). Samples were dissolved in deionized water at a concentration of 0.5 mg/mL. The optical path of quartz sample cell was 0.1 cm. The range of scanning wavelength was 180–300 nm, and the scanning speed was 50 nm min−1. Baseline correction was automatically carried out with the solvent (deionized water) as blank group. UV–VIS absorption spectra were measured using a JASCOJ810 spectropolarimeter (Jasco, Tokyo, Japan) in the range from 180 nm to 300 nm. Samples were diluted in distilled water at 0.5 mg/mL, and distilled water was used as the reference.
3.3. Degradation Studies
In the preliminary work, the components of oxidative system, pH, temperature, and the power of ultrasound showed significant influence on the degradation of HMW-HA. A series of experiments were carried out to determine the best degradation conditions.
3.3.1. Effect of Hydrogen Peroxide Concentration
A total of 0.5% (w/v) HMW-HA solution was prepared by dissolving in 0.2 M NaCl solution and gently stirring at room temperature overnight in the dark. Six different oxidative systems were prepared with 0.1 μM CuCl2 and different concentrations of hydrogen peroxide: (1) 10 mM H2O2, (2) 20 mM H2O2, (3) 30 mM H2O2, (4) 40 mM H2O2, (5) 50 mM H2O2, and (6) 60 mM H2O2. The reaction temperature was adjusted to 40 °C; pH was 6.5; the ultrasonic power was 160 W; the reaction time was 30 min. The reaction products were precipitated in twice the volume of ethanol; then, the polymer precipitate was washed with 20 mL ethanol, centrifuged, and dried in a vacuum drying oven for the following studies.
3.3.2. Effect of CuCl2 Content
The reaction conditions were the same as 3.3.1, except for the content of hydrogen peroxide and CuCl2. The concentration of hydrogen peroxide was 50 mM, and the concentrations of CuCl2 were (1) 0.1 μM, (2) 1.0 μM, (3) 2.0 μM, (4) 3.0 μM, (5) 4.0 μM, (6) 5.0 μM, and (7) 6.0 μM.
3.3.3. Effect of pH
In the previous study, the optimal concentrations of hydrogen peroxide and CuCl2 were determined. In this section, the effect of pH on HMW-HA degradation was evaluated. The values of pH were 3, 4, 6, 8, and 10.
3.3.4. Effect of Temperature
Based on the previous study, the effect of temperature on HMW-HA degradation was evaluated, and the temperatures were 20 °C, 30 °C, 40 °C, 50 °C, and 60 °C.
3.3.5. Effect of Ultrasonic Power
Through the previous study, the optimal conditions such as pH, temperature, and concentrations of hydrogen peroxide and CuCl2 were determined. Consequently, the effect of ultrasonic power on HMW-HA degradation was evaluated, and the values of ultrasonic power were set at 135 W, 150 W, 160 W, and 200 W.
3.3.6. Comparison of Degradation Efficiency of HMW-HA under Different Conditions
To confirm the high efficiency of HMW-HA degradation by a combination of ultrasound, hydrogen peroxide, and copper ion, the degradation effects of different methods were compared under the optimal reaction conditions.
Condition 1: HA solution was degraded using 160 W ultrasound at 50 °C. The solution pH was 4. The reaction times were 10 min, 20 min, 30 min, and 60 min.
Condition 2: HA solution was degraded using 5.0 μM CuCl2 at 50 °C. The solution pH was 4. The reaction times were 10 min, 20 min, 30 min, and 60 min.
Condition 3: HA solution was degraded using 50 mM H2O2 at 50 °C. The solution pH was 4. The reaction times were 10 min, 20 min, 30 min, and 60 min.
Condition 4: HA solution was degraded using 5.0 μM CuCl2 with 160 W ultrasound at 50 °C. The solution pH was 4. The reaction times were 10 min, 20 min, 30 min, and 60 min.
Condition 5: HA solution was degraded using 50 mM H2O2 with 160 W ultrasound at 50 °C. The solution pH was 4. The reaction times were 10 min, 20 min, 30 min, and 60 min.
Condition 6: HA solution was degraded using 50 mM H2O2 with 5.0 μM CuCl2 at 50 °C. The solution pH was 4. The reaction times were 10 min, 20 min, 30 min, and 60 min.
Condition 7: HA solution was degraded by 160 W ultrasound, 50 mM H2O2, and 5.0 μM CuCl2 at 50 °C. The solution pH was 4. The reaction times were 10 min, 20 min, 30 min, and 60 min.
4. Conclusions
In this study, physical and chemical methods were combined to degrade HMW-HA. The effect of ultrasonic power, concentrations of hydrogen peroxide and copper ions, pH, and reaction temperature on hyaluronic acid degradation was investigated. Under the optimal degradation conditions of 50 mM H2O2, 5.0 μM CuCl2, pH 4.0, and reaction temperature at 50 °C for 30 min, the yield of the degraded HA was 81.71% with 36.56% glucuronic acid content. The results show that a combination of ultrasound, hydrogen peroxide, and copper ion is a novel and efficient degradation method for the preparation of LMW-HA. The FTIR, CD, and UV–VIS absorption spectral characterizations also confirm that the structure of LMW-HA remained intact during the degradation.
Author Contributions
H.C. and Y.H. designed the experiments; H.C. performed the experiments; Y.H. arranged resources; J.Q. and H.C. performed the data analysis; H.C. prepared the original draft; Y.H. reviewed and edited the original draft; Y.H. acquired funding.
Funding
This research was funded by the National Natural Science Foundation of China (No. 21676143), Self-Owned Research Project from Key Laboratory of Materials-Oriented Chemical Engineering (No. ZK201603), Jiangsu Synergetic Innovation Center for Advanced Bio-Manufacture, and Qing Lan Project of Jiangsu Province.
Conflicts of Interest
The authors declare no conflict of interest.
References
- Chang, B.; Ahuja, N.; Ma, C.; Liu, X. Injectable scaffolds: Preparation and application in dental and craniofacial regeneration. Mat. Sci. Eng. R 2017, 111, 1–26. [Google Scholar] [CrossRef] [PubMed] [Green Version]
- Chen, W.Y.; Abatangelo, G. Functions of hyaluronan in wound repair. Wound Repair Regen. 1999, 7, 79–89. [Google Scholar] [CrossRef] [PubMed]
- Kakehi, K.; Kinoshita, M.; Yasueda, S. Hyaluronic acid: Separation and biological implications. J. Chromatogr. B 2003, 797, 347–355. [Google Scholar] [CrossRef]
- Inoue, M.; Katakami, C. The effect of hyaluronic acid on corneal epithelial cell proliferation. Invest. Ophth. Vis. Sci. 1993, 34, 2313–2315. [Google Scholar]
- Mast, B.A.; Frantz, F.W.; Diegelmann, R.F.; Krummel, T.M.; Cohen, I.K. Hyaluronic acid degradation products induce neovascularization and fibroplasia in fetal rabbit wounds. Wound Repair Regen. 1995, 3, 66–72. [Google Scholar] [CrossRef] [PubMed]
- D’Agostino, A.; Stellavato, A.; Corsuto, L.; Diana, P.; Filosa, R.; La Gatta, A.; De Rosa, M.; Schiraldi, C. Is molecular size a discriminating factor in hyaluronan interaction with human cells? Carbohyd. Polym. 2017, 157, 21–30. [Google Scholar] [CrossRef]
- Miyazaki, T.; Yomota, C.; Okada, S. Ultrasonic depolymerization of hyaluronic acid. Polym. Degrad. Stabil. 2001, 74, 77–85. [Google Scholar] [CrossRef]
- Jeanloz, R.W.; Jeanloz, D.A. The Degradation of Hyaluronic Acid by Methanolysis. Biochemistry 1964, 3, 121–122. [Google Scholar] [CrossRef]
- Holubova, L.; Korecka, L.; Podzimek, S.; Moravcova, V.; Rotkova, J.; Ehlova, T.; Velebny, V.; Bilkova, Z. Enhanced multiparametric hyaluronan degradation for production of molar-mass-defined fragments. Carbohyd. Polym. 2014, 112, 271–276. [Google Scholar] [CrossRef]
- Melander, C.; Tommeraas, K. Heterogeneous hydrolysis of hyaluronic acid in ethanolic HCl slurry. Carbohyd. Polym. 2010, 82, 874–879. [Google Scholar] [CrossRef]
- Whistler, R.L.; Bemiller, J.N. Alkaline degradation of polysaccharides. Adv. Carbohyd. Chem. 1958, 13, 289–329. [Google Scholar]
- Soltes, L.; Stankovska, M.; Kogan, G.; Mendichi, R.; Volpi, N.; Sasinkova, V.; Gemeiner, P. Degradation of high-molar-mass hyaluronan by an oxidative system comprising ascorbate, Cu(II), and hydrogen peroxide: Inhibitory action of antiinflammatory drugs—Naproxen and acetylsalicylic acid. J. Pharmaceut. Biomed. 2007, 44, 1056–1063. [Google Scholar] [CrossRef] [PubMed]
- Soltes, L.; Brezova, V.; Stankovska, M.; Kogan, G.; Gemeiner, P. Degradation of high-molecular-weight hyaluronan by hydrogen peroxide in the presence of cupric ions. Carbohyd. Res. 2006, 341, 639–644. [Google Scholar] [CrossRef] [PubMed]
- Hafsa, J.; Chaouch, M.A.; Charfeddine, B.; Rihouey, C.; Limem, K.; Le Cerf, D.; Rouatbi, S.; Majdoub, H. Effect of ultrasonic degradation of hyaluronic acid extracted from rooster comb on antioxidant and antiglycation activities. Pharm. Biol. 2017, 55, 156–163. [Google Scholar] [CrossRef] [PubMed]
- Chang, K.L.; Tai, M.C.; Cheng, F.H. Kinetics and products of the degradation of chitosan by hydrogen peroxide. J. Agr. Food Chem. 2001, 49, 4845–4851. [Google Scholar] [CrossRef]
- Haber, F.; Weiss, J. The catalytic decomposition of hydrogen peroxide by iron salts. Proc. R. Soc. Lond. A 1934, 147, 332–351. [Google Scholar]
- Suslick, K.S.; Didenko, Y.; Fang, M.M.; Hyeon, T.; Kolbeck, K.J.; McNamara, W.B.; Mdleleni, M.M.; Wong, M. Acoustic cavitation and its chemical consequences. Phil. Trans. R. Soc. A 1999, 357, 335–353. [Google Scholar] [CrossRef] [Green Version]
- Mehrdad, A.; Hashemzadeh, R. Ultrasonic degradation of Rhodamine B in the presence of hydrogen peroxide and some metal oxide. Ultrason. Sonochem. 2010, 17, 168–172. [Google Scholar] [CrossRef]
- Chen, S.J.; Chen, H.; Gao, R.C.; Li, L.H.; Yang, X.Q.; Wu, Y.Y.; Hu, X. Degradation of hyaluronic acid derived from tilapia eyeballs by a combinatorial method of microwave, hydrogen peroxide, and ascorbic acid. Polym. Degrad. Stabil. 2015, 112, 117–121. [Google Scholar] [CrossRef]
- Gilli, R.; Kacurakova, M.; Mathlouthi, M.; Navarini, L.; Paoletti, S. FTIR studies of sodium hyaluronate and its oligomers in the amorphous solid phase and in aqueous solution. Carbohyd. Res. 1994, 263, 315–326. [Google Scholar] [CrossRef]
- Staskus, P.W.; Johnson, W.C. Conformational Transition of Hyaluronic Acid in Aqueous-Organic Solvent Monitored by Vacuum Ultraviolet Circular Dichroism. Biochemistry 1988, 27, 1522–1527. [Google Scholar] [CrossRef] [PubMed]
- Wu, Y. Preparation of low-molecular-weight hyaluronic acid by ozone treatment. Carbohyd. Polym. 2012, 89, 709–712. [Google Scholar] [CrossRef] [PubMed]
- Soltes, L.; Kogan, G.; Stankovska, M.; Mendichi, R.; Rychly, J.; Schiller, J.; Gemeiner, P. Degradation of high-molar-mass hyaluronan and characterization of fragments. Biomacromolecules 2007, 8, 2697–2705. [Google Scholar] [CrossRef] [PubMed]
- Bitter, T.; Muir, H.M. A modified uronic acid carbazole reaction. Anal. Biochem. 1962, 4, 330–334. [Google Scholar] [CrossRef]
Sample Availability: Samples of the compounds are not available from the authors. |
Figure 1.
Comparison of degradation efficiency of hyaluronic acid under different conditions.

Figure 2.
Content of glucuronic acid in LMW-HA degraded under each of seven conditions.

Figure 3.
FTIR spectra of intact HA and LMW-HA degraded using the optimal method.

Figure 4.
CD spectra of HMW-HA and LMW-HA.

Figure 5.
UV–VIS absorption spectra of HMW-HA and LMW-HA.


Table 1.
Average molecular weights and dispersity indices of LMW-HA under different concentrations of hydrogen peroxide.
Table 1.
Average molecular weights and dispersity indices of LMW-HA under different concentrations of hydrogen peroxide.
| Entry | Hydrogen Peroxide Concentration (mM) | Mn (kDa) | Mw (kDa) | Mw/Mn |
|---|---|---|---|---|
| 1 | 10 | 560.1 | 619.3 | 1.106 |
| 2 | 20 | 501.8 | 533.2 | 1.063 |
| 3 | 30 | 508.7 | 544.3 | 1.07 |
| 4 | 40 | 431.6 | 464.6 | 1.076 |
| 5 | 50 | 414.2 | 446.5 | 1.078 |
| 6 | 60 | 472.2 | 507.2 | 1.074 |
The averages of molar mass—numeric: Mn and weight: Mw, dispersity indices (Mw/Mn).
Table 2.
Average molecular weights and dispersity indices of LMW-HA under different concentrations of copper ions.
Table 2.
Average molecular weights and dispersity indices of LMW-HA under different concentrations of copper ions.
| Entry | CuCl2 Concentration (μM) | Mn (kDa) | Mw (kDa) | Mw/Mn |
|---|---|---|---|---|
| 1 | 0.1 | 413.2 | 449.3 | 1.087 |
| 2 | 1.0 | 374.6 | 405.3 | 1.082 |
| 3 | 2.0 | 311.5 | 348.6 | 1.119 |
| 4 | 3.0 | 206.4 | 256.9 | 1.245 |
| 5 | 4.0 | 86.06 | 123.5 | 1.435 |
| 6 | 5.0 | 87.58 | 111.5 | 1.273 |
| 7 | 6.0 | 83.47 | 112.8 | 1.351 |
The averages of molar mass—numeric: Mn and weight: Mw, dispersity indices (Mw/Mn).
Table 3.
Average molecular weights and dispersity indices of LMW-HA under different pH.
| Entry | pH | Mn (kDa) | Mw (kDa) | Mw/Mn |
|---|---|---|---|---|
| 1 | 3 | 82.71 | 126.3 | 1.527 |
| 2 | 4 | 72.46 | 102.3 | 1.412 |
| 3 | 6 | 90.17 | 118.0 | 1.309 |
| 4 | 8 | 248.8 | 374.6 | 1.506 |
| 5 | 10 | 220.0 | 322.9 | 1.468 |
The averages of molar mass—numeric: Mn and weight: Mw, dispersity indices (Mw/Mn).
Table 4.
Average molecular weights and dispersity indices of LMW-HA at different temperatures.
| Entry | Temperature (°C) | Mn (kDa) | Mw (kDa) | Mw/Mn |
|---|---|---|---|---|
| 1 | 20 | 65.74 | 101.2 | 1.539 |
| 2 | 30 | 85.56 | 120.4 | 1.407 |
| 3 | 40 | 70.89 | 110.6 | 1.560 |
| 4 | 50 | 47.98 | 71.70 | 1.494 |
| 5 | 60 | 45.35 | 68.05 | 1.500 |
The averages of molar mass—numeric: Mn and weight: Mw, dispersity indices (Mw/Mn).
Table 5.
Average molecular weights and dispersity indices of LMW-HA under different ultrasonic powers.
Table 5.
Average molecular weights and dispersity indices of LMW-HA under different ultrasonic powers.
| Entry | Ultrasonic Power (W) | Mn (kDa) | Mw (kDa) | Mw/Mn |
|---|---|---|---|---|
| 1 | 135 | 91.11 | 122.1 | 1.340 |
| 2 | 150 | 80.34 | 108.7 | 1.353 |
| 3 | 160 | 51.67 | 74.9 | 1.449 |
| 4 | 200 | 81.84 | 114.6 | 1.400 |
The averages of molar mass—numeric: Mn and weight: Mw, dispersity indices (Mw/Mn).
© 2019 by the authors. Licensee MDPI, Basel, Switzerland. This article is an open access article distributed under the terms and conditions of the Creative Commons Attribution (CC BY) license (http://creativecommons.org/licenses/by/4.0/).
Share and Cite
MDPI and ACS Style
Chen, H.; Qin, J.; Hu, Y. Efficient Degradation of High-Molecular-Weight Hyaluronic Acid by a Combination of Ultrasound, Hydrogen Peroxide, and Copper Ion. Molecules 2019, 24, 617. https://doi.org/10.3390/molecules24030617
AMA Style
Chen H, Qin J, Hu Y. Efficient Degradation of High-Molecular-Weight Hyaluronic Acid by a Combination of Ultrasound, Hydrogen Peroxide, and Copper Ion. Molecules. 2019; 24(3):617. https://doi.org/10.3390/molecules24030617
Chicago/Turabian StyleChen, Hongyue, Jing Qin, and Yi Hu. 2019. "Efficient Degradation of High-Molecular-Weight Hyaluronic Acid by a Combination of Ultrasound, Hydrogen Peroxide, and Copper Ion" Molecules 24, no. 3: 617. https://doi.org/10.3390/molecules24030617