Article

Simultaneous Determination of the Traditional Herbal Formula Ukgansan and the In Vitro Antioxidant Activity of Ferulic Acid as an Active Compound

1
Clinical Medicine Division, Korea Institute of Oriental Medicine, Daejeon 34054, Korea
2
College of Pharmacy, Chungnam National University, Daejeon 34134, Korea
3
Korean Medicine Life Science, University of Science & Technology, Daejeon 34113, Korea
4
Herbal Medicine Research Division, Korea Institute of Oriental Medicine, Daejeon 34054, Korea
*
Authors to whom correspondence should be addressed.
Molecules 2018, 23(7), 1659; https://doi.org/10.3390/molecules23071659
Submission received: 5 June 2018 / Revised: 5 July 2018 / Accepted: 5 July 2018 / Published: 7 July 2018

Abstract

:
Ukgansan (UGS), a traditional herbal formula composing seven medicinal herbal plants, has been applied in Asian countries for treating neurosis, insomnia, and irritability. Here, the current study performed a simultaneous determination of the seven marker compounds (liquiritin apioside, liquiritin, ferulic acid, glycyrrhizin, decursin, decursinol angelate, and atractylenolide I) using high-performance liquid chromatography (HPLC), to establish quality control of UGS. A 70% ethanol extract of UGS and a mixture of the seven compounds were separated using a C-18 analytical column on a gradient solvent system of 1.0% (v/v) aqueous acetic acid and acetonitrile. Data were recorded at a UV wavelength of 250 nm for glycyrrhizin; 276 nm for liquiritin apioside, liquiritin, and atractylenolide I; and 325 nm for ferulic acid, decursin, and decursinol angelate. The results exhibited high linearity (correlation coefficient (r2) ≥ 0.9998) and proper precision (0.38–3.36%), accuracy (95.12–105.12%), and recovery (95.99–104.94%) for the seven marker compounds. The amount of the seven marker compounds at the concentrations from 0.190 to 16.431 mg/g. In addition, the current study evaluated the antioxidant effects of UGS by measuring their scavenging activities against the 2,2′-azinobis-(3-ethylbenzothiazoline-6-sulfonic acid) (ABTS) and 2,2′-diphenyl-1-picrylhydrazyl (DPPH) radicals using in vitro cell-free systems and observed its antioxidant activity. Among the seven components of the UGS extract, ferulic acid dramatically enhanced the scavenging of ABTS and DPPH radicals compared with other compounds. The concentrations of ferulic acid required for a 50% reduction (RC50) in ABTS and DPPH radicals were 16.22 μM and 41.21 μM, respectively. Furthermore, UGS extract exerted the neuroprotective effect and blocked the inflammatory response in neuronal hippocampal cells and microglia, respectively. Overall, the established method of HPLC will be valuable for improving the quality control of UGS extract, and ferulic acid may be useful as a potential antioxidant agent.

1. Introduction

Ukgansan (UGS), which is also called yokukansan in Japan and Yi-gan san in China, is a traditional Oriental herbal formula composing seven medicinal herbal plants including Uncaria sinensis, Atractylodes japonica, Poria cocos, Bupleurum falcatum, Angelica gigas, Cnidium officinale, and Glycyrrhiza uralensis. UGS has been utilized to manage various diseases such as neurosis, insomnia, and irritability in children and is a herbal medicine that is approved by the Ministry of Health, Labor and Welfare of Japan. Modern pharmacological and clinical studies have suggested that UGS has the potential to improve insomnia [1,2], borderline personality disorder [3], neuroleptic-induced tardive dyskinesia [4], drug-induced parkinsonism [5], cognitive impairment [6], and the behavioral and psychological symptoms of dementia (BPSD) [7,8,9]. It is well known that the occurrence of these diseases is closely related to oxidative stress [10,11,12]. Thus, antioxidant activity should be considered, in addition to the efficacy of therapeutic drugs.
The quality of herbal formulas depends on environmental factors, such as harvesting, storing, processing, and formulating methods. Because of their multiple components and the effect of the environment, quality assessment of the major components of herbal formulas is required for investigating their efficacy and safety [13]. Although the identification and simultaneous determination of the components of UGS using high-performance liquid chromatography (HPLC) and HPLC-Q-TOF-MS have been reported [14,15], there are few studies on simultaneous determination of the compounds in UGS using HPLC. Therefore, the current study conducted a simultaneous determination of the marker compounds of UGS for the quality control of UGS using a photodiode array HPLC detector (denoted the HPLC-PDA method), as it is the most popular analytical method. The HPLC-PDA method is a convenient and rapid analytical method to separate and identify the multiple compounds in herbal formulas [16,17].
In this study, simultaneous analysis of seven compounds (liquiritin apioside, liquiritin, ferulic acid, glycyrrhizin, decursin, decursinol angelate, and atractylenolide I) in a UGS extract was performed, and method validation was carried out using the HPLC-PDA method. Moreover, the antioxidant activities of the seven marker compounds were determined using in vitro radical scavenging assays and the biological effects in neuronal cell lines HT22 hippocampal cells and BV-2 microglia. A variety of drugs have shown the neuroprotective activity against damage-induced HT22 cells and the inhibitory effects on neuroinflammation in lipopolysaccharide-stimulated BV-2 cells [18,19,20].

2. Results

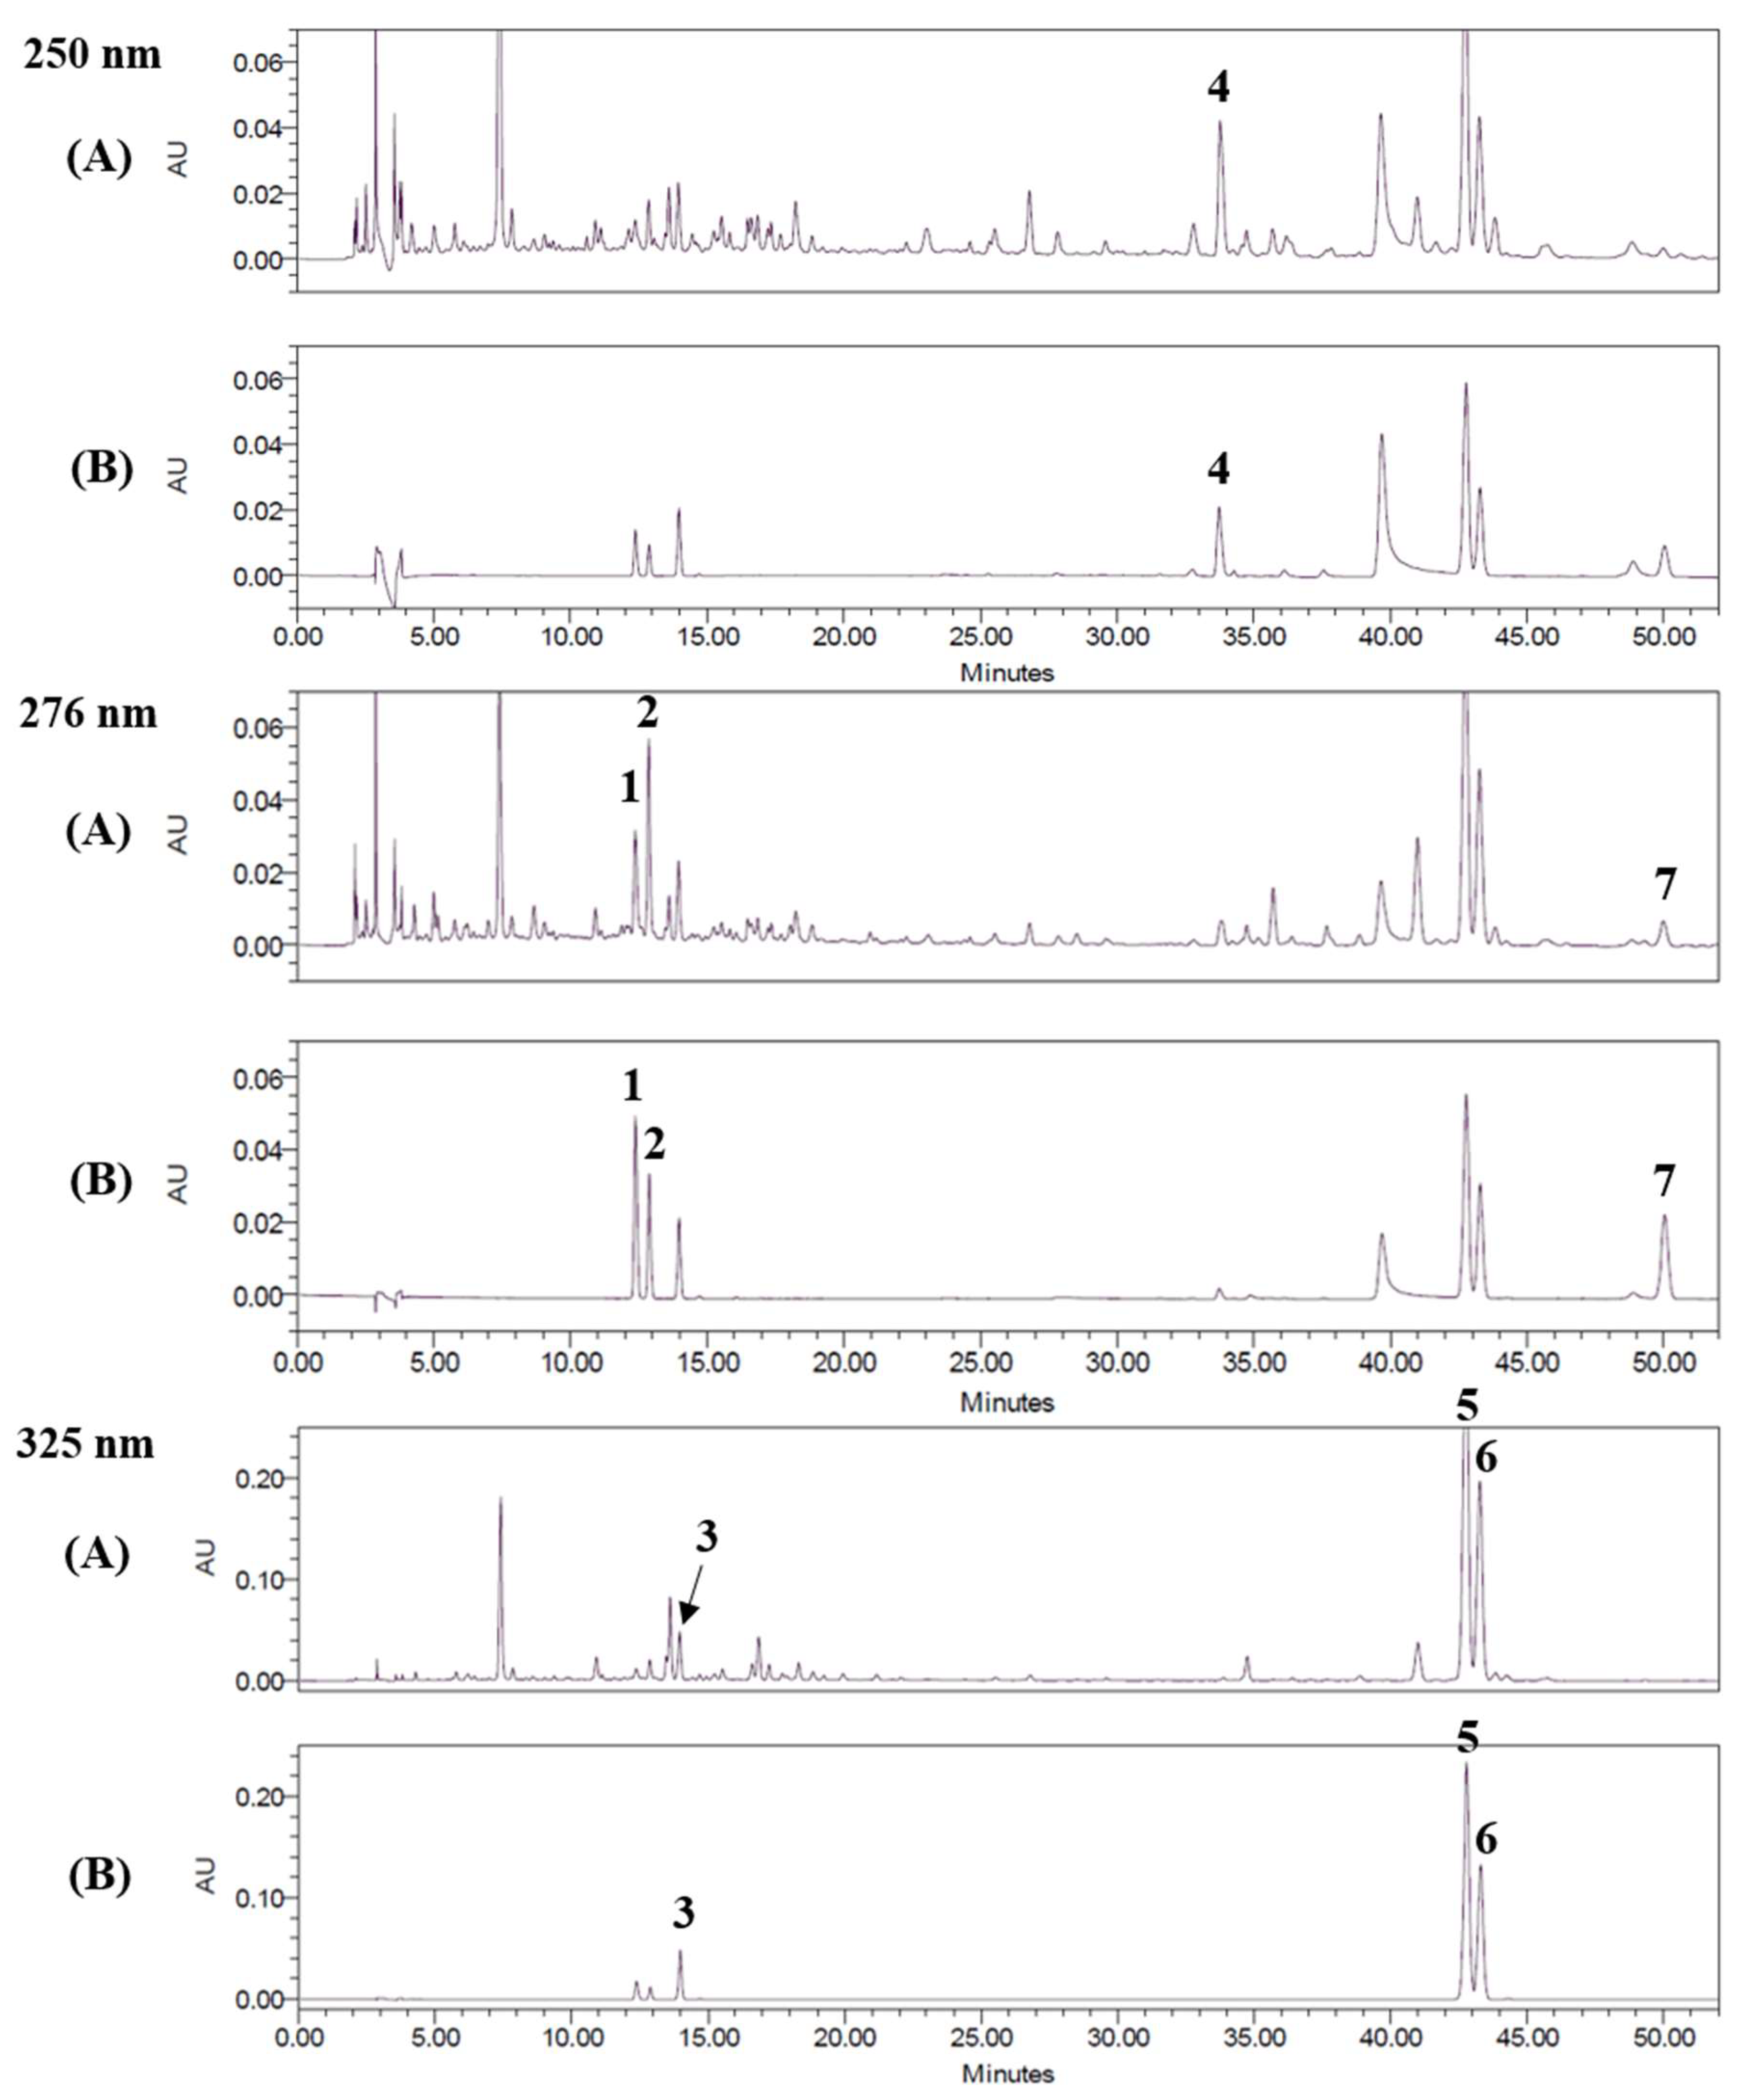
2.1. Optimization of HPLC Separation

HPLC analysis was performed for separating the seven marker compounds (Figure 1) from a 70% ethanol extract of UGS (Table 1). To establish an efficient separation of the seven compounds, various mobile phases were evaluated, including water, acetonitrile, and methanol with trifluoroacetic acid (TFA), acetic acid, and phosphoric acid. The results showed good separation chromatograms using mobile phases consisting of 1.0% (v/v) aqueous acetic acid (A) and acetonitrile (B). The UV wavelength used for quantitative analysis was 250 nm for glycyrrhizin; 276 nm for liquiritin apioside, liquiritin, and atractylenolide I; and 325 nm for ferulic acid, decursin, and decursinol angelate. Using the established methods of HPLC, the seven marker compounds were resolved within 50 min. The retention times of liquiritin apioside, liquiritin, ferulic acid, glycyrrhizin, decursin, decursinol angelate, and atractylenolide I were 12.36, 12.86, 13.95, 33.77, 42.74, 43.25, and 49.99 min, respectively. HPLC chromatograms of the UGS extract in 70% ethanol and the standard compound mixture are shown in Figure 2.

2.2. Regression Equation, Linearity, and Limits of Detection (LOD) and Quantification (LOQ)

The linear relationships between the concentrations (x, μg/mL) and peak areas (y) of each compound were expressed by the regression equations (y = ax + b) (Table 2 and Supplementary Figure 1). Calibration curves of the marker compounds revealed good linearity (r2 ≥ 0.9998). The LODs and LOQs for the tested compounds were 0.015–0.925 and 0.046–2.804 μg/mL, respectively.

2.3. Determination of the Seven Marker Compounds of the UGS Extract

The established analytical method using HPLC was used to the simultaneous quantification of the seven marker compounds of UGS extract. The amounts of the seven marker compounds ranged from 0.190 mg/g to 16.431 mg/g. As shown in Table 3, decursin (16.431 mg/g) was the most abundant compound among these seven compounds.

2.4. Precision, Accuracy, and Recovery

Precision was represented as the relative standard deviations (RSDs) of the concentrations of marker compounds in mixed standard solutions, and repeated five times at low, middle and high concentration levels. The results for the intra- and inter-day precision and accuracy are shown in Table 4 The intra- and inter-day precision for the seven marker compounds in mixed standard solutions was <3.36%, and the accuracy ranged from 95.12% to 105.12%. The RSD values for repeatability for the seven compounds ranged from 0.16% to 0.55% for retention times and from 0.4% to 0.76% for peak areas (Table 5). Recovery tests of the seven marker compounds were performed by adding the three different known amounts (low, middle, and high concentrations) of standard solutions to a certain amount of UGS extract. The recoveries of the seven marker compounds were between 95.99% and 104.94%, with RSD ≤ 3.21% (Table 6). These results demonstrate that the established method of HPLC had satisfactory precision, accuracy, repeatability, and recovery for simultaneous analysis.

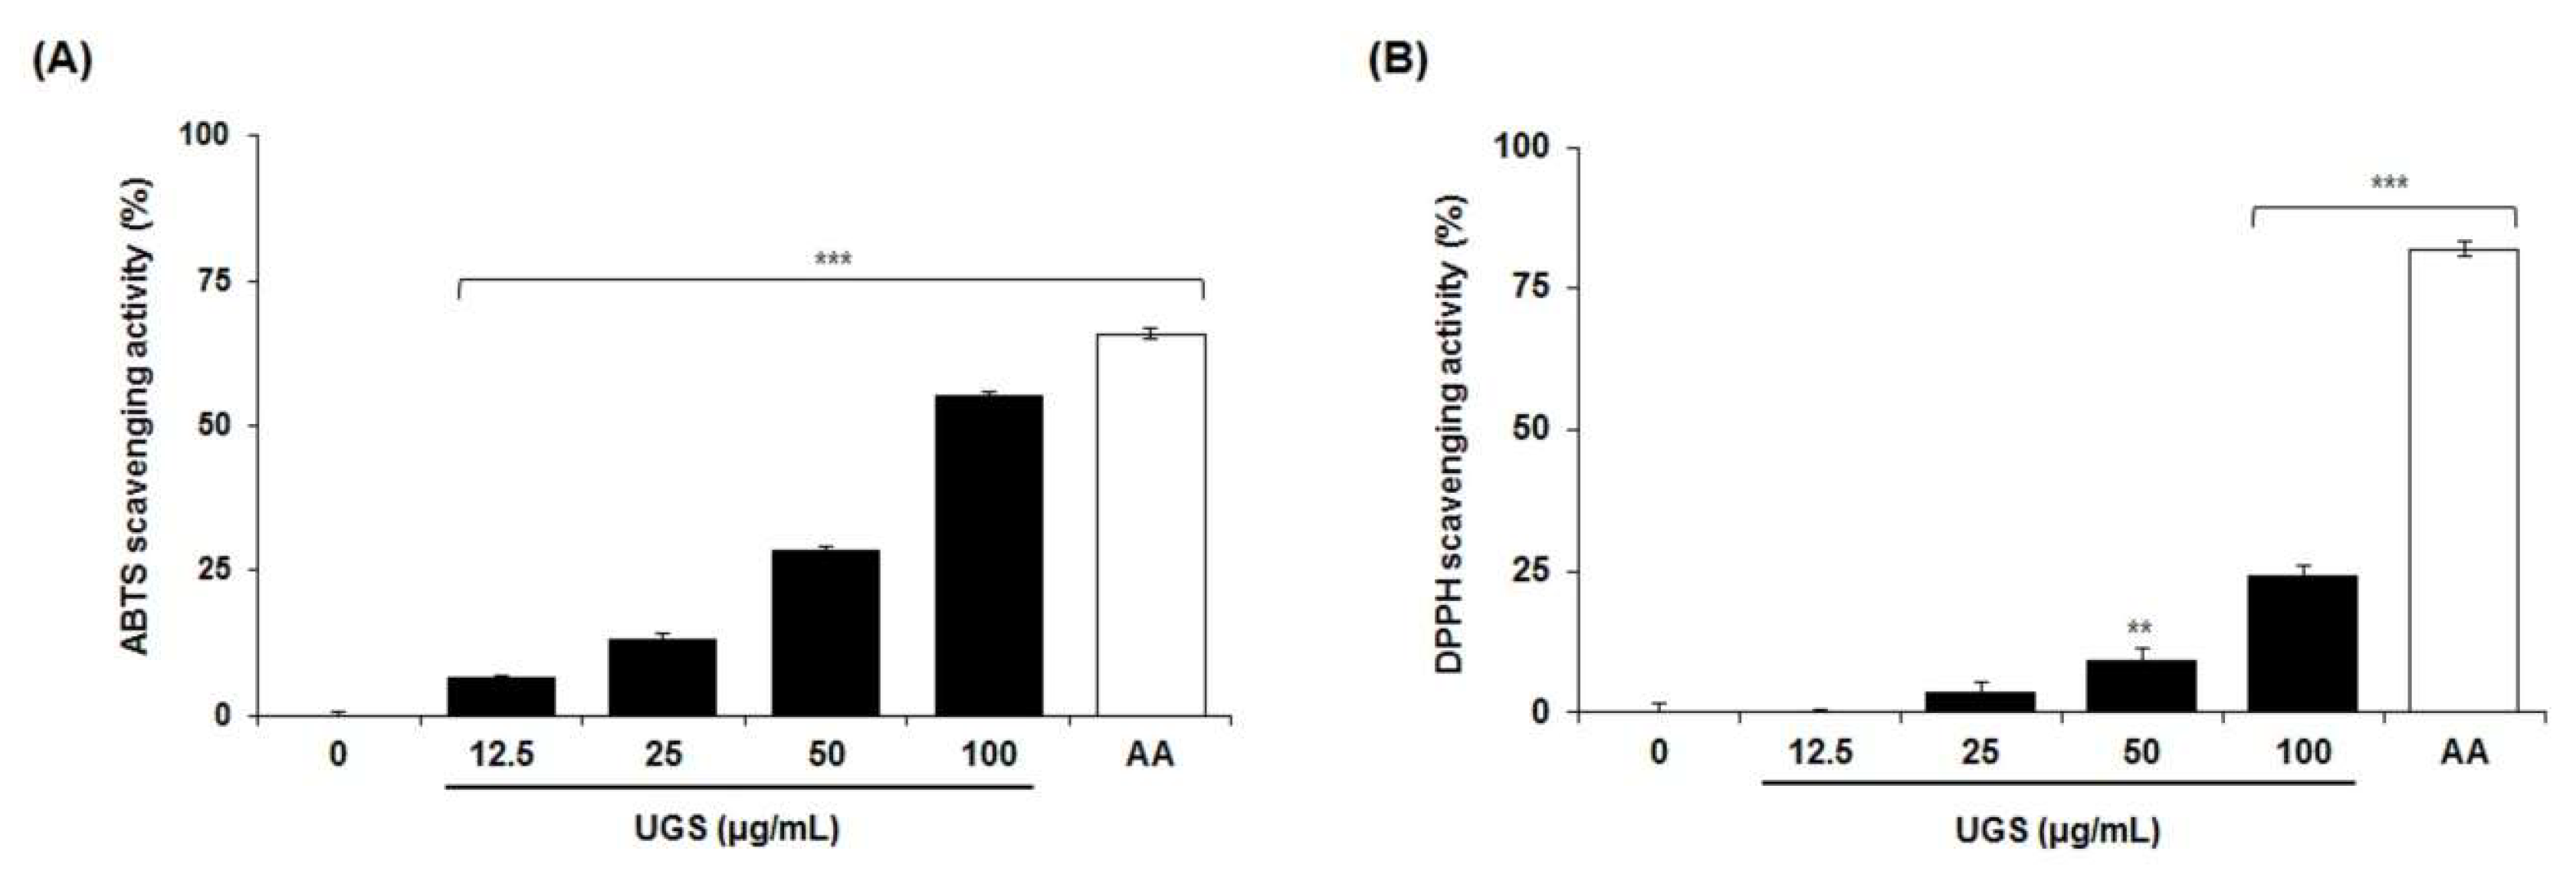
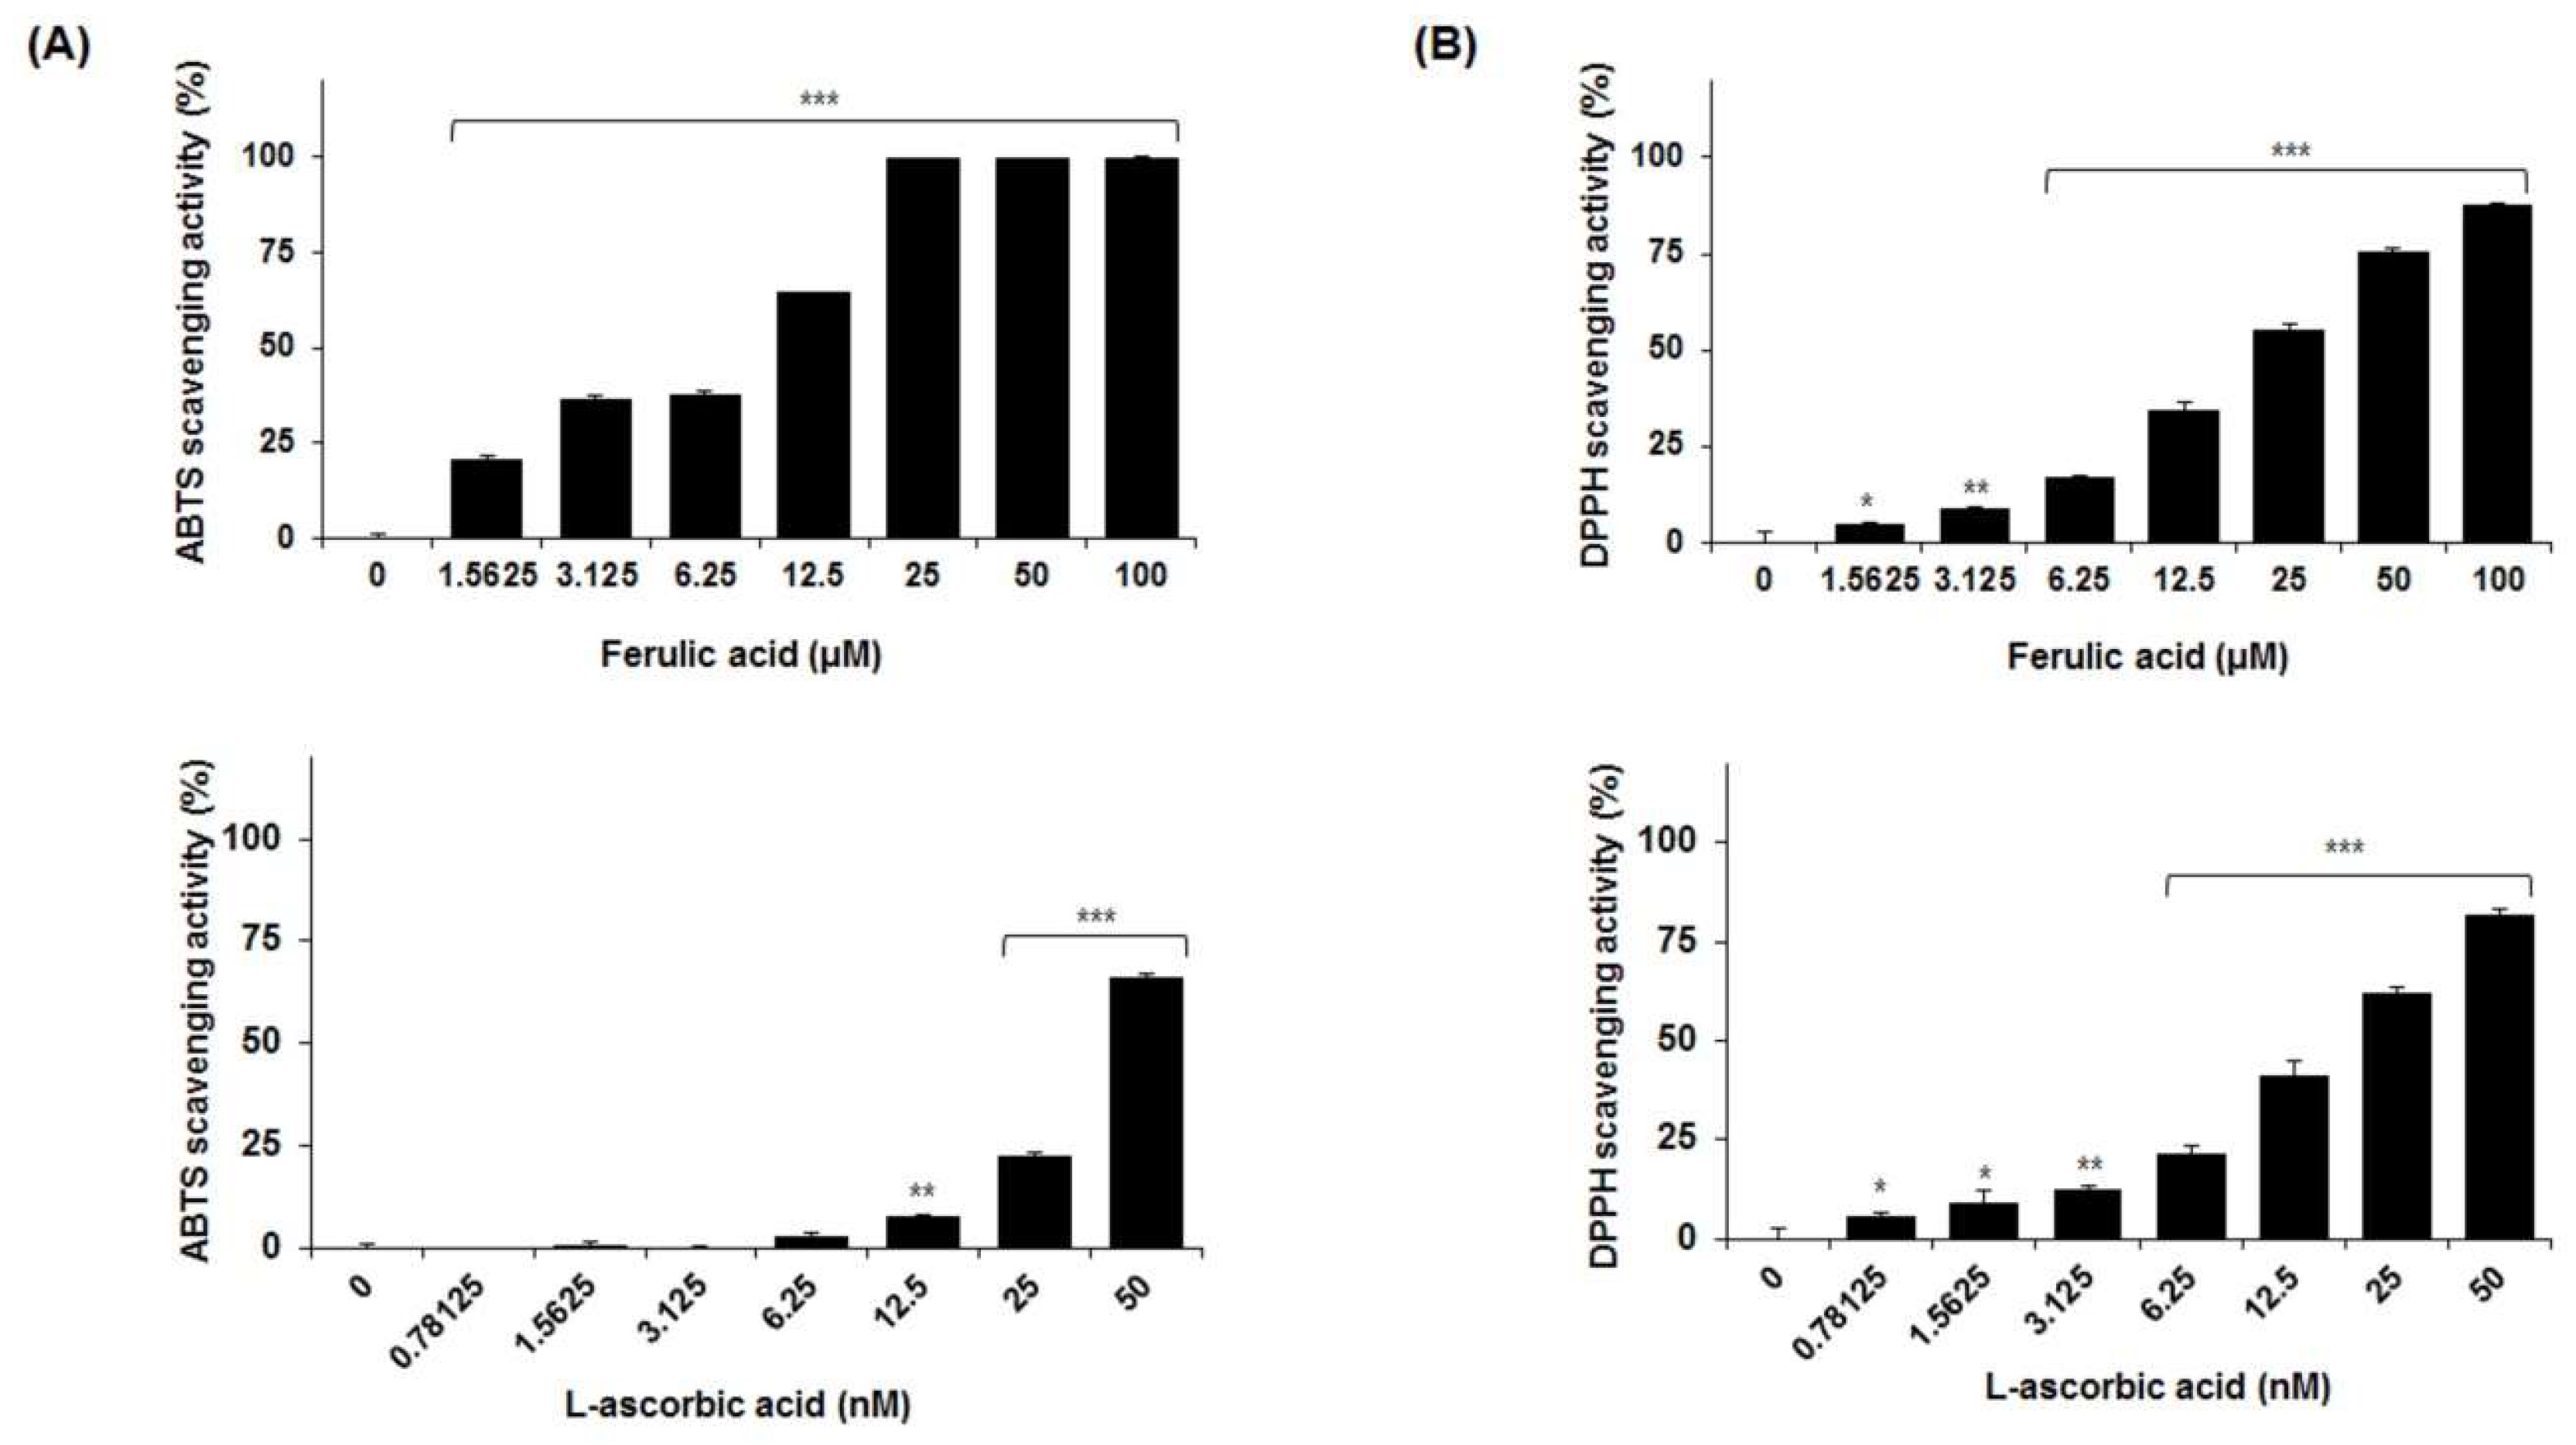
2.5. Antioxidant Activity of the Marker Compounds of UGS

To assess the antioxidant activity of UGS, the current study measured their scavenging activities against the 2,2′-azinobis-(3-ethylbenzothiazoline-6-sulfonic acid) (ABTS) and 2,2′-diphenyl-1-picrylhydrazyl (DPPH) radicals. As shown in Figure 3A,B, UGS extract dose-dependently increased the ABTS and DPPH radical scavenging activities. The effect on DPPH was not significant compared to ABTS. Then, antioxidant activity of the seven marker compounds of UGS was tested. These results revealed that ferulic acid dramatically increased the scavenging activity for ABTS in a dose-dependent manner. The concentration of ferulic acid required for a 50% reduction (RC50) in ABTS radicals was 16.22 μM (Table 7 and Figure 4A). The antioxidant activities obtained for ferulic acid using the DPPH assay are shown in Table 8 and Figure 4B. Similar to the results observed for ABTS, ferulic acid reduced the formation of the DPPH radical in a dose-dependent manner. The RC50 of ferulic acid against DPPH radicals was 41.21 μM. L-ascorbic acid was used as a positive antioxidant control compound.

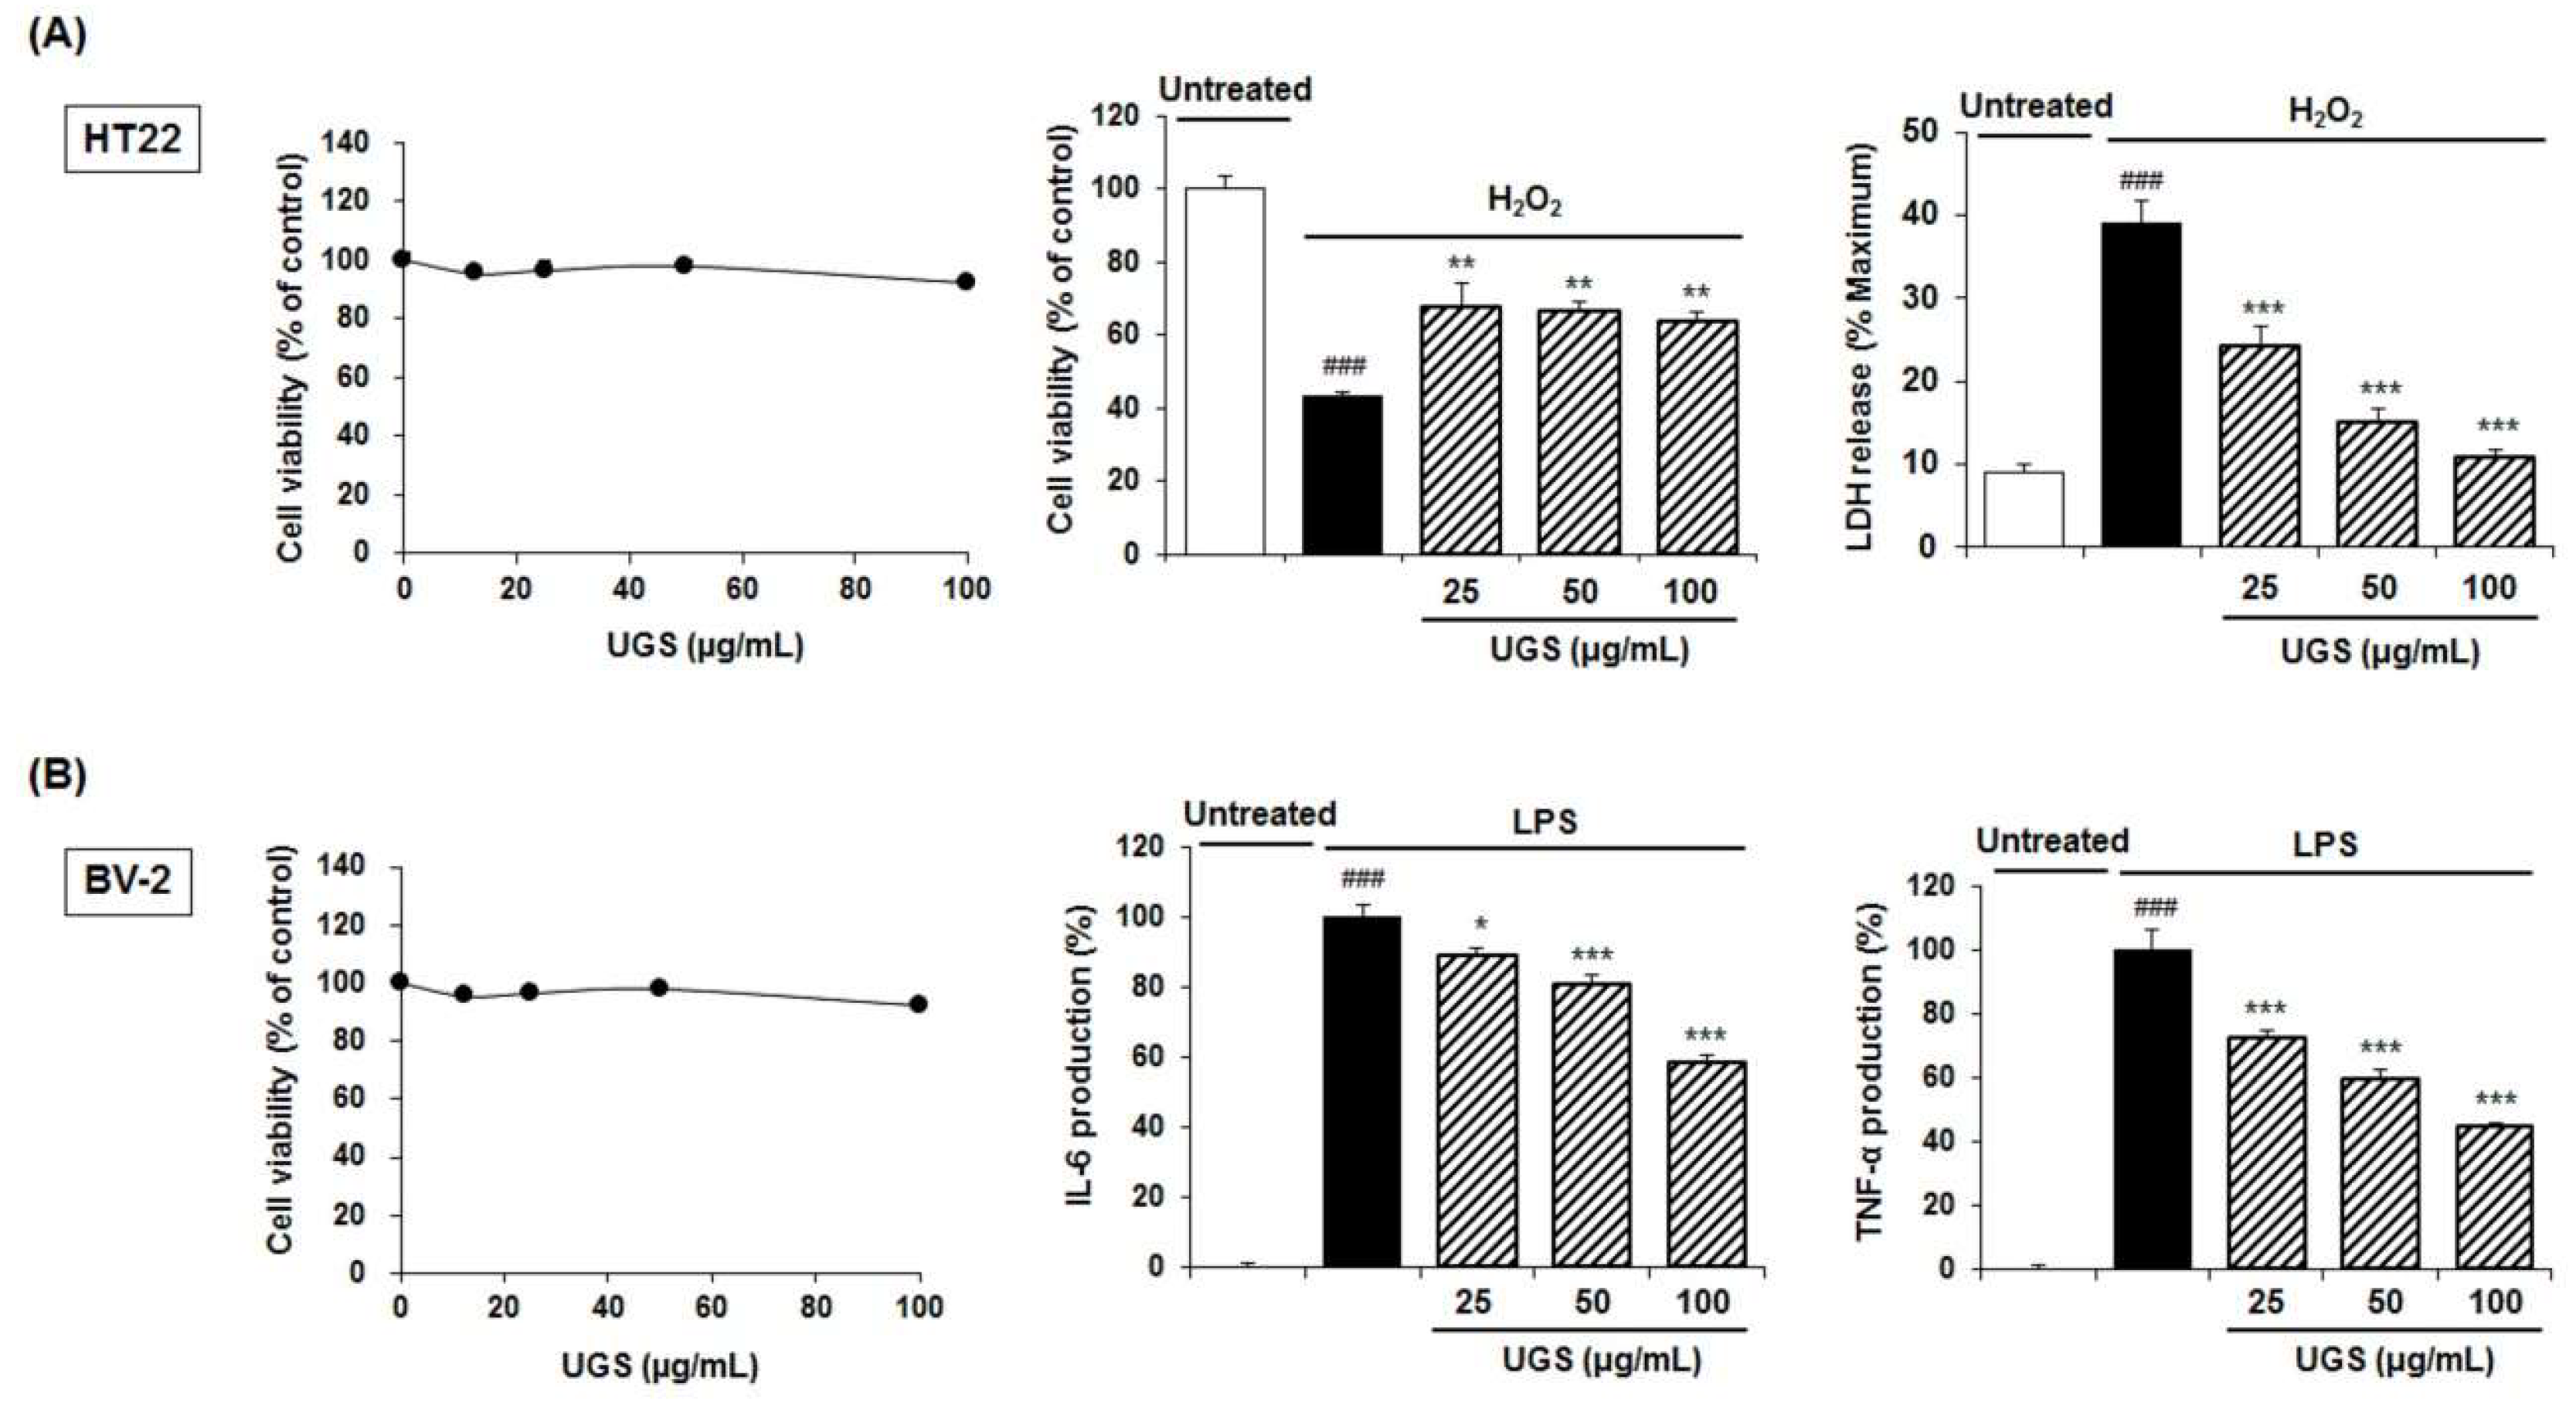
2.6. Biological Activitis of the UGS Extract in Neuronal Cell Lines

The current study examined the biological effects of the UGS extract on the neurodegenerative diseases. The cell viability test was carried out to measure the viability of HT22 hippocampal cells against UGS extract. Treatment with UGS extract did not affect the cell viability at ≤100 μg/mL (Figure 5A). Then, the neuroprotection activity of UGS was investigated. HT22 cells were stimulated with H2O2 in the absence or presence of the UGS extract. H2O2 treatment significantly decreased the viability of HT22 whereas UGS extract significantly reversed the H2O2-mediated cell death. The generation of lactose dehydrogenase (LDH) was further confirmed the neuroprotective effect of UGS. Consistent with the results of viability assay, H2O2 stimulation significantly enhanced the release of LDH compared with the untreated cells. In contrast, the UGS extract significantly blocked the release of LDH in H2O2-stimulated HT22 cells compared with the cells treated with H2O2 alone (Figure 5A).
Additionally, the inhibitory effect of UGS on neuroinflammation was studied using microglia cell line. The cell viability assay was performed to assess cytotoxicity of UGS against BV-2 cells. As shown in Figure 5B, no cytotoxicity of UGS extract was observed up to 100 μg/mL. Subsequent experiments were conducted at the range of nontoxic concentrations. To investigate the effects of UGS on the pro-inflammatory cytokine production, ELISAs for tumor necrosis factor-alpha (TNF-α) and interleukin-6 (IL-6) was performed using culture supernatant from the lipopolysaccharide (LPS)-stimulated BV-2 cells. Results showed that stimulation with LPS- significantly increased TNF-α and IL-6 levels. In contrast, UGS treatment significantly reversed the LPS effect on production of TNF-α and IL-6 (Figure 5B).

3. Discussion

In these study, a simultaneous analysis of the seven marker compounds of UGS was performed using the HPLC-PDA method. The main ingredients of each medicinal herb forming UGS, are as follows: alkaloids (e.g., corynoxeine and hirsutine) from Uncaria sinensis [21], sesquiterpenes (e.g., atractylon and atractylenolide I-III) from Atractylodes japonica [22], triterpenes (e.g., pachymic acid, dehydrotumulosic acid, and dehydrotrametenolic acid) from Poria cocos [23], triterpene saponins (e.g., saikosaponin A, C, and D) from Bupleurum falcatum [24], coumarins (e.g., decursin, decursinol angelate, and nodakenin) from Angelica gigas [25], alkylphthalides (e.g., cnidilide, ligustilide, butylphthalide, and neocnidilide) and phenol (e.g., ferulic acid) from Cnidium officinale [26,27], and flavonoids (e.g., liquiritin, liquiritin apioside and liquiritigenin) and triterpene saponins (e.g., glycyrrhizin) from Glycyrrhiza uralensis [28]. Among the various ingredients, the current study conducted simultaneous determination of the seven components liquiritin apioside, liquiritin, glycyrrhizin (Glycyrrhiza uralensis), ferulic acid (Cnidium officinale), decursin, decursinol angelate (Angelica gigas), and atractylenolide I (Atractylodes japonica) in the formulation of UGS by the established and validated analytical HPLC-PDA method. Consequently, decursin (16.431 mg/g), marker compound of Angelica gigas, was found as major compound in the UGS.
There are increasing evidence on the powerful antioxidant activity of herbal medicines [29,30]. Herbal medicines contain various free radical scavenging molecules that mediate oxidative stress, which ultimately causes a variety of diseases such as cancer, inflammation, and metabolic disorders [31,32,33]. Thus, antioxidant therapy is considered as an attractive approach to treat various human diseases [34,35]. To date, previous studies reported significant antioxidant activities of various herbal formulas such Galkeun-tang [36] and Samchulgeonbi-tang [37] by regulating the free radical scavenging activity were reported. The current study data revealed that UGS extract activate the free radical scavenging effects against ABTS and DPPH. Among seven marker compounds, ferulic acid showed antioxidant activity compared with others. The scavenging activities of UGS extract were 100 ± 0.1% and 87.8 ± 0.5% for ABTS and DPPH, respectively, at 100 μg/mL. In contrast, the activities of other six compounds were below 43.6% and 4.1% for ABTS and DPPH, respectively, at 100 μg/mL. These results suggest that ferulic acid may be an active compound of UGS possessing the potent antioxidant activity.
Similarly, Liang et al. reported in vitro antioxidant effect of ferulic acid from Spiranthes sinensis [38]. Additionally, to investigate the biological activity of UGS on the neurodegenerative diseases, neuronal cell lines were treated with various concentrations of UGS extract in the presence of neuronal damage inducers H2O2 and LPS, respectively. The results demonstrated that UGS has the effects on neuroprotection and anti-neuroinflammation in vitro. Further studies are required to verify the UGS effect using additional in vitro and in vivo neuronal diseases-related models.
In conclusion, the current study established a HPLC method for the quantitative analysis of the seven marker compounds present in extracts of UGS. Validation results of the method displayed good linearity, repeatability, intra- and inter-day precision, and recovery, indicating a successful application for the simultaneous analysis of marker compounds for the quality control of UGS. In addition, the results of antioxidant activity assays demonstrate the potent antioxidant activity of ferulic acid as an active compound of UGS.

4. Materials and Methods

4.1. Plant Materials

The seven crude herbal medicines forming UGS, Uncariae Ramulus et Uncus, Atractylodis Rhizoma Alba, Poria Sclerotium, Bupleuri Radix, Angelicae Gigantis Radix, Cnidii Rhizoma, and Glycyrrhizae Radix et Rhizoma, were purchased at the Kwangmyungdang herbal market (Ulsan, South Korea). Voucher specimens (SCD-B-032) have been deposited at the Clinical Medicine Division, Korea Institute of Oriental Medicine.

4.2. Chemicals and Reagents

The marker compound glycyrrhizin was purchased from ChemFaces Biochemical Co., Ltd. (Wuhan, China); atractylenolide I, ferulic acid, and decursinol angelate were purchased from Biopurify Phytochemicals (Chengdu, China); and liquiritin apioside, liquiritin, and decursin were purchased from Sunny Biotech Co., Ltd. (Shanghai, China). The chemical structures of compounds are shown in Figure 1. The purity of them was ≥98.0% according to HPLC analysis. HPLC-grade acetonitrile, methanol, and water were purchased from J. T. Baker Chemical Co. (Phillipsburg, NJ, USA), and analytical-grade acetic acid was purchased from Sigma-Aldrich (St. Louis, MO, USA).

4.3. Apparatus and Chromatographic Conditions

A Waters Alliance e2695 HPLC system (Waters Corp., Milford, MA, USA) equipped with a pump, degasser, column oven, auto sample injector, and photodiode array (PDA) detector (#2998, Waters Corp. Milford, MA, USA) was used in the quantitative analysis and Empower software (version 3; Waters Corp, Milford, MA, USA) was used to data processing. The chromatographic separation of the seven marker compounds was performed at 30 °C using a Gemini C-18 analytical column (250 × 4.6 mm, 5 μm; Phenomenex, Torrance, CA, USA) with a gradient solvent system of 1.0% (v/v) aqueous acetic acid (A) and acetonitrile (B). The elution conditions were as follows: 12–42% B for 0–25 min, 42–52% B for 25–30 min, 52–65% B for 30–55 min, 65–100% B for 55–56 min, and 100% B for 56–63 min. The flow rate and injection volume were 1.0 mL/min and 10 μL, respectively. The wavelength range of the PDA detector was 190 nm to 400 nm.

4.4. Preparation of Standard Solutions

The seven marker compounds were dissolved in methanol at a concentration of 1.0 mg/mL. Then, these stock solutions were diluted to make series of standard solutions with different concentrations for quantitative analysis.

4.5. Preparation of the UGS 70% Ethanol Extract and Sample Solutions

The UGS composed of the seven crude herbal medicines, Uncariae Ramulus et Uncus, Atractylodis Rhizoma Alba, Poria Sclerotium, Bupleuri Radix, Angelicae Gigantis Radix, Cnidii Rhizoma, and Glycyrrhizae Radix et Rhizoma, was mixed as indicated in Table 8 (41 g) and extracted using 70% aqueous ethanol (twice each with 246 mL) by refluxing for 2 h at 100 °C. The 70% ethanol extract was then filtered through a filter paper (5 μm) and concentrated using a rotary evaporator system (EYELA N-1000, Rikakikai Co., Tokyo, Japan) under vacuum to make powdered extract (8.613 g). The yield of UGS extract was 21%. The extract of UGS was weighed accurately and dissolved in methanol at 10 mg/ml for simultaneous determination. Then, the sample solution was filtered through a syringe filter (0.45 μm) and used for HPLC analysis. For testing biological activities, the extract of UGS was dissolved in dimethylsulfoxide (DMSO).

4.6. Calibration Curve, LOD, and LOQ

The calibration curves of compounds were calculated from the peak areas of the standard solutions at different concentrations. The concentration ranges of marker compounds were as follows: liquiritin apioside (3.125–50 μg/mL), liquiritin (1.5625–25 μg/mL), ferulic acid (0.78125–25 μg/mL), glycyrrhizin and decursinol angelate (6.25–200 μg/mL), decursin (12.5–400 μg/mL), and atractylenolide I (0.78125–12.5 μg/mL). These solutions were measured in triplicate for the preparation of the calibration curves. The slope of the calibration curve and the standard deviation (SD) of the intercept were used to calculate the LOD and LOQ for the seven marker compounds, as follows:
LOD = 3.3 × (SD of the response/slope of the calibration curve)
LOQ = 10 × (SD of the response/slope of the calibration curve)

4.7. Precision, Accuracy, and Recovery

To evaluate the precision of the established HPLC conditions, intra- and inter-day variations were measured using the mixed standard solutions with low, middle, and high concentration levels of marker compounds. For the measurement of intra-day precision and accuracy, the mixed standard solutions were analyzed five times in a single day. The inter-day precision was assessed by repeating the analysis of the mixed standard solutions for three consecutive days. The intra- and inter-day RSD (%) was used to express the precision, and the percentage of the observed concentration for the fortified concentration were used to present the accuracy. To confirm the repeatability, six replicates were measured using the mixed standard solutions and the RSDs of retention times and peak areas for each compound were used. The recoveries of the seven compounds were determined by adding standard solutions at three different concentration levels (low, middle, and high) to the extract of UGS samples (100 mg for liquiritin apioside, liquiritin, ferulic acid, and atractylenolide I, and 10 mg for glycyrrhizin, decursin, and decursinol angelate); the 90% aqueous methanol was added to volume metric flask to make 10mL sample solution. The recovery was performed five times at each level and calculated as follows:
Recovery   ( % ) = found   concentration   original   concentration spiked   concentration   ×   100

4.8. ABTS-Scavenging Activity

The ABTS radical-scavenging activity of the UGS extract was assessed according to the previous study [36]. The ABTS radical cation was prepared by reaction with a 7 mM ABTS solution and 2.45 mM potassium persulfate, followed by keeping in the dark at room temperature for 16 h. The absorbance of the reaction mixture was adjusted to 0.7 at 734 nm. A 100 μL of sample solution at various concentrations (12.5–200 µg/mL) was mixed with ABTS•+ solution. The mixture was incubated in the dark at room temperature for 5 min and the absorbance at 734 nm was measured using a spectrophotometer (Benchmark Plus, Bio-Rad, CA, USA). The ABTS radical-scavenging capacity of the UGS extract was measured using the following equation:
ABTS   scavenging   activity   ( % ) = 1 absorbance   at   734   nm   of   UGS   extract absorbance   at   734   nm   of   control   ×   100

4.9. DPPH-Scavenging Activity

The DPPH radical-scavenging activity of the UGS extract was assessed according to the previous study [37]. In brief, a 100 μL aliquot of sample solution at various concentrations was mixed with 100 μL of 0.15 mM DPPH solution in methanol. The mixture was incubated in the dark at room temperature for 30 min and the absorbance at 517 nm was measured on a spectrophotometer (Benchmark Plus, Bio-Rad, CA, USA). The DPPH radical-scavenging capacity of the UGS extract was measured using the following equation:
DPPH   scavenging   activity   ( % ) = 1 absorbance   at   517   nm   of   UGS   extract absorbance   at   517   nm   of   control   ×   100

4.10. Cell Lines and Culture

HT22 and BV-2 cells were maintained in Dulbecco’s modified Eagle’s medium (Hyclone/Thermo, Rockford, IL, USA) supplemented with 10% fetal bovine serum (Hyclone/Thermo, Rockford, IL, USA) and penicillin/streptomycin in 5% CO2 at 37 °C.

4.11. Cell Counting Kit (CCK) Assay

Cells were plated on 96-well microplates and treated with various concentrations of UGS extract in DMSO for 24 h. After adding CCK-8 solution (Dojindo, Kumamoto, Japan) to each well, and the cells were maintained for 4 h at 37 °C. The absorbance at 450 nm was measured on an Epoch microplate spectrophotometer (Bio-Tek Instruments, Inc., Winooski, VT, USA). The cell viability was determined using the following equation:
Cell   viability   ( % ) = Mean   OD   in   UGS   extract treated   cells Mean   OD   in   untreated   cells   ×   100
To examine the neuroprotective effect of UGS extract, HT22 cells were co-treated with UGS and H2O2 (Sigma-Aldrich, St. Louis, MO, USA) for 6 h.

4.12. LDH Release Assay

The release of LDH was measured using the CytoTox 96 nonradioactive cytotoxicity assay kit (Promega, Madison, WI, USA). Cell lysates and supernatants were prepared to induce maximal LDH release and experimental LDH release, respectively, and incubated with substrate mixture in the dark at room temperature for 30 min. Stop solution was added to each well and absorbance at 490 nm was determined on an Epoch microplate spectrophotometer (Bio-Tek Instruments, Inc., Winooski, VT, USA). The cytotoxicity of the UGS extract was calculated using the following formula:
Cytotoxicity   ( % ) = Experimental   LDH   release   Maximum   LDH   release   ×   100

4.13. Enzyme-Linked Immunosorbent Assays (ELISAs) for Cytokine Production

BV-2 cells were pretreated with UGS extract for 2 h and treated with LPS (1 μg/mL) for an additional 22 h. Culture supernatants were collected and the levels of TNF-α and IL-6 were assessed using ELISA kits from R&D Systems (Minneapolis, MN, USA).

4.14. Statistical Analysis

The data are expressed as the mean ±SEM. Data were analyzed using one-way analysis of variance and Dunnett’s multiple comparisons test and student’s t-test. P < 0.05 was considered significant.

Supplementary Materials

Supplementary Figure 1 is available online.

Author Contributions

Y.J.K., H.-S.L., and S.-J.J. participated in the design of the study data analyses and manuscript preparation. Y.J.K., J.Y. and C.-S.S. conducted JDS extract and simultaneous determination of seven constituents in JDS extract using HPLC-PDA method. H.-S.L., E.S., B.-Y.K., and S.-J.J. conducted the biological examination of in vitro. All authors read and approved the final manuscript.

Funding

This research received no external funding.

Acknowledgments

This study was supported by a research grant (C17120 and K18293) from the Korea Institute of Oriental Medicine (KIOM).

Conflicts of Interest

The authors declare no conflict of interest.

References

  1. Ogawa, Y.; Fujii, Y.; Sugiyama, R.; Konishi, T. The role of the seven crude drug components in the sleep-promoting effect of Yokukansan. J. Ethnopharmacol. 2016, 177, 19–27. [Google Scholar] [CrossRef] [PubMed]
  2. Ozone, M.; Yagi, T.; Chiba, S.; Aoki, K.; Kuroda, A.; Mitsui, K.; Ithoh, H.; Sasaki, M. Effect of yokukansan on psychophysiological insomnia evaluated using cyclic alternating pattern as an objective marker of sleep instability. Sleep. Biol. Rhythms 2012, 10, 157–160. [Google Scholar] [CrossRef]
  3. Horiguchi, J. Clinical usage of Yi-gan san-schizophrenia, borderline personality disorder, dyskinesia etc-. Psychiatria et neurologia Japonica 2012, 114, 708–718. [Google Scholar] [PubMed]
  4. Miyaoka, T.; Furuya, M.; Yasuda, H.; Hayashida, M.; Nishida, A.; Inagaki, T.; Horiguchi, J. Yi-gan san for the treatment of neuroleptic-induced tardive dyskinesia: An open-label study. Prog. Neuropsychopharmacol. Biol. Psychiatry 2008, 32, 761–764. [Google Scholar] [CrossRef] [PubMed]
  5. Shim, Y.H.; Park, J.Y.; Choi, W.W.; Min, I.K.; Park, S.U.; Jung, W.S.; Moon, S.K.; Park, J.M.; Ko, C.N.; Cho, K.H.; et al. Herbal medicine treatment for drug-induced parkinsonism. J. Altern. Complement. Med. 2015, 21, 273–280. [Google Scholar] [CrossRef] [PubMed]
  6. Lee, J.H.; Yang, T.J.; Jeong, S.J.; Wei, T.S. Effects of Ukgansan Pharmacopuncture at GB20 on Cognitive Impariment Induced by Focal Brain Injury in Rats. J. Acupunct Res. 2016, 33, 101–116. [Google Scholar] [CrossRef]
  7. Nagata, K.; Yokoyama, E.; Yamazaki, T.; Takano, D.; Maeda, T.; Takahashi, S.; Terayama, Y. Effects of yokukansan on behavioral and psychological symptoms of vascular dementia: An open-label trial. Phytomedicine 2012, 19, 524–528. [Google Scholar] [CrossRef] [PubMed]
  8. Sumiyoshi, H.; Mantani, A.; Nishiyama, S.; Fujiwaki, S.; Ohta, S.; Masuda, Y.; Tomita, Y.; Tarumoto, N.; Yamawaki, S. Yokukansan treatment of chronic renal failure patients receiving hemodialysis, with behavioral and psychological symptoms of dementia: An open-label study. Am. J. Geriatr. Psychiatry 2013, 21, 1082–1085. [Google Scholar] [CrossRef] [PubMed]
  9. Matsunaga, S.; Kishi, T.; Iwata, N. Yokukansan in the Treatment of Behavioral and Psychological Symptoms of Dementia: An Updated Meta-Analysis of Randomized Controlled Trials. J. Alzheimers Dis. 2016, 54, 635–643. [Google Scholar] [CrossRef] [PubMed]
  10. Ramalingayya, G.V.; Sonawane, V.; Cheruku, S.P.; Kishore, A.; Nayak, P.G.; Kumar, N.; Shenoy, R.S.; Nandakumar, K. Insulin Protects against Brain Oxidative Stress with an Apparent Effect on Episodic Memory in Doxorubicin-Induced Cognitive Dysfunction in Wistar Rats. J. Environ. Pathol. Toxicol. Oncol. 2017, 36, 121–130. [Google Scholar] [CrossRef] [PubMed]
  11. Choi, J.Y.; Jang, J.S.; Son, D.J.; Im, H.S.; Kim, J.Y.; Park, J.E.; Choi, W.R.; Han, S.B.; Hong, J.T. Antarctic Krill Oil Diet Protects against Lipopolysaccharide-Induced Oxidative Stress, Neuroinflammation and Cognitive Impairment. Int. J. Mol. Sci. 2017, 18, 2554. [Google Scholar] [CrossRef] [PubMed]
  12. Piri, H.; Haghdoost-Yazdi, H.; Fraidouni, N.; Dargahi, T.; Yaghoubidoust, M.; Azadmehr, A. The Anti-Parkinsonism Effects of KATP Channel Blockade in the 6-Hydroxydopamine-Induced Animal Model: The Role of Oxidative Stress. Basic. Clin. Neurosci. 2017, 8, 183–192. [Google Scholar] [CrossRef] [PubMed]
  13. Kim, J.H.; Seo, C.S.; Kim, S.S.; Shin, H.K. Quality Assessment of Ojeok-San, a Traditional Herbal Formula, Using High-Performance Liquid Chromatography Combined with Chemometric Analysis. J. Anal. Methods Chem. 2015, 2015, 607252. [Google Scholar] [CrossRef] [PubMed]
  14. Gai, Y.; Chen, H.; Wu, C.; Feng, F.; Wang, Y.; Liu, W.; Wang, S. Analysis of the traditional medicine YiGan San by the fragmentation patterns of cadambine indole alkaloids using HPLC coupled with high-resolution MS. J. Sep. Sci. 2013, 36, 3723–3732. [Google Scholar] [CrossRef] [PubMed]
  15. Chen, H.; Shi, Y.-Y.; Wei, M.-L.; Liu, W.-Y.; Feng, F. Chemical profile of the active fraction of Yi-Gan San by HPLC-DAD-Q-TOF-MS and its neuroprotective effect against glutamate-induced cytotoxicity. Chin. J. Nat. Med. 2014, 12, 869–880. [Google Scholar] [CrossRef]
  16. Machado, K.N.; Freitas, A.A.; Cunha, L.H.; Faraco, A.A.G.; Pádua, R.M.; Braga, F.C.; Vianna-Soares, C.D.; Castilho, R.O. A rapid simultaneous determination of methylxanthines and proanthocyanidins in Brazilian guaraná (Paullinia cupana Kunth.). Food Chem. 2018, 239, 180–188. [Google Scholar] [CrossRef] [PubMed]
  17. Seo, C.-S.; Shin, H.-K. Simultaneous Quantification of Eight Marker Compounds in Yongdamsagan-Tang Using a High-Performance Liquid Chromatography Equipped with Photodiode Array Detector. J. Chromatogr. Sci. 2017, 55, 923–933. [Google Scholar] [CrossRef] [PubMed]
  18. Lim, H.S.; Kim, O.S.; Kim, B.Y.; Jeong, S.J. Apigetrin from Scutellaria baicalensis Georgi Inhibits Neuroinflammation in BV-2 Microglia and Exerts Neuroprotective Effect in HT22 Hippocampal Cells. J. Med. Food 2016, 19, 1032–1040. [Google Scholar] [CrossRef] [PubMed]
  19. Kim, Y.J.; Lim, H.S.; Lee, J.; Jeong, S.J. Quantitative Analysis of Psoralea corylifolia Linne and its Neuroprotective and Anti-Neuroinflammatory Effects in HT22 Hippocampal Cells and BV-2 Microglia. Molecules 2016, 21, 1076. [Google Scholar] [CrossRef] [PubMed]
  20. Lim, H.S.; Kim, B.Y.; Kim, Y.J.; Jeong, S.J. Phytochemical allylguaiacol exerts a neuroprotective effect on hippocampal cells and ameliorates scopolamine-induced memory impairment in mice. Behav. Brain Res. 2018, 339, 261–268. [Google Scholar] [CrossRef] [PubMed]
  21. Kushida, H.; Fukutake, M.; Tabuchi, M.; Katsuhara, T.; Nishimura, H.; Ikarashi, Y.; Kanitani, M.; Kase, Y. Simultaneous quantitative analyses of indole and oxindole alkaloids of Uncaria Hook in rat plasma and brain after oral administration of the traditional Japanese medicine Yokukansan using high-performance liquid chromatography with tandem mass spectrometry. Biomed. Chromatogr. 2013, 27, 1647–1656. [Google Scholar] [CrossRef] [PubMed]
  22. Chen, L.G.; Jan, Y.S.; Tsai, P.W.; Norimoto, H.; Michihara, S.; Murayama, C.; Wang, C.C. Anti-inflammatory and Antinociceptive Constituents of Atractylodes japonica Koidzumi. J. Agric. Food Chem. 2016, 64, 2254–2262. [Google Scholar] [CrossRef] [PubMed]
  23. Li, T.H.; Hou, C.C.; Chang, C.L.; Yang, W.C. Anti-Hyperglycemic Properties of Crude Extract and Triterpenes from Poria cocos. Evid. Based. Complement. Alternat. Med. 2011, 2011, 128402. [Google Scholar] [CrossRef] [PubMed]
  24. Yang, F.; Dong, X.; Yin, X.; Wang, W.; You, L.; Ni, J. Radix Bupleuri: A Review of Traditional Uses, Botany, Phytochemistry, Pharmacology, and Toxicology. Biomed Res. Int. 2017, 2017, 7597596. [Google Scholar] [CrossRef] [PubMed]
  25. Jeong, S.Y.; Kim, H.M.; Lee, K.H.; Kim, K.Y.; Huang, D.S.; Kim, J.H.; Seong, R.S. Quantitative analysis of marker compounds in Angelica gigas, Angelica sinensis, and Angelica acutiloba by HPLC/DAD. Chem. Pharm. Bull. 2015, 63, 504–511. [Google Scholar] [CrossRef] [PubMed]
  26. Islam, M.N.; Yoo, H.H.; Sung, C.K.; Dong, M.S.; Park, Y.I.; Jin, C.; Kim, D.H. Simultaneous determination of phenolic acids and phthalide compounds by liquid chromatography for quality assessment of Rhizoma cnidii. J. AOAC Int. 2009, 92, 375–381. [Google Scholar] [PubMed]
  27. Lee, B.; Weon, J.B.; Yun, B.R.; Lee, J.; Eom, M.R.; Ma, C.J. Simultaneous determination of 11 major components in Palmul-tang by HPLC-DAD and LC-MS-MS. J. Chromatogr. Sci. 2014, 52, 482–492. [Google Scholar] [CrossRef] [PubMed]
  28. Zhang, Q.; Ye, M. Chemical analysis of the Chinese herbal medicine Gan-Cao (licorice). J. Chromatogr. A. 2009, 1216, 1954–1969. [Google Scholar] [CrossRef] [PubMed]
  29. Kasote, D.M.; Katyare, S.S.; Hegde, M.V.; Bae, H. Significance of antioxidant potential of plants and its relevance to therapeutic applications. Int. J. Biol. Sci. 2015, 11, 982–991. [Google Scholar] [CrossRef] [PubMed]
  30. Krishnaiah, D.; Sarbatly, R.; Nithyanandam, R. A review of the antioxidant potential of medicinal plant species. Food Bioprod. Process. 2011, 89, 217–233. [Google Scholar] [CrossRef]
  31. Gumula, I.; Alao, J.P.; Ndiege, I.O.; Sunnerhagen, P.; Yenesew, A.; Erdélyi, M. Flemingins G–O, Cytotoxic and Antioxidant Constituents of the Leaves of Flemingia grahamiana. J. Nat. Prod. 2014, 77, 2060–2067. [Google Scholar] [CrossRef] [PubMed]
  32. Sun, J.Y.; You, C.Y.; Dong, K.; You, H.S.; Xing, J.F. Anti-inflammatory, analgesic and antioxidant activities of 3,4-oxo-isopropylidene-shikimic acid. Pharm. Biol. 2016, 54, 2282–2287. [Google Scholar] [CrossRef] [PubMed]
  33. Niu, J.; Xu, G.; Jiang, S.; Li, H.; Yuan, G. In Vitro Antioxidant activities and anti-diabetic effect of a polysaccharide from Schisandra sphenanthera in rats with type 2 diabetes. Int. J. Biol. Macromol. 2017, 94, 154–160. [Google Scholar] [CrossRef] [PubMed]
  34. Zhang, Y.J.; Gan, R.Y.; Li, S.; Zhou, Y.; Li, A.N.; Xu, D.P.; Li, H.B. Antioxidant Phytochemicals for the Prevention and Treatment of Chronic Diseases. Molecules 2015, 20, 21138–21156. [Google Scholar] [CrossRef] [PubMed] [Green Version]
  35. Sharma, A.K.; Dobhal, M.P.; Sharma, M.C. In Vitro Antioxidant Activity of Selected Medicinal Plants Reported in Ancient Ayurveda Traditions. Curr. Tradit. Med. 2017, 3, 190–194. [Google Scholar] [CrossRef]
  36. Jeong, S.J.; Yoo, S.R.; Kim, O.S.; Seo, C.S.; Shin, H.K. Antioxidant and antiadipogenic activities of galkeun-tang, a traditional korean herbal formula. Evid. Based Complement. Alternat. Med. 2014, 2014, 763494. [Google Scholar] [CrossRef] [PubMed]
  37. Yoo, S.R.; Seo, C.S.; Kim, O.S.; Shin, H.K.; Jeong, S.J. Anti-adipogenic and antioxidant effects of the traditional Korean herbal formula Samchulgeonbi-tang: An in vitro study. Int. J. Clin. Exp. Med. 2015, 8, 8698–8708. [Google Scholar] [PubMed]
  38. Liang, C.P.; Chang, C.H.; Liang, C.C.; Hung, K.Y.; Hsieh, C.W. In vitro antioxidant activities, free radical scavenging capacity, and tyrosinase inhibitory of flavonoid compounds and ferulic acid from Spiranthes sinensis (Pers.) Ames. Molecules 2014, 19, 4681–4694. [Google Scholar] [CrossRef] [PubMed]
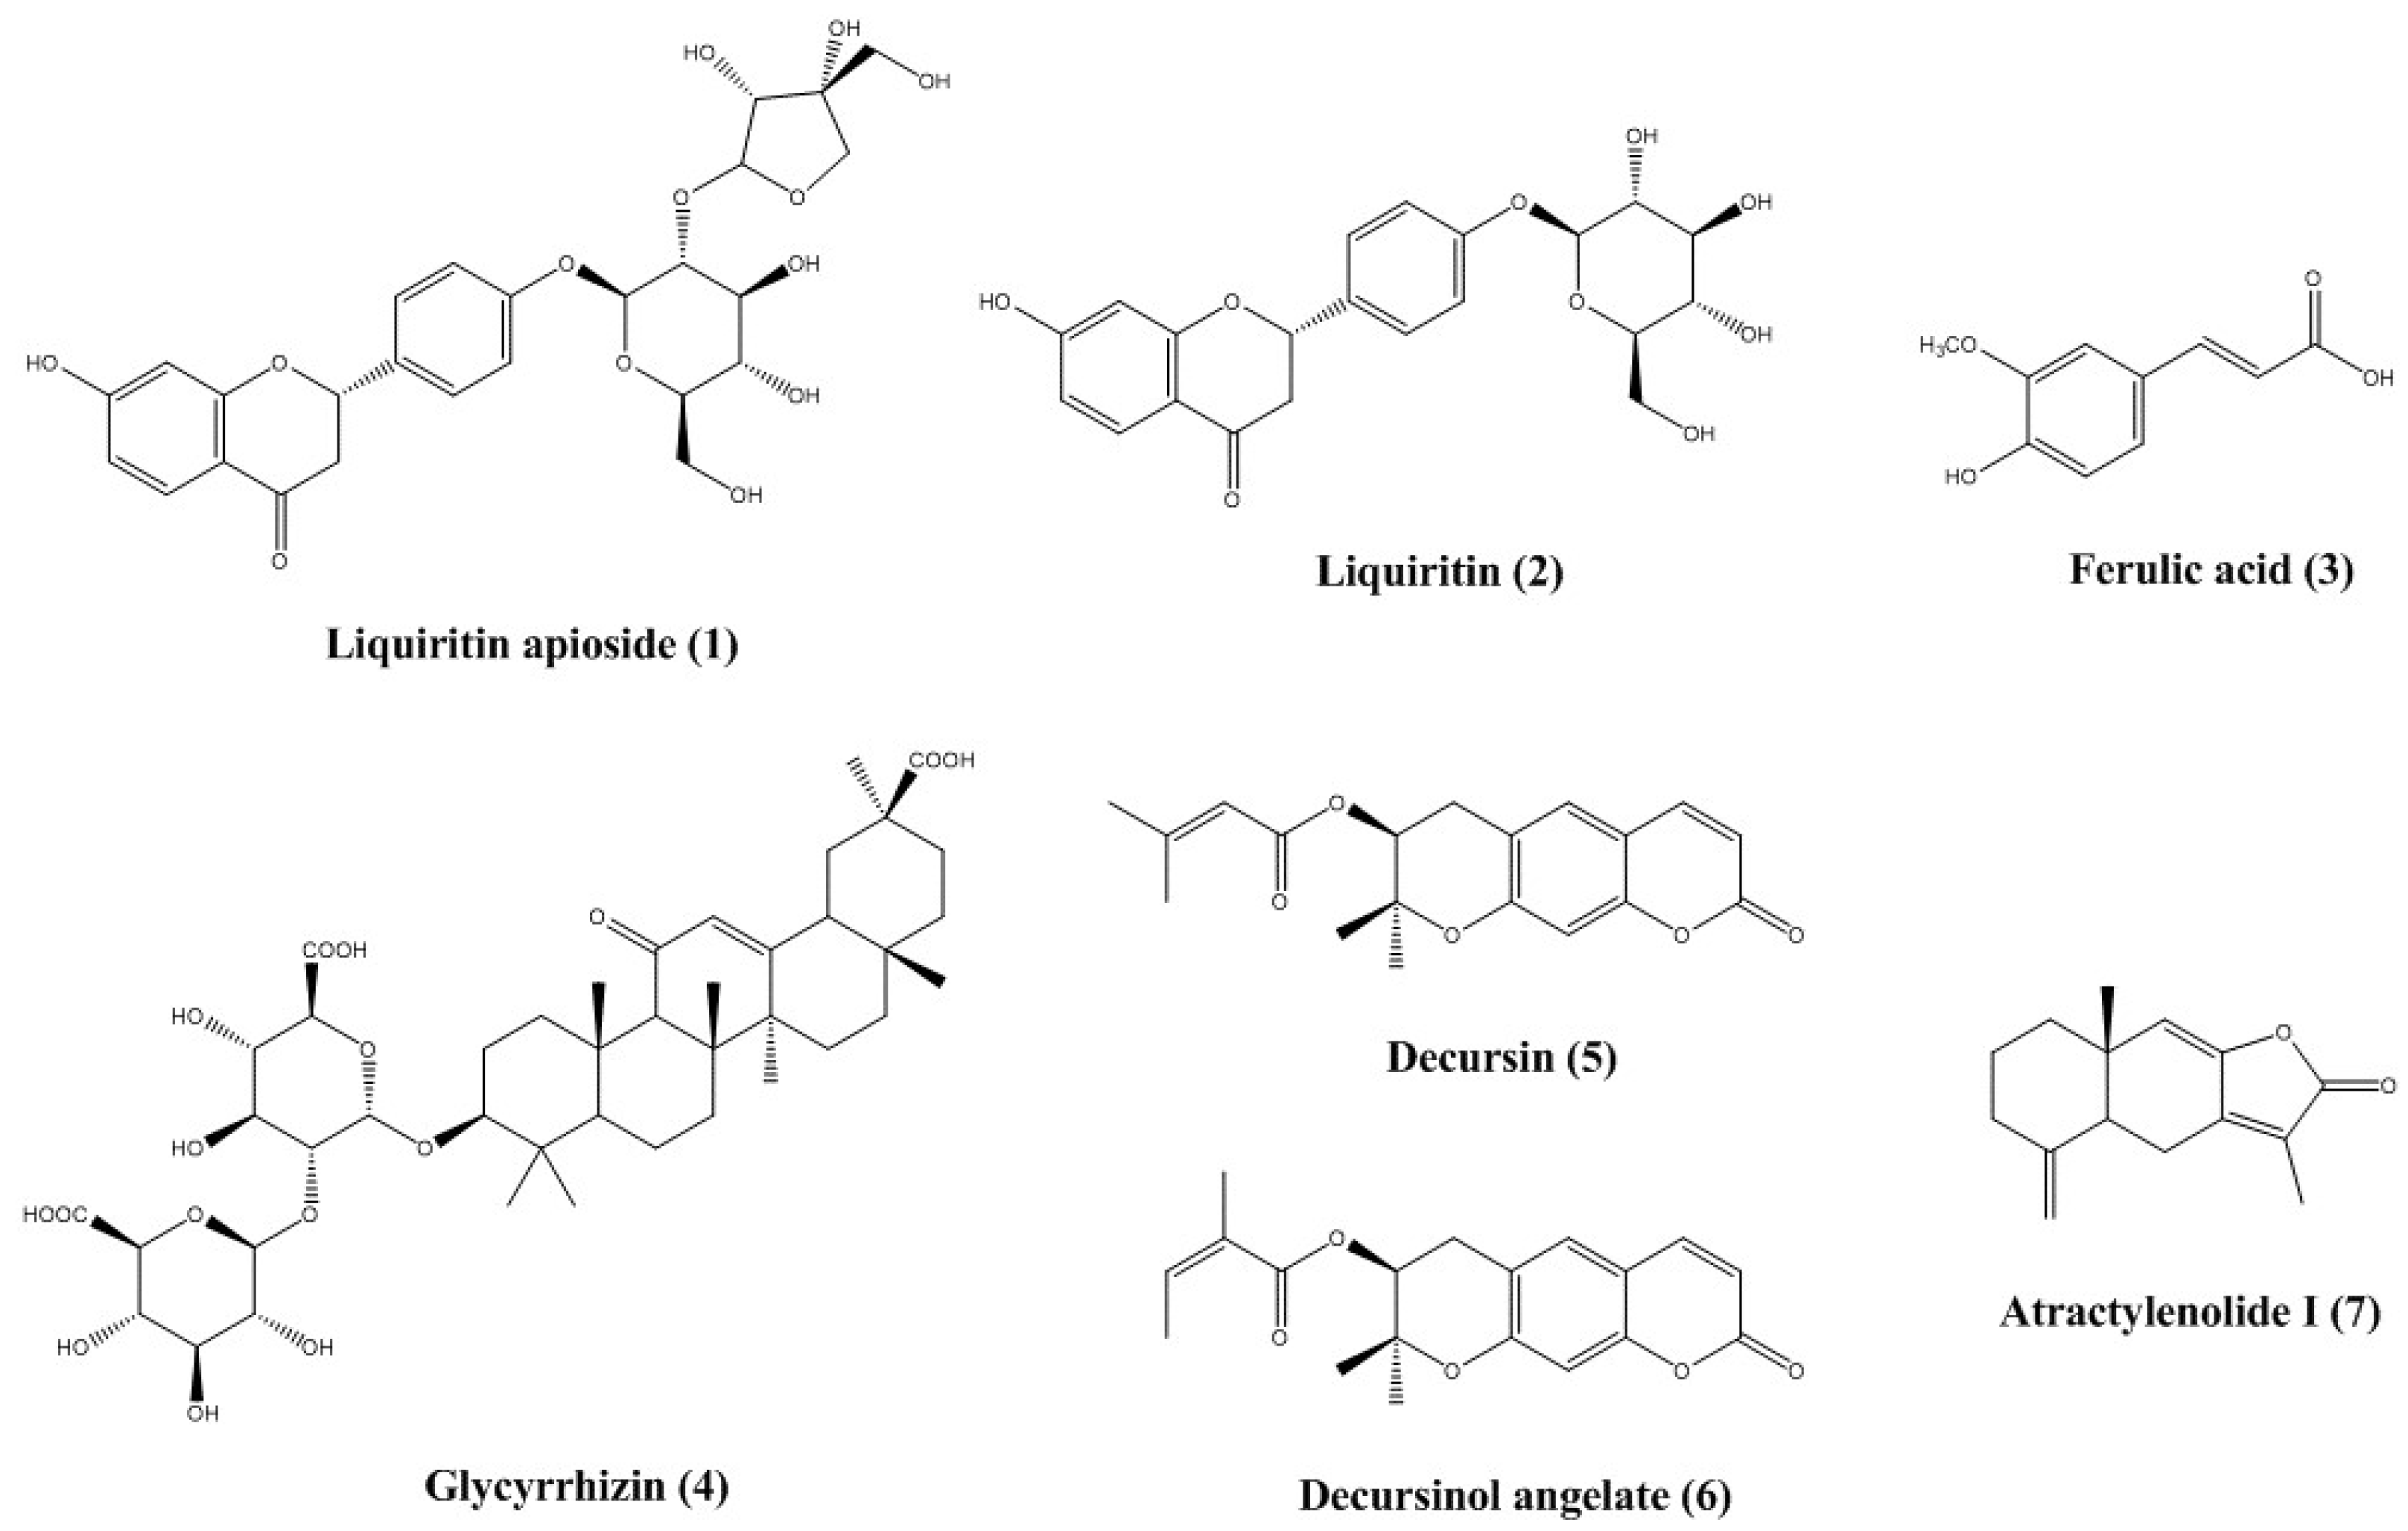
Sample Availability: Samples of the compounds liquiritin apioside, liquiritin, ferulic acid, glycyrrhizin, decursin, decursinol angelate, and atractylenolide I are commercially available.
Figure 1. Chemical structures of the seven marker compounds of UGS.
Molecules 23 01659 g001
Figure 2. HPLC chromatograms of the 70% ethanol extract of UGS (A) and a standard mixture (B) at 250 nm, 276 nm, and 325 nm. Liquiritin apioside (1), liquiritin (2), ferulic acid (3), glycyrrhizin (4), decursin (5), decursinol angelate (6), and atractylenolide I (7).
Molecules 23 01659 g002
Figure 3. Effects of UGS on free radical-scavenging activities. The antioxidant activity of UGS against ABTS (A) or DPPH (B) was assessed using a radical-scavenging method. The quantitative data are presented as the mean ±SEM of triplicate experiments. ** P < 0.01” or *** P < 0.001 vs vehicle control cells n = 3/sample. ‘0′ in x-axis represents vehicle control. AA: L-ascorbic acid, a positive control.
Molecules 23 01659 g003
Figure 4. Effects of ferulic acid on free radical-scavenging activities. The antioxidant activity of different concentrations of ferulic acid and L-ascorbic acid against ABTS (A) or DPPH (B), as assessed using a radical-scavenging method. L-ascorbic acid was used as a positive control of antioxidant. The quantitative data are presented as the mean ± SEM of triplicate experiments. * P < 0.05, ** P < 0.01 or *** P < 0.001 vs vehicle control cells n = 3/sample.
Molecules 23 01659 g004
Figure 5. Biological effects of UGS extract on neuroprotection and anti-inflammation in HT22 neuronal hippocampal cells and BV-2 microglia. (A) Cell viability was performed to assess the cytotoxicity of HT22 cells against UGS extract using the cell counting Kit (CCK)-8 assay. Neuroprotective activity of UGS was tested using the CCK assay (middle) and LDH release assay (right). The results are expressed as the mean ±SEM of three independent experiments. ### P < 0.001 vs vehicle control cells; *** P < 0.001 and ** P < 0.01 vs H2O2-treated cells. (B) Cell viability was performed to assess the cytotoxicity of BV-2 cells against UGS extract using the CCK-8 assay. The UGS effect on lipopolysaccharide (LPS)-induced production of proinflammatory cytokines were assessed in BV-2 cells using ELISA. Cells were pretreated with UGS for 2 h and then stimulated with LPS for an additional 22 h. The results are expressed as the mean ± SEM of three independent experiments. ### P < 0.001 vs vehicle control cells; *** P < 0.001, ** P < 0.01 and * P < 0.05 vs LPS-treated cells.
Molecules 23 01659 g005
Table 1. Composition of UGS.
Latin NameScientific NameAmount (g)Origin
Uncariae Ramulus et UncusUncaria sinensis6China
Atractylodis Rhizoma AlbaAtractylodes japonica8China
Poria SclerotiumPoria cocos8China
Bupleuri RadixBupleurum falcatum4China
Angelicae Gigantis RadixAngelica gigas6Bonghwa, Korea
Cnidii RhizomaCnidium officinale6China
Glycyrrhizae Radix et RhizomaGlycyrrhiza uralensis3China
Total amount 41
Table 2. Linear range, regression equation, correlation coefficients, LODs, and LOQs for compounds.
Compound.Linear Range
(μg/mL)
Regression Equation
(y = ax + b) a)
r2LOD b)
(μg/mL)
LOQ c)
(μg/mL)
Slope (a)Intercept (b)
Liquiritin apioside3.125–50152904536.91.00000.1770.537
Liquiritin1.5625–25187592614.90.99990.0520.157
Ferulic acid0.78125–25569951865.61.00000.0390.118
Glycyrrhizin6.25–2004882.515331.00000.6191.876
Decursin12.5–40030409774570.99980.9252.804
Decursinol angelate6.25–20035125388480.99980.2320.705
Atractylenolide I0.78125–12.5626151322.91.00000.0150.046
a)y = ax + b, y means peak area and x means concentration (μg /mL). b) LOD (Limit of detection): 3.3 × (SD of the response/slope of the calibration curve). c) LOQ (Limit of quantitation): 10 × (SD of the response/slope of the calibration curve).
Table 3. The content of marker compounds in UGS.
CompoundContent (mg/g)
Liquiritin apioside1.671 ± 0.004
Liquiritin2.014 ± 0.004
Ferulic acid0.605 ± 0.002
Glycyrrhizin10.267 ± 0.05
Decursin16.431 ± 0.04
Decursinol angelate7.606 ± 0.002
Atractylenolide I0.190 ± 0.001
Table 4. Precision and accuracy of seven marker compounds in UGS.
CompoundFortified Conc. (μg/mL)Intra-Day (n = 5)Inter-Day (n = 5)
Observed Conc. (μg/mL)Precision a) (%)Accuracy b) (%)Observed Conc. (μg/mL)Precision (%)Accuracy (%)
Liquiritin apioside54.842.1196.885.011.25100.18
1010.141.49101.3610.190.96101.87
2020.100.96100.5020.150.61100.76
Liquiritin54.992.5299.785.090.74101.84
1010.501.65105.0410.361.14103.63
2020.491.13102.4620.440.73102.18
Ferulic acid1.51.463.3697.631.472.7397.81
33.151.36105.122.972.9898.93
66.280.84104.635.852.9097.42
Glycyrrhizin12.512.260.9798.0812.250.9697.98
2524.982.0099.9224.470.8697.90
5049.440.3898.8849.510.4299.02
Decursin2019.741.4298.7119.681.4898.42
4041.510.97103.7840.471.22101.17
8081.370.72101.7181.340.53101.67
Decursinol angelate109.580.9395.769.512.6195.12
2019.550.7397.7319.500.4597.51
4039.130.4397.8339.110.4697.78
Atractylenolide I10.982.5398.401.001.14100.07
22.051.48102.602.020.95101.23
44.020.98100.504.010.69100.37
a) Precision is expressed as RSD (%) = (SD/Mean) × 100. b) Accuracy (%) = (Observed concentration/Fortified concentration) × 100.
Table 5. Repeatability of retention times and peak areas for the seven analytes (n = 6).
CompoundRetention Time (min)Peak Area (AU)
Mean ± SDRSD (%)Mean ± SDRSD (%)
Liquiritin apioside12.48 ± 0.050.43234009.83 ± 1419.740.61
Liquiritin13.00 ± 0.060.49143858.00 ± 903.600.63
Ferulic acid14.09 ± 0.080.55212067.33 ± 1604.310.76
Glycyrrhizin33.46 ± 0.180.52144019.50 ± 726.130.50
Decursin42.93 ± 0.070.161905525.83 ± 12044.190.63
Decursinol angelate43.45 ± 0.070.161094712.83 ± 4431.440.40
Atractylenolide I50.27 ± 0.120.24234499.67 ± 1056.720.45
SD: Standard deviation; RSD: Relative standard deviation.
Table 6. Recovery of seven marker compounds in UGS.
CompoundOriginal Conc. (μg/mL)Spiked Conc. (μg/mL)Found Conc. (μg/mL)Recovery a) ± SD (%)RSD (%)
Liquiritin apioside17.75421.5995.99 ± 0.750.78
1027.86101.14 ± 1.341.33
2037.5699.07 ± 1.281.29
Liquiritin21.27425.46104.94 ± 0.840.80
1031.61103.49 ± 1.721.66
2041.42100.80 ± 1.411.40
Ferulic acid6.631.58.16101.49 ± 1.551.53
39.73103.14 ± 0.760.74
612.79102.70 ± 0.610.60
Glycyrrhizin9.212.511.6397.04 ± 1.321.36
514.0897.45 ± 1.211.24
1018.9096.94 ± 1.401.44
Decursin14.81418.84100.68 ± 3.233.21
822.5696.77 ± 1.051.08
1630.4897.91 ± 0.750.77
Decursinol angelate6.9028.8597.26 ± 1.161.20
410.7696.53 ± 0.470.48
815.22104.00 ± 0.350.33
Atractylenolide I2.0813.11102.93 ± 1.301.26
24.14102.68 ± 1.491.46
45.9797.24 ± 0.420.43
a) Recovery (%) = (Found concentration – Original concentration)/spiked concentration × 100.
Table 7. ABTS/DPPH radical scavenging activity of marker compounds of UGS.
μM1234567nML-ascorbicAcid *
ABTS
00.0 ± 0.90.0 ± 0.90.0 ± 0.90.0 ± 0.90.0 ± 0.90.0 ± 0.90.0 ± 0.900.0 ± 0.9
1.56252.3 ± 0.61.9 ± 0.320.8 ± 0.70.7 ± 0.90.1 ± 0.3–0.2 ± 0.3–1.1 ± 0.60.78125–0.9 ± 0.9
3.1253.2 ± 0.63.5 ± 0.536.7 ± 0.40.0 ± 0.80.3 ± 0.2–1.1 ± 0.22.2 ± 1.31.56250.8 ± 0.6
6.257.0 ± 0.65.5 ± 0.438.0 ± 0.8–0.1 ± 0.70.7 ± 0.60.0 ± 0.2–0.4 ± 1.13.125-0.2 ± 0.5
12.510.1 ± 0.310.5 ± 0.164.4 ± 0.2–0.8 ± 0.9–1.5 ± 0.7–0.3 ± 0.20.4 ± 0.66.252.7 ± 0.8
2518.8 ± 0.819.7 ± 0.899.7 ± 0.11.3 ± 0.10.1 ± 0.4–0.4 ± 0.61.0 ± 1.112.57.4 ± 0.5
5028.3 ± 0.429.0 ± 0.699.8 ± 0.02.7 ± 1.00.5 ± 0.91.5 ± 0.22.0 ± 0.52522.4 ± 0.6
10043.6 ± 0.043.1 ± 0.7100.0 ± 0.13.6 ± 0.20.0 ± 0.12.6 ± 0.3–0.7 ± 0.35065.9 ± 1.0
DPPH
00.0 ± 2.50.0 ± 2.50.0 ± 2.50.0 ± 2.50.0 ± 2.50.0 ± 2.50.0 ± 2.500.0 ± 2.5
1.56250.9 ± 0.20.9 ± 0.24.8 ± 0.5–0.1 ± 0.70.9 ± 0.7–0.2 ± 1.02.7 ± 0.40.781255.7 ± 1.1
3.125–0.2 ± 0.3–0.2 ± 0.38.6 ± 0.5–0.7 ± 0.70.1 ± 1.43.7 ± 1.0–0.5 ± 0.51.56259.1 ± 3.0
6.252.5 ± 1.02.5 ± 1.016.9 ± 0.1–1.7 ± 1.20.3 ± 1.32.3 ± 0.50.4 ± 0.83.12512.4 ± 1.0
12.52.8 ± 0.52.8 ± 0.534.6 ± 2.0–0.9 ± 0.60.6 ± 0.83.6 ± 1.41.0 ± 0.76.2521.3 ± 1.0
251.7 ± 0.71.7 ± 0.755.1 ± 1.70.5 ± 1.30.5 ± 0.35.5 ± 1.41.3 ± 1.012.541.5 ± 3.6
504.1 ± 1.24.1 ± 1.275.5 ± 0.91.9 ± 0.90.4 ± 0.24.1 ± 1.23.1 ± 0.52561.8 ± 1.4
1002.2 ± 1.32.2 ± 1.387.8 ± 0.54.1 ± 0.40.2 ± 1.60.9 ± 1.6–1.8 ± 0.65082.0 ± 1.2
Liquiritin apioside (1), liquiritin (2), ferulic acid (3), glycyrrhizin (4), decursin (5), decursinol angelate (6), and atractylenolide I (7); * L-ascorbic acid was used as a positive control of antioxidant; The quantitative data are presented as the mean ± SEM of triplicate experiments.
Table 8. Composition of UGS.
Latin NameScientific NameAmount (g)Origin
Uncariae Ramulus et UncusUncaria sinensis6China
Atractylodis Rhizoma AlbaAtractylodes japonica8China
Poria SclerotiumPoria cocos8China
Bupleuri RadixBupleurum falcatum4China
Angelicae Gigantis RadixAngelica gigas6Bonghwa, Korea
Cnidii RhizomaCnidium officinale6China
Glycyrrhizae Radix et RhizomaGlycyrrhiza uralensis3China
Total amount 41

