Article

Inhibitory Activity of Allergic Contact Dermatitis and Atopic Dermatitis-Like Skin in BALB/c Mouse through Oral Administration of Fermented Barks of Alnus sibirica

Laboratory of Pharmacognosy and Natural Product based Medicine, College of Pharmacy, Chung-Ang University, Seoul 156-756, Korea
*
Author to whom correspondence should be addressed.
Molecules 2018, 23(2), 450; https://doi.org/10.3390/molecules23020450
Submission received: 21 December 2017 / Revised: 12 February 2018 / Accepted: 15 February 2018 / Published: 18 February 2018
(This article belongs to the Section Natural Products Chemistry)

Abstract

:
Phytochemical isolation of fermented Alnus sibirica (FAS) which was produced by using Lactobacillus plantarum subsp. argentoratensis, exhibited multiple and different composition compared with the original plant. Anti-allergic contact dermatitis (anti-ACD)/anti-atopic dermatitis (anti-AD) activities (visual observation and regulation of Th1/Th2 cytokines and IgE in blood) of FAS and the barks of Alnus sibirica extract (AS) and the two diarylheptanoids, hirsutenone (1) and muricarpon B (2), which are major components of FAS, were measured in vitro and in vivo. FAS, AS and the two compounds showed potent anti-oxidative, anti-inflammatory, anti-ACD and anti-AD activity. In particular, FAS showed more potent biological activity than AS. Thus, fermentation might be a prominent way to enhance the biological activity compared with the original plant. In addition, compounds (1) and (2) might be developed as functional materials or herbal medicines for ACD and AD.

1. Introduction

Contact dermatitis (CD) is an inflammatory skin reactions induced by exposure to external agents. The type of CD including irritants contact dermatitis (ICD) and allergic contact dermatitis (ACD) result from tissue damage by contact with irritant and allergen. Atopic dermatitis (AD) is a chronic inflammatory skin disease that can result in red, swollen, cracked skin that usually begins from childhood. AD affects 15–20% of children [1] and 1–3% adults worldwide [2]. The cause of AD is unknown, although there is some evidence of genetic, environmental and immunologic contributors [3], and atopic reactions are generally considered the cause by localized hypersensitivity reaction to an allergen. It is reported that AD is frequently associated with increased IgE and Th2 cytokine at the early stage including interleukin (IL)-4, IL-5, IL-10 and IL-13 and the tumor necrosis factor (TNF)-α [4,5,6]. Because of the decreased Th1 cytokines, the imbalance of Th1 and Th2 cytokines cause AD. However, in the later stage of AD, interferon (IFN)-γ was higher in the late skin lesions of human patients and mice [7,8,9]. Topical steroids, such as triamcinolone or clobetasol are successfully treat AD [10]. However, they can also increase the risk of skin cancer or lymphoma [11]. Thus, natural plants, which are safe and have fewer side effects, have been recommended [12].
The fermentation of traditional medicine has a long history in China, Korea, and India among other countries, and today, fermented traditional medicines are widely applied for preventing and treating many diseases. [13,14,15] Generally, fermentation is a metabolic process that converts sugars to acids, gases, or alcohol and degrades the organic components through oxidation–reduction. Herbal medicines have been fermented into beneficial micro-organisms such as yeast and lactobacillus, which could develop the bioactivity of natural plants and reduce side effects. [15]
Alnus species have been used for galactogogues, cathartics, hemostatics, emetics, febrifuges, skin tonic and parasiticides [16]. The bark of Alnus sibirica, which is distributed in Korea, Japan, Northeast China and Russia, has been reported for use as antipyretic, expectorant, antiasthmatic and a health tea for alcoholism [17]. Previous works have studied the phenolic components of various tannins, flavonoids, diarylheptanoids and triterpenoids that were isolated from the Alnus species [18]. In addition, Alnus japonica and diarylheptanoids, which are major compounds in AS, have been attempted for overcoming diseases including AD [19,20,21].
The present study investigated the bioactivity of fermented AS (FAS) and two isolated compounds, hirsutenone (1) and muricarpon B (2), which are main components of FAS, (Figure 1) in anti-oxidative, anti-inflammatory and anti-ACD and anti-AD experiments in vitro and in vivo.

2. Results and Discussions

2.1. Anti-Oxidative Activity

From, the DPPH results, all extracts and compounds showed potent dose-dependent radical scavenging activities. In particular, compared with AS (IC50: 31.41 μg/mL), FAS (IC50: 24.34 μg/mL) showed more potent radical scavenging activities. In addition, 1 and 2 (IC50: 14.08 μM, 24.08 μM) showed more potent radical scavenging activities than did the positive control, l-Ascorbic acid (IC50: 24.81 μM; Table 1). Additionally, the results for NBT superoxide radical scavenging activity were similar to the DPPH results; FAS (IC50: 1.11 μg/mL) showed more potent superoxide radical scavenging activities than did AS (IC50: 6.57 μg/mL).
Oxidative stress is an imbalance between the production of reactive oxygen species (ROS) and antioxidant defense, and excess ROS could damage cellular protein, DNA and lipids, resulting in various diseases such as Parkinson’s disease, Alzheimer’s disease, cancer and atopic disease [22,23,24,25]. Thus, anti-oxidative activity may be beneficial in the ACD and AD. The 1,1-diphenyl-2-picrylhydrazyl (DPPH; Sigma-Aldrich, St. Louis, MO, USA) radical scavenging activity and nitro blue tetrazolium chloride (NBT) superoxide radical scavenging activity were measured. All extracts and compounds showed potent dose-dependent anti-oxidative activities. In particular, FAS (extract level) and 1 (compound level) showed more potent anti-oxidative activities, in both DPPH radical scavenging activity and NBT superoxide radical scavenging activity assays. Moreover, 1, a potent antioxidant agent [26], showed more potent anti-oxidative activity than 2 (Table 1).

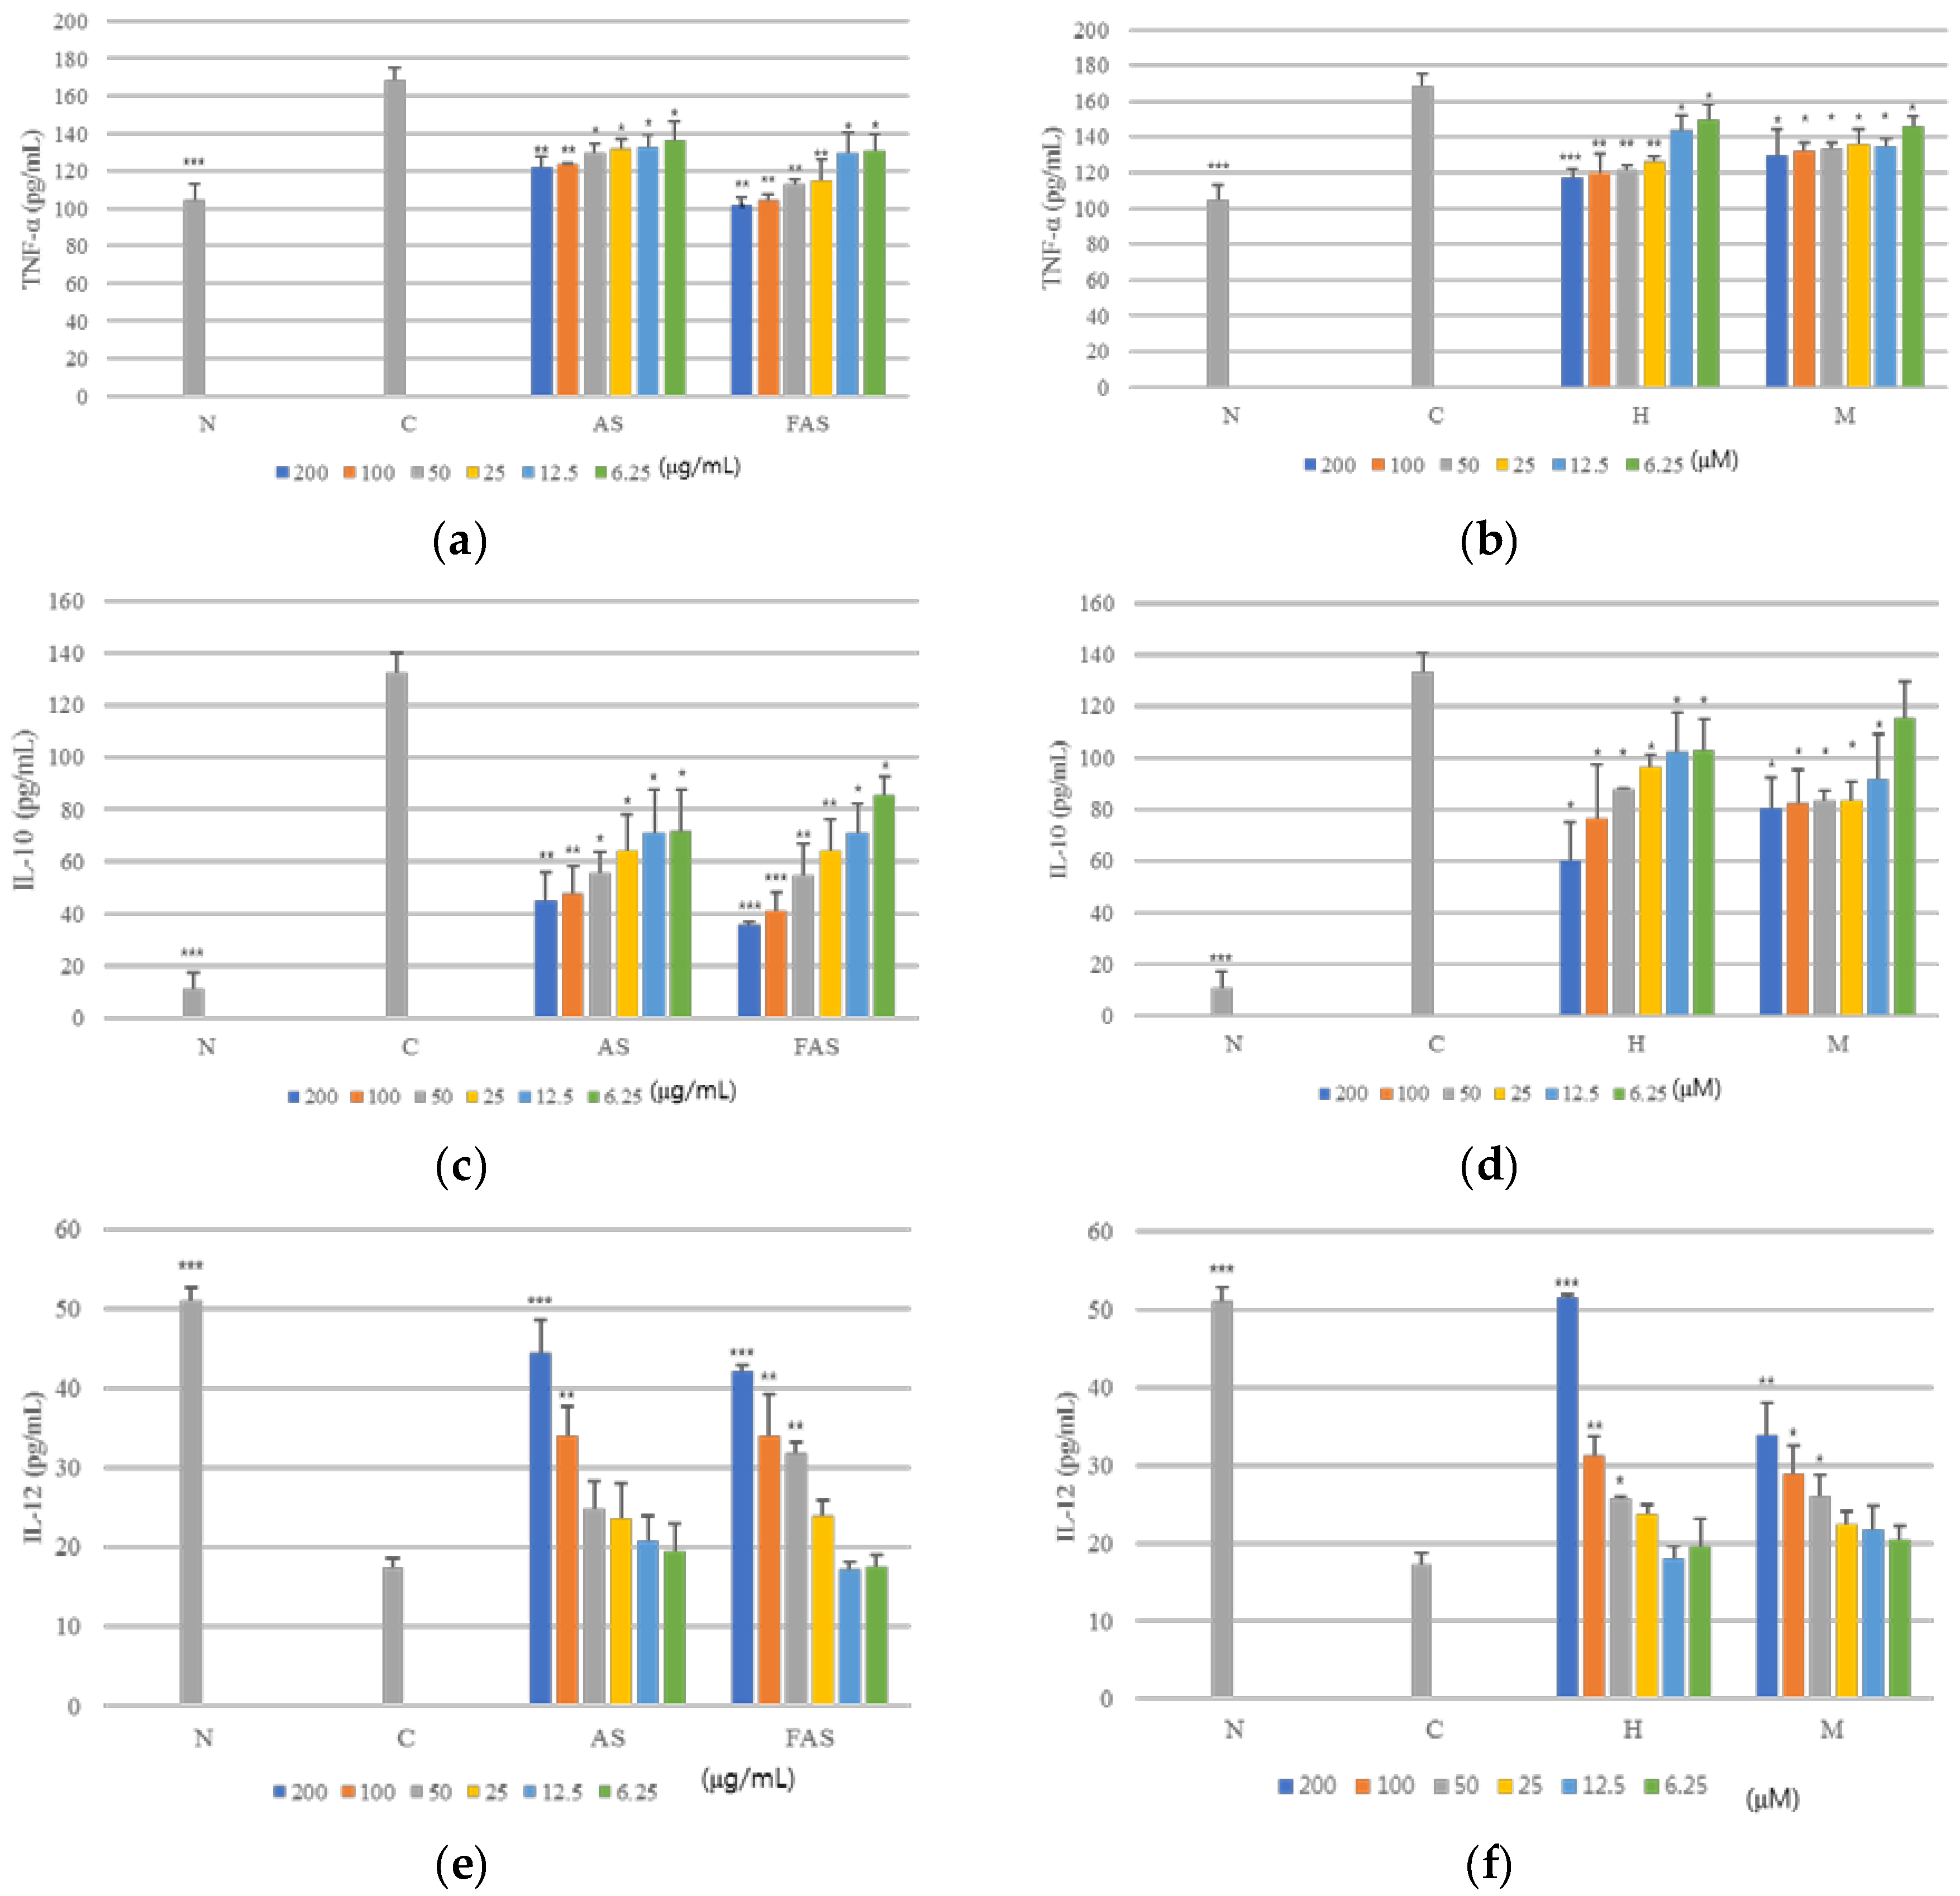
2.2. Anti-Inflammatory Activity

Before the measuring of anti-inflammatory activity experiments, the cytotoxicity activity of AS, FAS, 1 and 2 were studied on the macrophage cell line (RAW 264.7 cell line). The results showed that all the samples have no cytotoxicity activities on RAW 264.7 cells. (Figure 2)
FAS (IC50: 13.00 μg/mL) showed more potent inhibition of NO production than did AS (IC50: 19.31 μg/mL), and 1 and 2 (IC50: 14.10 μM, 22.66 μM) showed more potent inhibition activity than did the positive control, NG-monomethyl-l-arginine (L-NMMA; IC50: 37.05 μM; Table 2).
Nitric oxide (NO), which is a free radical, is an important cellular signaling molecule that is involved in many physiological and pathological processes in humans [27]. NO in large quantities is generated by inducible NO synthases and is reported to have an important role in inflammation and immune responses [28]. Thus, the inhibitory activity of NO production on FAS, AS, 1, and 2 in the LPS-stimulated RAW264.7 cells was studied. FAS showed more potent anti-inflammatory activity than did AS, and both 1 and 2 showed more potent anti-inflammatory activity than did the positive control (Table 2), showing that 1 and 2 have excellent anti-inflammatory activity.

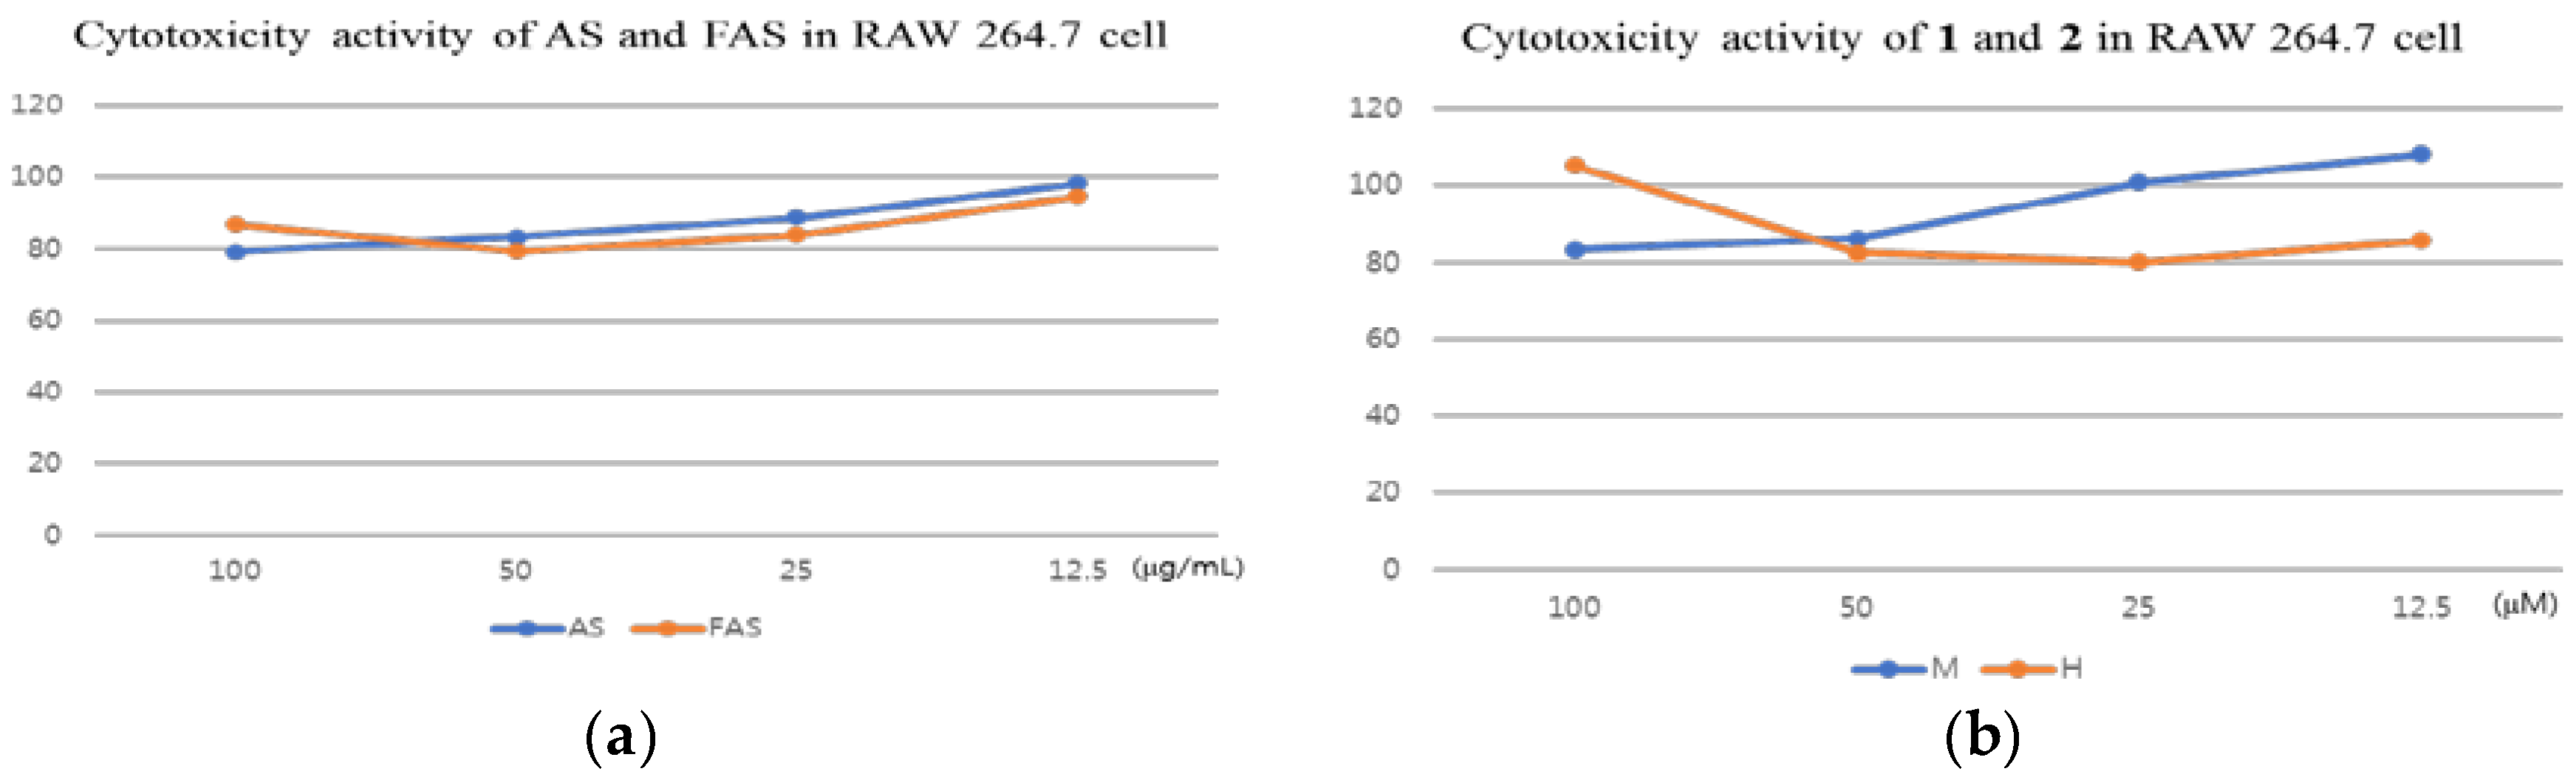
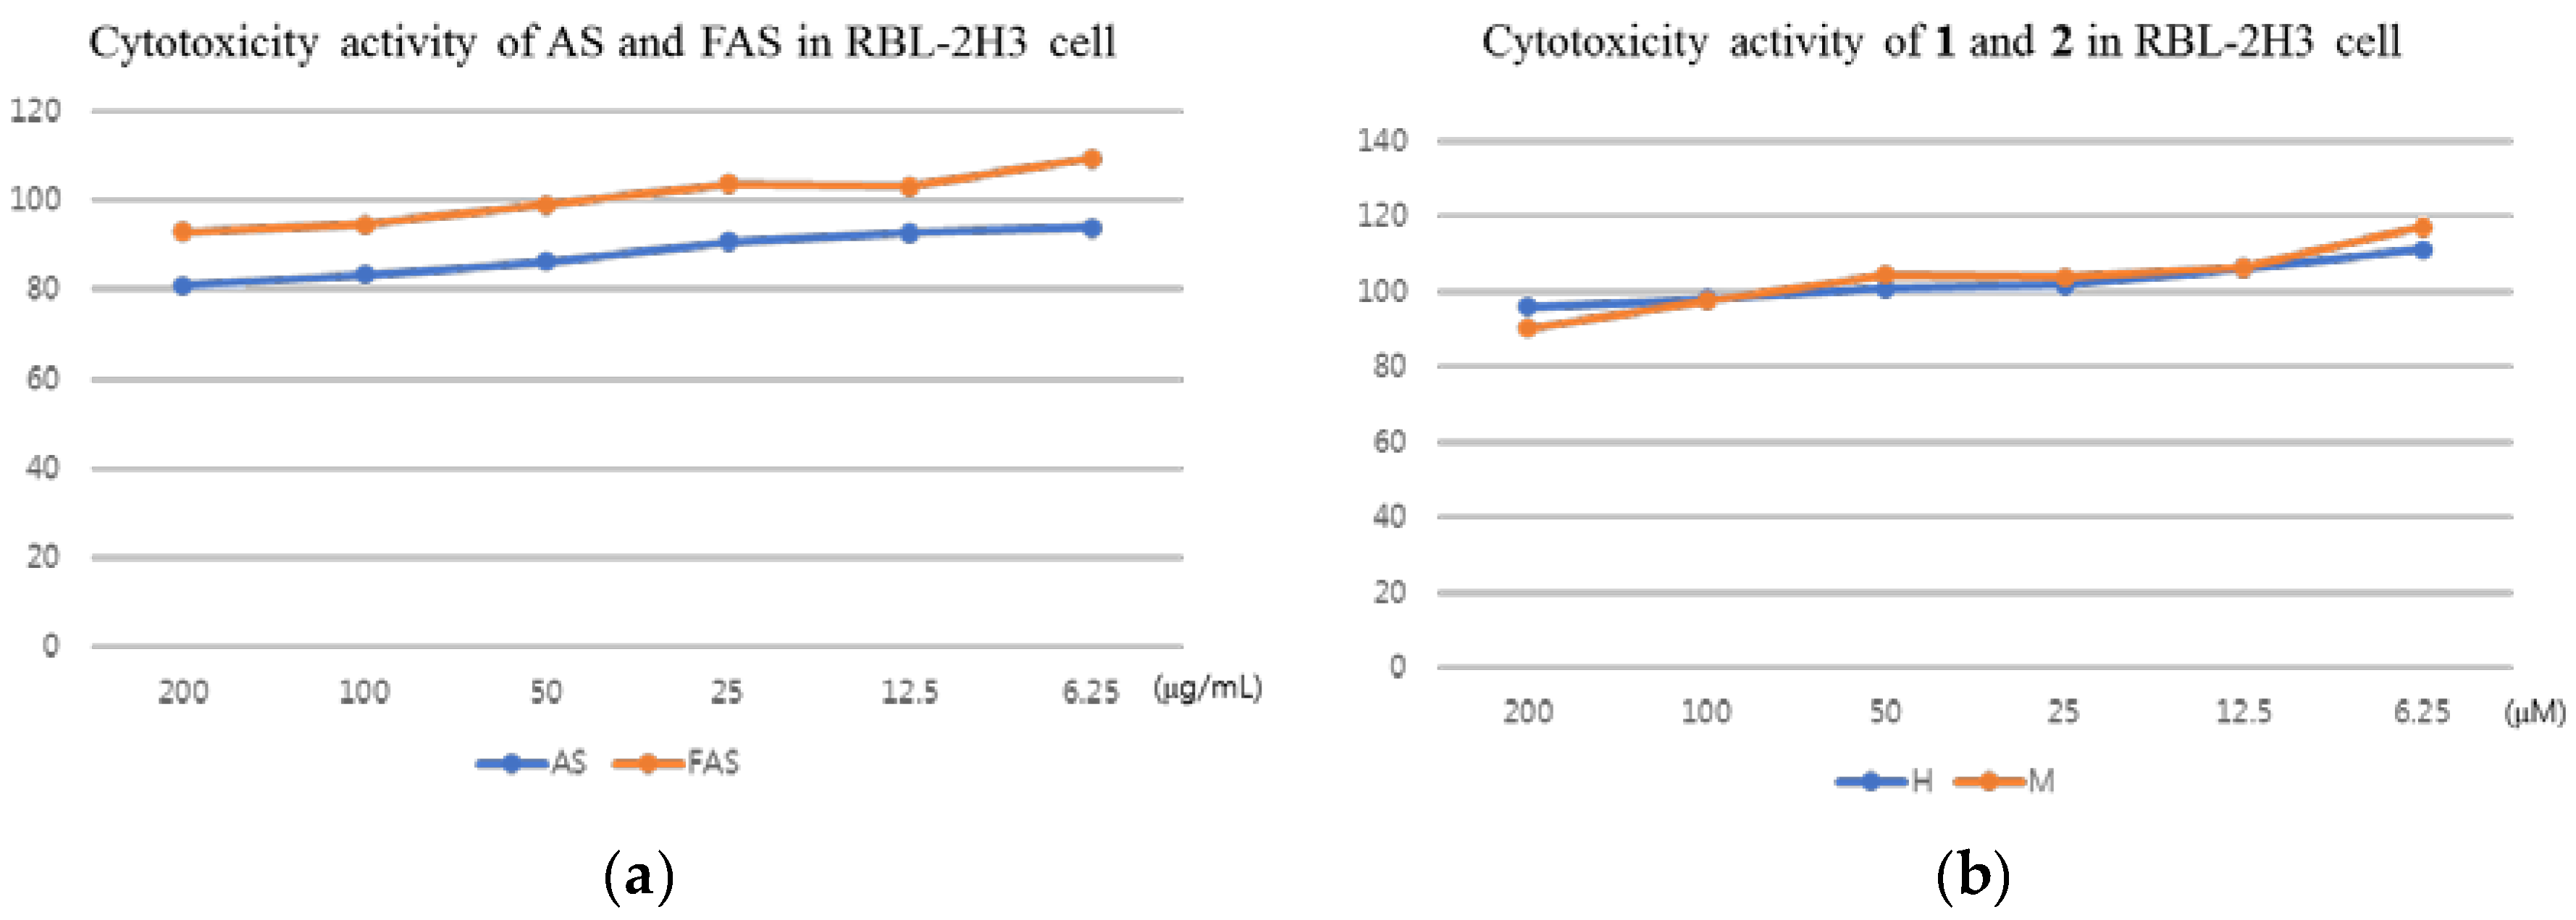
2.3. Anti-ACD and Anti-AD Activity in Vitro

Before the measuring of cytokine regulation in vitro, the cytotoxicity activities of AS, FAS, 1 and 2 were also studied on a basophils cell line (RBL-2H3 cell line). The results showed that all the samples have no cytotoxicity activities on RBL-2H3 cells. (Figure 3).
The regulation effects of IFN-γ and IL-4 cytokines on AS, FAS, 1 and 2 were measured. All samples showed down-regulation effects on IFN-γ and IL-4 cytokines. In particular, FAS showed more potent inhibition of IFN-γ and IL-4 cytokines than did AS in vitro by ELISA in RAW 264.7 cell lines (Figure 4a). In addition, 2 showed more potent inhibition of the two cytokines than 1 (Figure 4b).
Moreover, the regulation of other cytokines, like IL-10, IL-12 and TNF-α, were also measured. FAS showed more potent inhibition of TNF-α and IL-10 cytokines than AS in vitro by ELISA in the RBL-2H3 basophil cell line, (Figure 5a,c) and 1 also showed more potent inhibition of TNF-α and IL-10 cytokines than 2 in RBL-2H3 cells. (Figure 5b,d). However, all the samples (AS, FAS and compounds) increased the levels of IL-12 in the RBL-2H3 basophil cell line. (Figure 5e,f).
ACD, including AD, patients tend to have great hyper production of IgE, which is a result of the imbalance of T helper (Th1 and Th2) cells. Th2 cytokines, particularly IL-4 and IL-13, are potent stimulators of IgE synthesis [29,30], and other cytokines, such as IL-5 and IL-10, facilitate IgE production [29,31,32]. The down-regulation of Th2 cytokines may decrease production of IgE. In contrast, Th1 cytokines have negative effects on IgE synthesis, such as IFN-γ and IL-12 [29,30,33]. However, in the later stage of AD, the high concentration of IFN-γ existed in the AD later stage cases [7,8,9]. TNF-α, a proinflammatory cytokine, has been shown to produce some effects that are associated with infection, inflammation and immunoregulation [34,35,36,37] and it is reported that there is an increased TNF-α concentration in ACD/AD [38,39]. Our results showed that AS, FAS, 1 and 2 inhibited IL-4, IL-10, TNF-α and IFN-γ potently, but up-regulated the IL-12 cytokine. Although the samples decreased the IFN-γ cytokine, Th2 cytokines also were inhibited, this may be due to the increased IL-12 cytokine which is a cytokine involved in the production of IFN-γ [40,41].

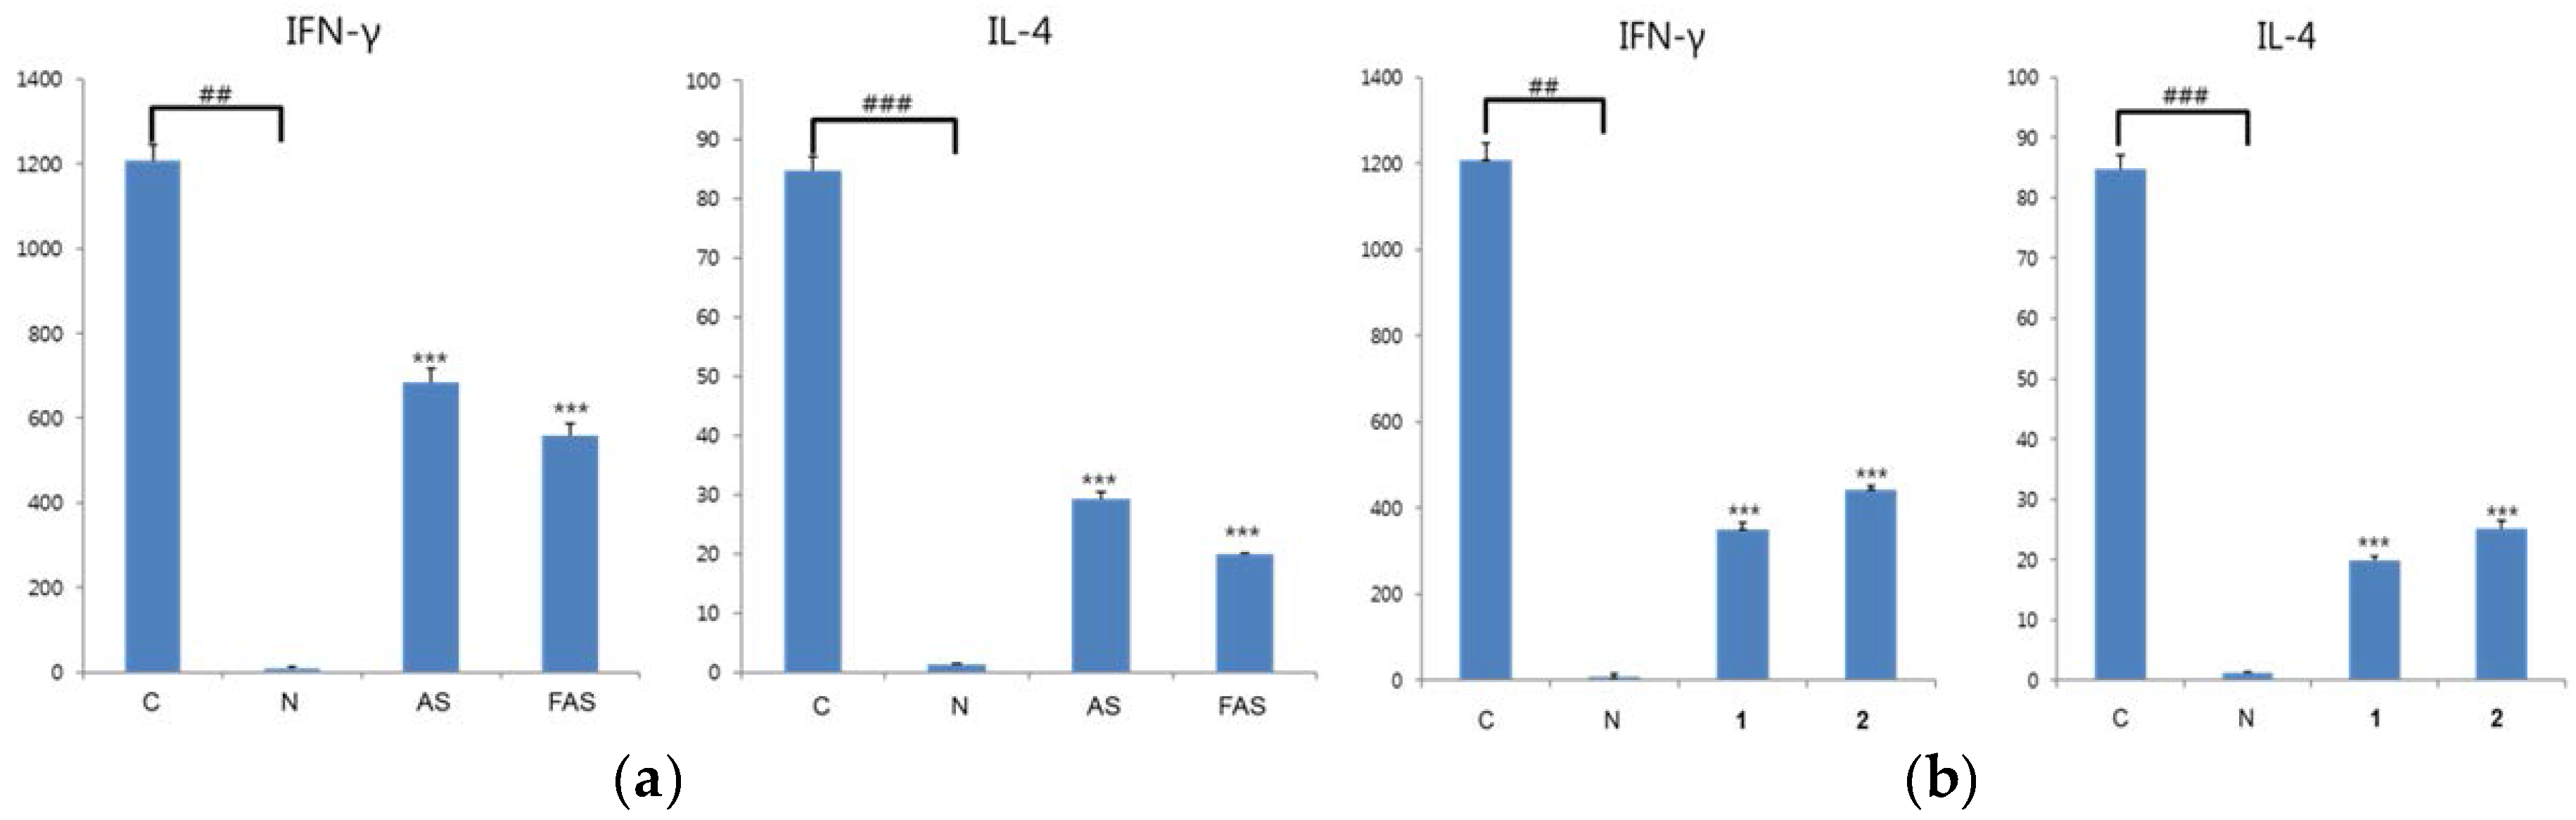
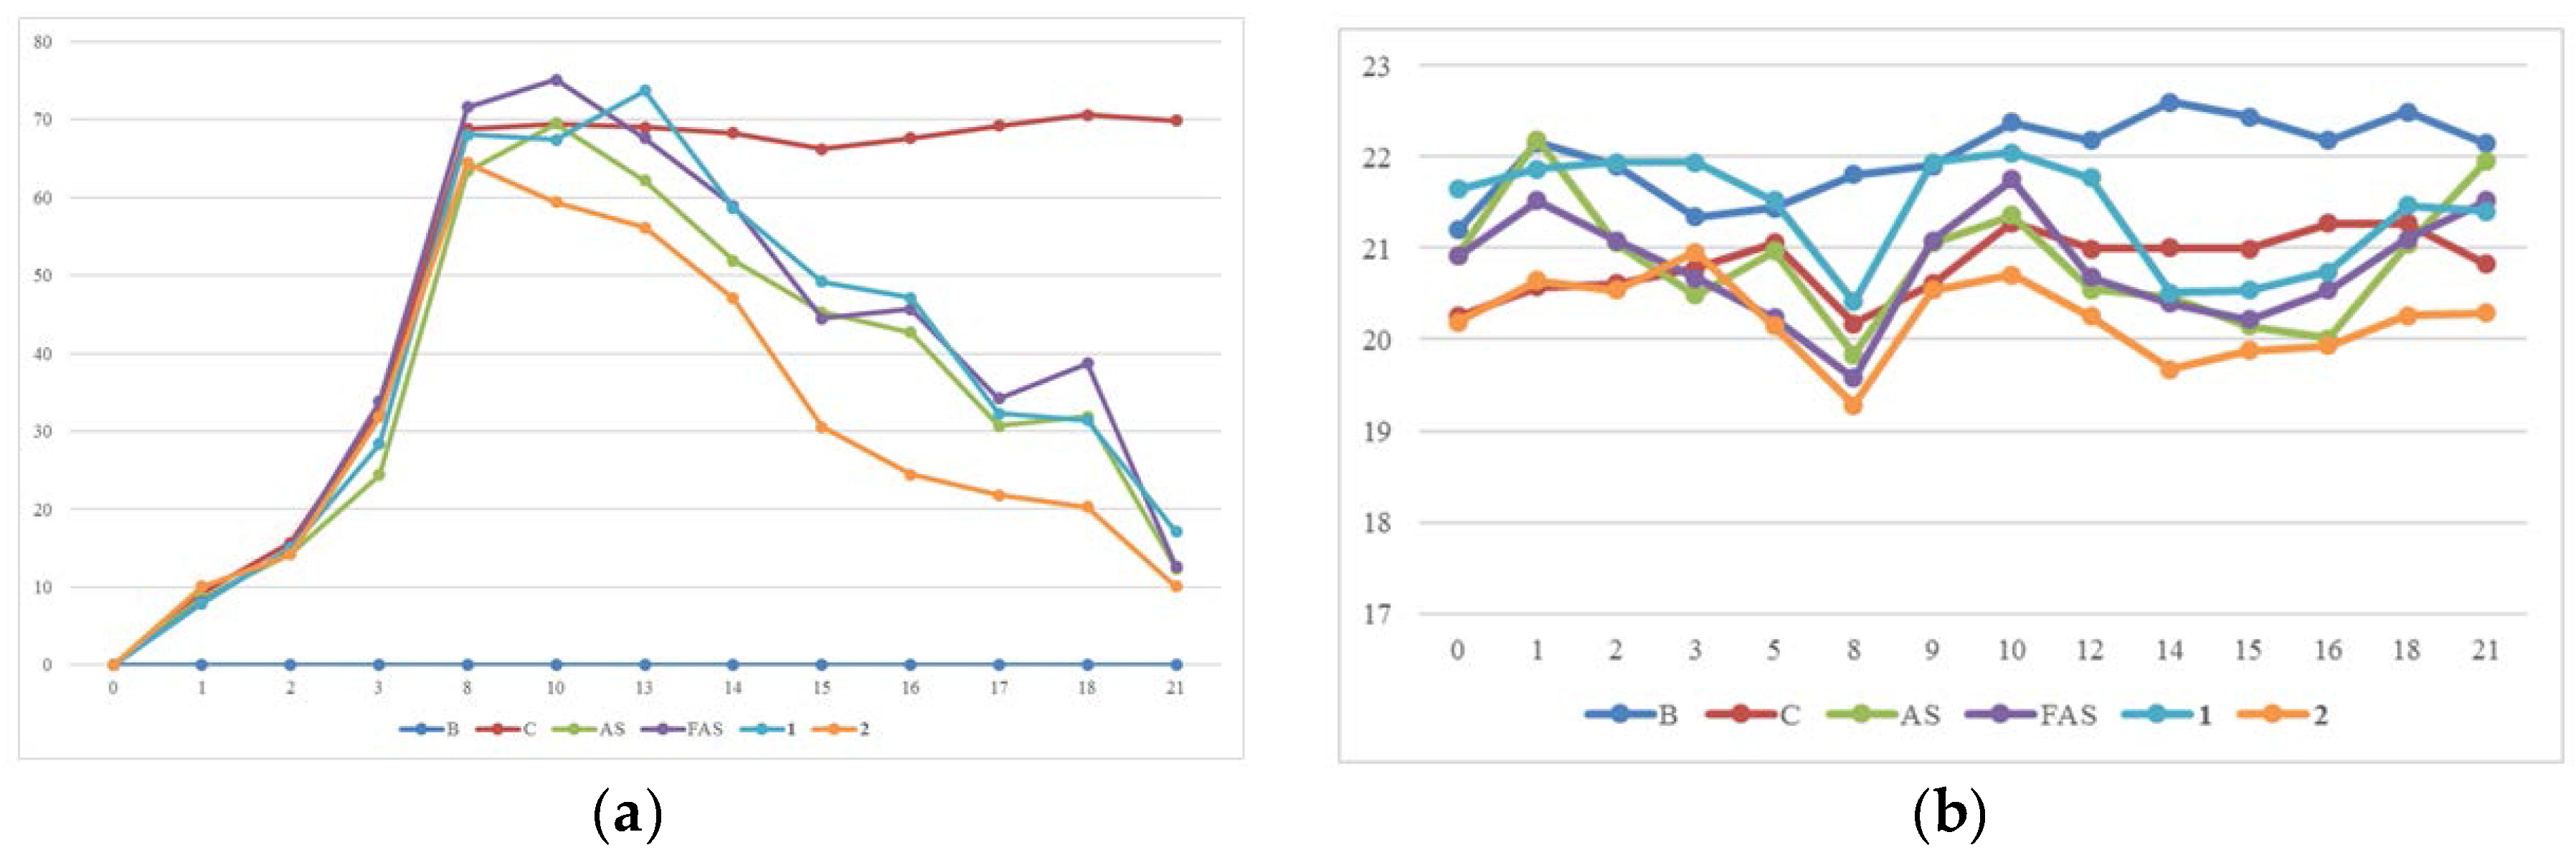
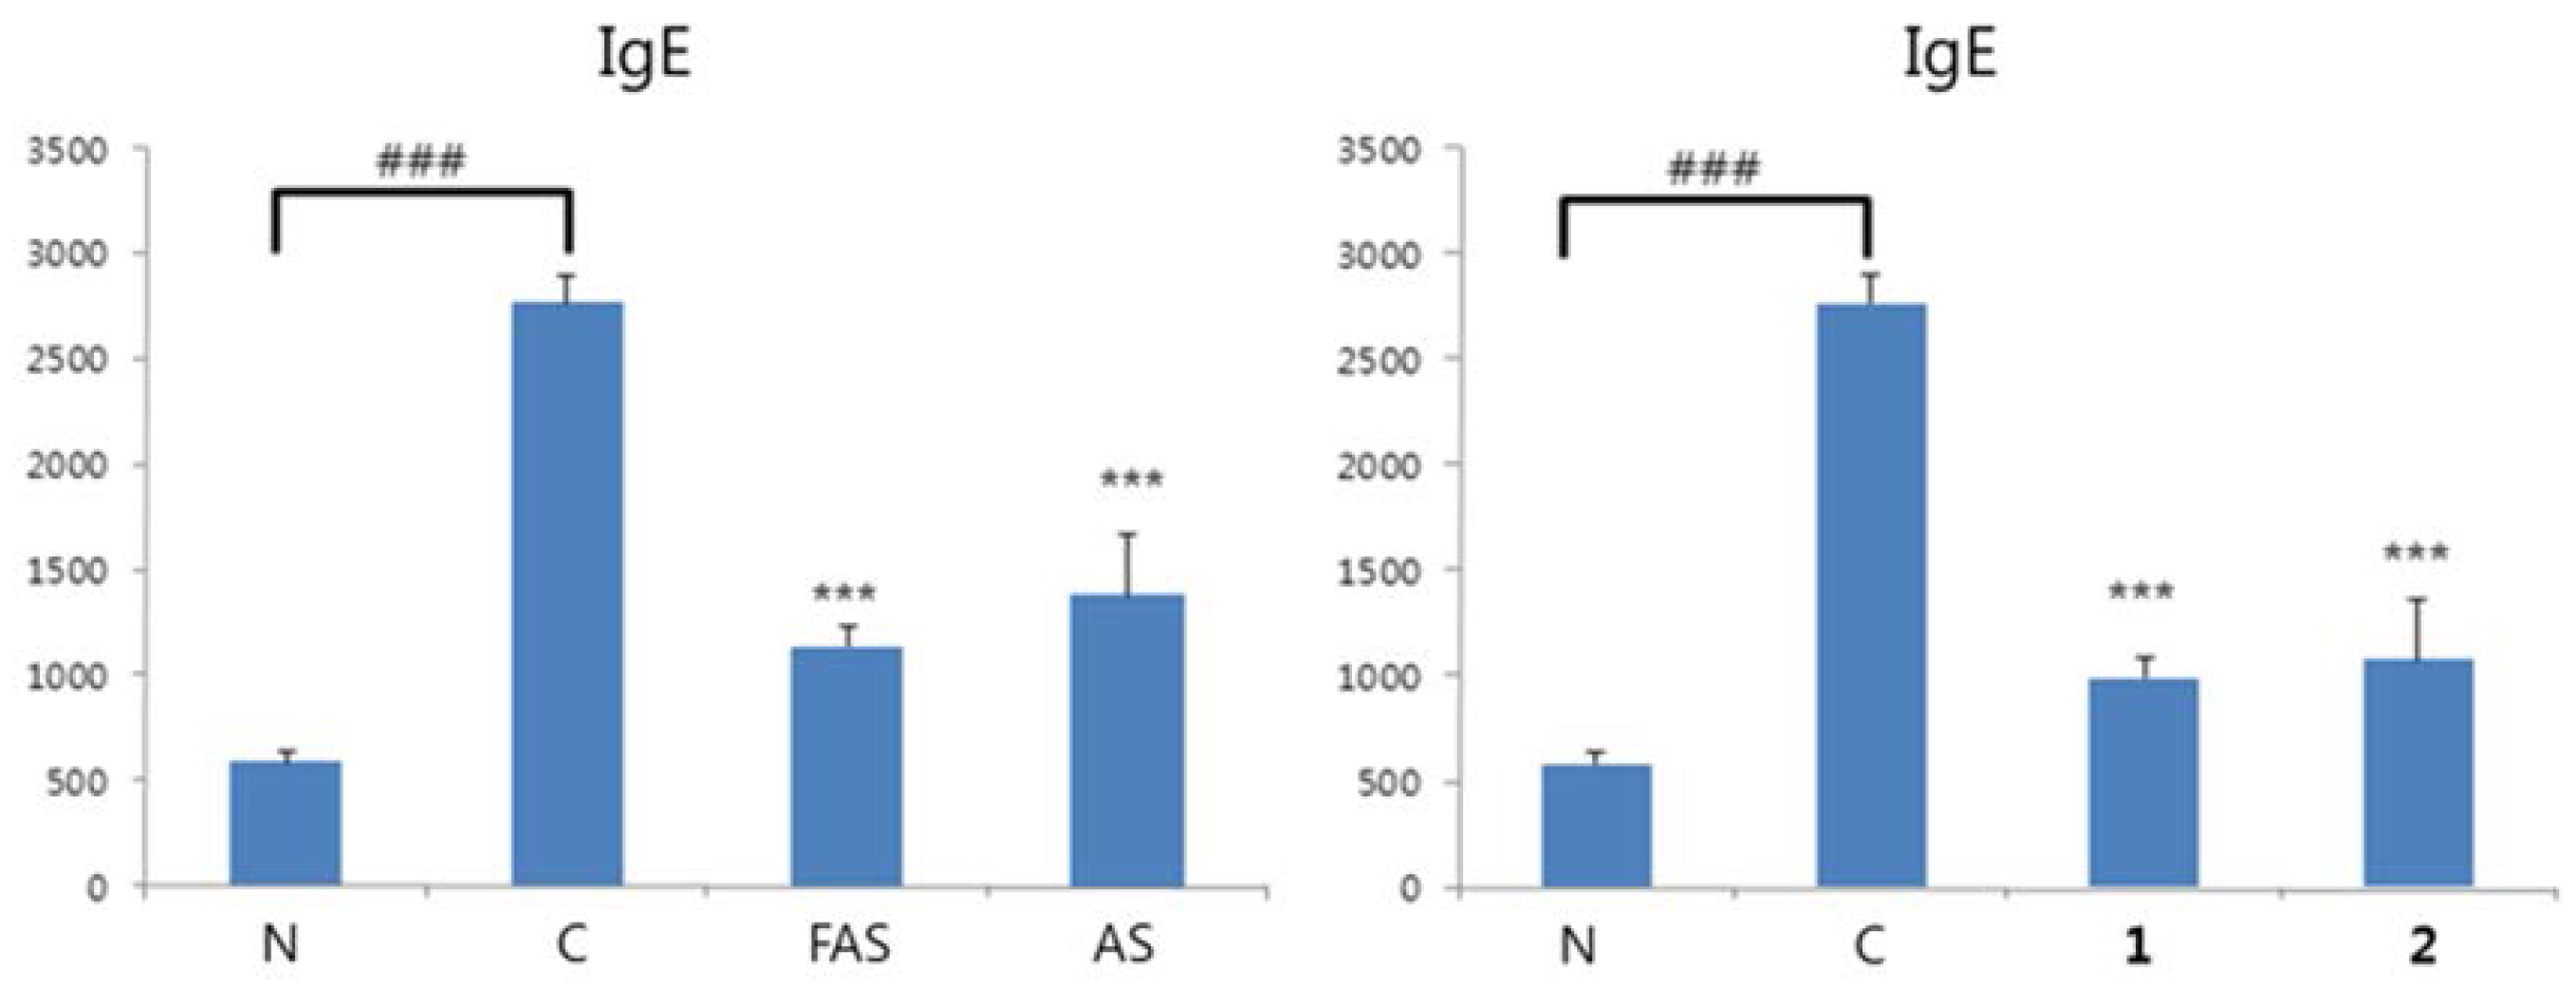
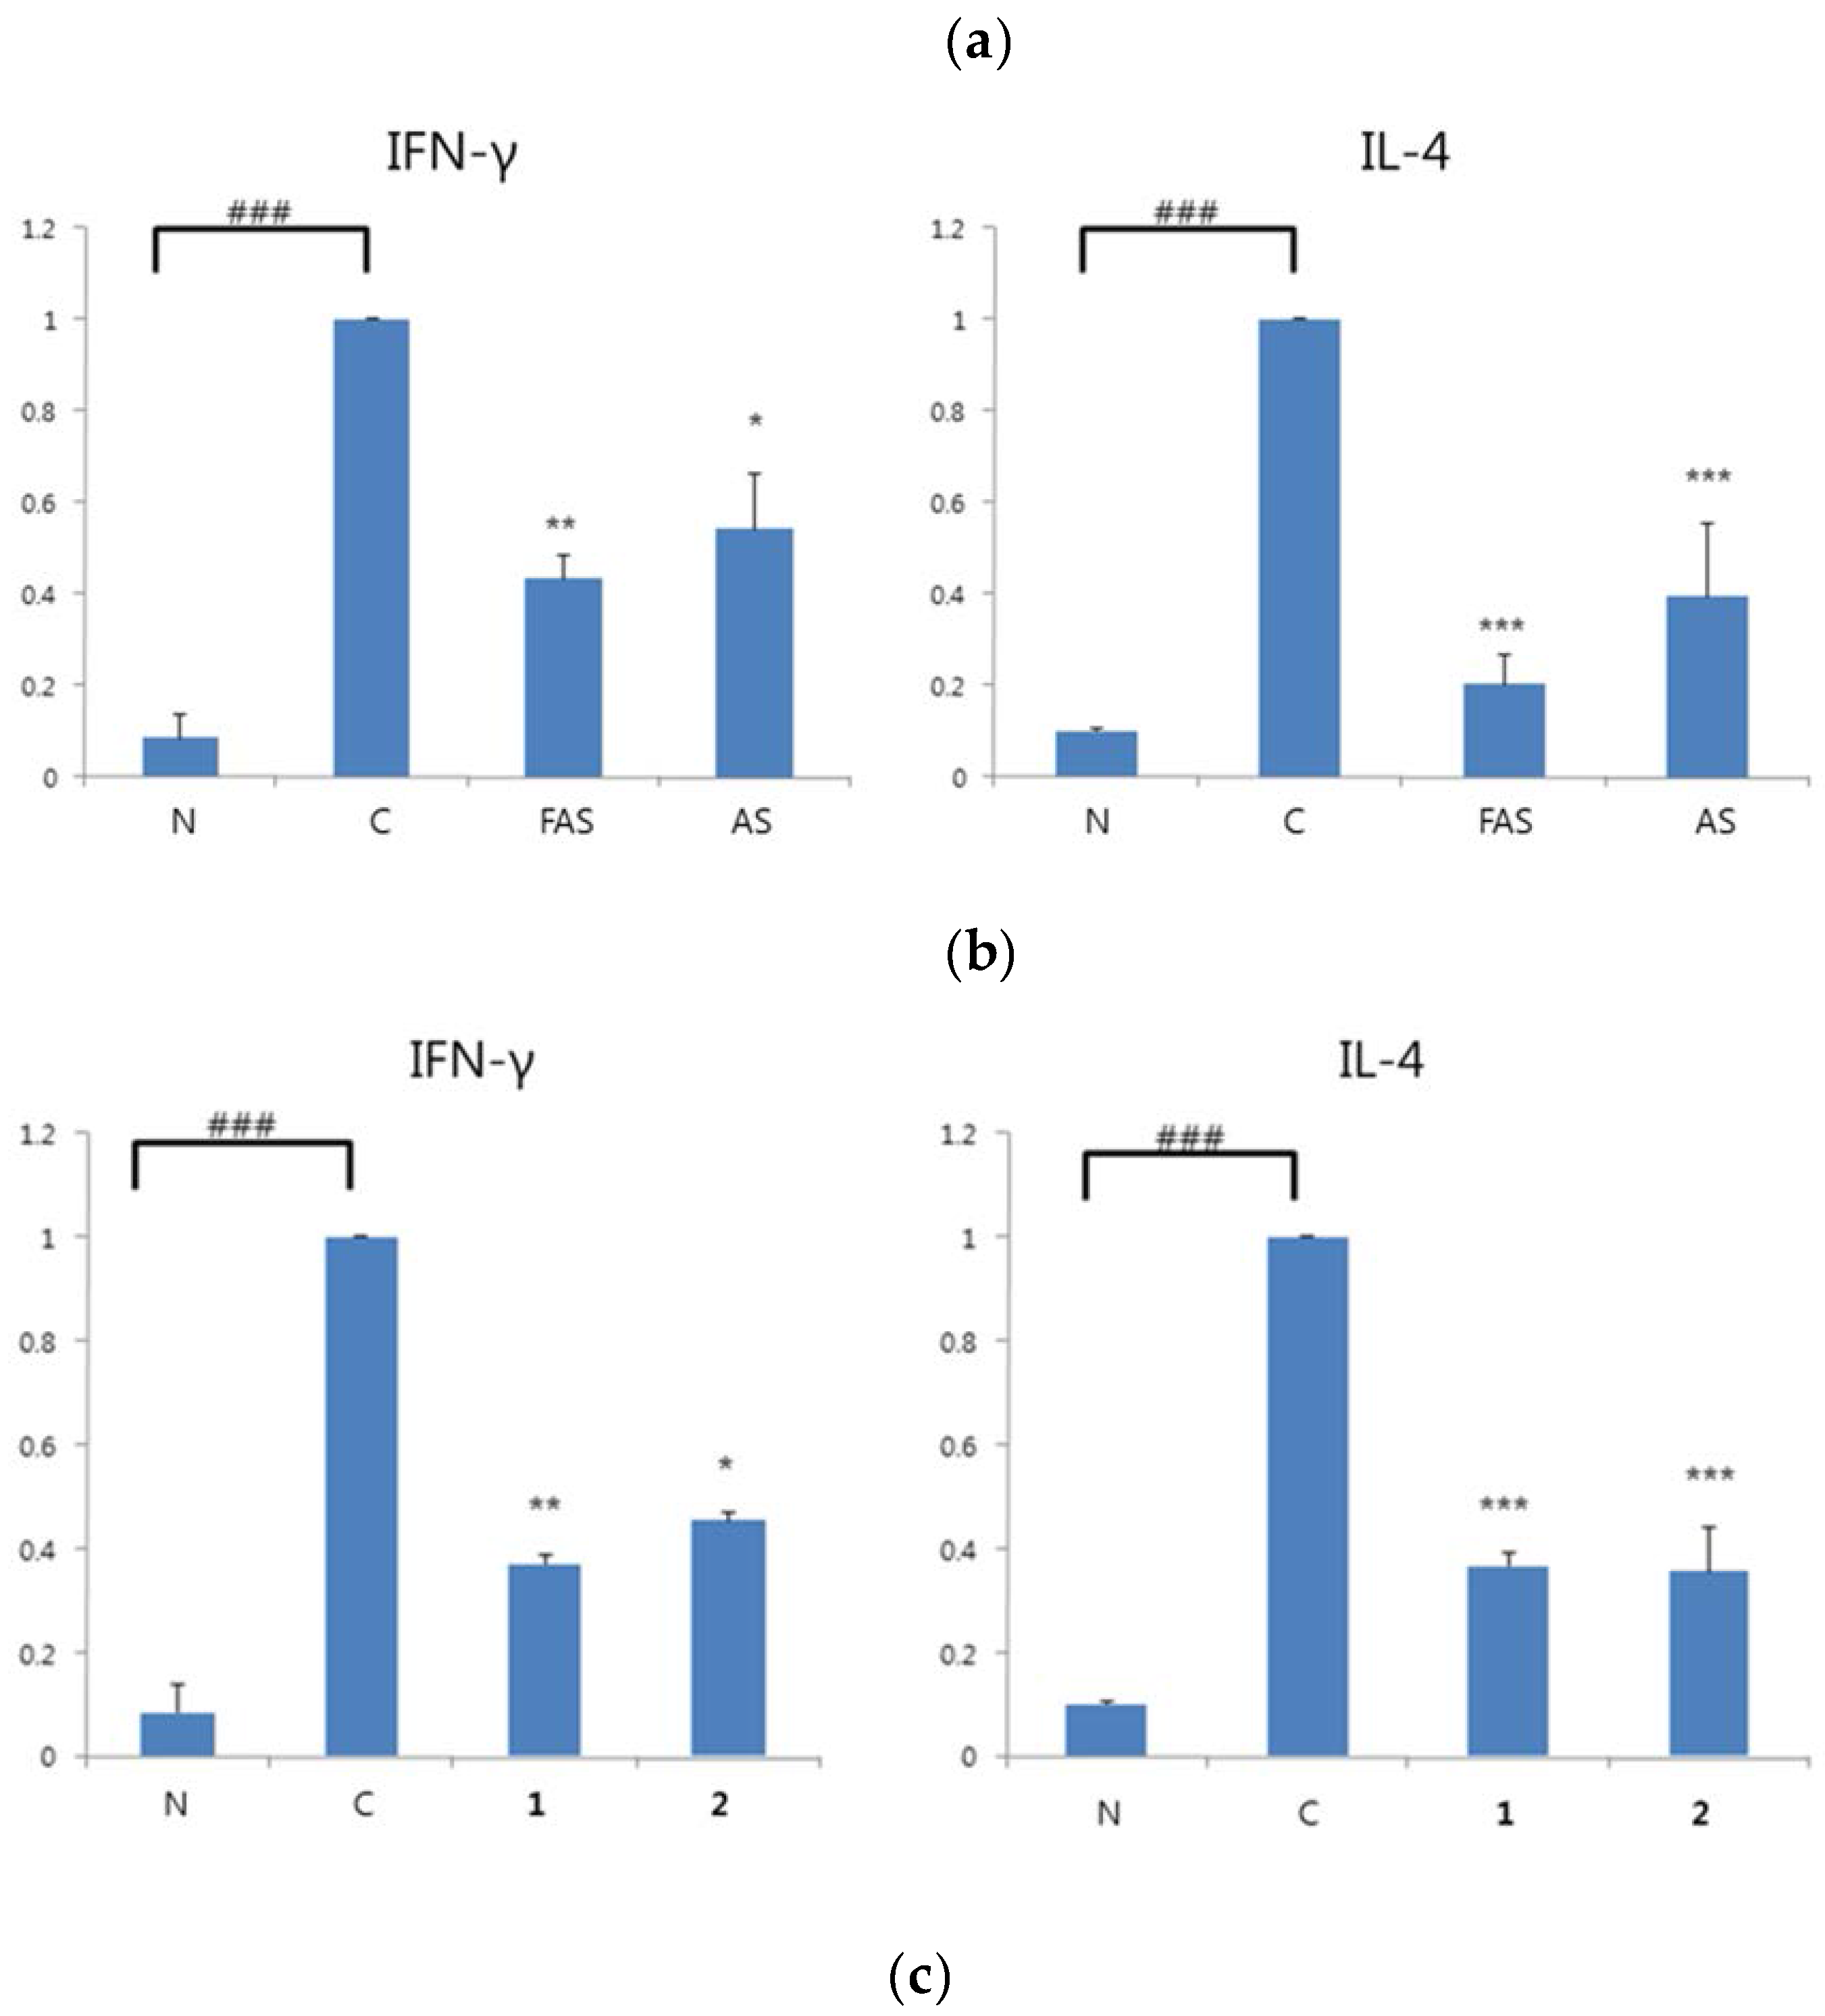
2.4. Anti-ACD/Anti-AD Evaluation on BALB/c Mice

The regulation activity of FAS, AS, 1, and 2 on Th1 (IFN-γ) and Th2 (IL-4) cytokines, which are increased in the early and late stages of ACD/AD, were evaluated [42,43]. In addition, we used the scoring atopic dermatitis (SCORAD) index and IgE levels in blood to measure the skin serious index. The SCORAD index is a clinical tool for assessing the severity of atopic dermatitis (AD) that was developed by the European Task Force on AD in 1993 [44]. The SCORAD index measures area, intensity and subjective symptoms. Intensity refers to dryness, redness, swelling, scabs, scratch marks and thickening of the skin, and meanwhile, IgE is an immunoglobulin isotype that is increased in ACD/AD. The study used 2,4-dinitrochlorobenzene (DNCB)-induced BALB/c mice as ACD/AD models and treated them with 100 mg/kg of extract (FAS and AS) and 100 μM/kg of compounds 1 and 2 by oral administration.
As noted above, the SCORAD index measures area, intensity and subjective symptoms. Intensity measures dryness, redness, swelling, scabs, scratch marks and thickening of the skin, and the symptoms are assessed as none (0), mild (1), moderate (2), or severe (3); the subjective symptoms include itching and sleeplessness, and each is rated on a scale of 0–10. The SCORAD index is calculated using the following formula: A/5 + 7B/2 + C. The lowest SCORAD index of the compound 2 experiment group showed that 2 was the best agent for treating ACD/AD; even though AS, FAS and 1 also showed potent anti-ACD/AD effects (Figure 6a), and the body weights of the experimental animals showed no significant differences indicating that AS, FAS, 1 and 2 had no toxicity.
The resulting SCORAD index showed that all samples including FAS, AS, 1 and 2 are good agents for treating AD/ACD (Figure 6a). Meanwhile, the body weights of the experimental animals showed no significant differences (Figure 6b). In the ACD/AD model, DNCB-induced BALB/c mouse, high levels of IgE, IL-4 and IFN-γ cytokines (BD Bioscience, San Diego, CA, USA) were detected (Figure 7), and all of the dose-treatment groups showed potent inhibition of these cytokines.

3. Materials and Methods

3.1. Plant Material

The bark of AS was collected from Mt. Kuksa, Seoul, Republic of Korea, in January 2015. The identification of the material was certified by Prof. Minwon Lee (Pharmacognosy Lab, College of Pharmacy, Chung-Ang University, Seoul, Korea), and a voucher specimen was deposited at the pharmacy department’s herbarium (20150816AS).

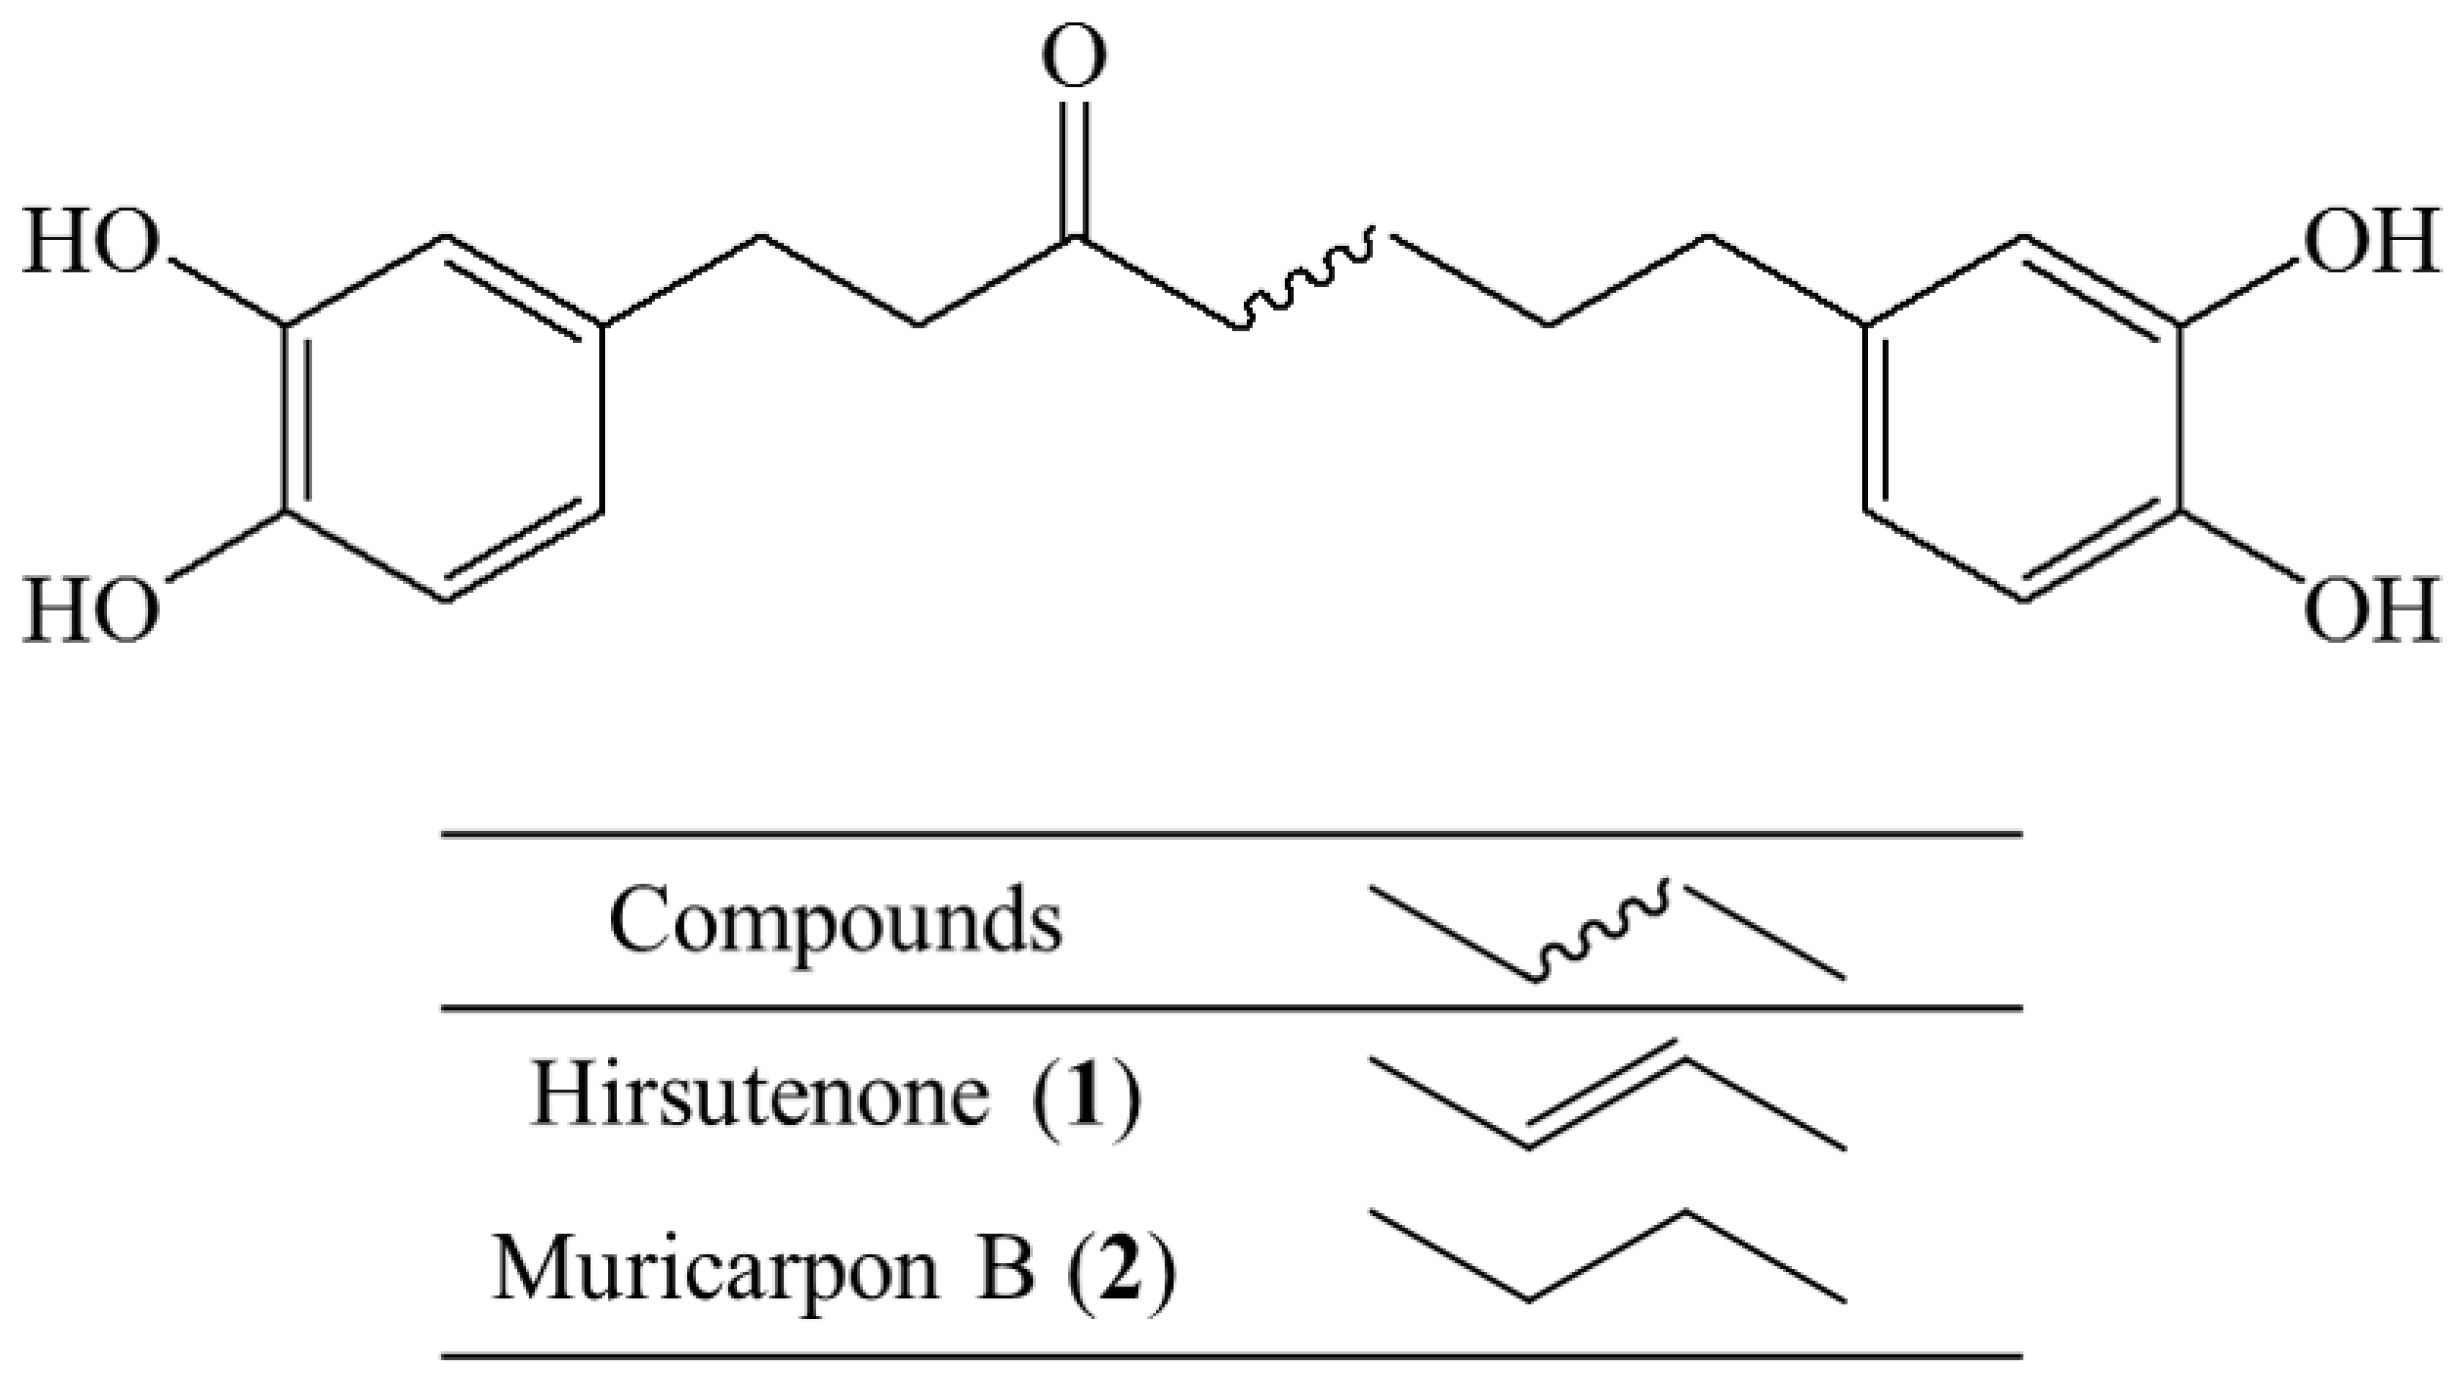
3.2. Extraction, Fermentation and Isolation

The bark of AS was extracted with 80% prethanol A at room temperature and, then, the prethanol A was removed by vacuuming the AS extract. The AS was fermented by using Lactobacillus plantarum with MRS broth for 7 days at room temperature. The FAS was subjected to Sephadex® LH-20 (GE Healthcare, Uppsala, Sweden) column chromatography and MCI gel (SUPELCO, Bellefonte, PA, USA) column yielded 1 and 2. They were compared with standard co-TLC.

3.3. Measuring DPPH Radical Scavenging Activity

Each 20 μL of sample was added to 180 μL of 0.1 mM DPPH (Sigma-Aldrich, St. Louis, MO, USA) in absolute ethanol. After the samples were mixed gently and left to stand for 30 min, the optical density (O.D.) of the samples was measured at 518 nm using an ELISA reader (TECAN, Salzburg, Austria). The free radical scavenging activity was calculated as inhibition rate (%) = 100 − (sample O.D./control O.D.) × 100; IC50 is the concentration of 50% DPPH free radicals scavenge activity. l-ascorbic acid is the positive control.

3.4. Measuring NBT Superoxide Radical Scavenging Activity

A reaction mixture with a final volume of 632 μL/Eppendorf was prepared with 50 mM phosphate buffer (pH 7.5) containing EDTA (0.05 mM), hypoxanthine (0.2 mM), 63 μL NBT (1 mM; Sigma-Aldrich, St. Louis, MO, USA), 63 μL of aqueous or ethanolic extract (distilled water for the control), and 63 μL of xantine oxidase (1.2 U/μL; Sigma); the xanthine oxidase was added last. For each sample, a blank was carried out. The subsequent rate of NBT reduction was determined based on sequential spectrophotometric determinations of absorbance at 590 nm. The solutions were prepared daily and kept from light. The results are expressed as the percentage inhibition of the NBT reduction with respect to the reaction mixture without the sample (buffer only). Superoxide anion scavenging activity was calculated as ((1−(sample O.D.− blank O.D.)/(control O.D. − blank O.D.)) × 100); IC50 was defined as the concentrations at which 50% of NBT/superoxide anions were scavenged. Allopurinol was used as the positive control.

3.5. Cell Culture

RAW 246.7 cells and RBL-2H3 cells were purchased from the Korean Cell Line Bank. The cells were grown at 37 °C in a humidified atmosphere (5% CO2) in Dulbeccos’s Modified Eagles’s Medium (DMEM, Sigma-Aldrich containing, 10% fetal bovine serum (FBS) and 100 IU/mL penicillin G (Gibco BRL, Grand Island, NY, USA)).

3.6. Viability Assay

Approximately 105/well of RAW264.7 or RBL-2H3 cells were seeded in wells of a 96-well plate and incubated for 4 h in 5% CO2 at 37 °C. The medium was replaced with phosphate-buffered saline (PBS) containing 1 mg/mL of 3-(4,5-dimethylthiazol-2-yl)-2,5-diphenyltetrazolium bromide (MTT), and incubated for 4 h. The supernatant was removed and the MTT-formazan was dissolved in 100 μL dimethylsulfoxide. The extent of the reduction of MTT to formazan within the cells was measured at 540 nm with microplate reader (TECAN, Salzburg, Austria). The cell viability was calculated as sample O.D./blank O.D.× 100 (%).

3.7. Measuring NO Production Inhibition

RAW 264.7 cells were cultured in 96-well plates and incubated for 3 h at 37 °C in a humidified atmosphere of 5% CO2. Then the cells were treated with 1 mg/mL lipopolysaccharide (LPS; Sigma-Aldrich) and incubated for 24 h. The NO content was determined by Griess assay. After aspiration of the supernatant, the 100 μL of Griess reagent (0.1% naphthylethylenediamine and 1% sulfanilamide in 5% H3PO4 solution; Sigma-Aldrich) was added to each well, then, 100 μL of DMSO were added. The content of NO was then measured at 540 nm with an ELISA reader (TECAN, Salzburg, Austria). NO inhibitory activity was calculated as 100 − (sample O.D. − blank O.D.)/(negative control O.D. − blank O.D.) × 100 (%); IC50 is the concentration of 50% inhibitory activity of NO production. NG-monomethyl-l-arginine (L-NMMA) was used as the positive control.

3.8. Measuring Cytokine Production Inhibition

The concentrations of cytokines (IFN-γ, IL-4, and IgE [BD Bioscience]; IL-10, IL-12p70, TNF-α (AFfrontier)) in culture supernatants were measured by ELISA. Cytokine content was quantified by measuring the absorbance at 405 nm with an ELISA reader (TECAN), and the amounts of cytokines produced were calculated using a standard calibration curve. After the cells were exposed by LPS, the IFN-γ, IL-4 cytokine levels were measured for the regulation effects of AS, FAS, 1, and 2 at 100 μg/mL and 100 μM, and IL-10, IL-12p70 and TNF-α cytokine levels were measured for the regulation effect of AS, FAS, 1 and 2 at 200~6.25 μg/mL and 200~6.25 μM.

3.9. Animal Experiment Model

Male BALB/c mice (7 weeks old) were adapted to laboratory conditions (temperature: 20 ± 2°C, relative humidity: 50%, light/dark cycle: 12 h) for 1 week; The animal experiments were approved by the Chung-Ang University Institute for Animal Research. Thirty BALB/c mice were randomly divided into six groups: the normal group; the negative control group; the AS treatment group; the FAS treatment group; the 1 treatment Group; and the M treatment group. 2,4-dinitrochlorobenzene (DNCB, Sigma-Aldrich) dissolved in acetone was used to induce dermatitis in the BALB/c mice except for in the normal group. The outer ears were sensitized with 20 μL of 1% DNCB daily for 7 days. After the first challenge, 20 μL of 0.5% DNCB was repeatedly applied to the outer ears for an additional 14 days at 2-day intervals. At the second challenge, FAS and AS (100 mg/kg) and 1 and 2 (100 μM/kg) were administered orally. After 14 days, all the mice were sacrificed. The animal studies have been reviewed and approved by the Institutional Animal Care and Use Committee (IACUC) at CHUNG-ANG UNIVERSITY. (2016-00037)

3.10. Preparing the Spleen Microsomes

Mice spleens were prepared from the experimental mice. After the spleens were washed in phosphate-buffered saline (PBS), they were mashed and centrifuged at 400G (gravitation) for 2 min. The supernatant was removed and mixed with 1X RBC lysis buffer at room temperature for 5 min. The mixtures were washed by PBS and centrifuged at 400 G for 2 min. Then the supernatant was removed and mixed with PBS and filtered using an 800 mesh filter. After centrifugation with 400 G for 2 min, the Th1 and Th2 cytokines in the spleen cells were measured using real-time polymerase chain reaction (PCR).

3.11. Reverse Transcription RT-PCR

Total RNA was isolated from the spleen cells using TRIzol reagent (Invitrogen, Waltham, MA, USA), and spleen microsomes were added to 1 ml of TRIzol reagent in a cultured dish. After 5 min at room temperature, 0.2 mL of chloroform per 1 mL of TRIzol reagent was added, and the tubes were shaken vigorously by hand for 15 seconds. The mixtures were centrifuged at 13,500 rpm and 4 °C for 15 min, 500 μL of the upper aqueous phase was transferred to a fresh tube, and iso-propanol (500 μL) was added.
After the mixtures were incubated at room temperature for 10 min, they were centrifuged at 13,500 rpm and 4 °C for 10 min. The supernatant was removed, washed with 700 μL of 70% ethanol, and centrifuged at 11,500 rpm and 4 °C for 10 min, the RNA pellet was briefly dried. The purified RNA was dissolved in diethyl pyrocarbonate-distilled water (DEPC-DW); 1 μg RNA was reverse transcripted at 42 °C for 1 h in a reaction containing reverse transcriptase (TaKaRa, Shiga, Japan), with 10× RT buffer, 10 mM dNTP (dNTP mix), oligo dT primer and RNase inhibitor. The 1 μL cDNA sample was amplified with 10 μL 2× ReddyMix PCR Master Mix, 2 μL 10 pM primer (1 μL 10 pM upstream primer, 1 μL 10 pM downstream primer), 7 μL DEPC-DW, and Universal SYBR Green Supermix using real-time PCR (BioRAD, Hercules, CA, USA). PCR primers were chemically synthesized using a DNA synthesizer (Bioneer, Daejeon, Korea), and the amplification conditions were: denaturation at 95 °C for 5 min for the first cycle and for 30 s starting from the second cycle, annealing at 51 °C for 30 s, 72 °C for 30 s. Final extension was performed at 72 °C for 10 min. The primers were β-actin (187 bp): 5′-TACAGCTTCACCACCACAGC-3′ (sense), 5′-AAGGAAGGCTGGAAAAGAGC-3′ (anti-sense)/ IL-4 (252 bp): 5′-ATATCCACGGATGCGACAAA-3′ (sense), 5′-AAGCCCGAAAGAGTCTCTGC-3′ (sense)/IFN-γ (193 bp): 5′-TGAAAATCCTGCAGAGCCAG-3′(sense), 5′-TGGACCTGTGGGTTGTTGAC-3′ (anti-sense).

3.12. Statistical Analysis

Values were analyzed by one-way analysis of variance (ANOVA) followed by Student-Newman-Keuls (S-N-K) test and one to one confrontation test that figure out t-value, p-value with Statistical Package for the Social Sciences (SPSS) software pack (v.18.0, IBM, Armonk, New York, NY, USA).

4. Conclusions

FAS was produced by fermenting AS with lactobacillus, and the phytochemical isolation of FAS yielded 1 as a main component and 2, which was newly produced. The anti-ACD/AD activities of AS, FAS, 1 and 2 were tested in vitro, and FAS showed more potent anti-ACD/AD activity than AS. Moreover, 2, the newly isolated FAS, showed more potent anti-ACD/AD activity than 1, which had been reported to be a potent anti-ACD/AD agent [20]. These results suggest that FAS, AS, 1 and 2 are prominent anti-ACD/AD agents.

Acknowledgments

This study was supported by the Basic Science Research Program through the National Research Foundation of Korea (NRF-2016R1D1A1B03930307), which is funded by the Ministry of Education, Science, and Technology.

Author Contributions

J.Y. and M.W.L. conceived and designed the experiments; J.Y. performed the experiments; J.Y. and H.S.A. analyzed the data; J.Y. and S.H.Y. contributed reagents/materials/analysis tools; J.Y. and M.W.L. wrote the paper.

Conflicts of Interest

The authors declare no conflict of interest.

References

  1. Asher, M.I.; Montefort, S.; Bjorksten, B.; Lai, C.K.; Strachan, D.P.; Weiland, S.K.; Williams, H. ISAAC Phase Three Study Group. Worldwide Time Trends in the Prevalence of Symptoms of Asthma, Allergic Rhinoconjunctivitis, and Eczema in Childhood: ISAAC Phases One and Three Repeat Multicountry Cross-Sectional Surveys. Lancet 2006, 368, 733–743. [Google Scholar] [CrossRef]
  2. Barnetson, R.S.; Rogers, M. Childhood Atopic Eczema. BMJ 2002, 324, 1376–1379. [Google Scholar] [CrossRef] [PubMed]
  3. Grey, K.; Maguiness, S. Atopic Dermatitis: Update for Pediatricians. Pediatr. Ann. 2016, 45, e280–e286. [Google Scholar] [CrossRef] [PubMed]
  4. Simon, D.; Braathen, L.R.; Simon, H.U. Eosinophils and Atopic Dermatitis. Allergy 2004, 59, 561–570. [Google Scholar] [CrossRef] [PubMed]
  5. Hamid, Q.; Boguniewicz, M.; Leung, D.Y. Differential in Situ Cytokine Gene Expression in Acute Versus Chronic Atopic Dermatitis. J. Clin. Investig. 1994, 94, 870–876. [Google Scholar] [CrossRef] [PubMed]
  6. Leung, D.Y. Role of IgE in Atopic Dermatitis. Curr. Opin. Immunol. 1993, 5, 956–962. [Google Scholar] [CrossRef]
  7. Grewe, M.; Gyufko, K.; Schopf, E.; Krutmann, J. Lesional Expression of Interferon-Gamma in Atopic Eczema. Lancet 1994, 343, 25–26. [Google Scholar] [CrossRef]
  8. Chen, L.; Martinez, O.; Overbergh, L.; Mathieu, C.; Prabhakar, B.S.; Chan, L.S. Early Up-Regulation of Th2 Cytokines and Late Surge of Th1 Cytokines in an Atopic Dermatitis Model. Clin. Exp. Immunol. 2004, 138, 375–387. [Google Scholar] [CrossRef] [PubMed]
  9. Park, S.; Lee, J.B.; Kang, S. Topical Application of Chrysanthemum Indicum L. Attenuates the Development of Atopic Dermatitis-Like Skin Lesions by Suppressing Serum IgE Levels, IFN-γ, and IL-4 in Nc/Nga Mice. Evid Based. Complement. Alternat Med. 2012, 2012. [Google Scholar] [CrossRef]
  10. Usatine, R.P.; Riojas, M. Diagnosis and Management of Contact Dermatitis. Am. Fam. Physician 2010, 82, 249–255. [Google Scholar] [PubMed]
  11. Berke, R.; Singh, A.; Guralnick, M. Atopic Dermatitis: An Overview. Am. Fam. Physician 2012, 86, 35–42. [Google Scholar] [PubMed]
  12. Tabassum, N.; Hamdani, M. Plants used to Treat Skin Diseases. Pharmacogn. Rev. 2014, 8, 52–60. [Google Scholar] [CrossRef] [PubMed]
  13. Puupponen-Pimia, R.; Nohynek, L.; Juvonen, R.; Kosso, T.; Truchado, P.; Westerlund-Wikstrom, B.; Leppanen, T.; Moilanen, E.; Oksman-Caldentey, K.M. Fermentation and Dry Fractionation Increase Bioactivity of Cloudberry (Rubus Chamaemorus). Food Chem. 2016, 197, 950–958. [Google Scholar] [CrossRef] [PubMed]
  14. Zhang, L.X.; Gao, W.Y.; Wang, H.Y. Review of Traditional Chinese Medicine Processed by Fermentation. Zhongguo Zhong Yao Za Zhi 2012, 37, 3695–3700. [Google Scholar] [PubMed]
  15. Barbagallo, M.; Marotta, F.; Dominguez, L.J. Oxidative Stress in Patients with Alzheimer's Disease: Effect of Extracts of Fermented Papaya Powder. Mediators Inflamm. 2015, 2015, 624801. [Google Scholar] [CrossRef] [PubMed]
  16. Lee, S. (Ed.) Korea Folk Medicine; Seoul National University Publishing Center Press: Seoul, Korea, 1966. [Google Scholar]
  17. Pui-hay, B.P.; Sung, C.K. International Collation of Traditional and Folk Medicine; Kimura Takeatsu; World Scientific Publishing Company: Singapore, 2001. [Google Scholar]
  18. Kim, M.H.; Park, K.H.; Kim, S.R.; Park, K.J.; Oh, M.H.; Heo, J.H.; Yoon, K.H.; Yin, J.; Yoon, K.H.; Lee, M.W. Two New Phenolic Compounds from the Leaves of Alnus Sibirica Fisch. Ex Turcz. Nat. Prod. Res. 2016, 30, 206–213. [Google Scholar] [CrossRef] [PubMed]
  19. Choi, S.E.; Park, K.H.; Jeong, M.S.; Kim, H.H.; Lee, D.I.; Joo, S.S.; Lee, C.S.; Bang, H.; Choi, Y.W.; Lee, M.K.; et al. Effect of Alnus Japonica Extract on a Model of Atopic Dermatitis in NC/Nga Mice. J. Ethnopharmacol. 2011, 136, 406–413. [Google Scholar] [CrossRef] [PubMed]
  20. Jeong, M.S.; Choi, S.E.; Kim, J.Y.; Kim, J.S.; Kim, E.J.; Park, K.H.; Lee, D.I.; Joo, S.S.; Lee, C.S.; Bang, H.; et al. Atopic Dermatitis-Like Skin Lesions Reduced by Topical Application and Intraperitoneal Injection of Hirsutenone in NC/Nga Mice. Clin. Dev. Immunol. 2010, 2010. [Google Scholar] [CrossRef] [PubMed]
  21. Choi, S.E.; Jeong, M.S.; Kang, M.J.; Lee, D.I.; Joo, S.S.; Lee, C.S.; Bang, H.; Lee, M.K.; Myung, S.C.; Choi, Y.W.; et al. Effect of Topical Application and Intraperitoneal Injection of Oregonin on Atopic Dermatitis in NC/Nga Mice. Exp. Dermatol. 2010, 19, e37–e43. [Google Scholar] [CrossRef] [PubMed]
  22. Hwang, O. Role of Oxidative Stress in Parkinson's Disease. Exp. Neurobiol. 2013, 22, 11–17. [Google Scholar] [CrossRef] [PubMed]
  23. Halliwell, B. Oxidative Stress and Cancer: Have we Moved Forward? Biochem. J. 2007, 401, 1–11. [Google Scholar] [CrossRef] [PubMed]
  24. Valko, M.; Leibfritz, D.; Moncol, J.; Cronin, M.T.; Mazur, M.; Telser, J. Free Radicals and Antioxidants in Normal Physiological Functions and Human Disease. Int. J. Biochem. Cell Biol. 2007, 39, 44–84. [Google Scholar] [CrossRef] [PubMed]
  25. Sivaranjani, N.; Rao, S.V.; Rajeev, G. Role of Reactive Oxygen Species and Antioxidants in Atopic Dermatitis. J. Clin. Diagn. Res. 2013, 7, 2683–2685. [Google Scholar] [CrossRef] [PubMed]
  26. Lee, J.H.; Yeom, S.H.; Kim, M.K.; Kim, H.J.; Shim, J.G.; Lee, M.W. Antioxidative Activities of Diarylheptanoids from Alnus Japonica and their Structural Relationship. Korean J. Pharm. 2003, 34, 190–192. [Google Scholar]
  27. Hou, Y.C.; Janczuk, A.; Wang, P.G. Current Trends in the Development of Nitric Oxide Donors. Curr. Pharm. Des. 1999, 5, 417–441. [Google Scholar] [PubMed]
  28. Coleman, J.W. Nitric Oxide in Immunity and Inflammation. Int. Immunopharmacol. 2001, 1, 1397–1406. [Google Scholar] [CrossRef]
  29. Ryan, J.J. Interleukin-4 and its Receptor: Essential Mediators of the Allergic Response. J. Allergy Clin. Immunol. 1997, 99, 1–5. [Google Scholar] [CrossRef]
  30. Bacharier, L.B.; Geha, R.S. Molecular Mechanisms of IgE Regulation. J. Allergy Clin. Immunol. 2000, 105, S547–S558. [Google Scholar] [CrossRef]
  31. Jabara, H.H.; Ahern, D.J.; Vercelli, D.; Geha, R.S. Hydrocortisone and IL-4 Induce IgE Isotype Switching in Human B Cells. J. Immunol. 1991, 147, 1557–1560. [Google Scholar]
  32. Purkerson, J.M.; Isakson, P.C. Interleukin 5 (IL-5) Provides a Signal that is Required in Addition to IL-4 for Isotype Switching to Immunoglobulin (Ig) G1 and IgE. J. Exp. Med. 1992, 175, 973. [Google Scholar] [CrossRef] [PubMed]
  33. Kiniwa, M.; Gately, M.; Gubler, U.; Chizzonite, R.; Fargeas, C.; Delespesse, G. Recombinant Interleukin-12 Suppresses the Synthesis of Immunoglobulin E by Interleukin-4 Stimulated Human Lymphocytes. J. Clin. Investig. 1992, 90, 262–266. [Google Scholar] [CrossRef] [PubMed]
  34. Waage, A.; Brandtzaeg, P.; Halstensen, A.; Kierulf, P.; Espevik, T. The Complex Pattern of Cytokines in Serum from Patients with Meningococcal Septic Shock. Association between Interleukin 6, Interleukin 1, and Fatal Outcome. J. Exp. Med. 1989, 169, 333–338. [Google Scholar] [CrossRef] [PubMed]
  35. Slordal, L.; Warren, D.J.; Moore, M.A. Effect of Recombinant Murine Tumor Necrosis Factor on Hemopoietic Reconstitution in Sublethally Irradiated Mice. J. Immunol. 1989, 142, 833–835. [Google Scholar] [PubMed]
  36. Grau, G.E.; Piguet, P.; Vassalli, P.; Lambert, P. Involvement of Tumour Necrosis Factor and Other Cytokines in Immune-Mediated Vascular Pathology. Int. Arch. Allergy Immunol. 1989, 88, 34–39. [Google Scholar] [CrossRef]
  37. Scheurich, P.; Thoma, B.; Ucer, U.; Pfizenmaier, K. Immunoregulatory Activity of Recombinant Human Tumor Necrosis Factor (TNF)-Alpha: Induction of TNF Receptors on Human T Cells and TNF-Alpha-Mediated Enhancement of T Cell Responses. J. Immunol. 1987, 138, 1786. [Google Scholar] [PubMed]
  38. Behniafard, N.; Gharagozlou, M.; Farhadi, E.; Khaledi, M.; Sotoudeh, S.; Darabi, B.; Mohammad Fathi, S.; Gholizadeh Moghaddam, Z.; Mahmoudi, M.; Aghamohammadi, A.; et al. TNF-Alpha Single Nucleotide Polymorphisms in Atopic Dermatitis. Eur. Cytokine Netw. 2013, 23, 163–165. [Google Scholar]
  39. Sumimoto, S.; Kawai, M.; Kasailma, Y.; Hamamoto, T. Increased Plasma Tumour Necrosis Factor-Ut Concentration in Atopic Dermatitis. Arch. Dis. Child. 1992, 67, 277–279. [Google Scholar] [CrossRef]
  40. De Becker, G.; Moulin, V.; Tielemans, F.; De Mattia, F.; Urbain, J.; Leo, O.; Moser, M. Regulation of T Helper Cell Differentiation in Vivo by Soluble and Membrane Proteins Provided by Antigen-Presenting Cells. Eur. J. Immunol. 1998, 28, 3161–3171. [Google Scholar] [CrossRef]
  41. Blaher, B.; McCluskey, J.; Puy, R.; Czarny, D.; Rolland, J.M. T Cell Response to Grass Pollen Allergens: Correlation with Skin Test Reactivity and Serum IgE Levels. Immunol. Cell Biol. 1995, 73, 17–22. [Google Scholar] [CrossRef] [PubMed]
  42. Gober, M.D.; Fishelevich, R.; Zhao, Y.; Unutmaz, D.; Gaspari, A.A. Human Natural Killer T Cells Infiltrate into the Skin at Elicitation Sites of Allergic Contact Dermatitis. J. Investig. Dermatol. 2008, 128, 1460–1469. [Google Scholar] [CrossRef] [PubMed]
  43. Simon, D.; Kozlowski, E.; Simon, H. Natural Killer T Cells Expressing IFN-Gamma and IL-4 in Lesional Skin of Atopic Eczema. Allergy 2009, 64, 1681–1684. [Google Scholar] [CrossRef] [PubMed]
  44. Stalder, J.F.; Taïeb, A.; Atherton, D.J.; Bieber, P.; Bonifazi, E.; Broberg, A.; Calza, A.; Coleman, R.; De Prost, Y.; Stalder, J.F.; et al. Severity Scoring of Atopic Dermatitis: The SCORAD Index. Consensus Report of the European Task Force on Atopic Dermatitis. Dermatology 1993, 186, 23–31. [Google Scholar]
Sample Availability: Samples of the compounds and the extracts are available from the authors.
Figure 1. Structures of hirsutenone (1) and muricarpon B (2).
Molecules 23 00450 g001
Figure 2. Cytotoxicity activity in RAW 264.7 cell. (a): cytotoxicity activity of AS and FAS in RAW 264.7 cell; (b): cytotoxicity activity of 1 and 2 in RAW 264.7 cell. X axis: concentration of dose, Y axis: viability activity (%). The results were expressed as mean ± S.D. of triplicated experiments. (n = 3)
Molecules 23 00450 g002
Figure 3. Cytotoxicity activity in RAW 264.7 cell. (a): Cytotoxicity activity of AS and FAS in RBL-2H3 cell; (b): cytotoxicity activity of 1 and 2 in RBL-2H3 cell. X axis: concentration of dose, Y axis: viability activity (%). The results were expressed as mean ± S.D. of triplicated experiments (n = 3).
Molecules 23 00450 g003
Figure 4. Anti-ACD/AD experiment in vitro. (a): Inhibitory activities of IFN-γ and Th2 on extract level in RAW 264.7 cells; (b): Inhibitory activities of Th1 and Th2 on compound level in RAW 264.7 cells. The results were expressed as mean ± S.D. of triplicated experiments. (n = 3). C: Negative control group; N: Normal control group. Y axis: concentration of cytokine (pg/mL) *** p < 0.001, comparing with negative control group; ### p < 0.001, ## p < 0.01, comparing with normal control group.
Molecules 23 00450 g004
Figure 5. Anti-ACD/AD experiment in vitro. (a): regulation of TNF-α on extract level in RBL-2H3 basophils cell lines; (b): regulation of TNF-α on compound level in RBL-2H3 basophils cell lines; (c): regulation of IL-10 on extract level in RBL-2H3 cells; (d): regulation of IL-10 on compound level in RBL-2H3 cells; (e): regulation of IL-12 on extract level in RBL-2H3 cells; (f): regulation of IL-12 on compound level in RBL-2H3 cells. The results were expressed as mean ± S.D. of triplicated experiments. (n = 3). C: Negative control group; N: Normal control group. X axis: concentration of dose, Y axis: concentration of cytokine (pg/mL) *** p < 0.001, ** p < 0.01, * p < 0.05, comparing with negative control group.
Molecules 23 00450 g005
Figure 6. The condition of ACD/AD model animals after induced ACD/AD and treatment by experimental doses. (a): SCORAD indices for AS, FAS, 1 and 2. X axis: Day of experiment, Y axis: The score of SCORAD; (b): Body weights of the experiment animals. X axis: Day of experiment, Y axis: Body weight of Balb/C mice (g). The results were expressed as mean ± S.D. of triplicate experiments. (n = 5). C: Negative control group; B: Blank normal control group.
Molecules 23 00450 g006
Figure 7. Anti-ACD/AD experiment in vivo. (a): Inhibitory activities of IgE levels in blood on extract level and compound level. Y axis: Concentration of cytokine (pg/mL); (b): Inhibitory activities of Th1 and Th2 on extract level in spleen. Y axis: Relative quantification of cytokine; (c): Inhibitory activities of Th1 and Th2 on compound levels in spleen. Y axis: Relative quantification of cytokine. The results were expressed as mean ± S.D. of triplicate experiments. (n = 5). C: Negative control group; N: Normal control group. *** p < 0.001, ** p < 0.01, * p < 0.05, comparing with negative control group; ### p < 0.001, comparing with normal control group.
Molecules 23 00450 g007aMolecules 23 00450 g007b
Table 1. IC50 values for FAS, AS, H, and M against DPPH and NBT radical scavenging activity.
SamplesDPPH Radical Scavenging ActivityNBT Radical Scavenging Activity
IC50 (μg/mL)IC50 (μM)IC50 (μg/mL)IC50 (μM)
FAS24.34 ± 0.9 1.11 ± 0.36
AS31.41 ± 1.14 6.57 ± 0.44
1 14.08 ± 0.13 17.56 ± 0.29
2 24.08 ± 1.08 30.16 ± 2.85
l-Ascorbic acid14.68 ± 0.3624.81 ± 0.59
Allopurinol 0.95 ± 0.27.99 ± 0.66
Values are presented as mean ± SD (n = 3).
Table 2. IC50 values for FAS, AS, H, and M against inhibiting NO production on LPS-stimulated RAW264.7 cells.
SamplesInhibition of NO Production
IC50 (μg/mL)IC50 (μM)
FAS13.00 ± 0.38
AS19.31 ± 1.22
1 14.10 ± 0.20
2 22.66 ± 1.18
L-NMMA2.22 ± 0.1137.05 ± 1.21
Values are presented as mean ± SD (n = 3).

