
Rapid and Cost-Effective Quantification of Glucosinolates and Total Phenolic Content in Rocket Leaves by Visible/Near-Infrared Spectroscopy

 , ,
, ,
Abstract
: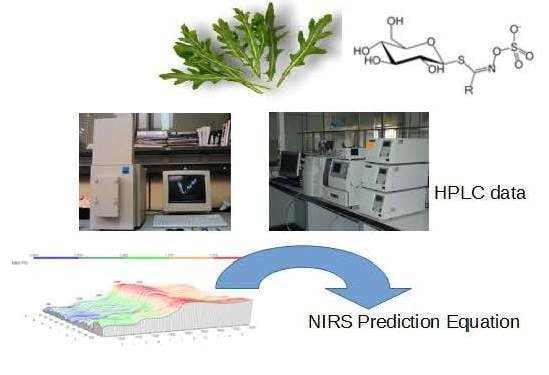
1. Introduction
2. Results and Discussion
2.1. Reference Values
2.2. Spectral Data Pre-Treatments and Equation Performances
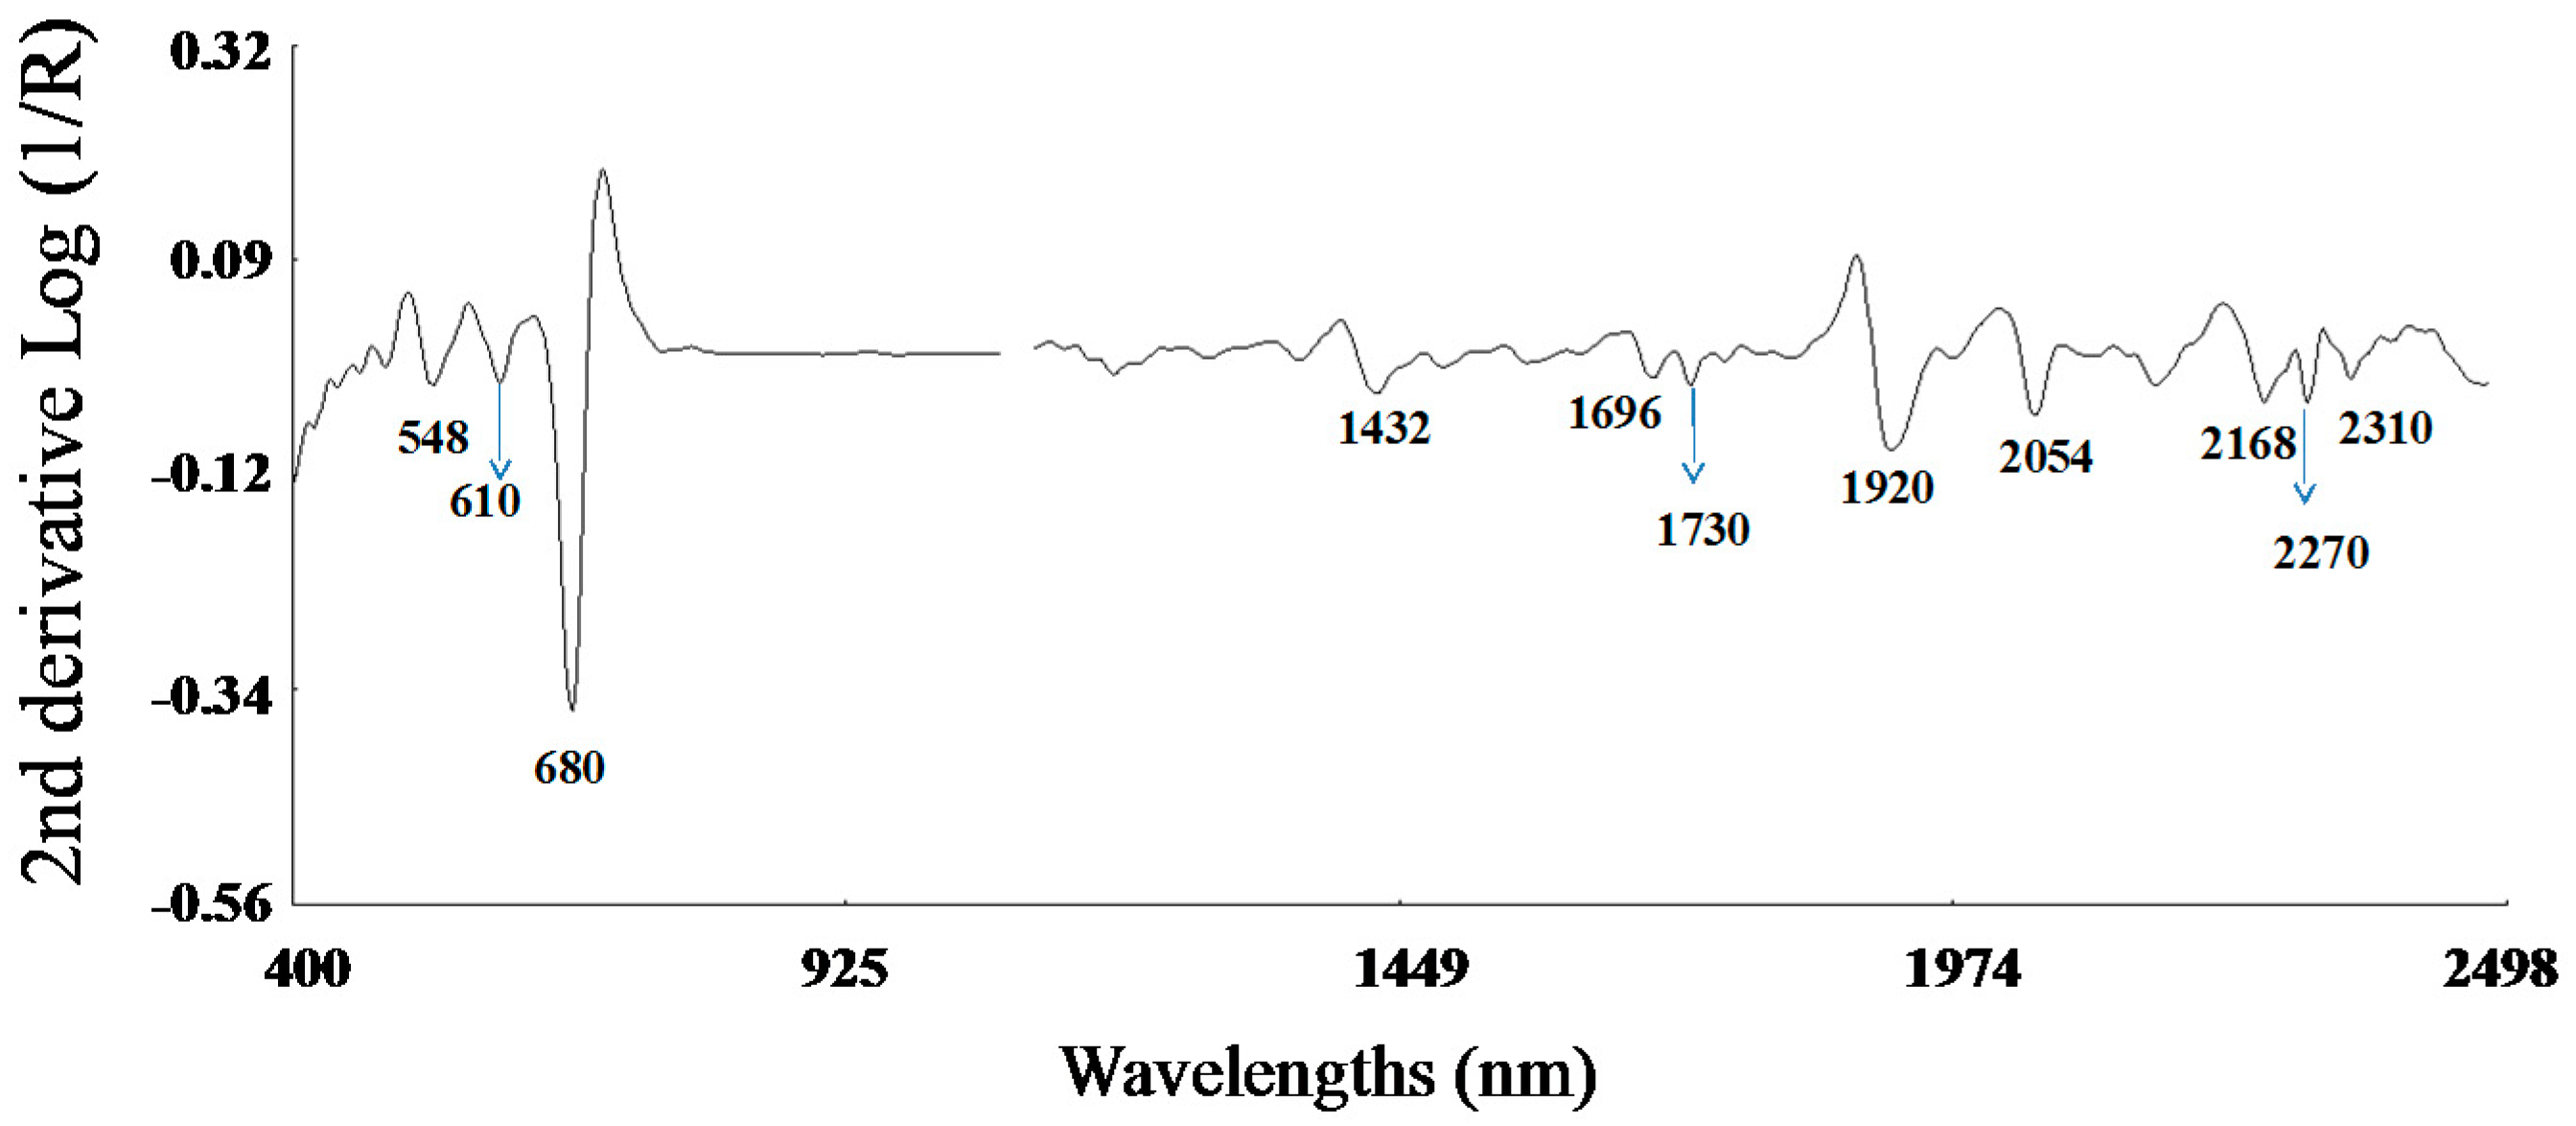
2.2.1. Second Derivative Spectra of Rocket Leaf
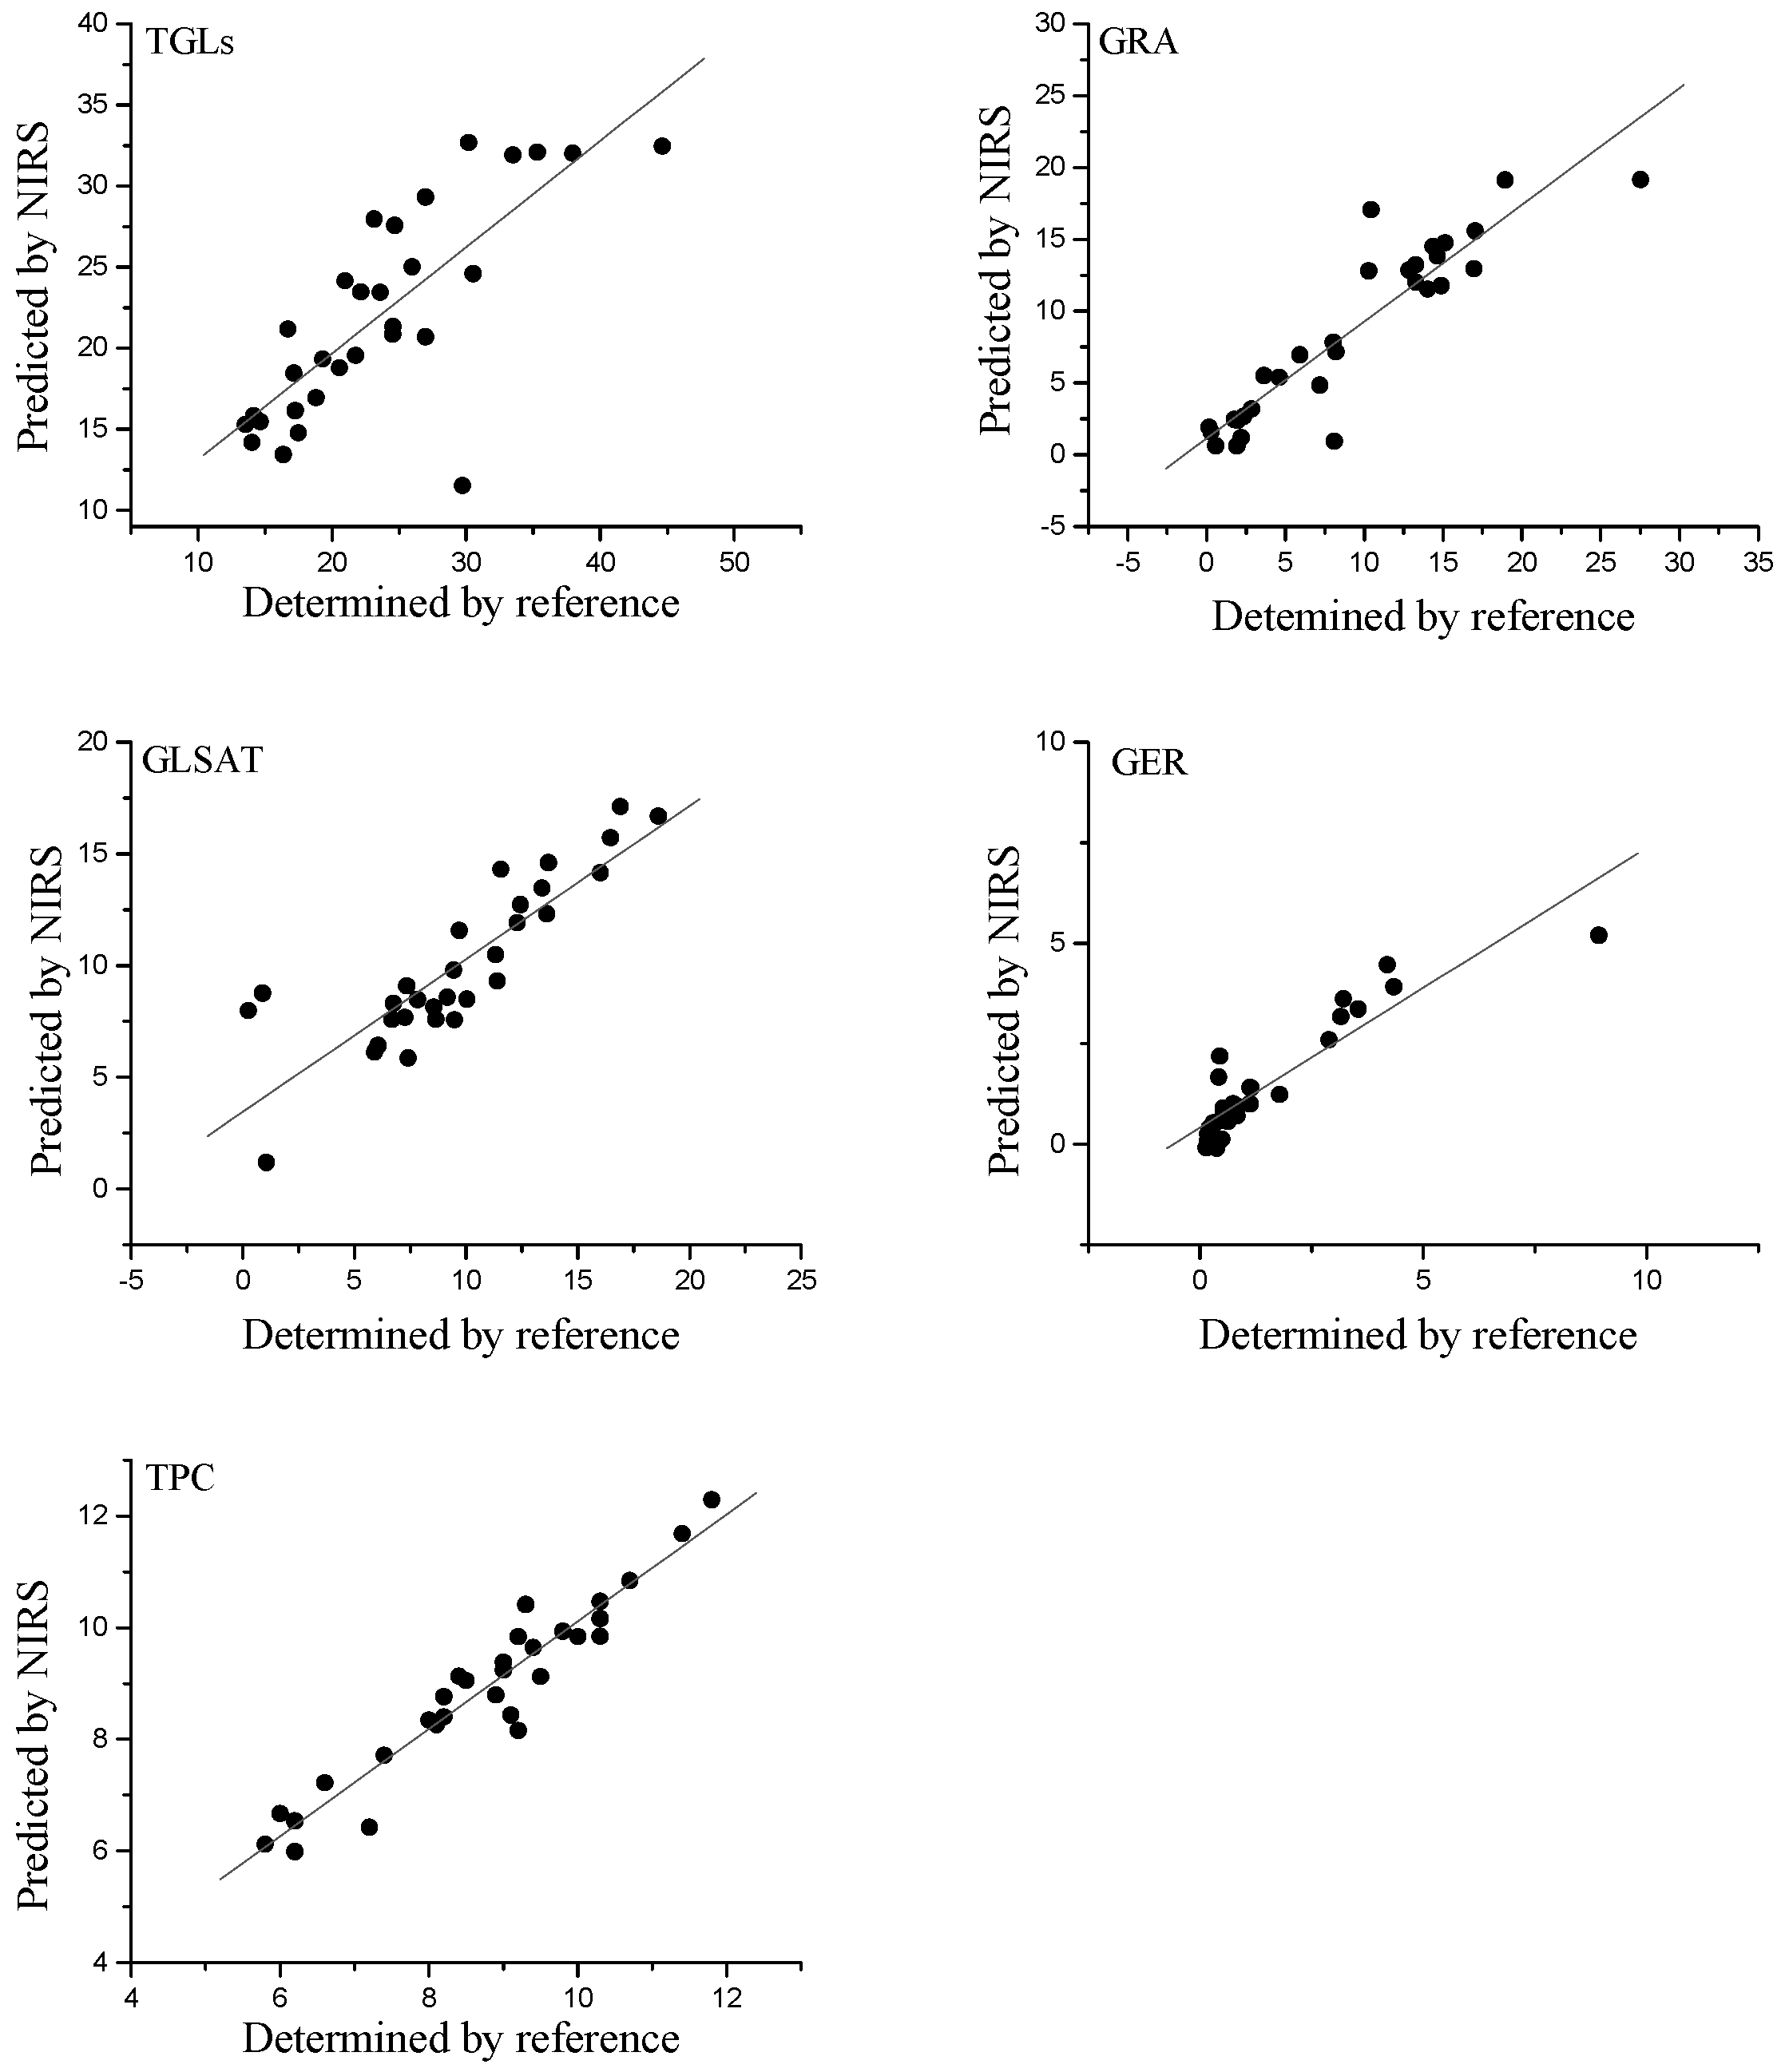
2.2.2. Calibration Equation
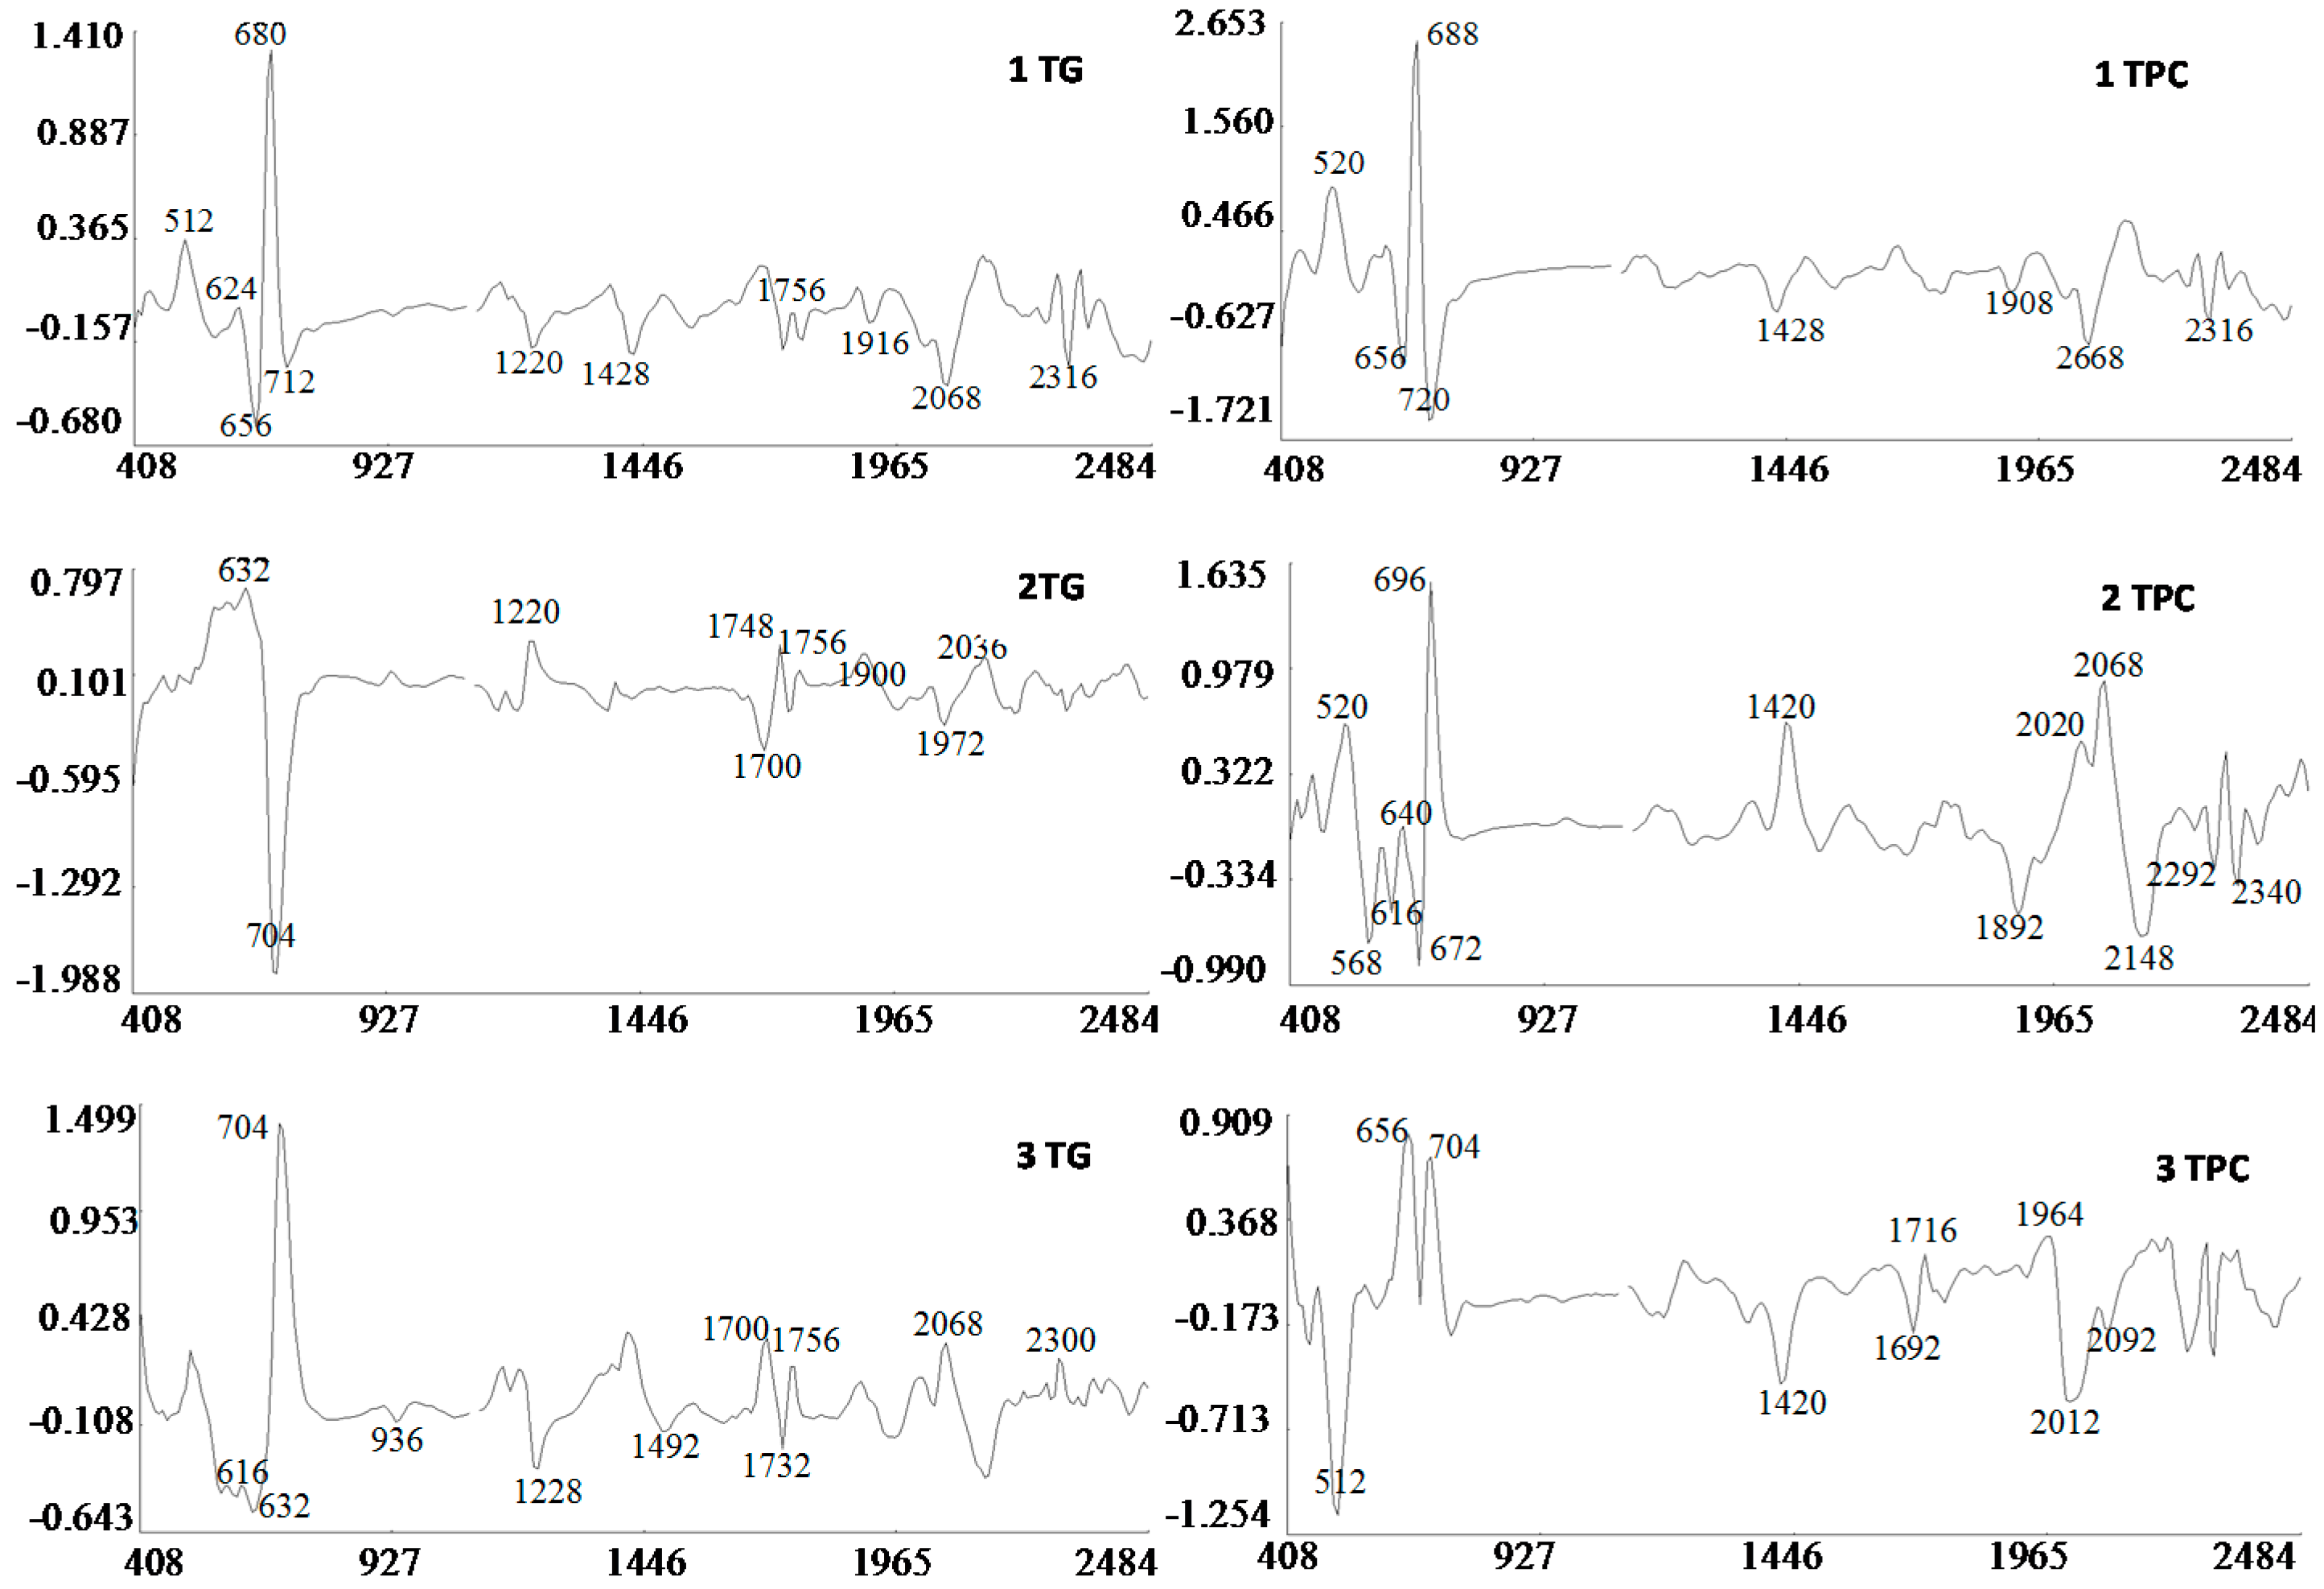
2.2.3. Modified Partial Least Square Loadings
3. Materials and Methods
3.1. Plant Material and Greenhouse Experiments
3.2. Sample Pre-Treatment and Storage
3.3 GLs Analysis by Liquid Chromatography with Ultraviolet Absorbance Detection (LC-UV)
3.4. Determination of the Total Phenolic Fraction
3.5. NIRS Analysis Calibration and Validation Development
3.6. Statistical Analysis
4. Conclusions
Acknowledgments
Author Contributions
Conflicts of Interest
References
- Zeven, A.C.; de Wet, J.M.J. Dictionary of Cultivated Plants and Their Regions of Diversity, 2nd ed.; Centre for Agricultural Publishing and Documentation: Wageningen, The Netherlands, 1982; p. 107. [Google Scholar]
- Warwick, S.I. Guide to the wild germplasm of brassica and allied crops. Pt. V: Life history and geographical data for wild species in the tribe Brassiceae (Cruciferae). Agric. Can. Tech. Bull. 1994, 2E, 61. [Google Scholar]
- Yaniv, Z.; Schafferman, D.; Amar, Z. Tradition, uses, and biodiversity of rocket (Eruca. sativa) in Israel. Econ. Bot. 1998, 52, 394–400. [Google Scholar] [CrossRef]
- Villatoro-Pulido, M.; Priego-Capote, F.; Álvarez-Sánchez, B.; Saha, S.; Philo, M.; Obregón-Cano, S.; De Haro-Bailón, A.; Font, R.; Del Río-Celestino, M. An approach to the phytochemical profiling of rocket [Eruca. sativa (Mill.) Thell]. J. Sci. Food Agric. 2013, 93, 3809–3819. [Google Scholar] [CrossRef] [PubMed]
- Windsor, A.J.; Reichelt, M.; Figuth, A.; Svatos, A.; Kroymann, J.; Kliebenstein, D.J.; Gershenzon, J.; Mitchell-Olds, T. Geographic and evolutionary diversification of glucosinolates among near relatives of Arabidopsis thaliana (Brassicaceae.). Phytochemistry 2005, 66, 1321–1333. [Google Scholar] [CrossRef] [PubMed]
- Louda, S.; Mole, S. Glucosinolates: chemistry and ecology. In Herbivores: Their Interactions with Secondary Plant Metabolites; Rosenthal, G.A., Berembaum, M.R., Eds.; Academic Press: New York, NY, USA, 1991; Volume 1, pp. 123–164. [Google Scholar]
- Bell, L.; Wagstaff, C. Glucosinolates, myrosinase hydrolysis products, and flavonols found in rocket (Eruca. sativa and Diplotaxis. tenuifolia). J. Agric. Food Chem. 2014, 62, 4481–4492. [Google Scholar] [CrossRef] [PubMed]
- Sørensen, H. Glucosinolates: Structure, properties, function. In Canola and Rapeseed. Production, Chemistry, Nutrition and Processing Technology; Shahidi, F., Ed.; Springer: Berlin, Germany, 1990; pp. 149–172. [Google Scholar]
- Rosa, E.A.S.; Heaney, R.K.; Fenwick., G.R.; Portas, C.A.M. Glucosinolates in crop plants. Hortic. Rev. 1997, 19, 99–225. [Google Scholar]
- Agerbirk, N.; Olsen, C.E. Glucosinolate structures in evolution. Phytochemistry 2012, 77, 16–45. [Google Scholar] [CrossRef] [PubMed]
- Kim, H.J.; Lee, M.J.; Jeong, M.H.; Kim, J.E. Identification and quantification of glucosinolates in kimchi by liquid chromatography-electrospray tandem mass spectrometry. Int. J. Anal. Chem. 2017, 2017, 6753481. [Google Scholar] [CrossRef] [PubMed]
- Fahey, J.W.; Zalcmann, A.T.; Talalay, P. The chemical diversity and distribution of glucosinolates and isothiocyanates among plants. Phytochemistry 2001, 56, 5–51. [Google Scholar] [CrossRef]
- Pasini, F.; Verardo, V.; Caboni, M.F.; D′Antuono, L.F. Determination of glucosinolates and phenolic compounds in rocket salad by HPLC-DAD–MS: Evaluation of Eruca. sativa Mill and Diplotaxis. tenuifolia L. genetic resources. Food Chem. 2012, 133, 1025–1033. [Google Scholar] [CrossRef]
- Angus, J.; Gardner, P.; Kirkegaard, J.; Desmarchlier, J. Biofumigation: Isothiocyanates released from Brassica roots inhibit growth of take-all fungus. Plant. Soil 1994, 162, 107–112. [Google Scholar] [CrossRef]
- Fahey, J.W.; Haristoy, X.; Dolan, P.M.; Kensler, T.W.; Scholtus, I.; Stephenson, K.K.; Talalay, P.; Lozniewski, A. Sulforaphane inhibits extracellular, intracellular, and antibiotic-resistant strains of Helicobacter pylori and prevents benzo[a]pyrene-induced stomach tumors. Proc. Natl. Acad. Sci. USA 2002, 99, 7610–7615. [Google Scholar] [CrossRef] [PubMed]
- Chen, S.; Andreasson, E. Update on glucosinolate metabolism and transport. Plant. Physio. Bioch. 2001, 39, 743–758. [Google Scholar] [CrossRef]
- Mithen, R. Glucosinolates-biochemistry, genetics and biological activity. Plant. Growth Regul. 2001, 34, 91–103. [Google Scholar] [CrossRef]
- Juge, N.; Mithen, R.F.; Traka, M. Molecular basis of chemoprevention by sulforaphane: A comprehensive review. Cell. Mol. Life Sci. 2007, 64, 1105–1127. [Google Scholar] [CrossRef] [PubMed]
- Keum, Y.S.; Jeong, W.S.; Kong, A.N. Chemoprevention by isothiocyanates and their underlying molecular signaling mechanisms. Mutat. Res. 2004, 555, 191–202. [Google Scholar] [CrossRef] [PubMed]
- Iori, R.; Bernardi, R.; Gueyrard, D.; Rollin, P.; Palmieri, S. Formation of glucoraphanin by chemoselective oxidation of natural glucoerucin: A chemoenzymatic route to sulforaphane. Bioorg. Med. Chem. Lett. 1999, 9, 1047–1048. [Google Scholar] [CrossRef]
- Fimognari, C.; Nusse, M.; Berti, F.; Iori, R.; Cantelli-Forti, G.; Hrelia, P. Isothiocyanates as novel cytotoxic and cytostatic agents: Molecular pathway on human transformed and nontransformed cells. Biochem. Pharmacol. 2004, 68, 1133–1138. [Google Scholar] [CrossRef] [PubMed]
- Fimognari, C.; Nusse, M.; Iori, R.; Cantelli-Forti, G.; Hrelia, P. The new isothiocyanate 4-(methylthio)butyl isothiocyanate selectively affects cell-cycle progression and apoptosis induction of human leukemia cells. Invest. New Drugs 2004, 22, 119–129. [Google Scholar] [CrossRef] [PubMed]
- Kim, S.J.; Kawaharada, C.; Jin, S.; Hashimoto, M.; Ishii, G.; Yamauchi, H. Structural elucidation of 4-(cysteine-S-yl)butyl glucosinolate from the leaves of Eruca. sativa. Biosci. Biotech. Bioch. 2007, 71, 114–121. [Google Scholar] [CrossRef] [PubMed]
- Cataldi, T.R.I.; Rubino, A.; Lelario, F.; Bufo, S.A. Naturally occurring glucosinolates in plant extracts of rocket salad (Eruca. sativa L.) identified by liquid chromatography coupled with negative ion electrospray ionization and quadrupole ion-trap mass spectrometry. Rapid Commun. Mas. Spectrom. 2007, 21, 2374–2388. [Google Scholar] [CrossRef] [PubMed]
- Kim, S.J.; Ishii, G. Glucosinolate profiles in the seeds, leaves and roots of rocket salad (Eruca. sativa Mill.) and anti-oxidative activities of intact plant powder and purified 4-methoxyglucobrassicin. Soil Sci. Plant. Nutr. 2006, 52, 394–400. [Google Scholar] [CrossRef]
- Weckerle, B.; Michel, K.; Balázs, B.; Schreier, P.; Tóth, G. Quercetin 3,3′,4′-tri-O-β-d-glucopyranosides from leaves of Eruca. sativa (Mill.). Phytochemistry. 2001, 57, 547–551. [Google Scholar] [CrossRef]
- Vallejo, F.; Tomás-Barberán, F.A.; García-Viguera, C. Potential bioactive compounds in health promotion from broccoli cultivars grown in Spain. J. Sci. Food Agric. 2002, 82, 1293–1297. [Google Scholar] [CrossRef]
- Danielak, R.; Borkowski, B. Biologically active compounds in seeds of crucifers Part III. Chromatographical search for glucosinolates. Dissert. Pharm. Pharma. 1969, 2, 563–575. [Google Scholar]
- Velasco, L.; Becker, H.C. Analysis of total glucosinolate content and individual glucosinolates in Brassica spp. by near-infrared reflectance spectroscopy. Plant. Breeding 1998, 117, 97–102. [Google Scholar] [CrossRef]
- Villatoro-Pulido, M.M.; Moreno-Rojas, R.; Muñoz-Serrano, A.; Cardeñosa, V.; Amaro-López, M.A.; Font, R.; Del Río-Celestino, M. Characterization and prediction by near-infrared reflectance of mineral composition of rocket (Eruca. vesicaria subsp. sativa and Eruca. vesicaria subsp. vesicaria). J. Sci. Food Agric. 2012, 92, 1331–1340. [Google Scholar] [CrossRef] [PubMed]
- Biston, R.; Dardenne, P.; Cwikowski, M.; Marlier, M.; Severin, M.; Wathelet, J.P. Fast Analysis of Rapeseed Glucosinolates by near-Infrared Reflectance Spectroscopy. J. Am. Oil Chem. Soc. 1988, 65, 1599–1600. [Google Scholar] [CrossRef]
- Daun, J.K.; Clear, K.M.; Williams, P. Comparison of three whole seed near-infrared analyzers for measuring quality components of canola seed. J. Am. Oil Chem. Soc. 1994, 71, 1063–1608. [Google Scholar] [CrossRef]
- Font, R.; Del Río, M.; Fernández-Martínez, J.M.; De Haro, A. Use of near-infrared spectroscopy for screening the individual and total glucosinolate content in Indian mustard seed (Brassica juncea L. Czern. & Coss.). J. Agric. Food Chem. 2004, 52, 3563–3569. [Google Scholar] [CrossRef]
- Font, R.; Del Río-Celestino, M.; Cartea, M.; De Haro-Bailón, A. Quantification of glucosinolates in leaves of leaf rape Brassica napus ssp. pabularia) by near-infrared spectroscopy. Phytochemistry 2005, 66, 175–185. [Google Scholar] [CrossRef] [PubMed]
- Font, R.; Del Río-Celestino, M.; Rosa, E.; Aires, A.; De Haro-Bailón, A. Glucosinolate assessment in Brassica oleracea leaves by Near-Infrared Spectroscopy. J. Agric. Sci. 2005, 143, 65–73. [Google Scholar] [CrossRef]
- Hernández-Hierro, J.M.; Valverde, J.; Villacreces, S.; Reilly, K.; Gaffney, M.; Gonzalez-Miret, M.L.; Heredia, F.J.; Downey, G. Feasibility Study on the Use of Visible-Near-Infrared Spectroscopy for the Screening of Individual and Total Glucosinolate Contents in Broccoli. J. Agric. Food Chem. 2012, 60, 7352–7358. [Google Scholar] [CrossRef] [PubMed]
- Bennett, R.N.; Rosa, E.A.S.; Mellon, F.A.; Kroon, P.A. Ontogenic Profiling of Glucosinolates, Flavonoids, and Other Secondary Metabolites in Eruca. sativa (Salad Rocket), Diplotaxis. erucoides (Wall Rocket), Diplotaxis. tenuifolia (Wild Rocket), and Bunias. orientalis (Turkish Rocket). J. Agric. Food Chem. 2006, 54, 4005–4015. [Google Scholar] [CrossRef] [PubMed]
- Bennett, R.N.; Carvalho, R.; Mellon, F.A.; Eagles, J.; Rosa, E.A.S. Identification and quantification of glucosinolates in sprouts derived from deeds of wild Eruca. sativa L. (salad rocket) and Diplotaxis. tenuifolia L. (Wild Rocket) from diverse geographical locations. J. Agric. Food Chem. 2007, 55, 67–74. [Google Scholar] [CrossRef] [PubMed]
- Perez-Balibrea, S.; Moreno, D.A.; García-Viguera, C. Genotypic effects on the phytochemical quality of seeds and sprouts from commercial broccoli cultivars. Food Chem. 2011, 125, 348–354. [Google Scholar] [CrossRef]
- Bell, L.; Yahya, H.N.; Oloyede, O.O.; Methven, L.; Wagstaff, C. Changes in rocket salad phytochemicals within the commercial supply chain: Glucosinolates, isothiocyanates, amino acids and bacterial load increase significantly after processing. Food Chem. 2017, 221, 521–534. [Google Scholar] [CrossRef] [PubMed]
- Naes, T.; Isaksson, T.; Fearn, T.; Davies, T. A User-Friendly Guide to Multivariate Calibration and Classification. NIR Publication: Chichester, UK, 2002. [Google Scholar]
- Wold, S.; Sjostrom, M.; Eriksson, L. PLS-regression: A basic tool of chemometrics. Chemometr. Intel. Lab. 2001, 58, 109–130. [Google Scholar] [CrossRef]
- Osborne, B.G.; Fearn, T.; Hindle, P. Practical NIR Spectroscopy with Applications in Food and Beverage Analysis, 2nd ed.; Addison-Wesley Longman Ltd.: Harlow, UK, 1993. [Google Scholar]
- Murray, I.; Williams, P.C. Chemical principles of near-infrared technology. In Near-Infrared Technology in the Agricultural and Food Industries; Williams, P., Norris, K., Eds.; The American Association of Cereal Chemists: St. Paul, MN, USA, 1987; pp. 17–34. [Google Scholar]
- Petisco, C.; García-Criado, B.; Vázquez-de-Aldana, B.R.; de Haro, A.; García-Ciudad, A. Measurement of quality parameters in intact seeds of Brassica species using visible and near-infrared spectroscopy. Ind. Crops Prod. 2010, 32, 139–146. [Google Scholar] [CrossRef]
- Williams, P.; Norris, K. Near-Infrared Technology in the Agricultural and Food Industries, 2nd ed.; The American Association of Cereal Chemists: St. Paul, MN, USA, 2001; pp. 171–185. [Google Scholar]
- Williams, P.C.; Sobering, D.C. How do we do it: A brief summary of the methods we use in developing near infrared calibrations. In Near Infrared Spectroscopy: The Future Waves; Davies, A.M.C., Williams, P.C., Eds.; NIR Publications: Chichester, UK, 1996; pp. 185–188. [Google Scholar]
- Mika, V.; Tillmann, P.; Koprna, R.; Nerusil, P.; Kucera, V. Fast prediction of quality parameters in whole seeds of oilseed rape (Brassica napus L.). Plant. Soil Environ. 2003, 49, 141–145. [Google Scholar]
- Bala, M.; Singh, M. Non-destructive estimation of total phenol and crude fiber content in intact seeds of rapeseed–mustard using FTNIR. Ind. Crops Prod. 2013, 42, 357–362. [Google Scholar] [CrossRef]
- Thomas, J.R.; Gausman, H.W. Leaf reflectance vs. leaf chlorophyll and carotenoid concentrations for eight crops. Agron. J. 1977, 69, 799–802. [Google Scholar] [CrossRef]
- Cozzolino, D. The Role of Visible and Infrared Spectroscopy Combined with Chemometrics to Measure Phenolic Compounds in Grape and Wine Samples. Molecules 2015, 20, 726–737. [Google Scholar] [CrossRef] [PubMed]
- Wathelet, J.P.; Wagstaffe, P.J.; Boenke, A. The certification of the total glucosinolate and sulphur contents of three rapeseed (colza), CRMs 190, 366 and 367. Comission of the European Communities, report EUR 13339; Office for Official Publications of the European Communities: rue Mercier, Luxembourg, 1991; pp. 1–75. [Google Scholar]
- Singleton, V.L.; Rossi, J.A. Colorimetry of total phenolics with phosphomolybdic phosphotungstic acid reagents. Am. J. Enol. Vitic. 1965, 16, 144–158. [Google Scholar]
- Shenk, J.S.; Westerhaus, M.O. Population structuring of near infrared spectra and modified partial least squares regression. Crop. Sci. 1991, 31, 1548–1555. [Google Scholar] [CrossRef]
- Shenk, J.S.; Westerhaus, M.O. The application of near infrared reflectance spectroscopy (NIRS) to forage analysis. In Forage Quality, Evaluation and Utilization; Fahey, G.C., Jr., Collins, M., Mertens, D.R., Moser, L.E., Eds.; Crop Science Society of America, Soil Science Society of America: Madison, WI, USA, 1994; pp. 406–450. [Google Scholar]
- Barnes, R.J.; Dhanoa, M.S.; Lister, S.J. Standard normal variate transformation and de-trending of near infrared diffuse reflectance spectra. Appl. Spectrosc. 1989, 43, 772–777. [Google Scholar] [CrossRef]
- Shenk, J.S.; Workman, J.; Westerhaus, M. Application of NIR spectroscopy to agricultural products. In Marcel Dekker Handbook of Near Infrared Analysis; Burns, D.A., Ciurczac, E.W., Eds.; CRC press: Boca Raton, FL, USA, 2001; pp. 419–474. [Google Scholar]
Sample Availability: Seeds of all the accessions are available from the authors. |


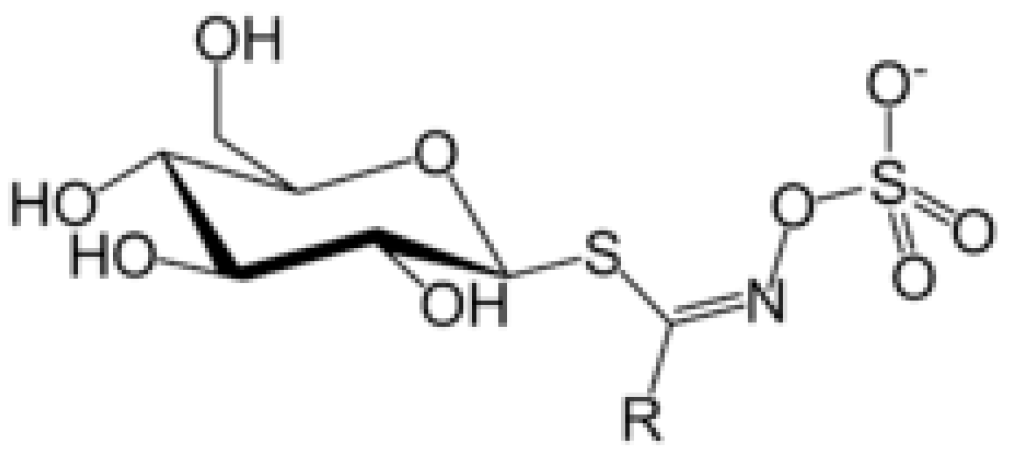
| R (Variable Side Chain) Group Structure | R-Group | Trivial Name |
|---|---|---|
 | 2-(Benzoyloxy) ethyl | - |
 | 3-Hydroxy-5-(methyl-sulfinyl)pentyl | - |
 | 4-(β-D-glucopyranosyldisulfanyl) butyl | Diglucothiobeinin |
 | 5-(Methylsulfinyl)pentyl | Glucoalyssin |
 | 4-Phenylbutyl | Glucoamoracin |
 | 7-(Methylsulfinyl)heptyl | Glucoibarin |
 | Ethyl | Glucolepiidin |
 | 2-Phenylethyl | Gluconasturtiin |
 | 4-(Methylsulfinyl)-3-butenyl | Glucoraphenin |
 | Dimeric 4-mercaptobutyl | DMB |
 | 4-Mercaptobutyl | Glucosativin |
 | 4-Hydroxy-3-indolymethyl | 4-Hydroxyglucobrassicin |
 | 4-(Methylthio)butyl | Glucoerucin |
 | 4-Hydroxybenzyl | Glucosinalbin |
 | (R,S)-2-Hydroxy-3-butenyl | Progoitrin |
 | 3-Indolymethyl | Glucobrassicin |
 | 1-Methylpropyl | Glucocochlearin |
 | 2-Methylbutyl | Glucojiabutin |
 | 3-(Methylthio)propyl | Glucoiberverin |
 | 3-Butenyl | Gluconapin |
 | Benzyl | Glucotropaeolin |
 | 1-Methoxyindol-3-ylmethyl | Neoglucobrassicin |
 | 4-(Methylsulfinyl) butyl | Glucoraphanin |
 | 4-Methoxyindol-3-ylmethyl | 4-Methoxyglucobrassicin |
| Parameter | Range | Mean | SD 1 | R 2C 2 | SEC 3 | R 2CV 4 | SECV 5 | RPDcv 6 |
|---|---|---|---|---|---|---|---|---|
| Total GLs | 4.86–44.65 | 23.56 | 7.32 | 0.79 | 3.34 | 0.70 | 4.02 | 1.83 |
| GRA | 0.13–27.85 | 9.11 | 6.41 | 0.94 | 1.52 | 0.82 | 2.72 | 2.37 |
| GLSAT | 0.25–18.61 | 9.66 | 3.92 | 0.86 | 1.44 | 0.64 | 2.42 | 1.62 |
| GER | 0.14–8.01 | 1.45 | 1.6 | 0.97 | 0.26 | 0.93 | 0.41 | 3.99 |
| TPC | 2.30–12.30 | 8.73 | 1.99 | 0.88 | 0.69 | 0.85 | 0.79 | 2.55 |
| Parameter | TGLs | GRA | GLSAT | GER | TPC |
|---|---|---|---|---|---|
| TGLs | 1 | 0.83 ** | 0.70 ** | −0.37 ** | −0.04 n.s. |
| GRA | 1 | 0.48 ** | −0.53 ** | −0.09 n.s. | |
| GLSAT | 1 | −0.14 n.s. | 0.09 n.s. | ||
| GER | 1 | 0.33 * | |||
| TPC | 1 |
| Parameter | Reference Values (n = 30) | External Validation | ||||||
|---|---|---|---|---|---|---|---|---|
| Range | Mean | SD 1 | R2VAL 2 | SEP(C) 3 | RPDp 4 | RER 5 | ||
| Total GLs | 13.52–39.88 | 23.56 | 7.63 | 0.61 | 4.80 | 1.59 | 6.48 | |
| GRA | 0.15–27.53 | 9.11 | 6.82 | 0.79 | 2.75 | 2.48 | 9.95 | |
| GLSAT | 0.35–17.52 | 9.66 | 4.53 | 0.60 | 2.36 | 1.92 | 7.78 | |
| GER | 0.20–7.34 | 3.20 | 1.90 | 0.59 | 1.22 | 1.56 | 14.89 | |
| TPC | 5.80–11.80 | 8.73 | 1.57 | 0.84 | 0.48 | 3.27 | 12.5 | |
© 2017 by the authors. Licensee MDPI, Basel, Switzerland. This article is an open access article distributed under the terms and conditions of the Creative Commons Attribution (CC BY) license (http://creativecommons.org/licenses/by/4.0/).
Share and Cite
Toledo-Martín, E.M.; Font, R.; Obregón-Cano, S.; De Haro-Bailón, A.; Villatoro-Pulido, M.; Del Río-Celestino, M. Rapid and Cost-Effective Quantification of Glucosinolates and Total Phenolic Content in Rocket Leaves by Visible/Near-Infrared Spectroscopy. Molecules 2017, 22, 851. https://doi.org/10.3390/molecules22050851
Toledo-Martín EM, Font R, Obregón-Cano S, De Haro-Bailón A, Villatoro-Pulido M, Del Río-Celestino M. Rapid and Cost-Effective Quantification of Glucosinolates and Total Phenolic Content in Rocket Leaves by Visible/Near-Infrared Spectroscopy. Molecules. 2017; 22(5):851. https://doi.org/10.3390/molecules22050851
Chicago/Turabian StyleToledo-Martín, Eva María, Rafael Font, Sara Obregón-Cano, Antonio De Haro-Bailón, Myriam Villatoro-Pulido, and Mercedes Del Río-Celestino. 2017. "Rapid and Cost-Effective Quantification of Glucosinolates and Total Phenolic Content in Rocket Leaves by Visible/Near-Infrared Spectroscopy" Molecules 22, no. 5: 851. https://doi.org/10.3390/molecules22050851