
Dietary Nucleotides Supplementation and Liver Injury in Alcohol-Treated Rats: A Metabolomics Investigation


Abstract
: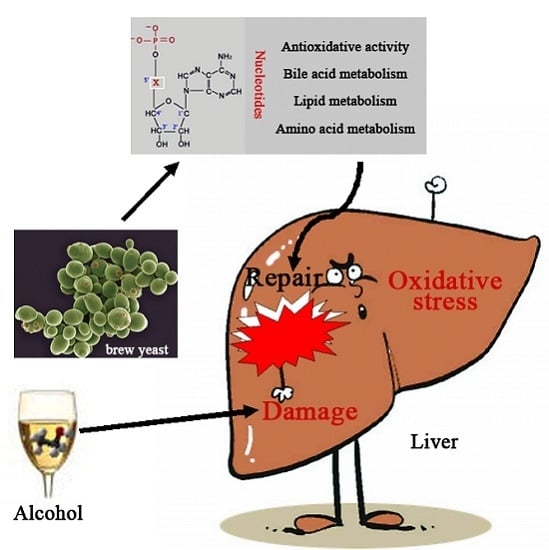
1. Introduction
2. Results
2.1. Biochemical Indices in the Serum
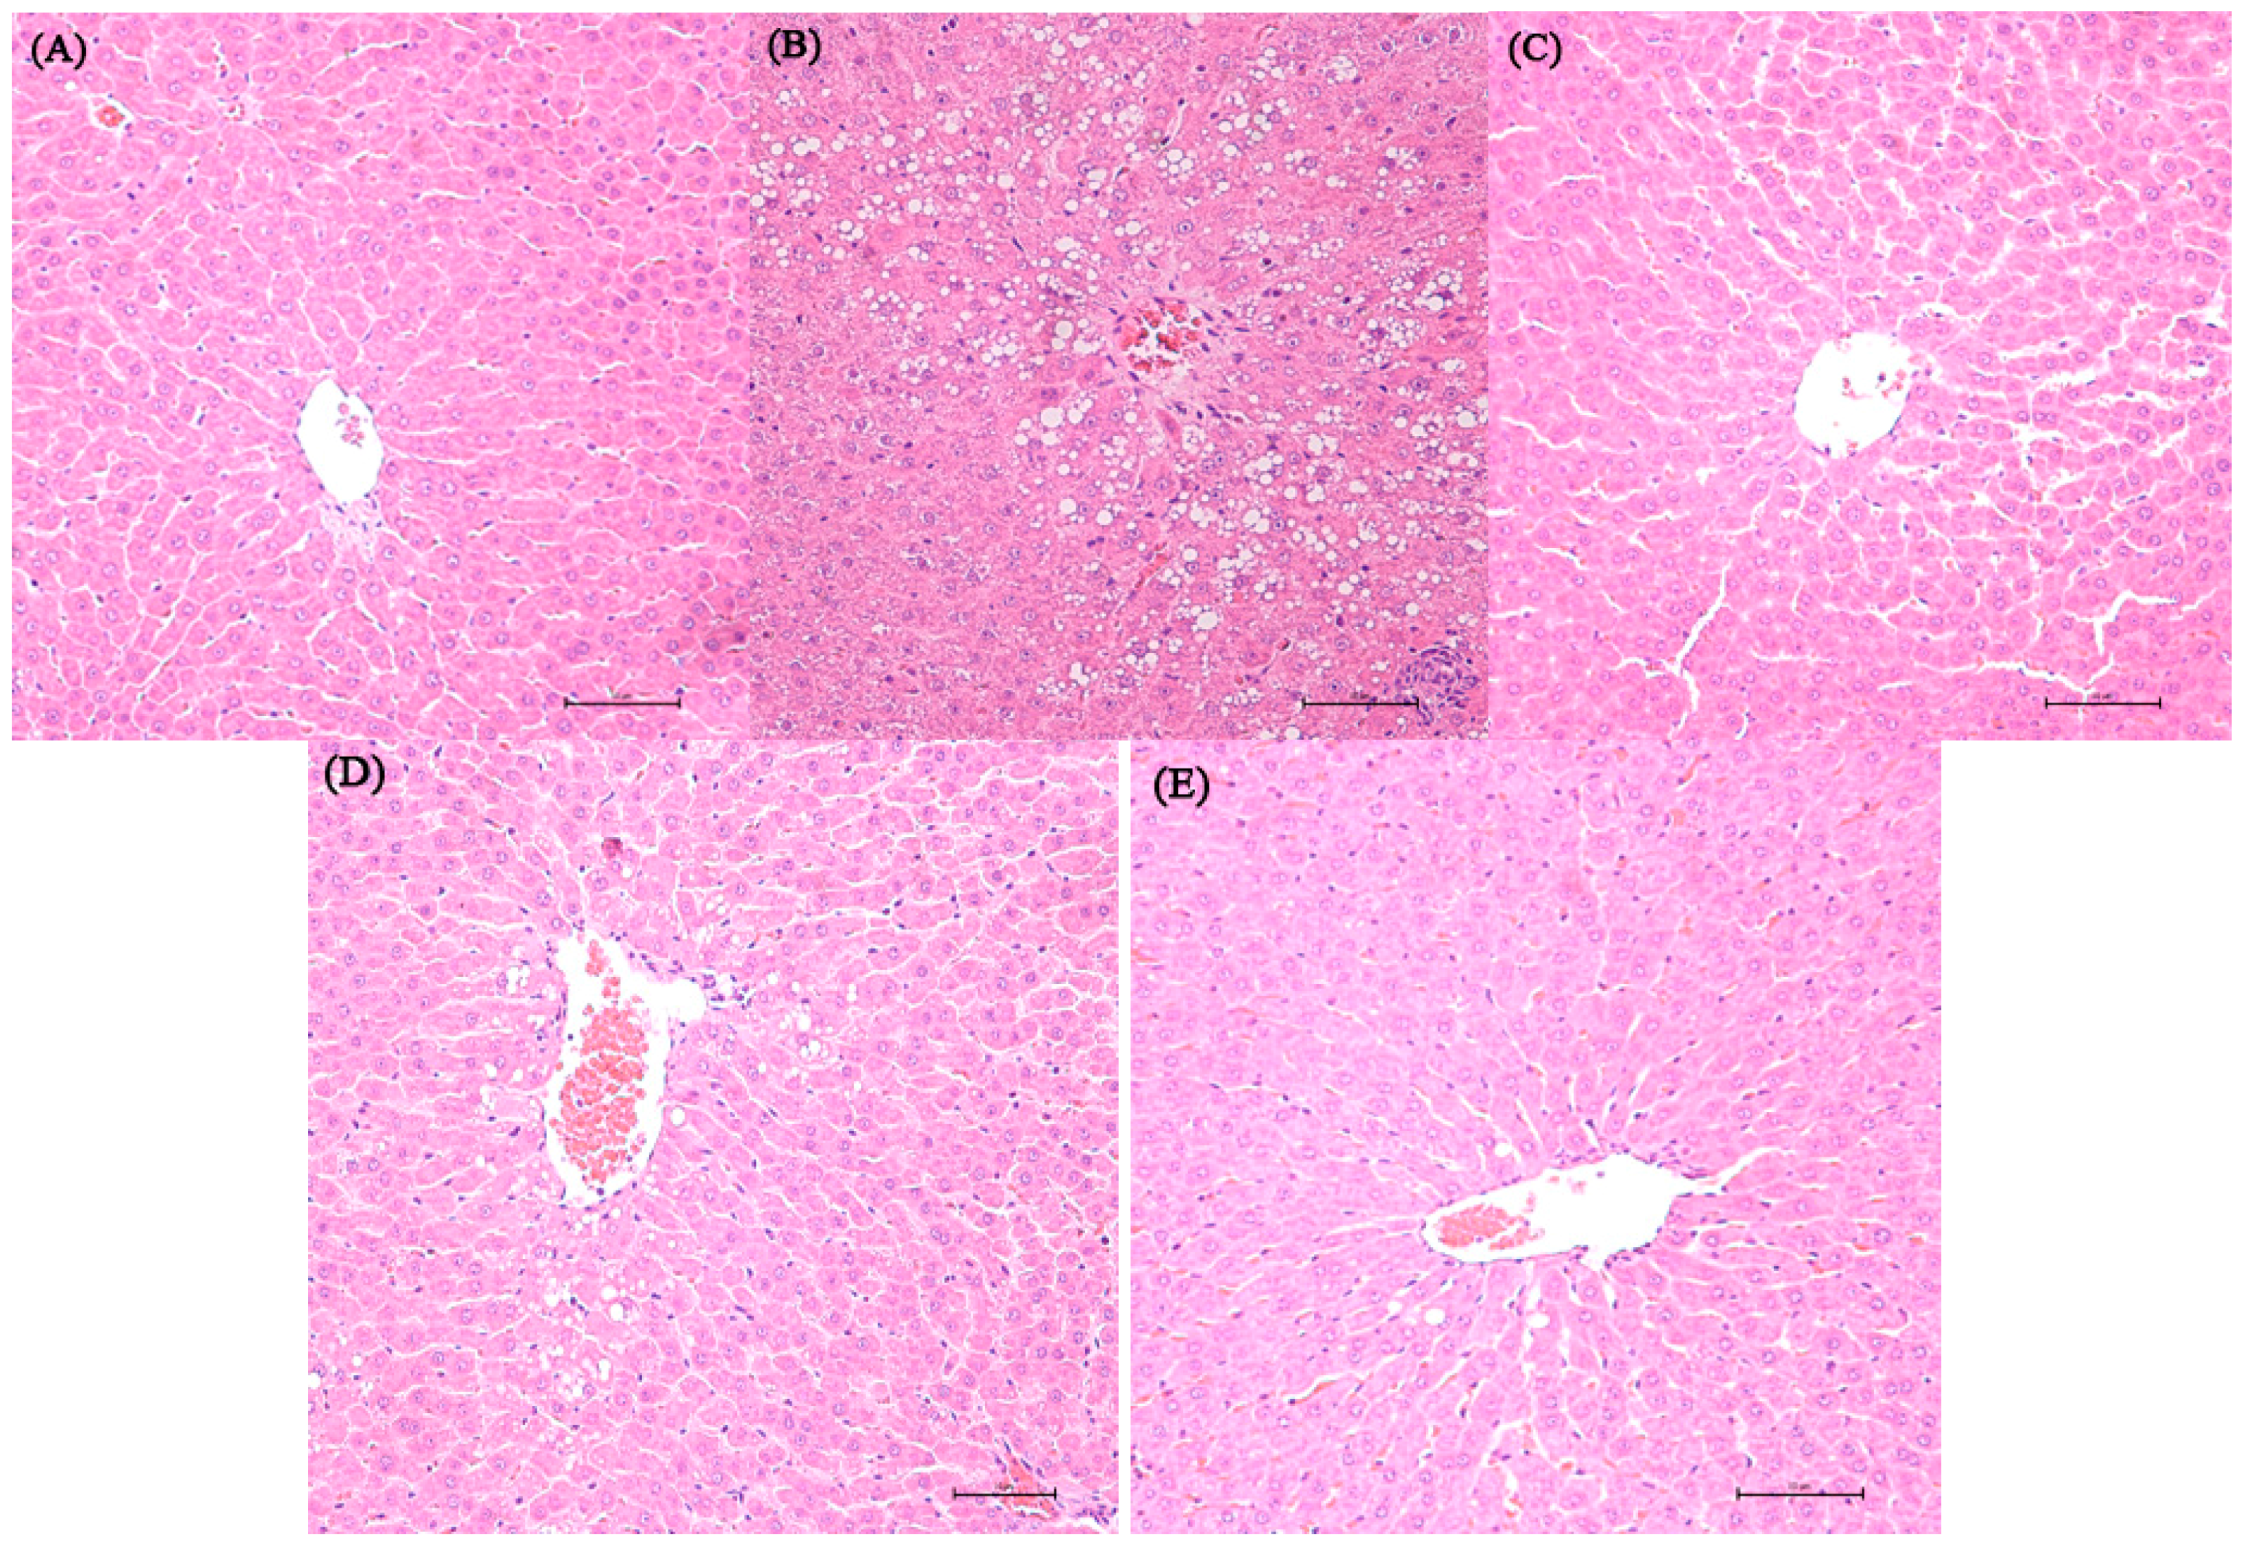
2.2. Histopathological Result
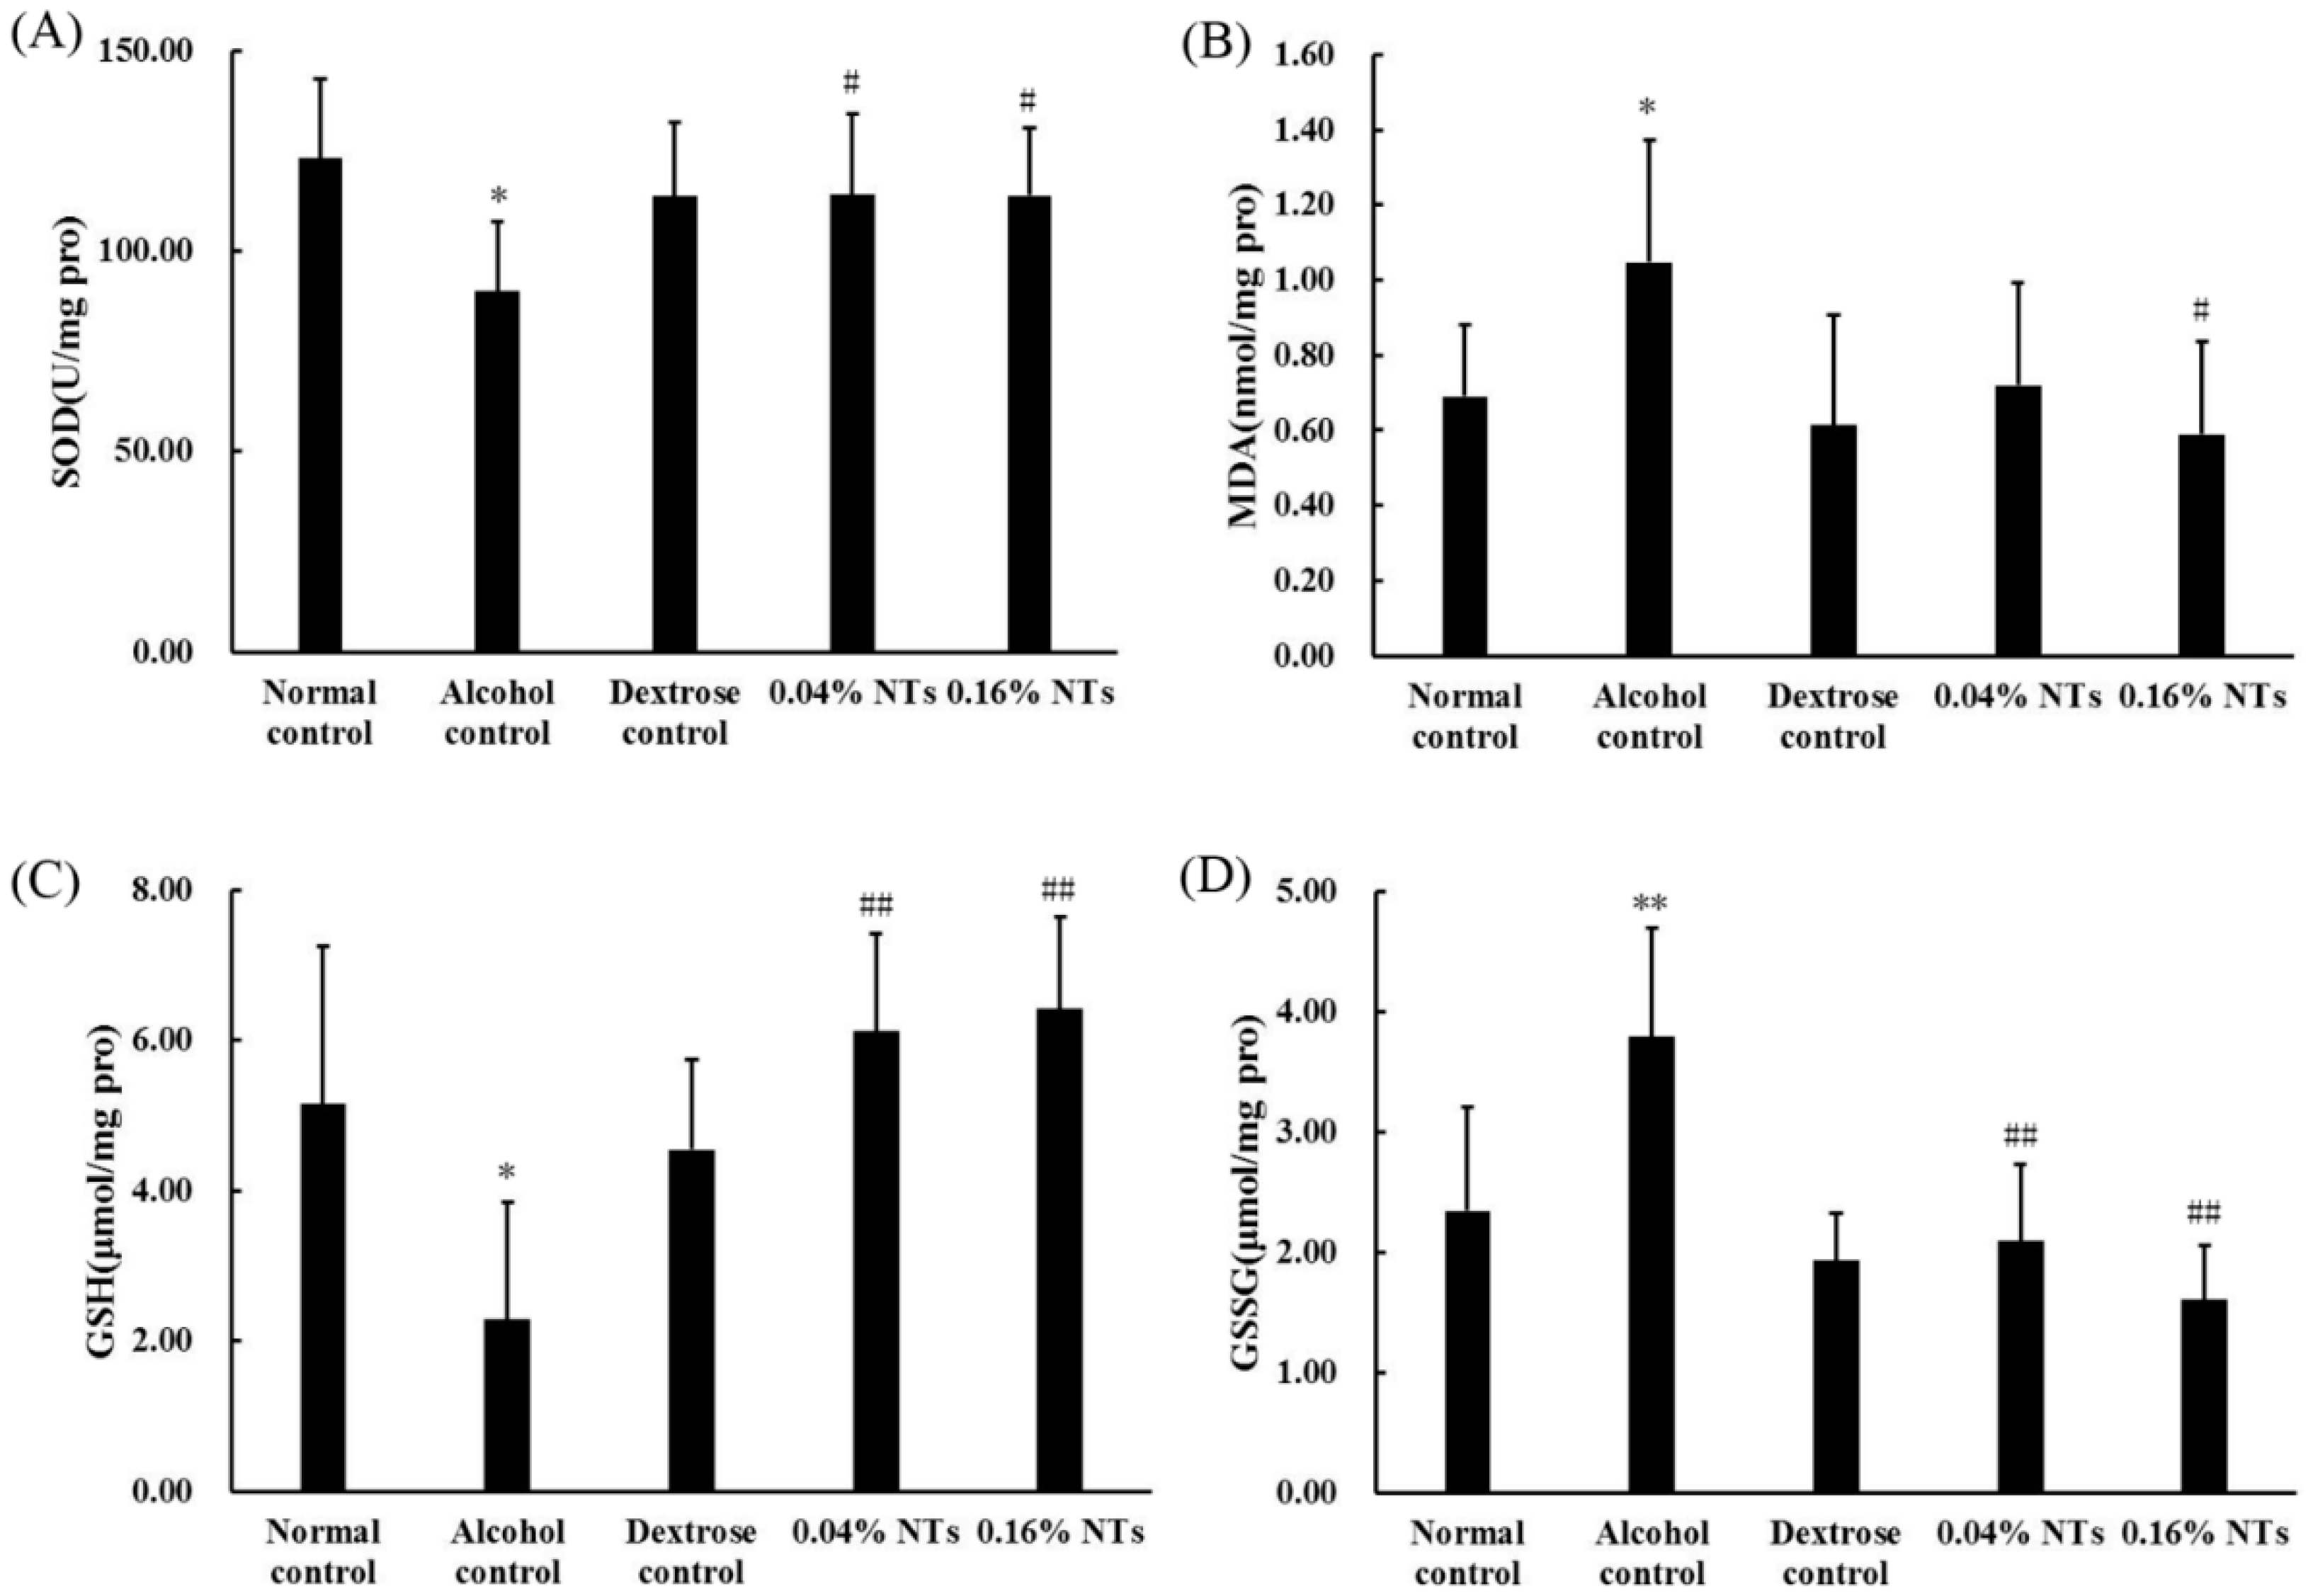
2.3. Oxidative Stress in Liver Tissue
2.4. Metabolite Detection
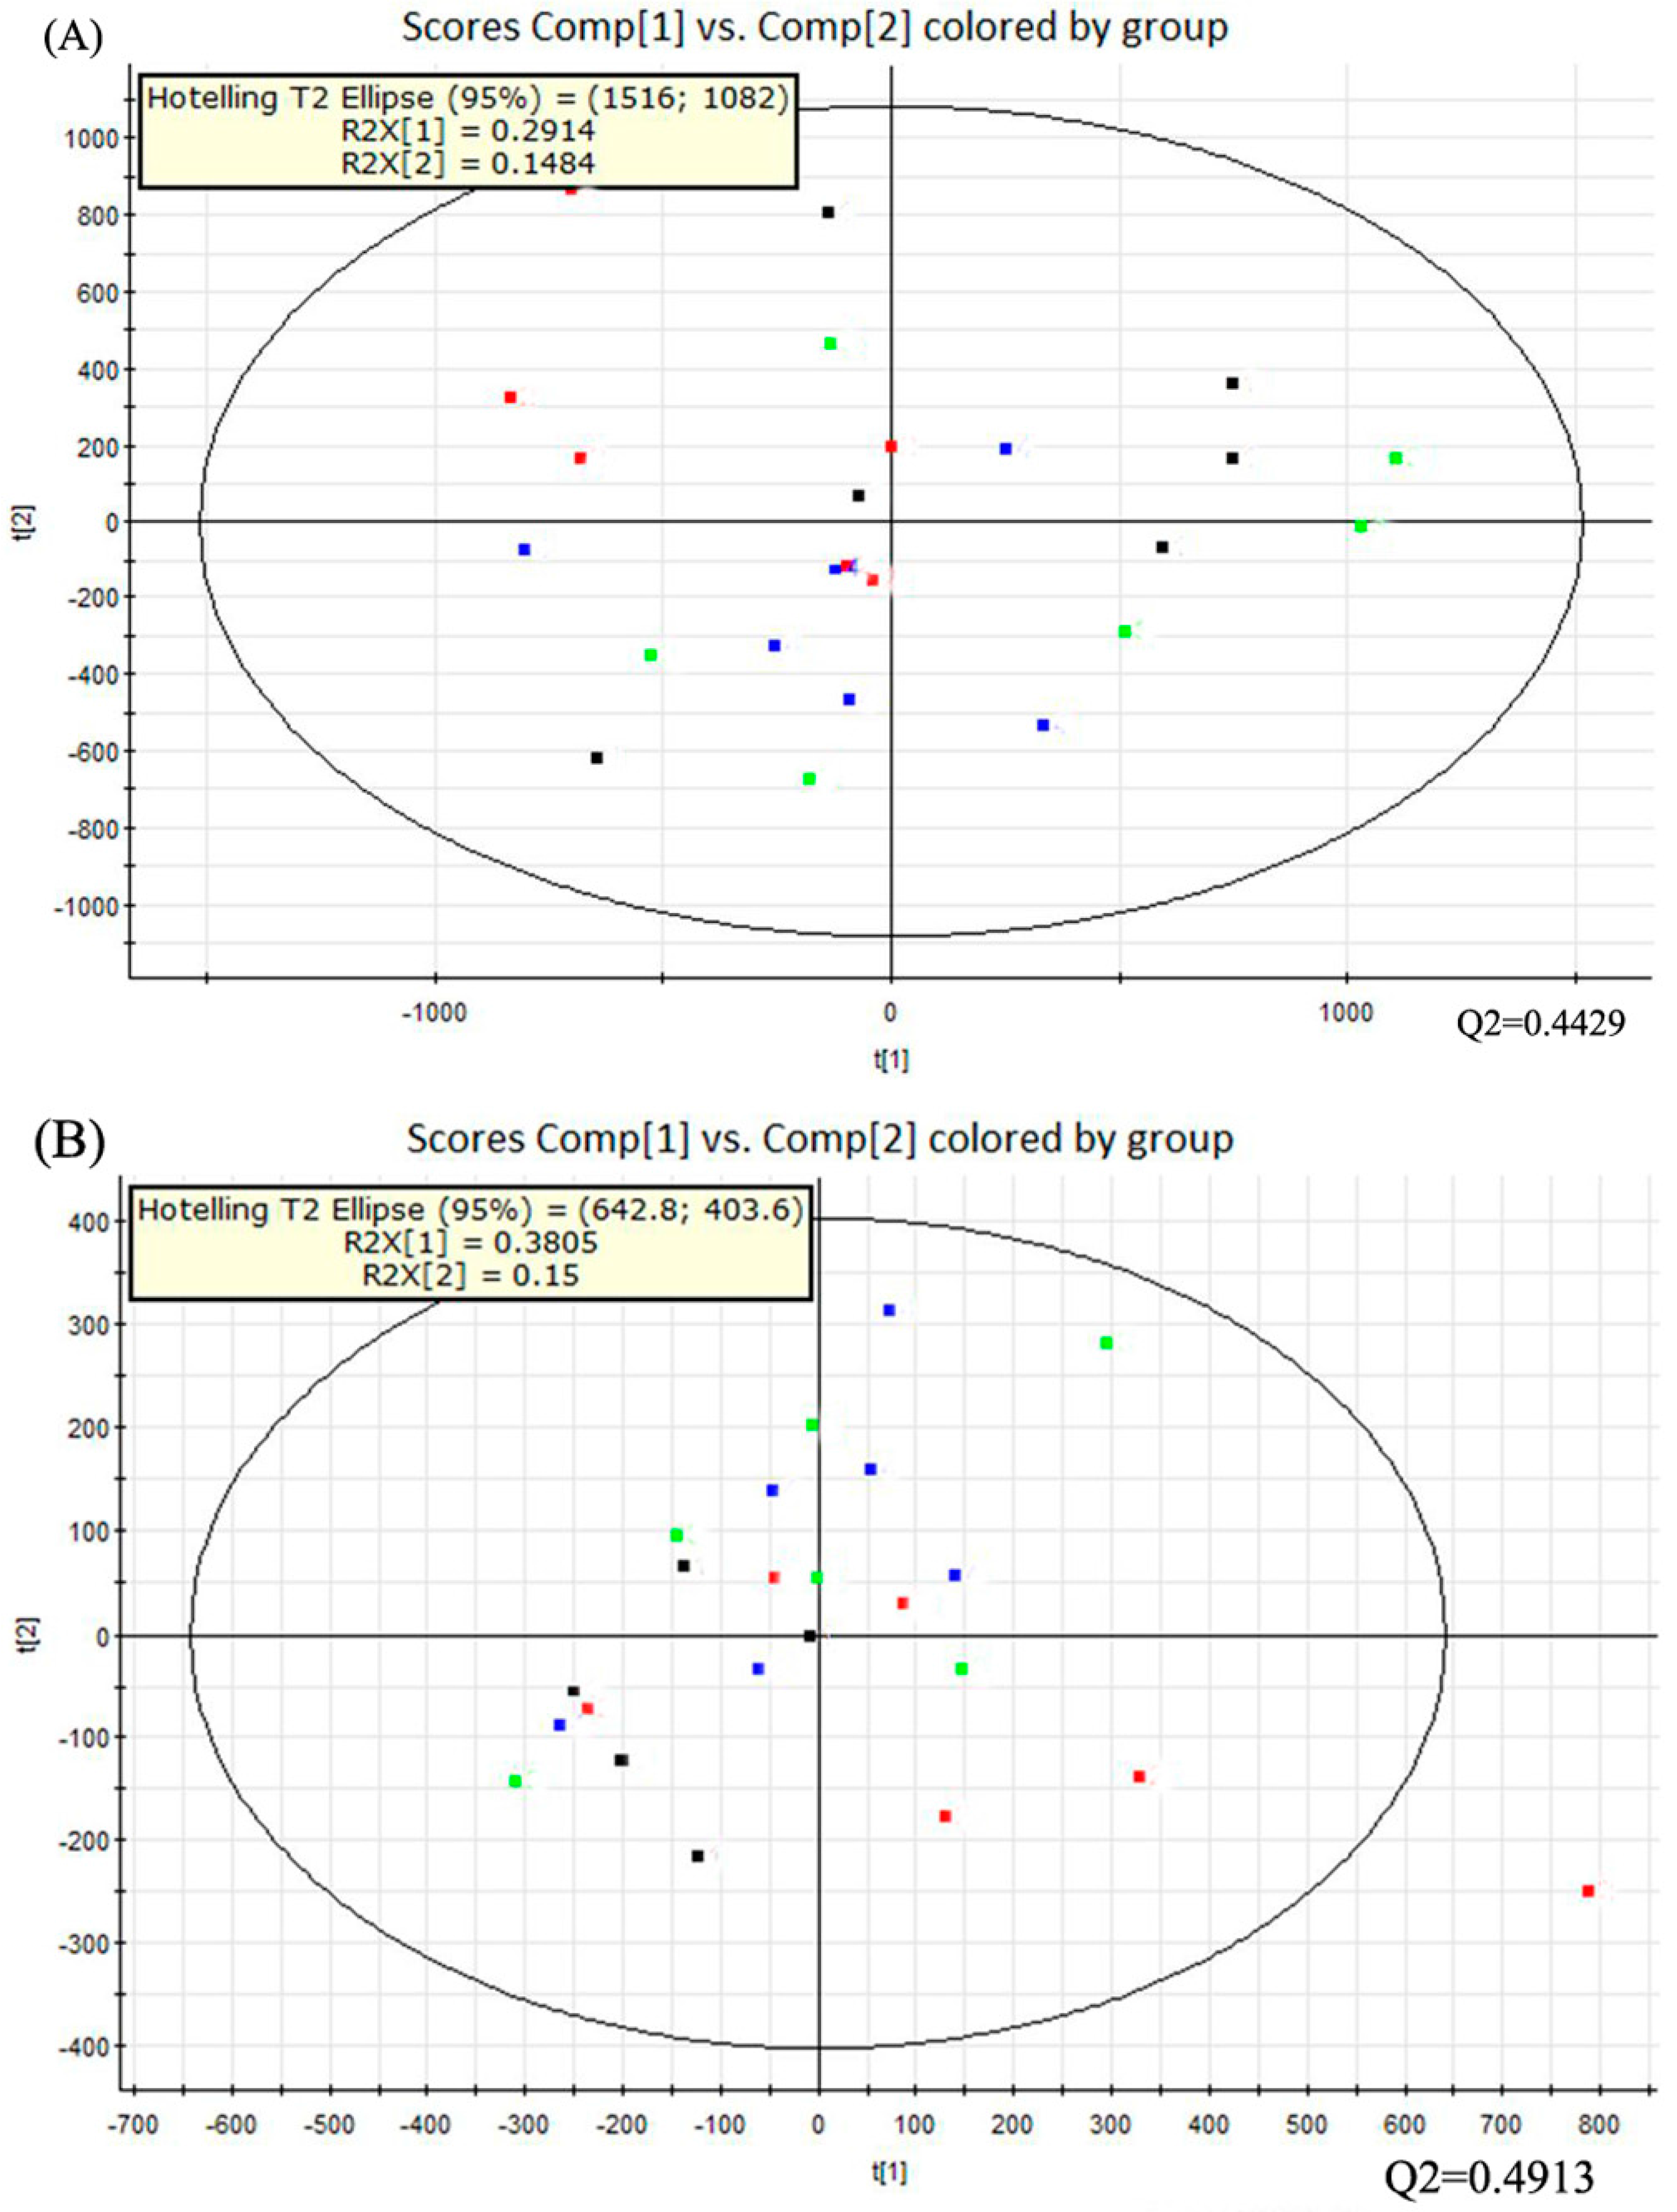
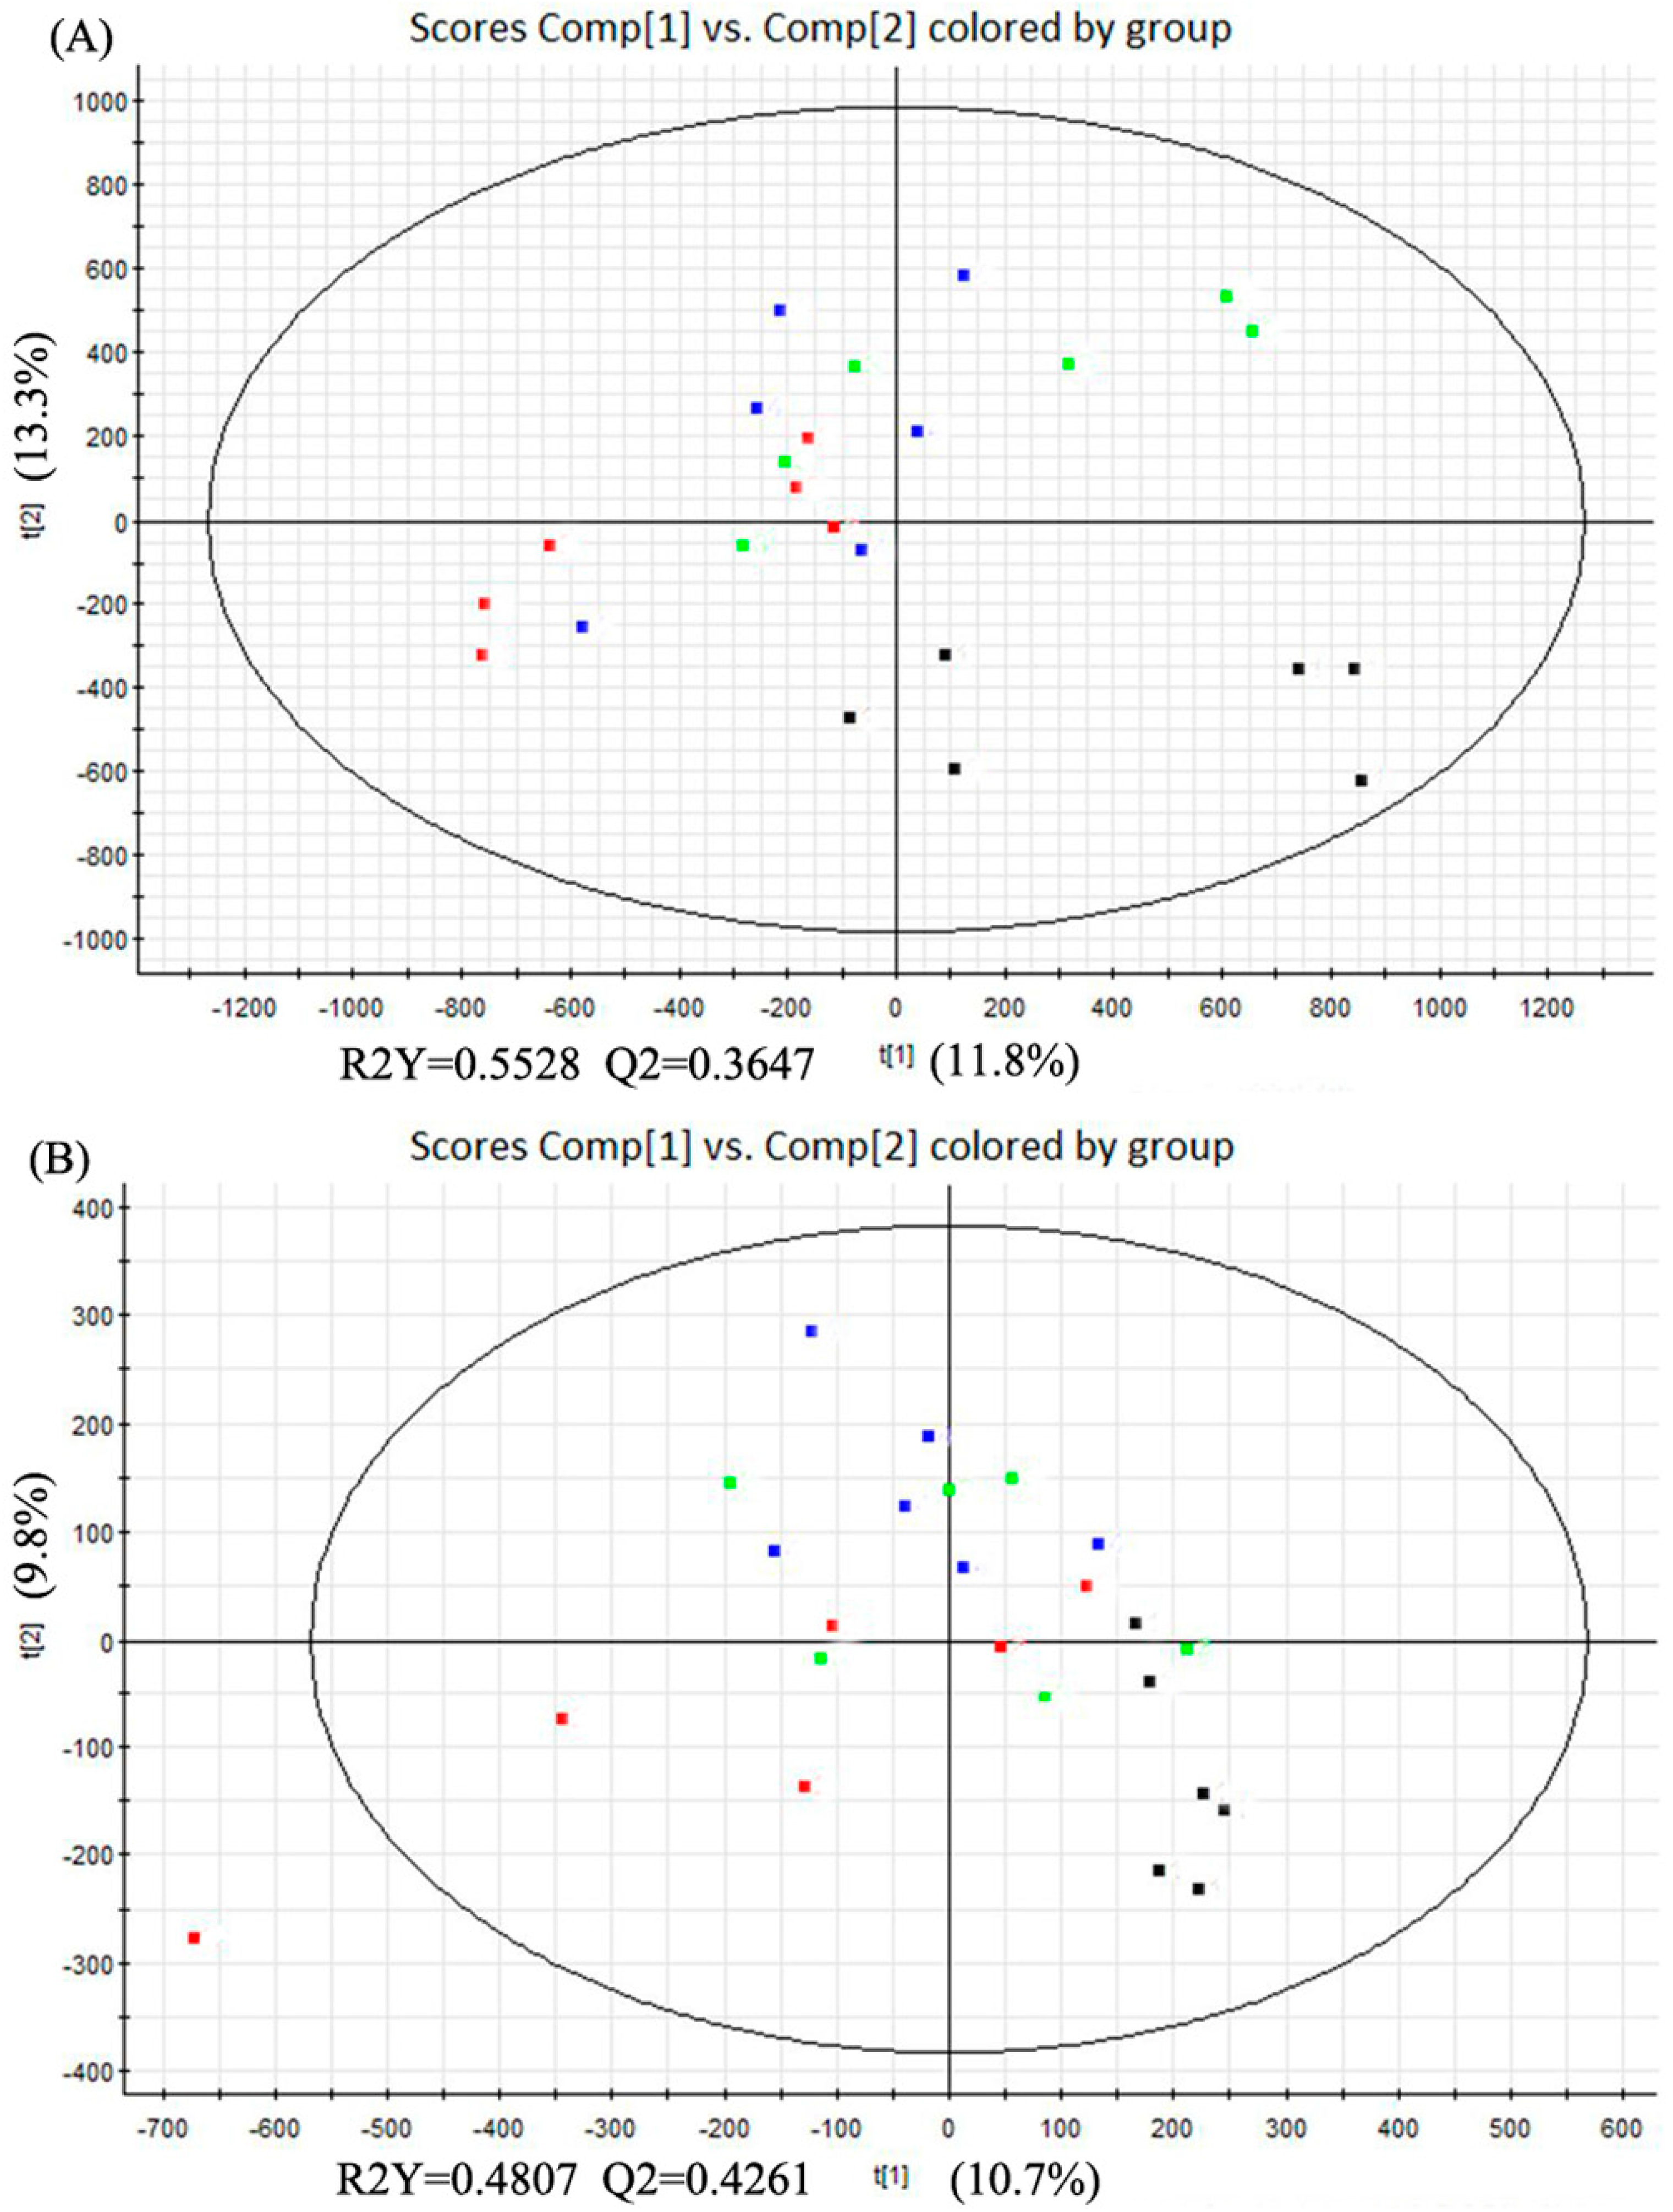
2.5. Multivariate Data Analysis
2.6. Analysis of Potential Biomarkers
3. Discussion
4. Materials and Methods
4.1. Materials and Reagents
4.2. Animals
4.3. Experimental Design
4.4. Biochemical Assay
4.5. Histopathological Observation
4.6. Sample Preparation
4.7. Ultra-Performance Liquid Chromatography
4.8. Mass Spectrometry
4.9. Data Processing
4.10. Identification of Biomarkers
4.11. Statistical Analysis
5. Conclusions
Supplementary Materials
Acknowledgments
Author Contributions
Conflicts of Interest
Abbreviations
| ALB | Albumin; |
| ALT | Alanine aminotransferase; |
| AST | Aspartate aminotransferase; |
| BCAA | Branched-chain amino acids; |
| ESI | Electrospray ionization source; |
| GC | Gas chromatography; |
| GLB | Globulin; |
| GSH | Reduced glutathione; |
| GSSG | Oxidized glutathione; |
| LCAT | Lecithin cholesterol acyltransferase; |
| LysoPE | Lysophosphatidylethanolamine; |
| MDA | Malondialdehyde; |
| MS | Magnetic resonance; |
| m/z | Mass to charge ration; |
| NTs | Nucleotides; |
| PC | Phosphatidylcholine; |
| PCA | Principal component analysis; |
| PLS-DA | Partial least squares discriminant analysis; |
| ROS | Reactive oxygen species; |
| RT | Retention time; |
| SFA | Saturated fatty acid; |
| SOD | Superoxide dismutase; |
| TBIL | Total bilirubin; |
| TC | Total cholesterol; |
| TG | Triglyceride; |
| TP | Total proteins; |
| UPLC | Ultra-performance liquid chromatography; |
| UPLC-Q-TOF-MS | Ultra-performance liquid chromatography quadrupole-time-flight mass spectrometry; |
| VIP | Variable importance in partial least squares project. |
References
- World Health Organization. Global Status Report on Alcohol and Health 2014. Available online: http://apps.who.int/iris/bitstream/10665/112736/1/9789240692763_eng.pdf?ua=1 (accessed on 1 February 2016).
- Jaurigue, M.M.; Cappell, M.S. Therapy for alcoholic liver disease. World J. Gastroenterol 2014, 20, 2143–2158. [Google Scholar] [PubMed]
- Liu, C.T.; Raghu, R.; Lin, S.H.; Wang, S.Y.; Kuo, C.H.; Tseng, Y.J.; Sheen, L.Y. Metabolomics of ginger essential oil against alcoholic fatty liver in mice. J. Agric. Food Chem. 2013, 61, 11231–11240. [Google Scholar] [PubMed]
- Bradford, B.U.; O’Connell, T.M.; Han, J.; Kosyk, O.; Shymonyak, S.; Ross, P.K.; Winnike, J.; Kono, H.; Rusyn, I. Metabolomic profiling of a modified alcohol liquid diet model for liver injury in the mouse uncovers new markers of disease. Toxicol. Appl. Pharmacol. 2008, 232, 236–243. [Google Scholar] [CrossRef] [PubMed]
- Sánchez-Pozo, A.; Gil, A. Nucleotides as semiessential nutritional components. Br. J. Nutr. 2002, 87, S135–S137. [Google Scholar] [CrossRef] [PubMed]
- Iwasa, Y.; Iwasa, M.; Ohmori, Y.; Fukutomi, T.; Ogoshi, S. The effect of the administration of nucleosides and nucleotides for parenteral use. Nutrition 2000, 16, 598–602. [Google Scholar] [CrossRef]
- Torres, M.I.; Fernández, M.I.; Gil, A.; Ríos, A. Dietary nucleotides have cytoprotective properties in rat liver damaged by thioacetamide. Life Sci. 1998, 62, 13–22. [Google Scholar] [CrossRef]
- Gil, A. Modulation of the immune response mediated by dietary nucleotides. Eur. J. Clin. Nutr. 2002, 56, S1–S4. [Google Scholar] [CrossRef] [PubMed]
- Iijima, S.; Tsujinaka, T.; Kishibuchi, M.; Kido, Y.; Ebisui, C.; Kan, K.; Yano, M.; Mori, T. A total parenteral nutrition solution supplemented with a nucleoside and nucleotide mixture sustains intestinal integrity, but does not stimulate intestinal function after massive bowel resection in rats. J. Nutr. 1996, 126, 589–595. [Google Scholar] [PubMed]
- Evans, M.E.; Tian, J.; Gu, L.H.; Jones, D.P.; Ziegler, T.R. Dietary Supplementation With Orotate and Uracil Increases Adaptive Growth of Jejunal Mucosa After Massive Small Bowel Resection in Rats. J. Parenter. Enter. Nutr. 2005, 29, 315–321. [Google Scholar] [CrossRef]
- Dunn, W.B.; Broadhurst, D.; Begley, P.; Zelena, E.; Francis-McIntyre, S.; Anderson, N.; Brown, M.; Knowles, J.D.; Halsall, A.; Haselden, J.N.; et al. Human Serum Metabolome (HUSERMET) Consortium. Procedures for large-scale metabolic profiling of serum and plasma using gas chromatography and liquid chromatography coupled to mass spectrometry. Nat. Protoc. 2011, 6, 1060–1083. [Google Scholar] [CrossRef] [PubMed]
- Want, E.J.; Masson, P.; Michopoulos, F.; Wilson, I.D.; Theodoridis, G.; Plumb, R.S.; Shockcor, J.; Loftus, N.; Holmes, E.; Nicholson, J.K. Global metabolic profiling of animal and human tissues via UPLC-MS. Nat. Protoc. 2013, 8, 17–32. [Google Scholar] [CrossRef] [PubMed]
- Fontana, L.; Moreira, E.; Torres, M.I.; Fernández, I.; Ríos, A.; Sánchez de Medina, F.; Gil, A. Dietary nucleotides correct plasma and liver microsomal fatty acid alterations in rats with liver cirrhosis induced by oral intake of thioacetamide. J. Hepatol. 1998, 28, 662–669. [Google Scholar] [CrossRef]
- Fontana, L.; Moreira, E.; Torres, M.I.; Periago, J.L.; Sánchez de Medina, F.; Gil, A. Effects of dietary polyunsaturated fatty acids and nucleotides on tissue fatty acid profiles of rats with carbon tetrachloride-induced liver damage. Clin. Nutr. 1999, 18, 93–101. [Google Scholar] [CrossRef]
- Zhou, B.; Xiao, J.F.; Tuli, L.; Ressom, H.W. LC-MS-based metabolomics. Mol. Biosyst. 2012, 8, 470–481. [Google Scholar] [CrossRef] [PubMed]
- Guillarme, D.; Ruta, J.; Rudaz, S.; Veuthey, J.L. New trends in fast and high-resolution liquid chromatography: A critical comparison of existing approaches. Anal. Bioanal. Chem. 2010, 397, 1069–1082. [Google Scholar] [CrossRef] [PubMed]
- Mutlu, E.; Keshavarzian, A.; Engen, P.; Forsyth, C.B.; Sikaroodi, M.; Gillevet, P. Intestinal dysbiosis: A possible mechanism of alcohol-induced endotoxemia and alcoholic steatohepatitis in rats. Alcohol. Clin. Exp. Res. 2009, 33, 1836–1846. [Google Scholar] [CrossRef] [PubMed]
- Pérez, M.J.; Sánchez-Medina, F.; Torres, M.; Gil, A.; Suárez, A. Dietary nucleotides enhance the liver redox state and protein synthesis in cirrhotic rats. J. Nutr. 2004, 134, 2504–2508. [Google Scholar] [PubMed]
- Arnaud, A.; Fontana, L.; Angulo, A.J.; Gil, A.; López-Pedrosa, J.M. Exogenous nucleosides alter the intracellular nucleotide pool in hepatic cell cultures. Implications in cell proliferation and function. Clin. Nutr. 2003, 22, 391–399. [Google Scholar] [CrossRef]
- Kirpich, I.A.; Solovieva, N.V.; Leikhter, S.N.; Shidakova, N.A.; Lebedeva, O.V.; Sidorov, P.I.; Bazhukova, T.A.; Soloviev, A.G.; Barve, S.S.; McClain, C.J.; et al. Probiotics restore bowel flora and improve liver enzymes in human alcohol-induced liver injury: A pilot study. Alcohol 2008, 42, 675–682. [Google Scholar] [CrossRef] [PubMed]
- Cederbaum, A.I.; Lu, Y.; Wu, D. Role of oxidative stress in alcohol-induced liver injury. Arch. Toxicol. 2009, 83, 519–548. [Google Scholar] [CrossRef] [PubMed]
- Lin, B.; Zhang, F.; Yu, Y.; Jiang, Q.; Zhang, Z.; Wang, J.; Li, Y. Marine collagen peptides protect against early alcoholic liver injury in rats. Br. J. Nutr. 2012, 107, 1160–1166. [Google Scholar] [CrossRef] [PubMed]
- Jurczuk, M.; Brzóska, M.M.; Moniuszko-Jakoniuk, J.; Gałazyn-Sidorczuk, M.; Kulikowska-Karpińska, E. Antioxidant enzymes activity and lipid peroxidation in liver and kidney of rats exposed to cadmium and ethanol. Food Chem. Toxicol. 2004, 42, 429–438. [Google Scholar] [CrossRef] [PubMed]
- Cheng, D.; Kong, H. The effect of Lycium barbarum polysaccharide on alcohol-induced oxidative stress in rats. Molecules 2011, 16, 2542–2550. [Google Scholar] [CrossRef] [PubMed]
- Jung, Y.S.; Kim, S.J.; Kwon do, Y.; Ahn, C.W.; Kim, Y.S.; Choi, D.W.; Kim, Y.C. Alleviation of alcoholic liver injury by betaine involves an enhancement of antioxidant defense via regulation of sulfur amino acid metabolism. Food Chem. Toxicol. 2013, 62, 292–298. [Google Scholar] [CrossRef] [PubMed]
- Xu, M.; Liang, R.; Guo, Q.; Wang, S.; Zhao, M.; Zhang, Z.; Wang, J.; Li, Y. Dietary nucleotides extend the life span in Sprague-Dawley rats. J. Nutr. Health Aging 2013, 17, 223–229. [Google Scholar] [CrossRef] [PubMed]
- Manley, S.; Ding, W. Role of farnesoid X receptor and bile acids in alcoholic liver disease. Acta Pharm. Sin. B 2015, 5, 158–167. [Google Scholar] [CrossRef] [PubMed]
- Tatekawa, Y.; Nakada, A.; Nakamura, T. Intrahepatic biliary ablation with pure ethanol: An experimental model of biliary atresia. Surg. Today 2013, 43, 661–669. [Google Scholar] [CrossRef] [PubMed]
- Aranha, M.M.; Cortez-Pinto, H.; Costa, A.; da Silva, I.B.; Camilo, M.E.; de Moura, M.C.; Rodrigues, C.M. Bile acid levels are increased in the liver of patients with steatohepatitis. Eur. J. Gastroenterol. Hepatol. 2008, 20, 519–525. [Google Scholar] [CrossRef] [PubMed]
- Nilsson, L.M.; Sjövall, J.; Strom, S.; Bodin, K.; Nowak, G.; Einarsson, C.; Ellis, E. Ethanol stimulates bile acid formation in primary human hepatocytes. Biochem. Biophys. Res. Commun. 2007, 364, 743–747. [Google Scholar] [CrossRef] [PubMed]
- You, M.; Crabb, D.W. Recent advances in alcoholic liver disease II. Minireview: Molecular mechanisms of alcoholic fatty liver. Am. J. Physiol. Gastrointest. Liver Physiol. 2004, 287, G1–G6. [Google Scholar] [CrossRef] [PubMed]
- Li, H.H.; Tyburski, J.B.; Wang, Y.W.; Strawn, S.; Moon, B.H.; Kallakury, B.V.; Gonzalez, F.J.; Fornace, A.J., Jr. Modulation of fatty acid and bile acid metabolism by peroxisome proliferator-activated receptor α protects against alcoholic liver disease. Alcohol. Clin. Exp. Res. 2014, 38, 1520–1531. [Google Scholar] [CrossRef] [PubMed]
- Wang, D.; Wei, Y.; Pagliassotti, M.J. Saturated fatty acids promote endoplasmic reticulum stress and liver injury in rats with hepatic steatosis. Endocrinology 2006, 147, 943–951. [Google Scholar] [CrossRef] [PubMed]
- Hernández, I.; Domínguez-Pérez, M.; Bucio, L.; Souza, V.; Miranda, R.U.; Clemens, D.L.; Gomez-Quiroz, L.E.; Gutiérrez-Ruiz, M.C. Free fatty acids enhance the oxidative damage induced by ethanol metabolism in an in vitro model. Food Chem. Toxicol. 2015, 76, 109–115. [Google Scholar] [CrossRef] [PubMed]
- Li, S.; Liu, H.; Jin, Y.; Lin, S.; Cai, Z.; Jiang, Y. Metabolomics study of alcohol-induced liver injury and hepatocellular carcinoma xenografts in mice. J. Chromatogr. B Anal. Technol. Biomed. Life Sci. 2011, 879, 2369–2375. [Google Scholar] [CrossRef] [PubMed]
- Zhao, Z.; Yu, M.; Crabb, D.; Xu, Y.; Liangpunsakul, S. Ethanol-induced alterations in fatty acid-related lipids in serum and tissues in mice. Alcohol. Clin. Exp. Res. 2011, 35, 229–234. [Google Scholar] [CrossRef] [PubMed]
- Fernando, H.; Kondraganti, S.; Bhopale, K.K.; Volk, D.E.; Neerathilingam, M.; Kaphalia, B.S.; Luxon, B.A.; Boor, P.J.; Shakeel Ansari, G.A. 1H and 31P NMR lipidome of ethanol-induced fatty liver. Alcohol. Clin. Exp. Res. 2010, 34, 1937–1947. [Google Scholar] [CrossRef] [PubMed]
- Chirkin, A.A.; Konevalova, N.Y.; Grebennikov, I.N.; Kulikov, V.A.; Saraev, Y.V.; Buko, V.U.; Chirkina, I.A.; Danchenko, E.O.; Gundermann, K.J. Effect of polyunsaturated phosphatidyl-choline on lipid transport system in alcoholic liver injury. Addict. Biol. 1998, 3, 65–70. [Google Scholar] [CrossRef] [PubMed]
- Siahanidou, T.; Mandyla, H.; Papassotiriou, I.; Anagnostakis, D. Serum lipids in preterm infants fed a formula supplemented with nucleotides. J. Pediatr. Gastroenterol. Nutr. 2004, 38, 56–60. [Google Scholar] [CrossRef] [PubMed]
- Sánchez-Pozo, A.; Ramírez, M.; Gil, A.; Maldonado, J.; van Biervliet, J.P.; Rosseneu, M. Dietary nucleotides enhance plasma lecithin cholesterol acyl transferase activity and apolipoprotein A-IV concentration in preterm newborn infants. Pediatr. Res. 1995, 37, 328–333. [Google Scholar] [CrossRef] [PubMed]
- Zhong, W.; Zhou, Z. Alterations of the gut microbiome and metabolome in alcoholic liver disease. World J. Gastrointest. Pathophysiol. 2014, 5, 514–522. [Google Scholar] [CrossRef] [PubMed]
- Stickel, F.; Hoehn, B.; Schuppan, D.; Seitz, H.K. Review article: Nutritional therapy in alcoholic liver disease. Aliment. Pharmacol. Ther. 2003, 18, 357–373. [Google Scholar] [CrossRef] [PubMed]
- Charlton, M. Branched-Chain Amino Acid Enriched Supplements as Therapy for Liver Disease. J. Nutr. 2006, 136, 295S–298S. [Google Scholar] [CrossRef]
- Iwasa, M.; Kobayashi, Y.; Mifuji-Moroka, R.; Hara, N.; Miyachi, H.; Sugimoto, R.; Tanaka, H.; Fujita, N.; Gabazza, E.C.; Takei, Y. Branched-chain amino acid supplementation reduces oxidative stress and prolongs survival in rats with advanced liver cirrhosis. PLoS ONE 2013, 8, e70309. [Google Scholar]
- Mukherjee, S.; Vaidyanathan, K.; Vasudevan, D.M.; Das, S.K. Role of plasma amino acids and gaba in alcoholic and non-alcoholic fatty liver disease-a pilot study. Indian J. Clin. Biochem. 2010, 25, 37–42. [Google Scholar] [CrossRef] [PubMed]
- Amathieu, R.; Triba, M.N.; Nahon, P.; Bouchemal, N.; Kamoun, W.; Haouache, H.; Trinchet, J.C.; Savarin, P.; le Moyec, L.; Dhonneur, G. Serum 1H-NMR metabolomic fingerprints of acute-on-chronic liver failure in intensive care unit patients with alcoholic cirrhosis. PLoS ONE 2014, 9, e89230. [Google Scholar] [CrossRef] [PubMed]
- Vannucchi, H.; Marchini, J.S.; Padovan, G.J.; dos-Santos, J.E.; Dutra-de-Oliveira, J.E. Amino acid patterns in the plasma and ascitic fluid of cirrhotic patients. Braz. J. Med. Biol. Res. 1985, 18, 465–470. [Google Scholar] [PubMed]
- Bode, C.; Bode, J.C. Effect of alcohol consumption on the gut. Best Pract. Res. Clin. Gastroenterol. 2003, 17, 575–592. [Google Scholar] [CrossRef]
- Ortega, M.A.; Nunez, M.C.; Gil, A.; Sánchez-Pozo, A. Dietary nucleotides accelerate intestinal recovery after food deprivation in old rats. J. Nutr. 1995, 125, 1413–1418. [Google Scholar] [PubMed]
- María Vieites, J.; Torre Rde, L.; Ramírez Mdel, C.; Torres, M.I.; Sánchez-Pozo, A.; Gil, A.; Suárez, A. Exogenous nucleosides accelerate differentiation of rat intestinal epithelial cells. Br. J. Nutr. 2008, 99, 732–738. [Google Scholar] [CrossRef] [PubMed]
- Andrés-Iglesias, C.; Blanco, C.A.; Blanco, J.; Montero, O. Mass spectrometry-based metabolomics approach to determine differential metabolites between regular and non-alcohol beers. Food Chem. 2014, 157, 205–212. [Google Scholar] [CrossRef] [PubMed]
- Scripps Center for Metabolomics. Available online: https://metlin.scripps.edu/index.php (accessed on 1 February 2016).
- KEGG: Kyoto Encyclopedia of Genes and Genomes. Available online: http://www.kegg.jp/kegg/ (accessed on 1 February 2016).
- Sample Availability: Not available.


| Parameters | Normal Control | Alcohol Control | Dextrose Control | 0.04% NTs | 0.16% NTs | |||||
|---|---|---|---|---|---|---|---|---|---|---|
| Mean | SD | Mean | SD | Mean | SD | Mean | SD | Mean | SD | |
| ALT (U/L) | 32.89 | 9.98 | 47.44 * | 25.53 | 32.89 | 7.99 | 31.44 # | 9.54 | 33.00 # | 7.33 |
| AST (U/L) | 62.58 | 13.61 | 85.81 ** | 26.46 | 58.49 | 15.92 | 54.11 ## | 14.46 | 52.91 ## | 12.59 |
| TP (g/L) | 73.56 | 3.55 | 66.78 ** | 3.40 | 73.33 | 4.43 | 69.20 | 5.55 | 71.81 # | 6.19 |
| ALB (g/L) | 38.22 | 1.37 | 36.86 | 1.93 | 38.16 | 1.25 | 37.19 | 2.15 | 37.54 | 2.12 |
| GLB (g/L) | 35.44 | 2.55 | 29.92 ** | 1.63 | 35.18 | 3.54 | 32.01 | 3.84 | 34.27 ## | 4.23 |
| A:G ratio | 1.08 | 0.07 | 1.23 ** | 0.04 | 1.09 | 0.09 | 1.17 | 0.10 | 1.11 ## | 0.10 |
| TBIL (μmol/L) | 2.01 | 0.40 | 2.46 | 0.50 | 2.09 | 0.27 | 2.24 | 0.46 | 2.03 # | 0.42 |
| TC (mmol/L) | 2.07 | 0.38 | 2.80 * | 0.61 | 2.22 | 0.34 | 2.34 # | 0.26 | 2.29 # | 0.32 |
| TG (mmol/L) | 1.30 | 0.29 | 1.89 * | 0.73 | 1.32 | 0.28 | 1.66 | 0.55 | 1.31 # | 0.49 |
| Compounds | RT(min)_m/z | VIP | Peak Area Intensity | Pathway | |||
|---|---|---|---|---|---|---|---|
| Dextrose Control | Alcohol Control | 0.04% NTs | 0.16% NTs | ||||
| Glycocholic acid | 7.7237_464.3005 | 5.59 | 8463.81 ± 7415.40 | 31,624.49 ± 15,933.73 ** | 26,484.27 ± 18,211.81 | 31,964.50 ± 15,863.17 | Primary bile acid biosynthesis; Secondary bile acid biosynthesis; Bile secretion |
| Chenodeoxyglycocholic acid | 7.4877_448.3058 | 2.20 | 143.49 ± 278.14 | 5104.29 ± 833.33 ** | 1725.13 ± 1099.87 ## | 2587.23 ± 725.60 ## | Primary bile acid biosynthesis; Secondary bile acid biosynthesis; Bile secretion |
| Taurodeoxycholic acid | 7.057_462.2852 | 3.57 | 498.07 ± 915.56 | 10,764.23 ± 2193.21 ** | 5839.72 ± 1832.43 ## | 9480.95 ± 2332.42 | Primary bile acid biosynthesis; Secondary bile acid biosynthesis; Bile secretion |
| Stearic acid | 9.0998_283.2622 | 3.18 | 970.48 ± 1097.17 | 7191.91 ± 1879.98 ** | 2026.56 ± 1676.70 ## | 1543.03 ± 758.30 ## | Fatty acid biosynthesis; Biosynthesis of unsaturated fatty acids |
| Palmitic acid | 8.8195_255.2323 | 3.04 | 3510.95 ± 3186.85 | 9469.90 ± 3202.26 ** | 5350.94 ± 3418.26 # | 3445.33 ± 1681.00 ## | Fatty acid metabolism; Fatty acid elongation; Biosynthesis of unsaturated fatty acids |
| Oleic acid | 8.9027_281.248 | 2.87 | 1951.77 ± 1228.59 | 5639.40 ± 2538.87 ** | 2738.06 ± 2399.18 | 1113.86 ± 1067.94 | Fatty acid biosynthesis; Biosynthesis of unsaturated fatty acids |
| LysoPE(16:0) | 8.8334_452.2774 | 2.87 | 575.73 ± 509.70 | 5241.31 ± 925.57 ** | 1375.93 ± 1208.68 ## | 723.85 ± 558.81 ## | NUM |
| LysoPE(18:0) | 9.0983_480.3084 | 2.31 | 95.30 ± 152.35 | 3245.92 ± 340.42 ** | 356.80 ± 402.64 ## | 248.25 ± 262.90 ## | NUM |
| PC(36:4) | 10.5958_782.5688 | 3.02 | 4685.98 ± 7215.85 | 19,441.81 ± 14,285.09 * | 5760.80 ± 7153.05# | 4855.63 ± 3996.21 # | Glycerophospholipid metabolism; Linoleic acid metabolism; Arachidonic acid metabolism; alpha-Linolenic acid metabolism; Biosynthesis of secondary metabolites |
| Valyl-Leucine | 4.0200_231.1707 | 4.23 | 82,347.30 ± 15,277.29 | 56,815.96 ± 11,255.82 * | 82,653.81 ± 17,597.53 # | 55,640.86 ± 20,887.14 | NUM |
| l-Leucine | 2.4894_132.1022 | 3.98 | 77,270.19 ± 19,282.77 | 46,539.18 ± 11,543.08 * | 72,540.58 ± 23,121.88 # | 63,797.58 ± 28,472.31 | Valine, leucine and isoleucine biosynthesis and degradation; Biosynthesis of secondary metabolites; Biosynthesis of amino acids; Protein digestion and absorption; ABC transporters |
| Alanyl-Leucine | 3.4595_203.1393 | 3.12 | 30,881.02 ± 5469.33 | 20,193.62 ± 6616.19 * | 33,593.60 ± 11,567.90 # | 24,107.26 ± 10,181.59 | NUM |
| l-Phenylalanine | 3.3547_166.0865 | 3.20 | 62,390.84 ± 10,449.98 | 50,789.46 ± 5932.05 | 66,602.95 ± 17,891.97 # | 51,682.26 ± 10,729.99 | Phenylalanine metabolism; Phenylalanine, tyrosine and tryptophan biosynthesis; Biosynthesis of secondary metabolites; Biosynthesis of amino acids; ABC transporters; Protein digestion and absorption |
| l-Phenylalanine (Fragment) | 3.3594_120.081 | 3.81 | 52,558.23 ± 8271.70 | 45,012.33 ± 5773.60 | 61,986.71 ± 16,794.77 # | 51,397.55 ± 9687.96 | |
| Glutathione | 1.6432_308.0917 | 8.02 | 123,866.59 ± 72,656.44 | 53,551.25 ± 36,343.10 * | 62,413.02 ± 38,243.30 | 78,404.52 ± 52,299.03 | Cysteine and methionine metabolism; Glutathione metabolism; Metabolic pathways; ABC transporters; Bile secretion |
© 2016 by the authors. Licensee MDPI, Basel, Switzerland. This article is an open access article distributed under the terms and conditions of the Creative Commons by Attribution (CC-BY) license ( http://creativecommons.org/licenses/by/4.0/).
Share and Cite
Cai, X.; Bao, L.; Wang, N.; Xu, M.; Mao, R.; Li, Y. Dietary Nucleotides Supplementation and Liver Injury in Alcohol-Treated Rats: A Metabolomics Investigation. Molecules 2016, 21, 435. https://doi.org/10.3390/molecules21040435
Cai X, Bao L, Wang N, Xu M, Mao R, Li Y. Dietary Nucleotides Supplementation and Liver Injury in Alcohol-Treated Rats: A Metabolomics Investigation. Molecules. 2016; 21(4):435. https://doi.org/10.3390/molecules21040435
Chicago/Turabian StyleCai, Xiaxia, Lei Bao, Nan Wang, Meihong Xu, Ruixue Mao, and Yong Li. 2016. "Dietary Nucleotides Supplementation and Liver Injury in Alcohol-Treated Rats: A Metabolomics Investigation" Molecules 21, no. 4: 435. https://doi.org/10.3390/molecules21040435