
Qualitative and Quantitative Analysis of Major Triterpenoids in Alismatis Rhizoma by High Performance Liquid Chromatography/Diode-Array Detector/Quadrupole-Time-of-Flight Mass Spectrometry and Ultra-Performance Liquid Chromatography/Triple Quadrupole Mass Spectrometry

Abstract
:1. Introduction
2. Results and Discussion
2.1. Optimization of Sample Preparation
2.2. Optimization of HPLC-DAD-Q-TOF MS Conditions
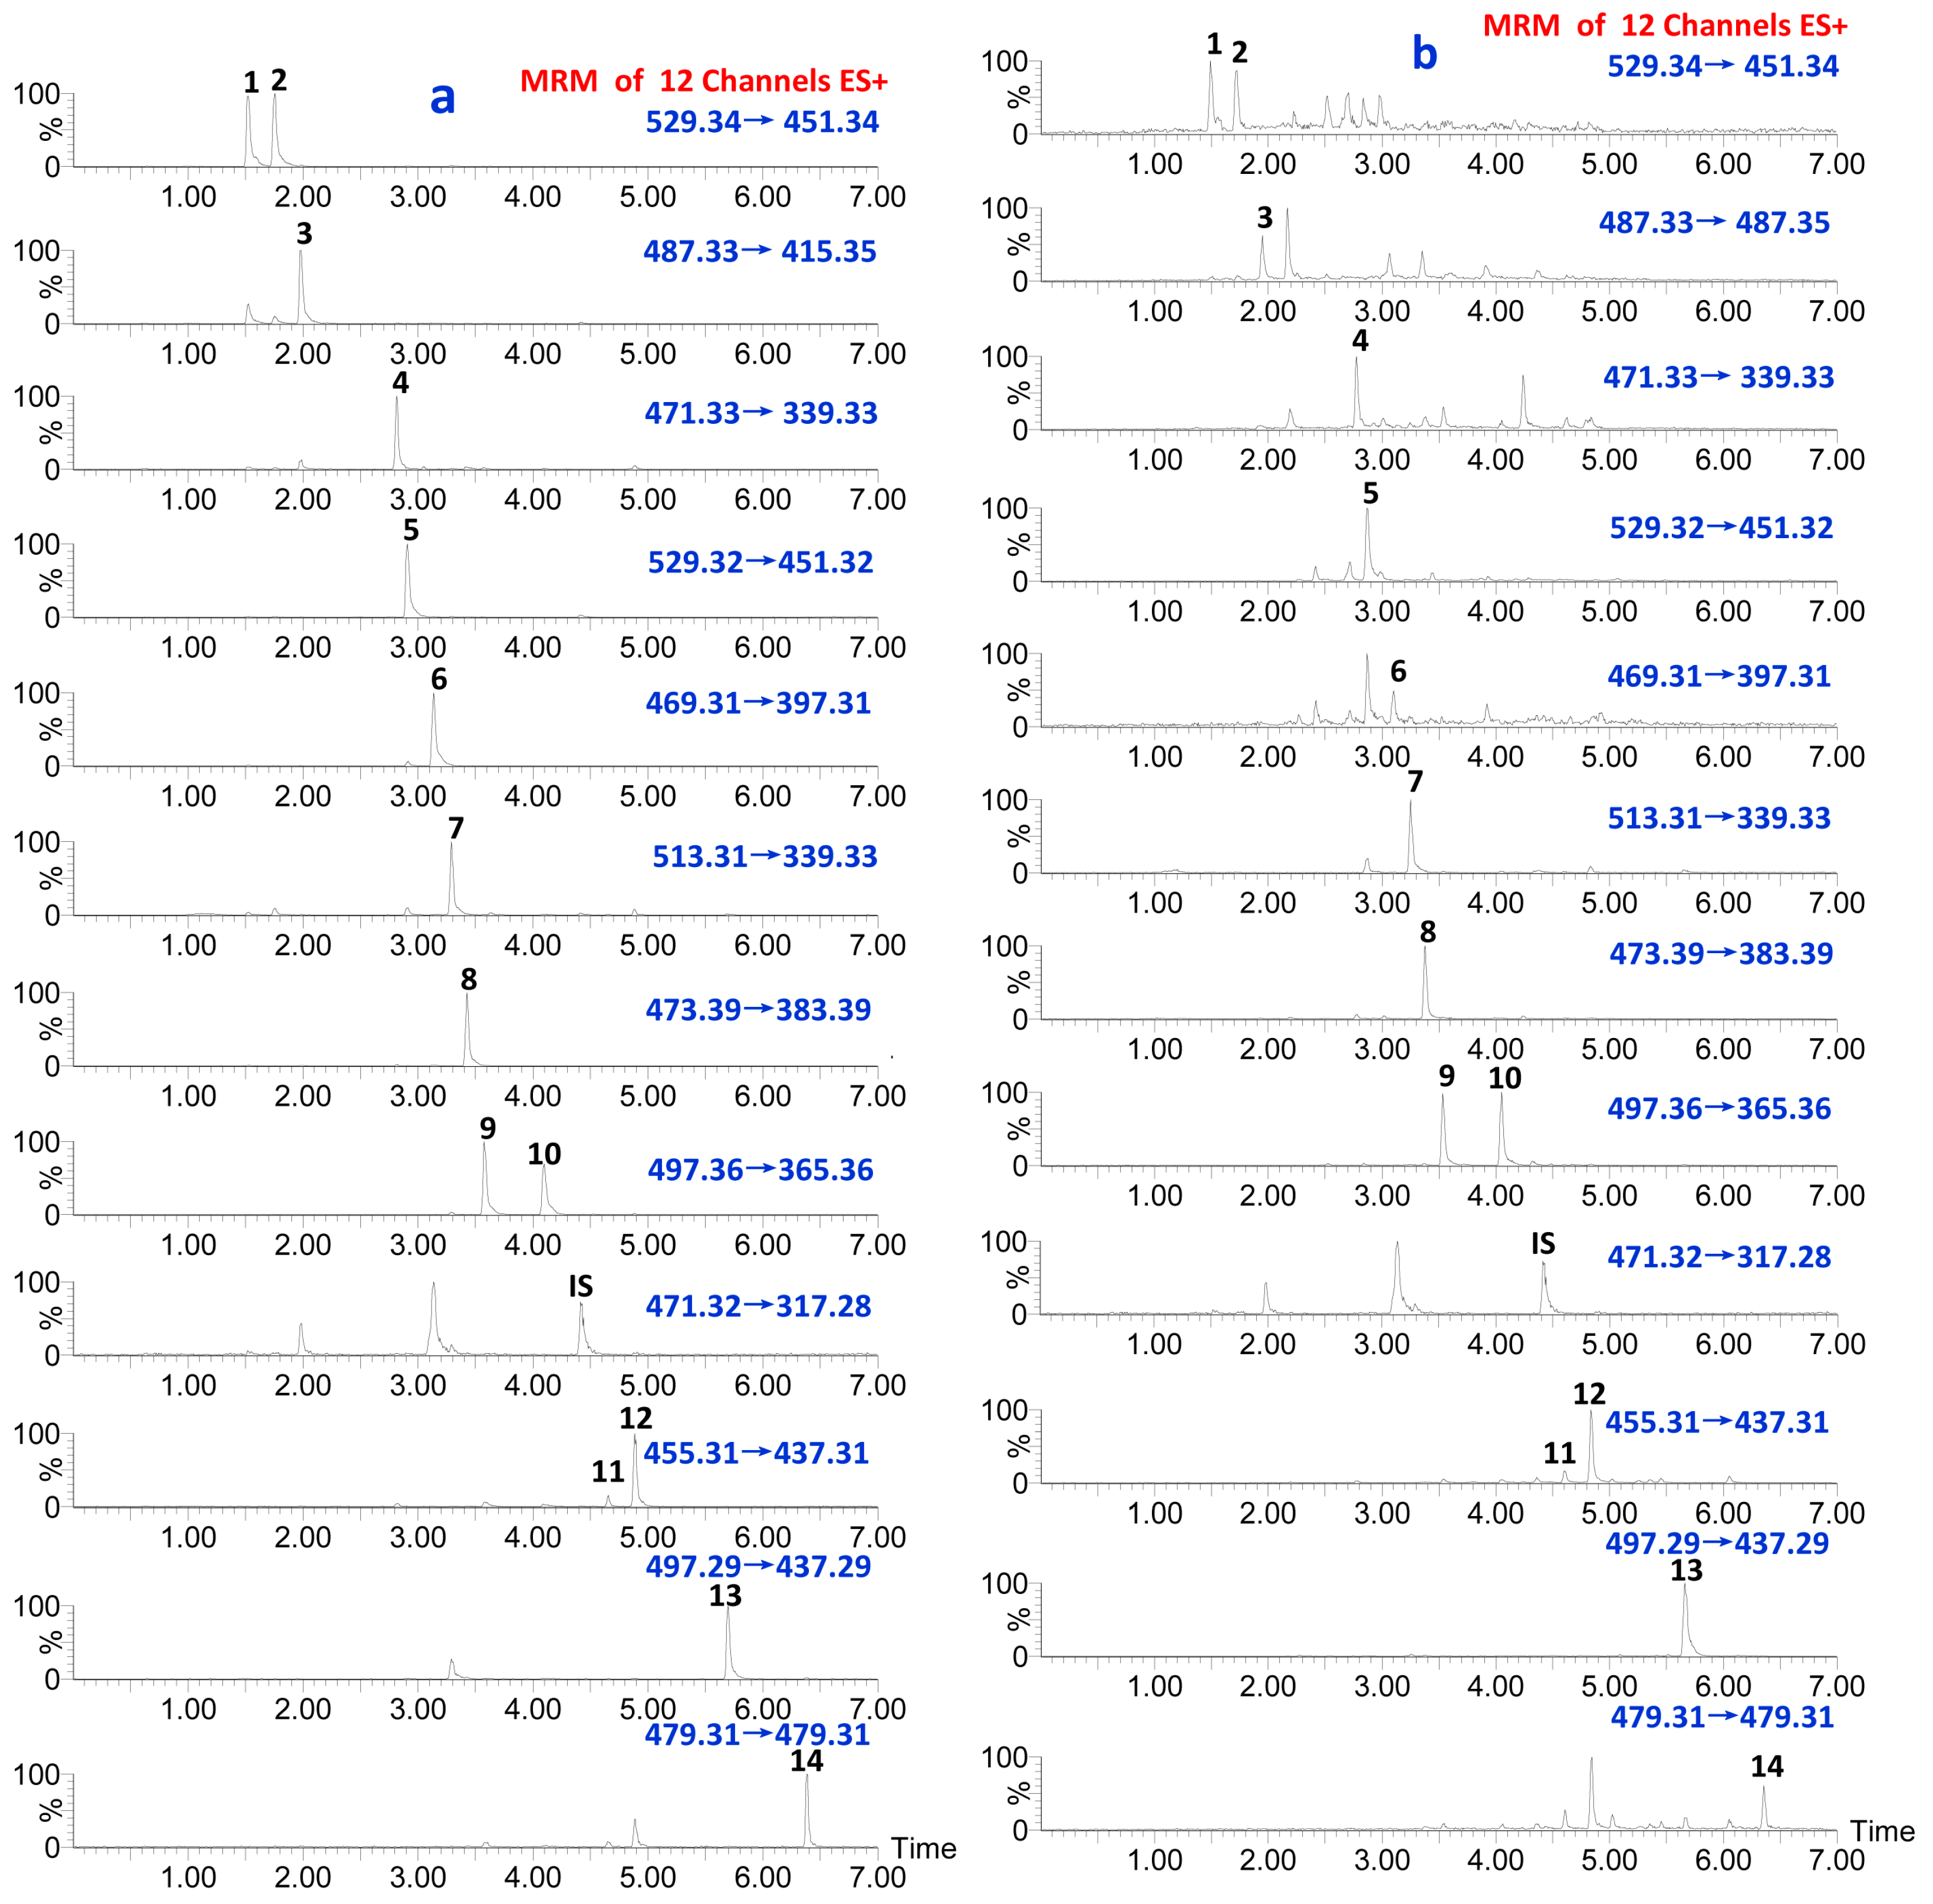
2.3. Optimization of UPLC-QqQ MS Conditions

| Peak Number | Analytes | Quantification Transition (m/z) | Cone Voltage (V) | Collision Energy (ce) |
|---|---|---|---|---|
| 1 | 16-oxo-Alisol A-23acetate | 529.34→451.34 | 30 | 18 |
| 2 | 16-oxo-Alisol A-24acetate | 529.34→451.34 | 30 | 18 |
| 3 | Alisol C | 487.33→415.35 | 40 | 18 |
| 4 | Alisol F | 471.33→339.33 | 35 | 12 |
| 5 | Alisol C-23acetate | 529.32→451.32 | 40 | 21 |
| 6 | Alisol L | 469.31→397.31 | 35 | 22 |
| 7 | Alisol F 24-acetate | 513.31→339.33 | 35 | 12 |
| 8 | Alisol A | 473.39→383.39 | 40 | 11 |
| 9 | Alisol A 23-acetate | 497.36→365.36 | 40 | 16 |
| 10 | Alisol A 24-acetate | 497.36→365.36 | 40 | 15 |
| IS | Glycyrrhetinic acid (IS) | 471.32→317.28 | 40 | 28 |
| 11 | Alisol G | 455.31→437.31 | 35 | 10 |
| 12 | Alisol B | 455.31→437.31 | 40 | 11 |
| 13 | Alisol B 23-acetate | 497.29→437.29 | 40 | 11 |
| 14 | 11-deoxy-Alisol B | 479.31→479.31 | 45 | 10 |
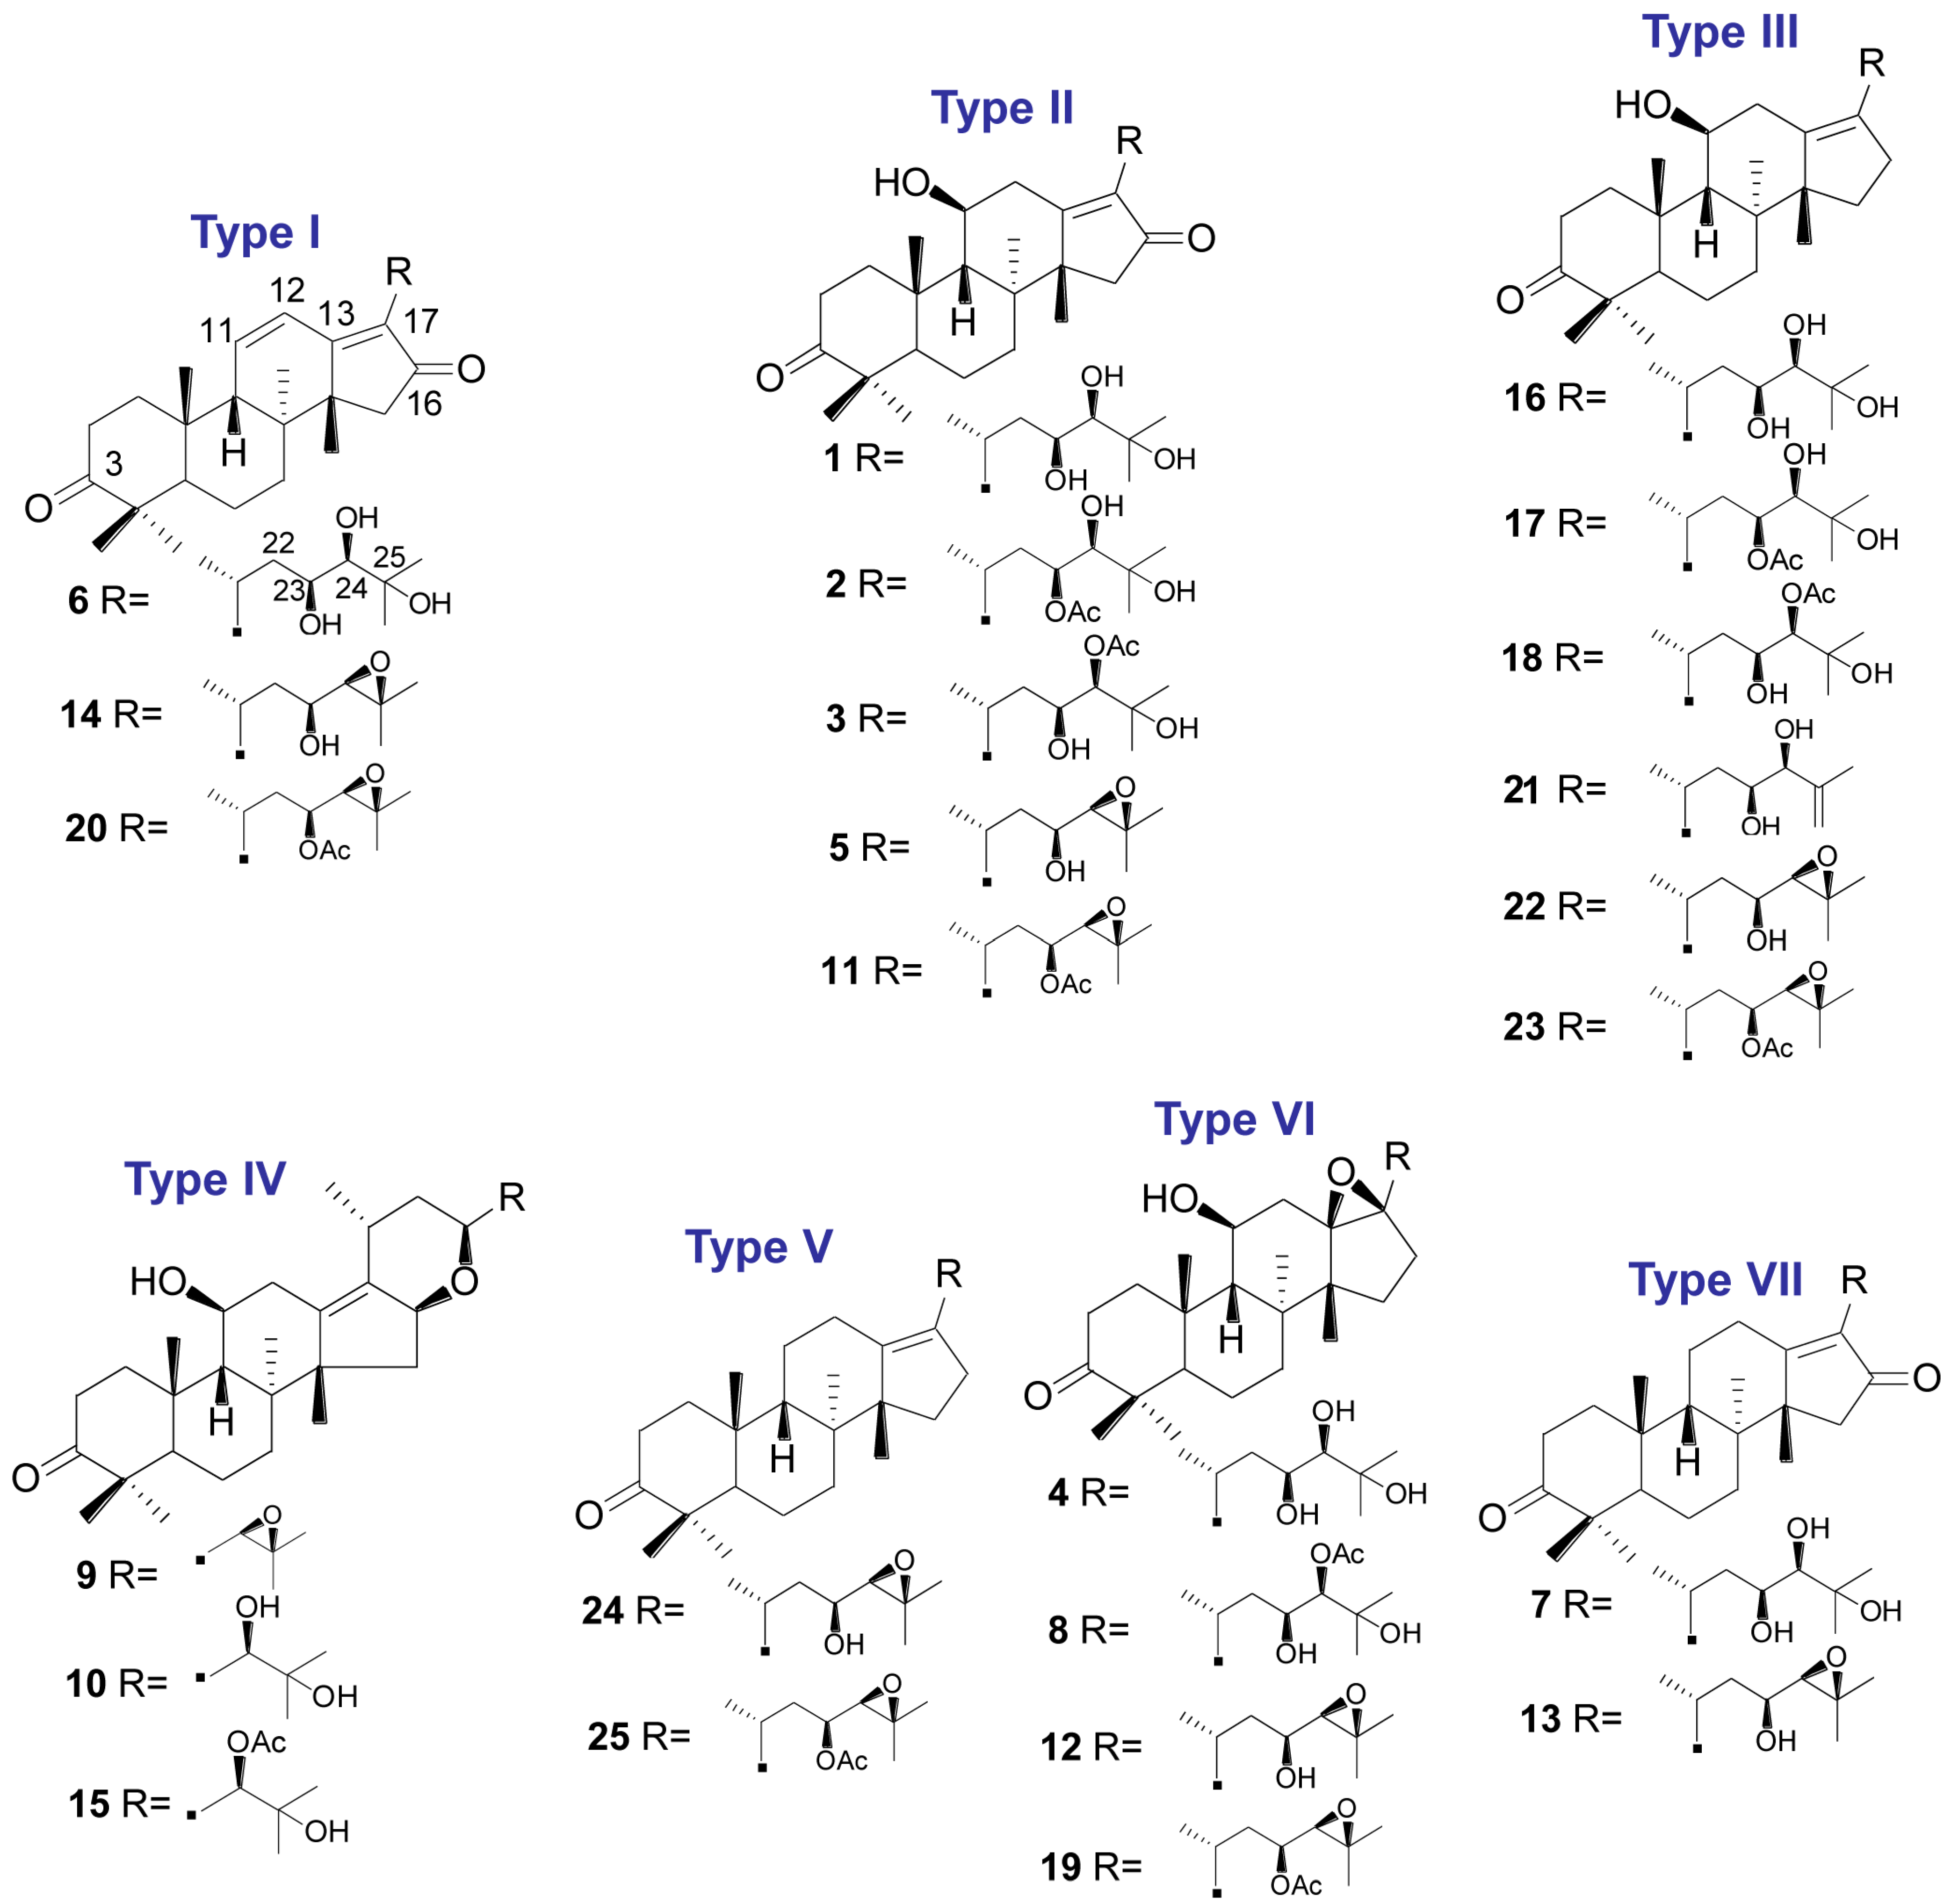
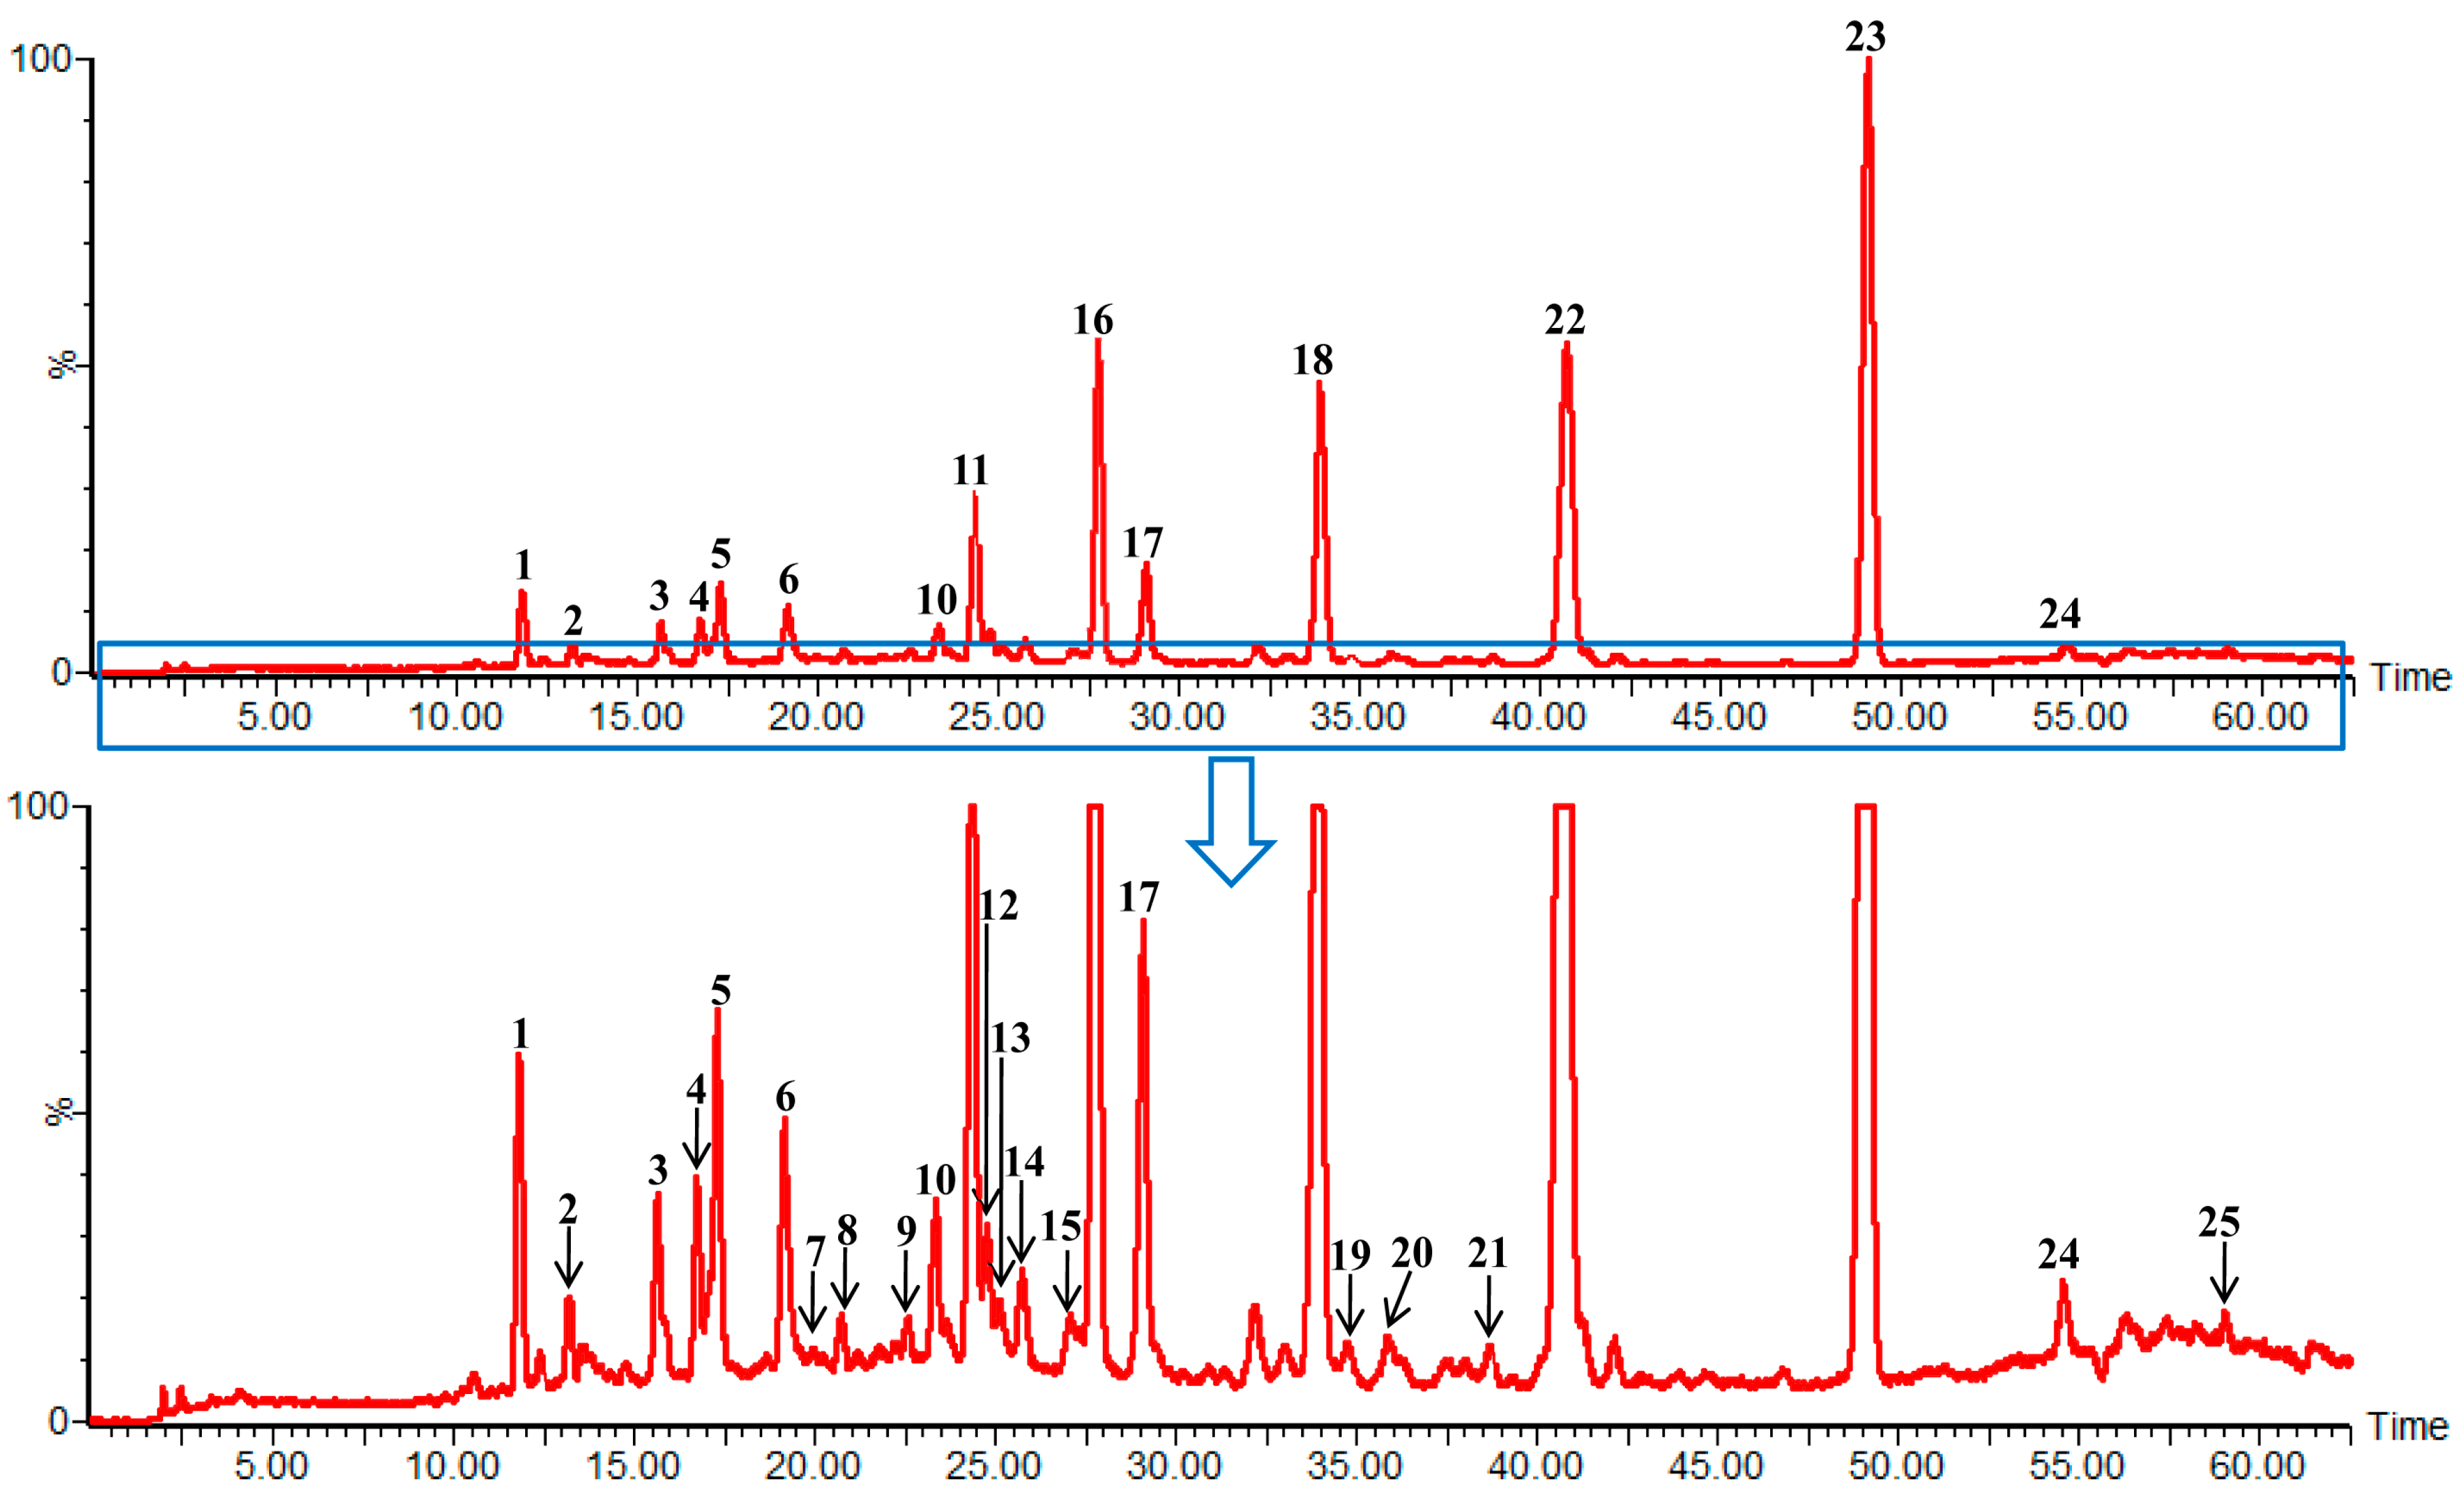
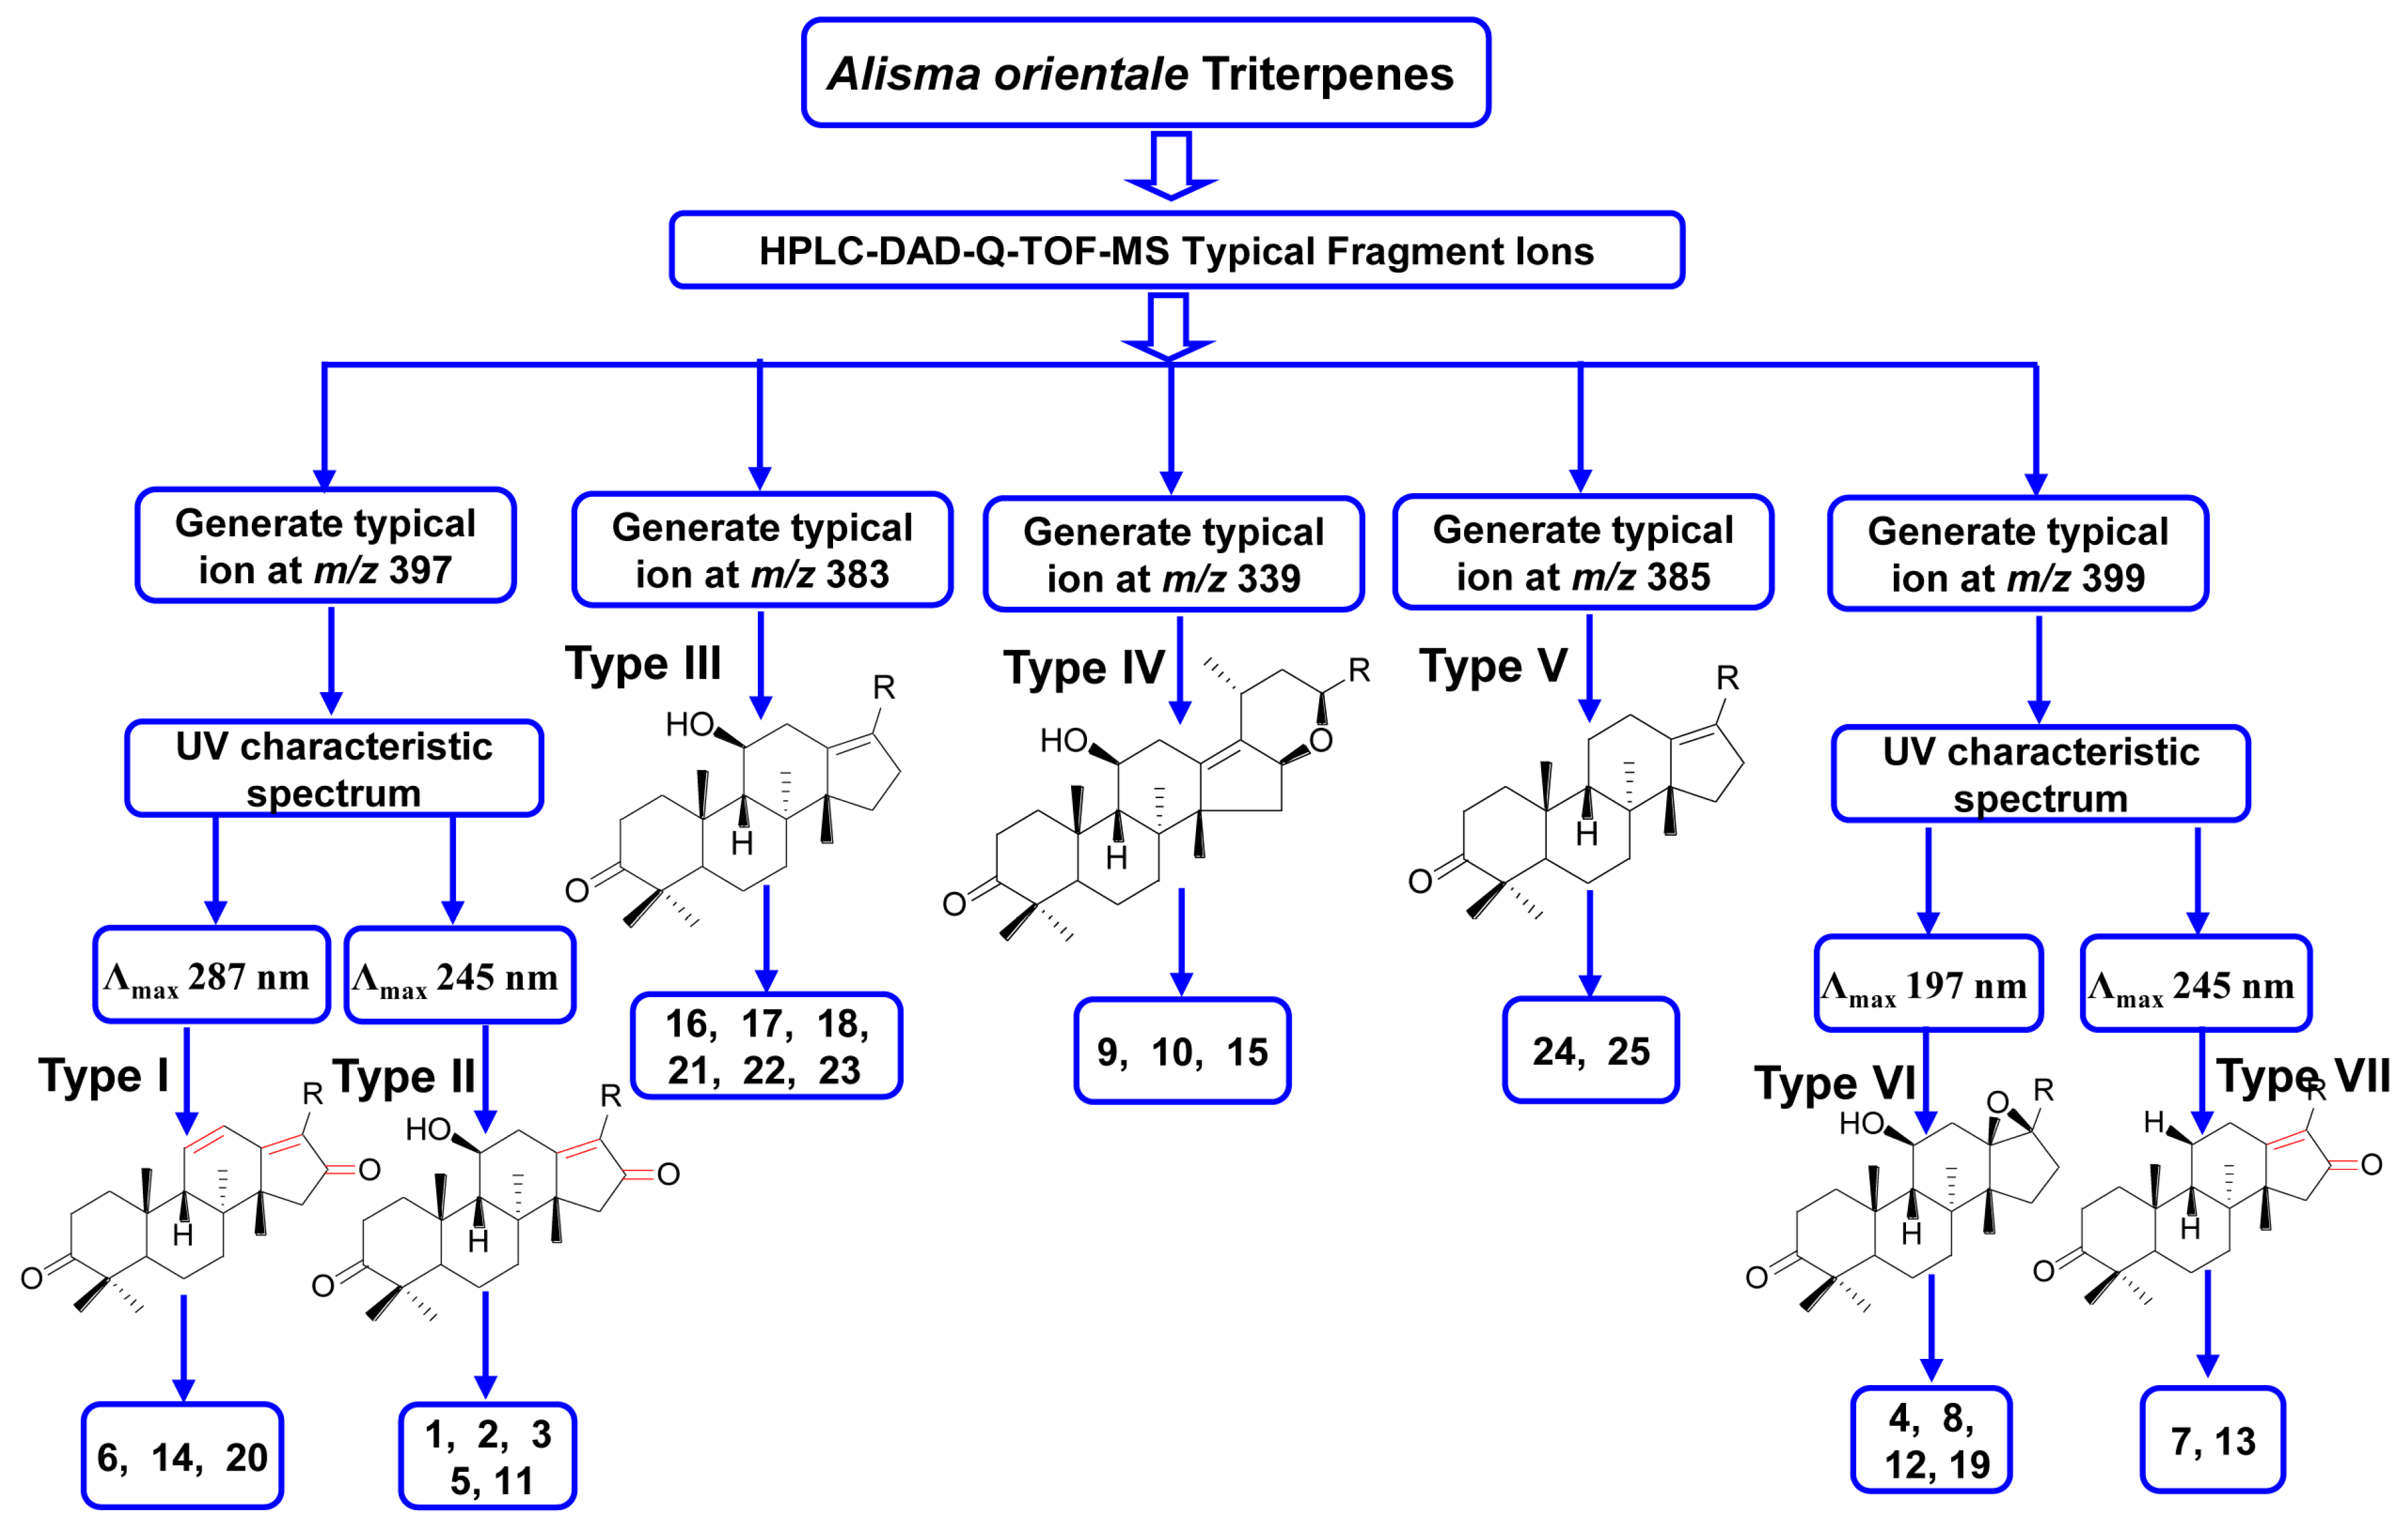
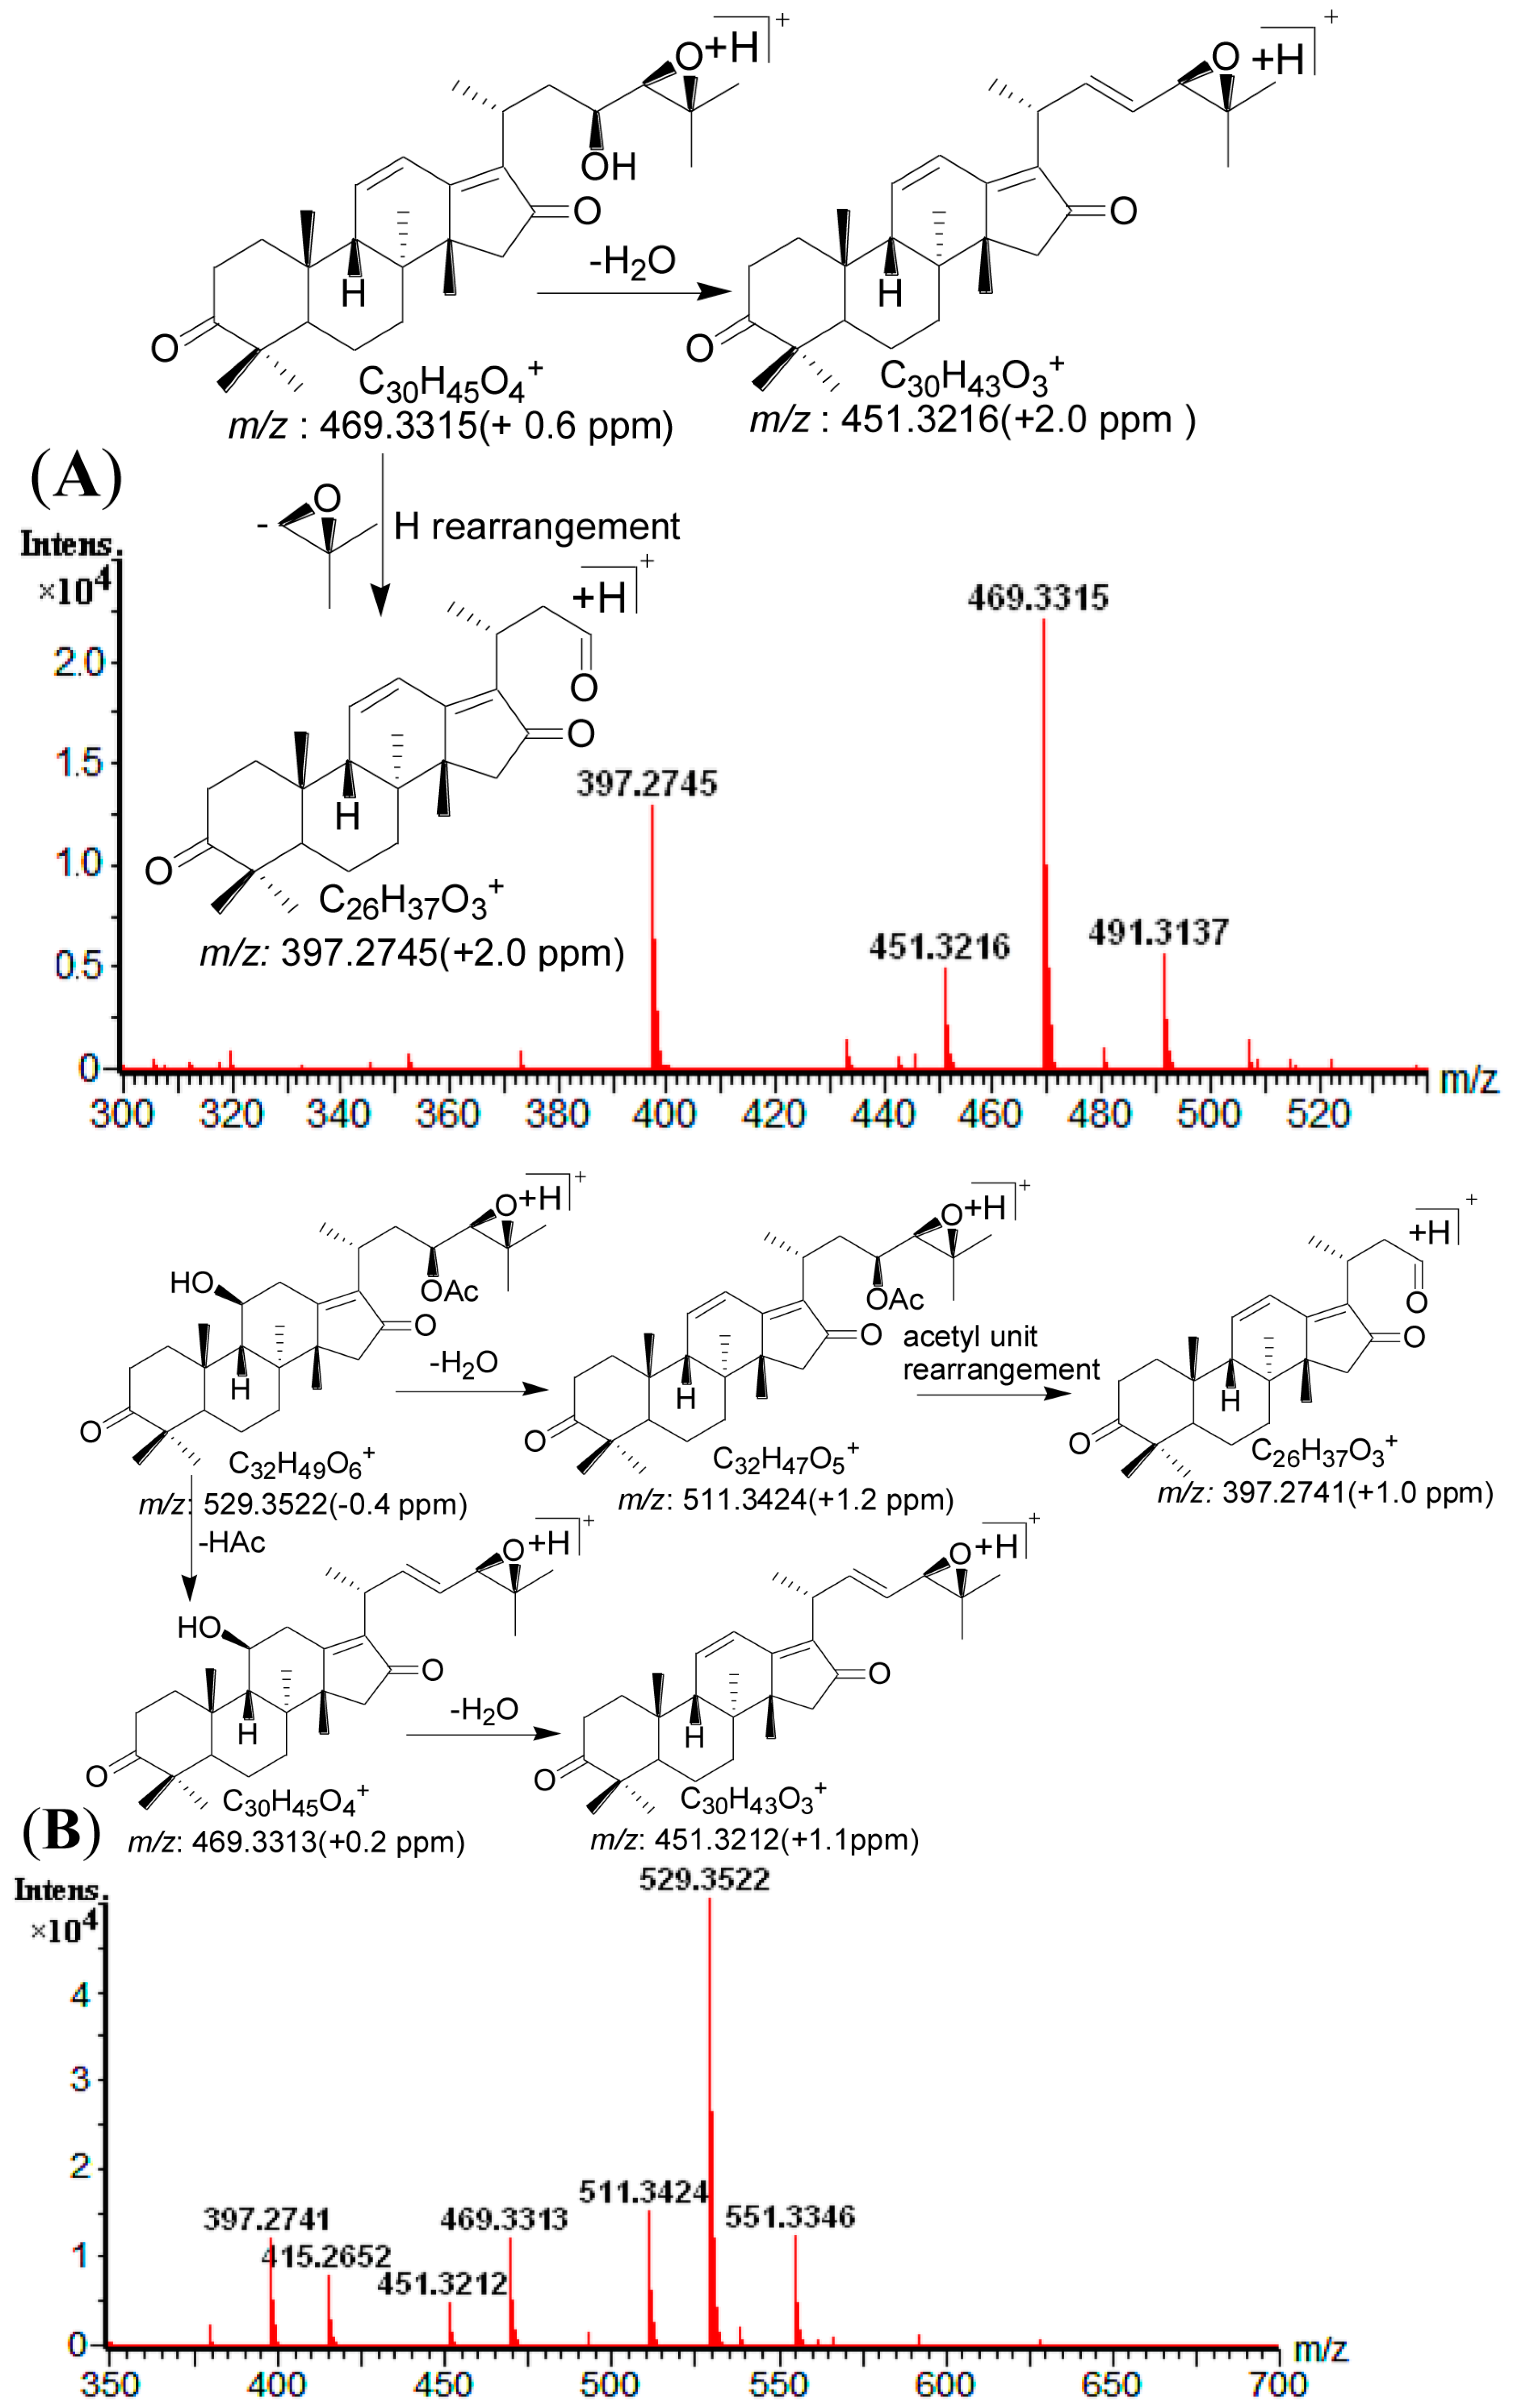
2.4. Identification of Compounds with HPLC-DAD-Q-TOF MS


| Peak Number | tR (min) | MS1 | Error (ppm) | Fragment Ions Collected in Positive Mode | Molecular Formula | λmax (nm) | Identity |
|---|---|---|---|---|---|---|---|
| 1 | 11.81 | 505.3534 [M + H]+ | 1.0 | 487.3421 [M + H − H2O]+, 469.3317 [M + H − 2H2O]+, 451.3416 [M + H − 3H2O]+, 415.2845 [M + H − C4H10O2]+, 397.2745 [M + H − C4H10O2 − H2O]+ | C 30H48O6 | 245 | 16-oxo-Alisol A a |
| 2 | 13.19 | 547.3638 [M + H]+ | 0.5 | 529.3528 [M + H − H2O]+, 511.3421 [M + H − 2H2O]+, 487.3422 [M + H − HAc]+, 469.3316 [M + H − Hac − H2O]+, 415.2848 [M + H − C6H12O3]+, 397.2745 [M + H − C6H12O3 − H2O]+ | C 32H50O7 | 245 | 16-oxo-Alisol A 23-actetate a |
| 3 | 15.63 | 547.3624 [M + H]+ | −2.0 | 529.3529 [M + H − H2O]+, 511.3429 [M + H − 2H2O]+, 487.3423 [M + H − HAc]+, 469.3318 [M + H – Hac − H2O]+, 415.2847 [M + H − C6H12O3]+, 397.2744 [M + H − C6H12O3 − H2O]+ | C 32H50O7 | 245 | 16-oxo-Alisol A 24-actetate a |
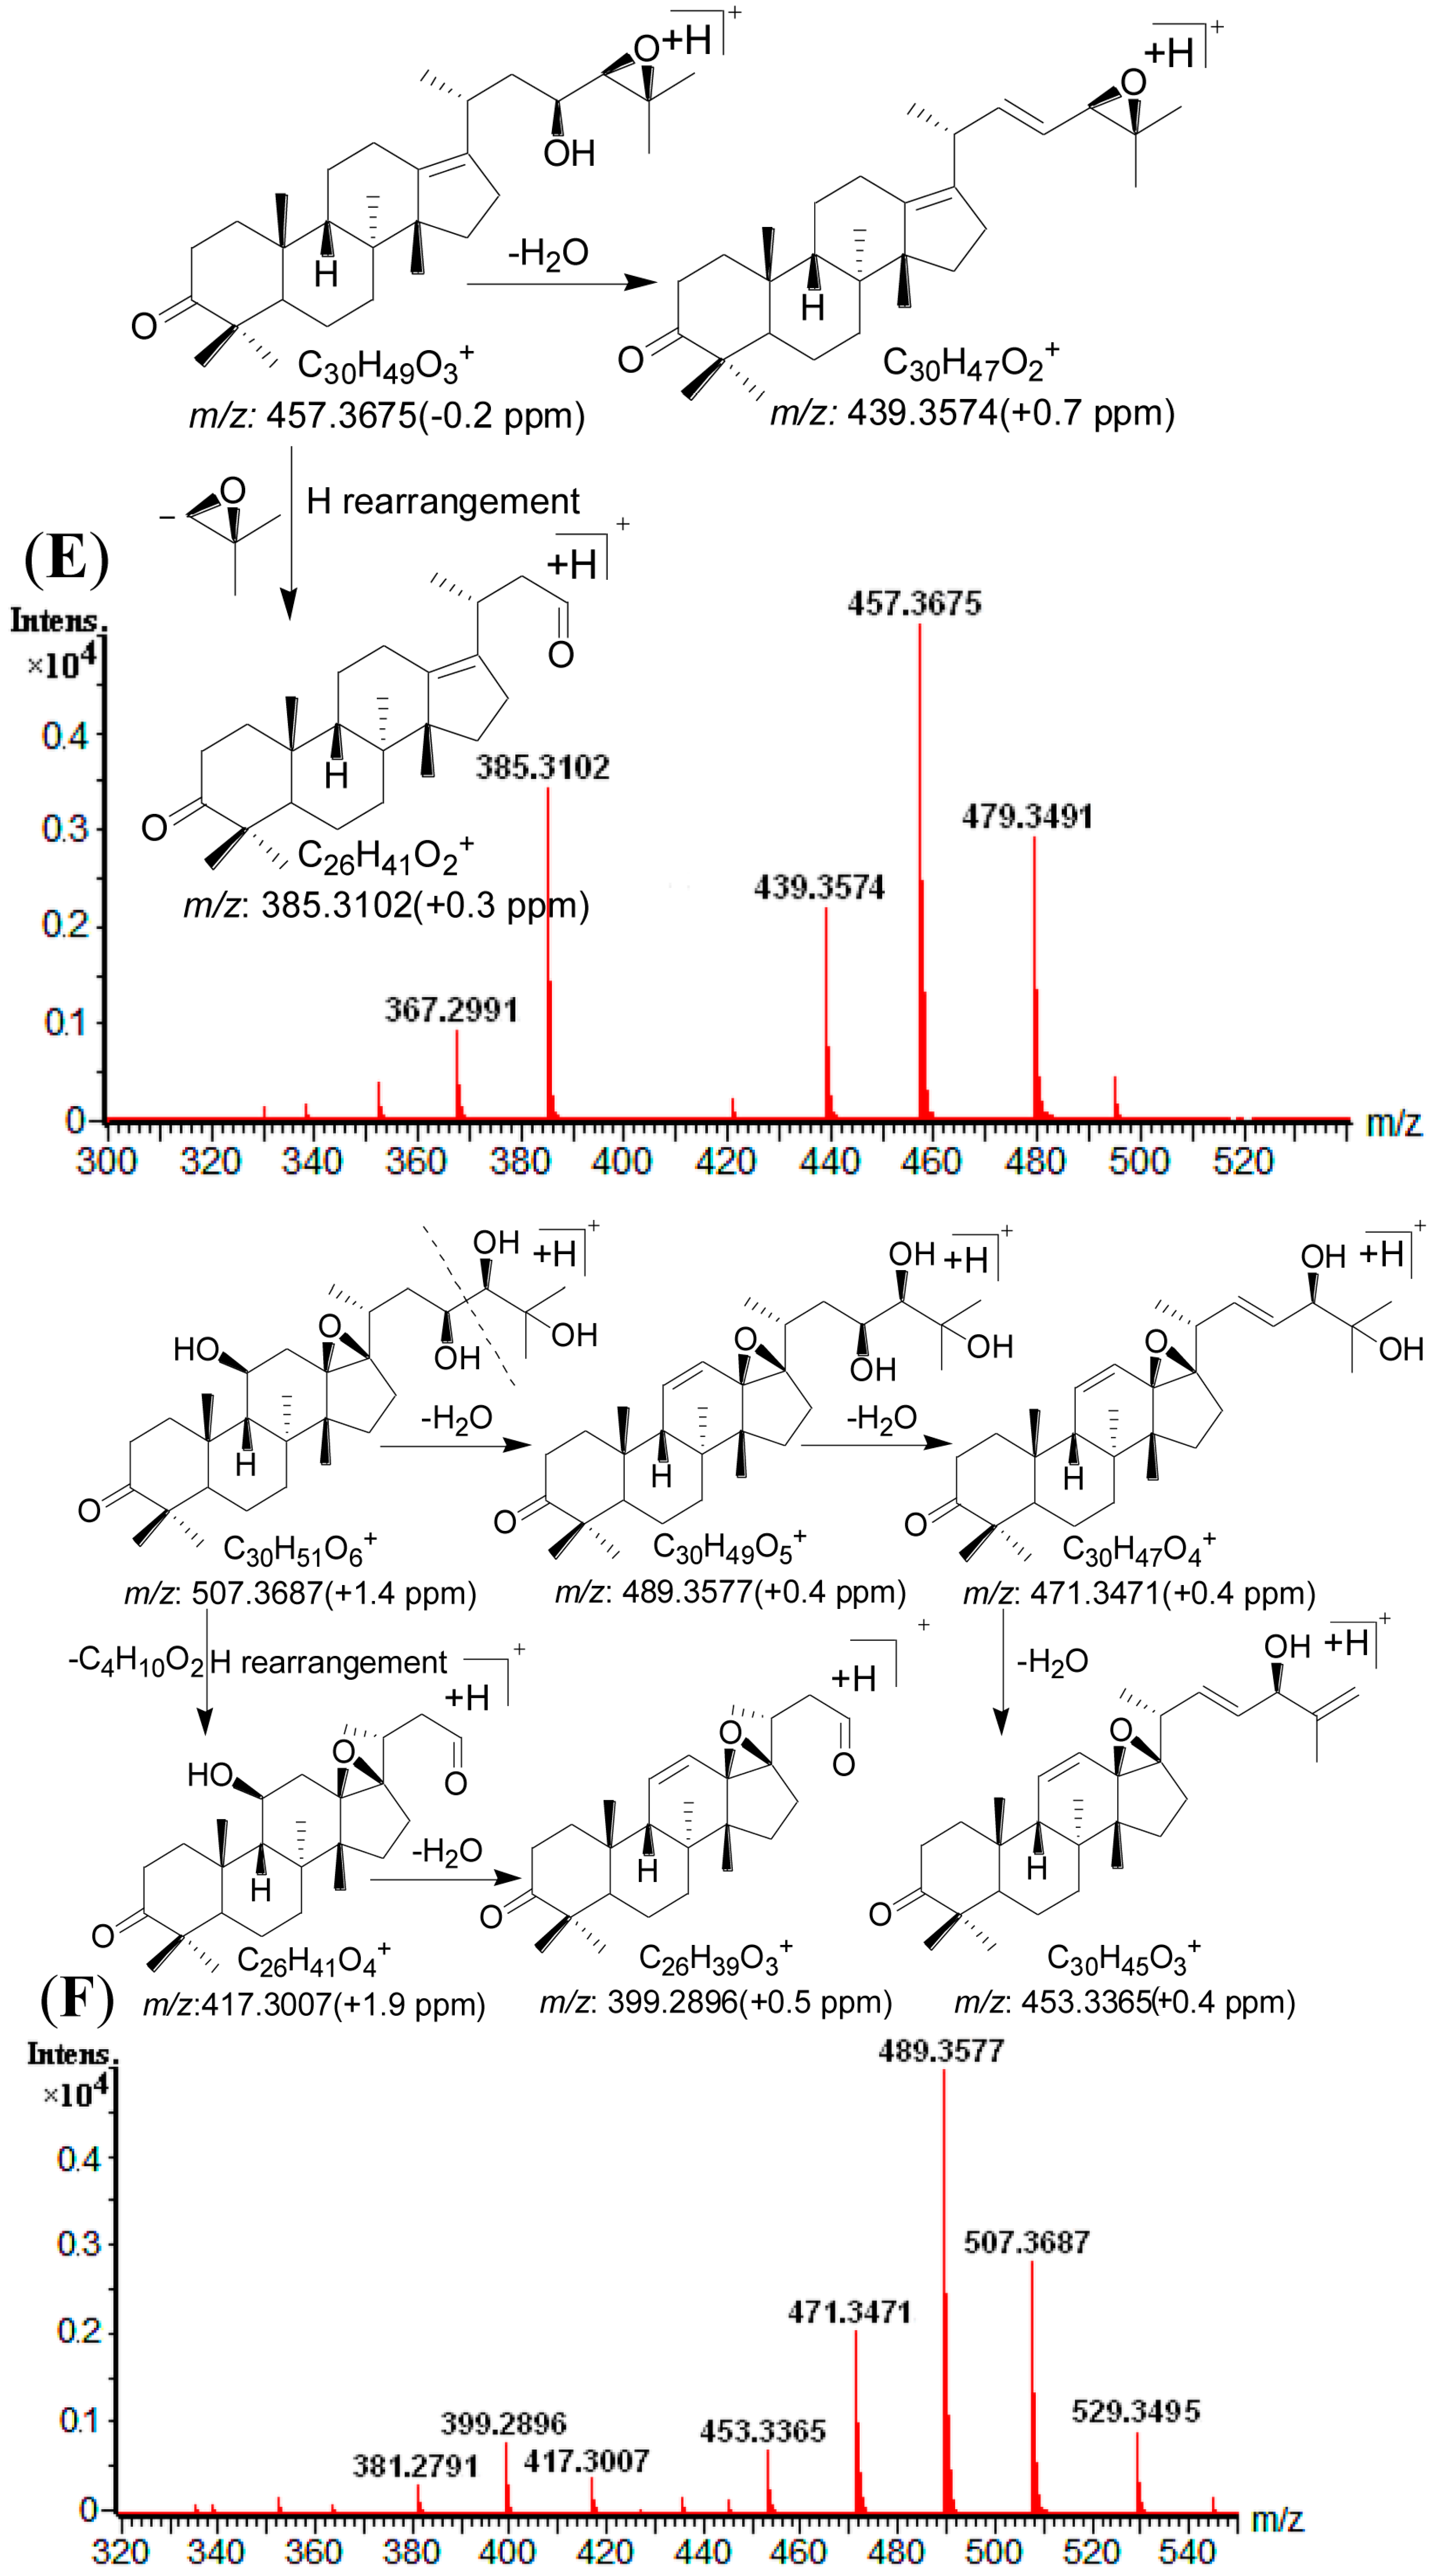
| 4 | 16.70 | 507.3687 [M + H]+ | 0.2 | 489.3577 [M + H − H2O]+, 471.3471 [M + H − 2H2O]+, 453.3365 [M + H − 3H2O]+, 417.3007 [M + H − C4H10O2]+, 399.2896 [M + H − C4H10O2 − H2O]+ | C 30H50O6 | - | 13,17-epoxy-Alisol A a |
| 5 | 17.31 | 487.3423 [M + H]+ | −0.2 | 469.3314 [M + H − H2O]+, 451.3213 [M + H − 2H2O]+, 415.2650 [M + H − C4H8O]+, 397.2741 [M + H − H2O − C4H8O]+, 379.3427 [M + H − 2H2O − C4H8O]+ | C 30H46O5 | 245 | Alisol C a |
| 6 | 19.36 | 487.3429 [M + H]+ | 1.0 | 469.3319 [M + H − H2O]+, 451.3215 [M + H − 2H2O]+, 397.2742 [M+H-C4H10O2]+ | C 30H46O5 | 287 | 16-oxo-11-anhydro-Alisol A a |
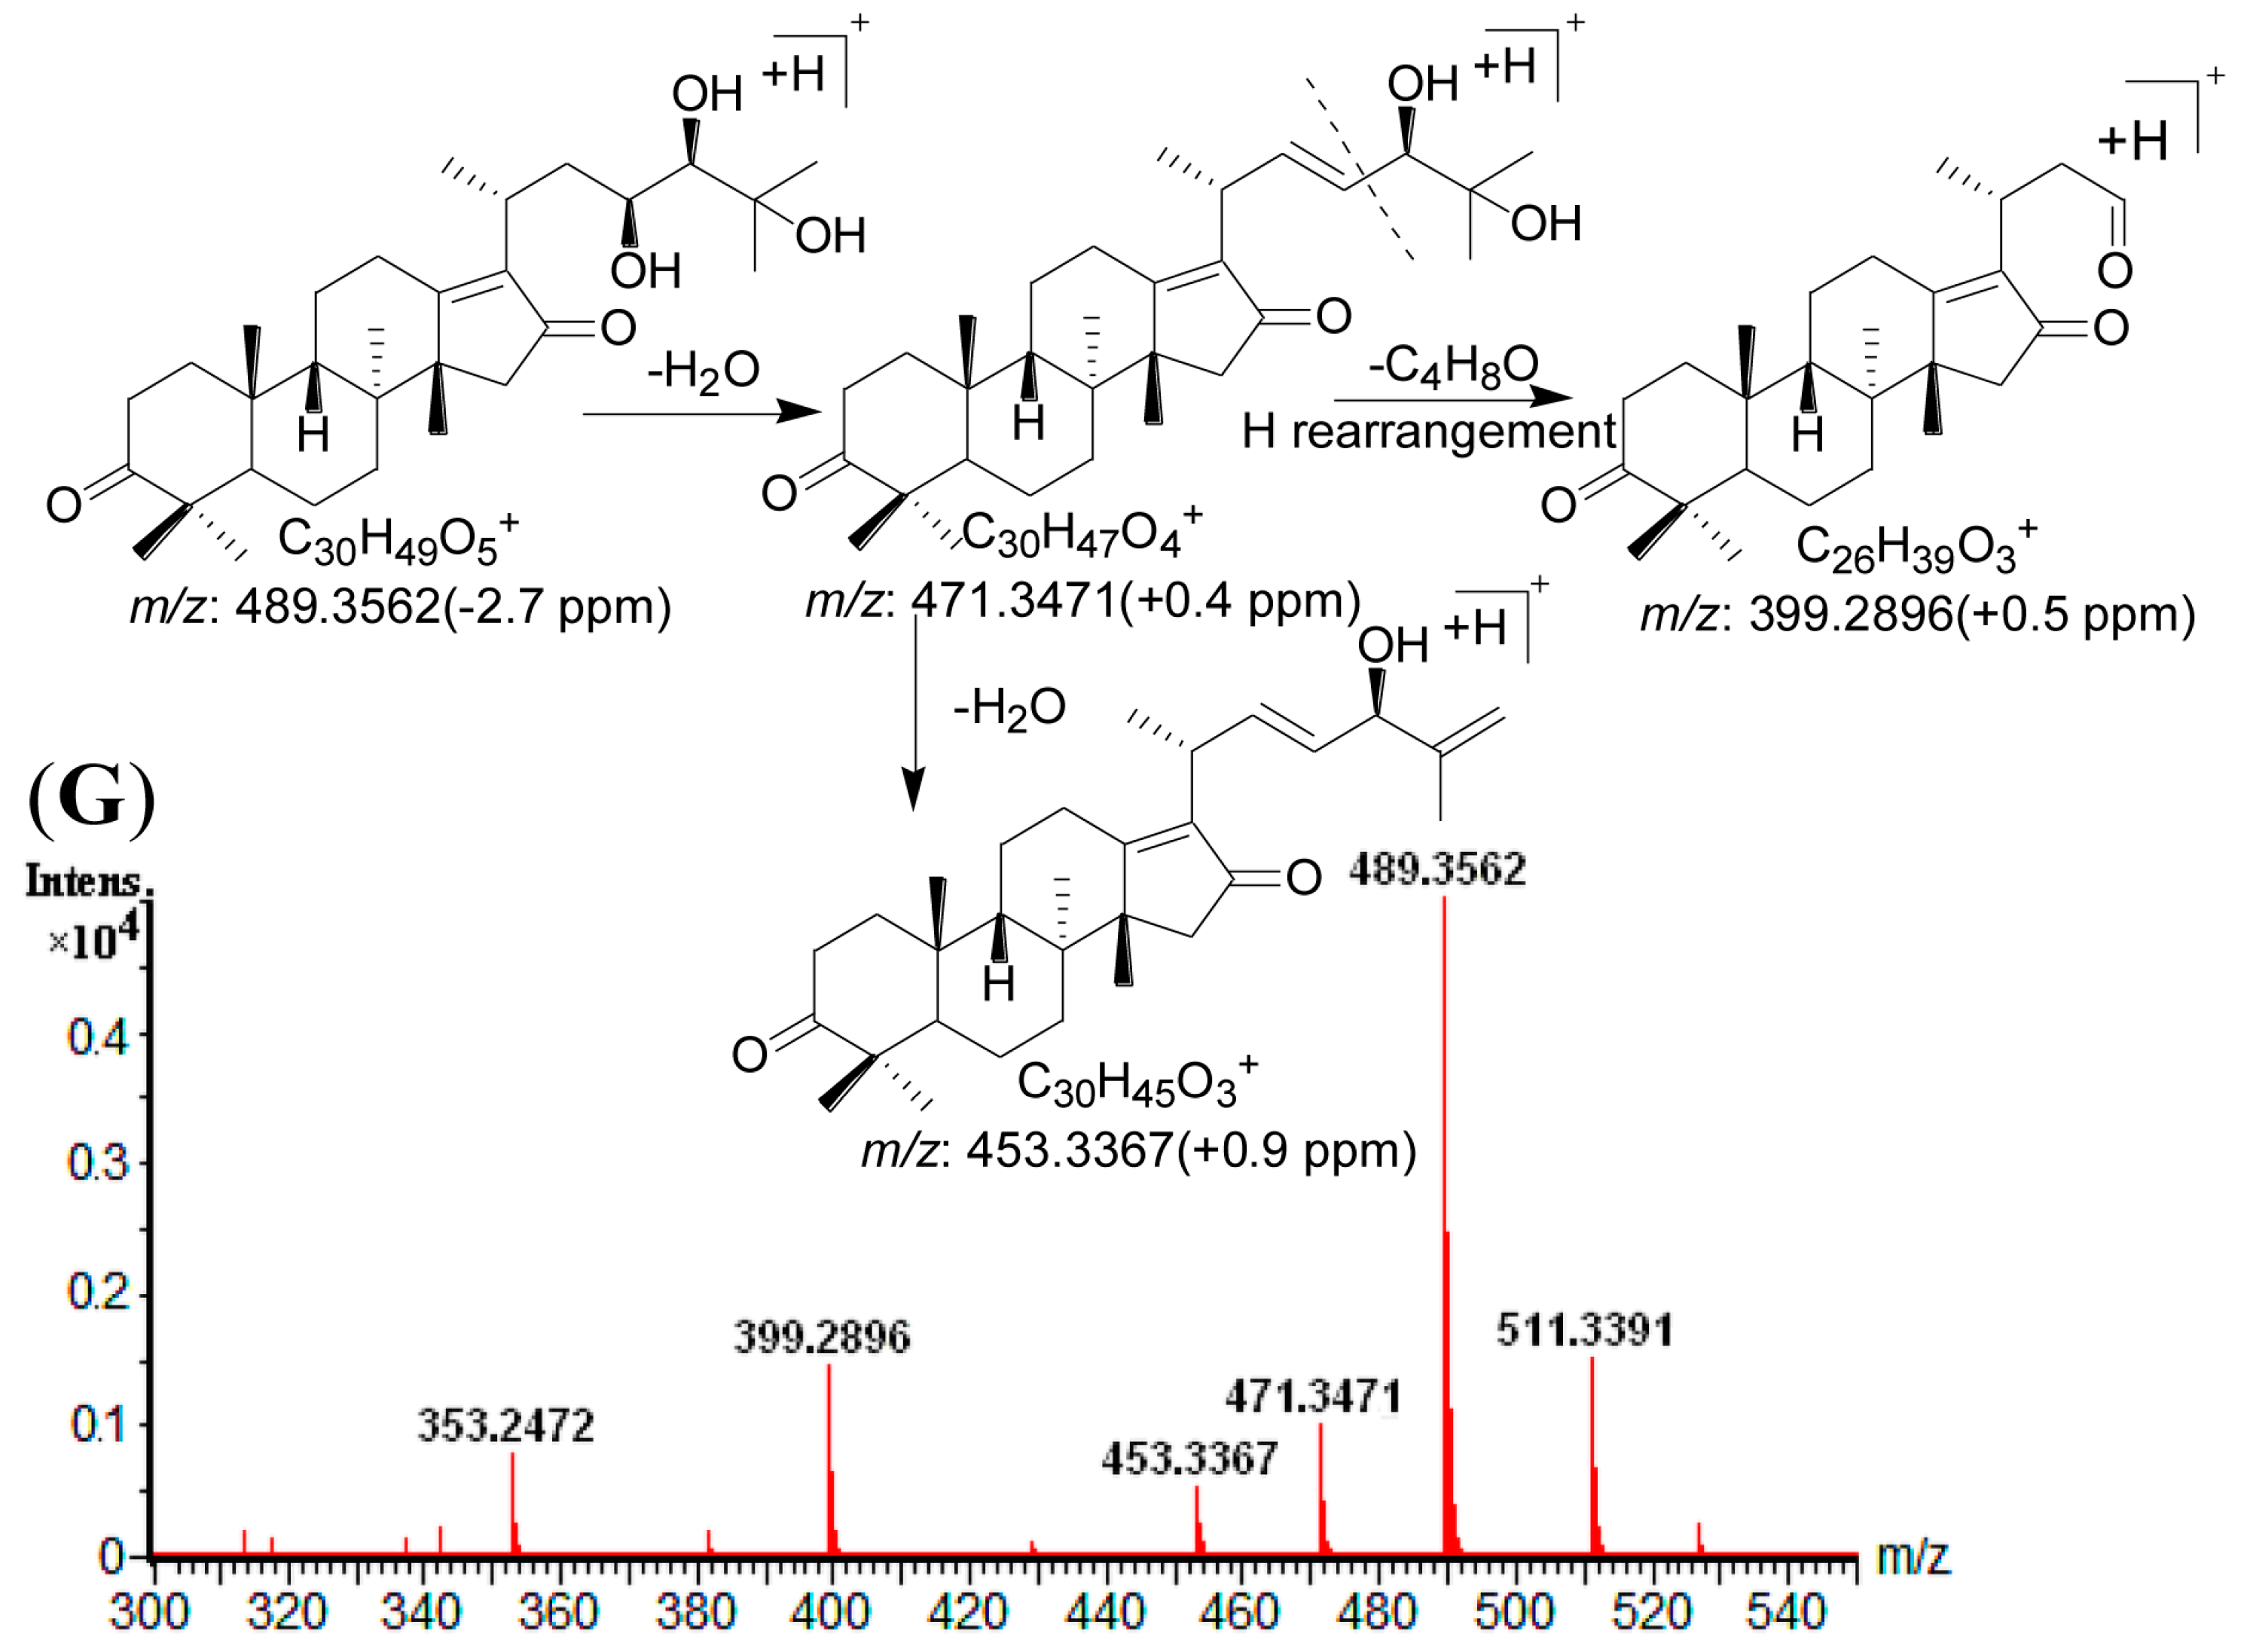
| 7 | 19.72 | 489.3562 [M + H]+ | −2.7 | 471.3471 [M + H − H2O]+, 453.3367 [M + H − 2H2O]+, 399.2896 [M+H-C4H10O2]+ | C 30H48O5 | 245 | 16-oxo-11-deoxy-Alisol A |
| 8 | 21.46 | 549.3798 [M + H]+ | 1.3 | 531.3685 [M + H − H2O]+, 513.3579 [M + H − 2H2O]+, 489.3585 [M + H − HAc]+, 471.3470 [M + H − Hac − H2O]+, 417.3005 [M + H − C6H12O3]+, 399.2896 [M + H − C6H12O3 − H2O]+ | C 32H52O7 | - | 13,17-epoxy-Alisol A 24-acetate a |
| 9 | 23.30 | 471.3464 [M + H]+ | −2.1 | 453.3367 [M + H − H2O]+, 381.2791 [M + H − C4H8O − H2O]+, 339.2684 [M + H − C4H8O − H2O − C2H2O]+ | C 30H46O4 | - | 16,23-oxido-Alisol B |
| 10 | 23.37 | 489.3583 [M + H]+ | 0.6 | 471.3472 [M + H − H2O]+, 453.3366 [M + H − 2H2O]+, 381.2798 [M + H − H2O − C4H10O2]+, 339.2687 [M + H − H2O − C4H10O2 − C2H2O]+ | C 30H48O5 | - | Alisol F a |
| 11 | 24.33 | 529.3522 [M + H]+ | −1.3 | 511.3424 [M + H − H2O]+, 469.3313 [M + H − HAc]+, 451.3212 [M + H − HAc − H2O]+, 415.2652 [M + H − C6H10O2]+,397.2741 [M + H − C6H10O2 − H2O]+ | C 32H48O6 | 245 | Alisol C 23-acetate a |
| 12 | 24.75 | 489.3586 [M + H]+ | 1.2 | 471.3477 [M + H − H2O]+, 453.3363 [M + H − 2H2O]+, 417.3006 [M + H − C4H8O]+, 399.2895 [M + H − C4H8O − H2O]+ | C 30H48O5 | - | 13,17-epoxy-Alisol B a |
| 13 | 25.46 | 471.3482 [M + H]+ | 1.7 | 453.3368 [M + H − H2O]+, 399.2894 [M + H − C4H8O]+ | C 30H46O4 | 245 | 11-deoxy-Alisol C |
| 14 | 25.91 | 469.3315 [M + H]+ | −0.6 | 451.3216 [M + H − H2O]+, 397.2745 [M + H − C4H8O]+ | C 30H44O4 | 287 | Alisol L a |
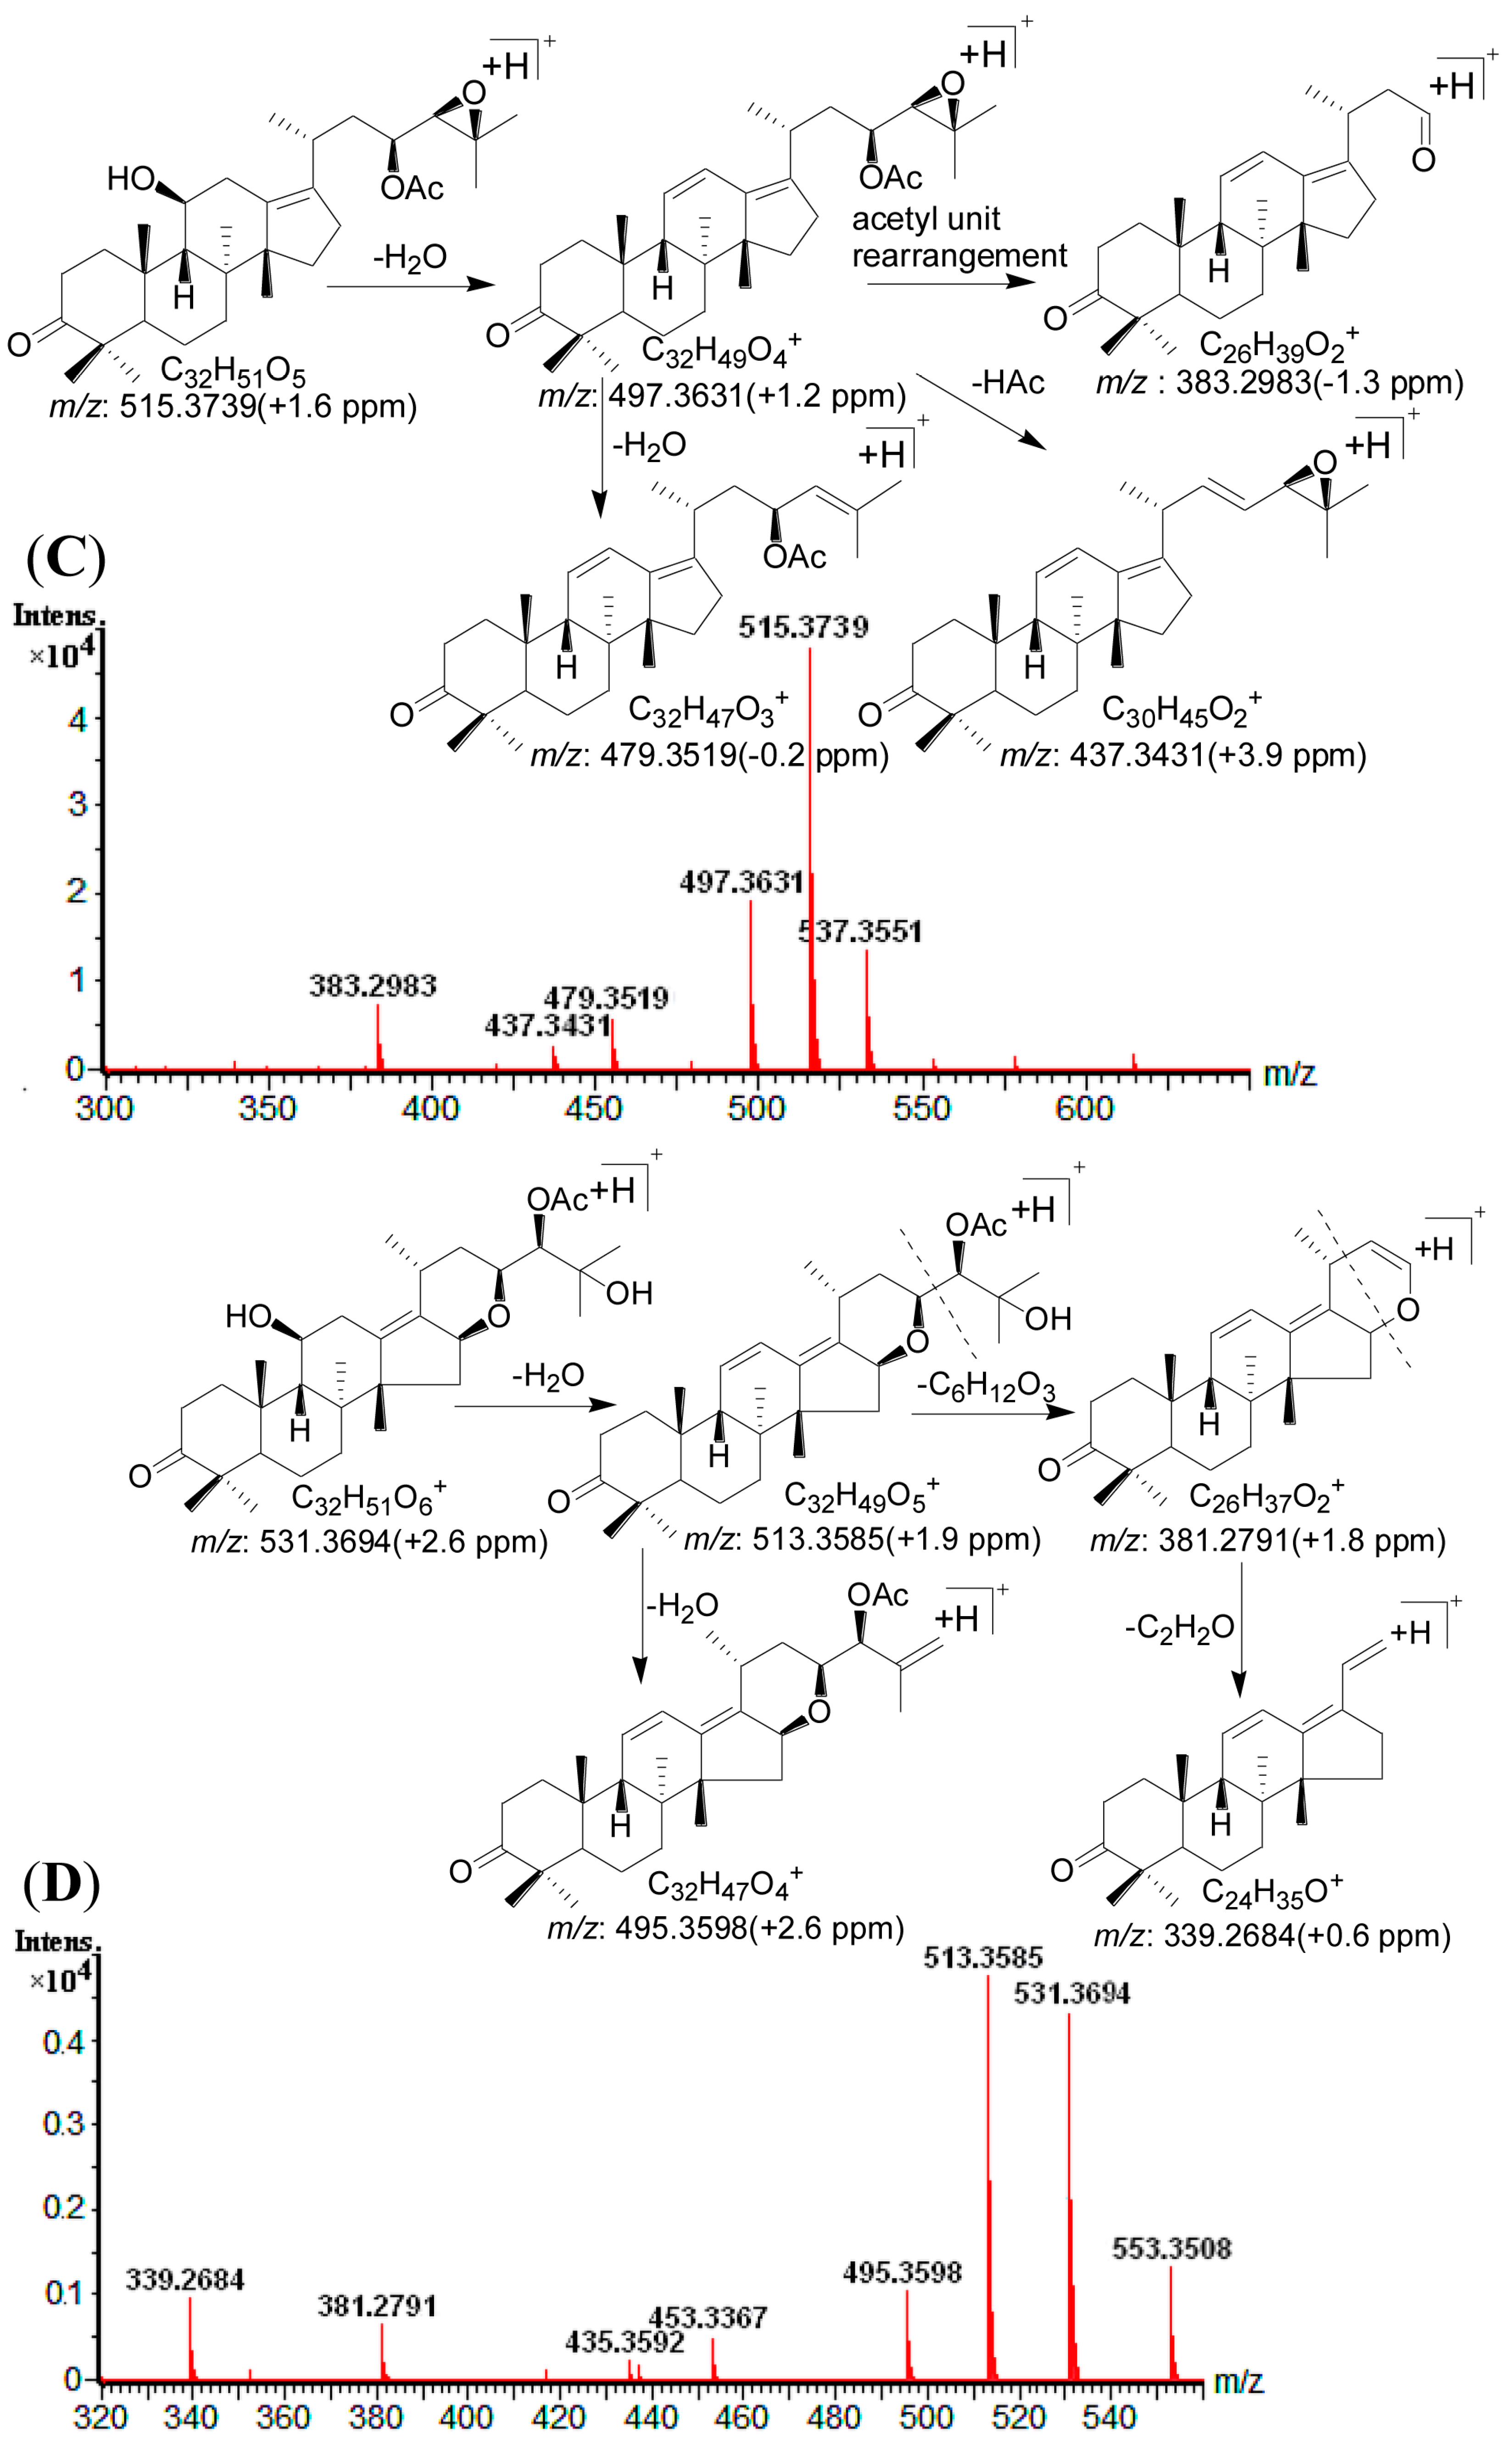
| 15 | 27.00 | 531.3694 [M + H]+ | 1.5 | 513.3585 [M + H − H2O]+, 495.3598 [M + H − 2H2O]+, 453.3367 [M + H − H2O − HAc]+, 435.3592 [M + H − 2H2O − HAc]+, 381.2791 [M + H − H2O − C6H12O3]+, 339.2684 [M + H − H2O − C6H12O3 − C2H2O]+ | C 32H50O6 | - | Alisol F 24-actetate a |
| 16 | 27.75 | 491.3731 [M + H]+ | 0.0 | 473.3630 [M + H − H2O]+, 455.3524 [M + H − 2H2O]+, 437.3418 [M + H − 3H2O]+, 383.2984 [M + H − H2O − C4H10O2]+ | C 30H50O5 | - | Alisol A a |
| 17 | 29.07 | 533.3773 [M + H]+ | 0.4 | 515.3735 [M + H − H2O]+, 497.3633 [M + H − 2H2O]+, 455.3526 [M + H − HAc − H2O] +, 437.3422 [M + H − HAc − 2H2O]+, 383.2983 [M + H − C6H12O3 − H2O]+ | C 32H52O6 | - | Alisol A 23-acetate a |
| 18 | 33.90 | 533.3848 [M + H]+ | 1.1 | 515.3736 [M + H − H2O]+, 497.3634 [M + H − 2H2O]+, 455.3528 [M + H − HAc − H2O] +, 437.3420 [M + H − HAc − 2H2O]+, 383.2981 [M + H − C6H12O3 − H2O]+ | C 32H52O6 | - | Alisol A 24-acetate a |
| 19 | 34.95 | 531.3685 [M + H]+ | −0.2 | 513.3581 [M + H − H2O]+, 495.3476 [M + H − 2H2O]+, 471.3478 [M + H − HAc]+, 453.3367 [M + H − HAc − H2O]+, 417.3008 [M + H − C6H10O2]+, 399.2895 [M + H − C6H10O2 − H2O]+ | C 32H50O6 | - | 13,17-epoxy-Alisol B 23-acetate a |
| 20 | 35.87 | 511.3418 [M + H]+ | −1.2 | 451.3321 [M + H − HAc]+, 397.2743 [M + H − C6H10O2]+ | C 32H46O5 | 287 | Alisol L 23-acetate a |
| 21 | 38.87 | 473.3638 [M + H]+ | 1.5 | 455.3527 [M + H − H2O]+, 437.3425 [M + H − 2H2O]+, 383.2981 [M + H − H2O − C4H8O]+ | C 30H48O4 | - | Alisol G a |
| 22 | 40.71 | 473.3639 [M + H]+ | 1.7 | 455.3523 [M + H − H2O]+, 437.2426 [M + H − 2H2O]+, 383.2982 [M + H − H2O − C4H8O]+ | C 30H48O4 | - | Alisol B a |
| 23 | 49.06 | 515.3739 [M + H]+ | 0.4 | 497.3631 [M + H − H2O]+, 479.3519 [M + H − 2H2O]+, 437.3431 [M + H − H2O − HAc]+, 383.2983 [M + H − H2O − C6H10O2]+ | C 32H50O5 | - | Alisol B 23-acetate a |
| 24 | 54.55 | 457.3675 [M + H]+ | −1.5 | 439.3574 [M + H − H2O]+, 385.3102 [M + H − C4H8O]+ | C 30H48O3 | - | 11-deoxy-Alisol B a |
| 25 | 61.12 | 499.3794 [M + H]+ | 1.4 | 439.3578 [M + H − HAc]+, 385.3105 [M + H − C6H10O2]+ | C 32H50O4 | - | 11-deoxy-Alisol B 23-acetate |


2.5. Method Validation
| Analytes | tR (min) | Calibration Curve | Linear Range μg/mL | r (n = 6) | LOD ng/mL | LOQ ng/mL |
|---|---|---|---|---|---|---|
| 16-oxo-Alisol A 23-acetate | 1.48 | Y = 15.87X − 0.014 | 0.008–0.103 | 0.9999 | 1.17 | 3.91 |
| 16-oxo-Alisol A 24-acetate | 1.71 | Y = 17.21X − 0.002 | 0.009–0.138 | 0.9990 | 1.82 | 6.05 |
| Alisol C | 1.95 | Y = 5.005X − 0.043 | 0.037–1.490 | 0.9980 | 3.63 | 12.1 |
| Alisol F | 2.78 | Y = 2.496X − 0.013 | 0.062–1.125 | 0.9989 | 2.45 | 8.17 |
| Alisol C 23-acetate | 2.87 | Y = 9.118X − 0.029 | 0.045–1.352 | 0.9990 | 1.70 | 5.67 |
| Alisol L | 3.10 | Y = 12.22X − 0.054 | 0.024–0.652 | 0.9996 | 1.68 | 5.59 |
| Alisol F 24-acetate | 3.25 | Y = 2.160X − 0.038 | 0.078–1.060 | 0.9990 | 7.01 | 21.0 |
| Alisol A | 3.38 | Y = 3.125X − 0.016 | 0.066–3.333 | 0.9982 | 1.61 | 5.35 |
| Alisol A 23-acetate | 3.54 | Y = 3.441X − 0.017 | 0.042–1.080 | 0.9993 | 1.73 | 5.75 |
| Alisol A 24-acetate | 4.05 | Y = 3.505X − 0.010 | 0.049–3.240 | 0.9990 | 1.01 | 4.37 |
| Alisol G | 4.61 | Y = 6.788X − 0.019 | 0.026–0.525 | 0.9980 | 3.63 | 12.1 |
| Alisol B | 4.84 | Y = 1.635X − 0.013 | 0.197–5.444 | 0.9982 | 3.40 | 10.6 |
| Alisol B 23-acetate | 5.67 | Y = 2.678X − 0.023 | 0.294–9.790 | 0.9993 | 3.04 | 10.1 |
| 11-deoxy-Alisol B | 6.36 | Y = 2.584X − 0.058 | 0.089–1.740 | 0.9990 | 9.23 | 27.4 |
| Analytes | Precision for Standard Solution (n = 6) | Repeatability from Real Samples | Stability (%) | Accuracy | |||
|---|---|---|---|---|---|---|---|
| Inter-Day RSD (%) | Intra-Day RSD (%) | RSD (%, n = 6) | Mean (mg/g) | Recovery (%) | RSD (%) | ||
| 16-oxo-Alisol A 23-acetate | 3.14 | 2.73 | 3.17 | 0.011 | 97.54 ± 2.49 | 100.2 | 3.10 |
| 16-oxo-Alisol A 24-acetate | 3.52 | 3.55 | 3.17 | 0.006 | 99.23 ± 2.39 | 101.7 | 2.02 |
| Alisol C | 3.94 | 3.79 | 3.97 | 0.128 | 98.57 ± 3.72 | 99.62 | 2.44 |
| Alisol F | 1.53 | 1.46 | 2.21 | 0.182 | 101.23 ± 2.73 | 103.8 | 2.53 |
| Alisol C 23-acetate | 2.14 | 3.60 | 3.02 | 0.174 | 96.22 ± 3.82 | 98.11 | 2.24 |
| Alisol L | 3.96 | 2.29 | 2.47 | 0.012 | 98.93 ± 1.59 | 101.3 | 4.06 |
| Alisol F 24-acetate | 2.22 | 1.28 | 2.86 | 0.089 | 99.75 ± 1.98 | 100.8 | 2.21 |
| Alisol A | 2.15 | 1.82 | 3.49 | 0.595 | 100.24 ± 3.52 | 98.17 | 2.15 |
| Alisol A 23-acetate | 2.14 | 1.81 | 4.03 | 0.105 | 96.88 ± 3.59 | 103.8 | 3.14 |
| Alisol A 24-acetate | 2.85 | 2.23 | 3.96 | 0.110 | 97.59 ± 3.61 | 102.0 | 3.84 |
| Alisol G | 2.08 | 3.22 | 3.01 | 0.031 | 97.92 ± 2.02 | 99.87 | 2.58 |
| Alisol B | 3.70 | 3.00 | 4.25 | 1.086 | 98.36 ± 1.30 | 99.34 | 3.20 |
| Alisol B 23-acetate | 2.22 | 1.48 | 2.31 | 1.465 | 100.56 ± 1.61 | 101.0 | 2.82 |
| 11-deoxy-Alisol B | 2.04 | 1.18 | 2.22 | 0.104 | 99.37 ± 3.19 | 101.2 | 3.04 |
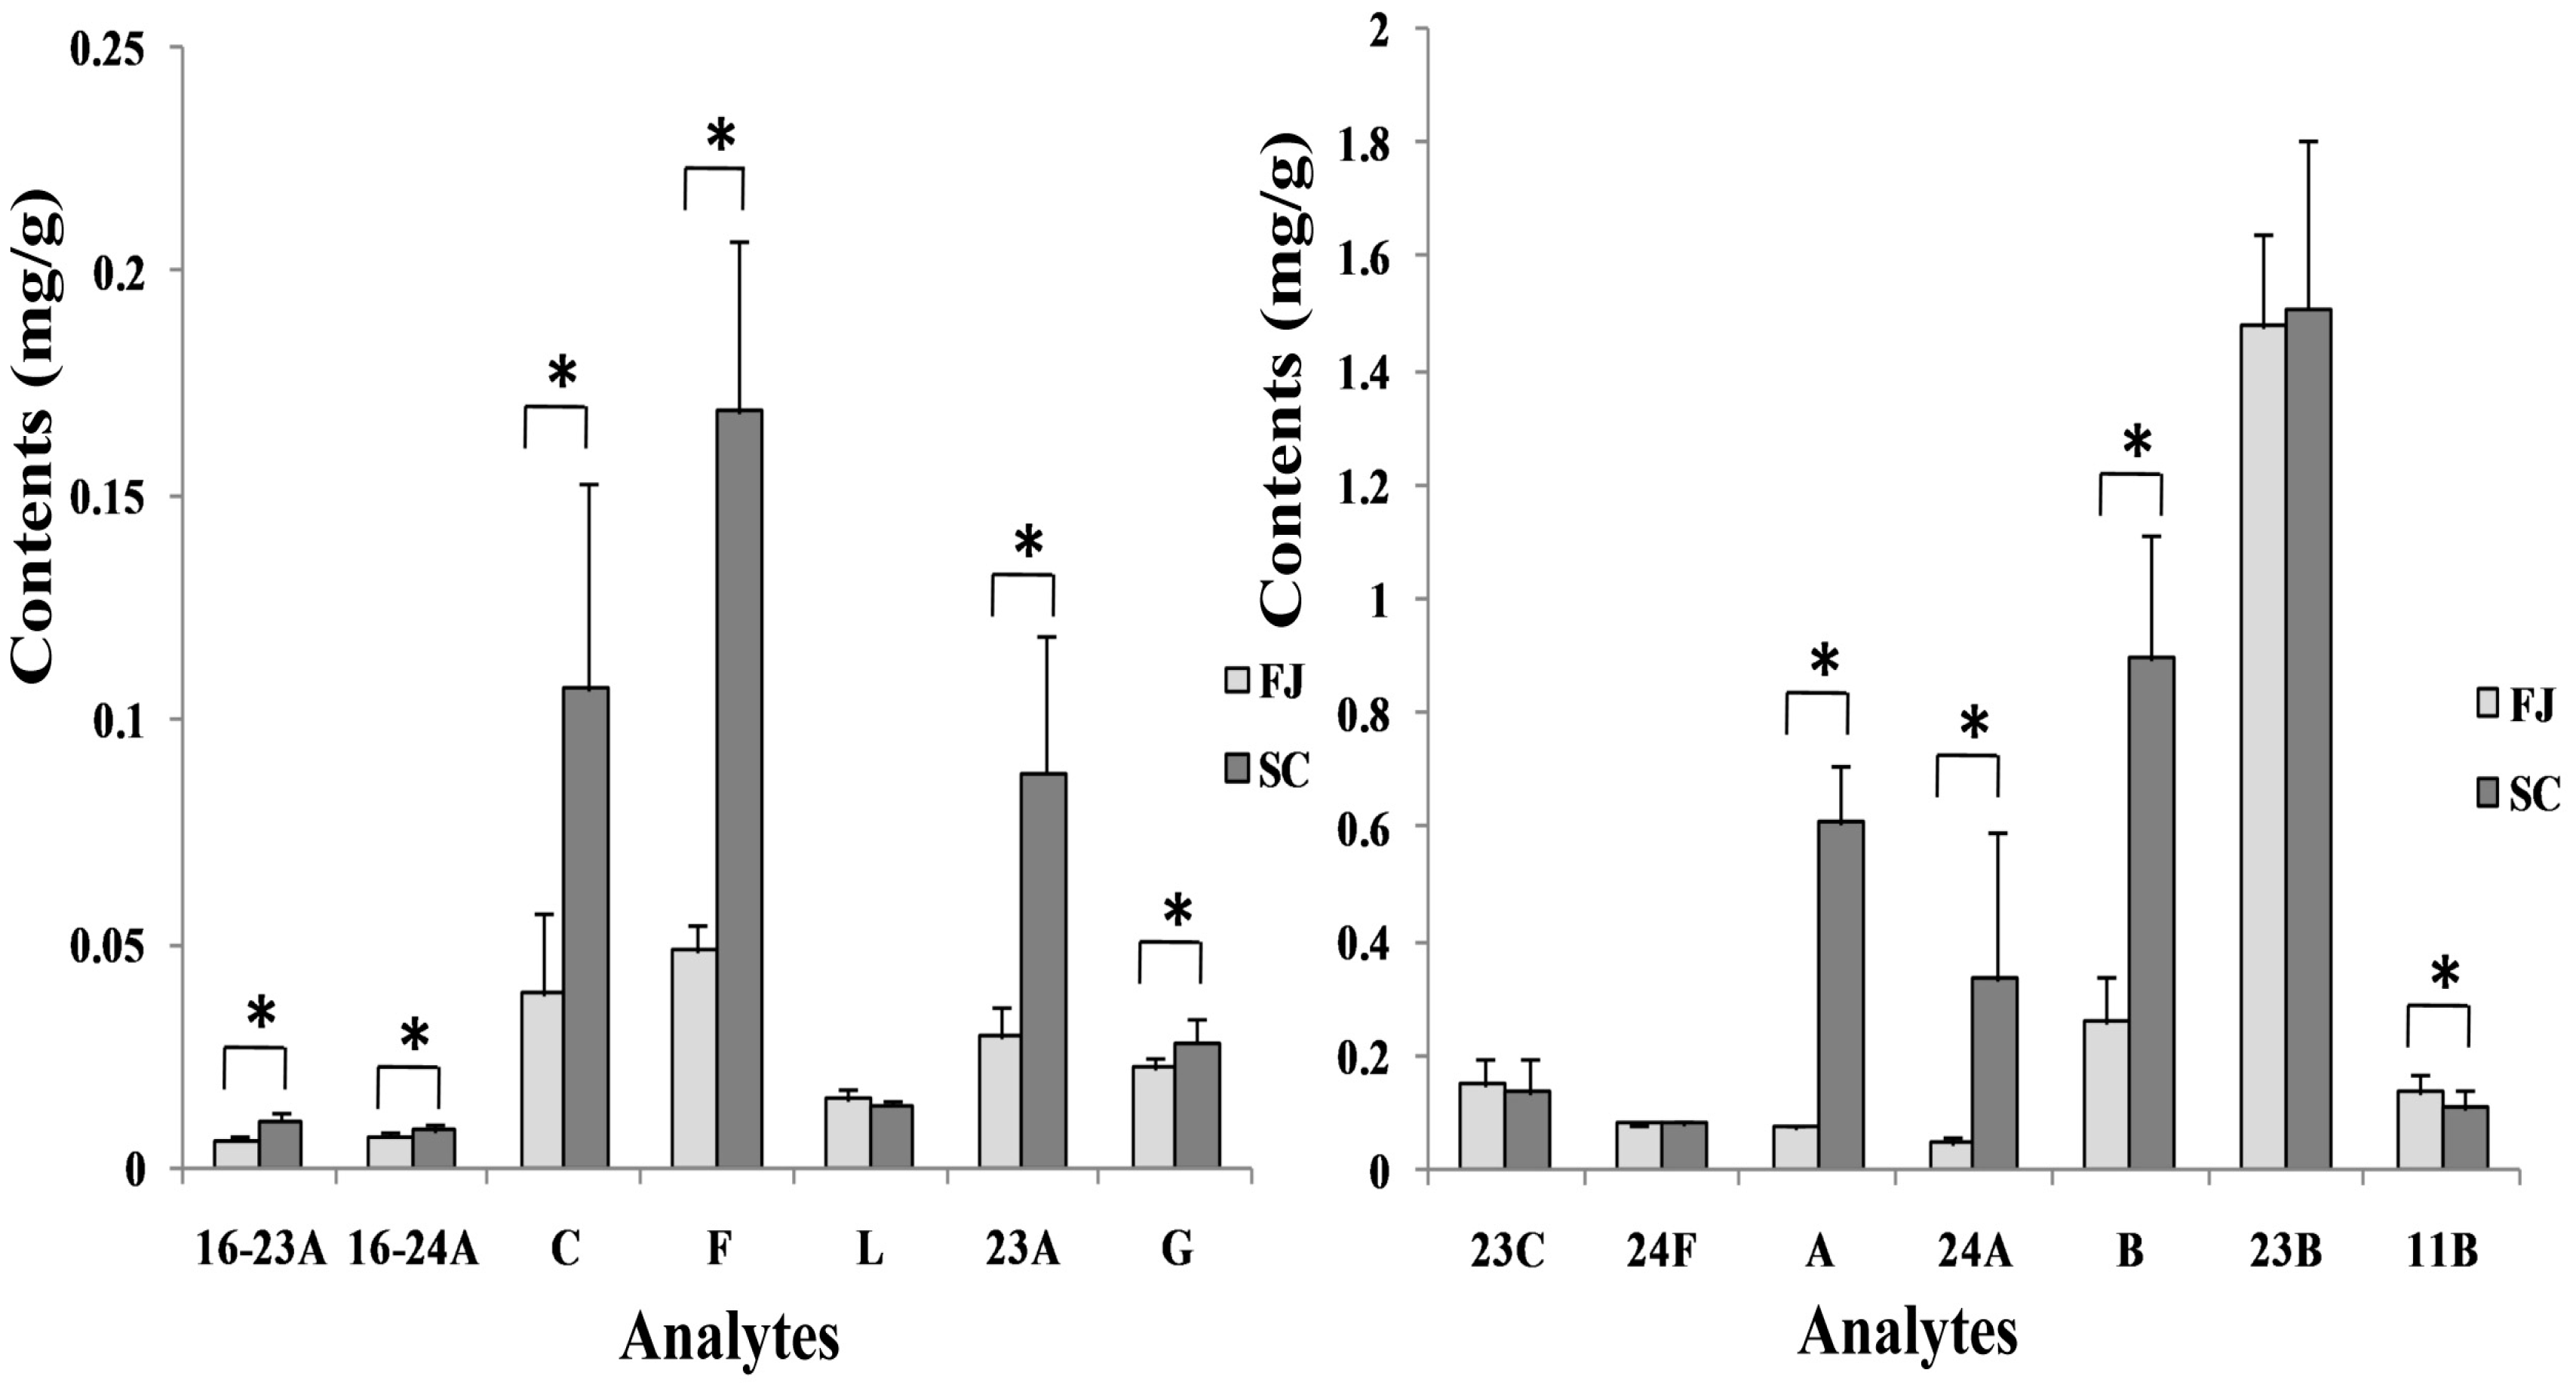
2.6. Sample Analysis
| NO. | Sample | 1 | 2 | 3 | 4 | 5 | 6 | 7 | 8 | 9 | 10 | 11 | 12 | 13 | 14 |
|---|---|---|---|---|---|---|---|---|---|---|---|---|---|---|---|
| S1 | Fujian 1 | 0.009 | 0.008 | 0.055 | 0.041 | 0.121 | 0.012 | 0.082 | 0.067 | 0.029 | 0.052 | 0.020 | 0.307 | 1.420 | 0.180 |
| S2 | Fujian 2 | 0.006 | 0.007 | 0.068 | 0.044 | 0.113 | 0.013 | 0.081 | 0.069 | 0.032 | 0.061 | 0.020 | 0.325 | 1.546 | 0.177 |
| S3 | Fujian 3 | 0.006 | 0.007 | 0.027 | 0.063 | 0.118 | 0.013 | ND | 0.075 | 0.030 | 0.069 | 0.024 | 0.118 | 1.560 | 0.183 |
| S4 | Fujian 4 | 0.006 | 0.008 | 0.025 | 0.047 | 0.219 | 0.018 | 0.08 | 0.070 | 0.021 | 0.028 | 0.020 | 0.324 | 1.216 | 0.124 |
| S5 | Fujian 5 | 0.005 | 0.005 | 0.023 | 0.046 | 0.204 | 0.018 | 0.081 | 0.081 | 0.023 | 0.028 | 0.021 | 0.291 | 1.780 | 0.122 |
| S6 | Fujian 6 | 0.006 | 0.007 | 0.027 | 0.049 | 0.244 | 0.020 | 0.085 | 0.075 | 0.024 | 0.030 | 0.025 | 0.342 | 1.502 | 0.131 |
| S7 | Fujian 7 | 0.007 | 0.008 | 0.070 | 0.057 | 0.141 | 0.014 | ND | 0.079 | 0.031 | 0.061 | 0.023 | 0.246 | 1.459 | 0.127 |
| S8 | Fujian 8 | 0.006 | 0.009 | 0.045 | 0.048 | 0.153 | 0.013 | 0.081 | 0.080 | 0.032 | 0.062 | 0.021 | 0.237 | 1.451 | 0.095 |
| S9 | Fujian 9 | 0.006 | 0.006 | 0.022 | 0.042 | 0.113 | 0.014 | 0.082 | 0.069 | 0.047 | 0.053 | 0.027 | 0.104 | 1.273 | 0.133 |
| S10 | Fujian 10 | 0.005 | 0.007 | 0.024 | 0.048 | 0.099 | 0.018 | 0.083 | 0.082 | 0.024 | 0.029 | 0.022 | 0.333 | 1.769 | 0.121 |
| S11 | Fujian 11 | 0.008 | 0.008 | 0.054 | 0.042 | 0.121 | 0.013 | 0.082 | 0.068 | 0.029 | 0.051 | 0.020 | 0.308 | 1.420 | 0.181 |
| S12 | Fujian 12 | 0.007 | 0.007 | 0.067 | 0.044 | 0.114 | 0.013 | 0.081 | 0.069 | 0.032 | 0.061 | 0.020 | 0.326 | 1.546 | 0.178 |
| S13 | Fujian 13 | 0.006 | 0.007 | 0.027 | 0.063 | 0.118 | 0.013 | ND | 0.075 | 0.030 | 0.069 | 0.024 | 0.118 | 1.560 | 0.183 |
| S14 | Fujian 14 | 0.005 | 0.008 | 0.026 | 0.048 | 0.219 | 0.019 | 0.08 | 0.070 | 0.021 | 0.029 | 0.021 | 0.324 | 1.216 | 0.124 |
| S15 | Fujian 15 | 0.006 | 0.005 | 0.024 | 0.046 | 0.205 | 0.018 | 0.082 | 0.081 | 0.024 | 0.028 | 0.021 | 0.291 | 1.780 | 0.122 |
| S16 | Fujian 16 | 0.006 | 0.007 | 0.027 | 0.049 | 0.244 | 0.020 | 0.085 | 0.076 | 0.024 | 0.030 | 0.025 | 0.343 | 1.300 | 0.132 |
| S17 | Fujian 17 | 0.007 | 0.008 | 0.070 | 0.057 | 0.141 | 0.014 | ND | 0.079 | 0.031 | 0.061 | 0.024 | 0.246 | 1.459 | 0.127 |
| S18 | Fujian 18 | 0.007 | 0.009 | 0.045 | 0.048 | 0.153 | 0.013 | 0.081 | 0.080 | 0.032 | 0.062 | 0.021 | 0.238 | 1.452 | 0.095 |
| S19 | Fujian 19 | 0.006 | 0.006 | 0.022 | 0.043 | 0.114 | 0.014 | 0.083 | 0.069 | 0.047 | 0.054 | 0.027 | 0.104 | 1.273 | 0.133 |
| S20 | Fujian 20 | 0.005 | 0.007 | 0.024 | 0.048 | 0.099 | 0.018 | 0.083 | 0.082 | 0.024 | 0.029 | 0.022 | 0.333 | 1.569 | 0.122 |
| S21 | Fujian 21 | 0.007 | 0.008 | 0.044 | 0.049 | 0.153 | 0.013 | 0.082 | 0.080 | 0.032 | 0.062 | 0.022 | 0.237 | 1.451 | 0.095 |
| S22 | Sichuan 1 | 0.011 | 0.008 | 0.207 | 0.184 | 0.202 | 0.013 | 0.085 | 0.802 | 0.115 | 0.543 | 0.038 | 0.905 | 1.418 | 0.163 |
| S23 | Sichuan 2 | 0.010 | 0.007 | 0.145 | 0.184 | 0.138 | 0.013 | 0.079 | 0.594 | 0.111 | 0.803 | 0.035 | 1.208 | 2.002 | 0.138 |
| S24 | Sichuan 3 | 0.009 | 0.007 | 0.137 | 0.213 | 0.131 | 0.013 | 0.079 | 0.568 | 0.105 | 0.807 | 0.032 | 1.232 | 2.032 | 0.166 |
| S25 | Sichuan 4 | 0.011 | 0.006 | 0.128 | 0.182 | 0.174 | 0.012 | 0.089 | 0.595 | 0.105 | 0.110 | 0.031 | 1.086 | 1.465 | 0.104 |
| S26 | Sichuan 5 | 0.008 | 0.006 | 0.108 | 0.131 | 0.065 | 0.017 | ND | 0.594 | 0.035 | 0.102 | 0.022 | 0.784 | 1.438 | 0.109 |
| S27 | Sichuan 6 | 0.010 | 0.008 | 0.077 | 0.156 | 0.069 | 0.013 | 0.082 | 0.567 | 0.102 | 0.279 | 0.025 | 0.740 | 1.163 | 0.104 |
| S28 | Sichuan 7 | 0.012 | 0.009 | 0.034 | 0.211 | 0.143 | 0.012 | ND | 0.756 | 0.107 | 0.271 | 0.026 | 1.016 | 1.217 | 0.061 |
| S29 | Sichuan 8 | 0.015 | 0.011 | 0.069 | 0.221 | 0.241 | 0.013 | 0.081 | 0.707 | 0.114 | 0.297 | 0.029 | 0.525 | 1.513 | 0.123 |
| S30 | Sichuan 9 | 0.012 | 0.007 | 0.104 | 0.118 | 0.114 | 0.016 | ND | 0.445 | 0.047 | 0.104 | 0.024 | 0.663 | 1.821 | 0.052 |
| S31 | Sichuan 10 | 0.012 | 0.010 | 0.073 | 0.109 | 0.182 | 0.015 | 0.090 | 0.491 | 0.062 | 0.155 | 0.021 | 0.912 | 1.131 | 0.072 |
| S32 | Sichuan 11 | 0.010 | 0.009 | 0.206 | 0.184 | 0.202 | 0.014 | 0.085 | 0.802 | 0.114 | 0.544 | 0.038 | 0.906 | 1.419 | 0.164 |
| S33 | Sichuan 12 | 0.011 | 0.010 | 0.145 | 0.185 | 0.138 | 0.013 | 0.079 | 0.594 | 0.111 | 0.803 | 0.035 | 1.208 | 2.001 | 0.139 |
| S34 | Sichuan 13 | 0.009 | 0.008 | 0.138 | 0.213 | 0.131 | 0.014 | 0.081 | 0.568 | 0.105 | 0.807 | 0.032 | 1.231 | 2.032 | 0.166 |
| S35 | Sichuan 14 | 0.011 | 0.010 | 0.128 | 0.183 | 0.174 | 0.012 | 0.089 | 0.596 | 0.105 | 0.111 | 0.031 | 1.086 | 1.465 | 0.104 |
| S36 | Sichuan 15 | 0.009 | 0.007 | 0.108 | 0.131 | 0.065 | 0.017 | ND | 0.594 | 0.035 | 0.102 | 0.023 | 0.784 | 1.439 | 0.109 |
| S37 | Sichuan 16 | 0.010 | 0.008 | 0.078 | 0.156 | 0.069 | 0.014 | 0.082 | 0.567 | 0.103 | 0.279 | 0.025 | 0.741 | 1.663 | 0.105 |
| S38 | Sichuan 17 | 0.011 | 0.009 | 0.034 | 0.212 | 0.144 | 0.012 | ND | 0.757 | 0.107 | 0.271 | 0.026 | 1.016 | 1.217 | 0.061 |
| S39 | Sichuan 18 | 0.015 | 0.011 | 0.069 | 0.221 | 0.241 | 0.013 | 0.081 | 0.707 | 0.114 | 0.297 | 0.029 | 0.525 | 1.513 | 0.123 |
| S40 | Sichuan 19 | 0.012 | 0.007 | 0.105 | 0.118 | 0.114 | 0.016 | ND | 0.446 | 0.048 | 0.105 | 0.024 | 0.663 | 1.522 | 0.053 |
| S41 | Sichuan 20 | 0.013 | 0.011 | 0.073 | 0.109 | 0.183 | 0.015 | 0.091 | 0.491 | 0.062 | 0.155 | 0.021 | 0.913 | 1.131 | 0.072 |
| S42 | Sichuan 21 | 0.008 | 0.007 | 0.109 | 0.132 | 0.065 | 0.017 | ND | 0.595 | 0.036 | 0.103 | 0.023 | 0.784 | 1.438 | 0.109 |
| S43 | Sichuan 22 | 0.010 | 0.008 | 0.077 | 0.156 | 0.069 | 0.014 | 0.082 | 0.567 | 0.102 | 0.279 | 0.025 | 0.741 | 1.164 | 0.105 |

3. Experimental Section
3.1. Materials and Standards, Reagents
3.2. Preparation of Standard Solution and Samples
3.3. Qualitative Chromatographic Conditions
3.4. Quantitative Chromatographic Conditions

3.5. Validation of the Quantitative Method
4. Conclusions
Supplementary Materials
Acknowledgments
Author Contributions
Conflicts of Interest
References
- Dan, H.; Wu, J.; Peng, M.; Hu, X.; Song, C.; Zhou, Z.; Yu, S.; Fang, N. Hypolipidemic effects of alismatis rhizome on lipid profile in mice fed high-fat diet. Saudi Med. J. 2011, 32, 701–707. [Google Scholar] [PubMed]
- Li, Q.; Qu, H. Study on the hypoglycemic activities and metabolism of alcohol extract of Alismatis Rhizoma. Fitoterapia 2012, 83, 1046–1053. [Google Scholar] [CrossRef] [PubMed]
- Lee, J.H.; Kwon, O.S.; Jin, H.G.; Woo, E.R.; Kim, Y.S.; Kim, H.P. The rhizomes of Alisma orientale and alisol derivatives inhibit allergic response and experimental atopic dermatitis. Biol. Pharm. Bul. 2012, 35, 1581–1587. [Google Scholar] [CrossRef]
- Lee, S.; Kho, Y.; Min, B.; Kim, J.; Na, M.; Kang, S.; Maeng, H.; Bae, K. Cytotoxic triterpenoides from Alismatis Rhizoma. Arch. Pharm. Res. 2001, 24, 524–526. [Google Scholar] [CrossRef] [PubMed]
- Feng, Y.L.; Chen, H.; Tian, T.; Chen, D.Q.; Zhao, Y.Y.; Lin, R.C. Diuretic and anti-diuretic activities of the ethanol and aqueous extracts of Alismatis Rhizoma. J. Ethnopharmacol. 2014, 154, 386–390. [Google Scholar] [CrossRef] [PubMed]
- Xu, W.; Li, T.; Qiu, J.F.; Wu, S.S.; Huang, M.Q.; Lin, L.G. Anti-Proliferative Activities of Terpenoids Isolated from Alisma orientalis and their Structure-Activity Relationships. Anti-Cancer Agents Med. Chem. 2015, 15, 228–235. [Google Scholar] [CrossRef]
- Jin, H.G.; Jin, Q.; Ryun Kim, A.; Choi, H.; Lee, J.H.; Kim, Y.S.; Lee, D.G.; Woo, E.R. A new triterpenoid from Alisma orientale and their antibacterial effect. Arch. Pharm. Res. 2012, 35, 1919–1926. [Google Scholar] [CrossRef] [PubMed]
- Adams, M.; Gschwind, S.; Zimmermann, S.; Kaiser, M.; Hamburger, M. Renaissance remedies: Antiplasmodial protostane triterpenoids from Alisma plantago-aquatica L. (Alismataceae). J. Ethnopharmacol. 2011, 135, 43–47. [Google Scholar] [CrossRef] [PubMed]
- Han, C.W.; Kang, E.S.; Ham, S.A.; Woo, H.J.; Lee, J.H.; Seo, H.G. Antioxidative effects of Alisma orientale extract in palmitate-induced cellular injury. Pharm. Biol. 2012, 50, 1281–1288. [Google Scholar] [CrossRef] [PubMed]
- Han, C.W.; Kwun, M.J.; Kim, K.H.; Choi, J.Y.; Oh, S.R.; Ahn, K.S.; Lee, J.H.; Joo, M. Ethanol extract of Alismatis Rhizoma reduces acute lung inflammation by suppressing nf-kappab and activating nrf2. J. Ethnopharmacol. 2013, 146, 402–410. [Google Scholar] [CrossRef] [PubMed]
- Yoshikawa, M.; Yamaguchi, S.; Chatani, N.; Nishino, Y.; Matsuoka, T.; Yamahara, J.; Murakami, N.; Matsuda, H.; Kubo, M. Crude drugs from aquatic plants. III Quantitative analysis of triterpene constituents in Alismatis Rhizoma by means of high performance liquid chromatography on the chemical change of the constituents during Alismatis Rhizoma processing. J. Pharm. Soc. Jpn. 1994, 114, 241–247. [Google Scholar]
- Luo, Z.; Zhou, A.; Zhang, C.; Zhang, M. Simultaneous determination of four alisols in Rhizoma Alismatis by RP-HPLC. China J. Chin. Mater. Med. 2010, 35, 3306–3309. [Google Scholar]
- Liu, X.; Li, S.L.; Zhou, Y.; Song, J.Z.; Zheng, Y.F.; Peng, G.P.; Xu, H.X. Characterization of protostane triterpenoids in Alisma orientalis by ultra-performance liquid chromatography coupled with quadrupole time-of-flight mass spectrometry. Rapid Commun. Mass Spectrom. 2010, 24, 1514–1522. [Google Scholar] [CrossRef] [PubMed]
- Shaw, L.H.; Chen, W.M.; Tsai, T.H. Identification of multiple ingredients for a traditional Chinese medicine preparation (bu-yang-huan-wu-tang) by liquid chromatography coupled with tandem mass spectrometry. Molecules 2013, 18, 11281–11298. [Google Scholar] [CrossRef] [PubMed]
- Julianti, T.; Oufir, M.; Hamburger, M. Quantification of the antiplasmodial alkaloid carpaine in papaya (Carica papaya) leaves. Planta Med. 2014, 80, 1138–1142. [Google Scholar] [CrossRef] [PubMed]
- Huang, M.; Zhao, H.; Xu, W.; Chu, K.; Hong, Z.; Peng, J.; Chen, L. Rapid simultaneous determination of twelve major components in pien tze huang by ultra-performance liquid chromatography coupled with triple quadrupole mass spectrometry. J. Sep. Sci. 2013, 36, 3866–3873. [Google Scholar] [CrossRef] [PubMed]
- Kanakis, P.; Termentzi, A.; Michel, T.; Gikas, E.; Halabalaki, M.; Skaltsounis, A.L. From olive drupes to olive oil. An HPLC-orbitrap-based qualitative and quantitative exploration of olive key metabolites. Planta Med. 2013, 79, 1576–1587. [Google Scholar] [CrossRef] [PubMed]
- Song, Y.X.; Liu, S.P.; Jin, Z.; Qin, J.F.; Jiang, Z.Y. Qualitative and quantitative analysis of andrographis paniculata by rapid resolution liquid chromatography/time-of-flight mass spectrometry. Molecules 2013, 18, 12192–12207. [Google Scholar] [CrossRef] [PubMed]
- Ding, J.Y.; Liu, X.X.; Xiong, D.M.; Ye, L.M.; Chao, R.B. Simultaneous determination of thirteen aminoalcohol-diterpenoid alkaloids in the lateral roots of aconitum carmichaeli by solid-phase extraction-liquid chromatography-tandem mass spectrometry. Planta Med. 2014, 80, 723–731. [Google Scholar] [CrossRef] [PubMed]
- Wang, X.; Sun, H.; Zhang, A.; Wang, P.; Han, Y. Ultra-performance liquid chromatography coupled to mass spectrometry as a sensitive and powerful technology for metabolomic studies. J. Sep. Sci. 2011, 34, 3451–3459. [Google Scholar] [CrossRef] [PubMed]
- Dong, J.; Zhu, Y.; Gao, X.; Chang, Y.; Wang, M.; Zhang, P. Qualitative and quantitative analysis of the major constituents in Chinese medicinal preparation dan-lou tablet by ultra high performance liquid chromatography/diode-array detector/quadrupole time-of-flight tandem mass spectrometry. J. Pharm. Biomed. Anal. 2013, 80, 50–62. [Google Scholar] [CrossRef] [PubMed]
- Nakajima, Y.; Satoh, Y.; Ida, Y.; Shoji, J. Terpenoids of Alisma orientale rhizome and the crude drug Alismatis Rhizoma. Phytochemistry 1994, 36, 119–127. [Google Scholar] [CrossRef]
- Fukuyama, Y.; Pei-Wu, G.; Rei, W.; Yamada, T.; Nakagawa, K. 11-deoxyalisol c and alisol d: New protostane-type triterpenoids from Alisma plantago-aquatica. Planta Med. 1988, 54, 445–447. [Google Scholar] [CrossRef] [PubMed]
- Makabel, B.; Zhao, Y.; Wang, B.; Bai, Y.; Zhang, Q.; Wu, L.; Lv, Y. Stability and structure studies on alisol a 24-acetate. Chem. Pharm. Bull. 2008, 56, 41–45. [Google Scholar] [CrossRef] [PubMed]
- Yoshikawa, M.; Yamaguchi, S.; Matsuda, H.; Tanaka, N.; Yamahara, J.; Murakami, N. Crude drugs from aquatic plants. V. On the constituents of Alismatis Rhizoma. (3). Stereostructures of water-soluble bioactive sesquiterpenes, sulfoorientalols a, b, c, and d, from Chinese Alismatis Rhizoma. Chem. Pharm. Bull. 1994, 42, 2430–2435. [Google Scholar] [CrossRef] [PubMed]
- Sample Availability: Samples of the compounds (1) 16-oxo-alisol A 23-acetate, (2) 16-oxo-alisol A 24-acetate, (3) alisol C, (4) alisol F, (5) alisol C 23-acetate, (6) alisol L, (7) alisol F 24-acetate, (8) alisol A, (9) alisol A 23-acetate, (10) alisol A 24-acetate, (11) alisol G, (12) alisol B, (13) alisol B 23-acetate, (14) 11-deoxy-alisol B, (15) 16-oxo-alisol A, (16) alisol L 23-acetate, (17) 13,17-epoxy-alisol A, (18) 16-oxo-11-anhydro-alisol A, (19) 13,17-epoxy-alisol A 24-acetate, (20) 13,17-epoxy-alisol B and 13, (21) 17-epoxy-alisol B 23-acetate, (22) Glycyrrhetinic acid are available from the authors.
© 2015 by the authors. Licensee MDPI, Basel, Switzerland. This article is an open access article distributed under the terms and conditions of the Creative Commons Attribution license ( http://creativecommons.org/licenses/by/4.0/).
Share and Cite
Zhao, W.; Huang, X.; Li, X.; Zhang, F.; Chen, S.; Ye, M.; Huang, M.; Xu, W.; Wu, S. Qualitative and Quantitative Analysis of Major Triterpenoids in Alismatis Rhizoma by High Performance Liquid Chromatography/Diode-Array Detector/Quadrupole-Time-of-Flight Mass Spectrometry and Ultra-Performance Liquid Chromatography/Triple Quadrupole Mass Spectrometry. Molecules 2015, 20, 13958-13981. https://doi.org/10.3390/molecules200813958
Zhao W, Huang X, Li X, Zhang F, Chen S, Ye M, Huang M, Xu W, Wu S. Qualitative and Quantitative Analysis of Major Triterpenoids in Alismatis Rhizoma by High Performance Liquid Chromatography/Diode-Array Detector/Quadrupole-Time-of-Flight Mass Spectrometry and Ultra-Performance Liquid Chromatography/Triple Quadrupole Mass Spectrometry. Molecules. 2015; 20(8):13958-13981. https://doi.org/10.3390/molecules200813958
Chicago/Turabian StyleZhao, Wanli, Xiaoqiang Huang, Xiaoyan Li, Fangfang Zhang, Sainan Chen, Miao Ye, Mingqing Huang, Wen Xu, and Shuisheng Wu. 2015. "Qualitative and Quantitative Analysis of Major Triterpenoids in Alismatis Rhizoma by High Performance Liquid Chromatography/Diode-Array Detector/Quadrupole-Time-of-Flight Mass Spectrometry and Ultra-Performance Liquid Chromatography/Triple Quadrupole Mass Spectrometry" Molecules 20, no. 8: 13958-13981. https://doi.org/10.3390/molecules200813958