Optimizing Ultrasonic Ellagic Acid Extraction Conditions from Infructescence of Platycarya strobilacea Using Response Surface Methodology

Abstract
:
1. Introduction
2. Results and Discussion
2.1. Statistical Analysis and Model Fitting


| No. | X1, liquid:solid ratio (mL/g) | X2, ultrasonic extraction time (min) | X3, ultrasonic extraction temperature (°C) | Y, extraction yield (%) |
|---|---|---|---|---|
| 1 | −1(15) | −1(20) | −1(50) | 0.476 |
| 2 | 1(25) | −1(20) | −1(50) | 0.883 |
| 3 | −1(15) | 1(40) | −1(50) | 0.614 |
| 4 | 1(25) | 1(40) | −1(50) | 1.081 |
| 5 | −1(15) | −1(20) | 1(70) | 1.456 |
| 6 | 1(25) | −1(20) | 1(70) | 1.877 |
| 7 | −1(15) | 1(40) | 1(70) | 1.104 |
| 8 | 1(25) | 1(40) | 1(70) | 2.046 |
| 9 | −1.68(11.59) | 0(30) | 0(60) | 0.415 |
| 10 | 1.68(28.41) | 0(30) | 0(60) | 1.252 |
| 11 | 0(20) | −1.68(13.18) | 0(60) | 1.125 |
| 12 | 0(20) | 1.68(46.82) | 0(60) | 1.803 |
| 13 | 0(20) | 0(30) | −1.68(43.18) | 0.695 |
| 14 | 0(20) | 0(30) | 1.68(76.82) | 1.896 |
| 15 | 0(20) | 0(30) | 0(60) | 1.635 |
| 16 | 0(20) | 0(30) | 0(60) | 1.599 |
| 17 | 0(20) | 0(30) | 0(60) | 1.580 |
| 18 | 0(20) | 0(30) | 0(60) | 1.590 |
| 19 | 0(20) | 0(30) | 0(60) | 1.612 |
| 20 | 0(20) | 0(30) | 0(60) | 1.625 |
| Parameter | Regression coefficient | Standard error | t Ratio | P-value |
|---|---|---|---|---|
| Linear | ||||
| x1 | 0.27 | 0.034 | 0.19 | 0.0000 |
| x2 | 0.095 | 0.034 | 0.018 | 0.0200 |
| x3 | 0.40 | 0.034 | 0.32 | 0.0000 |
| Quadratic | ||||
| x12 | −0.27 | 0.033 | −0.34 | 0.0000 |
| x22 | −0.046 | 0.033 | −0.12 | 0.1942 |
| x32 | −0.11 | 0.033 | −0.18 | 0.0099 |
| Interaction | ||||
| x1 x2 | 0.073 | 0.045 | −0.027 | 0.1359 |
| x1 x3 | 0.061 | 0.045 | −0.039 | 0.2021 |
| x2 x3 | −0.065 | 0.045 | −0.16 | 0.1780 |
| Response | Reduced response models a | Adjusted R2 | Model P value | % CV | Adequate precision |
|---|---|---|---|---|---|
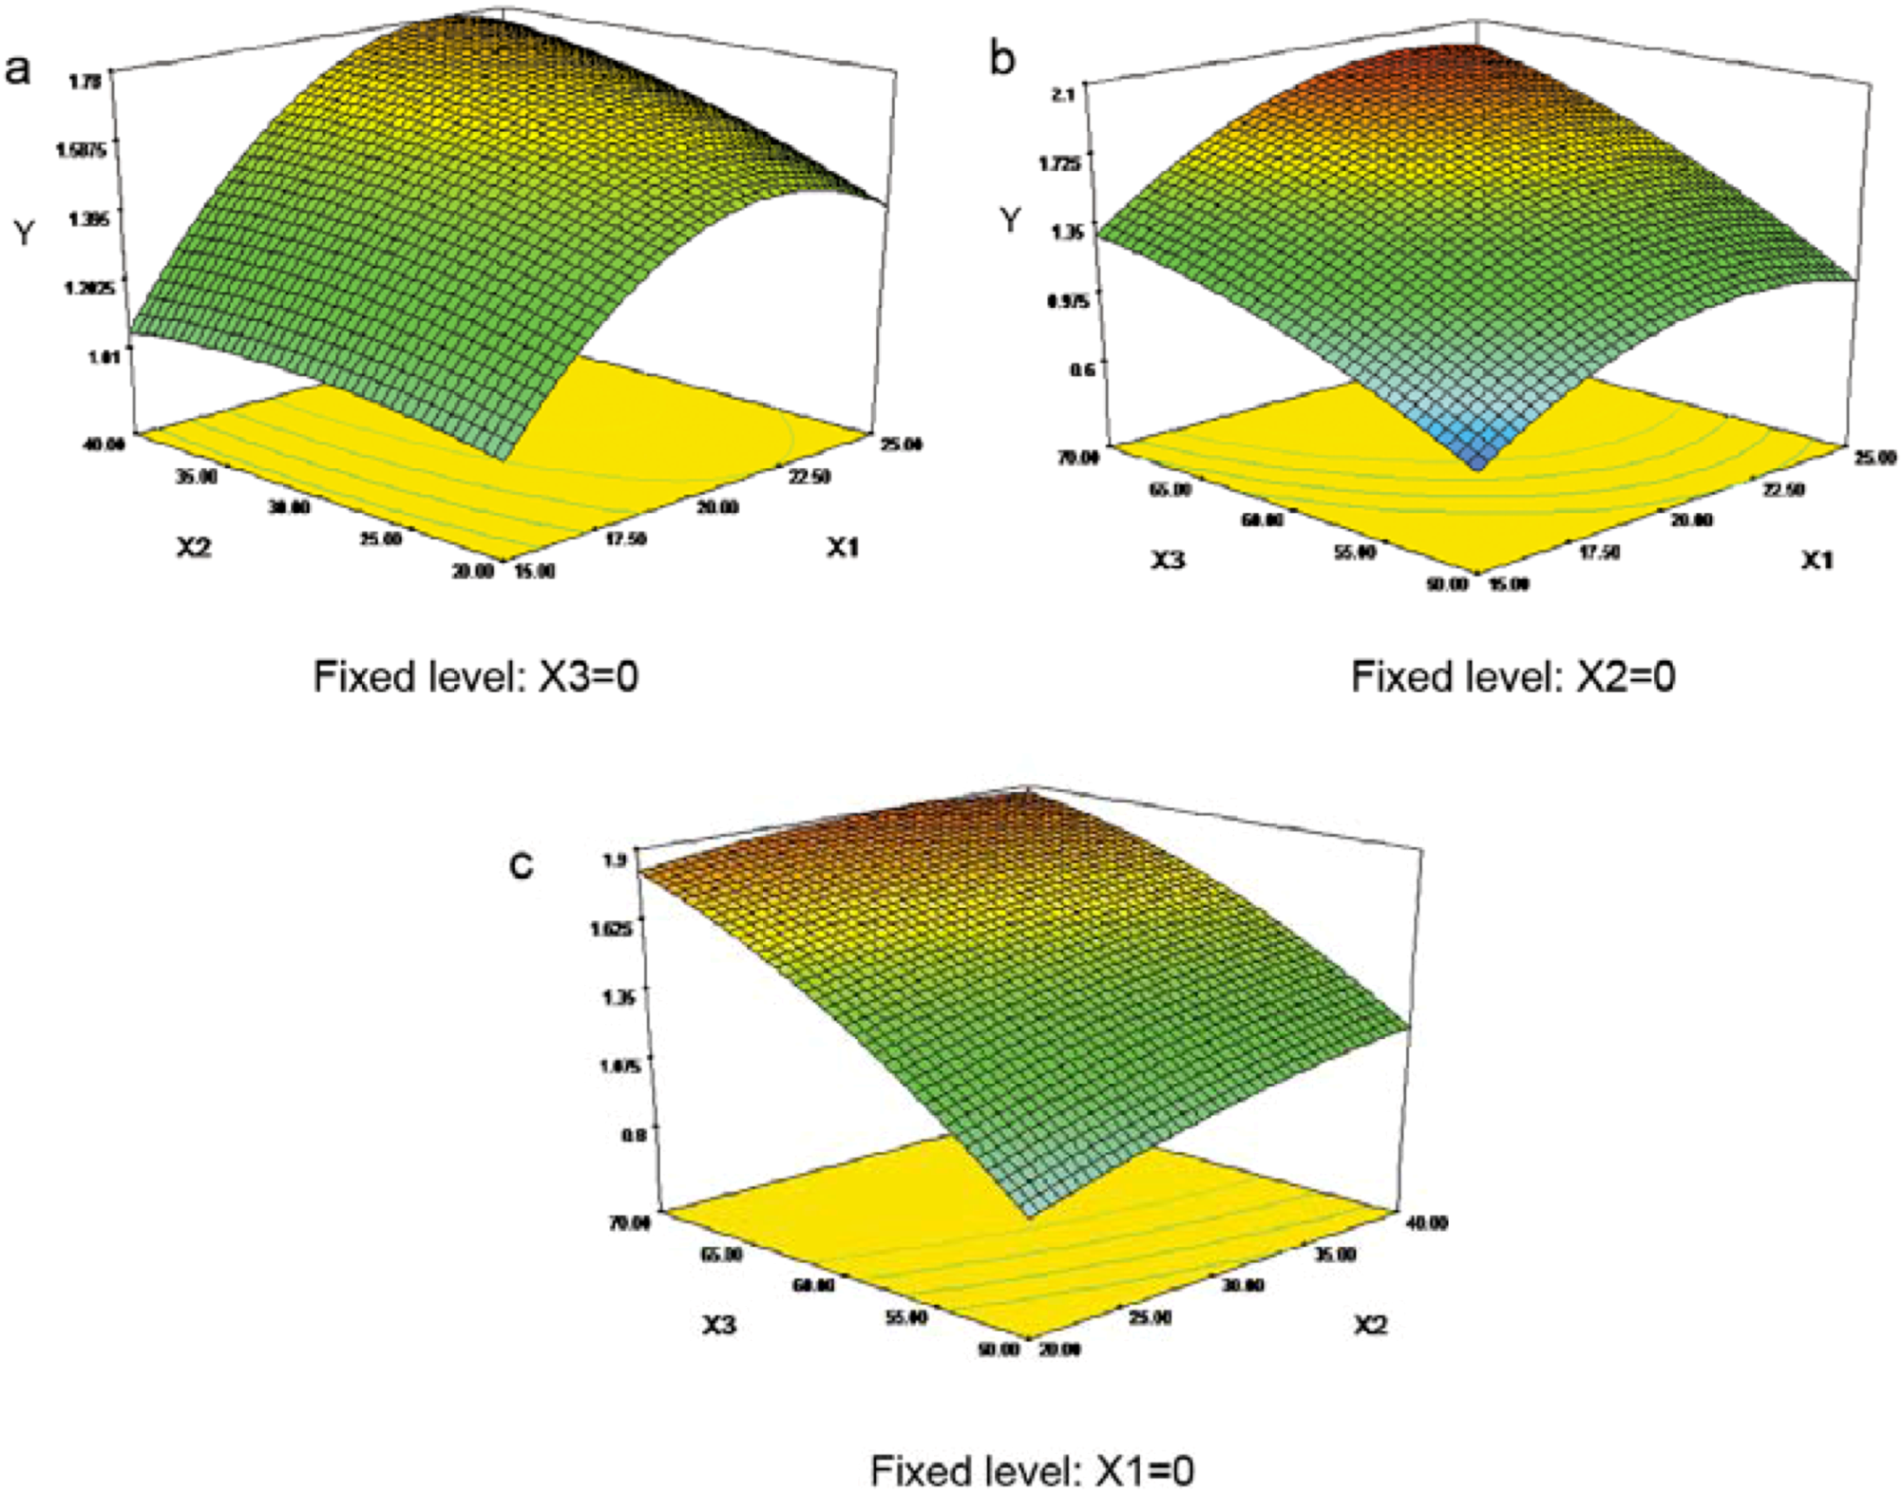
| Y | 1.57 + 0.27 x1 + 0.095x2 + 0.40x3 – 0.26x12 – 0.10x32 | 0.9137 | <0.0001 | 11.05 | 19.949 |
2.2. Optimization of EA Extraction Conditions

2.3. Verification of Predictive Model
| Optimum conditions | EA Extraction yield (%) | ||||
| Liquid:solid ratio | Ultrasonic extraction time (min) | Ultrasonic extraction temperature (°C) | Experimental | Predicted | |
| 22.5 | 40 | 70 | 1.961% | 2.028% | |
3. Experimental
3.1. Materials
3.2. Experimental Design

| Symbols | Independent variables | Coded levels | ||||
| −1.68 | −1 | 0 | +1 | +1.68 | ||
| x1 | Liquid:solid ratio (mL/g) | 11.59 | 15 | 20 | 25 | 28.41 |
| x2 | Ultrasonic extraction time (min) | 13.18 | 20 | 30 | 40 | 46.82 |
| x3 | Ultrasonic extraction temperature (℃) | 43.18 | 50 | 60 | 70 | 76.82 |
3.3. Extraction
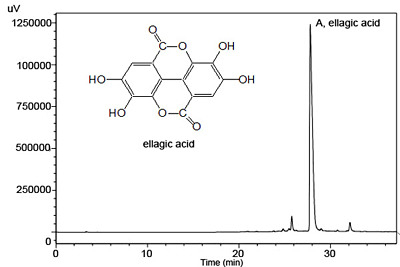
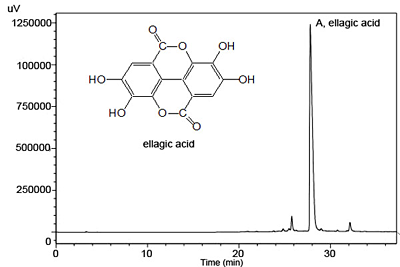
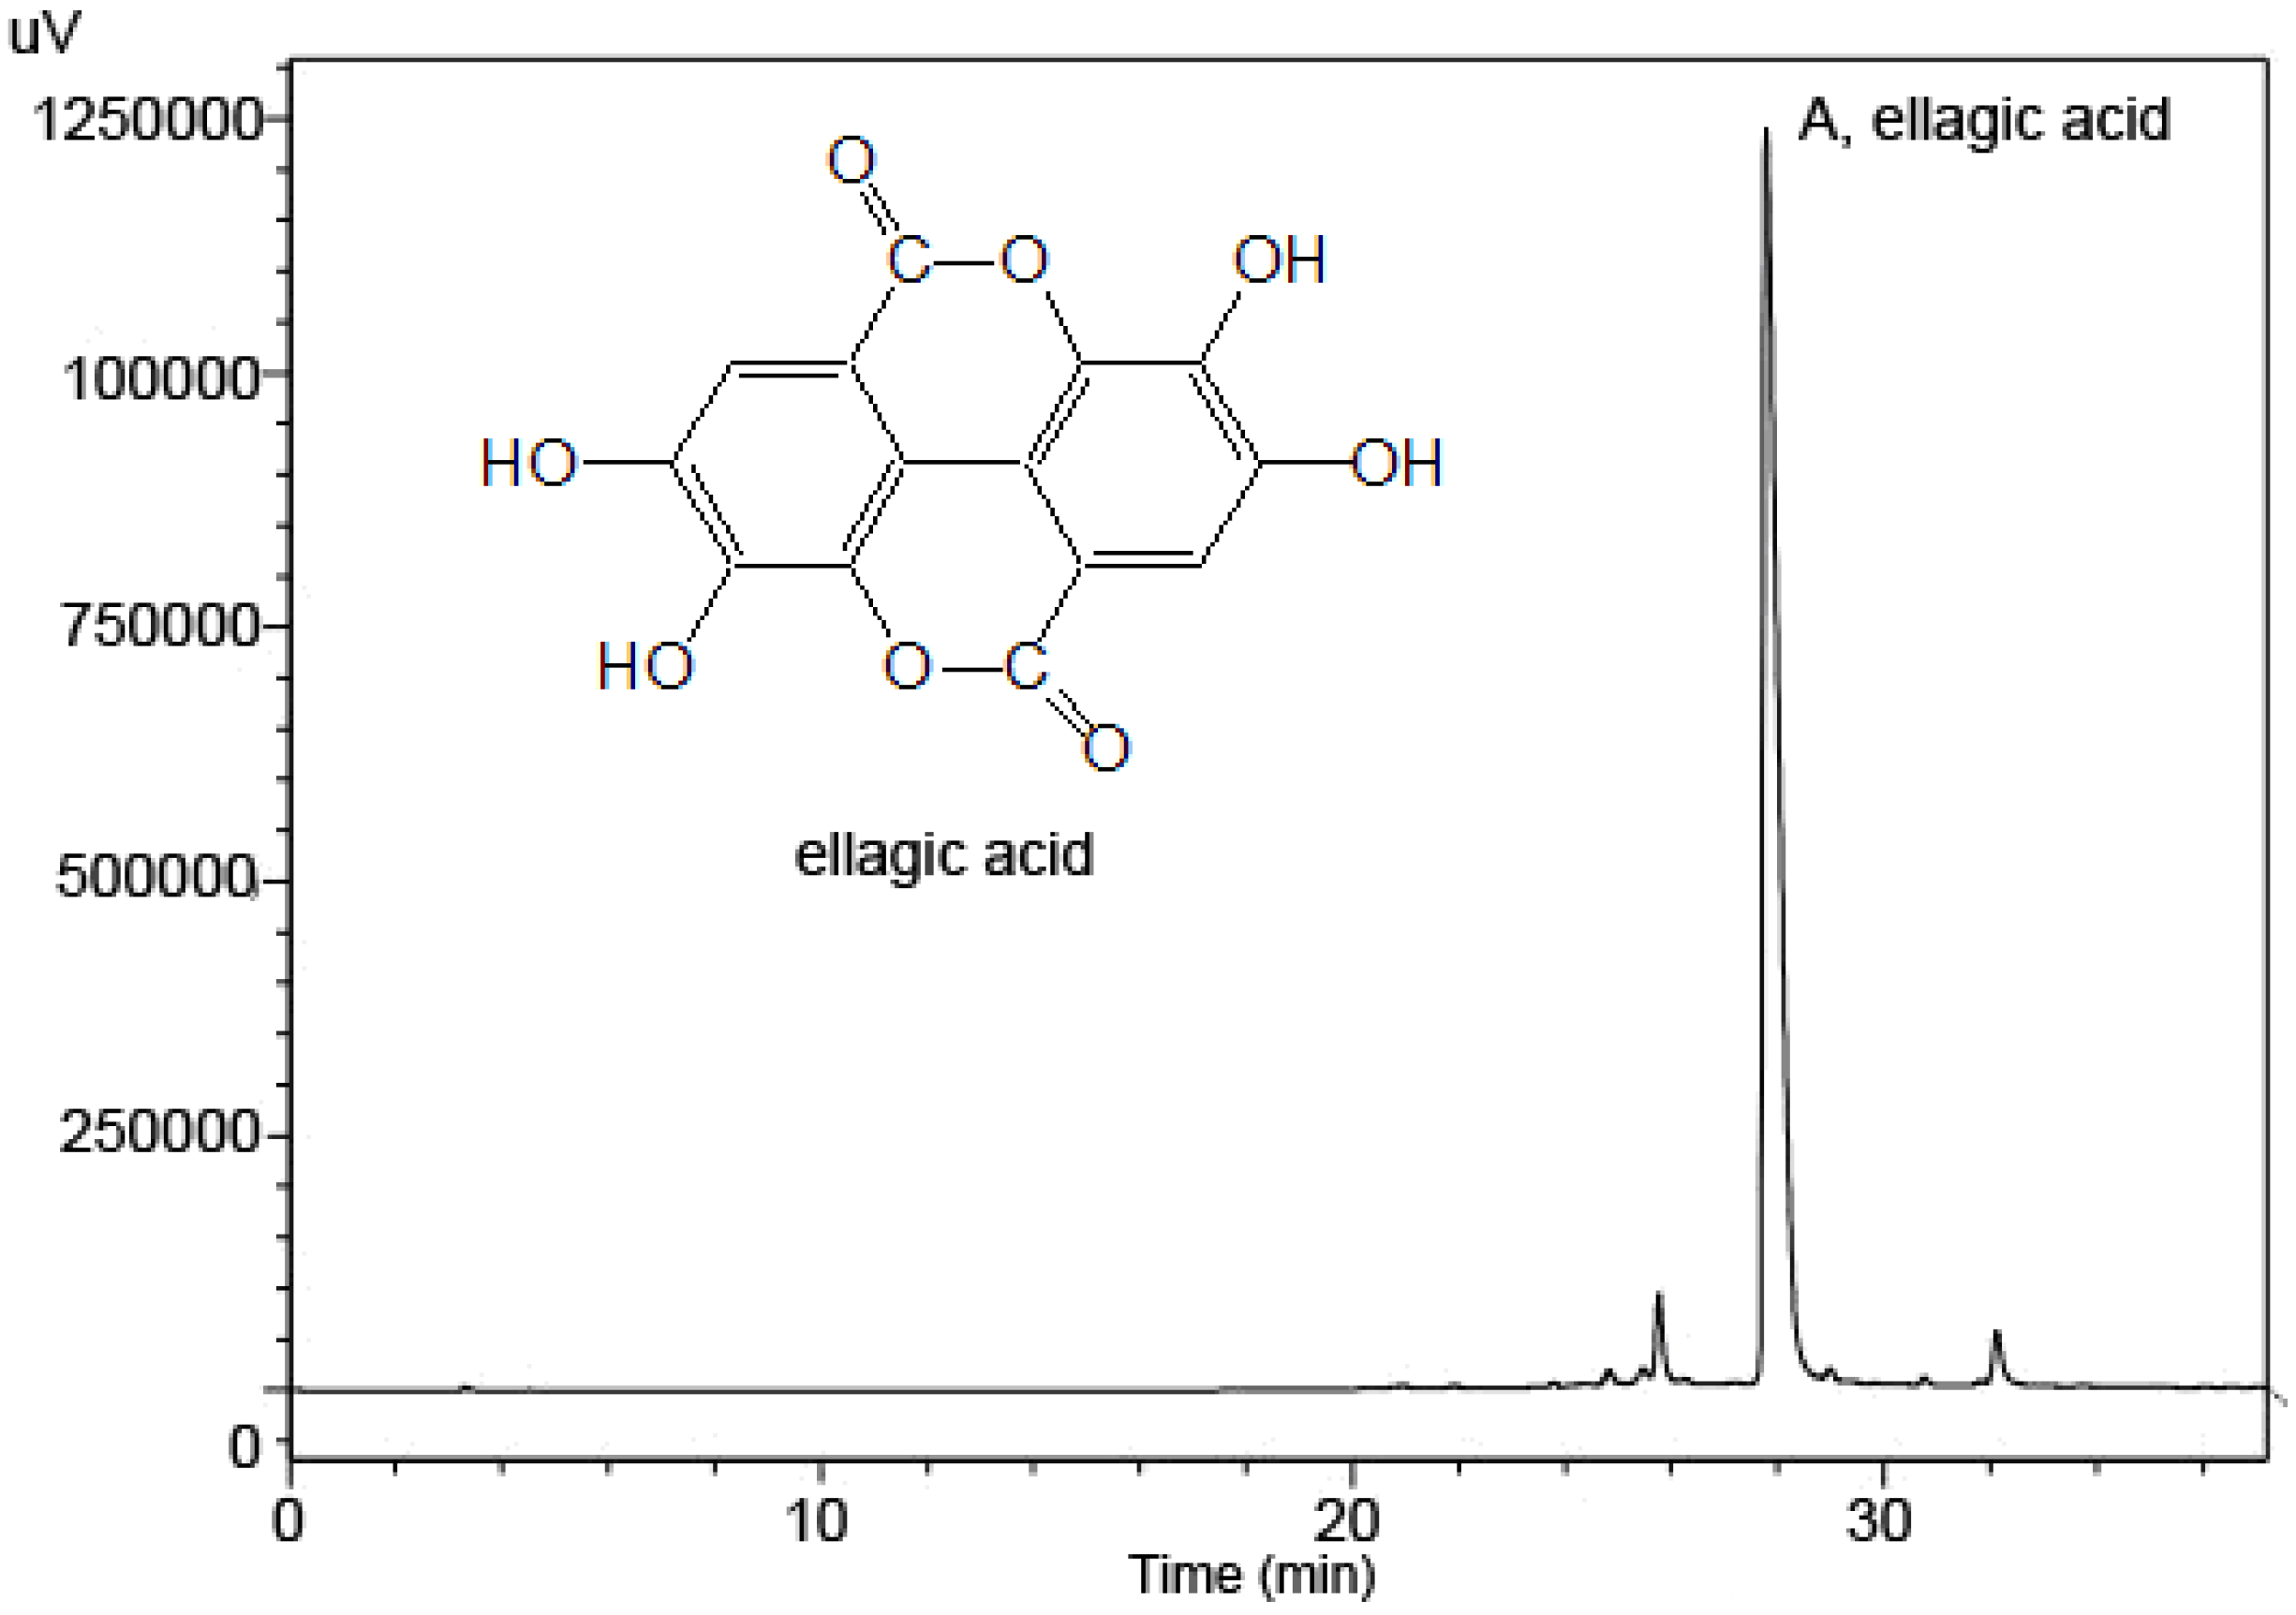
3.4. HPLC-UV Analysis
3.5. Statistical Analysis
4. Conclusions
Acknowledgements
- Sample Availability: Samples of the compounds are available from the authors.
References and Notes
- Amakura, Y.; Okada, M.; Tsuji, S.; Tonogai, Y. High performance liquid chromatographic determination with photodiode array detection of ellagic acid in fresh and processed fruits. J. Chromatogr. 2000, 896, 87–93. [Google Scholar] [CrossRef]
- Akagi, K.; Hirose, M.; Hoshiya, T.; Mizoguchi, Y.; Ito, N.; Shirai, T. Modulating effects of ellagic acid, vanillin and quercetin in a rat medium term multi-organ carcinogenesis model. Cancer Lett. 1995, 94, 113–121. [Google Scholar] [CrossRef]
- Hakkinen, S.H.; Karenlampi, S.O.; Mykkanen, H.M.; Heinonen, I.M.; Torronen, A.R. Ellagic acid content in berries: influence of domestic processing and storage. Eur. Food Res. Technol. 2000, 212, 75–80. [Google Scholar] [CrossRef]
- Rommel, A.; Wrolstad, R. Influence of acid and base hydrolysis on the phenolic composition of red raspberry juice. J. Agric. Food Chem. 1993, 41, 1237–1241. [Google Scholar] [CrossRef]
- Sigman, C.C.; Helmes, C.T.; Fay, J.R.; Lundquist, P.L.; Perry, L.R. A study of chemicals in the wood and associated industries for the selection of candidates for carcinogen bioassay, 1. Naturally-occuring wood chemicals. J. Environ. Sci. Heal. A. 1984, 19, 533–577. [Google Scholar] [CrossRef]
- Okuda, T. Systematics and health effects of chemically distinct tannins in medicinal plants. Phytochemistry 2005, 66, 2012–2031. [Google Scholar] [CrossRef]
- Lansky, E.P. Beware of pomegranates bearing 40% ellagic acid. J. Med. Food. 2006, 9, 119–122. [Google Scholar] [CrossRef]
- Bianco, M.A.; Handaji, A.; Savolainen, G. Quantitative analysis of ellagic acid in hardwood samples. Sci. Total Environ. 1999, 222, 123–126. [Google Scholar]
- Tanaka, T.; Jang, Z.H.; Kouno, J. Distribution of ellagic acid derivatives and a diarylheptanoid in wood of Platycarya strobilacea. Phytochemistry 1998, 47, 851–854. [Google Scholar] [CrossRef]
- Xu, X.; Gao, Y.X.; Liu, G.M.; Wang, Q.; Zhao, J. Optimization of supercritical carbon dioxide extraction of sea buckthorn (Hippophaë thamnoides L.) oil using response surface methodology. LWT-Food Sci. Technol. 2008, 41, 1223–1231. [Google Scholar] [CrossRef]
- Ma, T.Z.; Wang, Q.; Wu, H.W. Optimization of extraction conditions for improving solubility of peanut protein concentrates by response surface methodology. LWT-Food Sci. Technol. 2010, 43, 1450–1455. [Google Scholar] [CrossRef]
- Myers, R.H.; Montgomery, D.C. Response Surface Methodology: Process and Product Optimization Using Designed Experiments, 1st ed; Wiley, Inc.: New York, NY, USA, 1995. [Google Scholar]
- Liyana-Pathirana, C.; Shahidi, F. Optimization of extraction of phenolic compounds from wheat using surface response methodology. Food Chem. 2005, 93, 47–56. [Google Scholar] [CrossRef]
- Li, Q.H.; Fu, C.L. Application of response surface methodology for extraction optimization of germinant pumpkin seeds protein. Food Chem. 2005, 92, 701–706. [Google Scholar] [CrossRef]
- Montgomery, D.C. Design and Analysis of Experiments, 2nd ed; Wiley: New York, NY, USA, 1997; pp. 43–80. [Google Scholar]
- Muralidhar, R.V.; Chirumamil, R.R.; Marchant, R.; Nigam, P. A response surface approach for the comparison of lipase production by Candida cylindracea using two different carbon sources. Biochem. Eng. J. 2001, 9, 17–23. [Google Scholar] [CrossRef]
- Sun, Y.X.; Liu, J.C.; Kennedy, J.F. Application of response surface methodology for optimization of polysaccharides production parameters from the roots of Codonopsis pilosula by a central composite design. Carbohyd. Polym. 2010, 80, 949–953. [Google Scholar] [CrossRef]
- Yang, B.; Liu, X.; Gao, Y.X. Extraction optimization of bioactive compounds (crocin, geniposide and total phenolic compounds) from Gardenia (Gardenia jasminoides Ellis) fruits with response surface methodology. Innov. Food Sci. Emerg. 2009, 10, 610–615. [Google Scholar] [CrossRef]
- Ballard, T.S.; Mallikarjunan, P.; Zhou, K.Q.; O′Keefe, S. Microwave-assisted extraction of phenolic antioxidant compounds from peanut skins. Food Chem. 2010, 120, 1185–1192. [Google Scholar] [CrossRef]
© 2010 by the authors; licensee MDPI, Basel, Switzerland. This article is an open access article distributed under the terms and conditions of the Creative Commons Attribution license (http://creativecommons.org/licenses/by/3.0/).
Share and Cite
Zhang, L.-L.; Xu, M.; Wang, Y.-M.; Wu, D.-M.; Chen, J.-H. Optimizing Ultrasonic Ellagic Acid Extraction Conditions from Infructescence of Platycarya strobilacea Using Response Surface Methodology. Molecules 2010, 15, 7923-7932. https://doi.org/10.3390/molecules15117923
Zhang L-L, Xu M, Wang Y-M, Wu D-M, Chen J-H. Optimizing Ultrasonic Ellagic Acid Extraction Conditions from Infructescence of Platycarya strobilacea Using Response Surface Methodology. Molecules. 2010; 15(11):7923-7932. https://doi.org/10.3390/molecules15117923
Chicago/Turabian StyleZhang, Liang-Liang, Man Xu, Yong-Mei Wang, Dong-Mei Wu, and Jia-Hong Chen. 2010. "Optimizing Ultrasonic Ellagic Acid Extraction Conditions from Infructescence of Platycarya strobilacea Using Response Surface Methodology" Molecules 15, no. 11: 7923-7932. https://doi.org/10.3390/molecules15117923