Copper-Arsenic Nanoparticles in Hematite: Fingerprinting Fluid-Mineral Interaction
by
 , , and
Max R. Verdugo-Ihl
1,* ,
,
Cristiana L. Ciobanu
1,
Ashley Slattery
2,
Nigel J. Cook
1,
Kathy Ehrig
3 and
Liam Courtney-Davies
1 1
School of Chemical Engineering and Advanced Materials, The University of Adelaide, Adelaide, SA 5005, Australia
2
Adelaide Microscopy, The University of Adelaide, Adelaide, SA 5005, Australia
3
BHP Olympic Dam, Adelaide, SA 5000, Australia
*
Author to whom correspondence should be addressed.
Minerals 2019, 9(7), 388; https://doi.org/10.3390/min9070388
Submission received: 2 June 2019
/
Revised: 20 June 2019
/
Accepted: 25 June 2019
/
Published: 27 June 2019
(This article belongs to the Special Issue Minerals Down to the Nanoscale: A Glimpse at Ore-Forming Processes)
Abstract
:Metal nanoparticles (NP) in minerals are an emerging field of research. Development of advanced analytical techniques such as Z-contrast imaging and mapping using high-angle annular dark field scanning transmission electron microscopy (HAADF STEM) allows unparalleled insights at the nanoscale. Moreover, the technique provides a link between micron-scale textures and chemical patterns if the sample is extracted in situ from a location of petrogenetic interest. Here we use HAADF STEM imaging and energy-dispersive X-ray spectrometry (EDX) mapping/spot analysis on focused ion beam prepared foils to characterise atypical Cu-As-zoned and weave-twinned hematite from the Olympic Dam deposit, South Australia. We aim to determine the role of solid-solution versus the presence of discrete included NPs in the observed zoning and to understand Cu-As-enrichment processes. Relative to the grain surface, the Cu-As bands extend in depth as (sub)vertical trails of opposite orientation, with Si-bearing hematite NP inclusions on one side and coarser cavities (up to hundreds of nm) on the other. The latter host Cu and Cu-As NPs, contain mappable K, Cl, and C, and display internal voids with rounded morphologies. Aside from STEM-EDX mapping, the agglomeration of native copper NPs was also assessed by high-resolution imaging. Collectively, such characteristics, corroborated with the geometrical outlines and negative crystal shapes of the cavities, infer that these are opened fluid inclusions with NPs attached to inclusion walls. Hematite along the trails features distinct nanoscale domains with lattice defects (twins, 2-fold superstructuring) relative to hematite outside the trails, indicating this is a nanoprecipitate formed during replacement processes, i.e., coupled dissolution and reprecipitation reactions (CDRR). Transient porosity intrinsically developed during CDRR can trap fluids and metals. Needle-shaped and platelet Cu-As NPs are also observed along (sub)horizontal bands along which Si, Al and K is traceable along the margins. The same signature is depicted along nm-wide planes crosscutting at 60° and offsetting (012)-twins in weave-twinned hematite. High-resolution imaging shows linear and planar defects, kink deformation along the twin planes, misorientation and lattice dilation around duplexes of Si-Al-K-planes. Such defects are evidence of strain, induced during fluid percolation along channels that become wider and host sericite platelets, as well as Cl-K-bearing inclusions, comparable with those from the Cu-As-zoned hematite, although without metal NPs. The Cu-As-bands mapped in hematite correspond to discrete NPs formed during interaction with fluids that changed in composition from alkali-silicic to Cl- and metal-bearing brines, and to fluid rates that evolved from slow infiltration to erratic inflow controlled by fault-valve mechanism pumping. This explains the presence of Cu-As NPs hosted either along Si-Al-K-planes (fluid supersaturation), or in fluid inclusions (phase separation during depressurisation) as well as the common signatures observed in hematite with variable degrees of fluid-mineral interaction. The invoked fluids are typical of hydrolytic alteration and the fluid pumping mechanism is feasible via fault (re)activation. Using a nanoscale approach, we show that fluid-mineral interaction can be fingerprinted at the (atomic) scale at which element exchange occurs.
1. Introduction
The abundance and potential significance of nanoparticles in rocks and ores is gaining recognition, as analytical capabilities expand, allowing detailed characterisation of their physical states and quantification of their chemical compositions. Nanoparticulate phases may have geochemical behaviour that differs significantly from that of their larger mineral analogues due to far greater surface area relative to mass (e.g., [1]). Metal-bearing nanoparticles (NPs) hosted within minerals, particularly sulphides, have drawn research attention because of their potential economic significance and because they can represent evidence in support of petrogenetic models. Among the best studied examples is nanoparticulate “invisible gold” within arsenian pyrite, or arsenopyrite. Inferences for the presence of discrete Au NPs, alongside lattice-bound (solid solution) gold within arsenian pyrite were validated for the first time by direct imaging of high-As (thousands ppm) pyrite using transmission electron microscopy (TEM) [2]. This type of observation has been used in combination with trace element data to determine an empirical solubility limit for structurally-bound Au in pyrite as a function of increasing As-content [3]. Gold NPs have recently been identified in hydrothermal fluids, suggesting that gold transport may occur in both dissolved (complexed) and particulate form [4]. The identification of nanoparticulate platinum group element (PGE)-minerals has been used to discuss PGE enrichment and ore-forming processes in layered-intrusions (e.g., [5,6,7]).
Breaking the paradigm of invisible gold in As-bearing pyrite, an alternative mechanism was put forward [8], which could explain the formation of Au NPs. Ciobanu et al. [8] invoked devolatilization processes resulting in precipitation of Au-telluride NPs within As-free pyrite during fluid-rock interaction. Such a process was considered to occur via a coupled dissolution and reprecipitation reaction (CDRR), during which transient porosity develops, explaining the persistent presence of pores wherever NPs were observed. The pore-attached NPs were interpreted as the “frozen expression” of fluid inclusions. Comparable CDRR processes were invoked to explain the presence of composite, pore-attached nanoparticulate clausthalite (PbSe) and Bi-bearing phases within chalcopyrite [9]. In this case, the Se was already present in solid solution within the Cu-Fe-sulphide and Pb (from U-decay) was supplied by an interacting hydrothermal fluid, accounting for NP precipitation. The role of transient porosity in trapping metals has been validated by experimental work supporting the “Bi-Au collector” model [10]. Gold scavenged by a Bi-melt is precipitated from hydrothermal fluids and incorporated in pores along the reaction interface as Bi-Au NPs/fine particles. Experimental work demonstrating the development of CDRR shows that rapid closure of external porosity, due to ripening of the pores, can effectively trap fluids, including low-T melts, as fluid inclusions and/or mineral precipitates during CDRR [11].
In comparison with sulphides, relatively little is known about the presence of NPs in Fe-oxides. Nanoscale studies of NPs in magnetite (e.g., [12,13,14]) have been used to identify conditions of ore-formation. In contrast, the potential constraints that could be obtained from NPs in hematite remain largely unexplored. The formation of uraninite NPs associated with pores in hematite has previously been attributed to CDRR processes [15], with the U locally sourced from U-rich domains in the precursor, overprinted hematite.
Quantitative compositional data obtained by laser-ablation inductively-coupled-plasma mass-spectrometry (LA-ICP-MS) may only represent bulk, volume-averaged results whenever the mineral in question is heterogeneous down to the nanoscale, a phenomenon that may impact on accurate petrogenetic interpretations [16]. An adequate understanding of the distribution and speciation of trace elements (i.e., within solid-solution or as discrete phases) can often only be achieved by systematic studies using a combination of microanalytical techniques with different scales of observation [15,17,18]. High-resolution imaging using Z-contrast techniques, such as high-angle annular dark-field (HAADF) scanning transmission electron microscopy (STEM) on material extracted in-situ from the surface of a polished specimen, using a focused ion beam (FIB) scanning electron microscope (SEM) platform, has proven particularly valuable for correct interpretation of micron-scale geochemical data [17,19,20,21]. TEM methods can also be used to resolve and image sub-micrometre-size fluid inclusions [22], making the technique valuable for understanding complex trace element signatures associated with their presence, although they are limited to what remains of the fluid inclusions after TEM-sample preparation.
The sample selected for this study originates from the iron oxide Cu-Au (IOCG) system at the Olympic Dam deposit, South Australia [23]. The deposit is hosted within a breccia complex, confined to the Mesoproterozoic Roxby Downs Granite. Discovery of hematite containing lattice-bound U and radiogenic Pb and displaying oscillatory zoning patterns allowed U-Pb dating using LA-ICP-MS, providing geologically meaningful ages [24]. Subsequent high-precision U-Pb ID-TIMS dating of hematite (1592.1 ± 0.88 Ma; [25]) indicates that mineralisation occurred shortly after granite emplacement (U-Pb zircon age 1593.87 ± 0.21 Ma; [26]).
The oscillatory zoned hematite is present throughout the entire Olympic Dam deposit, with zonation patterns defined by the element association U-(Pb)-W-Sn-Mo [27]. Moreover, such hematite displays a variety of textures, including varied twinning patterns and overprints. Among the latter, pseudomorphic replacement of oscillatory zoned hematite by another hematite with a distinct, different trace element signature can show a “new” zoning arrangement that can partially overlap pre-existing patterns or may display evidence of selective removal of some pre-existing elements [27]. The present study is carried out on a representative sample displaying such an overprint, in which compositional maps obtained by LA-ICP-MS depict spatially overlapping grain-scale zonation patterns in hematite expressed by U-W-Sn-Mo, superimposed by Cu, As and Sb [27]. Hematite from this sample is also characterised by unusual weave-twinning, such as those described as basket-weave twins in volcaniclastic breccias at the Olympic Dam deposit [27].
Although naturally-occurring end-member Cu-Fe-oxides (e.g., cuprospinel, CuFe2O4; [28]) are relatively scarce, limited Cu2+ substitution in octahedral coordination is considered for both magnetite and hematite. Copper incorporation into hematite, however, has only been documented from experimental studies of hematite nanostructures (e.g., [29]). Incorporation of Sb (and As) into hematite can be inferred by the existence of rhombohedral, ilmenite-type oxides (e.g., melanostibite: Mn2+(Sb0.55+Fe0.53+)O3; [30]) that could build limited solid-solution with hematite, although charge-balance would require substituting divalent cations (e.g., Fe2+).
In this context, the sample studied here represents an ideal opportunity to test whether Cu, As (and Sb) incorporation in natural hematite specimens could be explained by substitution, or if these elements occur as discrete phases. We therefore assess the incorporation of Cu, and As in hematite down to the nanoscale to determine the role of solid-solution versus the presence of discrete inclusions (NPs). Secondly, we aim to understand the processes involved in the Cu-As-enrichment of hematite.
2. Samples and Methodology
The studied hematite derives from a sulphide-poor interval in the south-eastern part of the Olympic Dam deposit. This interval comprises a hematite breccia containing clasts of volcanic rocks and is notable for the presence of a diverse range of trace minerals including native copper, Cu-Au-alloys, electrum, and Pb-Bi-tellurides [31]. The grains studied are derived from a single polished block in which oscillatory zoned, U-W-Sn-Mo-bearing hematite shows two conspicuous features: (i) unusual zoning with respect to Cu and As (Figure 1); and (ii) weave-twinning patterns (Figure 2).
Four TEM-foils were extracted using established dual-beam FIB-SEM methods [16] using a FEI Helios Nanolab 600 instrument (FEI, Hillsboro, OR, USA). Three foils (foils #1, #2 and #3) were cut across the Cu-As bands from both sides of the grain (domain A and B; Figure 1b), whereas a fourth (foil #4) was cut across the weave-twining pattern in another hematite grain (Figure 2). HAADF STEM imaging and energy-dispersive X-ray spectrometry (EDX) spot analysis and mapping were conducted with an ultra-high resolution, probe corrected, FEI Titan Themis STEM (FEI, Hillsboro, OR, USA) operated at 200 kV. This instrument is equipped with a X-FEG Schottky source and Super-X EDX geometry. The Super-X EDX detector provides geometrically symmetric EDX detection with an effective solid angle of 0.8 Sr. Probe correction delivered sub-Ångstrom spatial resolution and an inner collection angle greater than 50 mrad was used for HAADF imaging with a Fischione detector.
Indexing of diffraction patterns obtained from Fast-Fourier-Transformed (FFT) images was conducted with WinWulff© (version 1.5.2) and publicly available data from the American Mineralogist Crystal Structure Database (http://rruff.geo.arizona.edu/AMS/amcsd.php). Crystal structure models were generated in CrystalMaker® (version 10.2) and STEM for xHREMTM Version 4.1 software. All instruments are housed at Adelaide Microscopy, The University of Adelaide. Complete STEM EDX maps and additional figures are shown as Supplementary Materials Figures S1–S7.
3. Results
3.1. Nanoscale Characterisation of Cu-As Zoned and Weave-Twinned Hematite
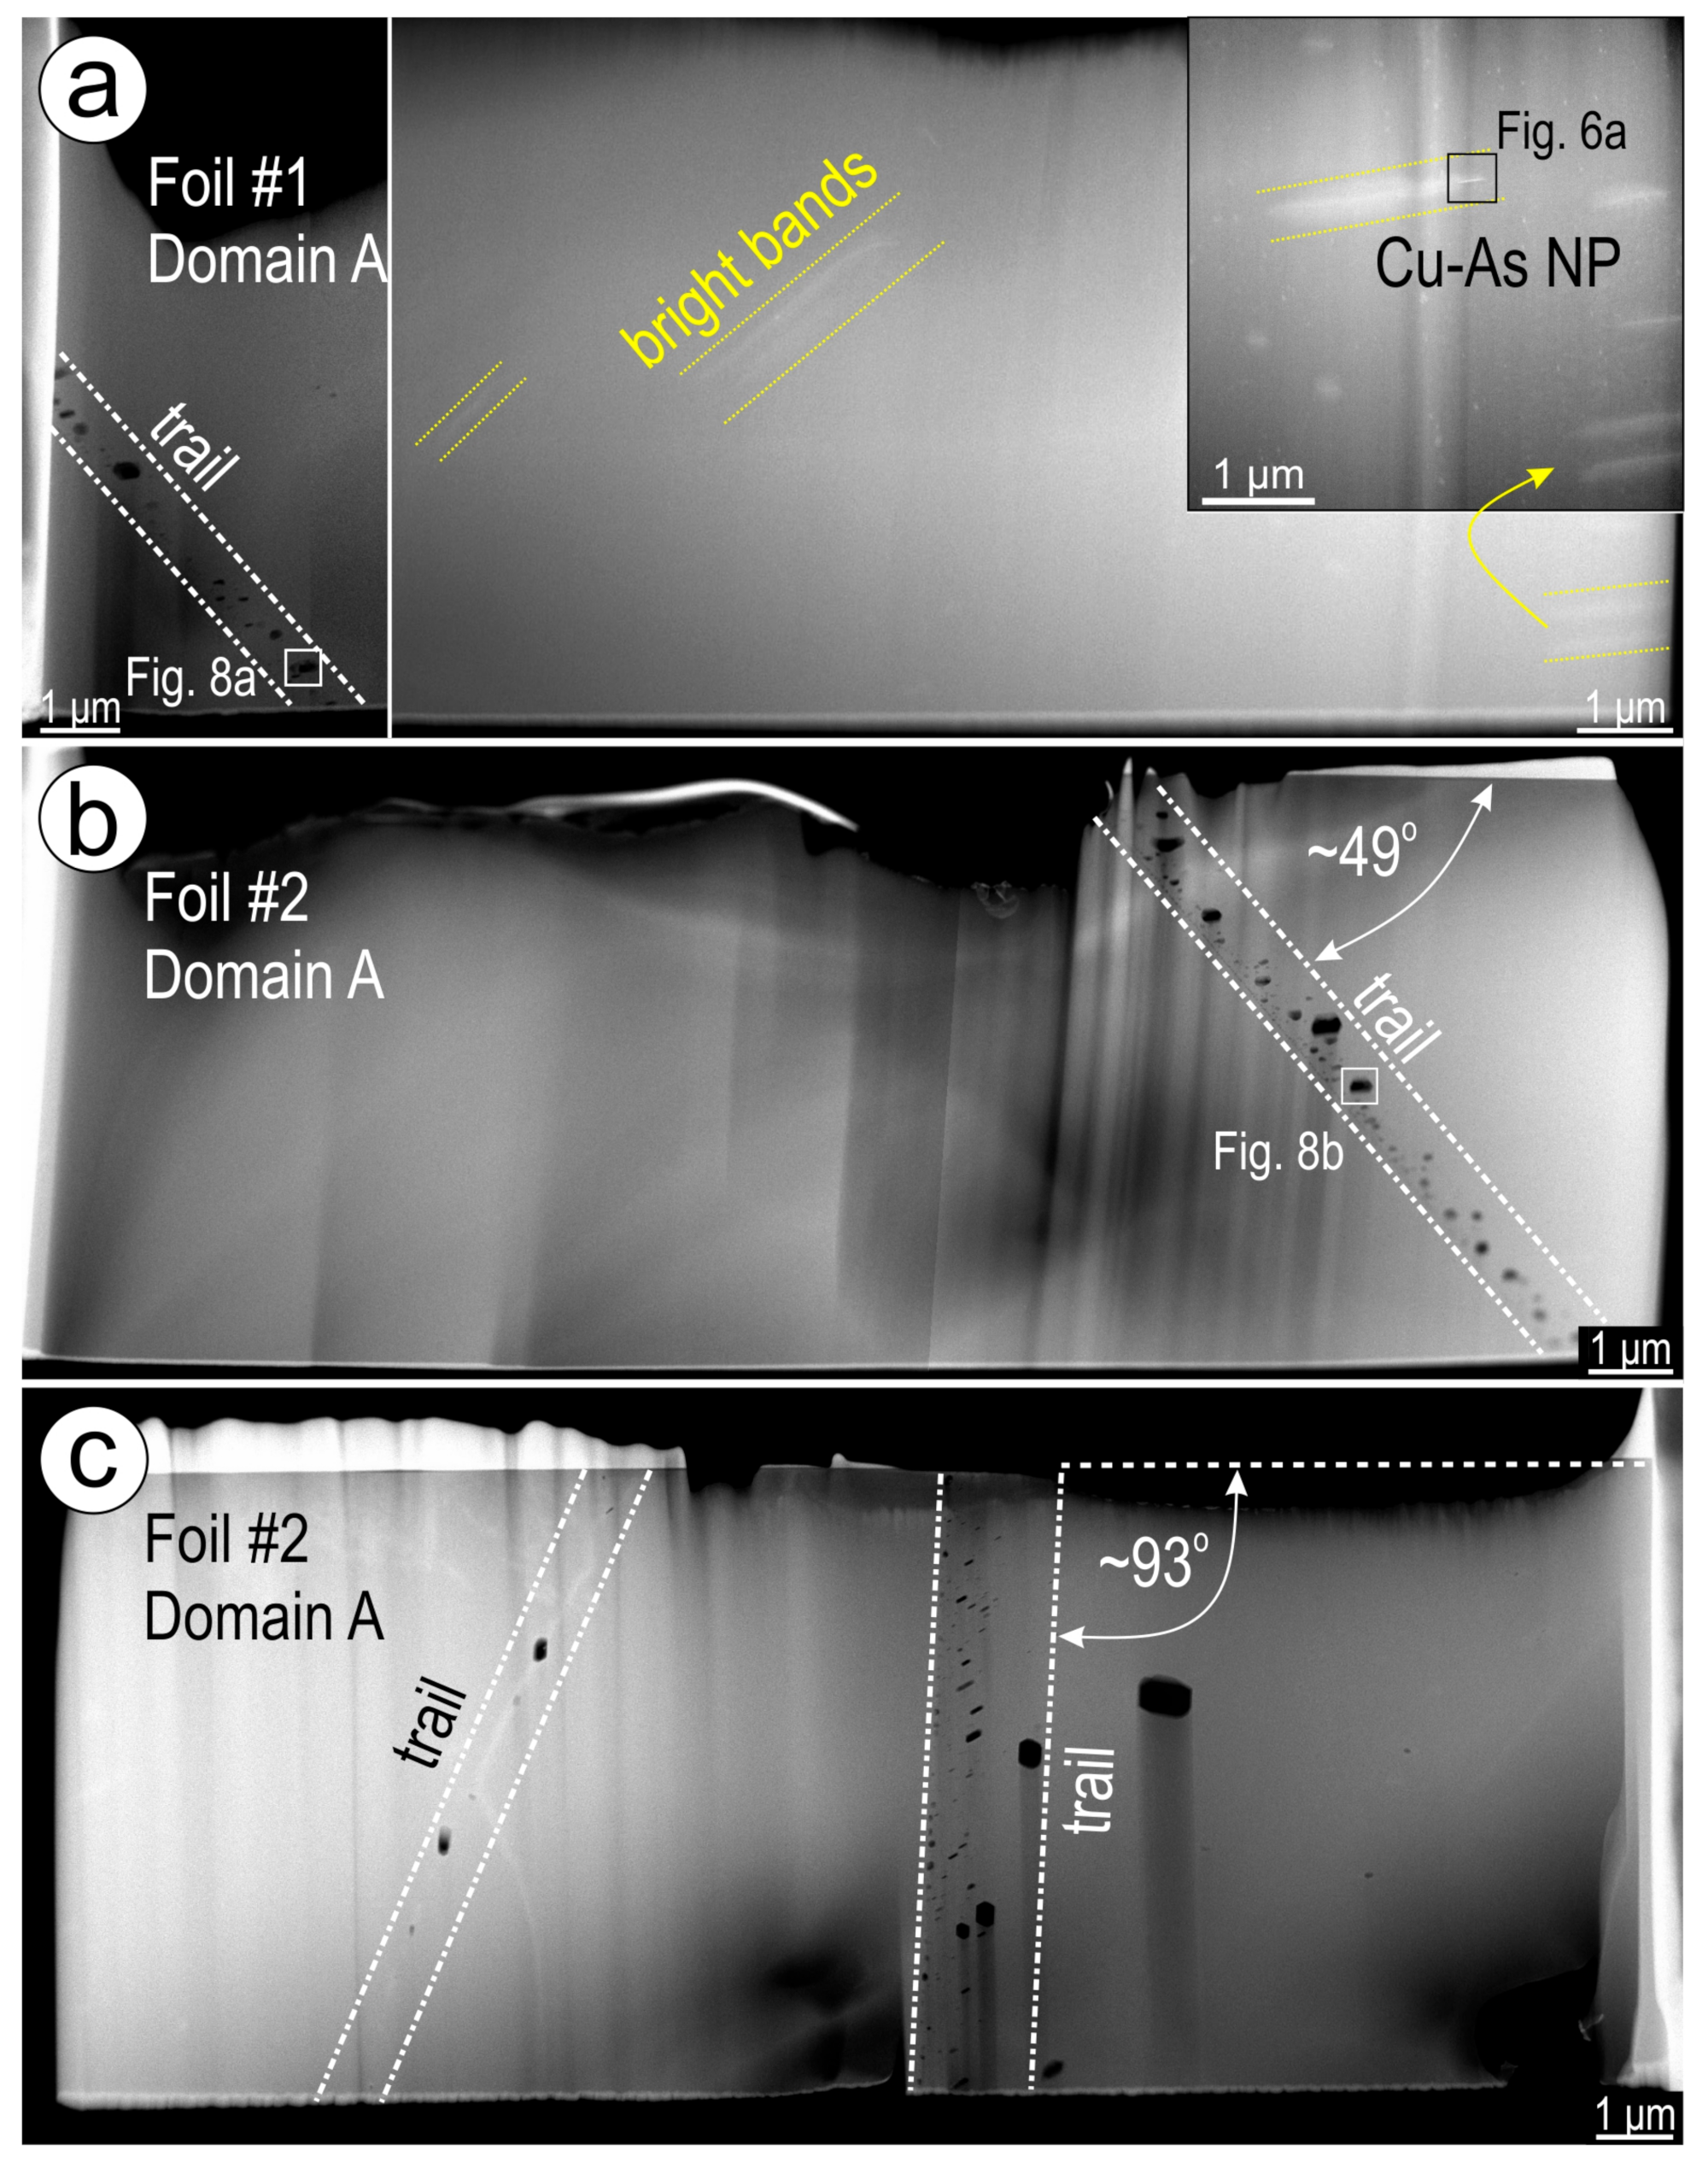
HAADF STEM imaging of the three foils from the zoned Cu-As hematite shows oriented trails tens of microns in length consisting of darker inclusions and cavities (Figure 3 and Figure 4). Domain A also displays brighter bands (up to ~300 nm in width and ~2–3 µm in length) with variable orientations relative to the trails (Figure 3a).
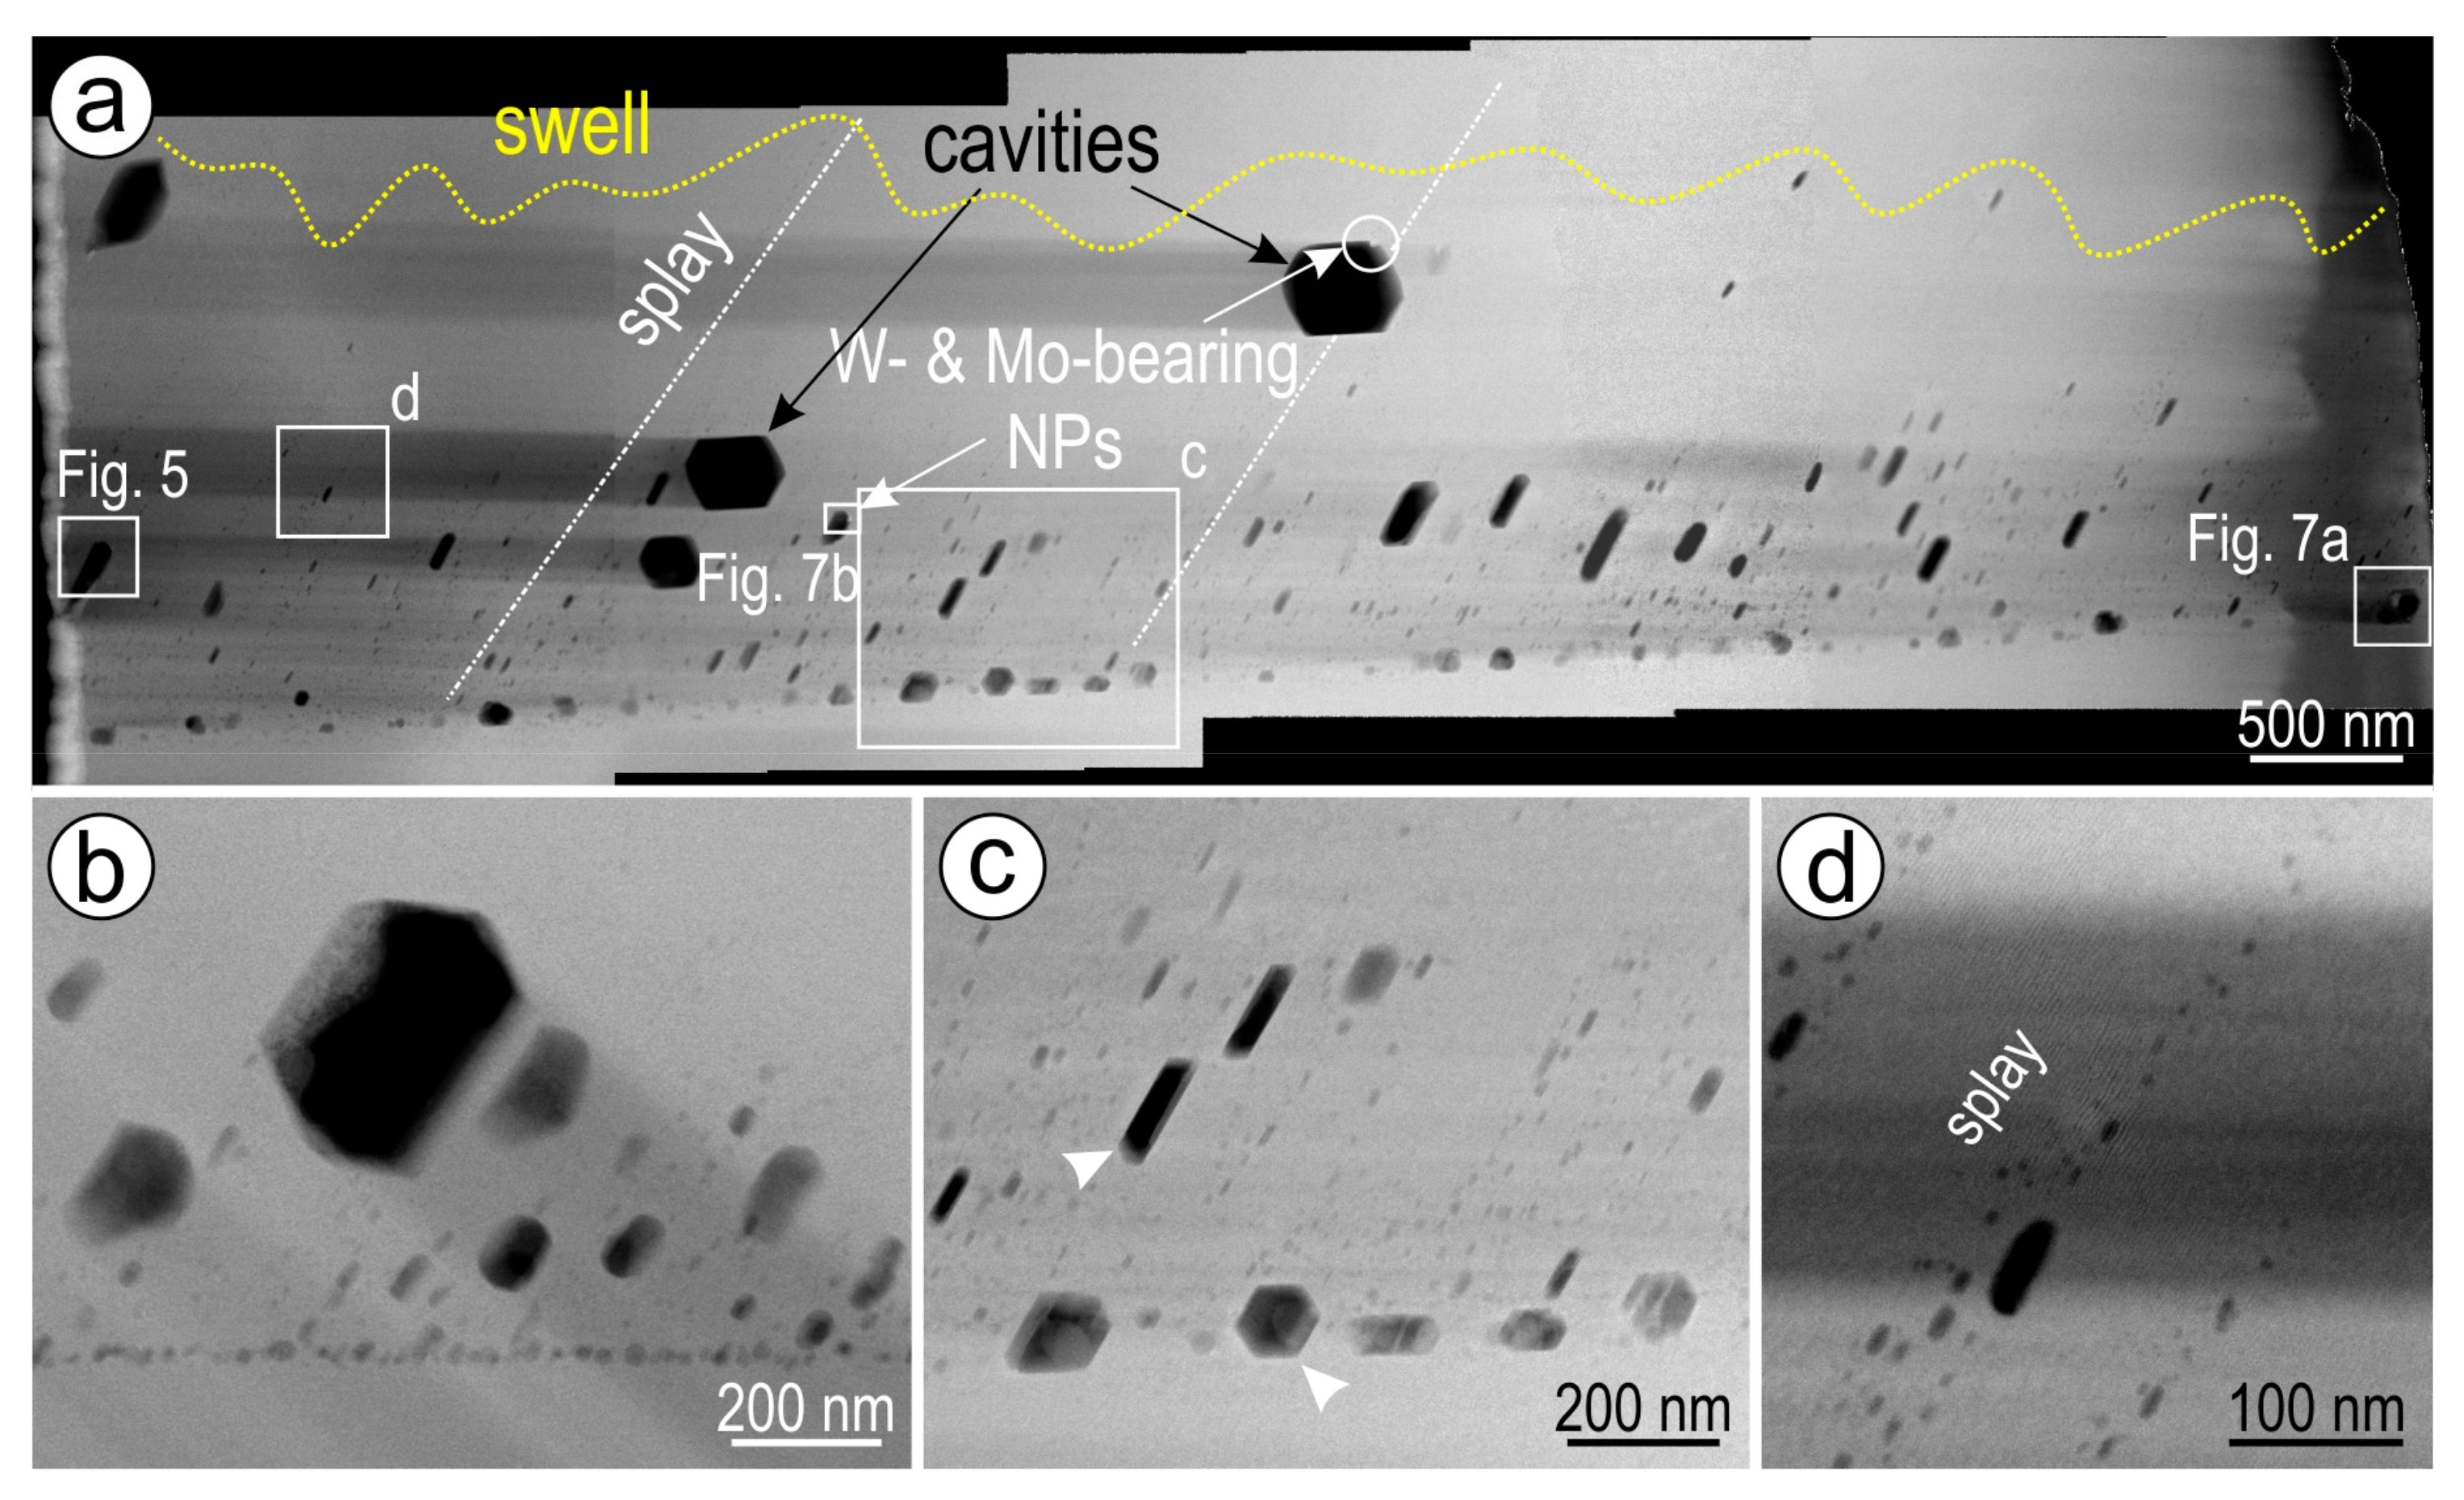
Orientation of trails is at ~50–60° relative to the surface in both domains, but subvertical trails are also observed in domain B (Figure 3c). This indicates that the banding with respect to Cu and As on the surface of the grain changes both inwards and outwards with depth relative to the grain core (Figure 1b). The trails are densely populated, but the distribution of inclusions and cavities is asymmetric (Figure 4). The smallest inclusions can form linear arrays along one side of the trail, whereas a diverse range of inclusions and cavities, from NPs (<50 nm) to fine particles >300 nm in size, occur on the other side, in some cases organised along linear splays (Figure 4b–d). The smallest inclusions are nanoparticles of Si-(Al-K)-Cl-bearing hematite (?), hereafter termed NPSi-Hm (Figure 5a–c). The coarsest cavities display relatively well-defined, geometrical, negative crystal outlines featuring walls towards rounded voids (Figure 5d,e). Such cavities are surrounded by NPSi-Hm.
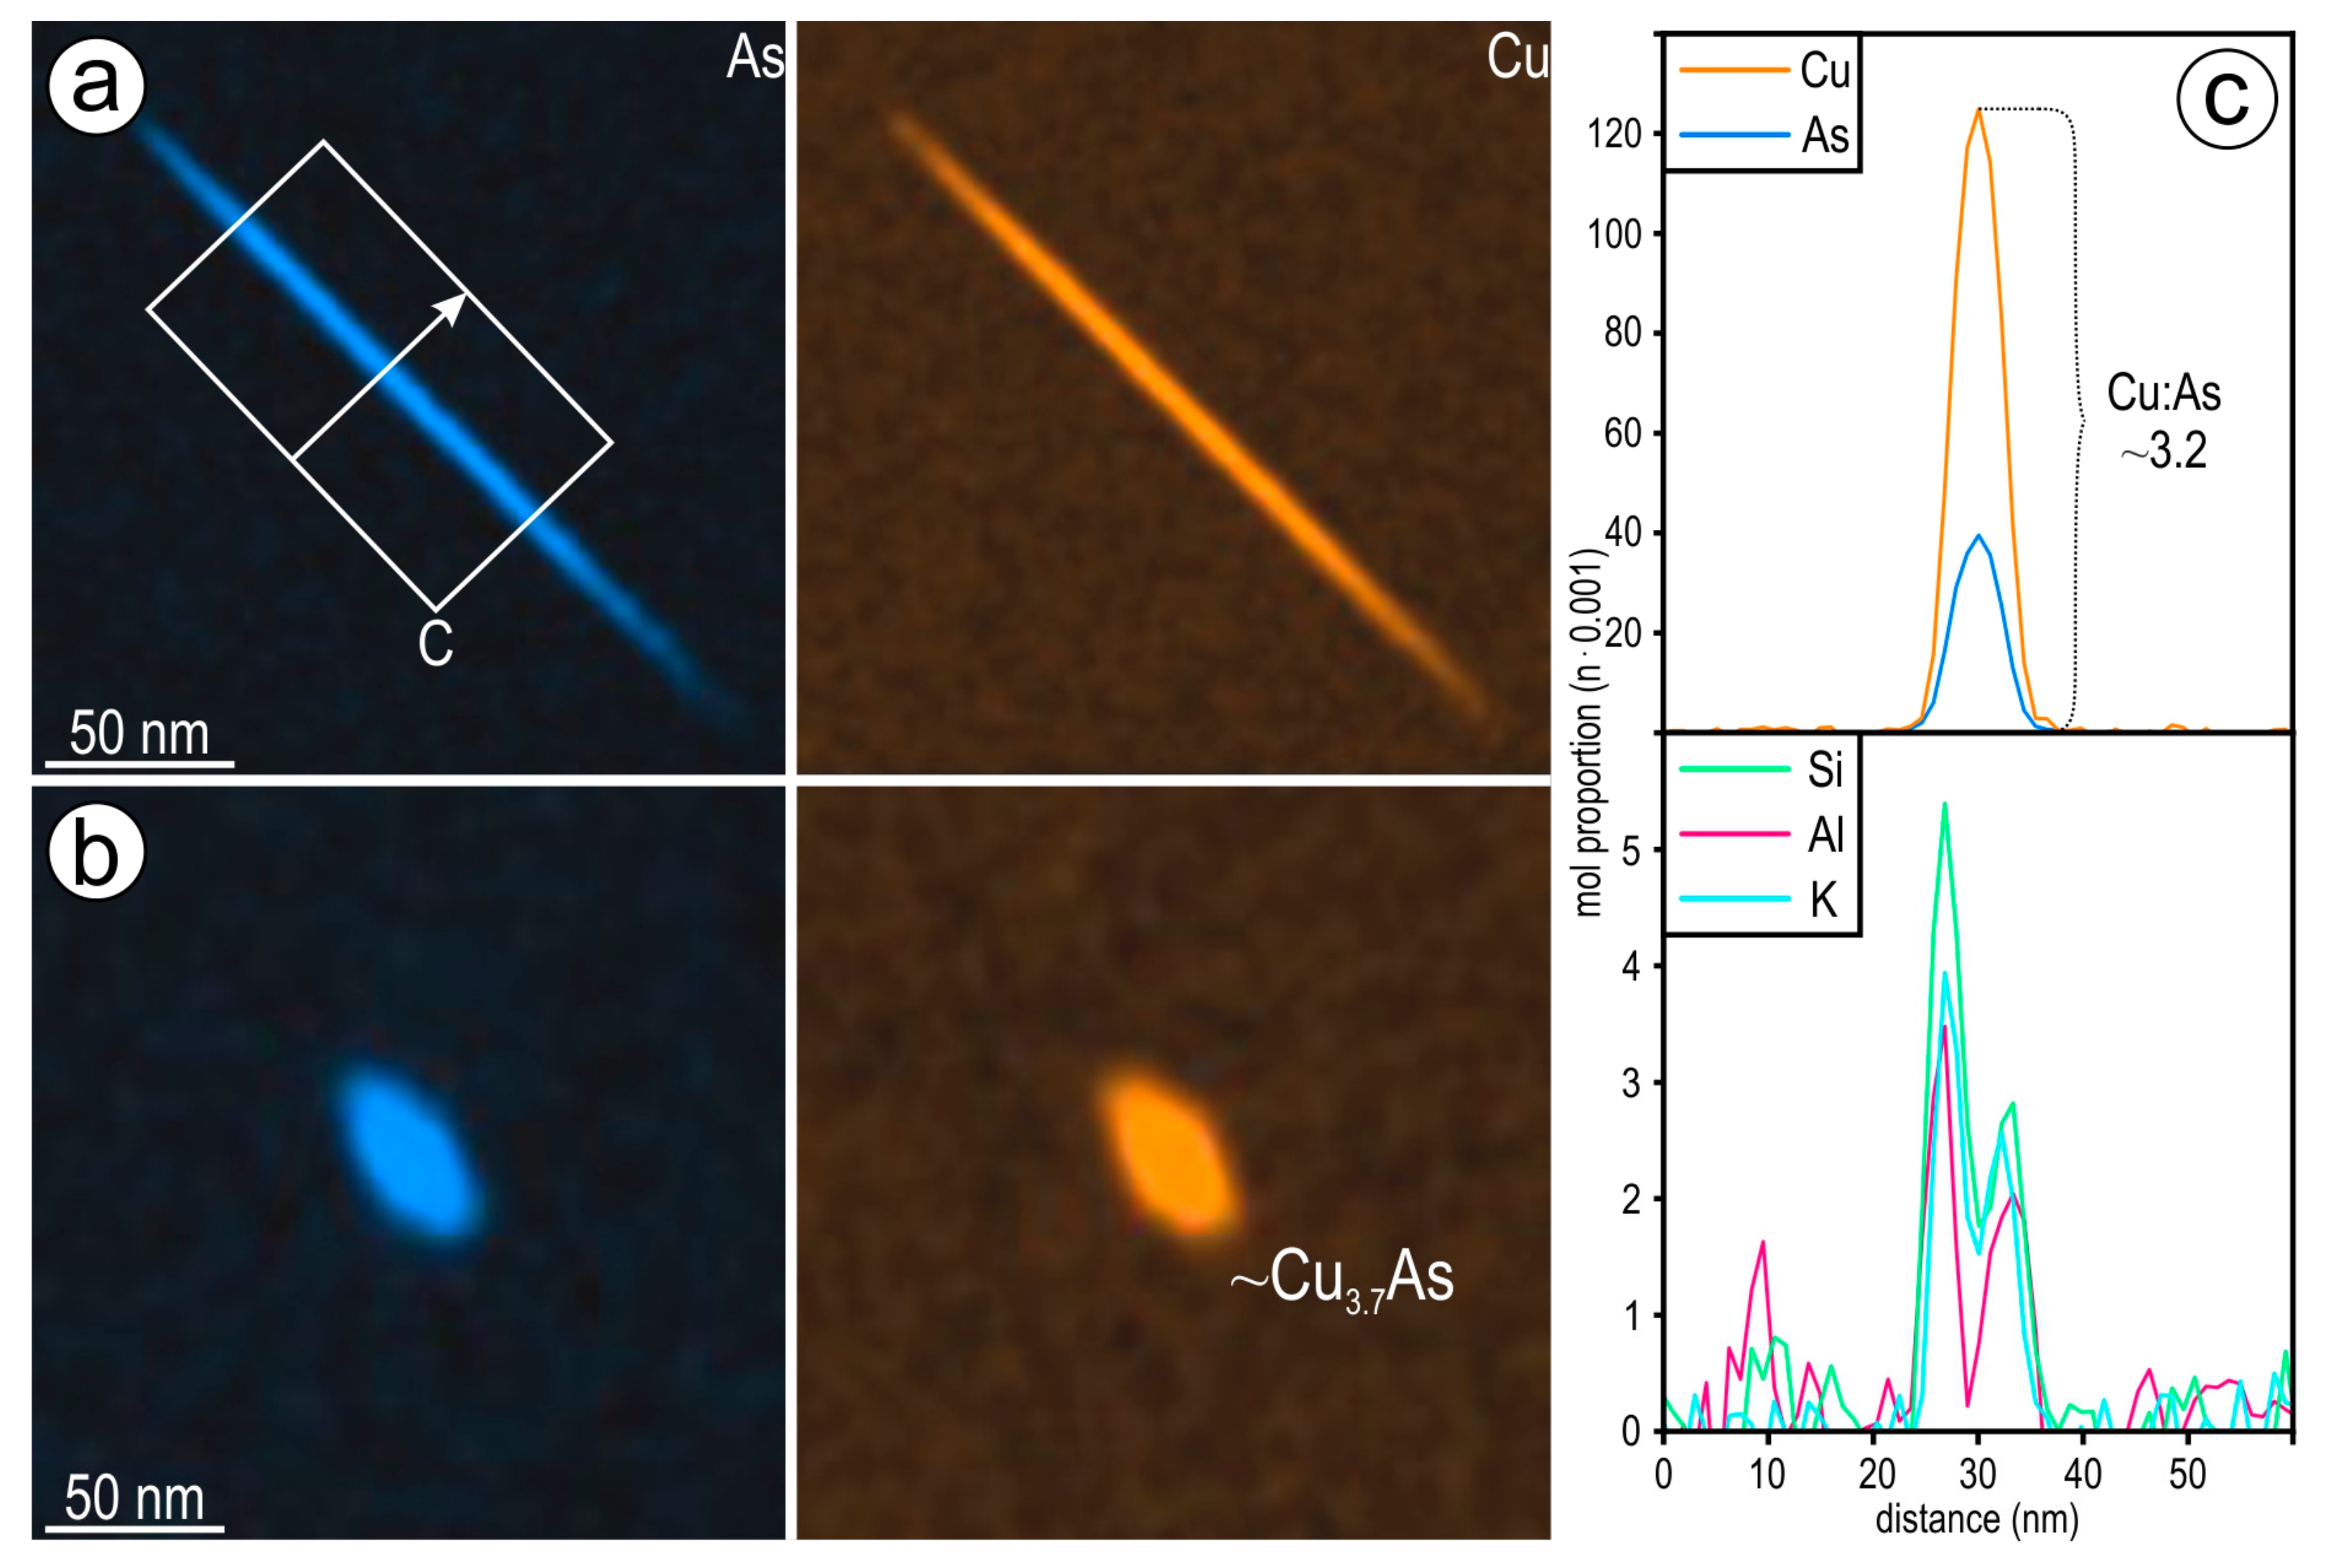
Mapping of the bright bands shows the presence of Cu-As NPs with acicular and hexagonal morphologies in the middle part of the bands (Figure 6a,b; Supplementary Material Figure S2). STEM EDX profiles across these NPs give a relatively steady Cu/As molar ratio of ~3.2–3.7 and indicate a distinct Si-K-Al geochemical signature on the margins of the NPs (Figure 6c). Such ratios are somewhat higher than stoichiometric domeykite (Cu3As), possibly suggesting that these are composed of intergrowths between domeykite and another Cu-rich arsenide phase such as algodonite (Cu6As; [32]).
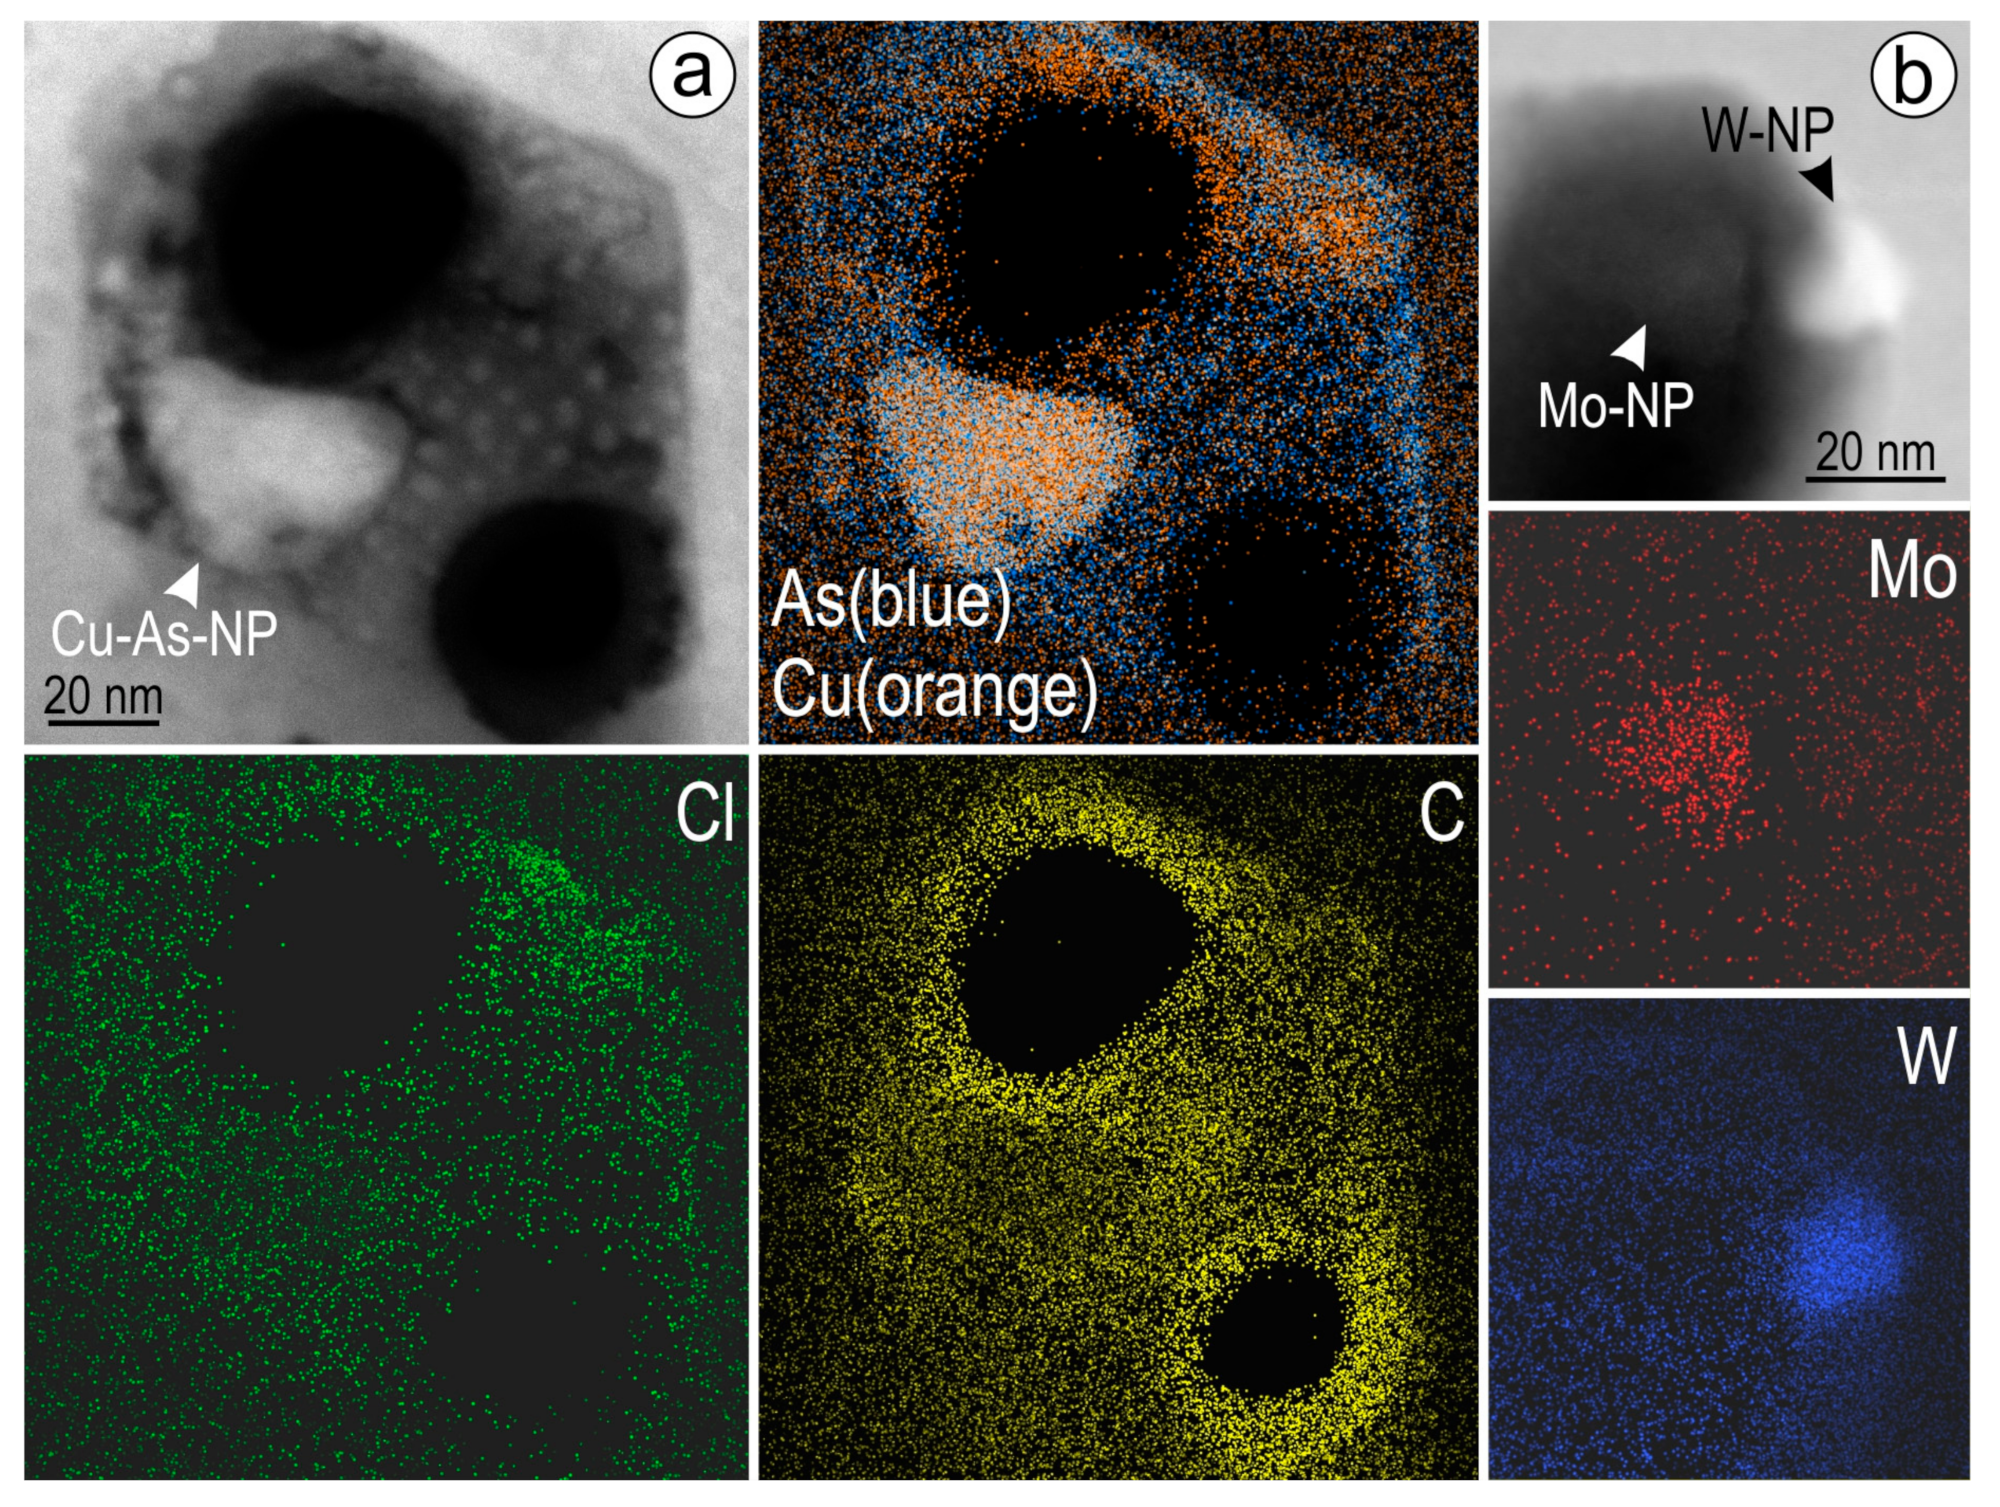
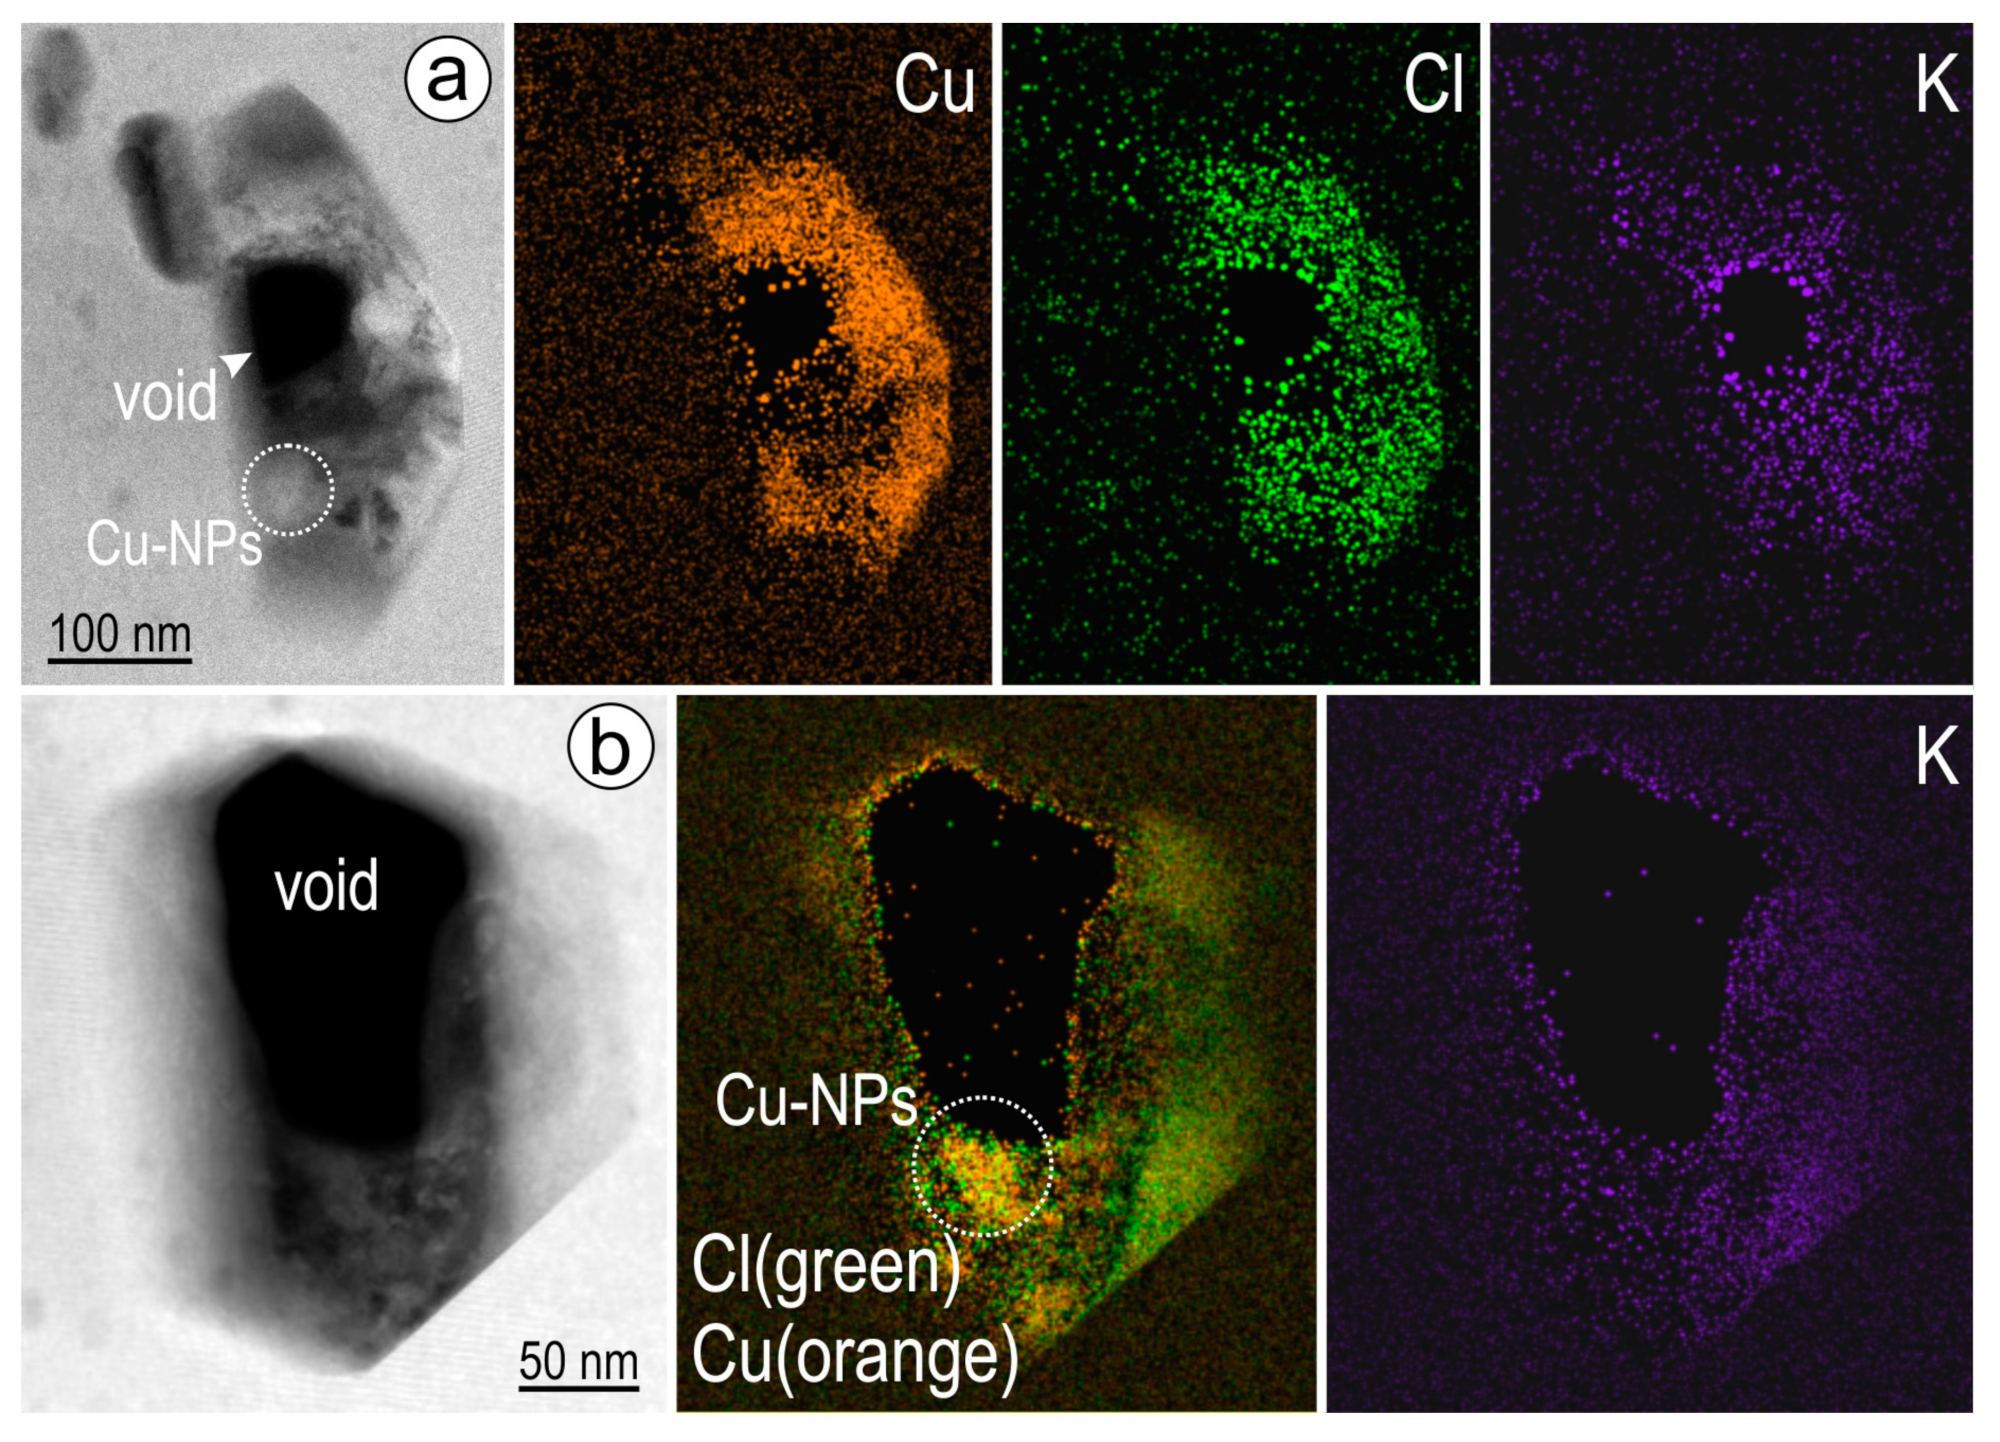
STEM EDX maps of coarser cavities show detectable concentrations of Cu, As and occasionally, also Mo and W, as well as Cl, K, Si, Al, C, and minor Ca (Figure 7 and Figure 8; Supplementary Material Figures S3–S6). Both Cu and As show higher concentration (agglomerated Cu-As and native Cu NPs) particularly towards the outer margins of the voids (Figure 7 and Figure 8b). The speciation of the NPs differs within the two domains, whereby the Cu-As NPs are found only in domain B, which lacks the bright bands.
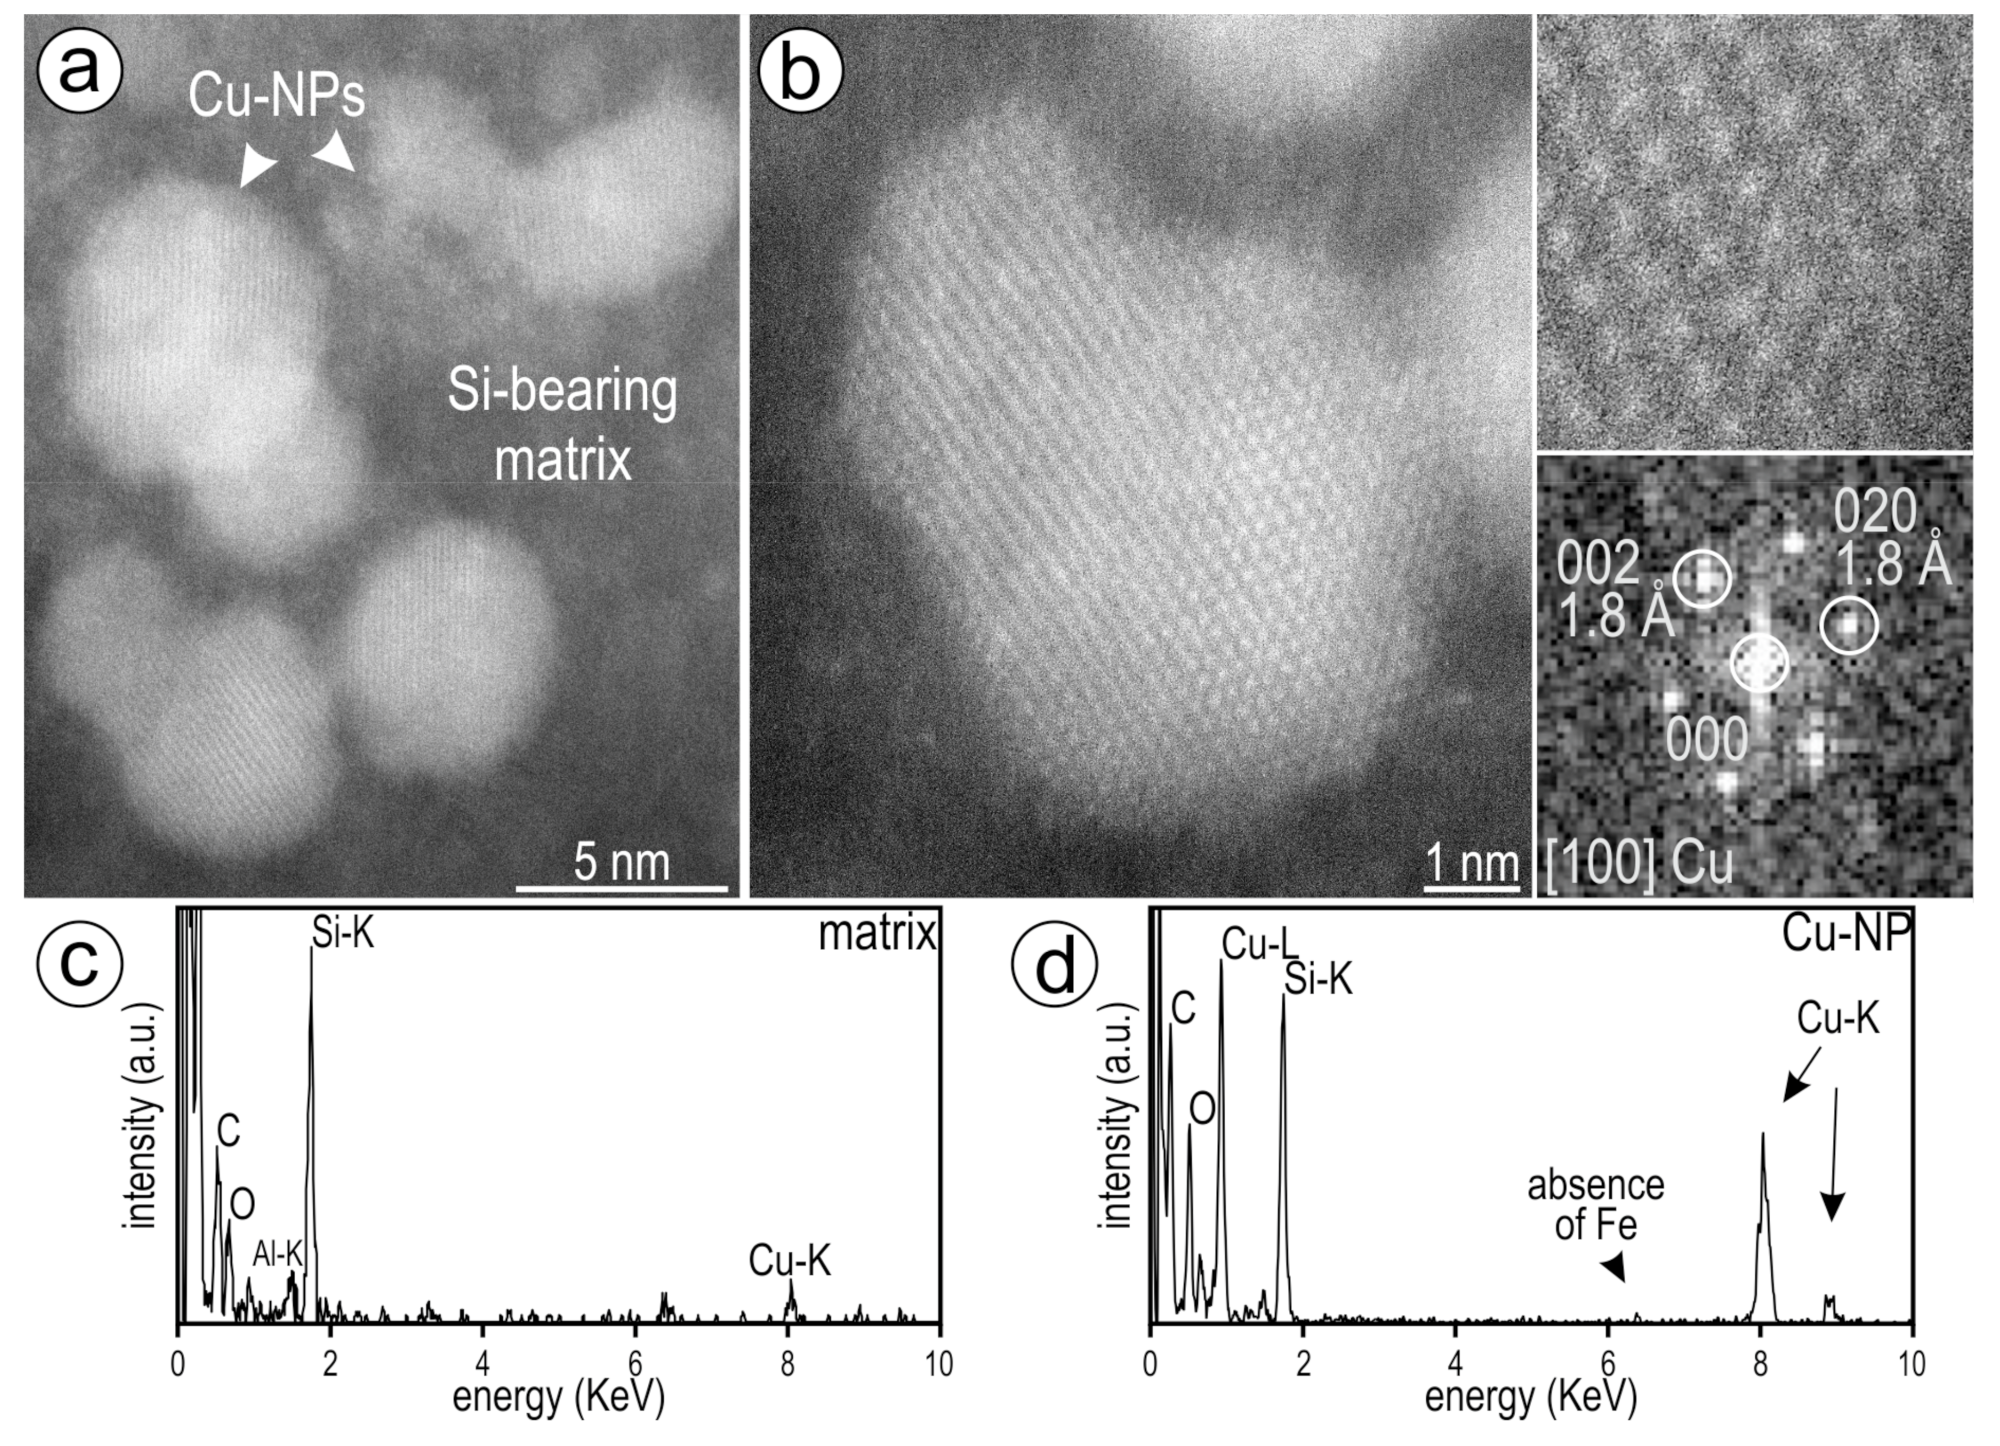
High-resolution imaging of one cluster of NPs from one of the cavities mapped in Figure 7a shows agglomeration of Cu NPs (Figure 9a). Nanoparticle morphology was observed to change under exposure to the beam. An atomic arrangement that can be indexed as the [100] zone axis of native copper is documented from one of the larger NP (Figure 9b). The substrate of the NPs contains measurable Si (spectrum in Figure 9c). Compositional information of the native copper NPs is also shown by the spectrum in Figure 9d, in which Fe is conspicuously absent.
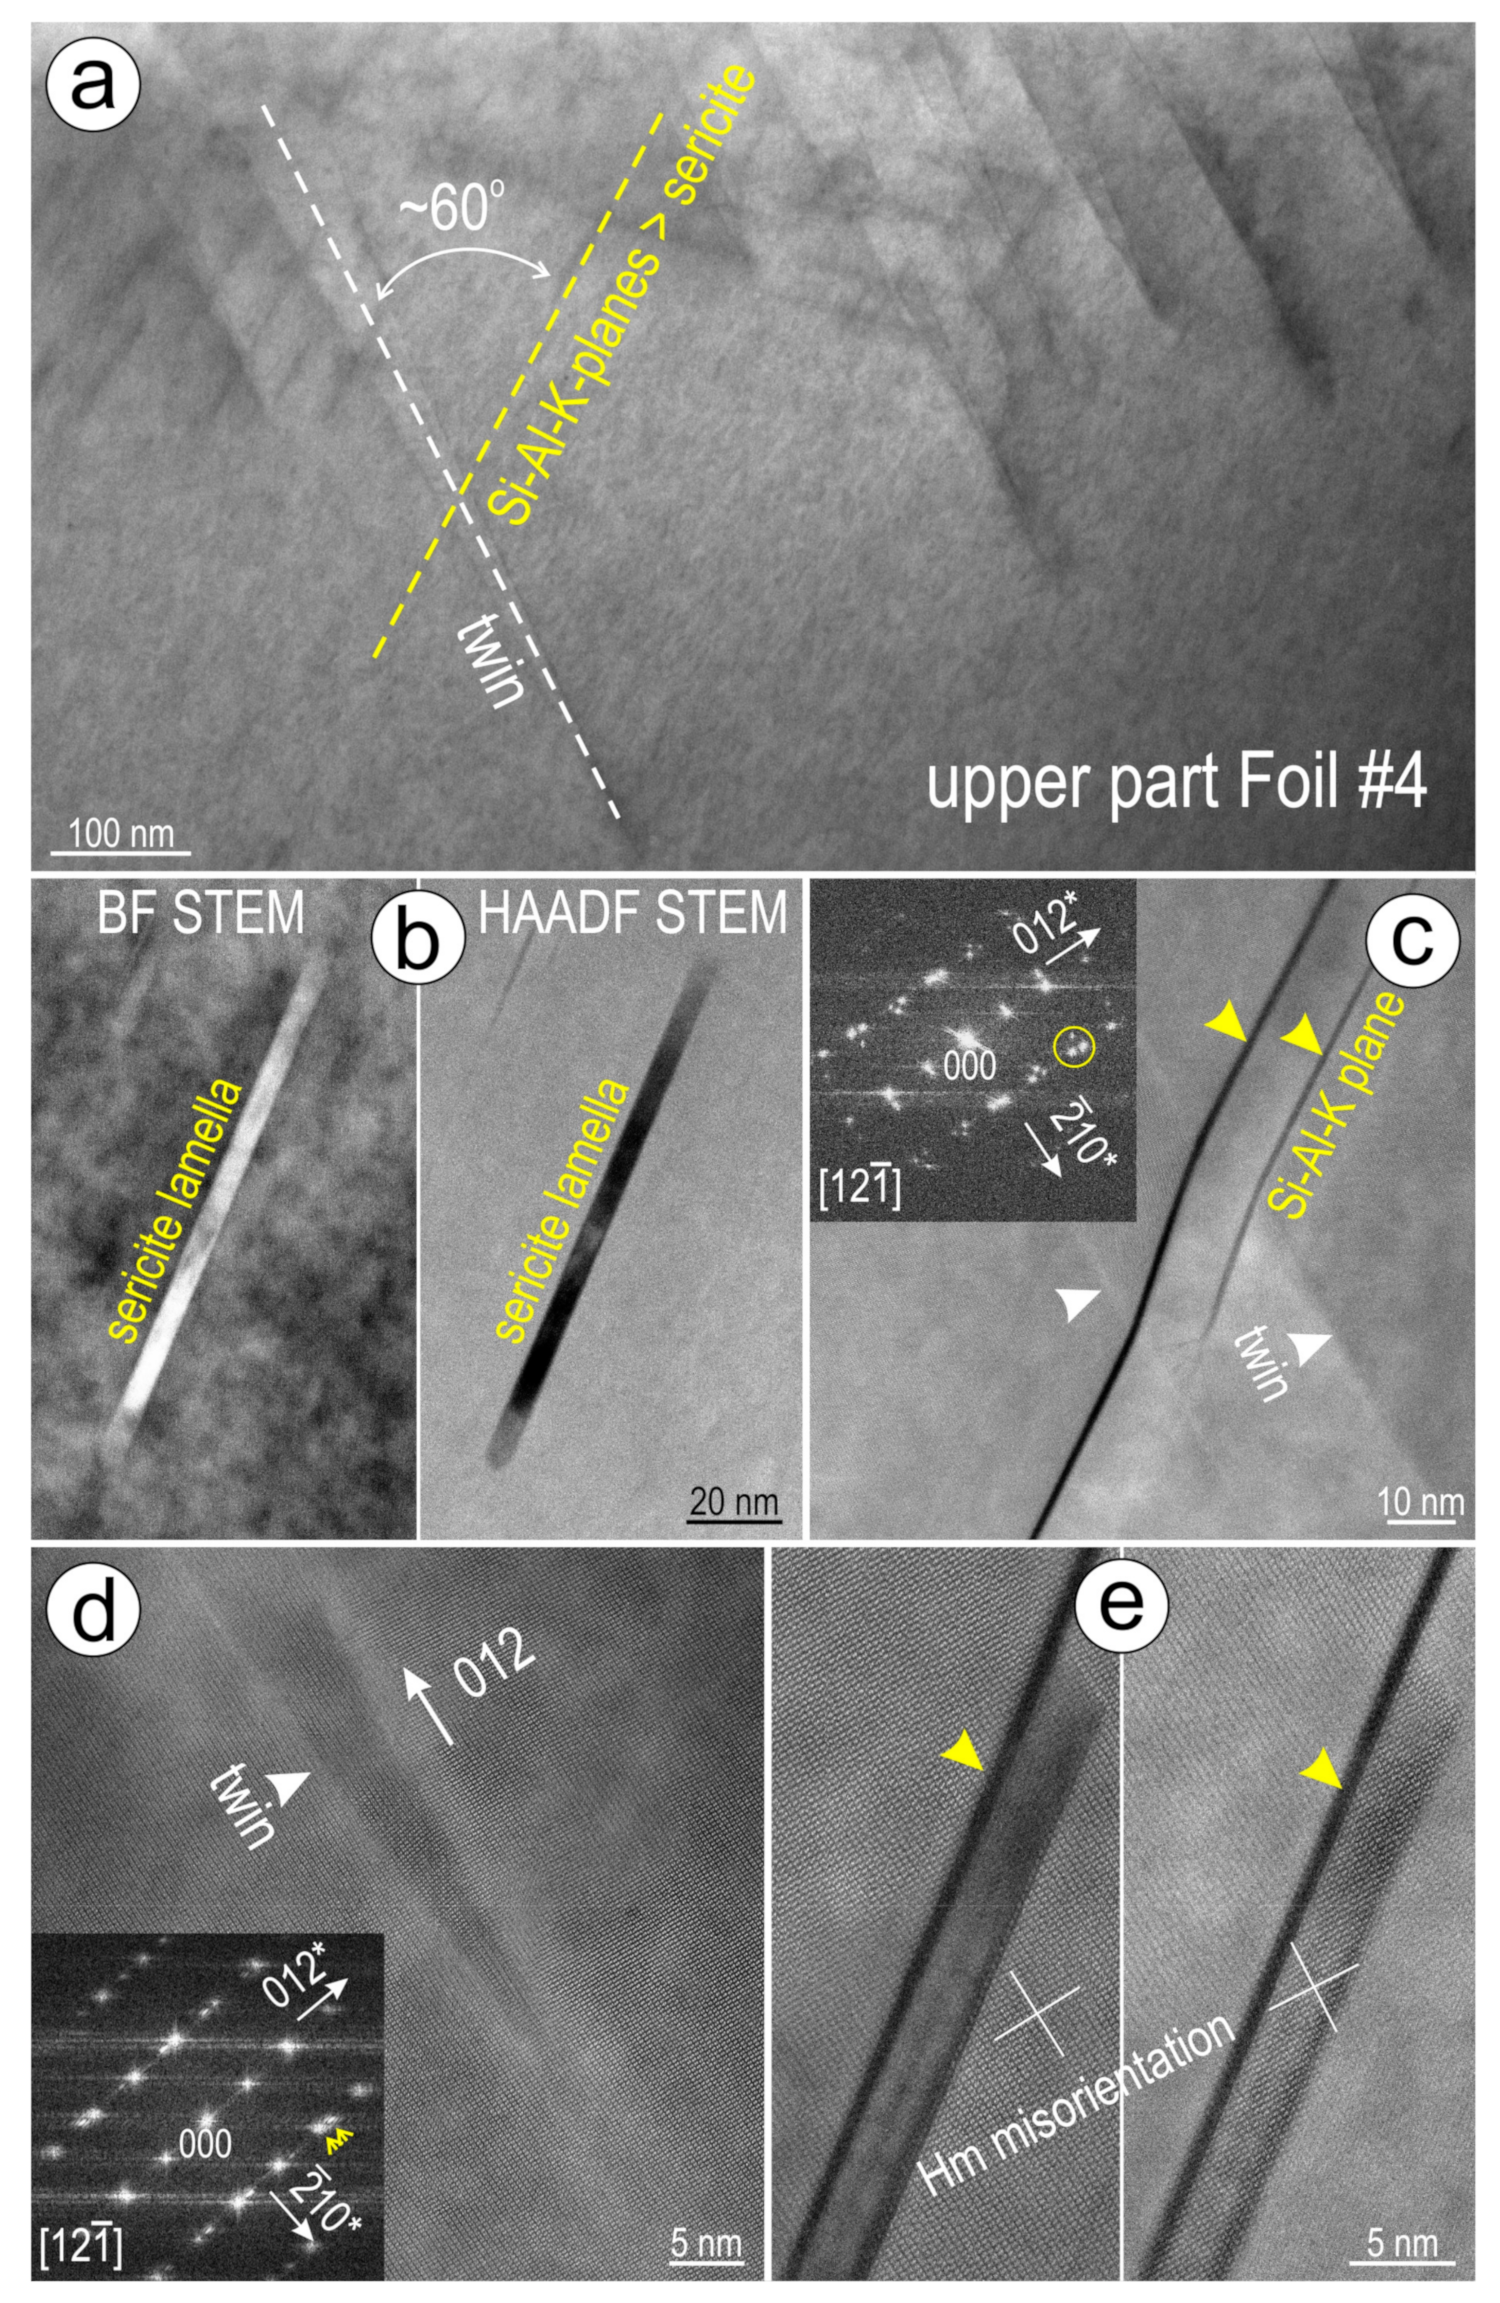
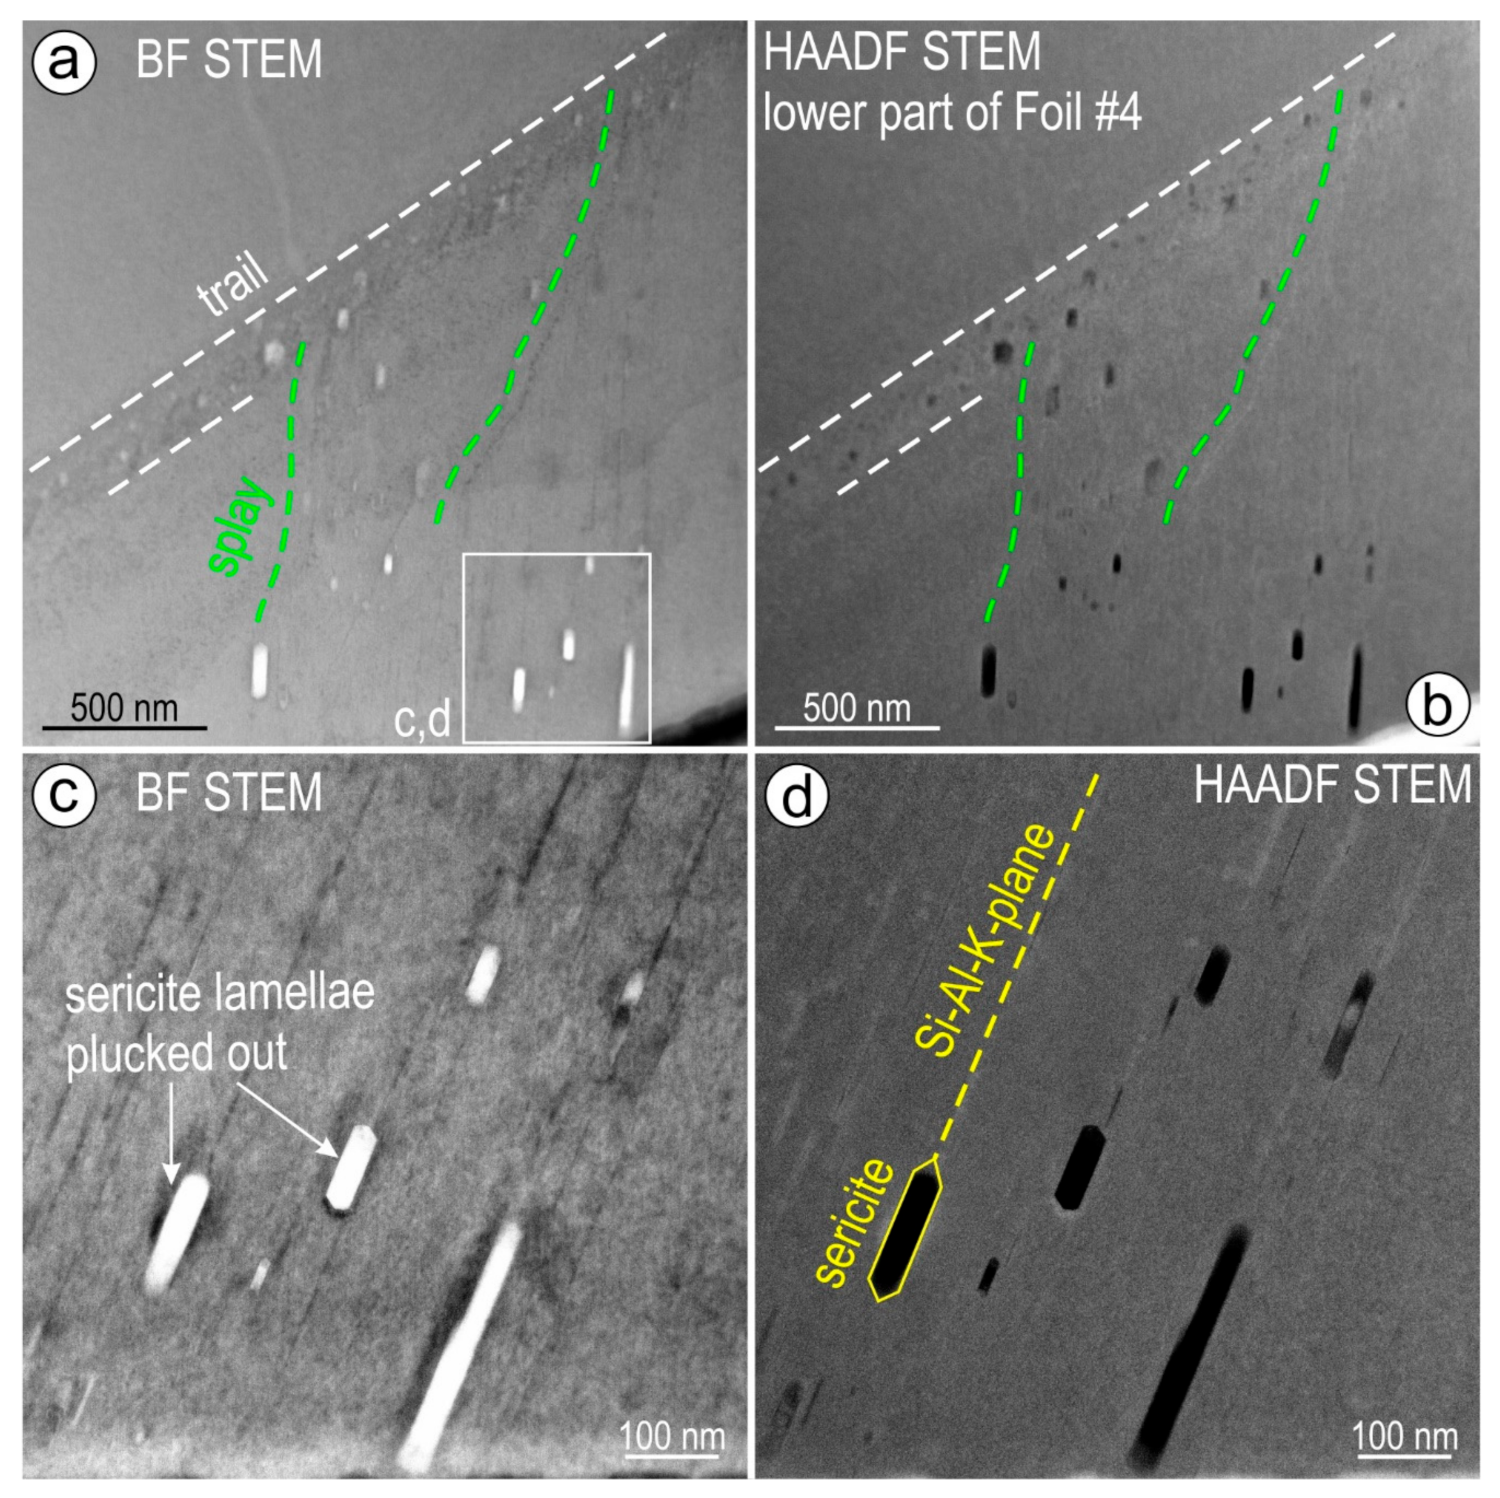
The hematite foil obtained from grain 2 (foil #4) shows differences between the upper and the lower margin (Supplementary Material Figure S1). At the upper part, domains of variable widths display two crosscutting sets of ‘lamellae’ at an orientation of ~60° to one another (Figure 10a). In detail, the two sets also feature different morphologies, whereby the thinnest (no more than a few nm wide) are planes containing measurable concentrations of Si-Al-K and become host to platelets of sericitic mica (Figure 10b; see below), even though the contents of many of these have been lost during FIB milling. The second set of lamellae are twins crosscut and offset by the Si-Al-K-bearing planes. The planes themselves also show kink deformation between two twins (Figure 10c). In contrast to the Si-Al-K-planes, the twins can be as wide as ~150–200 nm but they narrow down towards edges with lanceolate terminations (Figure 10d). Sharp, rectangular domains of hematite close to the Si-Al-K-planes shows slight misorientation relative to enclosing hematite, indicating presence of glide planes (Figure 10e). Nucleation of sericite platelets can take place between such glide planes (Figure 10e). Imaging of hematite on the [121] zone axis across simple twins show splits of main reflections along rows parallel to (021)* lattice vector on FFT image (inset Figure 10d). Groups of satellite reflections along the same directions mark conjugated pairs of twins, and Si-Al-K-planes (and/or sericite) on FFTs (inset, Figure 10c). Trails of inclusions and cavities resembling those in foils #1–3 are present in the lower part of the same foil (Figure 11a,b). These are seen to propagate into splays leading to stubby, hexagonal-shaped platelets (Figure 11c,d). Although they appear empty (cf. BF and HAADF STEM images, Figure 11), they partially preserve areas with the same Si-Al-K-bearing element association as the inferred “sericite” platelets at the upper part of the foil.
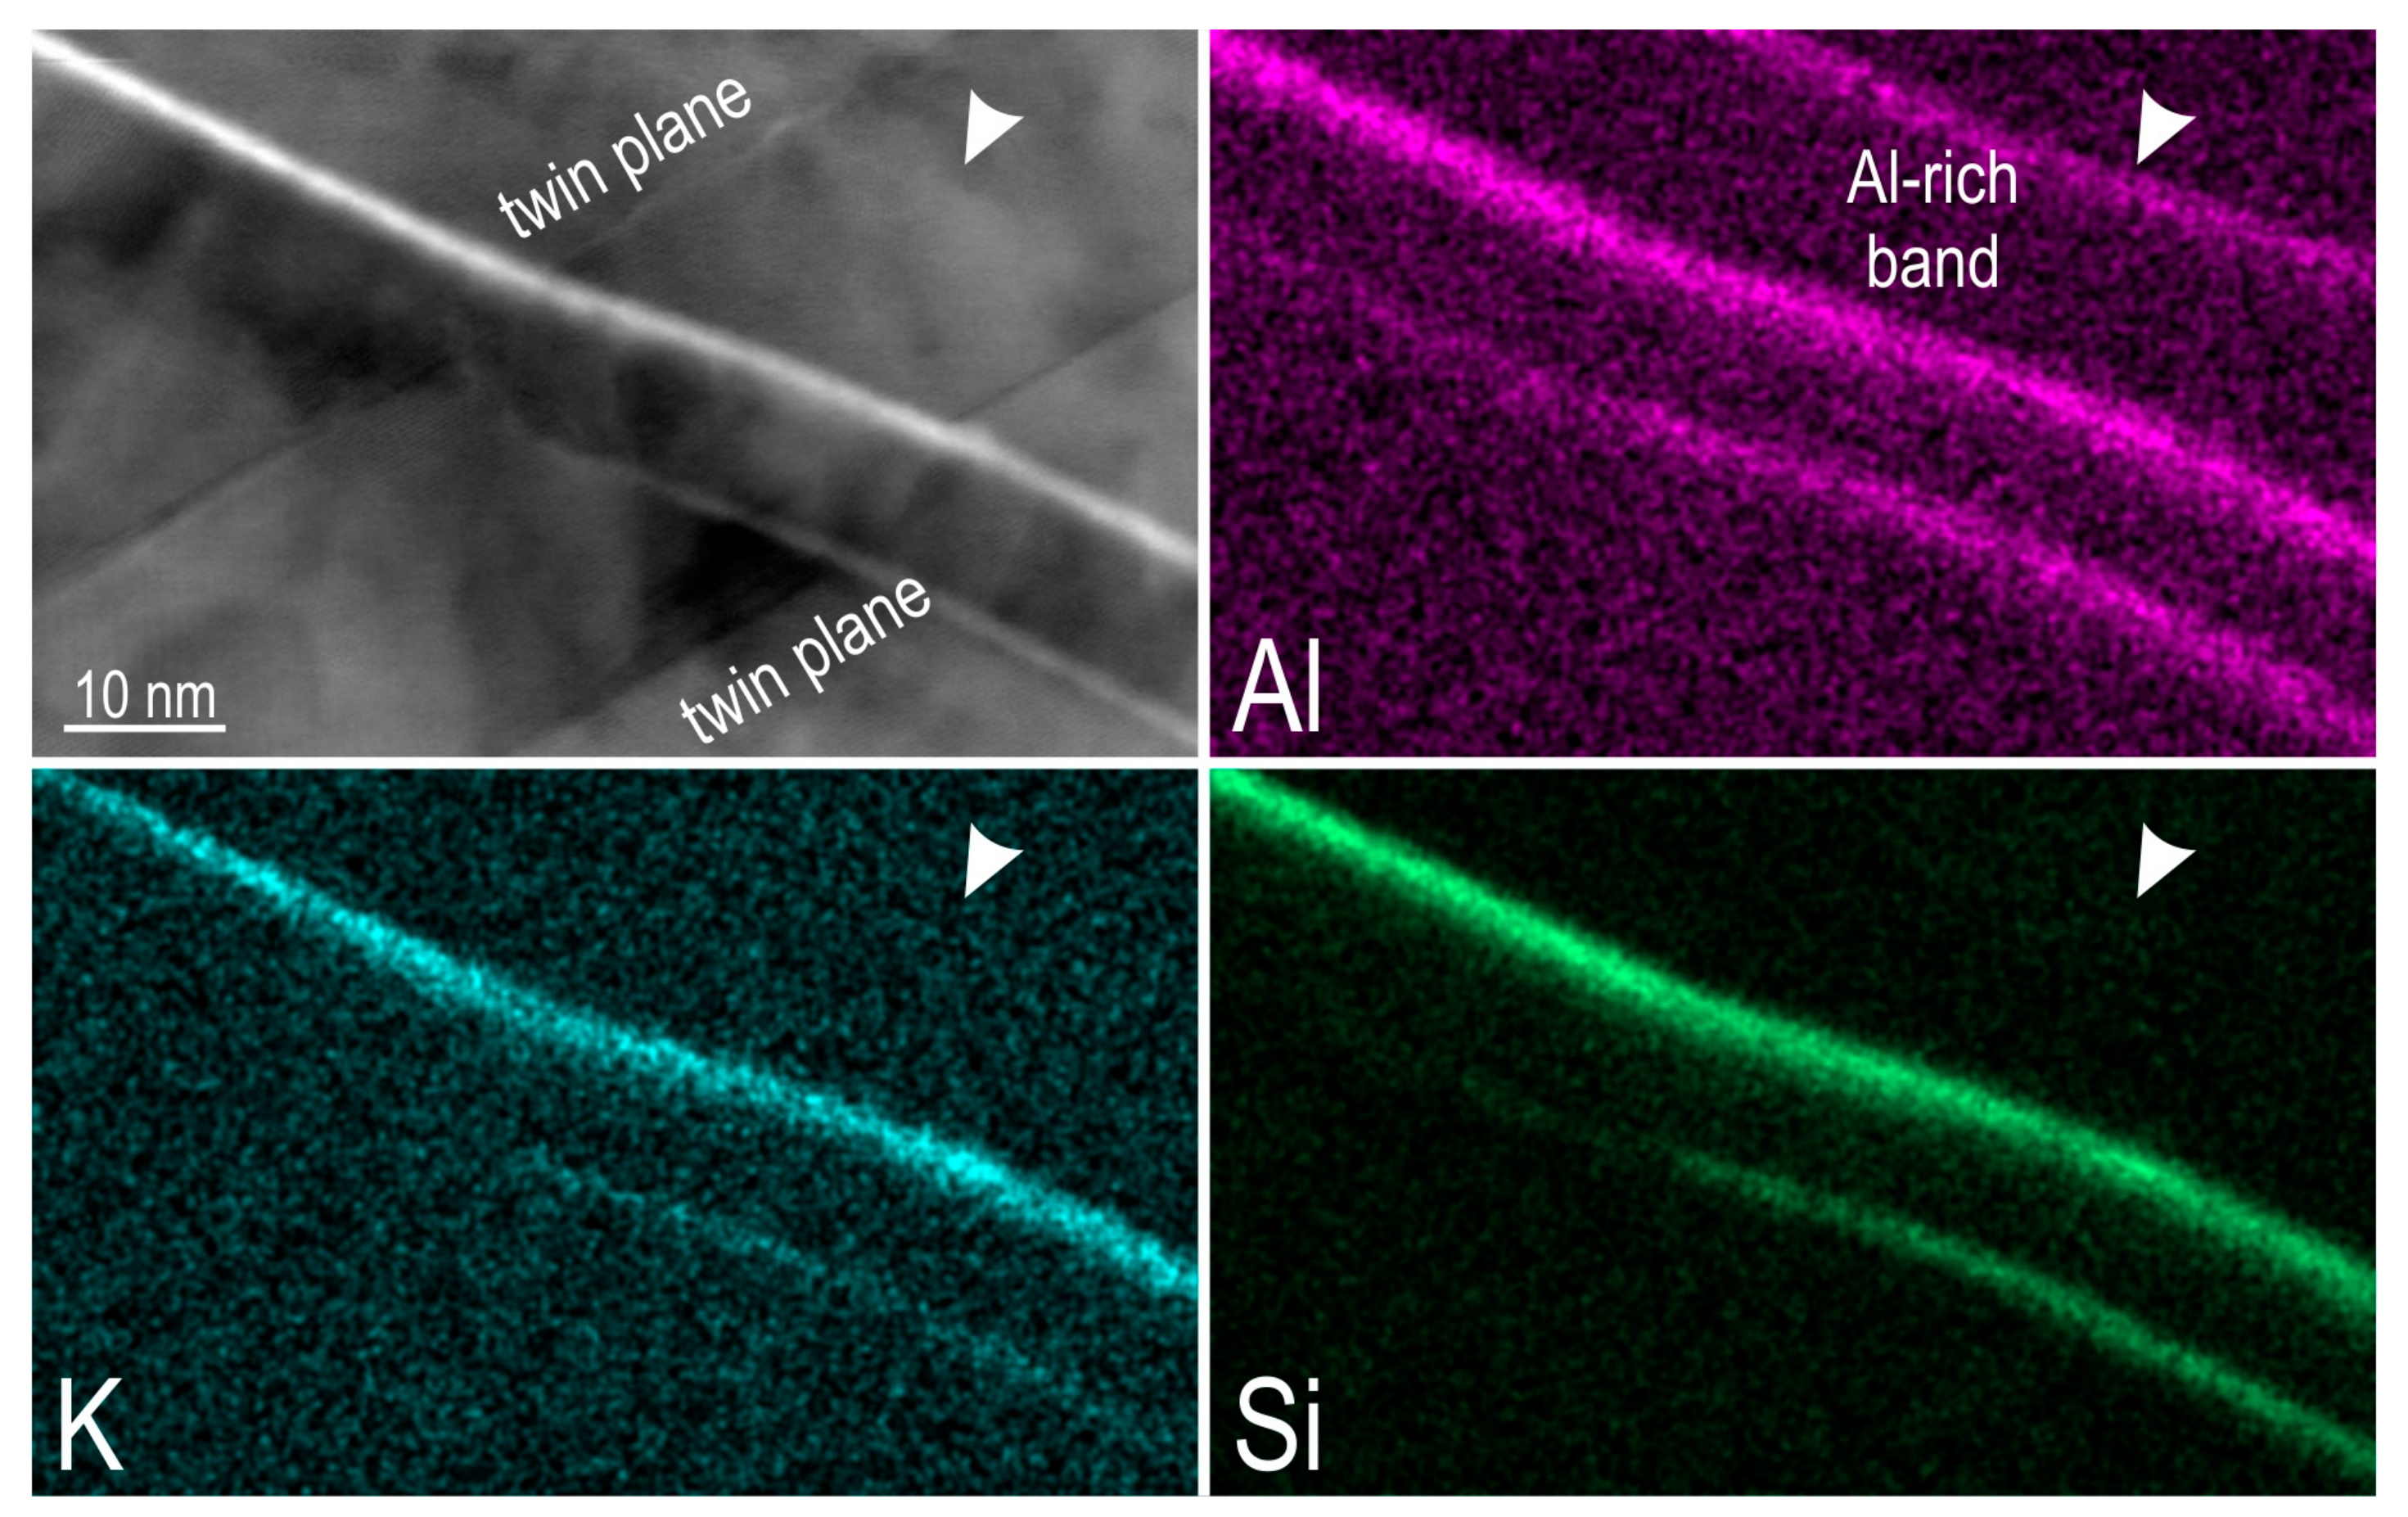
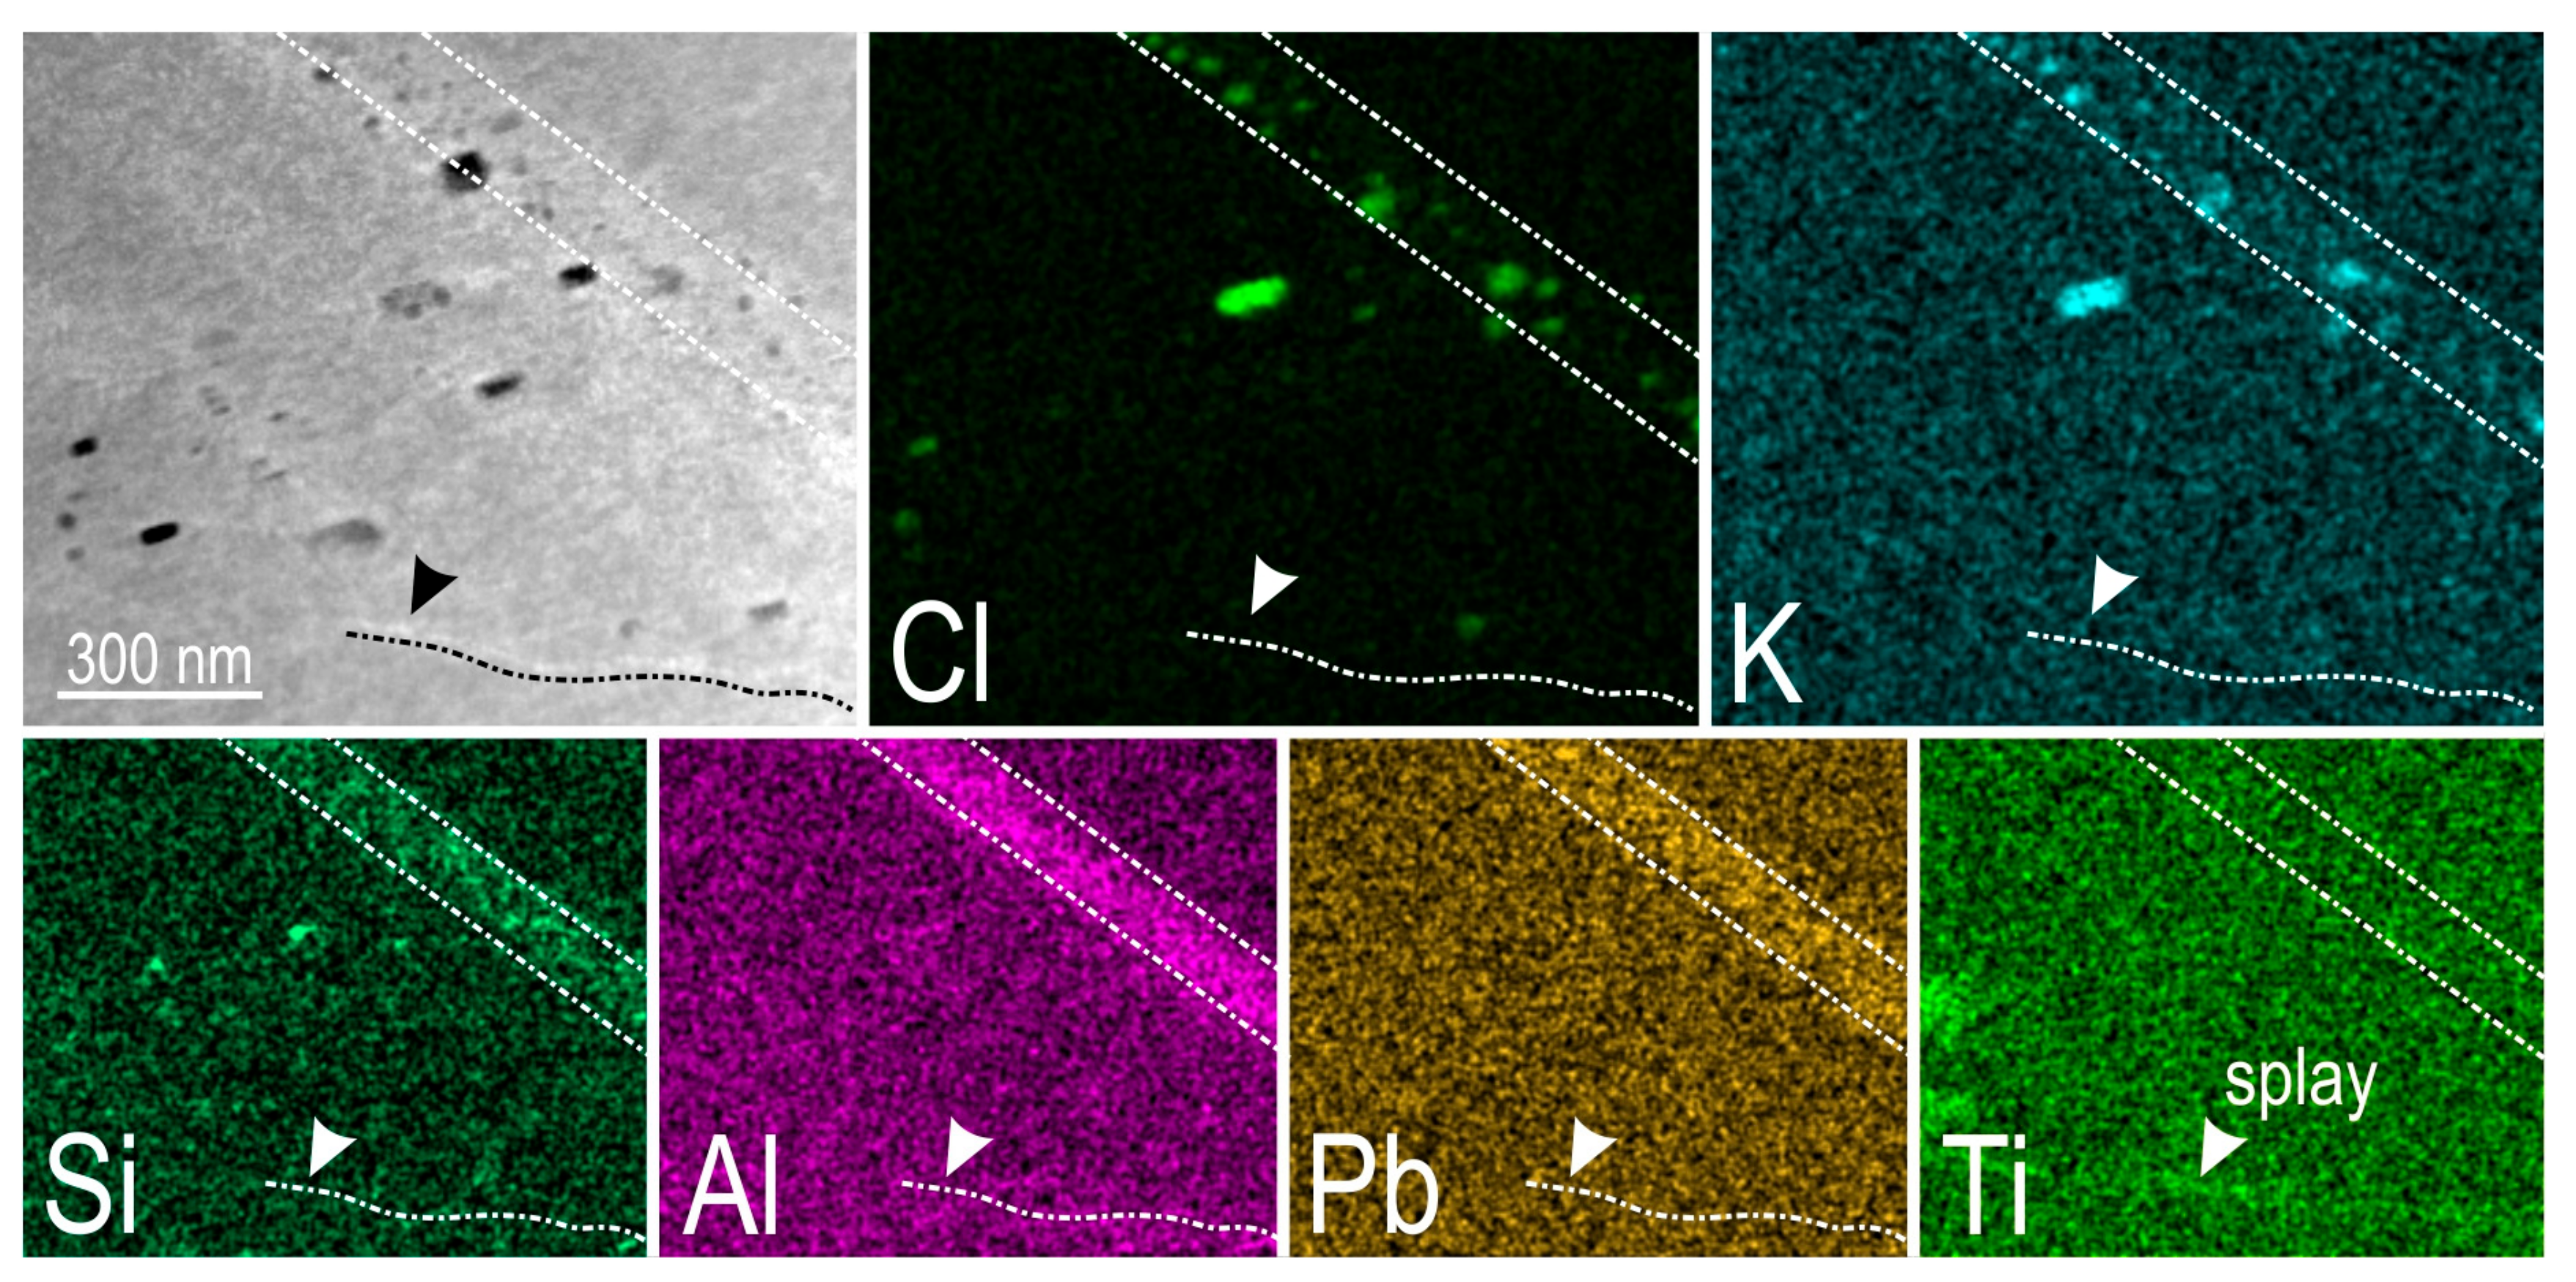
STEM EDX mapping of two areas representative of upper and lower parts of the foil (Figure 12 and Figure 13) show that they contain measurable concentrations of Si, Al, K, but the lower area differs in that it also shows Cl as a component of some of the K-bearing platelets (Figure 13). Additionally, the trails and splays feature the presence of Pb and Ti, respectively. Spotty concentrations of Cl and K also occur along the trails, whereas Si and Al appear homogeneously distributed. On the other hand, compositional heterogeneity is also observed in the upper part of the foil, between wider and thinner planes, whereby the latter contain only Al (Figure 12).
3.2. High-Resolution HAADF STEM Imaging of Hematite
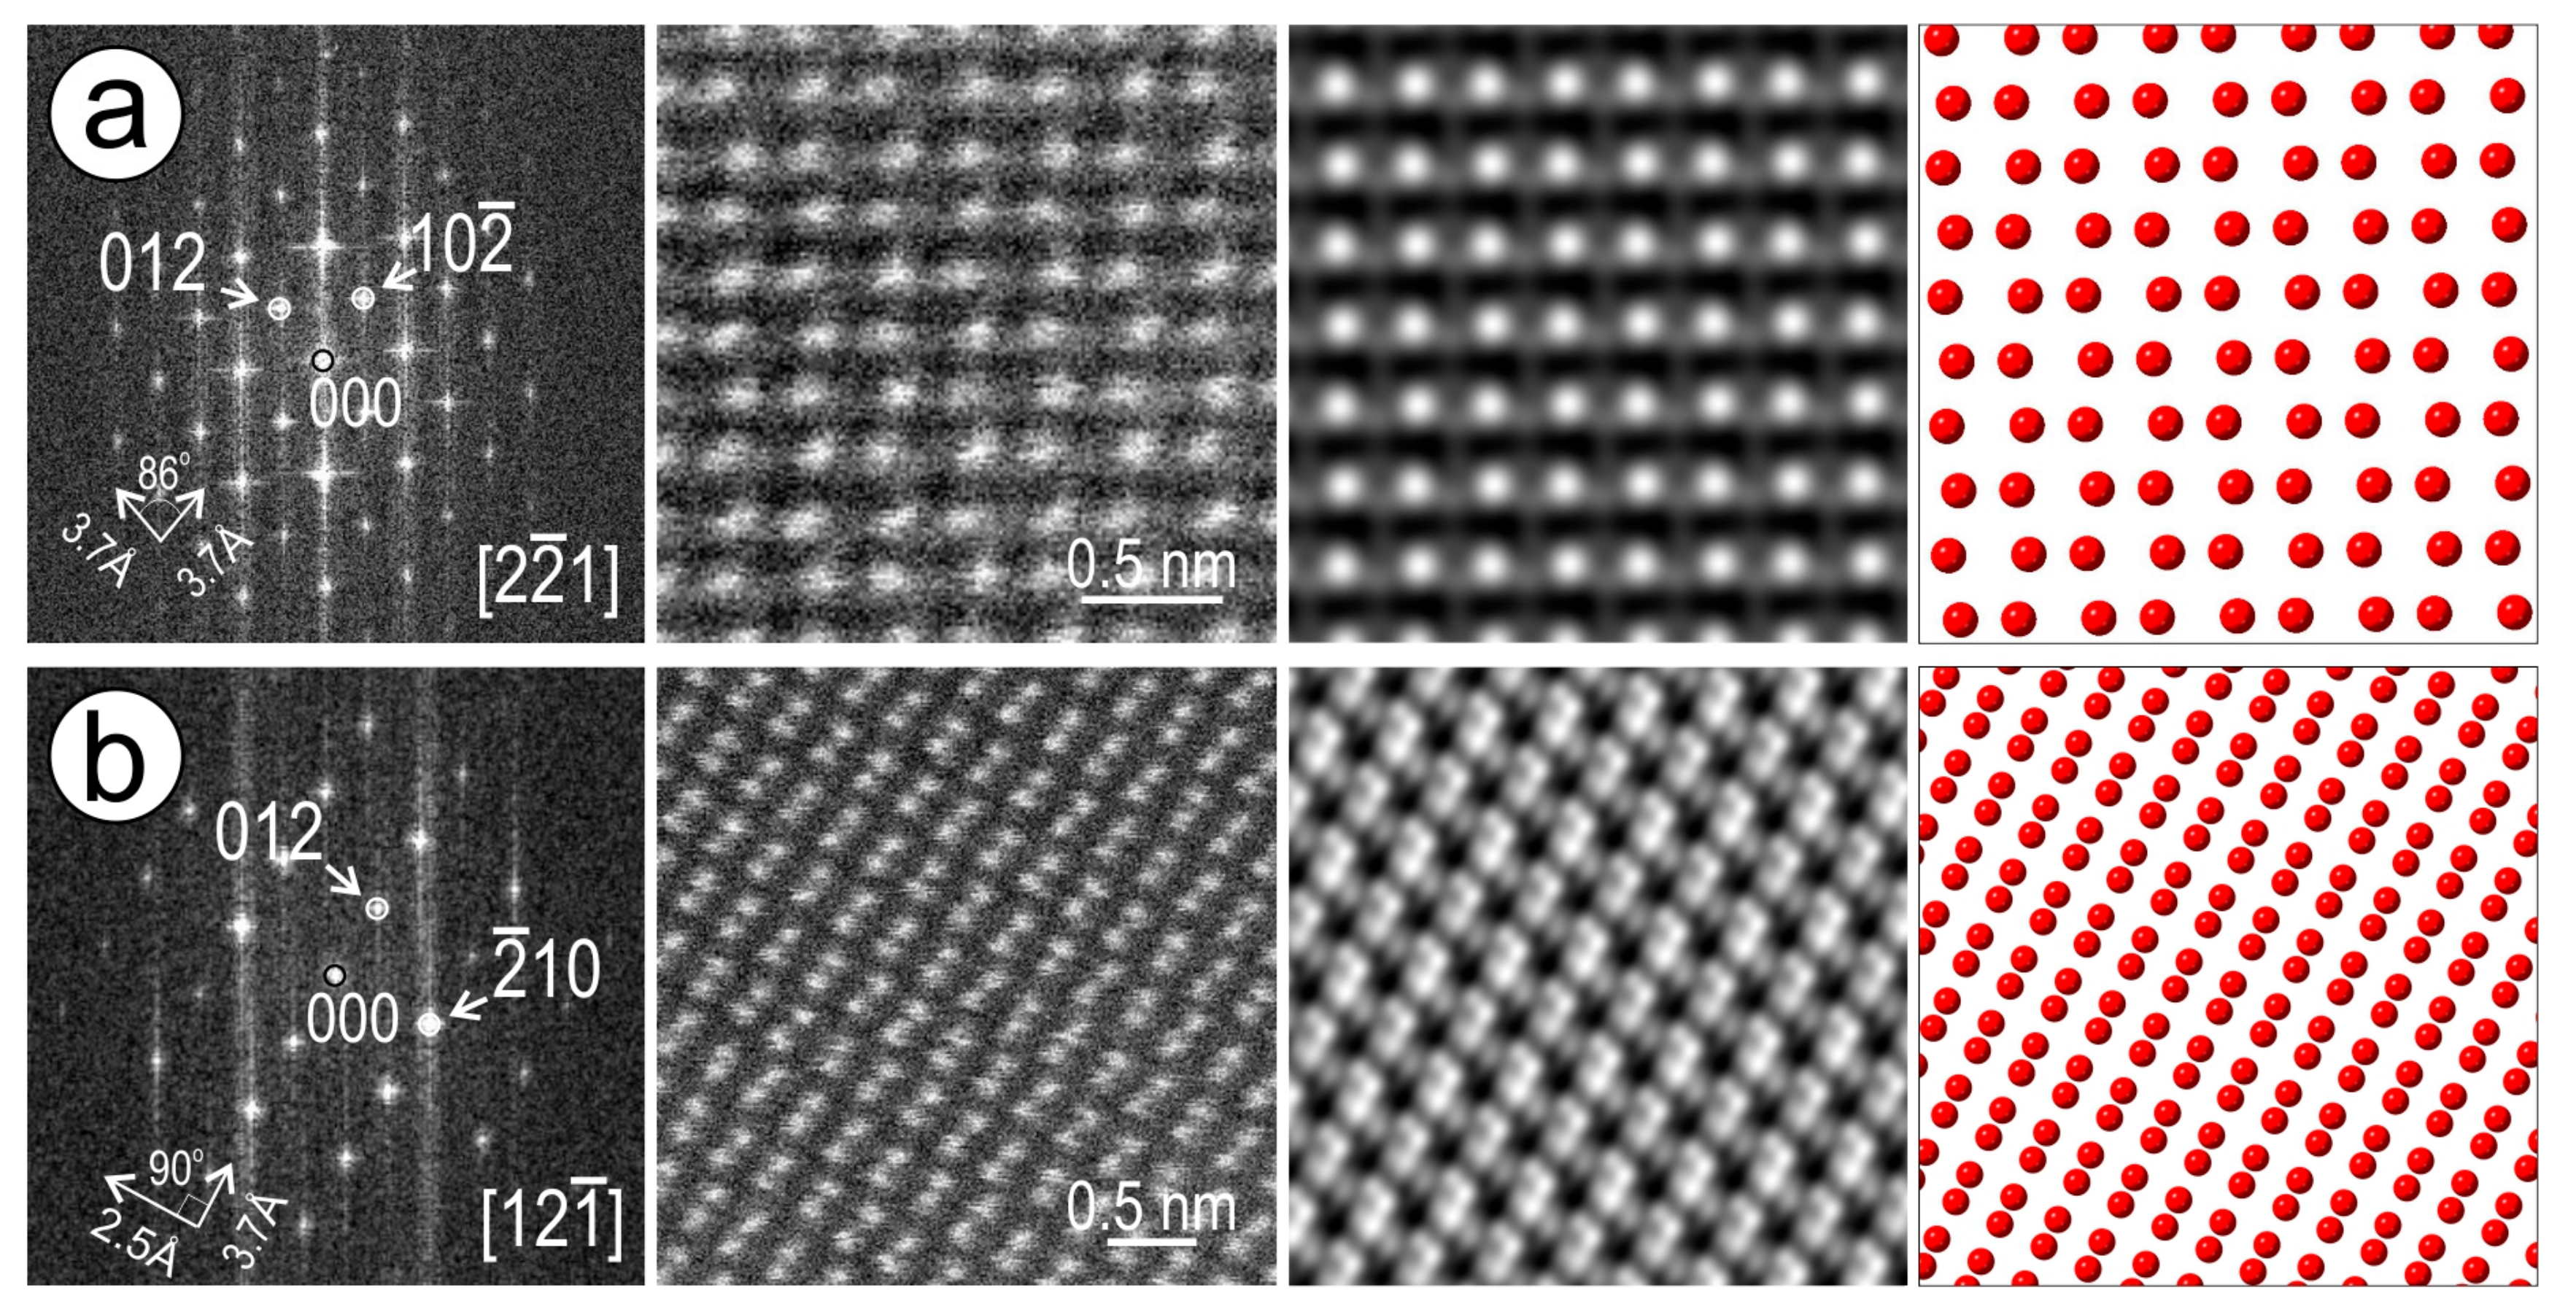
Atomic scale imaging of hematite throughout all foils was undertaken on two zone axes, i.e., [221] for the Cu-As-zoned grain and [121] for the weave-twinned grain. Interpretation of HAADF STEM images was based upon: (i) STEM simulation; and (ii) crystal models on the two respective axes obtained from the images (Figure 14). The bright spots on the images correspond to Fe atoms which show two distinct dumbbell patterns with good fit to the STEM simulations.
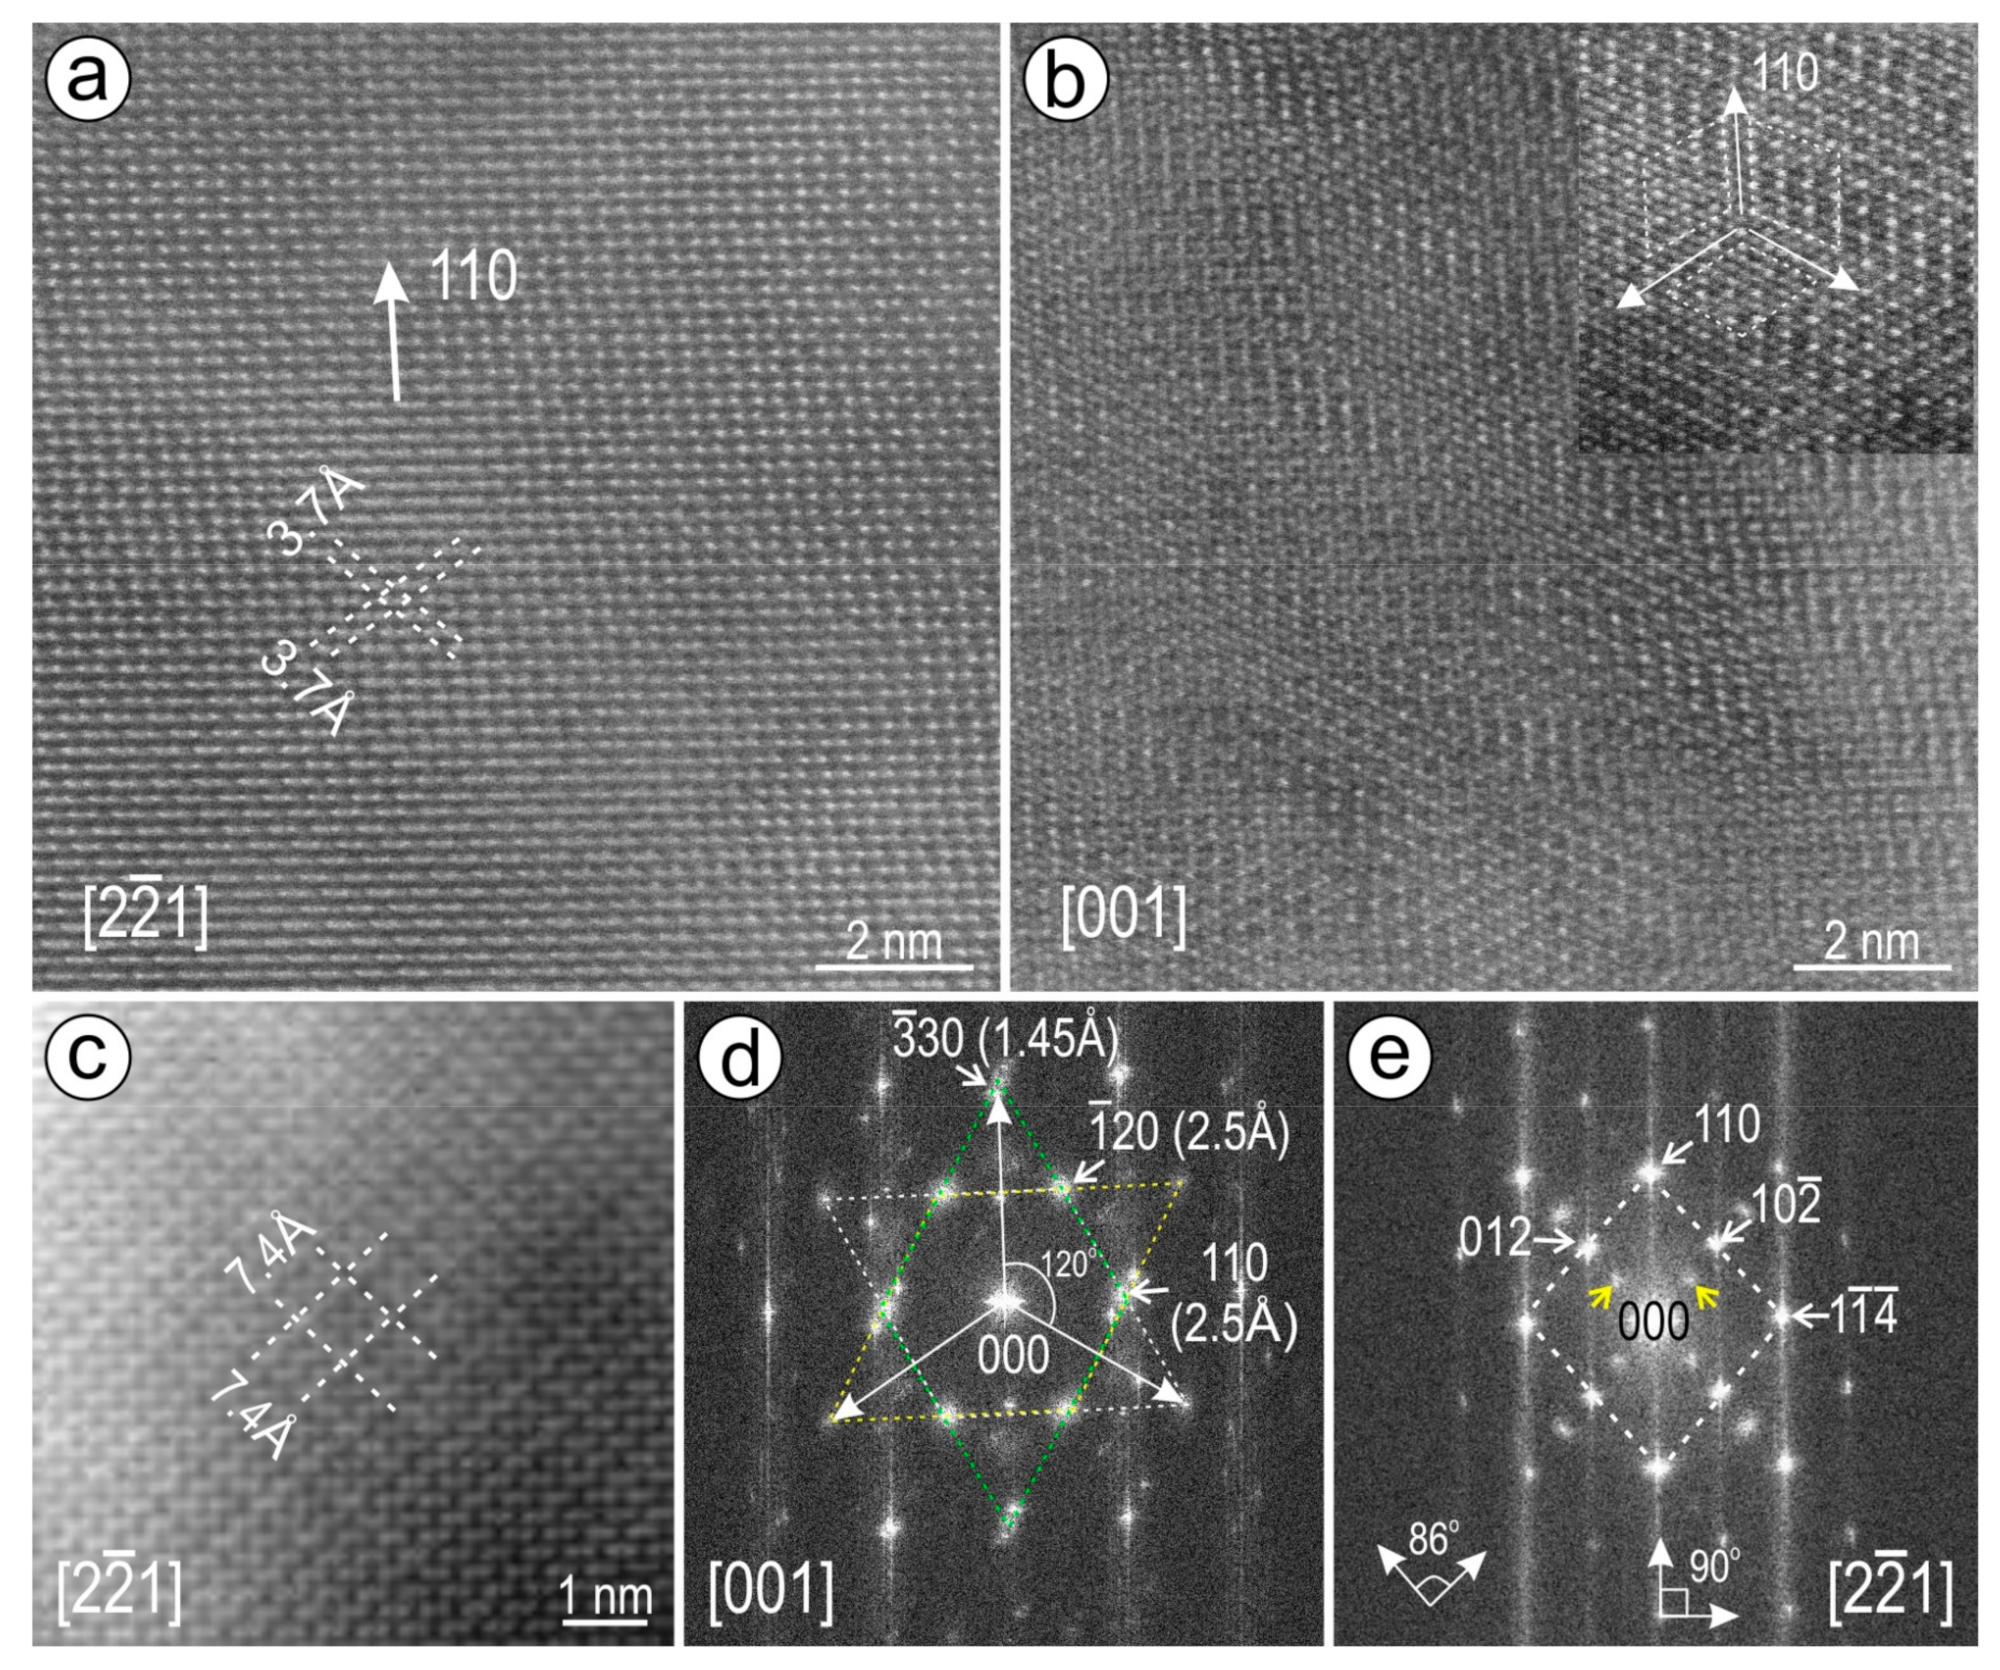
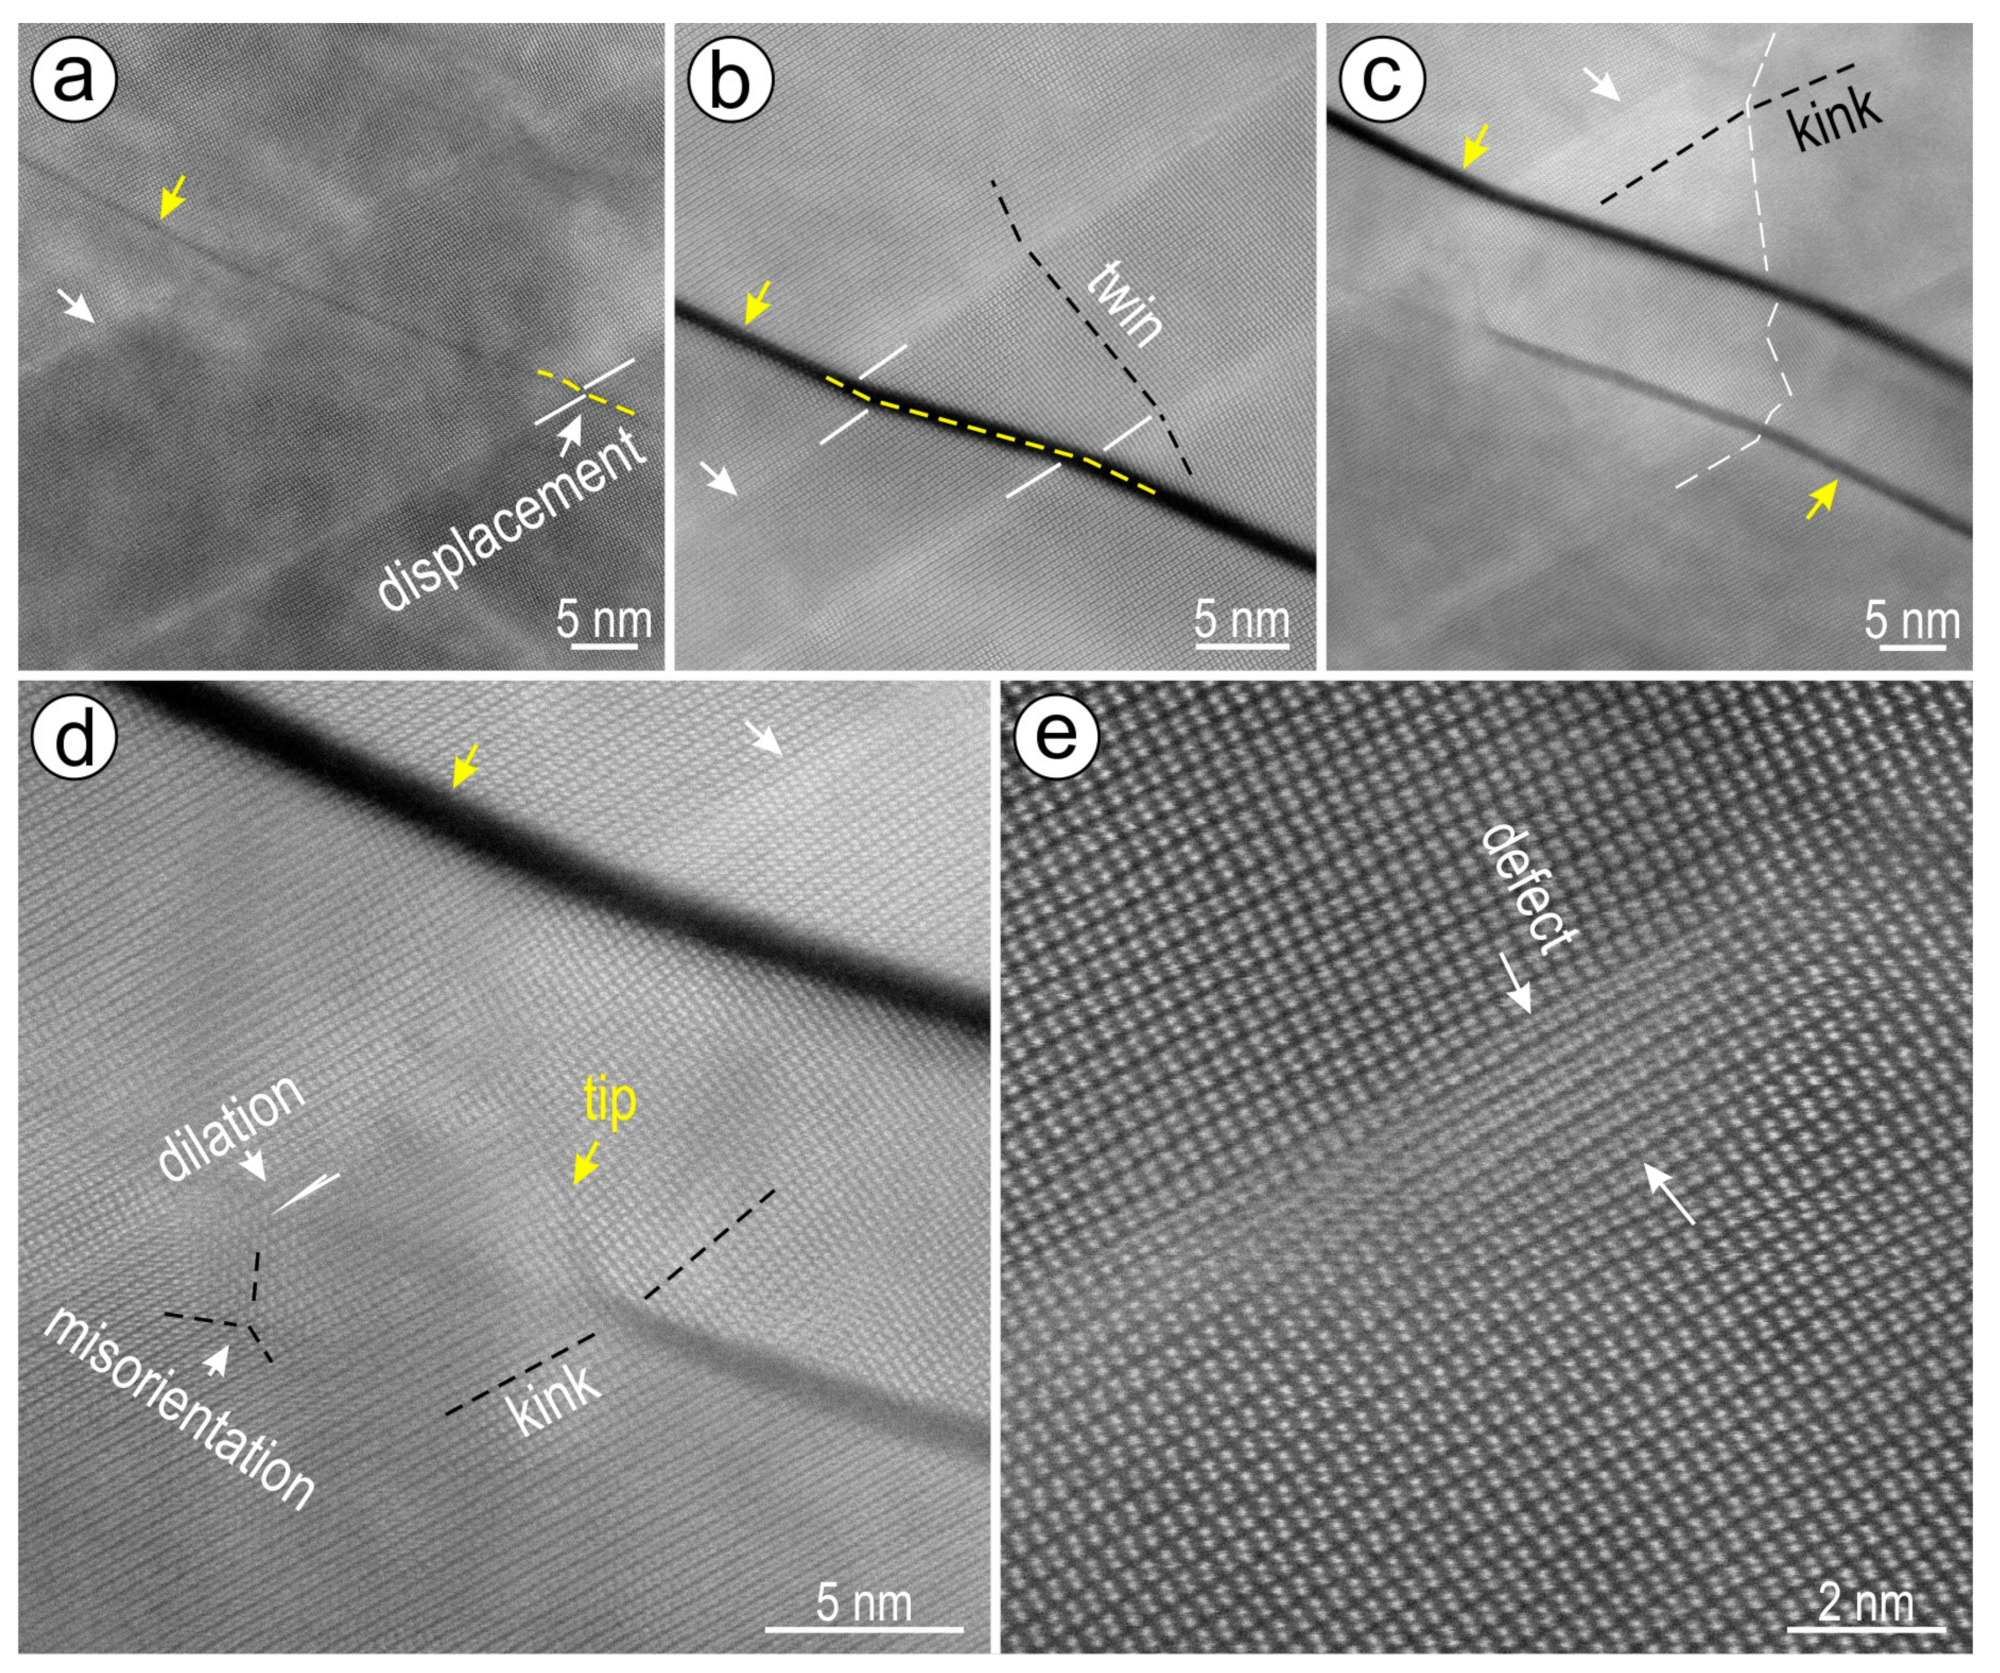
In all cases, the hematite represents a single grain as it shows continuous orientation throughout the foil, except for areas surrounding the trails in foils #1–3. In the Cu-As-zoned hematite, the lattice is free of defects (Figure 15a). In contrast, hematite close to the larger cavities displays sets of twinned nanodomains with 120° rotation relative to one another on [001] zone axis (Figure 15b). Such nanodomains are evidence for local recrystallisation since these changes in orientation are observed against the surrounding hematite titled on the [221] zone axis. Moreover, domains of lattice superstructuring are also present close to the walls of the cavities (Figure 15c). The micro-twins are shown by sets of satellite reflections on the [001] zone axis (Figure 15d). The two-fold superstructure is also shown as satellite reflections at ½ (012)* and ½ [102]* lattice vectors (Figure 15e). High-resolution imaging of weaved-twinned hematite shows lattice scale defects related to crosscutting relationships between the twins and the Si-Al-K-planes (Figure 16). The most common defects are displacements of twin boundaries at the junction with these planes. The magnitude of such displacements varies from one to several atom arrays with an increase of the Si-Al-K-plane width (Figure 16a,b).
More complex lattice scale defects are observed with respect to duplex planes crosscutting the twins (Figure 16c,d). In such cases, kink deformation is observed along the wider twin planes whereas nanodomains with misorientation surround the tips of the thinner Si-Al-K-planes. The twin planes also show linear defects at the crest of the twin propagating downwards into planar defects (Figure 16e).
4. Discussion and Summary
4.1. Can Fluid Inclusions be Fingerprinted at the Nanoscale?
The observations presented here show that cavities with negative crystal shapes (Figure 5c,d) have a topography which is chemically traceable from K, Cl, and C-bearing surfaces (Figure 7 and Figure 8). These elements are commonly associated with fluids trapped as fluid inclusions within a host mineral [34]. If so, the rounded voids/holes within the negative crystal shaped cavities are attributable to vapour bubbles, whereas the Cu-(As) NPs imaged on the walls of the same cavities (Figure 7 and Figure 8) correspond to solid phase components of the inclusions. The geometrical morphologies displayed by the coarser cavities can be related to the maturation of fluid inclusions during processes of re-equilibration, as has been proved experimentally ([35] and references therein).
Although fluid inclusion studies are often undertaken to track the fluid evolution of hydrothermal ore deposits, these are generally carried out on transparent rather than (semi)opaque host minerals such as hematite. Fluid inclusions in iron-oxides have nonetheless been addressed in several studies, for example from hematite from banded iron ores and crosscutting Au-Pd-Pt-quartz veins from Quadrilátero Ferrífero, Brazil [36,37]. In both cases, two- and three-phase fluid inclusions were documented, some of which display comparable hexagonal shapes as those reported here. The Quadrilátero Ferrífero hematite in the veins also contains measurable concentrations of Na, K, CO2 and SO4; the solid phases, however, could not be identified [37].
The cavities imaged and mapped in the present study can therefore be interpreted as relicts of fluid inclusions forming along trails in hematite that have been opened during foil cutting and milling. The mapped concentrations of K and Cl (Figure 7 and Figure 8) would represent a fingerprint of the fluid ± clathrate phases, such as sylvite (KCl). Similarly, the measured C may be correlated with a CO2-bearing vapour phase partially released during foil preparation. In addition, the metals (Cu, Mo, W) and As trapped as NPs within fluid inclusions (Figure 7 and Figure 8) represent components of a 3-phase (liquid-vapour-solid) system. Copper NPs are present in domain A which preserves Cu-As NPs along bands (Figure 6) outside of those trails containing fluid inclusions, whereas Cu-As NPs are present within the fluid inclusions occurring along trails from domain B. The presence of Cl is also detected within the smaller NPs (Figure 5a,b) as well as in the inclusions along splays from the weave-twinned hematite (Figure 13). The lack of detectable Na is possibly an intrinsic feature of the fluids preserved within the hematite but might equally be due to analytical conditions during sample preparation (lost by volatilization?).
4.2. Trace Element Mobilisation during Fluid-Mineral Interaction: Trapping Metal Nanoparticles
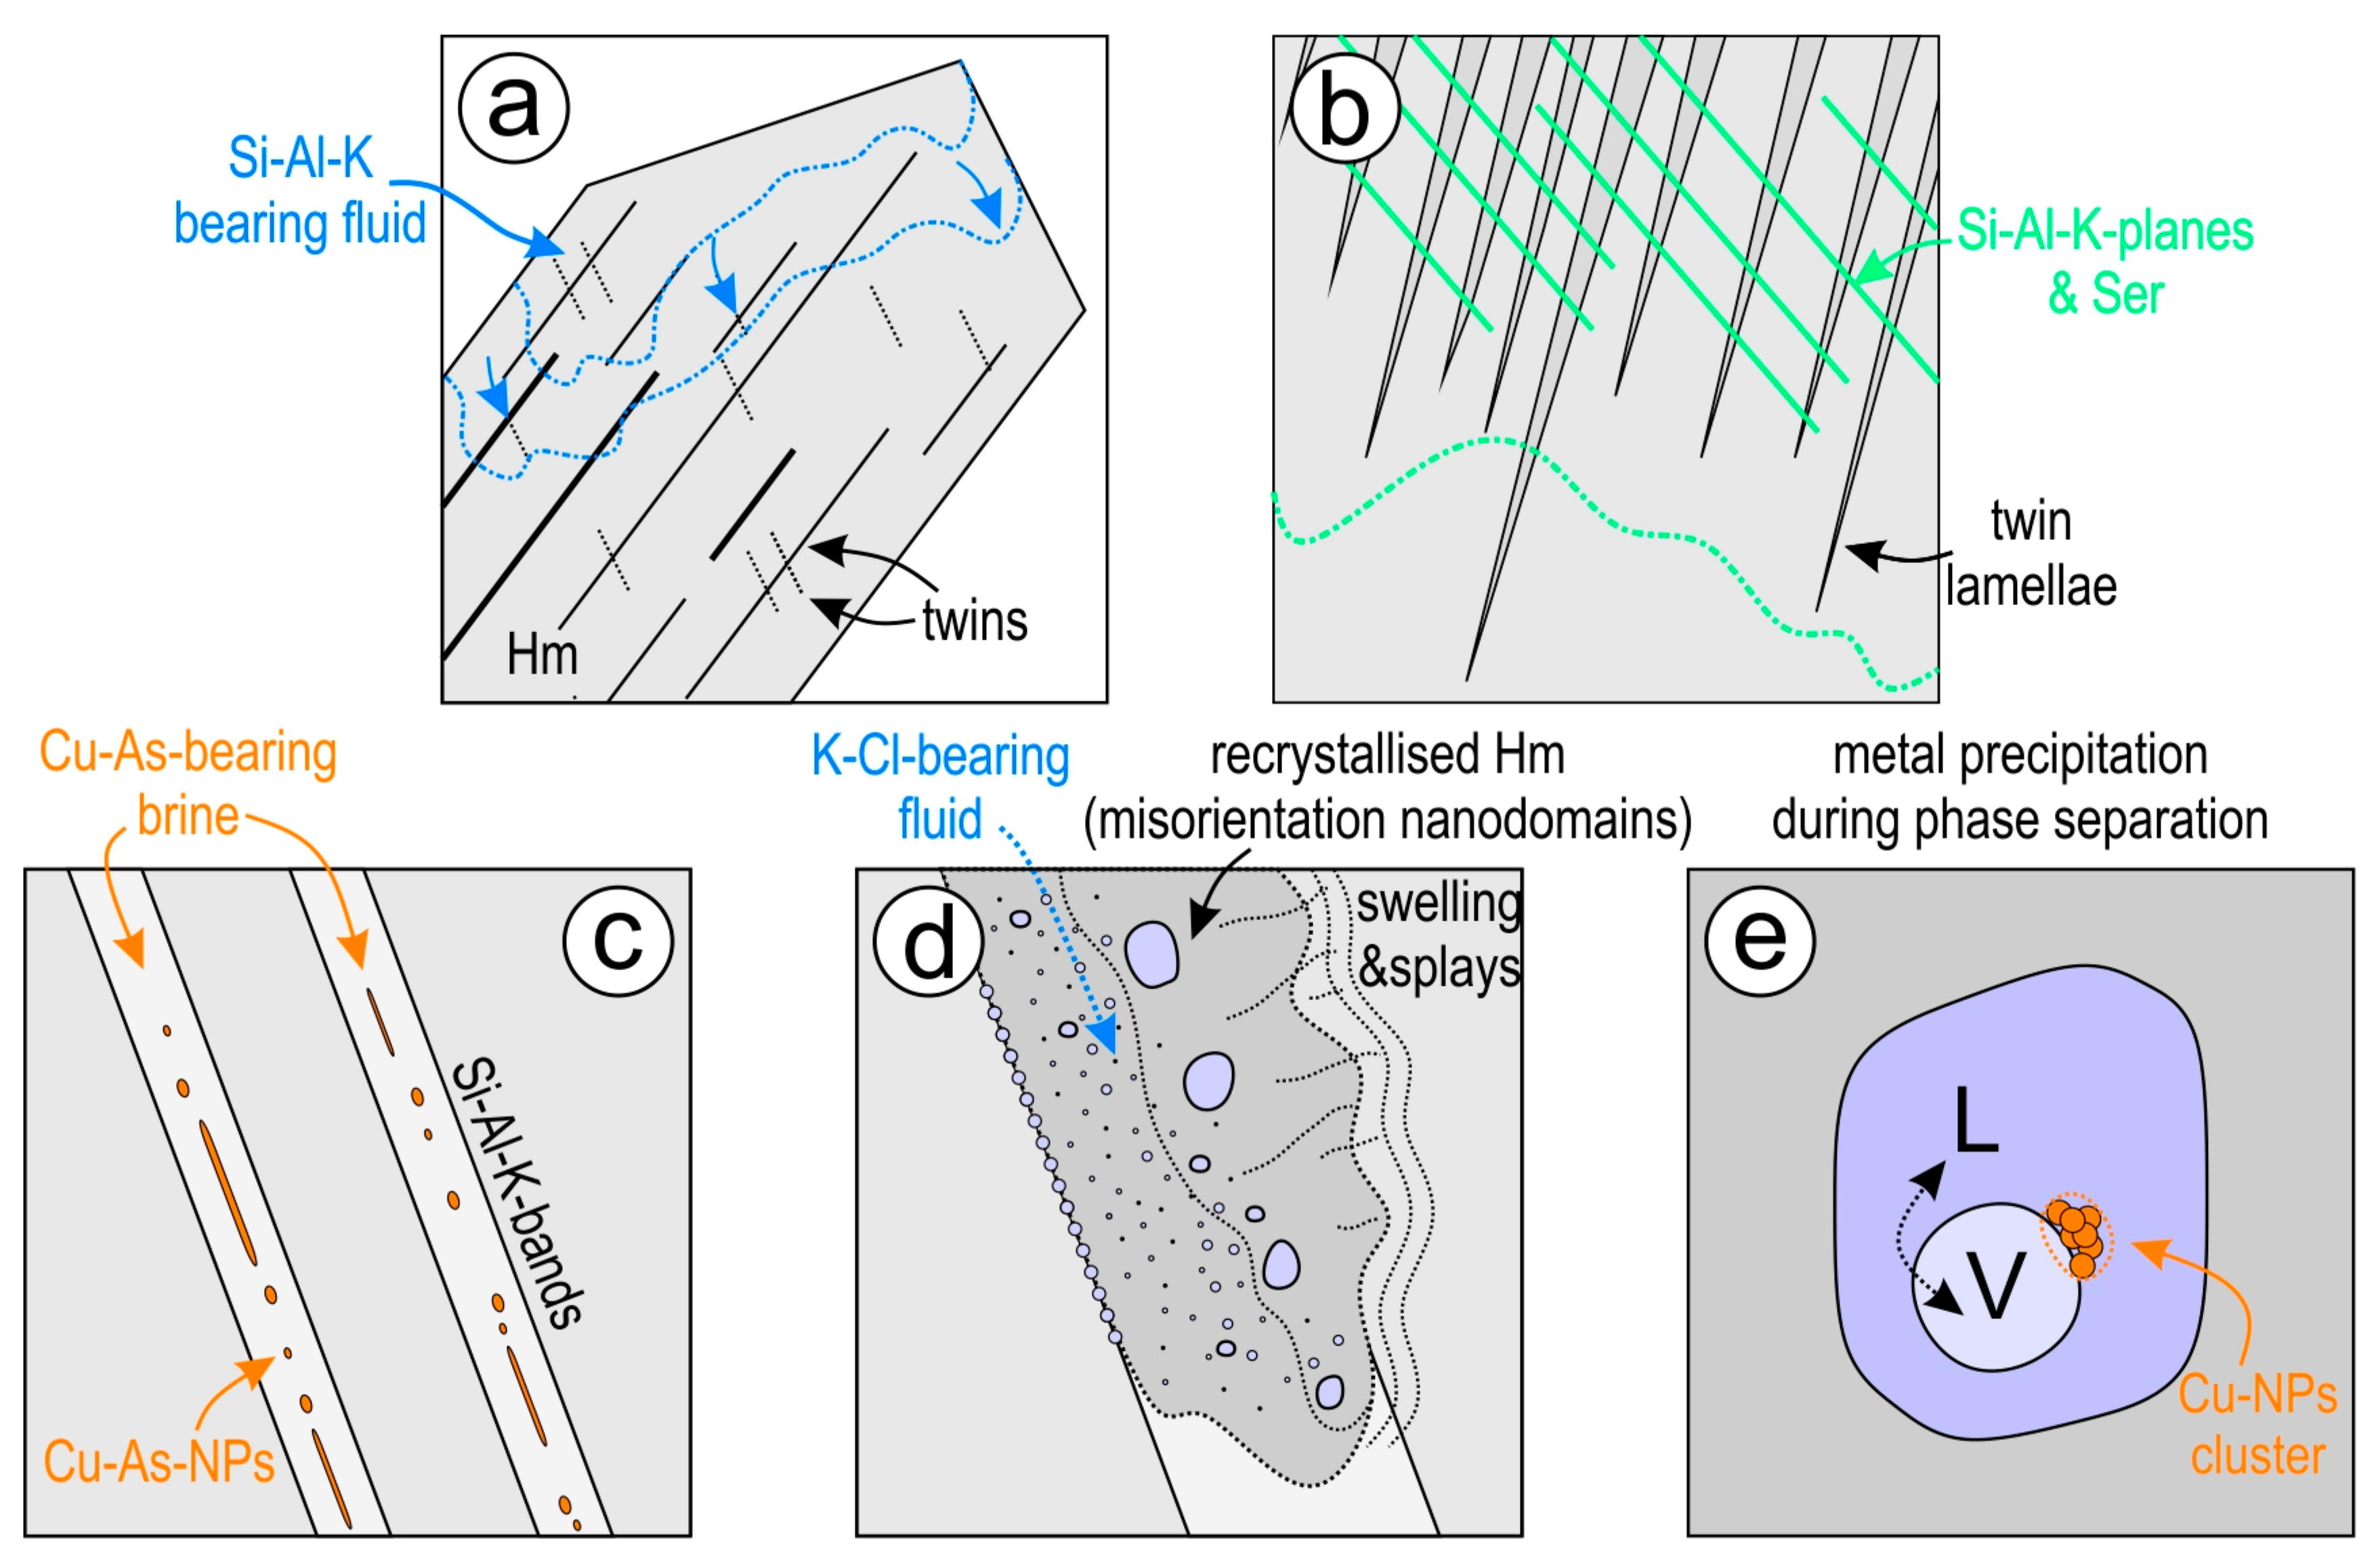
The formation of metal NPs of two distinct types, associated with trails of fluid inclusions and along Cu-As-bearing bands mapped with continuous appearance at the micron-scale (Figure 1) can be discussed in the context of fluid-mineral interaction during events that allow for, and facilitate changes in fluid chemistry and rates of fluid influx (Figure 17). Assuming that weave-twinned hematite represents the precursor mineral at the initial stage for the formation of metal NPs, the twin planes provide zones of weakness allowing percolation of Si-Al-K-bearing fluids (Figure 17a). If so, chemical disequilibrium between such a fluid and the host hematite facilitates reactions that result in precipitation of nm-wide Si-Al-K-phases and sericite lamellae placed discontinuously along the Si-Al-K-planes of fluid percolation (Figure 17b). We can assume that the infiltration takes place along a conjugate set of twins in hematite with 60° rotation relative to the twins observed and that these twins were obliterated in the course of reaction. Alternatively, fluid flow has a preferential direction relative to the grain orientation and infiltration is driven along parting planes in hematite rather than along pre-existing twins. Either way, the fact that a Si-Al-K-fluid interacts with pre-existing hematite is proven by the lattice defects (shown in Figure 16) and in mapping of these planes and sericite platelets in hematite (Figure 12). Formation of sericite is entirely consistent with the hydrolytic alteration observed at Olympic Dam [23] and in IOCG systems elsewhere ([38] and references therein).
A second stage in this model (Figure 17c,d) starts with metal-bearing brines percolating the same assemblage. Two different fluid rates can be inferred at this stage: (i) steady-state percolation along the Si-Al-K-planes; and (ii) erratic fluid focussing associated with strong pressure fluctuation. In case (i), a metal-bearing brine replaces pre-existing Si-Al-K-bearing bands leading to formation of Cu-As NPs (Figure 17c). The bands nevertheless preserve the initial signature along the margins (Figure 6; Supplementary Material Figure S2). In case (ii), fluid-focussing of this brine along the affected Cu-As-bearing bands initiates replacement fronts that couple dissolution with reprecipitation rates, a process leading to transient porosity along the reaction front (Figure 17d). Such pores can trap products formed during CDRR, and in this case, we suggest they could pool fluids, evolving into fluid inclusions. The misorientation of nanodomains and -twins in hematite are evidence that this is a newly formed hematite that precipitated in areas immediately surrounding the fluid inclusions (Figure 15). The latter are hosted within swells (Figure 17d) located on one side of the trail and linked to one another by splays to the smallest inclusions of NPSi-Hm, an observation suggestive of abrupt pressure fluctuation as considered for fault-valve mechanisms in orogenic Au deposits (e.g., [39]). Formation of metal-dominant NPs within three-phase fluid inclusions (Figure 17e) can be considered in the context of fault-valve depressurisation leading to phase separation and metal precipitation from the brines.
Formation of fluid inclusion-hosted NPs, close to the interface between the vapour bubble and fluid is attributable to a decrease in metal solubility in the fluid at the stage of phase separation. The suggested mechanism involving pressure fluctuation leading to metal discharge is comparable with devolatilization during hydrofracturing as considered for pore-attached Au-telluride NPs occurring within As-free pyrite [8]. Two metal source(s) are possible for the observed NPs: (i) Cu, As, Mo, W and Pb are remobilised from the hematite itself during superimposed CDRR processes, the primary hematite being oscillatory zoned with respect to U-(Pb)-W-Sn-Mo, as well as with Cu and As in this case [27]; and (ii) Cu and As are sourced from pre-existing Cu-(Fe)-sulphides from the enclosing hematite breccia, a scenario considered feasible in the context of the sulphide-poor interval from which the sample originates.
The fault-valve mechanism invoked for phase separation can be attributed to fault (re)activation. This is possible considering the presence of steeply dipping faults, with ~1 km vertical drop, along which the breccia formed [23].
In summary, the two hematite grains, although apparently unrelated at the micron-scale, have common geochemical signatures, and also display nanoscale aspects that allows interpretation of a shared genetic history. The Cu-As-bands exposed on the surface of analysed hematite (grain #1) extend as inclusion trails with two opposite directions at depth, with the same grain featuring sub-horizontal Cu-As-rich bands (Figure 1 and Figure 3). This indicates that such grains represent the equivalent of the weave-twinned hematite studied from grain #2 (Figure 2) but differ in having undergone more intense interaction with fluids. The textural and compositional variation between inclusions trails and Cu-As-bands throughout the same foil indicates that fluid flow was focussed along preferential directions within the volume of the same grain. The type of weave-twinned hematite studied from grain #2 is less affected by interaction with fluids and preserves characteristics intrinsic to its primary crystallisation. At this stage, it is unclear whether the twinning patterns represent characteristics inherited from the rock protolith, e.g., hematite replacing a pre-existing feldspar as is reported for hematite from Olympic Dam [40]. Alternatively, such weave-twin patterns may occur in hematite within breccias containing rock-flour milling produced during fault (re)activation. At Olympic Dam, several breccia types are polymict and contain volcanic clasts. The Si-hematite NPs found here within the reacted hematite requires further study, as this feature is likely more widespread in ores of various types and would represent a key texture for recognition of overprinting events. For example, Si-bearing hematite (up to 1.51 wt. % SiO2) has been documented from hematite grains with oscillatory zoning at the micron scale in banded ion formation ores (Middleback Ranges, South Australia; [41]).
5. Implications
The results presented here attest to the importance of CDRR and the generation of transient porosity in the formation of NPs associated with fluid inclusions, and how these impact on observed trace element signatures measured at the micron-scale (e.g., by LA-ICP-MS). If characterized at appropriate scales of observation, such features represent evidence for open system behaviour in hematite and other minerals, with broad applicability to a range of geochemical systems.
Demonstration of open system behaviour at the nanoscale carries implications for the decoupling and mobilization of daughter radionuclides from their parent isotopes (e.g., [42,43]. In turn, such pseudo-fractionation would cause a modification of isotope systematics affecting accurate interpretations of U-Pb microbeam-dating of hematite [24,44], or other minerals. This is particularly valid whenever the replacement process is highly selective and allows primary zonation patterns to be at least partially preserved [27].
This study further highlights the advantages of HAADF STEM imaging as a valuable technique to understand and correctly interpret trace element compositional data. The presence of Cu within hematite at Olympic Dam represents additional evidence for the simultaneous introduction of Fe, Cu, and U.
Supplementary Materials
Supporting figures (Figures S1–S7) are available at https://www.mdpi.com/2075-163X/9/7/388/s1. Figure S1. Low-magnification HAADF STEM image of the foil (foil #4) from the weave-twinned hematite showing areas of interest. Ser-sericite; Hm-hematite. Figure S2. HAADF STEM and STEM EDX maps of Cu-As NP with acicular morphology hosted within bright band (foil #1). Note the presence of Si, K and Al surrounding the margins of the needle and/or proximal to it. Ser-sericite. Figure S3. HAADF STEM and STEM-EDX maps of hexagonal cavity in Foil #3 (domain B) featuring the presence of voids and a Cu-As NP. Though F-Kα partially overlaps with Fe-Lα in the lower energy spectrum, note that enrichment of F is observed within the cavity, rather than outside, in the host hematite. Figure S4. HAADF STEM and STEM-EDX maps of cavity hosting W- and Mo-bearing NPs (foil #3, domain B). Although the EDX peak position of Mo-Lα partially overlaps with that of Pb-Mα, the presence of characteristic Mo-Kα peaks is observed in the higher energy interval of the spectrum. Figure S5. HAADF STEM and STEM-EDX maps of large cavity in foil #1 displaying the presence of a void and strong enrichment in Cu correlating with Cl. Native copper NPs are observed proximal to the void. Figure S6. HAADF STEM and STEM-EDX maps of cavity in foil #2 (domain A) displaying the presence of a void and compositional heterogeneity within the inclusion (compare distributions of Ca versus Si and Al). Figure S7. Representative STEM EDX spectra for observed NPs within cavities or directly hosted by hematite. The spectra are scaled individually to emphasise features of interest; typical hematite spectrum is shown (top left) for comparison. Note the relative differences between the Fe-K and Cu-K intensities in hematite host relative to the Cu-As-bearing NP.
Author Contributions
M.R.V.-I. and C.L.C. conceived this contribution and conducted all analytical work, assisted by A.S. (HAADF STEM imaging). K.E. provided sample material and guidance. The manuscript was written by M.R.V.-I., C.L.C. and N.J.C., with contributions from K.E., L.C.-D. and A.S.
Funding
This research is a contribution to the FOX project “Trace elements in iron-oxides: deportment, distribution and application in ore genesis, geochronology, exploration and mineral processing”, supported by BHP Olympic Dam and the South Australian Government Mining and Petroleum Services Centre of Excellence. N.J.C. acknowledges support from the ARC Research Hub for Australian Copper-Uranium (Grant IH130200033).
Acknowledgments
We extend thanks to the staff of Adelaide Microscopy, particularly Sarah Gilbert and Benjamin Wade, who have assisted the FOX project in various ways. We kindly thank four anonymous reviewers for their positive feedback and constructive comments that helped us improve this manuscript.
Conflicts of Interest
The authors declare no conflicts of interest.
References
- Reich, M.; Hough, R.M.; Deditius, A.; Utsunomiya, S.; Ciobanu, C.L.; Cook, N.J. Nanogeoscience in ore systems research: Principles, methods, and applications. Ore Geol. Rev. 2011, 42, 1–5. [Google Scholar] [CrossRef]
- Palenik, C.S.; Utsunomiya, S.; Reich, M.; Kesler, S.E.; Wang, L.; Ewing, R.C. “Invisible” gold revealed: Direct imaging of gold nanoparticles in a Carlin-type deposit. Am. Mineral. 2004, 89, 1359–1366. [Google Scholar] [CrossRef]
- Reich, M.; Kesler, S.E.; Utsunomiya, S.; Palenik, C.S.; Chryssoulis, S.L.; Ewing, R.C. Solubility of gold in arsenian pyrite. Geochim. Cosmochim. Acta 2005, 69, 2781–2796. [Google Scholar] [CrossRef]
- Hannington, M.; Garbe-Schönberg, D. Detection of gold nanoparticles in hydrothermal fluids. Econ. Geol. 2019, 114, 397–400. [Google Scholar] [CrossRef]
- Wirth, R.; Reid, D.; Schreiber, A. Nanometer-sized platinum-group minerals (PGM) in base metal sulfides: New evidence for an orthomagmatic origin of the Merensky Reef PGE ore deposit, Bushveld Complex, South Africa. Can. Mineral. 2013, 51, 143–155. [Google Scholar] [CrossRef]
- Junge, M.; Wirth, R.; Oberthür, T.; Melcher, F.; Schreiber, A. Mineralogical siting of platinum-group elements in pentlandite from the Bushveld Complex, South Africa. Miner. Depos. 2015, 50, 41–54. [Google Scholar] [CrossRef]
- Baurier-Aymat, S.; Jiménez-Franco, A.; Roqué-Rosell, J.; González-Jiménez, J.M.; Gervilla, F.; Proenza, J.A.; Mendoza, J.; Nieto, F. Nanoscale Structure of Zoned Laurites from the Ojén Ultramafic Massif, Southern Spain. Minerals 2019, 9, 288. [Google Scholar] [CrossRef]
- Ciobanu, C.L.; Cook, N.J.; Utsunomiya, S.; Kogagwa, M.; Green, L.; Gilbert, S.; Wade, B. Gold-telluride nanoparticles revealed in arsenic-free pyrite. Am. Mineral. 2012, 97, 1515–1518. [Google Scholar] [CrossRef]
- Owen, N.D.; Ciobanu, C.L.; Cook, N.J.; Slattery, A.; Basak, A. Nanoscale Study of Clausthalite-Bearing Symplectites in Cu-Au-(U) Ores: Implications for Ore Genesis. Minerals 2018, 8, 28. [Google Scholar] [CrossRef]
- Tooth, B.; Ciobanu, C.L.; Green, L.; O’Neill, B.; Brugger, J. Bi-melt formation and gold scavenging from hydrothermal fluids: An experimental study. Geochim. Cosmochim. Acta 2011, 75, 5423–5443. [Google Scholar] [CrossRef]
- Putnis, C.V.; Tsukamoto, K.; Nishimura, Y. Direct observations of pseudomorphism: Compositional and textural evolution at a fluid-solid interface. Am. Mineral. 2005, 90, 1909–1912. [Google Scholar] [CrossRef]
- Xu, H.; Shen, Z.; Konishi, H. Si-magnetite nano-precipitates in silician magnetite from banded iron formation: Z-contrast imaging and ab initio study. Am. Mineral. 2014, 99, 2196–2202. [Google Scholar] [CrossRef]
- Deditius, A.P.; Reich, M.; Simon, A.C.; Suvorova, A.; Knipping, J.; Roberts, M.P.; Rubanov, S.; Dodd, A.; Saunders, M. Nanogeochemistry of hydrothermal magnetite. Contrib. Mineral. Petrol. 2018, 173, 46. [Google Scholar] [CrossRef]
- Ciobanu, C.L.; Verdugo-Ihl, M.R.; Slattery, A.; Cook, N.J.; Ehrig, K.; Courtney-Davies, L.; Wade, B.P. Silician Magnetite: Si–Fe-Nanoprecipitates and Other Mineral Inclusions in Magnetite from the Olympic Dam Deposit, South Australia. Minerals 2019, 9, 311. [Google Scholar] [CrossRef]
- Cook, N.J.; Ciobanu, C.L.; Ehrig, K.; Slattery, A.; Verdugo-Ihl, M.R.; Courtney-Davies, L.; Gao, W. Advances and Opportunities in Ore Mineralogy. Minerals 2017, 7, 233. [Google Scholar] [CrossRef]
- Ciobanu, C.L.; Cook, N.J.; Utsunomiya, S.; Pring, A.; Green, L. Focussed ion beam–transmission electron microscopy applications in ore mineralogy: Bridging micro- and nanoscale observations. Ore Geol. Rev. 2011, 42, 6–31. [Google Scholar] [CrossRef]
- Ciobanu, C.; Cook, N.; Maunders, C.; Wade, B.; Ehrig, K. Focused Ion Beam and Advanced Electron Microscopy for Minerals: Insights and Outlook from Bismuth Sulphosalts. Minerals 2016, 6, 112. [Google Scholar] [CrossRef]
- Cook, N.; Ciobanu, C.; George, L.; Zhu, Z.-Y.; Wade, B.; Ehrig, K. Trace Element Analysis of Minerals in Magmatic-Hydrothermal Ores by Laser Ablation Inductively-Coupled Plasma Mass Spectrometry: Approaches and Opportunities. Minerals 2016, 6, 111. [Google Scholar] [CrossRef]
- Keyser, W.; Ciobanu, C.L.; Cook, N.J.; Feltus, H.; Johnson, G.; Slattery, A.; Wade, B.P.; Ehrig, K. Mineralogy of Zirconium in Iron-Oxides: A Micron- to Nanoscale Study of Hematite Ore from Peculiar Knob, South Australia. Minerals 2019, 9, 244. [Google Scholar] [CrossRef]
- Xu, J.; Ciobanu, C.L.; Cook, N.J.; Slattery, A. Crystals from the scheelite-powellite solid-solution series at the nanoscale: The Zhibula Cu skarn, Gangdese Belt, Tibet. Minerals 2019, 9, 340. [Google Scholar] [CrossRef]
- Courtney-Davies, L.; Ciobanu, C.L.; Verdugo-Ihl, M.R.; Slattery, A.; Cook, N.J.; Dmitrijeva, M.; Keyser, W.; Wade, B.P.; Dominick, U.I.; Ehrig, K.; et al. Zircon at the nanoscale records metasomatic processes leading to large magmatic-hydrothermal ore deposits. Minerals 2019, 9, 364. [Google Scholar] [CrossRef]
- Viti, C.; Frezzotti, M.-L. Transmission electron microscopy applied to fluid inclusion investigations. Lithos 2001, 55, 125–138. [Google Scholar] [CrossRef]
- Ehrig, K.; McPhie, J.; Kamenetsky, V. Geology and Mineralogical Zonation of the Olympic Dam Iron Oxide Cu-U-Au-Ag Deposit, South Australia. In Geology and Genesis of Major Copper Deposits and Districts of the World: A Tribute to Richard H. Sillitoe, Special Publication 16; Hedenquist, J.W., Harris, M., Camus, F., Eds.; Society of Economic Geologists: Littleton, CO, USA, 2012; pp. 237–267. [Google Scholar]
- Ciobanu, C.L.; Wade, B.P.; Cook, N.J.; Schmidt Mumm, A.; Giles, D. Uranium-bearing hematite from the Olympic Dam Cu–U–Au deposit, South Australia: A geochemical tracer and reconnaissance Pb–Pb geochronometer. Precambrian Res. 2013, 238, 129–147. [Google Scholar] [CrossRef]
- Courtney-Davies, L.; Ciobanu, C.L.; Tapster, S.R.; Cook, N.J.; Ehrig, K.J.; Kennedy, A.K.; Condon, D.J.; Verdugo-Ihl, M.R.; Wade, B.S.; Gilbert, S.E. The U-Pb systematics of hydrothermal hematite: Insights from the IOCG system at Olympic Dam, South Australia. In Proceedings of the 15th Quadrennial International Association on the Genesis of Ore Deposits Symposium, Salta, Argentina, 28–31 August 2018; pp. 171–172. [Google Scholar]
- Cherry, A.R.; Ehrig, K.; Kamenetsky, V.S.; McPhie, J.; Crowley, J.L.; Kamenetsky, M.B. Precise geochronological constraints on the origin, setting and incorporation of ca. 1.59 Ga surficial facies into the Olympic Dam Breccia Complex, South Australia. Precambrian Res. 2018, 315, 162–178. [Google Scholar] [CrossRef]
- Verdugo-Ihl, M.R.; Ciobanu, C.L.; Cook, N.J.; Ehrig, K.J.; Courtney-Davies, L.; Gilbert, S. Textures and U-W-Sn-Mo signatures in hematite from the Olympic Dam Cu-U-Au-Ag deposit, South Australia: Defining the archetype for IOCG deposits. Ore Geol. Rev. 2017, 91, 173–195. [Google Scholar] [CrossRef]
- Nickel, E.H. The new mineral cuprospinel (CuFe2O4) and other spinels from an oxidized ore dump at Baie Verte, Newfoundland. Can. Mineral. 1973, 11, 1003–1007. [Google Scholar]
- Gotić, M.; Dražić, G.; Musić, S. Hydrothermal synthesis of α-Fe2O3 nanorings with the help of divalent metal cations, Mn2+, Cu2+, Zn2+ and Ni2+. J. Mol. Struct. 2011, 993, 167–176. [Google Scholar] [CrossRef]
- Moore, P.B. Substitutions of the type (Sb0.55+Fe0.53+⇄Ti4+): The crystal structure of melanostibite. Am. Mineral. 1968, 53, 1104–1109. [Google Scholar]
- Ciobanu, C.L. Trace element signatures in sulfides at Olympic Dam and satellite prospects: A reconnaissance study for ore vectoring using Cu-(Fe)-sulfides in Iron Oxide Copper Gold Deposits; The University of Adelaide: Adelaide, Australia, 2015; Unpublished Report. [Google Scholar]
- Subramanian, P.R.; Laughlin, D.E. The As−Cu (arsenic-copper) system. Bull. Alloy Phase Diagrams 1988, 9, 605–618. [Google Scholar] [CrossRef]
- Maslen, E.N.; Streltsov, V.A.; Streltsova, N.R.; Ishizawa, N. Synchrotron X-ray study of the electron density in α-Fe2O3. Acta Crystallogr. Sect. B Struct. Sci. 1994, 50, 435–441. [Google Scholar] [CrossRef]
- Roedder, E. Fluid inclusions. Rev. Mineral. 1984, 12, 646. [Google Scholar]
- Bodnar, R.J. Reequilibration of fluid inclusions. In Fluid inclusions: Analysis and interpretation, Short Course 32; Samson, I., Anderson, A., Marshal, D., Eds.; Mineralogical Association of Canada: Ottawa, ON, Canada, 2003; pp. 213–230. [Google Scholar]
- Rosiere, C.A.; Rios, F.J. The origin of hematite in high-grade iron ores based on infrared microscopy and fluid inclusion studies: The example of the Conceição Mine, Quadrilátero Ferrífero, Brazil. Econ. Geol. 2004, 99, 611–624. [Google Scholar] [CrossRef]
- Lüders, V.; Romer, R.L.; Cabral, A.R.; Schmidt, C.; Banks, D.A.; Schneider, J. Genesis of itabirite-hosted Au–Pd–Pt-bearing hematite-(quartz) veins, Quadrilátero Ferrífero, Minas Gerais, Brazil: Constraints from fluid inclusion infrared microthermometry, bulk crush-leach analysis and U–Pb systematics. Miner. Depos. 2005, 40, 289–306. [Google Scholar] [CrossRef]
- Barton, M.D. Iron Oxide(–Cu–Au–REE–P–Ag–U–Co) Systems. In Treatise on Geochemistry; Elsevier: Amsterdam, The Netherlands, 2014; Volume 13, pp. 515–541. ISBN 9780080959757. [Google Scholar]
- Sibson, R.H.; Robert, F.; Poulsen, K.H. High-angle reverse faults, fluid-pressure cycling, and mesothermal gold-quartz deposits. Geology 1988, 16, 551. [Google Scholar] [CrossRef]
- Verdugo-Ihl, M.R.; Ciobanu, C.L.; Cook, N.J.; Ehrig, K.J.; Courtney-Davies, L. Defining early stages of IOCG systems: Evidence from iron oxides in the outer shell of the Olympic Dam deposit, South Australia. Miner. Depos. 2019, 1–24. [Google Scholar] [CrossRef]
- Keyser, W.; Ciobanu, C.L.; Cook, N.J.; Johnson, G.; Feltus, H.; Johnson, S.; Dmitrijeva, M.; Ehrig, K.; Nguyen, P.T. Petrography and trace element signatures of iron-oxides in deposits from the Middleback Ranges, South Australia: From banded iron formation to ore. Ore Geol. Rev. 2018, 93, 337–360. [Google Scholar] [CrossRef]
- Rollog, M.; Cook, N.J.; Guagliardo, P.; Ehrig, K.; Kilburn, M. In situ spatial distribution mapping of radionuclides in minerals by nanoSIMS. Geochemistry Explor. Environ. Anal. 2018. [Google Scholar] [CrossRef]
- Rollog, M.; Cook, N.J.; Guagliardo, P.; Ehrig, K.; Ciobanu, C.L.; Kilburn, M. Detection of trace elements/isotopes in Olympic Dam copper concentrates by nanoSIMS. Minerals 2019, 9, 336. [Google Scholar] [CrossRef]
- Courtney-Davies, L.; Tapster, S.R.; Ciobanu, C.L.; Cook, N.J.; Verdugo-Ihl, M.R.; Ehrig, K.J.; Kennedy, A.K.; Gilbert, S.E.; Condon, D.J.; Wade, B.P. A multi-technique evaluation of hydrothermal hematite U Pb isotope systematics: Implications for ore deposit geochronology. Chem. Geol. 2019, 513, 54–72. [Google Scholar] [CrossRef]
Figure 1.
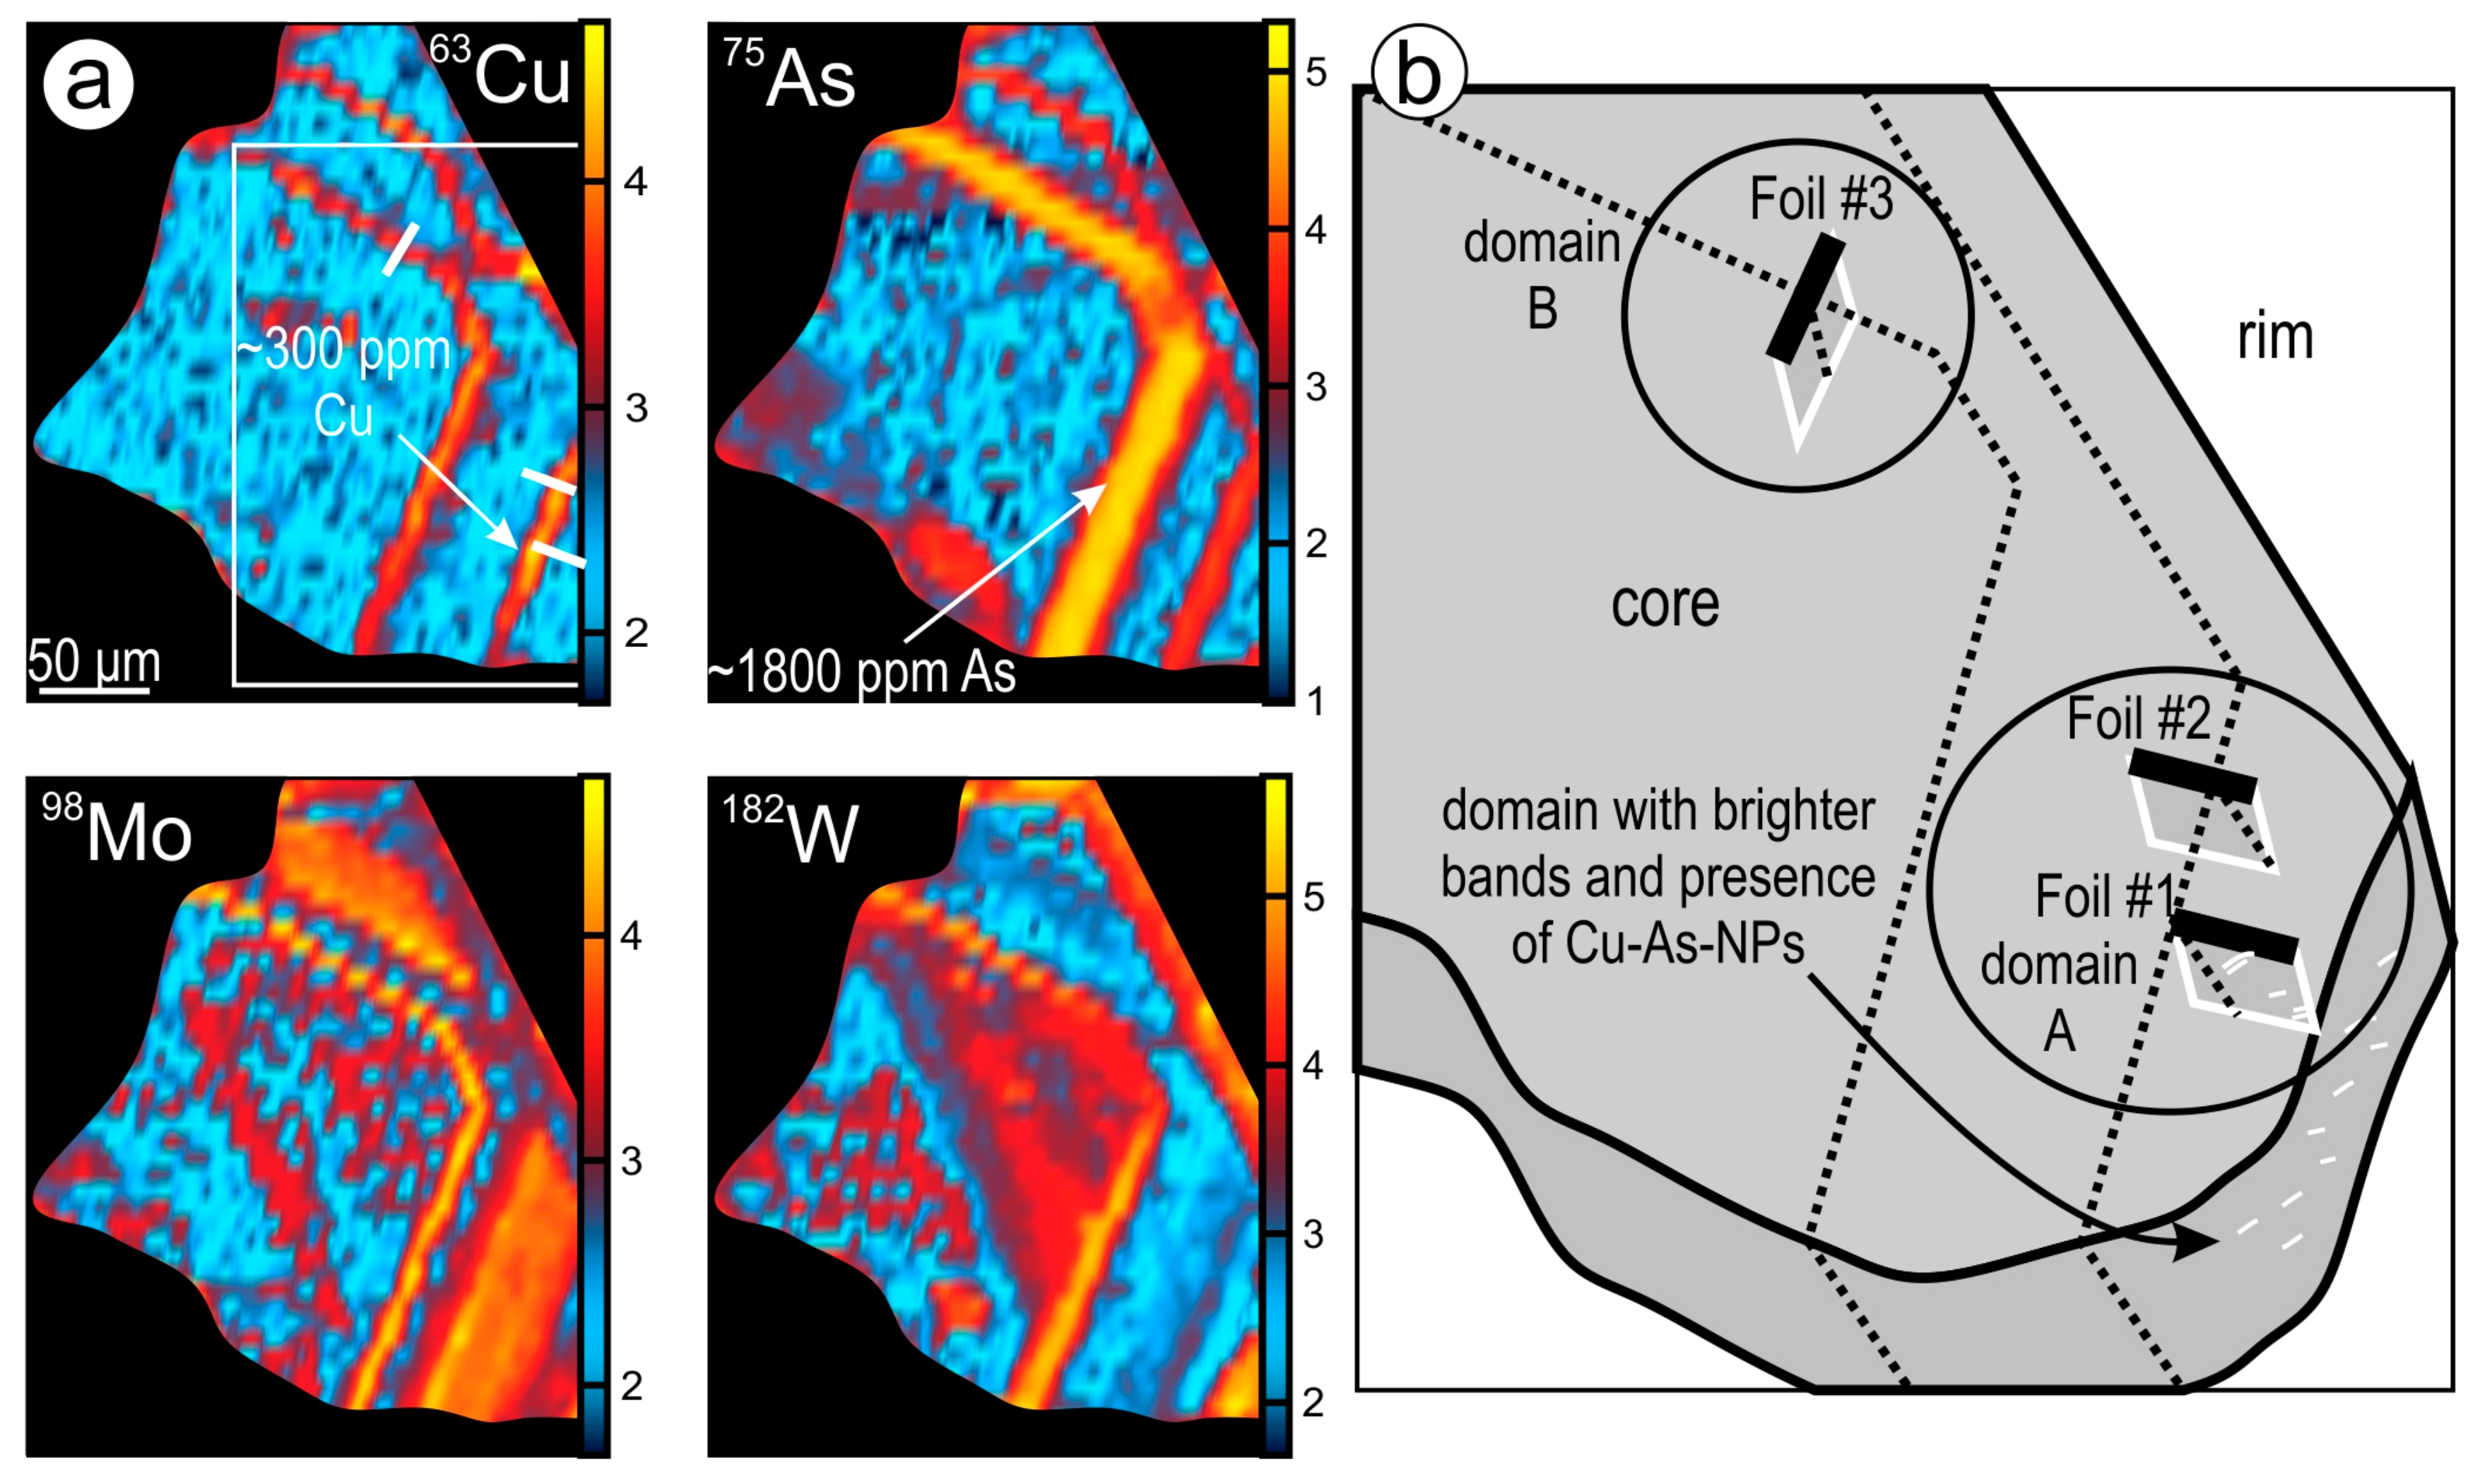
(a) LA-ICP-MS element maps of hematite (grain #1) displaying oscillatory zoning with respect to Cu and As. The distributions of both elements partially overlap with other metals such as Mo and W (modified from [27]). Other metal/metalloids showing zoning in this grain are Sb, Sn, and U. Intensities are in counts-per-second (logarithmic scale, 10n). Concentrations of Cu and Sb in the bands can reach up to ~300 and ~200 ppm, respectively, whereas As concentrations are an order of magnitude higher (up to ~1800 ppm). Locations of FIB cuts for extraction of S/TEM foils are shown as white bars. (b) 3D schematic showing the location of the three foils (foils #1–3) relative to zoning and trails observed at depth (dashed black lines). Two domains (A and B) are defined relative to the sides of the grain in which domain A features bright bands (dashed white lines) hosting Cu-As NPs. Note the variable orientation of trails relative to the grain core.
Figure 1.
(a) LA-ICP-MS element maps of hematite (grain #1) displaying oscillatory zoning with respect to Cu and As. The distributions of both elements partially overlap with other metals such as Mo and W (modified from [27]). Other metal/metalloids showing zoning in this grain are Sb, Sn, and U. Intensities are in counts-per-second (logarithmic scale, 10n). Concentrations of Cu and Sb in the bands can reach up to ~300 and ~200 ppm, respectively, whereas As concentrations are an order of magnitude higher (up to ~1800 ppm). Locations of FIB cuts for extraction of S/TEM foils are shown as white bars. (b) 3D schematic showing the location of the three foils (foils #1–3) relative to zoning and trails observed at depth (dashed black lines). Two domains (A and B) are defined relative to the sides of the grain in which domain A features bright bands (dashed white lines) hosting Cu-As NPs. Note the variable orientation of trails relative to the grain core.

Figure 2.
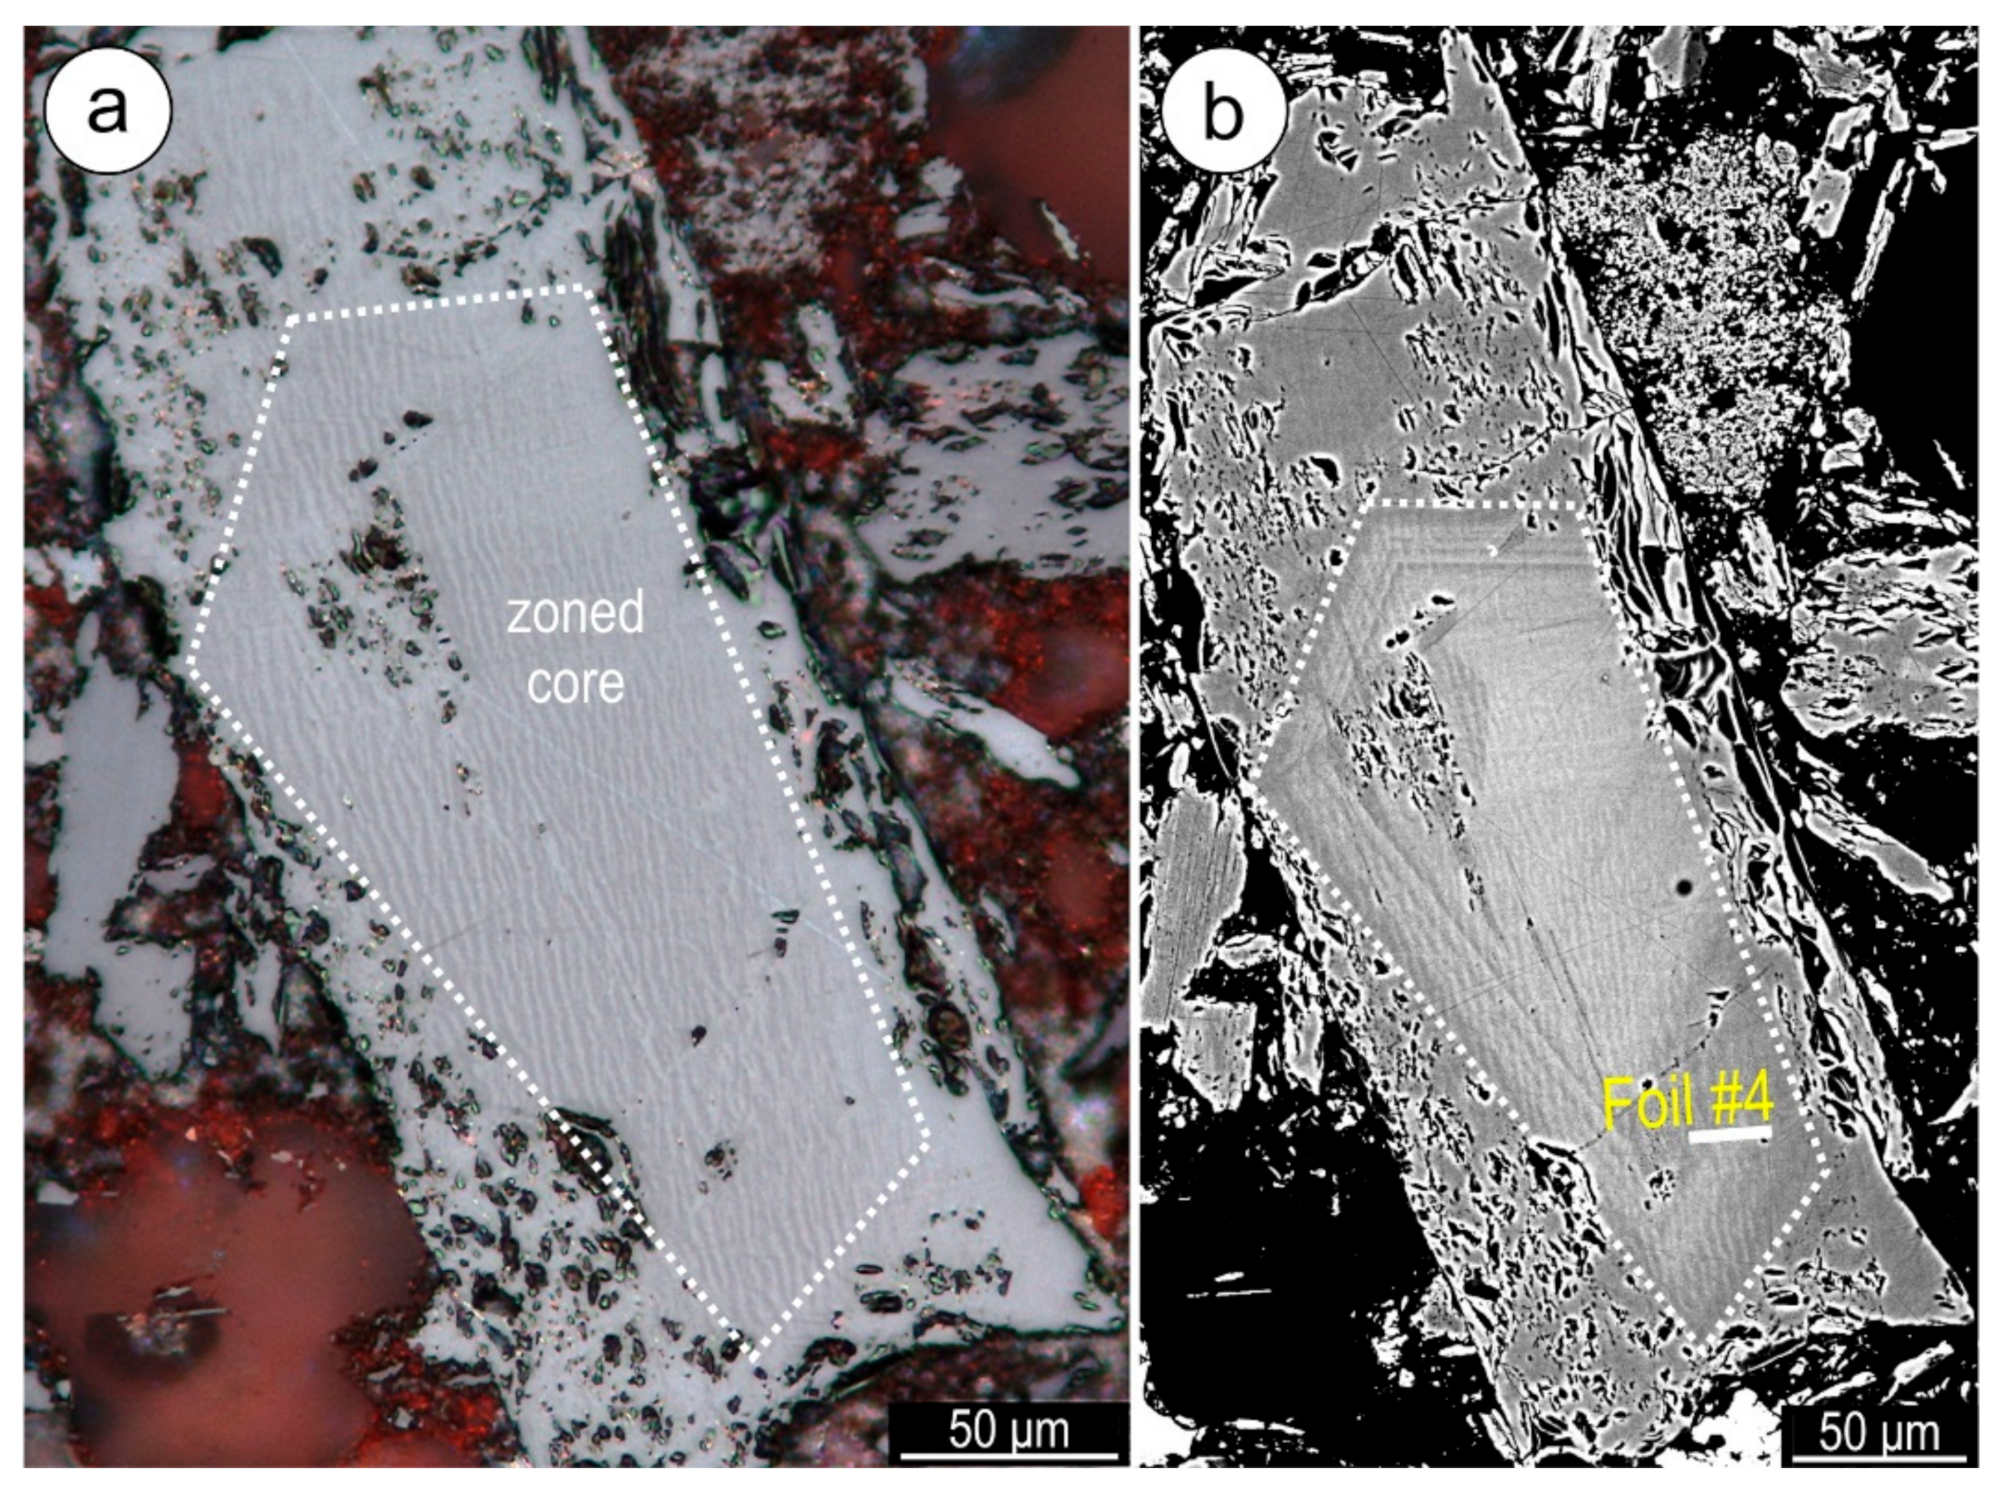
(a) Reflected light microphotograph of weave-twinned hematite (grain #2) and (b) back scattered electron image of the same grain showing oscillatory zonation patterns. Note the two textures overlap with one another within the grain core (dashed line). Location of extracted foil (Foil #4) is marked on (b). Obtained foil shown in Supplementary Material Figure S1.
Figure 2.
(a) Reflected light microphotograph of weave-twinned hematite (grain #2) and (b) back scattered electron image of the same grain showing oscillatory zonation patterns. Note the two textures overlap with one another within the grain core (dashed line). Location of extracted foil (Foil #4) is marked on (b). Obtained foil shown in Supplementary Material Figure S1.

Figure 3.
(a–c) HAADF STEM images of foils from grain 1 (foils #1–3) showing textures of Cu-As-zoned hematite. Trails of inclusions and cavities (white lines) with (sub)vertical orientation differ to (sub)horizontal, bright bands (yellow lines) observed in domain A. Inset in (a) shows one of the Cu-As NP along the “bright bands”. Note that the foils are oriented from the core of the hematite grain (left) to its margin (right) in all cases for comparison with the schematic shown as Figure 1b.

Figure 4.
HAADF STEM images showing distribution of inclusions and cavities along trails in hematite. (a) Trail representative for the asymmetric distribution of inclusions and cavities (subvertical trail in Figure 3c rotated at 90°). Note that the coarsest inclusions are placed within swells (yellow line) on one side of the trail. (b) Variation across trail width (several hundred nm; foil #2) showing the finest inclusions (<20 nm) as a continuous array on one side expanding into coarsest cavities (~300–400 nm size) on the other side. Swarms of small inclusions are present throughout the area. (c) Detail of trail in (a) showing a mixture of inclusions and cavities along the array defining the trail on one side. Note hexagonal to tabular morphologies (arrowed) of cavity/inclusions but with swarms of NPs still present throughout the area. (d) Detail from (a) showing distribution of inclusions/cavities along diagonal splays propagating from one side of the trail.

Figure 5.
(a) HAADF STEM image of a NP interpreted as Si-bearing hematite (NPSi-Hm). (b,c) Representative STEM EDX spectra showing composition of NPSi-Hm. Note the presence of Si and Fe in both cases. Common to such NPs is the presence of Cl; note strong peak in (b). Minor Al, and trace K can occasionally be present. (d,e) HAADF STEM images showing cavities with negative crystal shapes with hexagonal outline showing rounded voids.

Figure 6.
STEM EDX maps of Cu-As NPs hosted within bright bands (foil #1) with acicular (needle in (a)) and hexagonal (b) morphology. (c) Integrated, molar-profile across Cu-As-needle shown in (a). Note the positive correlation between Si, K and Al (sericite?) on the margins of the Cu-As NP. The profiles correspond to background-subtracted intensities to avoid interference from the copper grid.

Figure 7.
HAADF STEM image (upper left, right) and STEM EDX element maps (foil #3, domain B; extended maps are shown in Supplementary Material Figures S3 and S4) of (a) coarse negative crystal shaped cavity showing the presence of Cu, As, Cl and C, and (b) the presence of W and Mo NPs within the cavity. Copper and As are highest and overlap, indicating a Cu-As NP. The other elements are likely retained on the wall of the cavity. Note the rounded voids are empty.

Figure 8.
HAADF STEM images (left) and STEM EDX maps (extended maps in Supplementary Material Figures S4 and S5; foil #1–2 in (a,b), respectively) showing native Cu NPs within negative crystal shaped cavities from domain A. Note the presence of Cl and K within the cavities.
Figure 8.
HAADF STEM images (left) and STEM EDX maps (extended maps in Supplementary Material Figures S4 and S5; foil #1–2 in (a,b), respectively) showing native Cu NPs within negative crystal shaped cavities from domain A. Note the presence of Cl and K within the cavities.

Figure 9.
(a,b) Atomic-scale resolution images of native copper NPs. (a) Agglomeration of Cu NPs placed adjacent to the empty void in Figure 8a. (b) Distribution of Cu atoms in one of the NPs in (a) showing a square arrangement (cropped area upper right side) corresponding to zone axis [100] in native copper as indexed from FFT in the image bottom right. (c,d) STEM EDX spectra of substrate and Cu NPs. Note absence of Fe in both spectra. The carbon peaks on both spectra are partially due to the contamination in the chamber during prior high-resolution imaging.

Figure 10.
(a) HAADF (and bright field (BF) where marked) STEM images showing aspects of weaved-twin hematite at the upper part of foil #4. (a) Sets of twins and crosscutting Si-Al-K planes crosscutting at ~60°. (b) Platelets of sericite found in continuation of Si-Al-K planes. Comparison between BF and HAADF STEM images shows much of the filling is lost most likely plucked out during the FIB milling. (c) Conjugate sets of Si-Al-K planes (yellow arrows) crosscutting twins (white arrows) in hematite imaged on [121] zone axis. Such crosscutting relationships are marked by groups of satellite reflections (circled) along (210)* and parallel lattice vectors as shown on the FFT (inset). (d) Twinned hematite imaged on the [121] zone axis. The twin planes along (012) directions are marked by a split in reflections along the (210)* and parallel lattice vectors (FFT in inset). (e) Sliver of hematite adjacent to a Si-Al-K-plane (yellow arrow) imaged on the same [121] zone axis but with different focus to show the slight misorientation (white crosses) relative to the enclosing hematite.

Figure 11.
Images in BF and HAADF STEM modes as marked, showing aspects of hematite in the lower part of foil #4. (a,b) Trail of inclusions and cavities (white lines) with branching splays (green) towards fields of hexagonal platelets. (c,d) Detail of the platelets interpreted as sericite lamellae formed in continuation of Si-Al-K-planes.

Figure 12.
Bright field STEM image (top left) and STEM EDX maps of the Si-Al-K-bearing planes crosscutting twins at the upper part of foil #4. Note some of the planes are only depicted by Al (arrowed).
Figure 12.
Bright field STEM image (top left) and STEM EDX maps of the Si-Al-K-bearing planes crosscutting twins at the upper part of foil #4. Note some of the planes are only depicted by Al (arrowed).

Figure 13.
HAADF STEM image (left) and STEM EDX maps of the trail at the lower part of foil #4 (part of area shown in Figure 11). Note Cl and K show high concentrations either within the trail or along splays, whereas other elements, including Pb, are evenly distributed across the width of the trail. In contrast, Ti is present outside of the trail.

Figure 14.
Assessment of atomic arrangements on HAADF STEM images obtained from hematite oriented on the two zone axes as marked. Each zone axis is represented by (a) and (b) rows, showing, from left to right: FFT, HAADF STEM image, STEM simulation and crystal structural model (space filling) of hematite. Red spheres represent Fe atoms. Indexing using crystallographic information data for hematite (a = 5.0355 Å, c = 13.7471 Å; space group R3c; [33]).

Figure 15.
(a–c) High resolution HAADF STEM images of hematite on zone axes as marked. (a) Dumbbell atomic arrangement of Fe atoms on [221] zone axis. (b,c) Nanoscale domains with twins and 2-fold superstructure in hematite from areas surrounding coarse inclusions/cavities adjacent to trails (foils #1–2). Note three sets of nanotwins on [001]hematite in (b) also highlighted by dashed lines in the inset. The double spacing of the superstructure relative to the simple structure of hematite on [221] zone axis is marked by dashed lines in (c) and (a), respectively. (d) and (e) FFT patterns corresponding to images in (b) and (c). The three sets of twins are marked by different colours in (d), Satellite reflections at ½ (012) and (102) are marked by yellow arrows in (e).

Figure 16.
Atomic-scale resolution images showing lattice scale defects associated with crosscutting relationships between Si-Al-K-planes (yellow arrowheads) and twins (white arrowheads) in the weave-twinned hematite (foil #4). (a,b) Twin displacements (white bars) with increasing magnitude relative to increasing width of the planes. Note kink bends along the Si-Al-K-planes (dashed yellow lines). Single column atomic arrangement across the twin is marked by black dashed line following (210) direction. (c,d) More complex defects in areas with duplex Si-Al-K-planes crosscutting a twin. (c) Kink deformation (white dashed line) along the direction of the twin (dashed black line). (d) Detail around the tip of Si-Al-K-plane in (c) showing nanodomain misorientation, lattice dilation and kink bends as marked. (e) Linear defect at the twin plane crest propagating into a planar defect (arrowed).

Figure 17.
Schematic showing formation of metal NPs along fluid inclusion trails in hematite during fluid-mineral interaction. (a) Plan view of weave-twinned hematite interacting with incoming Si-Al-K-bearing fluids typical of hydrolytic alteration in IOCG systems. (b) Cross-section of a reacted domain within hematite in which the channels of fluid percolation led to nm-wide Si-Al-K-planes that become coarser bands and/or sericite platelets. Various defects occur in hematite at the junction between the twins and fluid channels. (c,d) The fluid compositionally evolves into a Cl- and metal-bearing brine that interacts with the pre-existing Si-Al-K planes and sericite. Initially, rates of fluid percolation are slow, and the reaction leads to formation of Cu-As NPs with variable Cu/As ratios, whereas some of the Si-Al-K-filling of the planes is removed (c). Rapid and/or erratic fluid flow driven by fault-valve mechanisms produce fronts of reaction via CDRR along preferential sets of Cu-As-enriched and Si-Al-K-depleted bands (d). This leads to formation of complex trails with smallest Si-hematite NPs on one side and coarsest fluid inclusions within swells on the other side of the trail. The reacted area along the trails is filled with nanoprecipitates of hematite (dark grey) recognised by nanodomains with 2-fold superstructures, twins and misorientation. Fluid inclusions are trapped within transient pores produced during CDRR development. (e) Metal-bearing NPs (Cu-, Cu-As-, Mo-, and W-bearing NPs) are precipitated within the fluid inclusions during fluid-vapour phase separation. The latter is induced by sudden depressurization during fault-valve fluid pumping.

© 2019 by the authors. Licensee MDPI, Basel, Switzerland. This article is an open access article distributed under the terms and conditions of the Creative Commons Attribution (CC BY) license (http://creativecommons.org/licenses/by/4.0/).
Share and Cite
MDPI and ACS Style
Verdugo-Ihl, M.R.; Ciobanu, C.L.; Slattery, A.; Cook, N.J.; Ehrig, K.; Courtney-Davies, L. Copper-Arsenic Nanoparticles in Hematite: Fingerprinting Fluid-Mineral Interaction. Minerals 2019, 9, 388. https://doi.org/10.3390/min9070388
AMA Style
Verdugo-Ihl MR, Ciobanu CL, Slattery A, Cook NJ, Ehrig K, Courtney-Davies L. Copper-Arsenic Nanoparticles in Hematite: Fingerprinting Fluid-Mineral Interaction. Minerals. 2019; 9(7):388. https://doi.org/10.3390/min9070388
Chicago/Turabian StyleVerdugo-Ihl, Max R., Cristiana L. Ciobanu, Ashley Slattery, Nigel J. Cook, Kathy Ehrig, and Liam Courtney-Davies. 2019. "Copper-Arsenic Nanoparticles in Hematite: Fingerprinting Fluid-Mineral Interaction" Minerals 9, no. 7: 388. https://doi.org/10.3390/min9070388
Note that from the first issue of 2016, this journal uses article numbers instead of page numbers. See further details here.