Article

Spatial and Temporal Controls on the Distribution of Indium in Xenothermal Vein-Deposits: The Huari Huari District, Potosí, Bolivia

1
Geological Engineering Program, Faculty of Sciences and Engineering, Pontifical Catholic University of Peru (PUCP), Av. Universitaria 180, San Miguel, Lima 15088, Peru
2
Departament de Mineralogia, Petrologia i Geologia Aplicada, Universitat de Barcelona (UB), C/ Martí i Franquès s/n, 08028 Barcelona, Spain
3
Facultad de Ciencias Geológicas, Universidad Mayor San Andrés, Av. Villazón Nº 1995, Plaza del Bicentenario–Zona Central, La Paz Bolivia, Bolivia
4
Department of Earth Sciences, University of Geneva, Rue des Maraîchers 13, 1205 Geneva, Switzerland
5
Instituto de Geología, Universidad Nacional Autónoma de México, Ciudad Universitaria, Coyoacán, CDMX 04510, Mexico
6
Departament d’Enginyeria Minera, Industrial i TIC, Universitat Politècnica de Catalunya, Av. de les Bases de Manresa 61-73, 08242 Manresa, Barcelona, Spain
7
Colegio de Geólogos de Bolivia, Edificio Señor de la Exaltación Nro. 4683, Av. Hernando Siles entre calles 1 y 2, Zona de Obrajes, Casilla 8941, La Paz, Bolivia
*
Author to whom correspondence should be addressed.
Current address: Eloro Resources Ltd. Av. La Floresta 497, Of. 101, San Borja, Lima, Perú.
Minerals 2019, 9(5), 304; https://doi.org/10.3390/min9050304
Submission received: 22 April 2019 / Revised: 14 May 2019 / Accepted: 14 May 2019 / Published: 17 May 2019
(This article belongs to the Special Issue Mineral Deposits of Critical Elements)

Abstract

:
The Huari Huari deposit, Potosí Department in SW Bolivia, hosts polymetallic stratiform and vein mineralization of Miocene age with significant concentrations of the critical metal indium (In). Vein mineralization records document early crystallization of quartz and cassiterite followed by prominent associations of sulfides and sulfosalts. The earliest sulfide was arsenopyrite, followed by pyrrhotite, and progressively giving way to pyrite as the main iron sulfide, whereas Cu–Ag–Pb sulfosalts constitute late hypogene associations. Sphalerite is the chief ore mineral, and its crystallization is extended during most of the mineralization lifespan as evidenced by its initial cocrystallization with pyrrhotine, then with pyrite, and finally with Ag–Pb sulfosalts. The composition of sphalerite varies from early to late generations with a continuous decrease in FeS that attests to a decrease in temperature, which is constrained to vary from ~450 to <200 °C, and/or an increase in f(S2), both congruent with the described paragenetic sequence. Indium concentrated mostly in the structure of Fe-rich sphalerite (up to 3.49 wt. %) and stannite (up to 2.64 wt. %) as limited solid solutions with roquesite in the (Zn,Fe)S–Cu2FeSnS4–CuInS2 pseudoternary system. In sphalerite, In shows a strong positive correlation with Cu at Cu/In = 1, suggesting its incorporation via a (Cu+ + In3+) ↔ 2Zn2+ coupled substitution, and it does not correlate with Fe. In stannite, In shows a moderate, negative correlation with Cu and Sn, and an In3+ ↔ (Cu+ + ½ Sn4+) coupled substitution is suggested. Coexisting sphalerite and stannite yielded the highest In concentrations and crystallized at temperatures between 350 and 250 °C. Copper activity probably played a major role in the accumulation of In in the structure of sphalerite since In-bearing sphalerite coexisted with the deposition of stannite, shows high concentrations of Cu (up to 0.13 atoms per formula unit (a.p.f.u.)) in its structure, and hosts exsolutions of stannite and chalcopyrite. Distribution on the district scale of In suggests an input of hydrothermal fluids richer in Cu in the central position of the mineralizing system, represented by the Antón Bravo vein.

1. Introduction

There is a growing concern for securing reliable, sustainable, and undistorted access to raw materials fundamental to the global economy. Indium (In), which is at the heart of our research, is among the raw materials categorized by the European Commission and the U.S. Geological Survey as critical because of its high economic importance combined with a high supply risk [1,2]. Not surprisingly, most of the elements categorized as critical are increasingly used in modern technologies, including the so-called green technologies as environmentally friendly substitutes of conventional ones with a greater ecological footprint [3]. The manufacturing of photovoltaic cells stands out as the paradigm of green industries that demand significant tonnages of diverse by-product mineral materials, including critical metals [4].
Indium is an essential component in bonding, high-purity and low-temperature alloys, soldering and thin films used in the manufacture of LCDs (liquid crystal displays), flat panel displays, touch screens, solar panels, etc. Moreover, In (and most of its compounds) is relatively inert and considered an environmentally friendly substitute of mercury in alkaline batteries [5]. The European Commission forecasts a supply deficit for this metal by 2020 because of the expected increase of In consumption in China, which is the main producer of this metal [1]. Therefore, the announced transition to renewable energy and the increased use of digital technologies hangs in a shifting supply–demand balance, and every effort should be made towards strategically sourcing key raw materials.
There are no mines in which indium is a primary commodity. This technological element, as well as germanium and gallium, is mostly recovered as a by-product from the production of other metals, chiefly zinc in sulfide minerals (i.e., sphalerite) [6], although important resources are described in tin ore as well [7,8]. Major hosts for indium include a variety of mineralization styles such as volcanic-hosted massive sulfide and stratabound carbonate-hosted deposits, greisen, polymetallic vein-type (s.l., including xenothermal deposits), porphyry tin, skarn and epithermal deposits, and important resources are reported in Bolivia, Peru, China, Japan, Canada, and Russia [9,10,11,12,13,14,15,16,17,18,19,20].
A major indium province is delineated at the South American plate in southern Peru, Bolivia and northern Argentina as a result of the subduction of the Nazca plate [10]. Elevated indium concentrations have been reported in different Bolivian xenothermal polymetallic veins (Bolivian-type deposits; cf. [21]), porphyry, and epithermal-style deposits. The Huari Huari zinc–silver–tin–antimony polymetallic vein deposit, with average concentrations around 1 wt. % In [10], is a particularly important deposit for the production and exploration of indium. In order to illustrate such importance, this deposit was the main source for raw material obtained by the Indium Corporation of America between 1976 and 1978, and it provoked a global shortage of this metal upon its closure in 1978 [22]. During this period, the mine was operated by Empresa Minera Caballo Blanco. In 1976, the indicated reserves were 1.6 Mt of ore, averaging 20% Zn and 150 g/t Ag [10]. After its reopening in 1983, the mine was operated by the company COMSUR until 2006, and then by Empresa Minera Sinchi Wayra S.A. Also in 2006, and to date, the Bolivian government awarded the concession for exploitation to the Huari Huari Ltd. mining cooperative. Current monthly production is at 10,000 t of ore, averaging 10%–15% Zn, 3%–5% Sn, and 200–500 g/t Ag (cooperative’s personnel, personal communication).
Published whole-rock geochemical data include maximum indium grades of 5740 ppm for Cerro Rico of Potosí, 3080 ppm for Huari Huari, 2730 ppm for Bolívar, and 2510 ppm for Siete Suyos-Ãnimas deposits, and electron probe microanalysis (EPMA) on sphalerite from the Cerro Rico of Potosí deposit yielded concentrations up to 1.27 wt. % In [23]. Laser ablation (LA)-ICP-MS determinations performed on sulfide minerals from four Bolivian deposits have shown wide ranges of indium concentrations in sphalerite even on the single crystal scale [16]. These previous studies shed light on the mineralogical expression of indium in sulfide ore and on concentration and tonnage estimates for some Bolivian deposits. However, they were carried out on very few samples (e.g., only one sample was studied by means of LA-ICP-MS from Huari Huari, three from Cerro Rico of Potosí, and one from Porco), an observation that compromises their representativeness given the geochemical and mineralogical heterogeneity that characterizes these deposits [18,24,25,26]. Further, the referred studies were largely devoid of systematic petrographic determinations as a basis for the assessment of geochemical studies. In consequence, few conclusions can be drawn from the available data on the relative distribution of indium across mineralized districts (i.e., spatial control) and the evolution of its concentration throughout the mineralizing system lifespan (i.e., temporal control). The research described in this article seeks a better understanding of the parameters that control indium (and other potential strategic metals) concentration and the development of geochemical tools for the exploration of this metal. Specific objectives include: (1) to determine the concentration of indium in mineral phases and to identify those that preferentially concentrate this metal in the primary ore and (2) to comprehend the spatial distribution of indium on the mineralized district scale at Huari Huari.

2. Geologic Setting

2.1. Geodynamic Setting

From SW to NE, physiographic units in Bolivia include the Western Cordillera, the Altiplano, the Eastern Cordillera, the Subandean zone, the Chaco-Beni plains, and the Precambrian Brazilian shield. The first three provinces make up the central portion of the Andean Orogen in Bolivia [24,26,27,28,29,30]. The Western Cordillera is composed mostly of late Miocene to Recent intermediate (andesitic and dacitic) volcanic rocks that overlie Jurassic and Cretaceous sedimentary and volcanic rocks. In contrast, the Eastern Cordillera, in which the Huari Huari mineralization is located (Figure 1), is mostly composed of thrusted, folded, and variably metamorphosed Paleozoic marine sedimentary rocks, overlain by marine and nonmarine Cretaceous sedimentary rocks. This sequence was deformed during three main orogenic cycles in Ordovician (Caledonian), Devonian to Triassic (Hercynian), and Cretaceous to Cenozoic (Andean) times [31,32]. The Altiplano is located between the Western and Eastern Cordilleras and is composed of a series of intermontane basins whose filling is linked with the uplifting of the Eastern Cordillera and the development of the volcanic front of the Western Cordillera.
Igneous rocks in the Bolivian Andes include scarce Paleozoic and more abundant Mesozoic and Cenozoic magmatic units. Mesozoic igneous rocks crop out narrowly in the Altiplano and southern Subandean zone and as Triassic/early Jurassic plutons along the Cordillera Real in northern Bolivia (largely concentrated in the eastern border of the Huarina belt [28]). The voluminous Cenozoic igneous assemblages in the Bolivian Andes concentrate along the Huarina belt. They constitute the core of the Western Cordillera and form several intrusive/extrusive centers in the Altiplano and Eastern Cordillera [27,28]. Whereas intrusive bodies of this era predominate in the northern Bolivian Andes, volcanic rocks dominate in the southern sector (south of 19°30′ S). Cenozoic igneous rocks in the Altiplano and Western Cordillera are described as having a high mantle input and belonging to the I-type magnetite series. In contrast, igneous rocks in the Eastern Cordillera resulted mostly from sediment melting in a thickened continental crust. They yield a distinctive peraluminous and reduced signature, thus, belonging to the S-type ilmenite series [33,34,35].
The big picture of the metallogenic evolution in the Central Andes has been drawn by a quasi-continuous subduction along the western South American plate margin over the last ca. 250 M.y. [29,30,36,37,38,39]. Several Cenozoic polymetallic provinces forming N–S mineralized belts juxtapose to morphotectonic provinces in the Andean orogen [39,40]. The Bolivian tin belt is confined to the Eastern Cordillera and extends along more than 1000 km from southern Peru to northern Argentina through Bolivia [24,26,27,39,41]. In the Bolivian tin belt, mineralization was triggered by reduced, peraluminous magmatism. Mineralization is mostly of late Oligocene and Miocene age, although a late Triassic/early Jurassic mineralization episode occurs in NW Bolivia [39,42,43,44]. In the northern portion of the tin belt (i.e., Cordillera Real), Sn–W mineralization is located within batholiths (greisen-type) or their contacts with sedimentary hosts, whereas in the southern portion, Sn, Sn–W, and Sn–polymetallic mineralizations are “shallower” and related to porphyritic intrusions and dome complexes, including hydrothermal breccia pipes and collapse calderas [25,26,42].

2.2. Geology of the Deposit

The Huari Huari deposit is located in the Bolivian Eastern Cordillera, in the Bolivian tin belt. Geographically, it is situated in the Tomás Frías province, about 32 km to the northeast of the city of Potosí (Figure 1). Access to this deposit is via an unpaved road that departs from the main paved road that connects the cities of Potosí and Don Diego.
Polymetallic mineralization at Huari Huari is mostly hosted by a steeply dipping turbiditic sequence, which includes shales and quartzites of Lower Paleozoic age that are unconformably overlain by Mesozoic sandstones (Figure 2 and Figure 3). This sequence was deformed along NNE-SSW to NW-SE trending folds (including an anticline axis found near the ore deposits) and NE-SE trending faults (Figure 1), and it was intruded by syn-kinematic dacitic to andesitic stocks and domes dated at 20 Ma in the study area [45,46,47].
The lower Paleozoic sedimentary rocks are mapped as Ordovician and Silurian in age [27,48]. Ordovician rocks in the area probably belong to the San Benito Formation (Cochabamba Group, Tascarian Cycle [27]) and are mostly composed of a thick turbiditic unit (more than 1 km) composed of black shales interbedded with meter-thick quartzite beds. These rocks are unconformably overlain by those of the Silurian Cancañiri and Uncía Formations [27], which are composed of massive diamictites [49] and black shales, respectively.
The Cretaceous continental series belong to the La Puerta Formation and are medium- to coarse-grained sandstones. They conglomerate with a distinctive red color because of ferruginous cement located around rounded and well-sorted quartz grains. Local olivine basalts are interbedded with Cretaceous sedimentary rocks [50].
Small dacite domes crop out across all the area (Figure 2). Volcanic textures observed within these domes include breccias with silicic angular clasts, up to some centimeters across (Figure 3C), and flow-banded deposits that are locally cut by swarms of aplite dikes, which are deep red in color (Figure 3D). Locally, massive (nonbedded) lithofacies with microporphyritic textures are observed within these igneous bodies.
As further described below, two hypogene mineralization styles have been identified in the Huari Huari district: polymetallic vein (fissure filling) and subordinate stratiform (manto-type) deposits. As a general rule, veins are common within the Paleozoic and Cretaceous series, whereas stratiform mineralizations are developed in the Ordovician quartzites, particularly in the Cerro Espíritu area. Both styles are oxidized when exposed at the surface, forming gossan pockets 50 to 80 m thick and supergene enrichment zones, prominently in the Cerro San Salvador area. In this study, we focused only on hypogene mineralization.
The Huari Huari deposit consists of four vein groups: San Salvador, Antón Bravo, Matilde, and Buen Suceso. The Antón Bravo vein, located to the east of the Cerro Vera Cruz, strikes 290° to 320°, dips 60° to 80° W, and is between 0.2 and 2 m in thickness. The length of the vein can be traced for over 1 km (Figure 2) and is 110 m at 4146 m.a.s.l. (Carluncho level), 470 m at 4067 m.a.s.l. (San Antonio level), 660 m at 3965 m.a.s.l. (San José level), 920 m at 3911 m.a.s.l. (Esperanza level), 620 m at 3858 m.a.s.l. (110 level), 600 m at 3802 m.a.s.l. (55 level), and 390 m at 3745 m.a.s.l. (0 level) [46]. The Matilde vein is located to the west of Cerro Espíritu, strikes 222°, dips 70° W, and its thickness varies between 0.60 and 0.80 m. The Buen Suceso vein is located to the east of the Cerro Manto, strikes 260°, dips 75°, and its thickness varies between 0.10 and 0.70 m. The San Salvador vein, located in the homonymous hill, strikes 320°, dips 80° W, is 0.10 m thick, and, unlike other veins, is hosted by Cretaceous sandstones (Figure 2). Hydrothermal alteration of the host rocks to the veins includes silicic and phyllic assemblages.

3. Materials and Methods

This study was based on 78 in situ surface and gallery samples collected from the Huari Huari district. The study area comprised the quadrangle defined by coordinates (UTM, WGS-84, zone 20K) N7846914 E228085 and N7851500 E229600. Studied samples were representative of the different hypogene mineralization styles and of the host rock lithofacies, and they were picked out following a comprehensive sampling plan that was traced to ensure representative 3D space.
Samples were prepared as polished thick (n = 65) and thin (n = 8) sections for their study under an optical microscope using reflected and transmitted light. A selection of these samples was examined with an environmental SEM Quanta 200 FEI, an XTE 325/D8395 (Thermo Fisher Scientific, Waltham, MA, USA) equipped with an INCA Energy 250 EDS microanalysis system at Centres Científics i Tecnològics of the Univeristy of Barcelona (CCiT-UB), and on an environmental scanning electron microscope (SEM) Quanta 650 FEI, equipped with an EDAX-Octane Pro EDS microanalysis system at Centro de Caracterización de Materiales of the Pontifical Catholic University of Peru (CAM-PUCP). Operating conditions were 20 keV accelerating voltage and 5 nA in backscattered electron (BSE) mode. Mineral chemistry analyses of sulfide minerals were performed on 54 polished sections using a five-channel JEOL JXA-8230 electron microprobe (EMP; Jeol Ltd., Tokyo, Japan) at the CCiT-UB, operated at 20 kV acceleration voltage, 20 nA beam current, and with a beam diameter of 5 µm. Analytical standards and lines used for analyses were: sphalerite (Zn, Kα), chalcopyrite (Cu, Kα), FeS2 (Fe and S, Kα), Ag (Ag, Lα), Sb (Sb, Lα), Bi (Bi, Mβ), CdS (Cd, Lβ), PbS (Pb, Mα), GaAs (As, Lα), Sn (Sn, Lα), InSb (In, Lα), Ge (Ge, Lα), and Ta (Ta, Lβ). The detection limit (d.l.) for each element is shown in Table 2 and Appendices.
Mineralogical determinations were also carried out by means of X-ray diffraction (XRD; n = 2). Samples were ground in an agate mortar and were manually pressed, by means of a glass plate, to get a flat surface in cylindrical standard sample holders that were 16 mm in diameter and 2.5 mm in height. Diffractograms were obtained in a Bruker D8 Discover powder diffractometer in Bragg-Brentano θ/2θ geometry with a 240 mm radius, nickel-filtered Cu Kα radiation (k = 1.5418 Å), and 45 kV-40 mA at the CAM-PUCP. The software X’Pert Highscore© (Version 2.0.1, PANalytical, Almelo, The Netherlands) was used to subtract the background of the patterns, to detect the peaks, and to assign mineral phases to each peak.

4. Mineralogy and Textures

4.1. Stratiform Mineralization

4.1.1. Pyrite

Pyrite was, by far, the most abundant sulfide mineral in the stratiform mineralization (Figure 4). It occurred as anhedral and subhedral crystals with diameters that ranged between 50 μm and 1 mm. It formed stringers, either parallel or perpendicular to bedding (Figure 4A,B), and more commonly it disseminated interstitial spaces between quartz grains in the host sandstone (Figure 4C–F). Pyrite crystals in the stratiform mineralization were often zoned so that anhedral cores were overgrown by subhedral domains that developed some planar crystal outlines (Figure 4F). Larger crystals showed evidence of microbrecciation in response to brittle deformation as well as corrosion vugs that were lined by gangue phases (Figure 4E).

4.1.2. Sphalerite

Sphalerite was a minor mineral in the stratiform mineralization. Like pyrite, it occurred both along veinlets parallel to bedding (Figure 4A,B) and as interstitial infilling that conformed to the space between rounded quartz grains, which made up the sandstone host (Figure 4D). Sphalerite showed microporosity as a result of corrosion.

4.1.3. Cassiterite

In the stratiform mineralization, cassiterite was a minor mineral. It was observed as minute, elongated crystals (needle tin variety) of some tens of microns in length embedded in irregular quartz veinlets (Figure 4E). Equant cassiterite crystals, some tens of microns across, were also observed interstitial to quartz grains of the sandstone host (Figure 4F).

4.1.4. Galena

Galena was a trace mineral in the stratiform mineralization and was observed, along with sphalerite, to occupy interstitial space between quartz grains that made up the sandstone host. It occurred as minute crystals some tens of microns in size.

4.2. Polymetallic Vein Mineralization

Veins and spatially associated groups of veinlets of variable thicknesses were hosted by hydrothermally altered host rocks. Minerals within these structures showed textures that denoted an open space filling, including colloform, cockade, and comb textures (Figure 5 and Figure 6). The mineralogy within the polymetallic veins was conspicuously diverse and delineated complex paragenetic sequences.

4.2.1. Quartz

Quartz was a common mineral in all sampled veins. It formed bands along or near the wall–rock boundary and around silicified rock fragments in the veins (Figure 5A–C). Accordingly, this mineral was interpreted to have crystallized during initial stages in the growth of the veins. It formed subhedral and euhedral prismatic crystals some tens of microns long, which often grew perpendicularly to wall rock or rock fragments, thus forming comb and cockade textures. The occurrence of some individual euhedral quartz crystals towards inner sectors of the veins indicated, however, that crystallization of this mineral occurred throughout most of the mineralization process.

4.2.2. Cassiterite

Cassiterite was rather scant in the Huari Huari ores. If formed small equant crystals, up to 200 μm across, and common elongated acicular crystals (needle tin variety) up to 100 μm in length. Cassiterite occupied a similar paragenetic distribution to quartz, as shown by mutual grain boundaries. The relative abundance of cassiterite increased toward the vein walls. In addition, minute needle tin cassiterite wraps silicified host rock fragments in the veins, and the assemblage was covered by massive sphalerite aggregates (Figure 5B). Cassiterite crystals were locally replaced by several generations of sphalerite (Figure 6F). These observations indicated that the bulk of cassiterite crystallized during early stages of vein growth, and its crystallization overlapped and partially followed that of quartz. A second generation of cassiterite of the needle tin variety, significantly scarcer, coated a first generation of Fe-rich sphalerite ± quartz and predated siderite (Figure 5C; Antón Bravo vein, sample 1276), or it coated late porosity on siderite along the vein cores in the Cerro San Salvador area (sample 1320; Figure 5D).

4.2.3. Arsenopyrite

Arsenopyrite was a minor mineral in the Matilde, Antón Bravo, and Buen Suceso veins, and it was absent in the San Salvador vein. It occurred as small subhedral to euhedral crystals up to 300 μm across (long axis). This mineral crystallized early during the formation of the veins since it was concentrated along the wall contact as minute crystals (Figure 5C) with irregular, corroded outlines, which were highly replaced and veined by other sulfides such as early sphalerite, pyrite, and marcasite (Figure 5G–I,L). Therefore, crystallization of arsenopyrite predated, in general, the other sulfides. The occurrence of small pyrrhotite inclusions within arsenopyrite (Figure 5E) suggested cocrystallization during most of their deposition.

4.2.4. Pyrrhotite

Pyrrhotite, a minor mineral in the ores, was more abundant in the Matilde than in the Antón Bravo veins group, and it was absent in the other veins. This mineral occurred as microscopic relicts that were pervasively replaced and veined by other sulfides such as sphalerite, pyrite, and marcasite (Figure 5H,I,L and Figure 6A). In addition, it was found locally as small inclusions within arsenopyrite (see above and Figure 5I).

4.2.5. Sphalerite

In the vein mineralization, sphalerite was the chief ore mineral. In general terms, this mineral was more abundant in the Antón Bravo and Buen Suceso veins than in the Matilde vein, whereas in the San Salvador vein it was a trace mineral. Its crystallization probably took place during most of the sulfide stage and probably continued during the crystallization of the later sulfosalt-rich stage described below. It showed common anhedral shapes, forming bands or masses that filled spaces between quartz and cassiterite (and partially replaced them; Figure 5A–C), pyrrhotite (Figure 6A), arsenopyrite, pyrite (Figure 5E–G), and sulfosalts such as jamesonite (Figure 6E,F). Cavities in corroded sphalerite were lined by stannite and sulfosalts such as pyrargyrite, miargyrite, and argentian tetrahedrite (Figure 6C,D,G,K). Up to three generations of sphalerite were identified in some of the studied samples. The first generation, which was Fe-rich, was the most abundant and occurred in the form of continuous parallel bands (when preceding phases were present) and close to the wall contact (Figure 5A,C). Early sphalerite was characterized by a very fine dissemination of stannite and chalcopyrite blebs (the so-called “chalcopyrite disease”; Figure 5E), not present in subsequent generations. Further sphalerite generations were identified by means of crosscutting relationships (identified by their lower Fe contents, resulting in dissimilar microscope imaging, e.g., Figure 6C) or by contrasting positions along the paragenetic sequence (Figure 7). Some sphalerite masses and bands showed complex compositional zoning, which included parallel and irregular growth zones that highlighted the partial corrosion of preceding zones, thus suggesting a reactive deposition within sphalerite zoning (Figure 6A,B). Interspersed narrow stannite zones that followed the general zoning in sphalerite crystals were common in the Matilde and Antón Bravo veins. Such stannite zones were also affected by corrosion and replaced by younger sphalerite, thus indicating that both phases cocrystallized at least during some periods of vein formation (Figure 6A,B). Sphalerite was pervasively replaced and veined by marcasite (Figure 5H–K and Figure 6L).

4.2.6. Pyrite

Pyrite was rather abundant in the Antón Bravo, Buen Suceso, and Matilde veins, whereas it was a minor component in the San Salvador vein. It occurred as highly corroded, subhedral, and anhedral grains. It lined intergranular spaces between arsenopyrite crystals and veined sphalerite and arsenopyrite. Corrosion cavities and other vugs in pyrite crystals were commonly lined by siderite, but quartz and sphalerite were also present (Figure 5E,F). According to this observation, pyrite probably followed the crystallization of earlier sphalerite, cocrystallized at some point with subsequent generations of sphalerite, and was post-dated by later sphalerite in reactive succession. Fine mixtures of pyrite and marcasite formed spheroidal, concentric masses (or “bird’s eye” textures) up to 500 μm in diameter after pyrrhotite, and the assemblage was cut by marcasite plates (Figure 5H).

4.2.7. Chalcopyrite

As a rule, chalcopyrite was a minor phase in the Antón Bravo, Buen Suceso, and Matilde veins. It was observed as minute blebs within sphalerite crystals (“chalcopyrite disease” textures; Figure 5E). In addition, it lined vugs within sphalerite or along contacts of sphalerite and other sulfides.

4.2.8. Marcasite

Relatively large amounts of marcasite occurred in the Antón Bravo vein, whereas it was relatively scarce in the Matilde vein, and it was not observed in the Buen Suceso and San Salvador veins. It crystallized later than the sulfides above, as it veined and pervasively replaced sphalerite, pyrrhotite, and pyrite (Figure 5H–L). Marcasite occurred in the form of thin, irregular veinlets, as plates, and as fine aggregates along with pyrite in “bird’s eye” textures. In addition, it occurred as colloform aggregates that coated massive sphalerite aggregates (Figure 5J). Although not commonly found in contact, galena and marcasite were likely to be nearly contemporaneous, as suggested by the prevalence of mutual grain boundaries (Figure 5L).

4.2.9. Galena

Galena was a minor mineral in the four studied veins. It was observed as small grains (some tens of microns across) associated with late sulfosalts (described below) and interstitial to quartz, cassiterite, arsenopyrite, and sphalerite crystals (Figure 6F,H–K). Accordingly, we suggested that its crystallization occurred during late stages in the vein formation. Galena was partially replaced by lead sulfosalts such as semseyite, plagionite, and late jamesonite (Figure 6F,H–I), and the assemblage was replaced by silver sulfosalts such as andorite and miargyrite (Figure 6J). Galena also concentrated along the contacts between, and was partly replaced by, silver sulfosalt infillings (Figure 6K). Such observation suggested that galena and silver sulfosalts could have coprecipitated locally.

4.2.10. Stannite

Stannite was a common mineral in the Antón Bravo, Buen Suceso, and Matilde veins, but it was absent in the studied samples from the San Salvador vein. Stannite was intimately linked to sphalerite (explained above, see Figure 6A–D). Stannite partly crystallized (1) directly form the ore fluid, intermittently and alternately with sphalerite, (2) exsolved from sphalerite and accumulated along contacts that behaved as collectors ([25]), and (3) crystallized directly from the ore fluid after the main sphalerite-rich substage.

4.2.11. Tetrahedrite Group Minerals

Tetrahedrite group minerals were rather scarce in the studied ore samples from Antón Bravo, Buen Suceso, and Matilde veins, and they were absent in the samples from the San Salvador vein. These were observed in association with lead–silver sulfosalts, such as miargyrite and pyrargyrite, filling space between crystals of cassiterite and sphalerite after the crystallization of stannite (Figure 6D). Tetrahedrite group minerals formed anhedral grains partially replaced by miargyrite.

4.2.12. Other Sulfosalts

The main lead sulfosalt in samples from Huari Huari was jamesonite, which was particularly abundant in the Buen Suceso vein and was also observed in lesser amounts in the Antón Bravo and Matilde veins. Jamesonite was probably the first lead sulfosalt to crystallize during the formation of the veins, as it was partially replaced by late generations of sphalerite (Figure 6E,F) and by almost all the silver and other lead sulfosalts (Figure 6F–J). It occurred in the form of thin plates and bent blades (in places forming plumose aggregates) some tens to hundreds of microns in length.
Franckeite (a lead–tin sulfosalt) was an early sulfosalt in the paragenetic sequence. Traces of franckeite were observed in a few samples from the Matilde vein, whereas its occurrence in the other veins was not detected. It formed highly distorted thin plates and slivers that were replaced by marcasite in high proportions (Figure 6L). The lack of textural relationships with other minerals did not allow a precise paragenetic position of franckeite to be determined (Figure 7).
In addition, small proportions of a variety of other lead–silver sulfosalts were observed in the Antón Bravo, Buen Suceso, and Matilde veins, whereas these phases were absent in the San Salvador vein. They occurred mostly as geodic lining between quartz, cassiterite, sphalerite, stannite, and jamesonite crystals (Figure 6D,F–K). A particular crystallization pattern observed in the samples was the occurrence of lead–silver sulfosalts in the spaces generated by the dissolution of jamesonite bladed crystals (e.g., Figure 6G,I) or interstitial to this mineral (Figure 6I–J). Late lead–silver sulfosalts found in Huari Huari veins included andorite, diaphorite, miargyrite, plagionite, pyrargyrite, semseyite, and staročeskéite. Detailed observations indicated that pyrargyrite was partially replaced by miargyrite (Figure 6D), and that plagionite replaced semseyite (Figure 6I).

4.2.13. Siderite

Along with quartz, siderite was the main gangue mineral in the four studied vein groups of the Huari Huari deposit. It crystallized late in the paragenetic sequence, and it largely occurred interstitial to the quartz–cassiterite–sulfide sequence described above (Figure 5C), often forming the core of the veins. Siderite occurred on mm and cm scales as subhedral and euhedral rhombohedral crystals in comb textures, which suggested open-space growth. In the San Salvador vein, dissolution of rhombohedral siderite was followed by the crystallization of a very late generation of needle tin cassiterite (Figure 5D), thus suggesting that the circulation of hydrothermal fluids continued after the crystallization of siderite.

4.2.14. Other

Other phases found in trace amounts in the Huari Huari veins included greenockite and acanthite as late replacement products of sphalerite and silver sulfosalts, respectively. Late phases particularly abundant in the studied samples included supergene coatings, veinlets, and euhedral crystals of late phosphates such as pyromorphite and plumbogummite—the latter developed conspicuous oscillatory zoning. Other observed minerals related to the weathering of the hypogene ones included hematite, goethite, anglesite, jarosite, and barite among others (note that the study of the weathering profiles was not a target of this work).

4.3. Paragenetic Sequence

The mineral sequence for the different studied veins is shown diagrammatically in Figure 7. In general terms, based on the textures described above, early crystallization of quartz and cassiterite was followed by the crystallization of a base metal sulfide-rich stage and a subsequent late lead–silver sulfosalt-rich stage. Early sulfides were arsenopyrite, pyrrhotite, and early Fe-rich sphalerite. The crystallization of sphalerite probably protracted during most of the mineralization of the veins, with at least second and a third generations, which were distinctive based on their low Fe contents as further explained below. Pyrrhotite masses were pervasively replaced by an assemblage of pyrite and marcasite. Stannite crystallized earlier than most of the lead–silver sulfosalts. Aside from jamesonite, and probably franckeite, the other sulfosalts crystallized late in the sequence. The San Salvador vein group underwent a pervasive gossanization, and most of the primary textures have been obliterated, thus hindering the determination of a paragenetic sequence.

5. Ore Mineral Geochemistry

5.1. Arsenopyrite

Representative analyses of arsenopyrite crystals from the Huari Huari district are shown in Table 1. Their concentrations of As ranged between 29.79 and 32.35 at. % (atomic %; equivalent to 40.81 and 44.35 wt. %) and were inversely proportional to the concentration of S, which was in the range between 33.42 and 35.48 at. %. The concentrations of Sb and Se were low, up to 2.07 and 0.88 wt. %, respectively.

5.2. Pyrrhotite

Representative analyses of pyrrhotite crystals from the Huari Huari district are shown in Table 1. Pyrrhotite grains yielded concentrations in Fe that ranged between 46.50 and 47.29 at. %, and concentrations in S that ranged between 52.62 and 53.41 at. %. The mole fraction of FeS in pyrrhotite (in the system FeS-S2) was higher for pyrrhotite crystals from the Antón Bravo vein (93.6–94.7 mol. %) than from the Matilde vein (93.1–93.4 mol. %).

5.3. Sphalerite

A summary of the composition of sphalerite from the Huari Huari district is shown in Table 2. Representative analyses of sphalerite from the different mineralization styles and veins are shown in Table 3. Sphalerite grains yielded a relatively wide compositional range, as illustrated by the concentrations of Fe, which varied between below its detection limit (d.l.; see Table 2 for detection limits) and 16.12 wt. %, Cu (<d.l. to 8.37 wt. %), or Sn (<d.l. to 6.98 wt. %). The concentrations of potential byproducts or penalty elements were also variable on the district scale, particularly for In (up to 3.49 wt. %), Cd (up to 2.91 wt. %), and Ga (up to 0.64 wt. %), whereas it was systematically very low for Ge (up to 0.08 wt. %). Other minor elements such as Mn yielded relatively low concentrations (up to 0.39 wt. %).
The chemical composition of sphalerite grains showed strong variations according to the mineralization style (stratiform vs. polymetallic veins) and to the vein in which they occurred. Sphalerite in the stratiform mineralization had lower average Fe, Cu, and Sn concentrations than sphalerite in veins (Table 2). Sphalerite grains from the San Salvador veins yielded the lowest Fe, Cu, and Sn and the highest Zn concentrations in the Huari Huari deposit. At the other end of the spectrum, sphalerite grains from the Antón Bravo veins yielded the highest Fe, Cu, and Sn and the lowest Zn concentrations in the deposit. Sphalerite crystals from the Matilde and Buen Suceso veins yielded intermediate values between those from San Salvador and Antón Bravo, even though their compositions were closer to the latter. In general terms, the concentration of In followed an equivalent distribution as Fe, Cu and Sn, where the highest concentrations were recorded in sphalerite from the Antón Bravo vein (up to 3.49 wt. %) followed by the Matilde (up to 0.90 wt. %) and Buen Suceso (up to 0.29 wt. %) veins. Values were obtained below the detection limit for In in the San Salvador vein and stratiform sphalerite. Similarly, Cd concentrations peaked in crystals from the Antón Bravo (up to 2.91 wt. %) and Matilde (up to 1.11 wt. %) veins, and the lowest values were found in the San Salvador vein (up to 0.38 wt. %). The concentration of Cd in sphalerite from the Buen Suceso vein (up to 0.41 wt. %) was lower than that in sphalerite from the stratiform mineralization (up to 0.77 wt. %). The concentrations of Mn peaked in the Matilde vein (up to 0.39 wt. %) and were significantly lower (0.04 to 0.10 wt. %) in the rest of the veins and in the stratiform ore. The highest concentrations of Ag and Ga in sphalerite were recorded in the Antón Bravo and Buen Suceso veins. However, the composition of sphalerite from each vein (with the exception of San Salvador) encompassed a broad variability, which is addressed in detail below.
Most of the studied homogeneous, pristine sphalerite crystals plotted within the sphalerite–stannite–roquesite pseudoternary system [11,51] (Figure 8). A large proportion of the studied sphalerite from this district plotted on the Zn + Fe + Cd + Mn axis of the diagram or in its vicinities, whereas the rest of the analyses were distributed very closely to the sphalerite–stannite and sphalerite–roquesite tie-lines. The studied sphalerite samples contained a maximum of 5.9 mol. % Cu2FeSnS4 (i.e., solid solution with stannite) and a maximum of 3.1 mol. % CuInS2 (i.e., solid solution with roquesite). Fe-rich sphalerite contained a maximum of 27.3 mol. % FeS. A few analyses, in addition, plotted along the sphalerite–chalcopyrite tie-line. Sphalerite crystals from the Antón Bravo vein group showed greater compositional variation followed by sphalerite from the Buen Suceso and Matilde vein groups (Figure 8 and Figure 9).
In those veins in which several generations of sphalerite were identified, namely Antón Bravo and Buen Suceso, contrasting compositions were determined between such generations. The concentration of Fe decreased drastically from the first generation (sl-1; e.g., 11.82 wt. % Fe in sample HH-44 in Antón Bravo) to the second (sl-2; up to 5.22 wt. % Fe) and the third (sl-3; up to 1.56 wt. % Fe) generations of sphalerite. Similar behaviors were observed for Cu, Sn, Cd, and In.
Zinc and Fe correlated negatively in sphalerite, and most of the analyses were along the Zn + Fe = 1 (a.p.f.u.) line, thus indicating a dominant simple substitution between these elements (Figure 9). Nevertheless, at concentrations higher than 0.10 Fe p.f.u. (that are arbitrarily labeled henceforth as Fe-rich sphalerite), there were a significant number of analyses that deviated from the Zn + Fe = 1 line towards lower values of Zn at a given Fe concentration. The concentrations of Cu and Sn showed similar patterns when plotted against Zn, so that both elements occurred in higher concentrations in Fe-rich sphalerite by following a continuous enrichment trend between 0.8 and 0.6 Zn p.f.u. (Figure 9). Such trends were observed prominently in samples from the Antón Bravo vein and, to a lesser extent, from the Buen Suceso and Matilde veins. In the Zn vs. Fe + Cu + Sn binary diagram in Figure 9, practically all analyses plotted along the Zn + Fe + Cu + Sn = 1 line. This suggested that, although a Zn ↔ Fe simple substitution was dominant, coupled substitutions (e.g., Zn ↔ Fe + Cu + Sn) might have occurred at high Fe concentrations; this was in good agreement with the limited solid solution between sphalerite and stannite described above.
The highest In concentrations occurred in Fe-rich sphalerite in the interval between 0.10 and 0.20 Fe p.f.u., but no clear correlation between these two elements was observed (Figure 10) despite the fact that In and Zn correlated negatively in Fe-rich sphalerite. Although some dispersion was observed in the Cu vs. In diagram, most analyses of In-rich sphalerite were along the Cu/In = 1 line (Figure 10), thus suggesting a coupled substitution of Zn by Cu + In. In contrast, Sn and In did not correlate. There were, however, some analyses that yielded relatively high In concentrations (between ca. 0.005 and 0.015 a.p.f.u.) that showed enrichment in both Cu (at Cu/In >> 1) and Sn. Pristine sphalerite crystals in sphalerite + stannite assemblages in samples from the Antón Bravo and Matilde veins yielded maximum In concentrations of 2.07 wt. %. This agreed well with high In contents (up to 0.79 wt. %) in sphalerite with stannite exsolutions (Figure 8). The close spatial relationship between sphalerite and stannite with relatively high In concentrations is discussed in Section 6.2.
Indium and Cd showed a crude positive correlation at low Cd concentrations. In did not correlate with Mn or Ag, in which it showed a rather antipathetic correlation pattern. The low amounts of Ga and Ge detected in the studied samples did not correlate with any of the other analyzed elements.

5.4. Stannite Group Minerals

Representative EPMA analyses of stannite group minerals from the Huari Huari district in the Antón Bravo, Matilde, and Buen Suceso veins are shown in Table 4. Compositions of the analyzed crystals approximated the composition of stannite. However, a variable Zn/(Fe + Zn) atomic ratio between 0 and 0.24, with no compositional gap, indicated that some stannite group minerals at Huari Huari had relatively high amounts of Zn. Similar to sphalerite, the composition of stannite group minerals varied from vein to vein. In the Buen Suceso vein, the Zn/(Fe + Zn) atomic ratio in stannite was systematically zero, the concentration of In was up to 0.16 wt. %, and the concentration of Ag was up to 0.97 wt. %. In the Matilde vein, the Zn/(Fe + Zn) atomic ratio in stannite ranged between 0.07 and 0.09, the concentration of In was between 0.03 and 0.06 wt. %, and the concentration of Ag was between 1.47 and 2.08 wt. %. In the Antón Bravo vein, the Zn/(Fe + Zn) atomic ratio in stannite ranged between 0.08 and 0.24, the concentration of In was between 0.03 and 2.64 wt. %, and the concentration of Ag was between 0.08 and 1.88 wt. %. The concentrations of Ga and Ge were systematically below their respective detection limits.
Zinc did not show a negative correlation with Fe (Figure 11) as would be expected for stannite group minerals that belonged to the stannite–kësterite series. Even a subtle positive correlation was observed for crystals from the Antón Bravo vein group. In contrast, also in crystals from the same locality, Zn correlated negatively with Cu and Sn (Figure 11). These observations suggested that the incorporation of Zn probably was due to the limited solid solution between stannite and Fe-rich sphalerite described in Section 5.3 (Figure 8), which in the studied samples was up to 31.5 mol. % (Zn,Fe)S. The atomic proportions of Cu (up to 2.2 a.p.f.u.) peaked in stannite from the Buen Suceso vein.
The highest concentrations of In in stannite were found in Zn-rich crystals from the Antón Bravo vein (>0.15 Zn p.f.u.; Figure 11). In these crystals, In was negatively correlated with Cu and Sn. Those analysis that occurred simultaneously along the Cu + In = 2 and Sn + In = 1 a.p.f.u. lines (In vs. Cu and In vs. Sn diagrams in Figure 11) suggested a solid solution between stannite and roquesite.

5.5. Galena

Representative analyses of galena crystals from the Huari Huari district are shown in Table 5. The concentration of Pb was relatively variable, between 73.94 and 86.78 wt. %, which corresponded to 0.84–1.08 Pb p.f.u. Lead showed a negative correlation with Sb (Figure 12), whose concentration was up to 5.46 wt. % (or 0.10 Sb p.f.u.). The concentration of Sb was higher in galena from the Antón Bravo vein than from the Matilde vein (up to 3.77 wt. %); this element was not analyzed for galena from the Buen Suceso vein. The concentration of Ag varied from below its detection limit to 2.66 wt. % and did not correlate with any of the analyzed elements. Other elements that showed “erratic”, non-correlated values were Bi (up to 6.52 wt. %), Zn (up to 2.06 wt. %), Cu (up to 0.34 wt. %), Fe (up to wt. 0.28 wt. %), Sn (up to 0.43 wt. %), Ge (up to 0.56 wt. %), and Ga (up to 0.17 wt. %).

5.6. Tetrahedrite Group Minerals

Representative analyses of tetrahedrite-group minerals from the Huari Huari district are shown in Table 5. Compositional differences were remarkable between crystals from the Antón Bravo and Matilde veins (Figure 13). Crystals from the Matilde vein approximated the composition of apthonite [(Cu,Zn,Ag)12Sb4S13], a variety of tetrahedrite with high silver content. Studied crystals yielded silver concentrations between 8.13 and 8.51 wt. %, and their Ag/(Ag + Cu) ratio was 0.13 (atomic proportions). Their As/(As + Sb) ratio was 0.05, and their Zn/(Zn + Fe) ratio was in the range between 0.92 and 0.98.
On the other hand, analyzed crystals from the Antón Bravo vein were of argentian tetrahedrite, with Ag concentrations ranging between 22.95 and 27.48 wt. %, and their Ag/(Ag + Cu) ratio was between 0.38 and 0.48 (atomic proportions; Figure 13). Their As/(As + Sb) ratio was systematically zero (as As was below its detection limit), and their Zn/(Zn + Fe) ratio ranged between 0.21 and 0.34. Regarding its structural formula, S ranged between 11.59 and 12.60 a.p.f.u. (i.e., < 13 S p.f.u.) when analyses were normalized to Sb = 4 a.f.p.u., hence indicating a freibergite component.
The concentrations of In, Ge, and Ga were systematically below their detection limits in the analyzed crystals.

5.7. Other Sulfosalts

Representative analyses of other analyzed sulfosalts form the Huari Huari district are shown in Table 6. In jalpaite, Ag–Sb (miargyrite and pyrargyrite), and Ag–Pb–Sb (andorite, diaphorite, and staročeskéite) sulfosalts, concentrations were systematically below the lower detection limit for the three critical elements. The concentration of Ge in franckeite ranged between 0.06 and 0.20 wt. %, the concentration of Ga was up to 0.09 wt. %, and the concentration of In was systematically below its lower detection limit. The concentration of Ge in semseyite ranged between 0.07 and 0.90 wt. %, the concentration of Ga was up to 0.10 wt. %, and the concentration of In was below its lower detection limit. The concentration of Ge in jamesonite was up to 0.81 wt. %, the concentration of Ga was up to 0.10 wt. %, and the concentration of In was mostly below its lower detection limit.

6. Discussion

6.1. Ore-Forming Conditions

The mineral assemblages and textures in veins from the Huari Huari district had many similarities with those described by Kelly and Turneaure [25] for tin ores from the Eastern Cordillera of Bolivia, tinged with some characteristics of “tin-silver ores” (with the caveat that cassiterite is not the main ore mineral in the system). In this “time-honored” study, these authors combined sulfide geothermometry and fluid inclusions microthermometry with a thorough petrographic study of ores from a number of polymetallic deposits to study the influence of temperature on the distributions and assemblages of ore minerals.
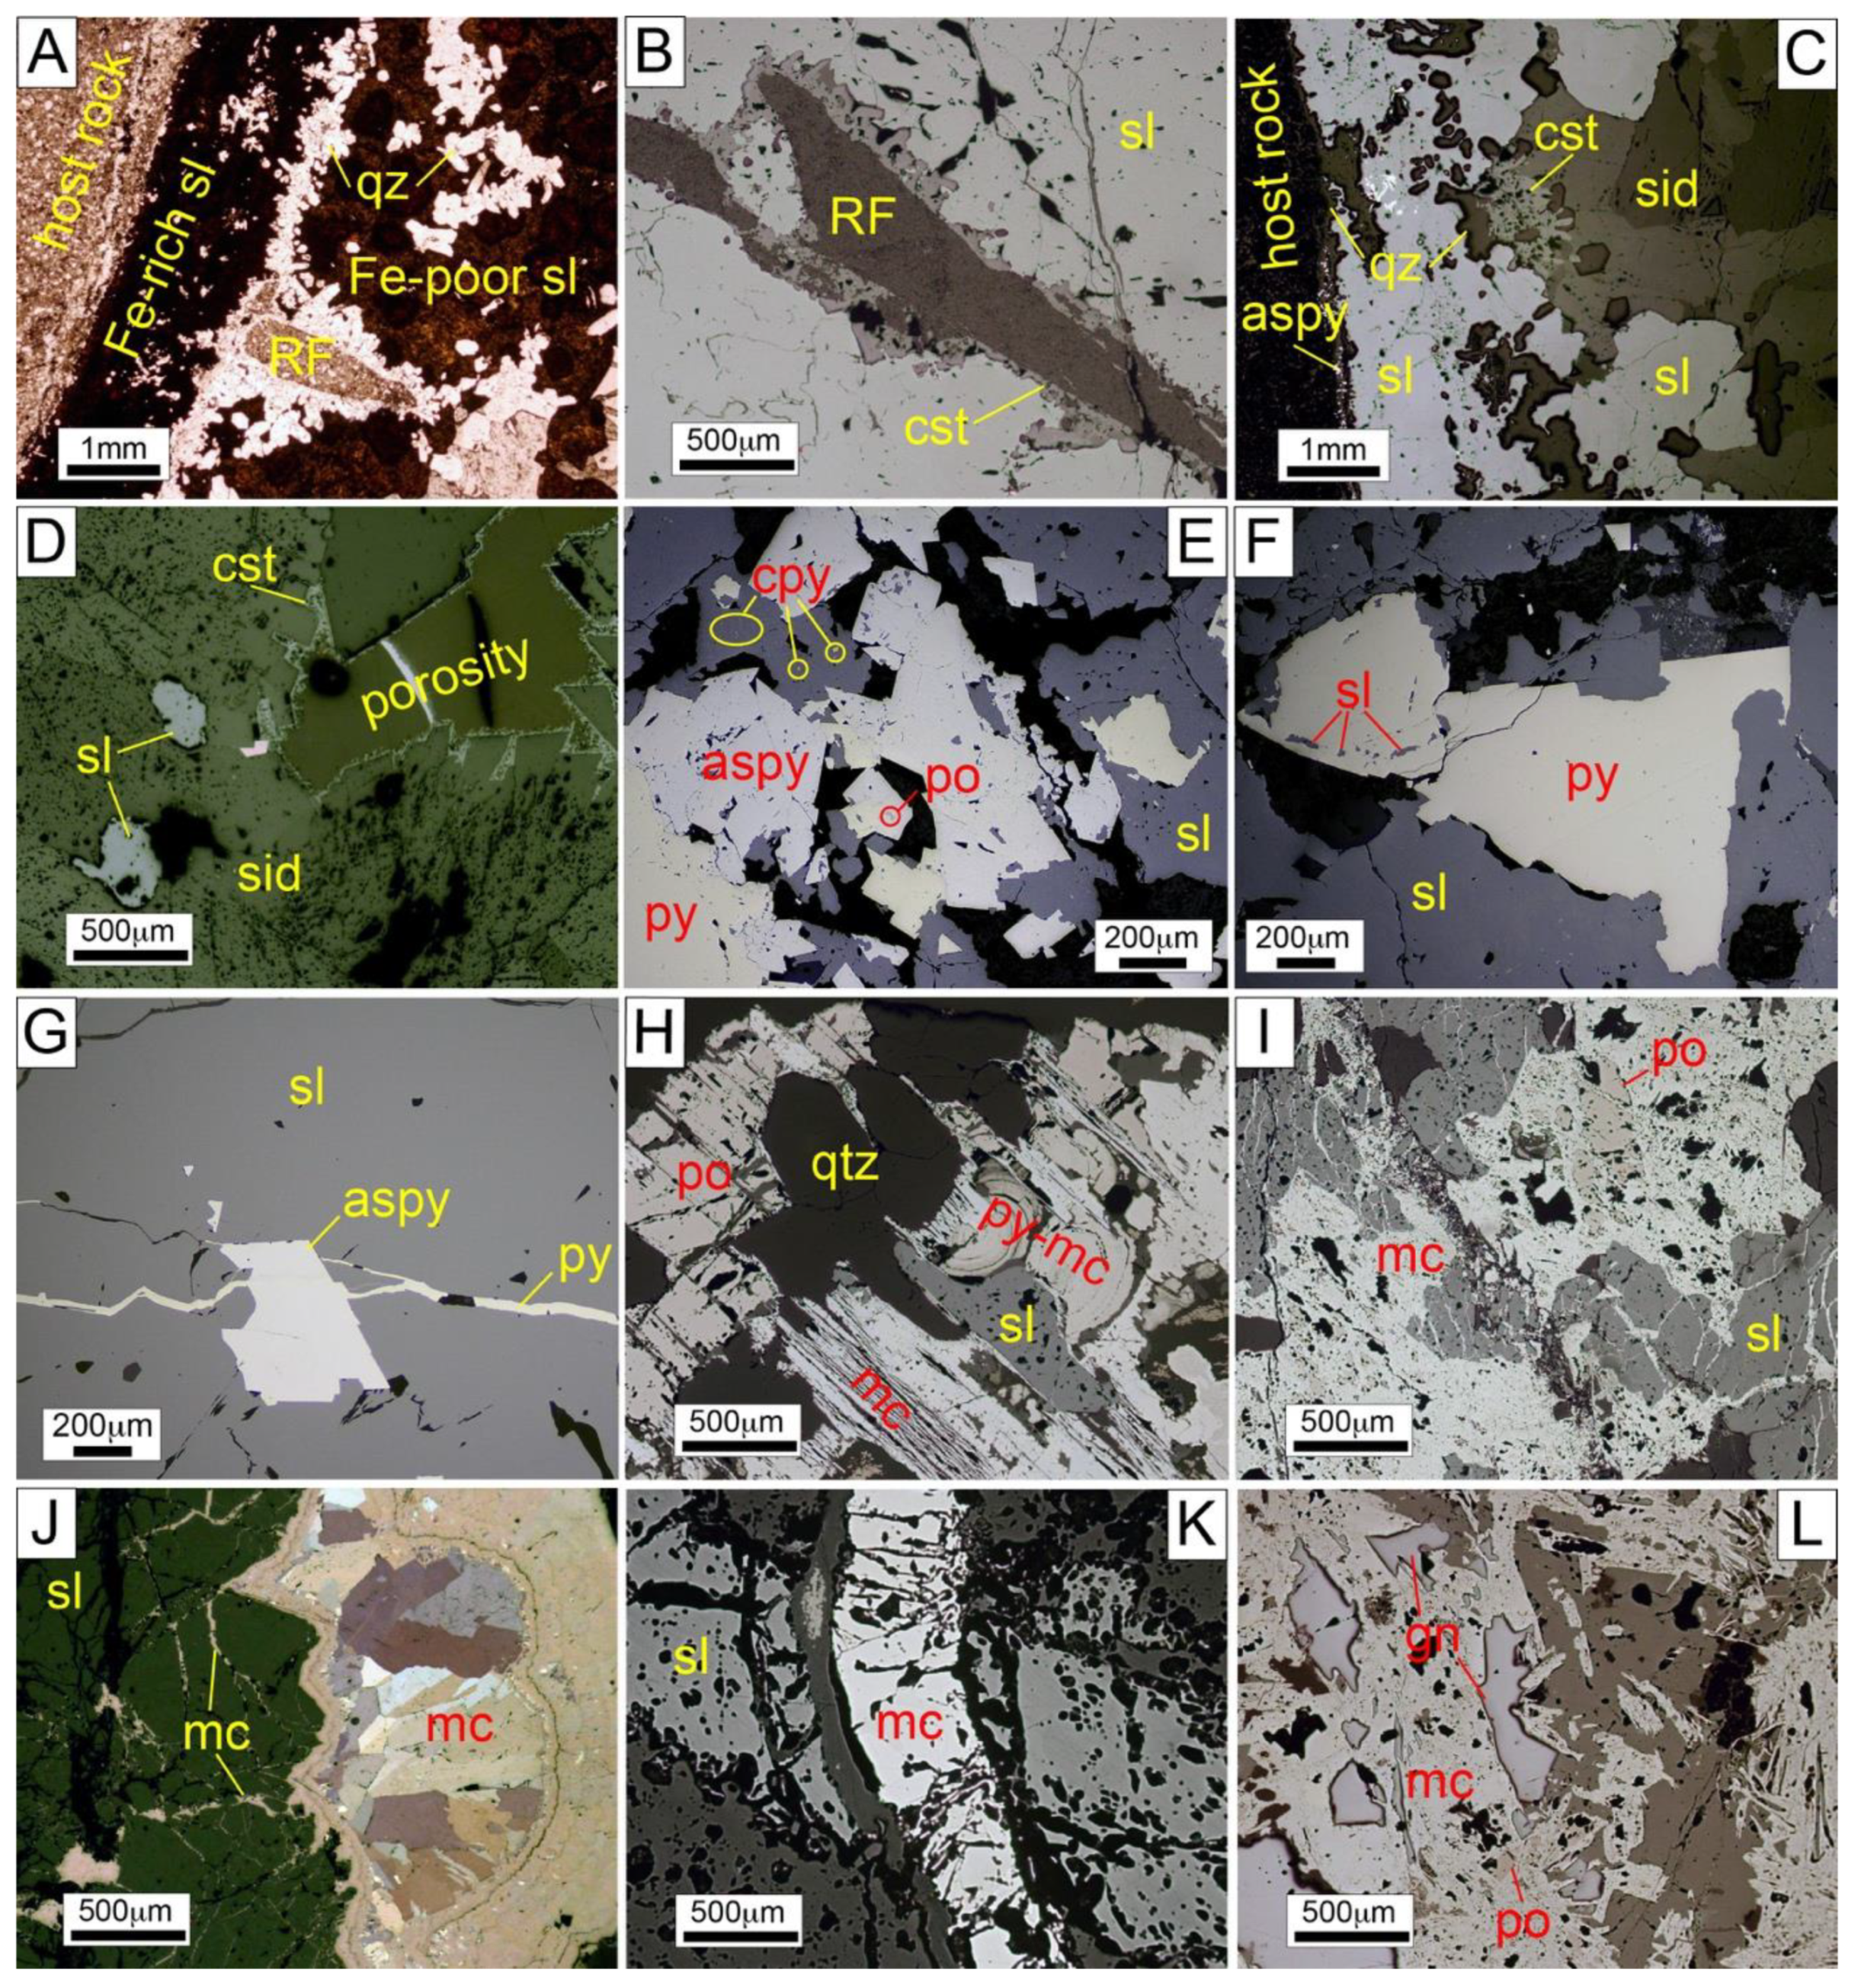
We determined that quartz and cassiterite preceded crystallization of the first sulfides in tin ores, and that arsenopyrite and pyrrhotite were deposited prior (and partly synchronously) to a widespread crystallization of Fe-rich sphalerite. By analogy, these assemblages represented the high-temperature stage described by Kelly and Turneaure [25]. Microthermometric fluid inclusion data were not available for Huari Huari. Studies on fluid inclusions from other “shallow” Sn and Sn–Zn deposits from SW Bolivia yielded entrapment temperatures as high as 510 °C for early quartz and 480 °C for cassiterite, with evidence of boiling [25]. Other workers have reported homogenization temperatures as high as 441 °C in early quartz from Sn + Zn ± Ag deposits in the Potosí district [52], and up to 394 °C in cassiterite from the Huanuni deposit [
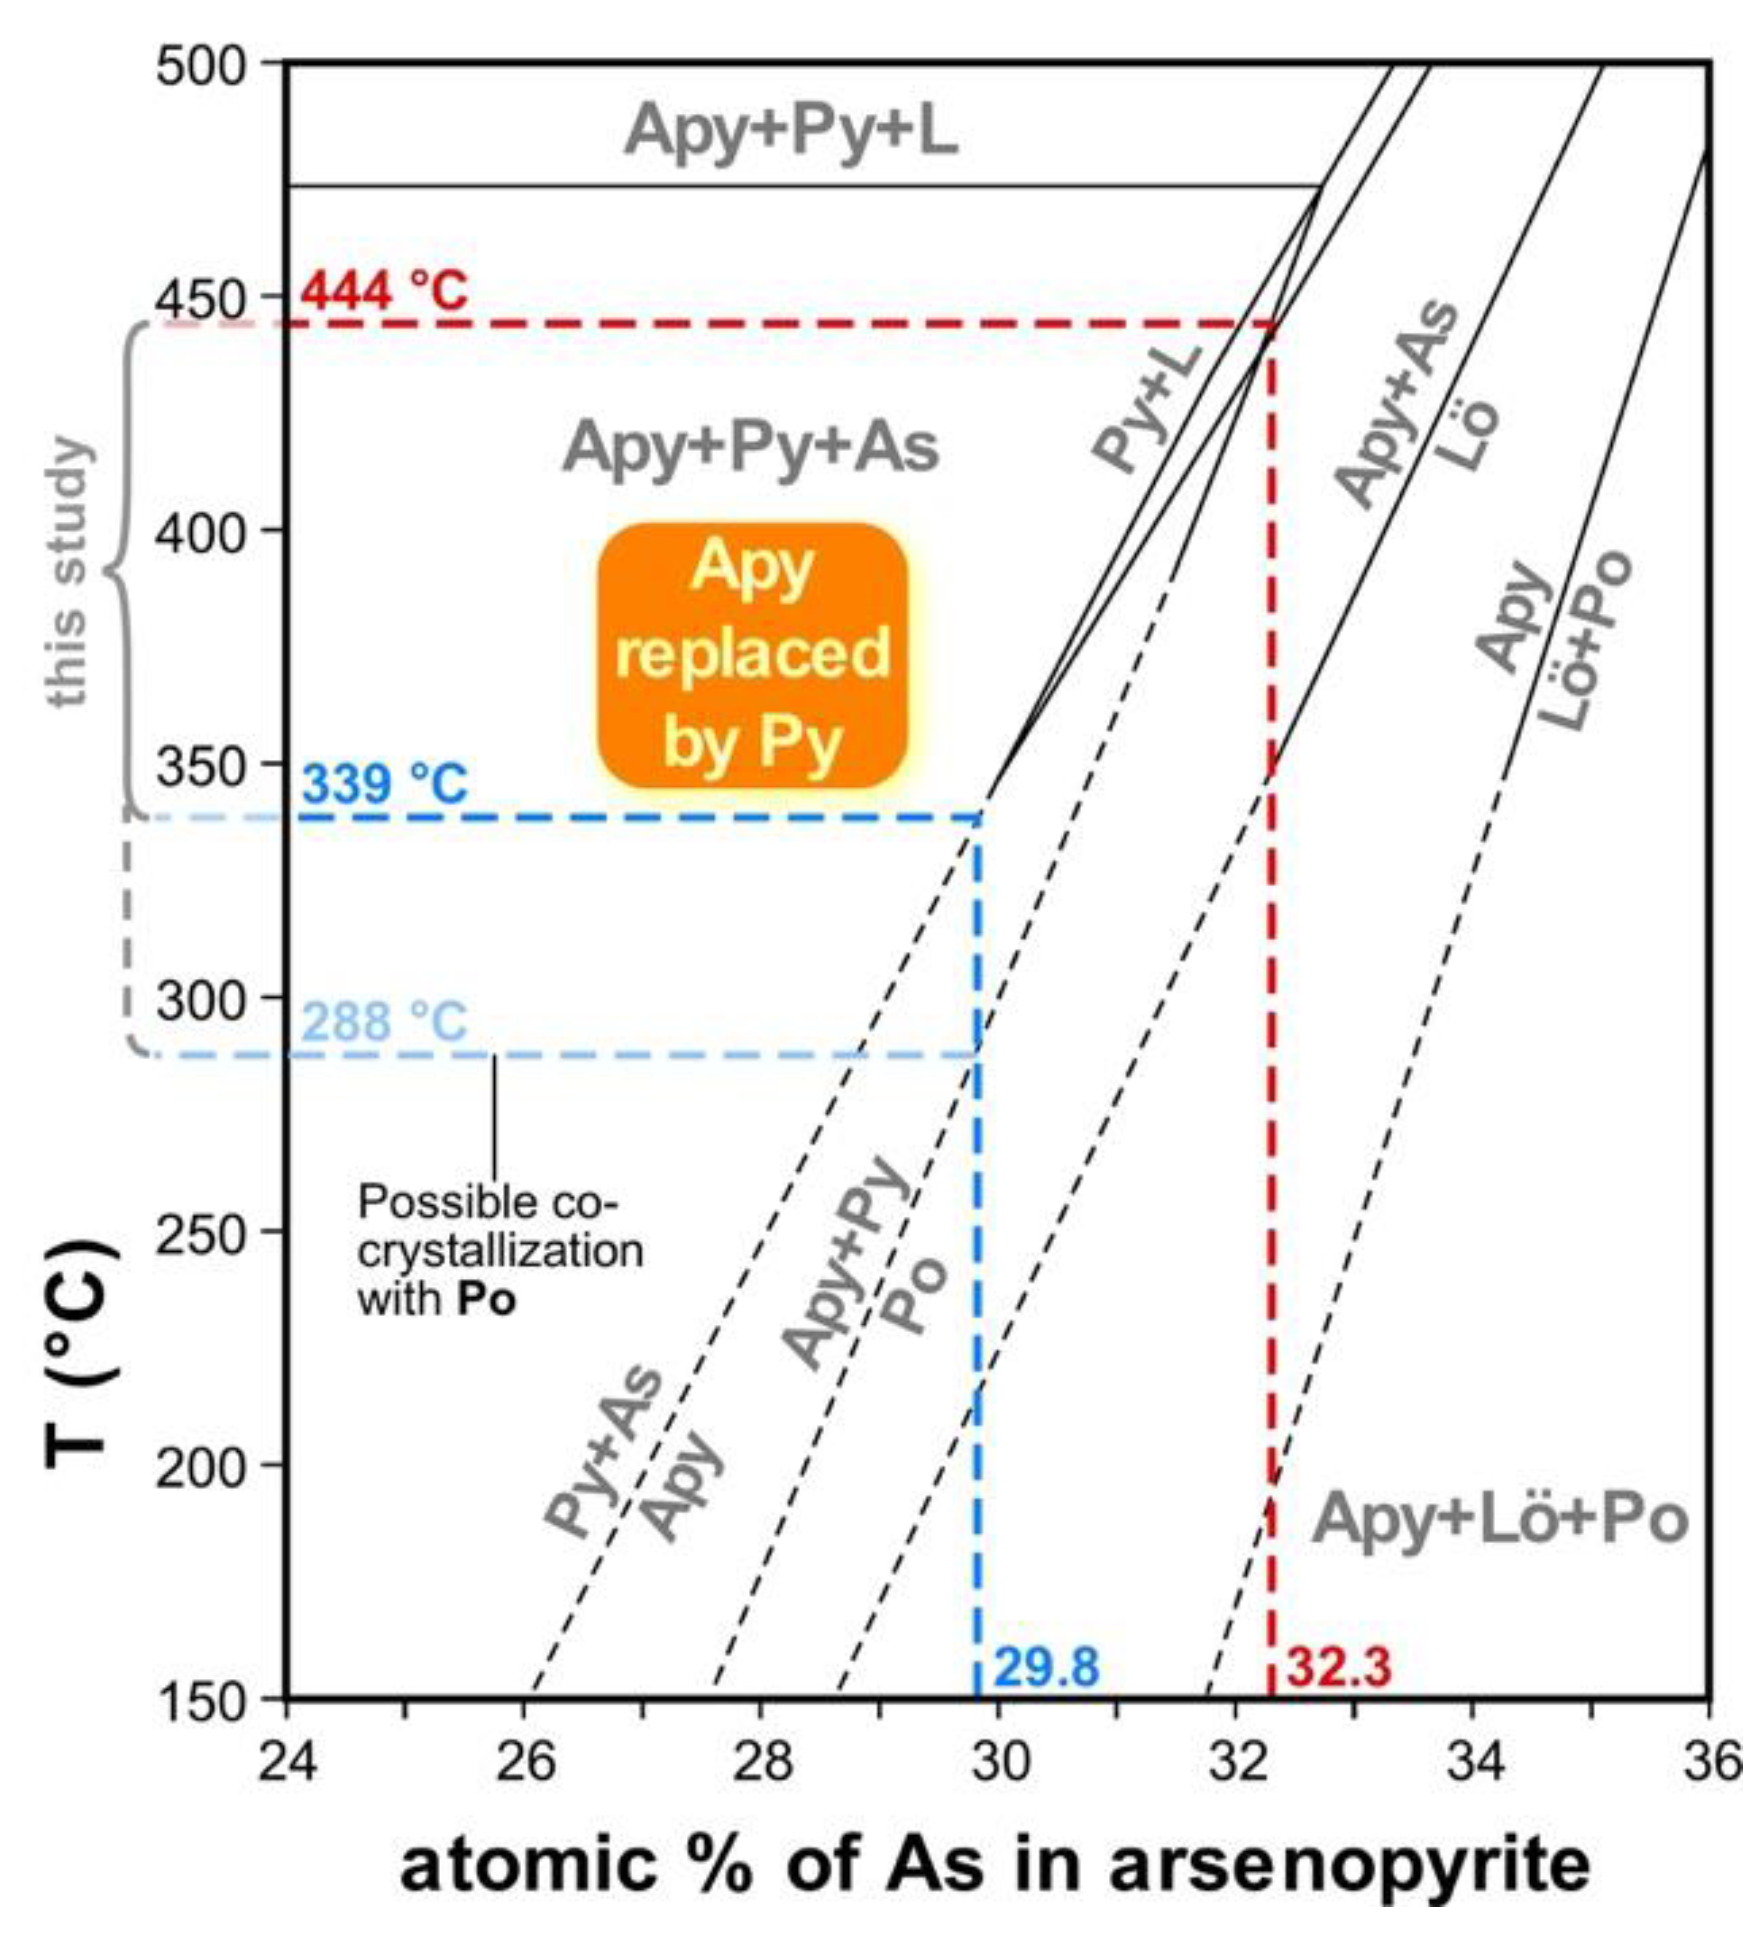
53]. For the Huari Huari district, the composition of arsenopyrite, replaced by pyrite, pointed to depositional temperatures that ranged between 339 and 440 °C (see Figure 14) at log f(S2) below –7 [54,55]. The calculated range of crystallization temperatures for arsenopyrite was congruent with temperatures for fluid inclusions in neighboring deposits during the early evolution of the mineralizing system. It also agreed with maximum temperatures calculated from arsenopyrite compositions in neighboring shallow Sn + Zn deposits (Llallagua, Huanuni and Tasna; [25]). The maximum value of As concentration (32.3 As at. %) in the present study was within the expected range for arsenopyrite formed with pyrite, for which a maximum of 33.3 at. % As has been determined in natural crystals—a composition that is close to the arsenopyrite + pyrite + pyrrhotite + L (liquid) + V (vapor) invariant at 33.0 As at. % [54]. In addition, we described very local inclusions of pyrrhotite within arsenopyrite crystals that might suggest cocrystallization of both phases; in this case, crystallization temperatures could be as low as 288 °C (Figure 14).
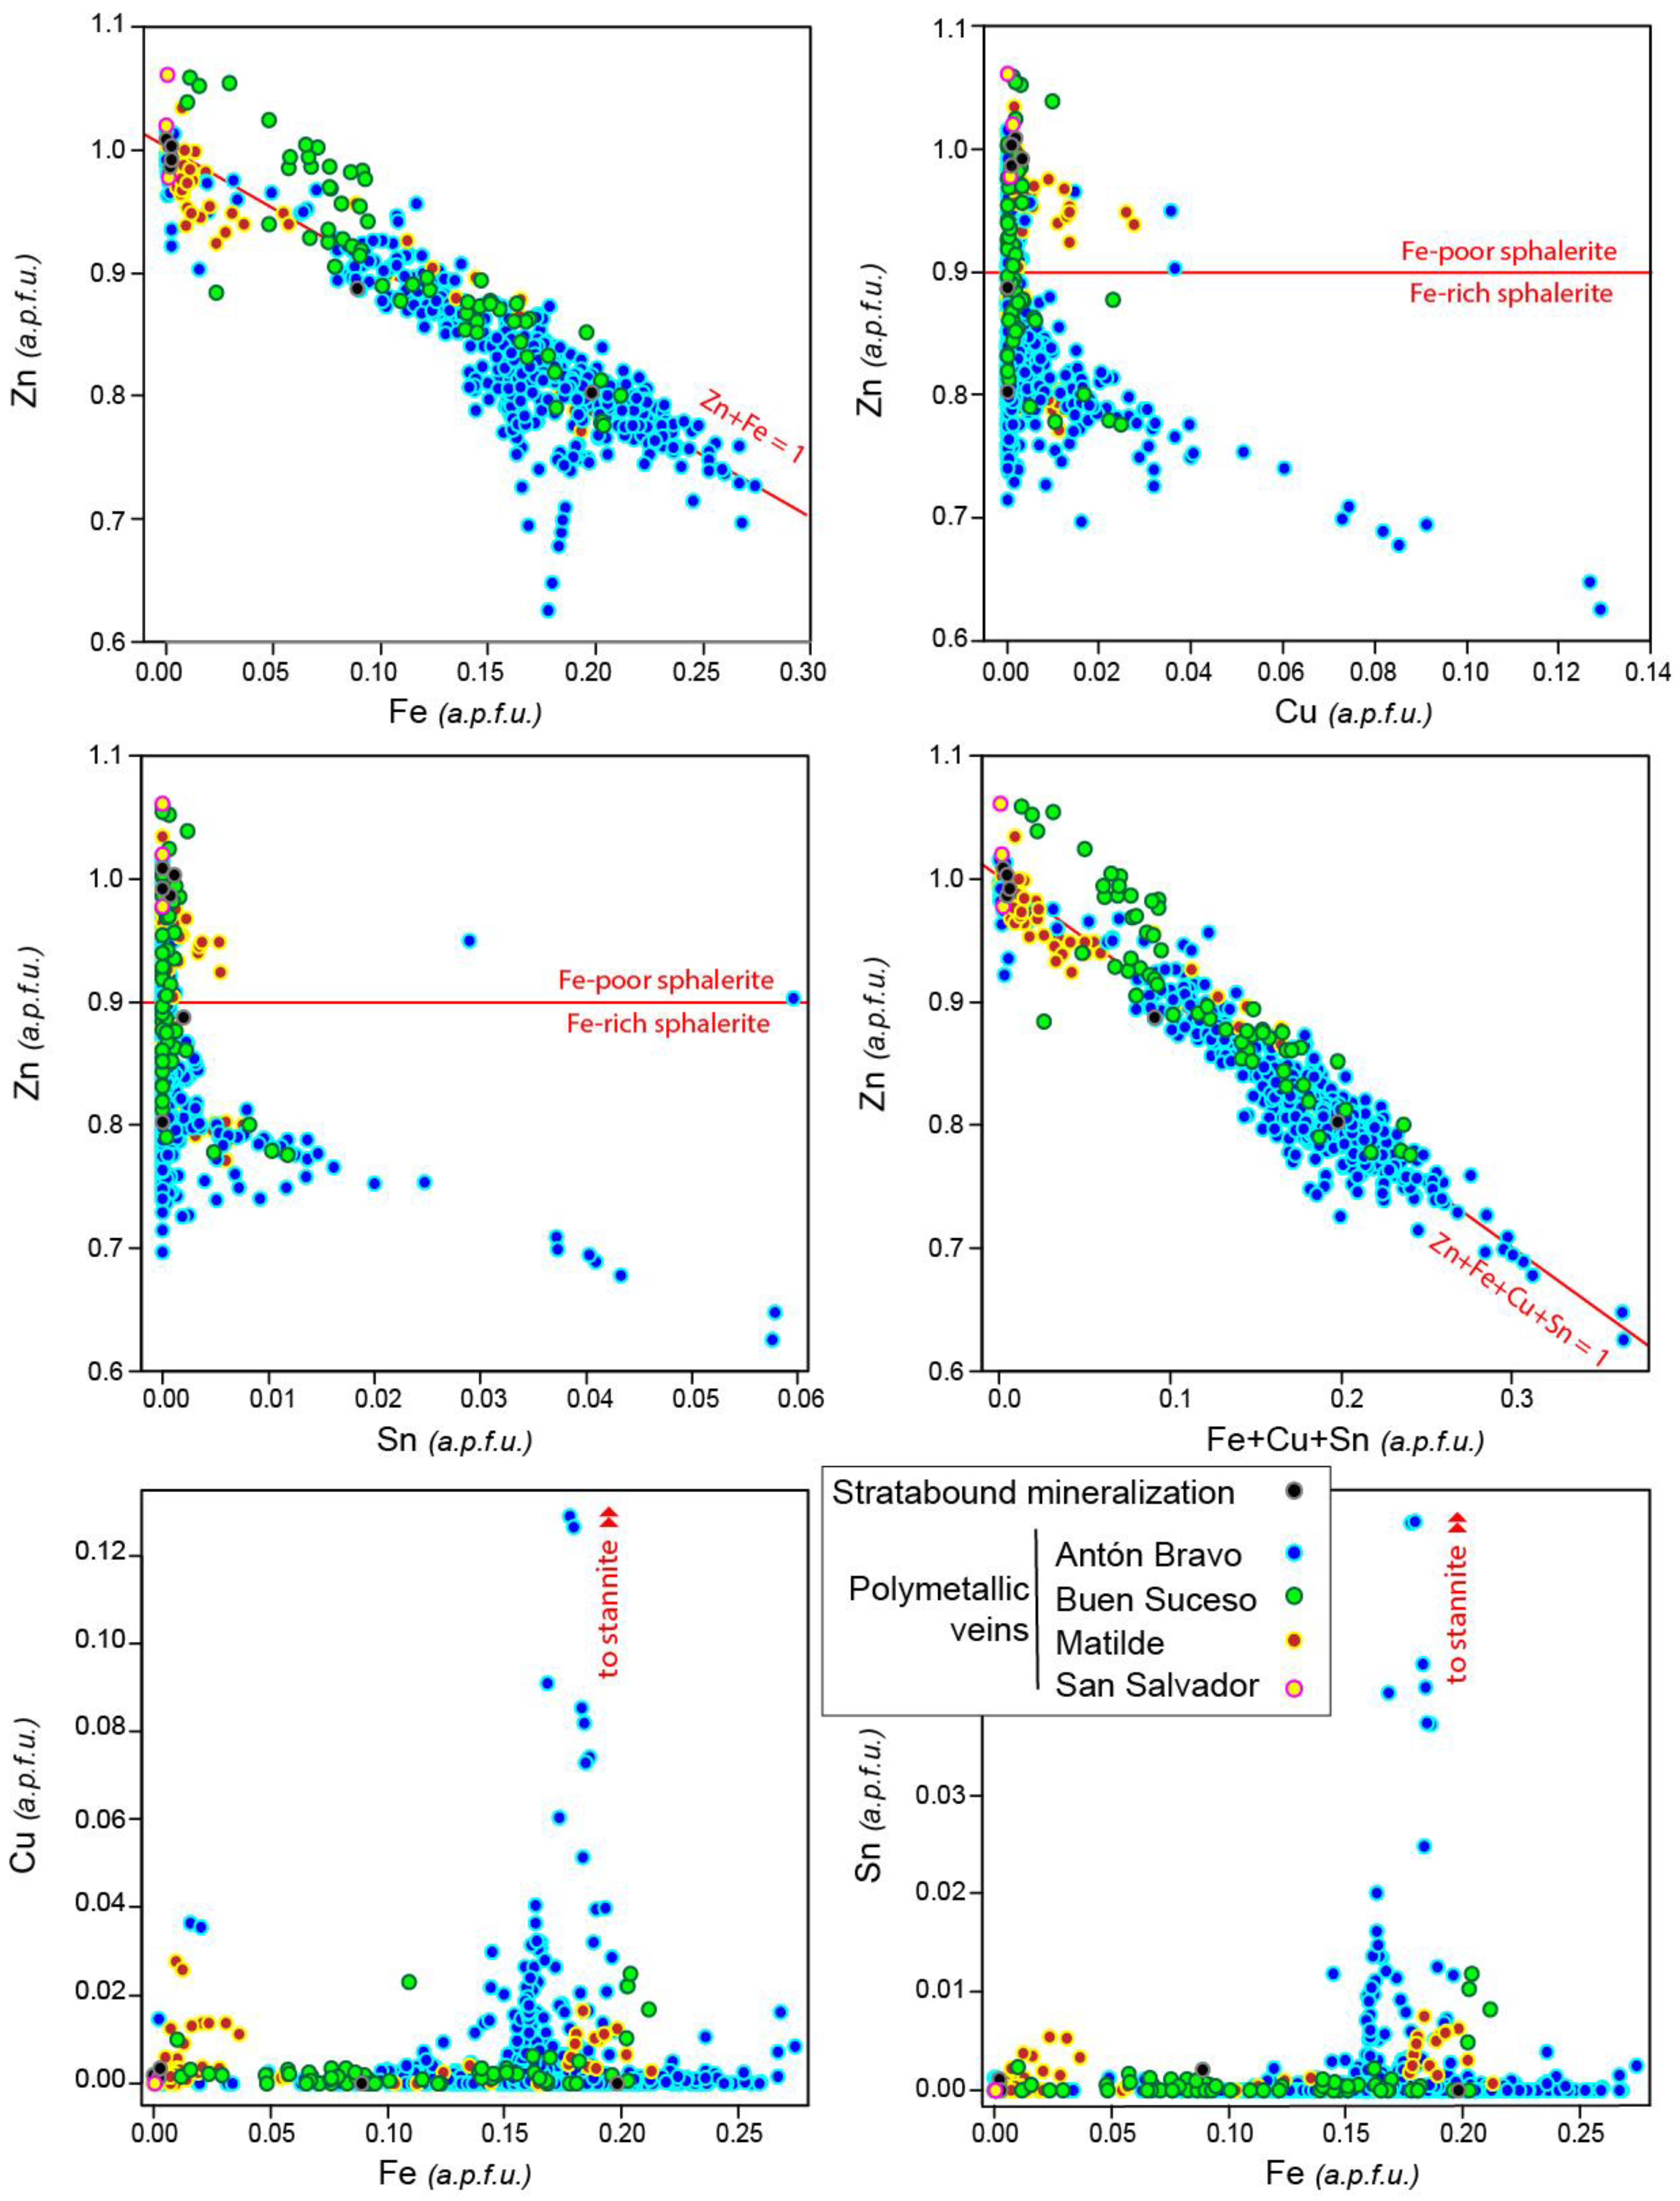
Early sphalerite was characterized by higher FeS content than subsequent generations of this mineral. This observation was compatible with a progressive decrease in the temperature of the system and/or an increase in f(S2) during the protracted crystallization of this phase. This, in turn, was in good agreement with a first crystallization of pyrrhotite as the main Fe sulfide and a subsequent crystallization of pyrite (Figure 7). Indeed, the molecular proportions of FeS in early sphalerite, which were as high as 27.3 mol. % in the Antón Bravo vein, were consistent with a crystallization in equilibrium with pyrrhotite and out of the pyrite stability field at any temperature and pressure [56,57], as already deduced from the textural study (Figure 7). Molecular proportions of FeS in pyrrhotite from the Antón Bravo vein (up to 94.7 mol. %) were compatible with a direct crystallization of this phase in the absence of pyrite in the FeS–S2 system at a reasonable temperature range between 300 and 400 °C and at log f(S2) below –7 [58,59,60], which coincided with the f(S2) drawn from the composition of previously crystallized arsenopyrite. Assuming cocrystallization of a pyrrhotite with an FeS of 94.7 mol. % and an early sphalerite with an FeS of 27.3 mol. % at log f(S2) between –7 and –12, crystallization temperatures at this stage would range between 300 and 450 °C, respectively, according to the sphalerite geothermometer of Scott and Barnes [56]. This temperature range was, in addition, similar to that calculated from the composition of arsenopyrite. These geothermometers altogether suggested initial temperatures of the mineralizing system that ranged between ~300 and 450 °C, at least in the Antón Bravo veins group. In the Matilde vein group, pyrrhotite showed slightly lower FeS content than in the Antón Bravo vein. Such FeS content may indicate temperatures of deposition higher than 450 °C at log f(S2) higher than –6 (assuming that cocrystallization with pyrite did not occur, and this assumption was allowed by our textural study and the lack of alteration in the analyzed pyrrhotite). An initially high f(S2) in the Matilde and Buen Suceso vein groups was also suggested by lower maximum molecular proportions of FeS in early sphalerite (up to 21 mol. %; Figure 9) than in the Antón Bravo vein group. This composition pointed to cocrystallization between sphalerite and pyrrhotite near the pyrite stability field (or at its boundary) according to experimental data by Scott and Barnes [56]. At a log f(S2) of –6 or higher, sphalerite with 21 mol. % FeS would cocrystallize with pyrrhotite at a temperature ≥450 °C.
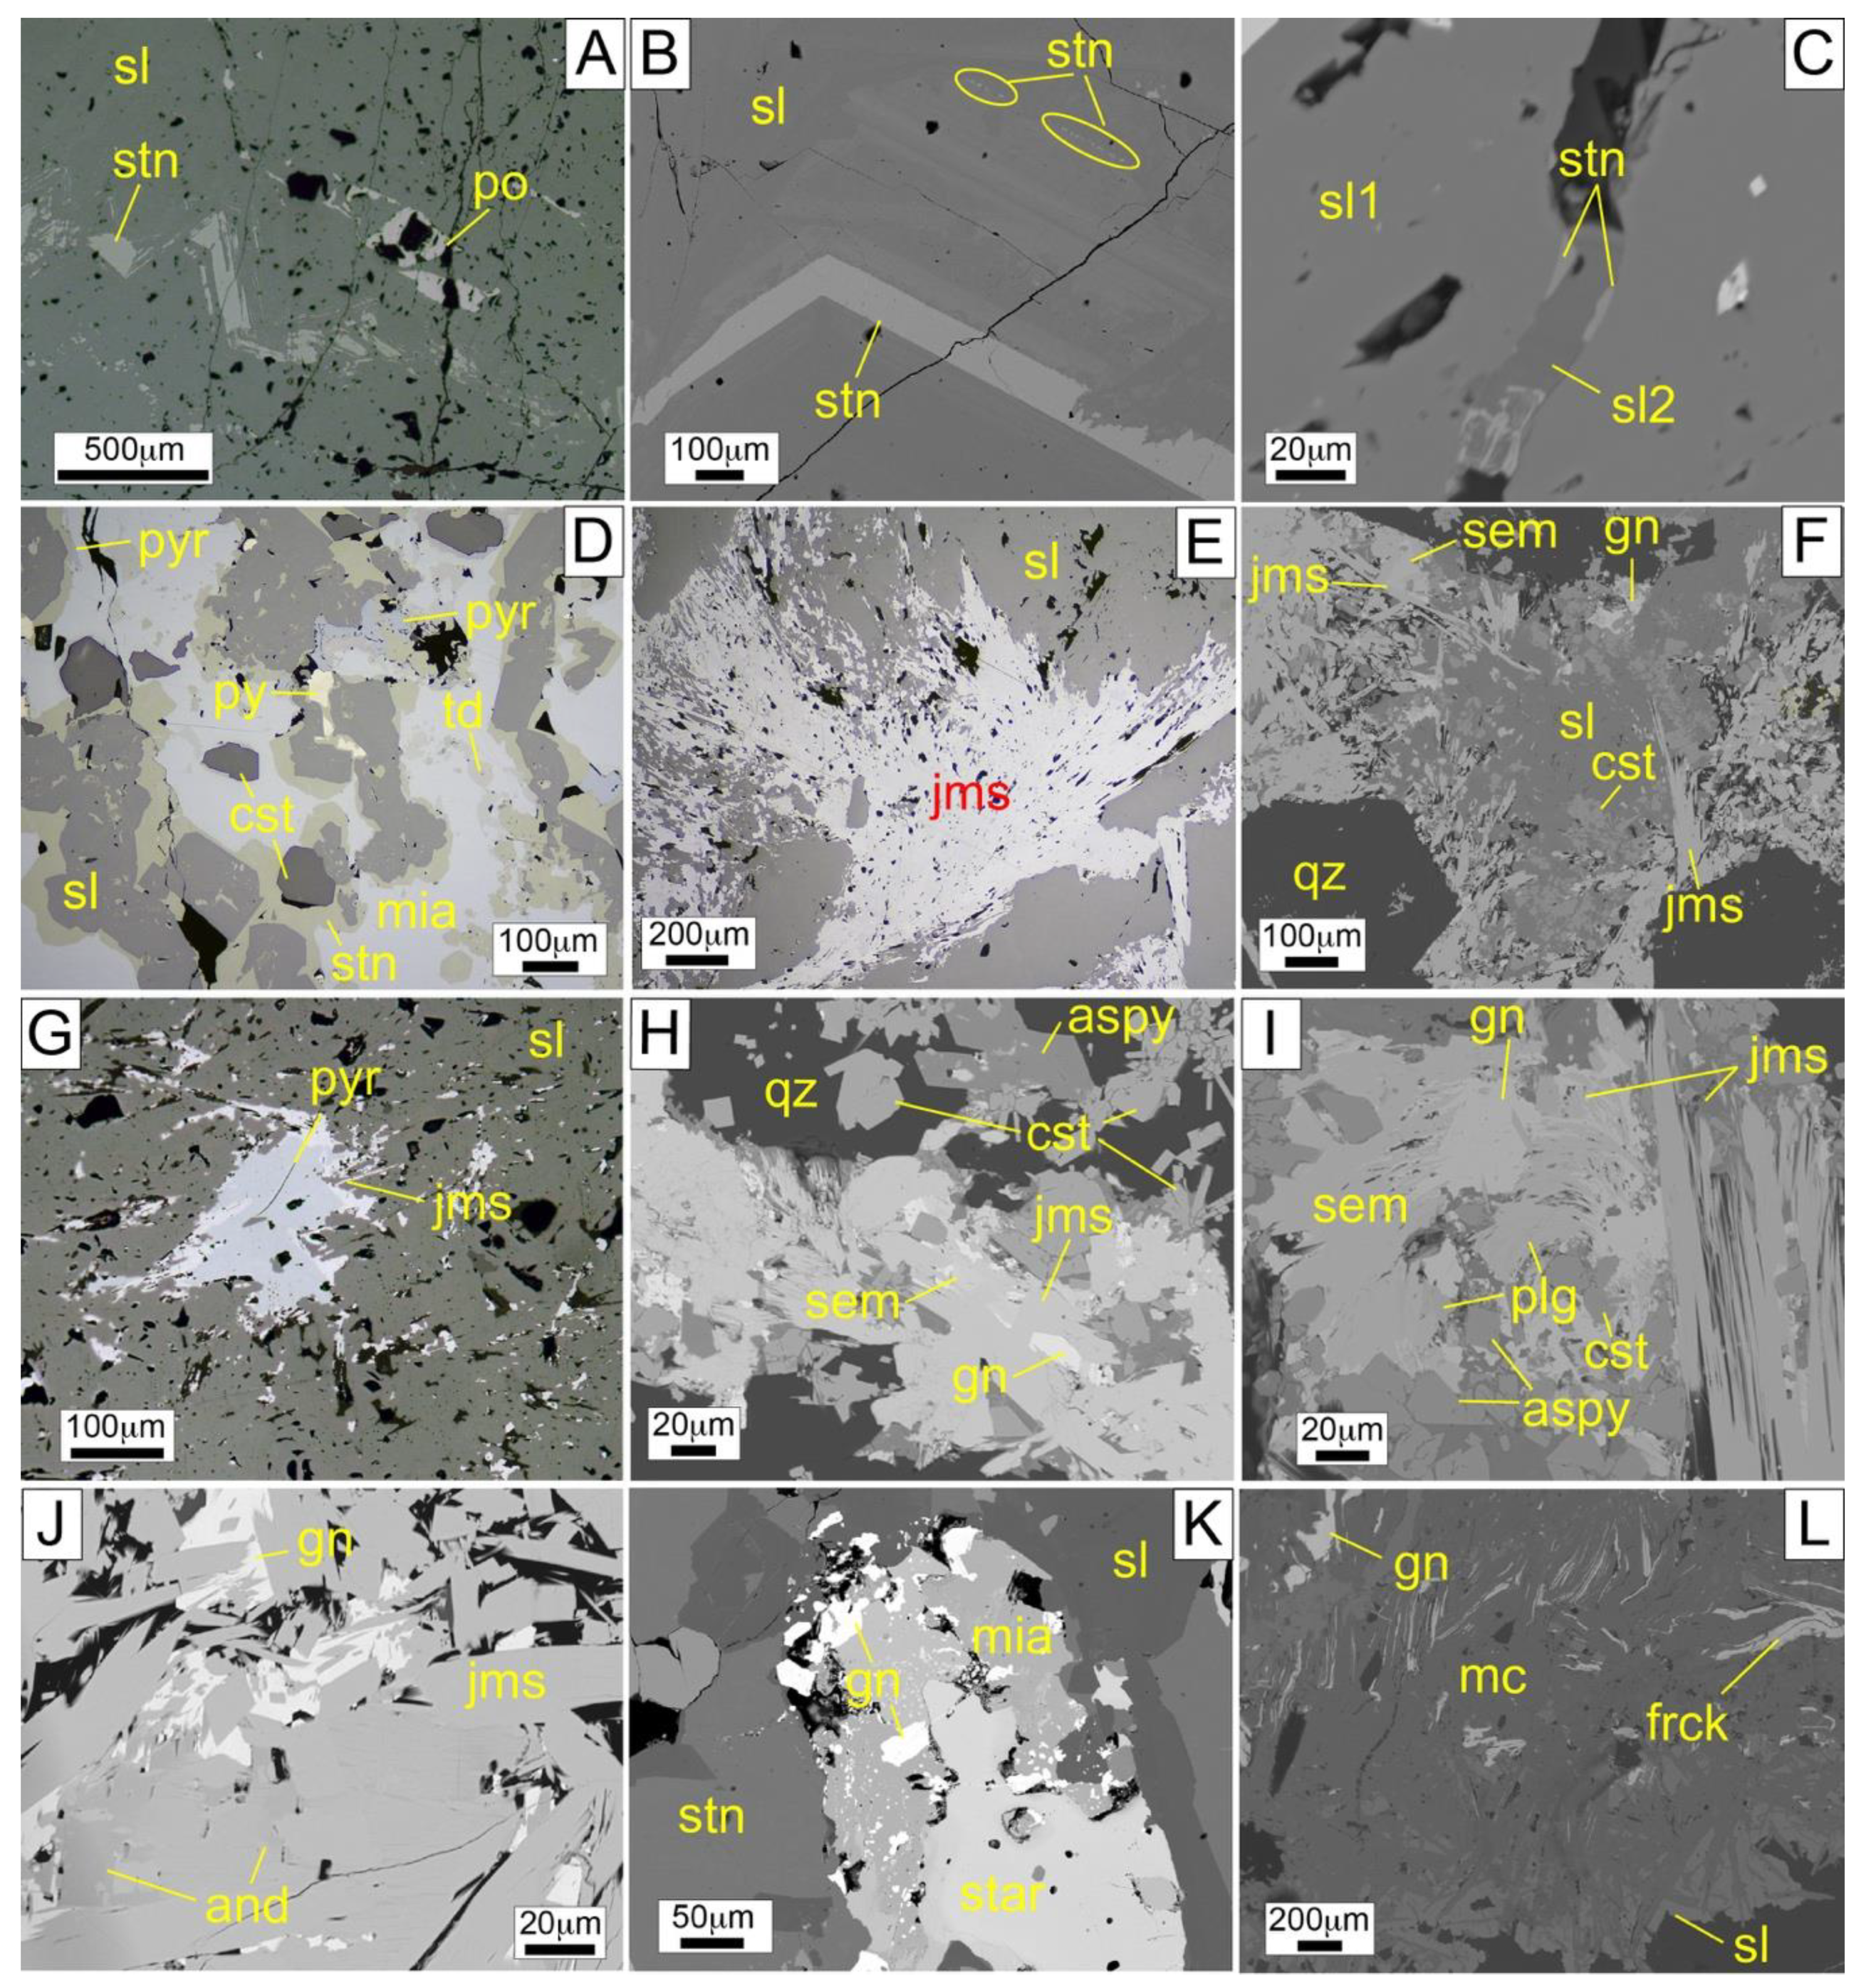
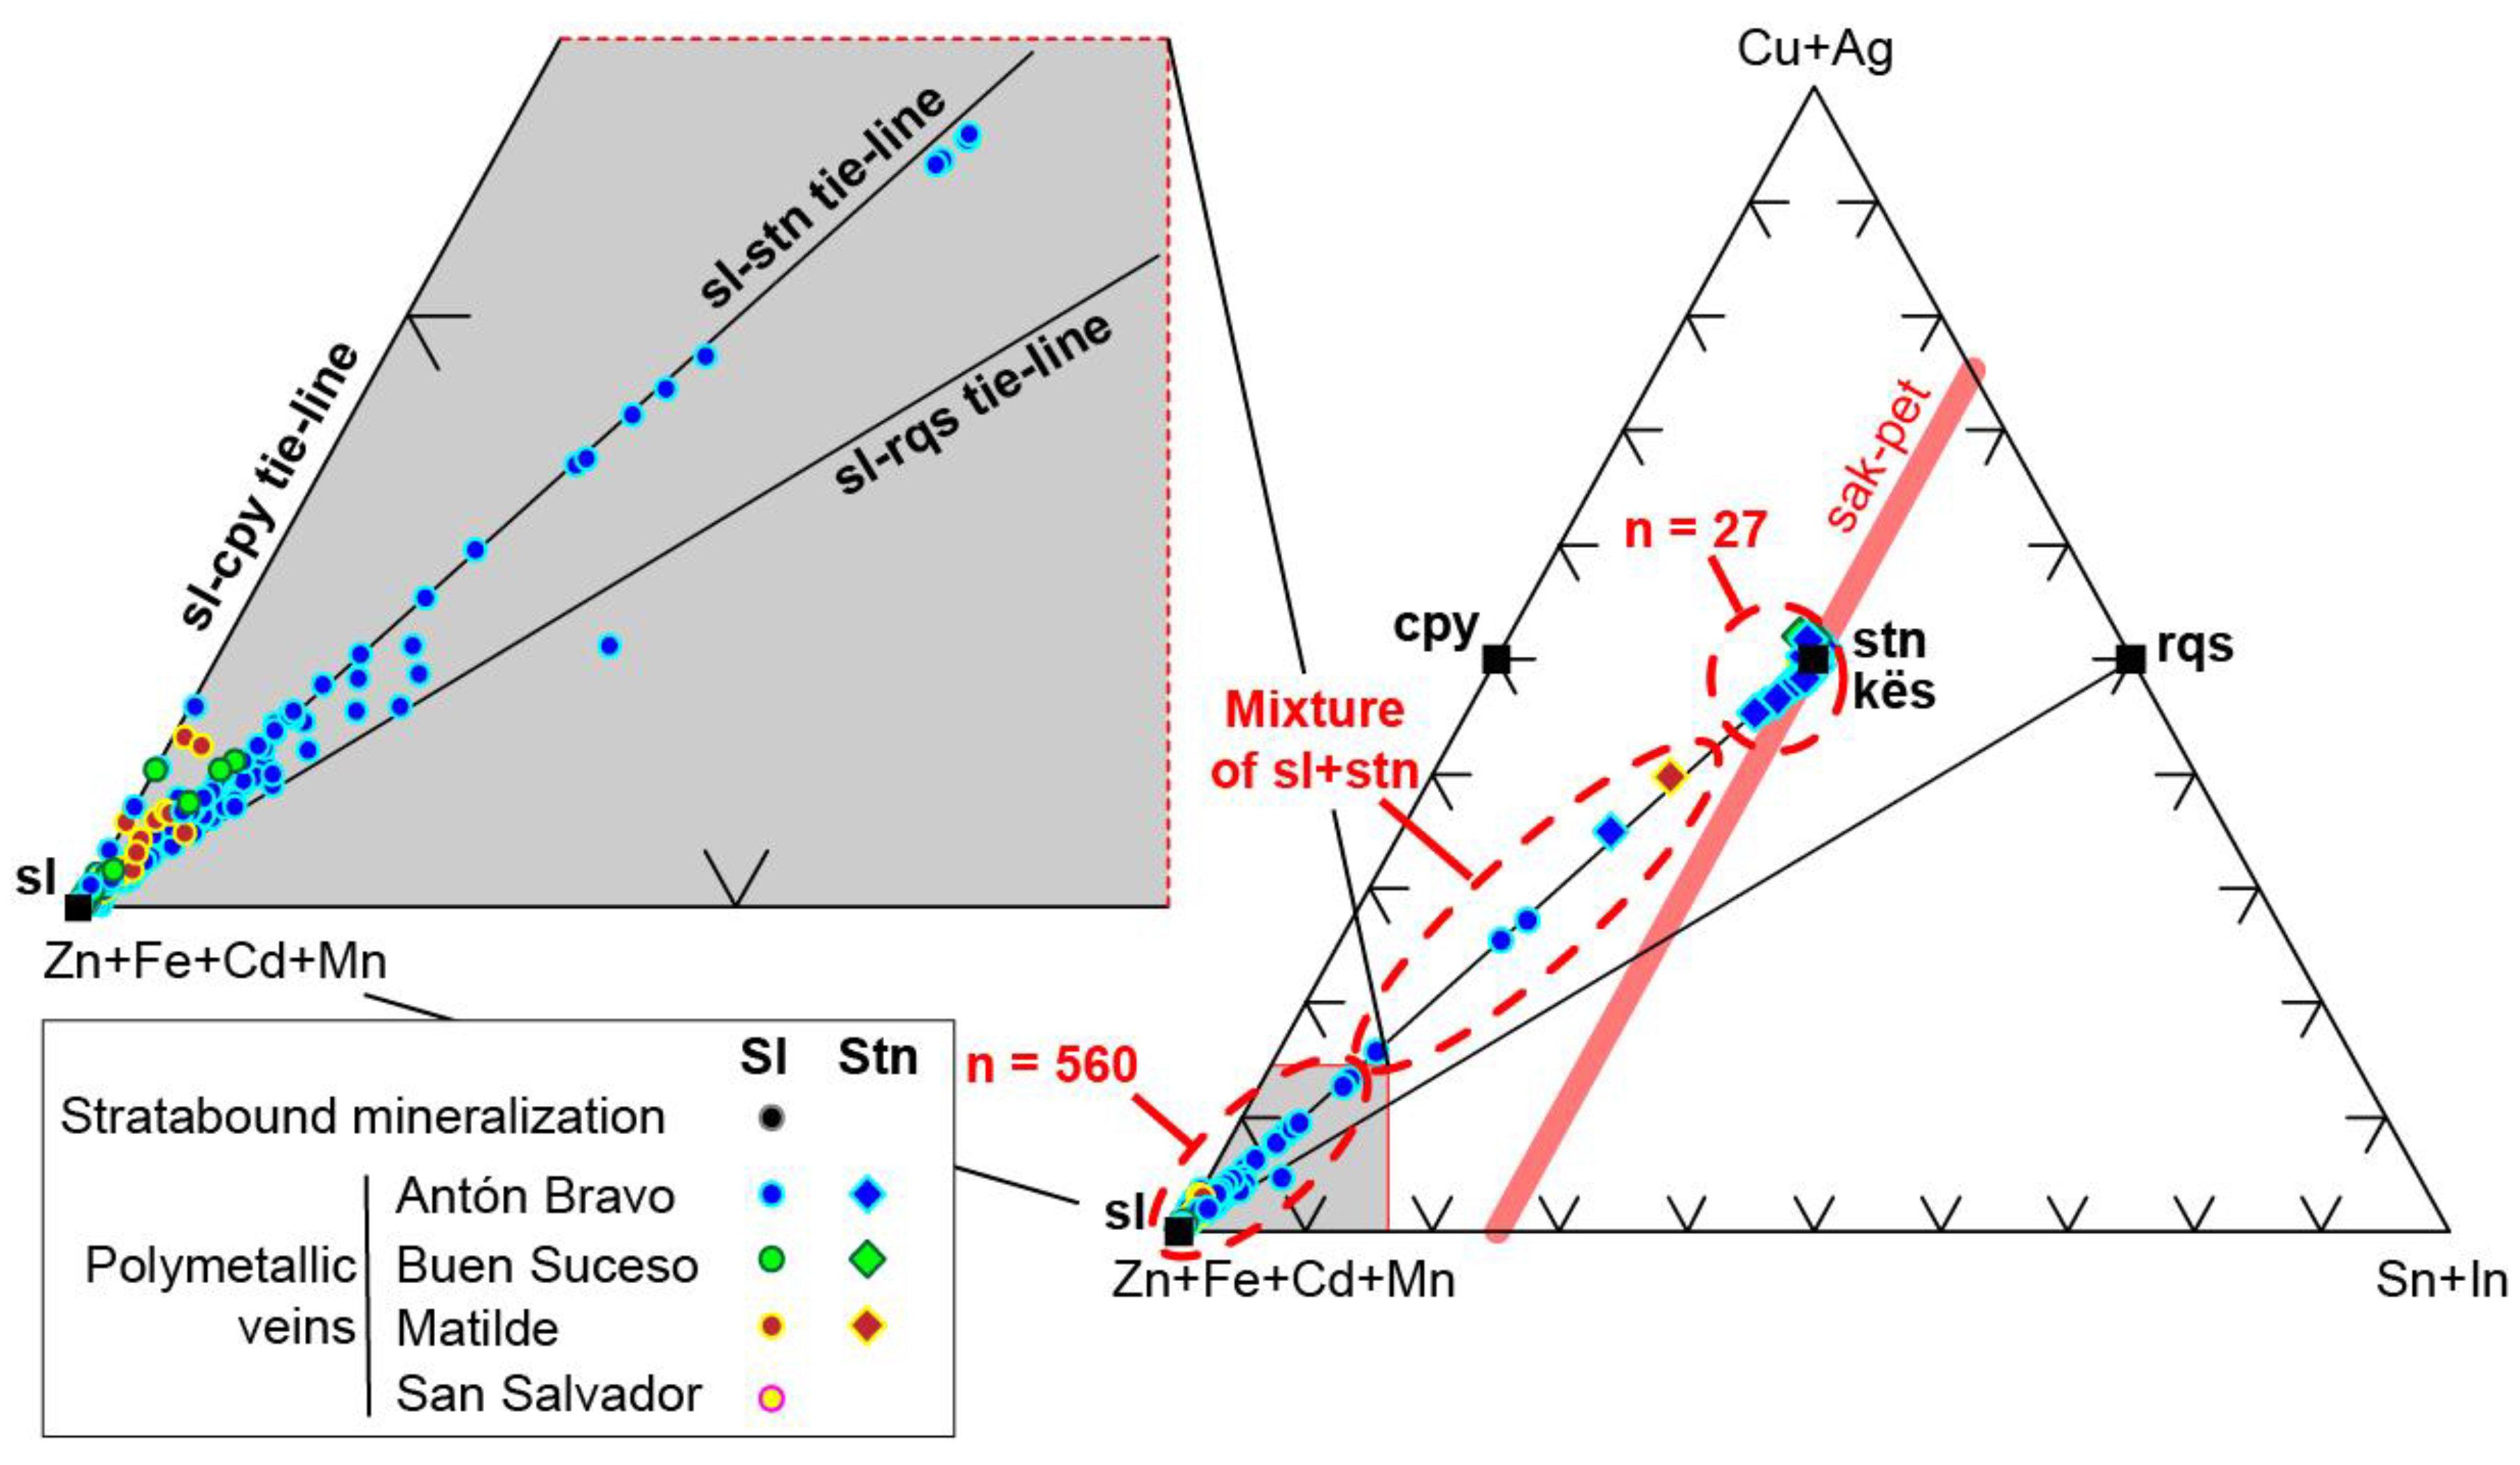
Oscillatory compositional zoning was common in sphalerite from Huari Huari, and intergrowths between sphalerite and stannite were observed chiefly in the Matilde and Antón Bravo vein groups (Figure 6A,B). A similar phenomenon was described by Oen et al. [51], who attributed the oscillatory zoning to a classical model of concentration gradients that triggered cyclic supersaturation at the crystal–liquid interphase (or boundary layer) at isothermal, nonequilibrium conditions. Temperatures of deposition near the stannite–sphalerite boundary in the (Zn,Fe)S–Cu2FeSnS4–CuInS2 system (or peritectic point in the (Zn,Fe)S–Cu2FeSnS4 system) would have led to the deposition of stannite–sphalerite interspersed bands, whereas oscillatory zoning in sphalerite would have been developed at lower temperatures. Solid solution between sphalerite and stannite in Huari Huari, with a maximum 5.9 mol. % Cu2FeSnS4 in sphalerite and a maximum 31.5 mol. % (Zn,Fe)S in stannite, fitted very well with the maximum ranges for the solid solution gap described by Oen et al. [51] and references therein. In addition, the occurrence of sphalerite–stannite oscillatory zoning, and of course a prevalence of sphalerite over stannite (or Sn minerals in general), suggested a location of the hydrothermal solution to the left of the peritectic reaction in the stannite–sphalerite binary diagram proposed by these authors, at least in the Antón Bravo and Matilde veins. In the Buen Suceso vein, stannite yielded low concentrations in Zn (below its detection limit; Figure 11) that may suggest other deposition mechanisms such as changes in P-T-X conditions, solid state reactions, elemental diffusion, or replacement reactions. According to the Nakamura and Shima [61] geothermometer, which was based on the partitioning of Fe and Zn between coexisting sphalerite and stannite, these minerals would have formed in the Antón Bravo and Matilde veins at temperatures between 250 and 350 °C (Figure 15). Further, the FeS/ZnS molar ratios in sphalerite cocrystallized with stannite, which were systematically below 20.8 mol. % FeS, pointed to their deposition in equilibrium with pyrite ± pyrrhotite [56]. The obtained FeS/ZnS molar ratios in sphalerite–stannite were similar to those in polymetallic veins and skarn deposits in Japan (Figure 15).
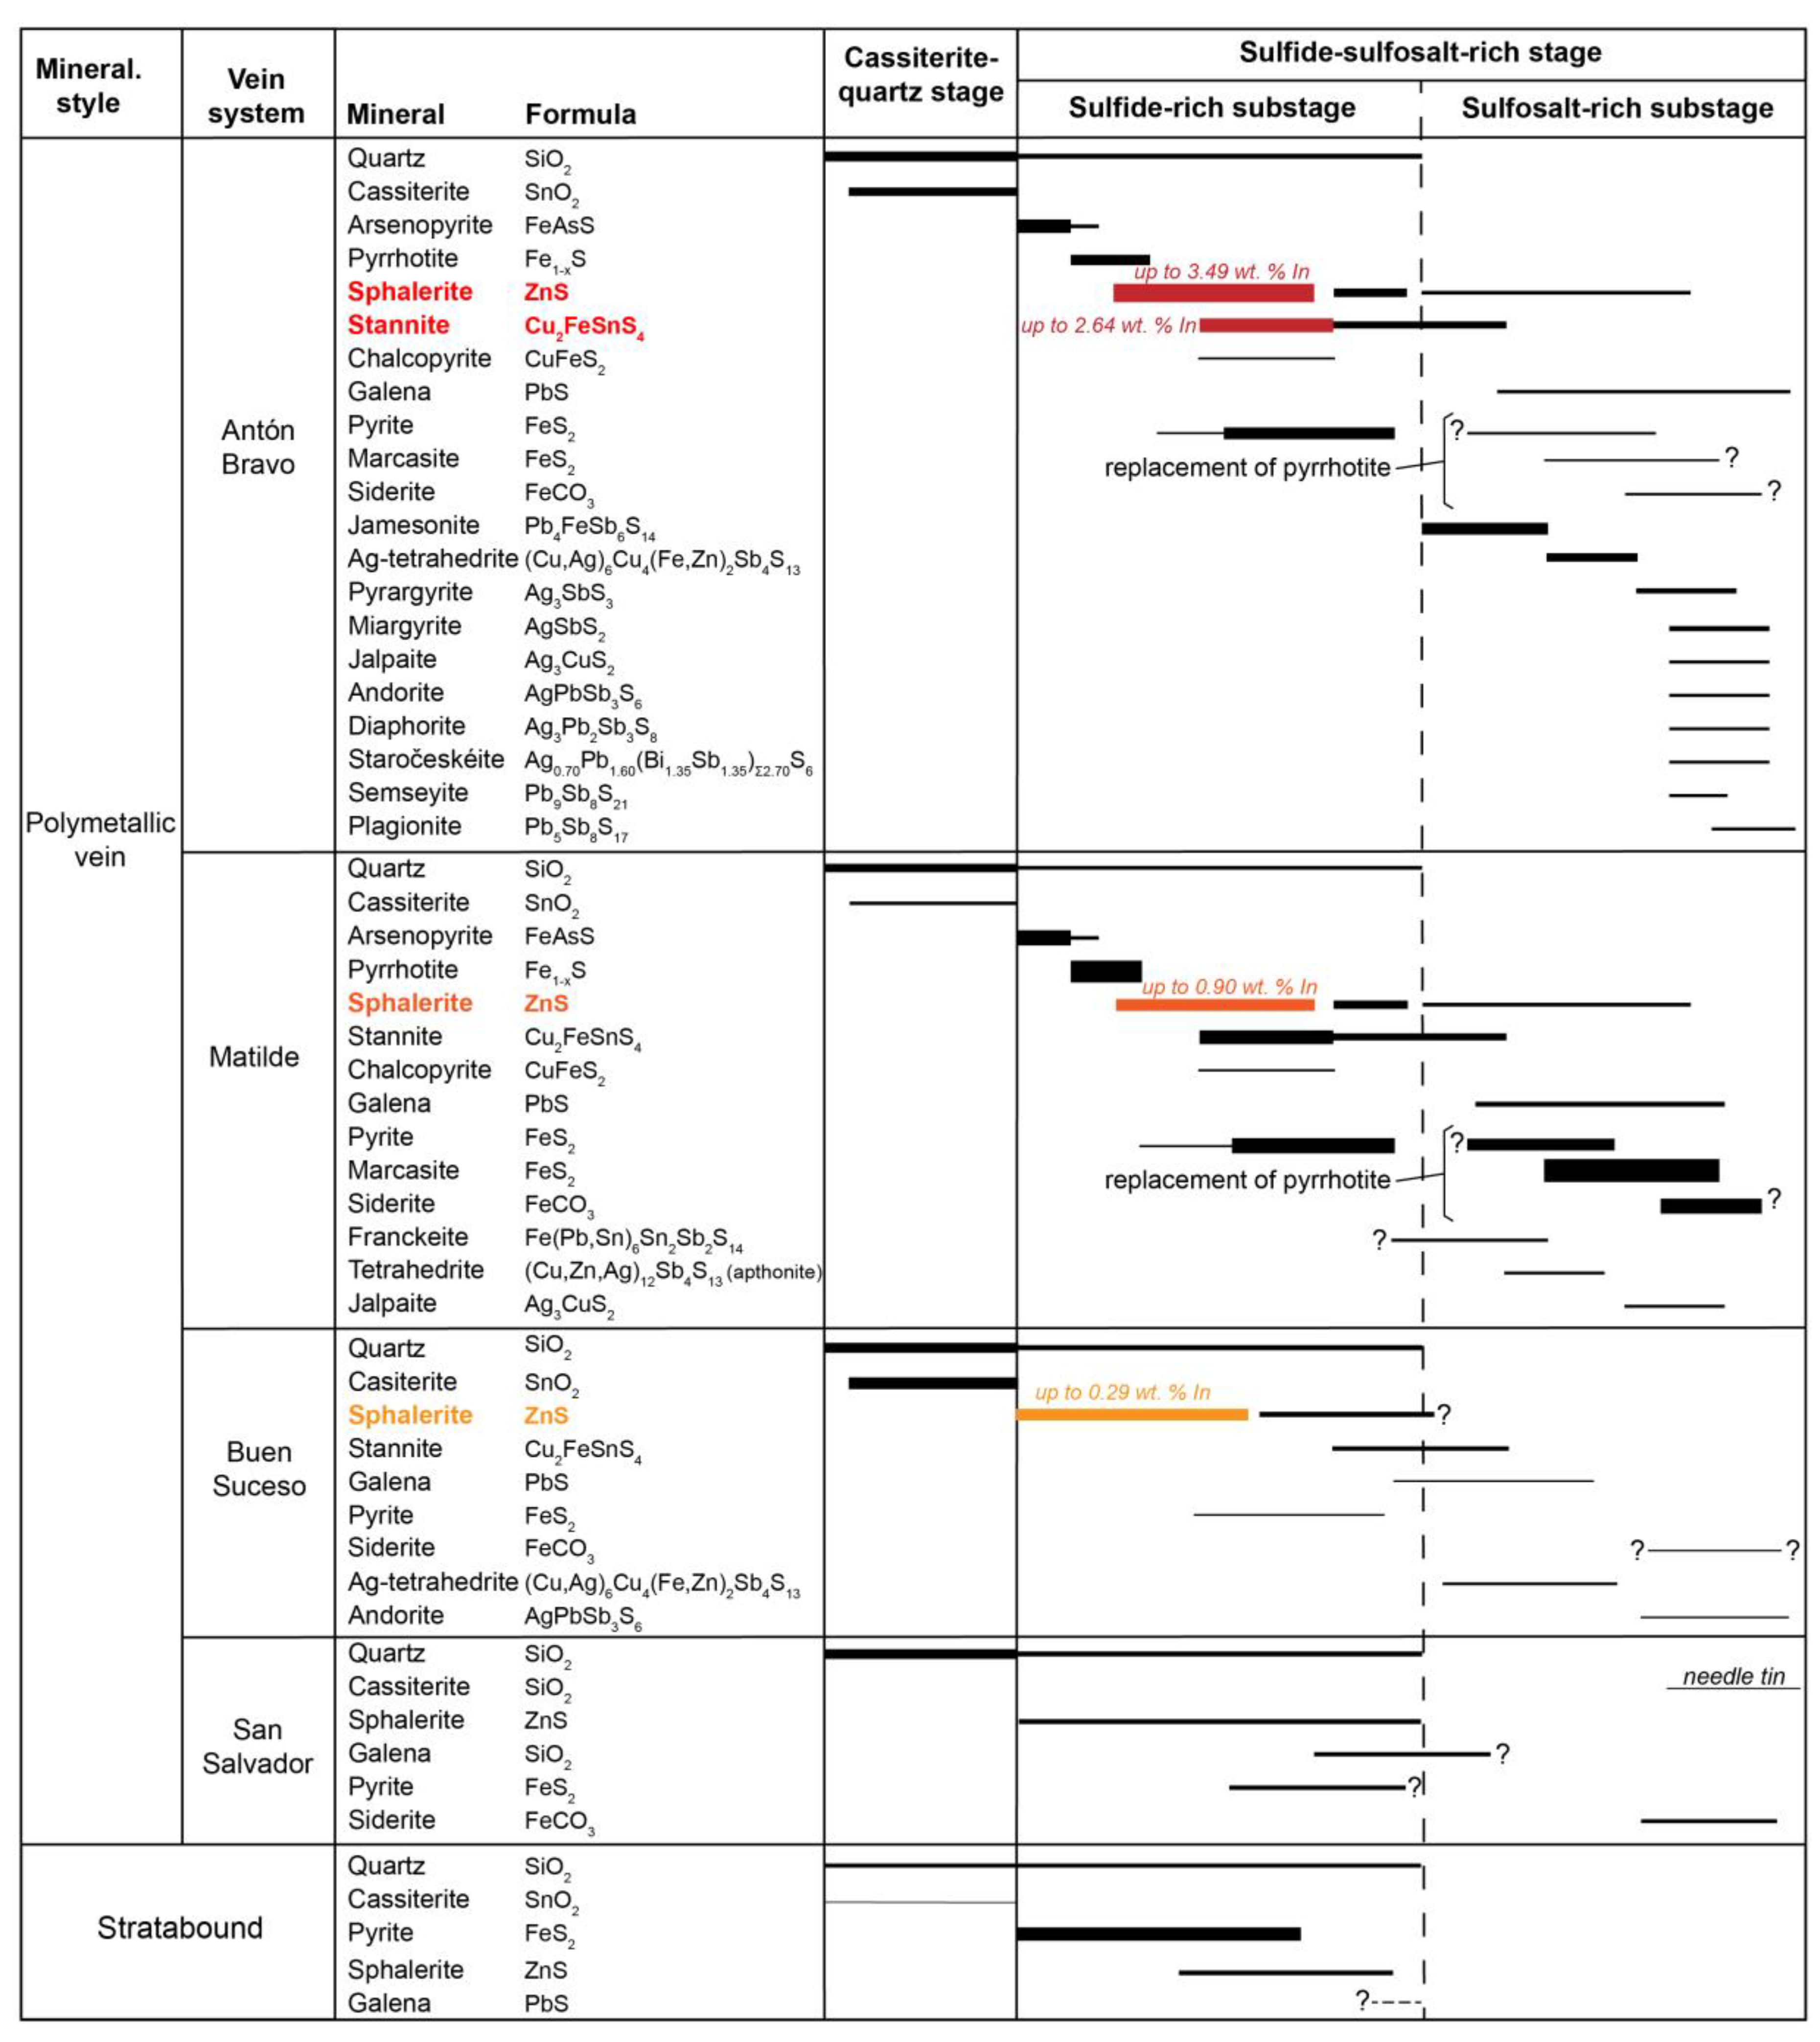
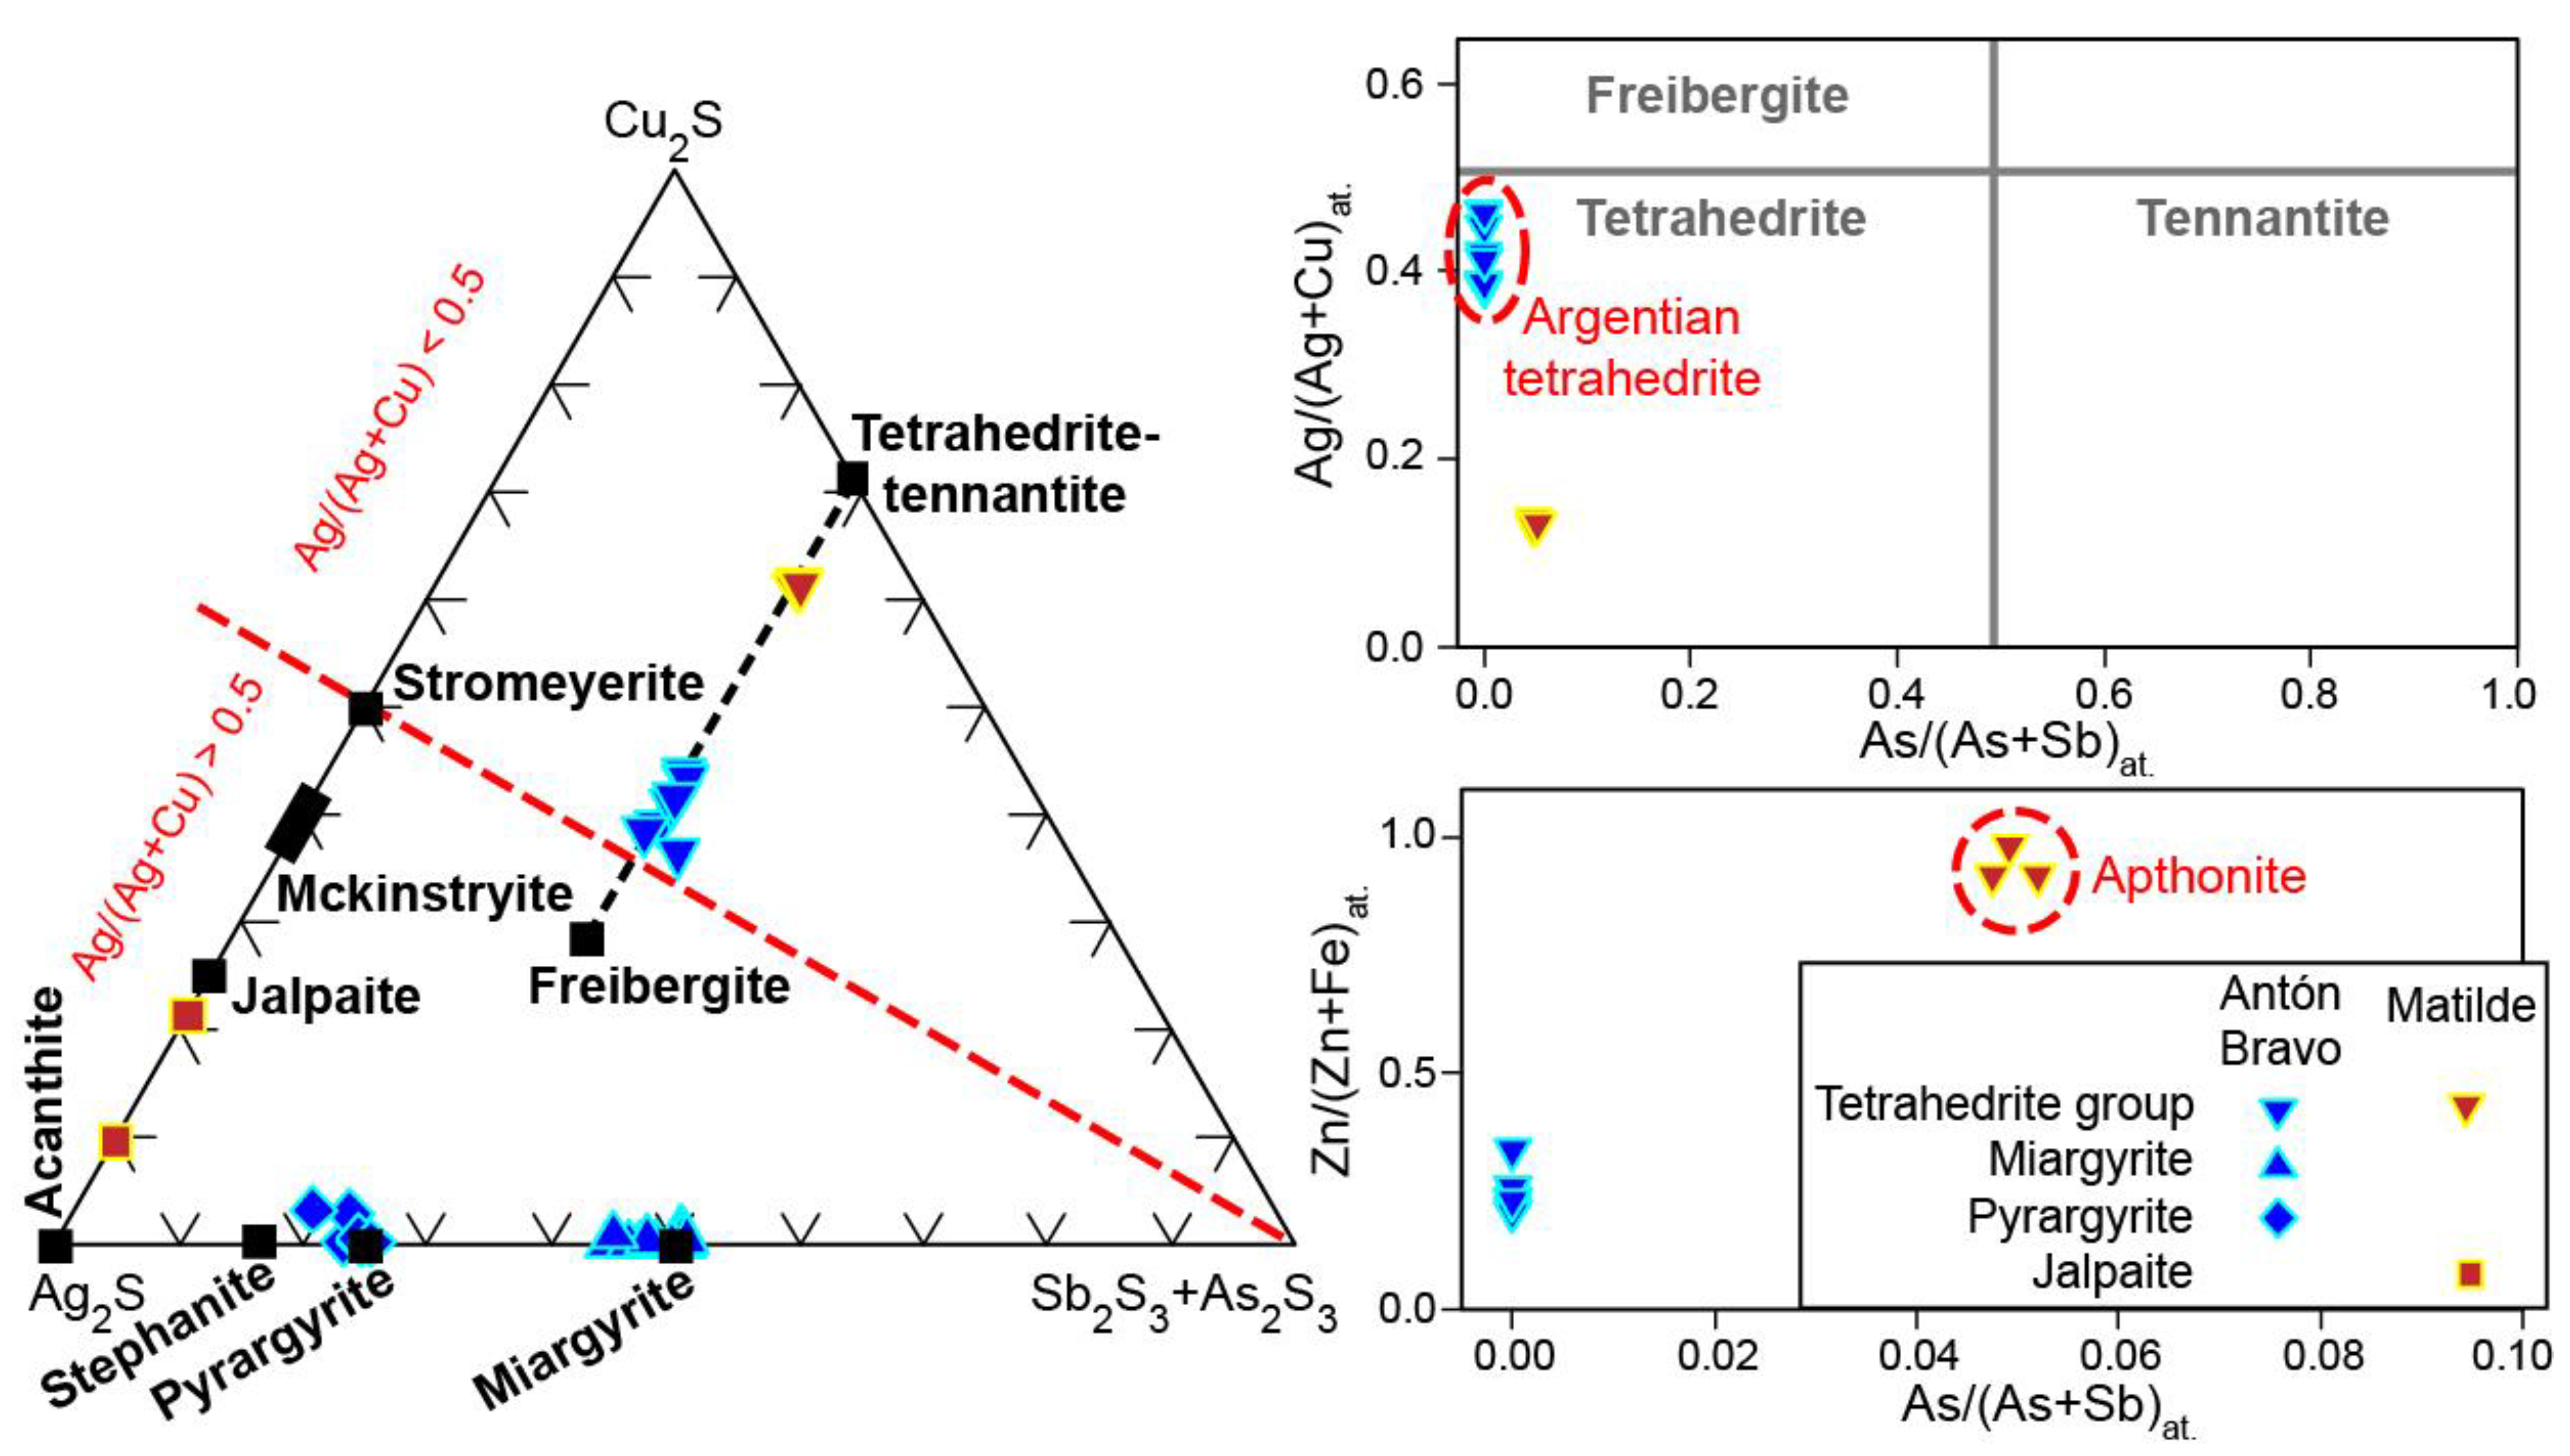
The crystallization of most sulfosalts, with the exception of jamesonite and probably of franckeite, systematically postdated the crystallization of most sulfides (
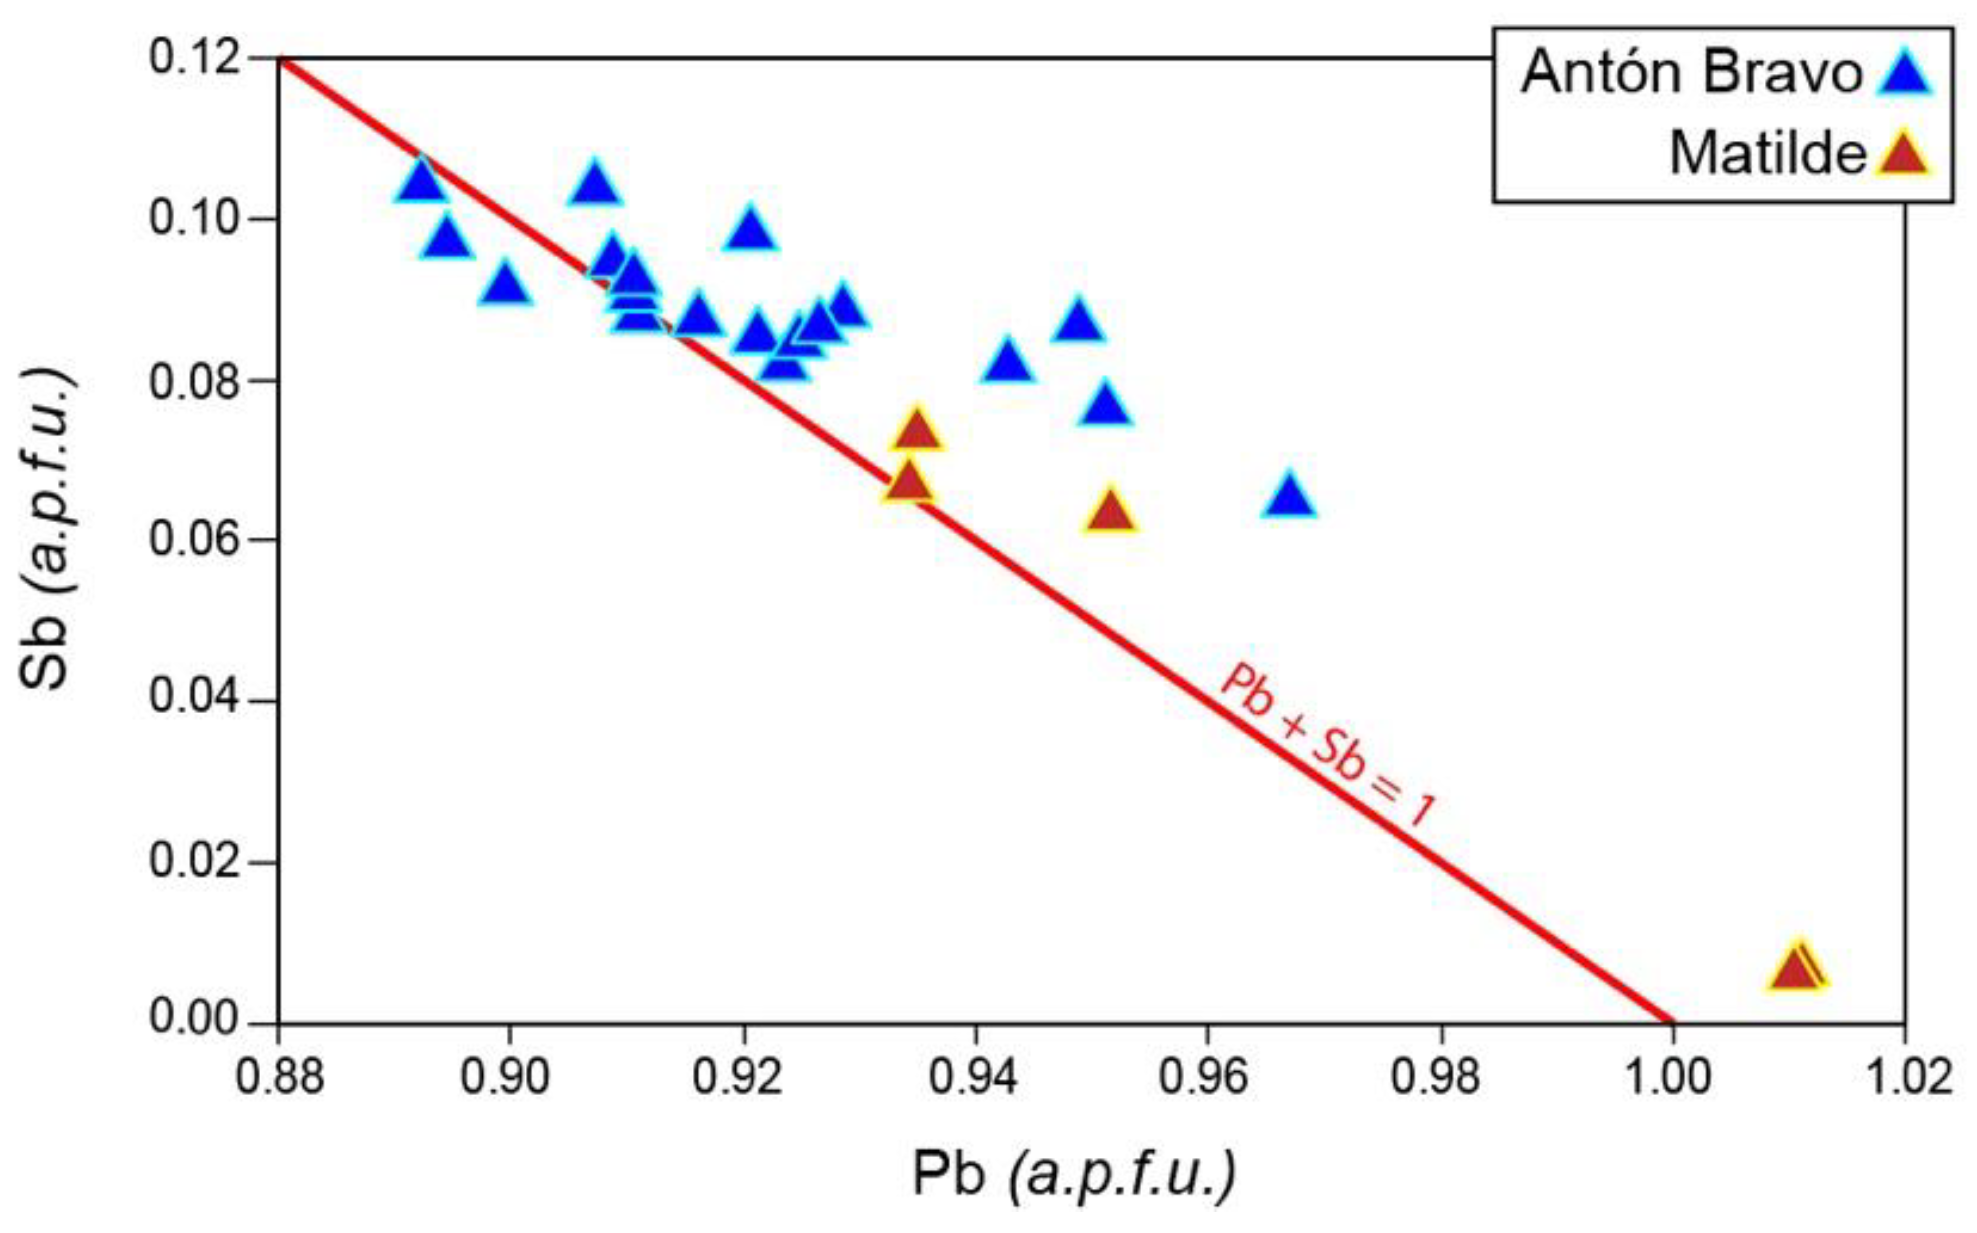
Figure 7). The composition of argentian tetrahedrite from Antón Bravo indicated crystallization at temperatures in the range between 200 and 250 °C according to the calibration of Sack et al. [64]. In contrast, the apthonite variety of tetrahedrite from the Matilde vein would have crystallized at much lower temperatures, probably below 170 °C. The composition of miargyrite found in the Antón Bravo vein, with As systematically below its lower detection limit (Table 6), indicated minimum precipitation temperatures of 50 °C according to the stability diagram of Ghosal and Sack [65].
Alteration of early pyrrhotite to complex intergrowths of pyrite and marcasite has been described in many base metal xenothermal veins in Bolivia. Kelly and Turneaure [25] assessed that this process could initiate at temperatures between ~200 and 285 °C, and that siderite could have formed in the porosity generated during the reaction.
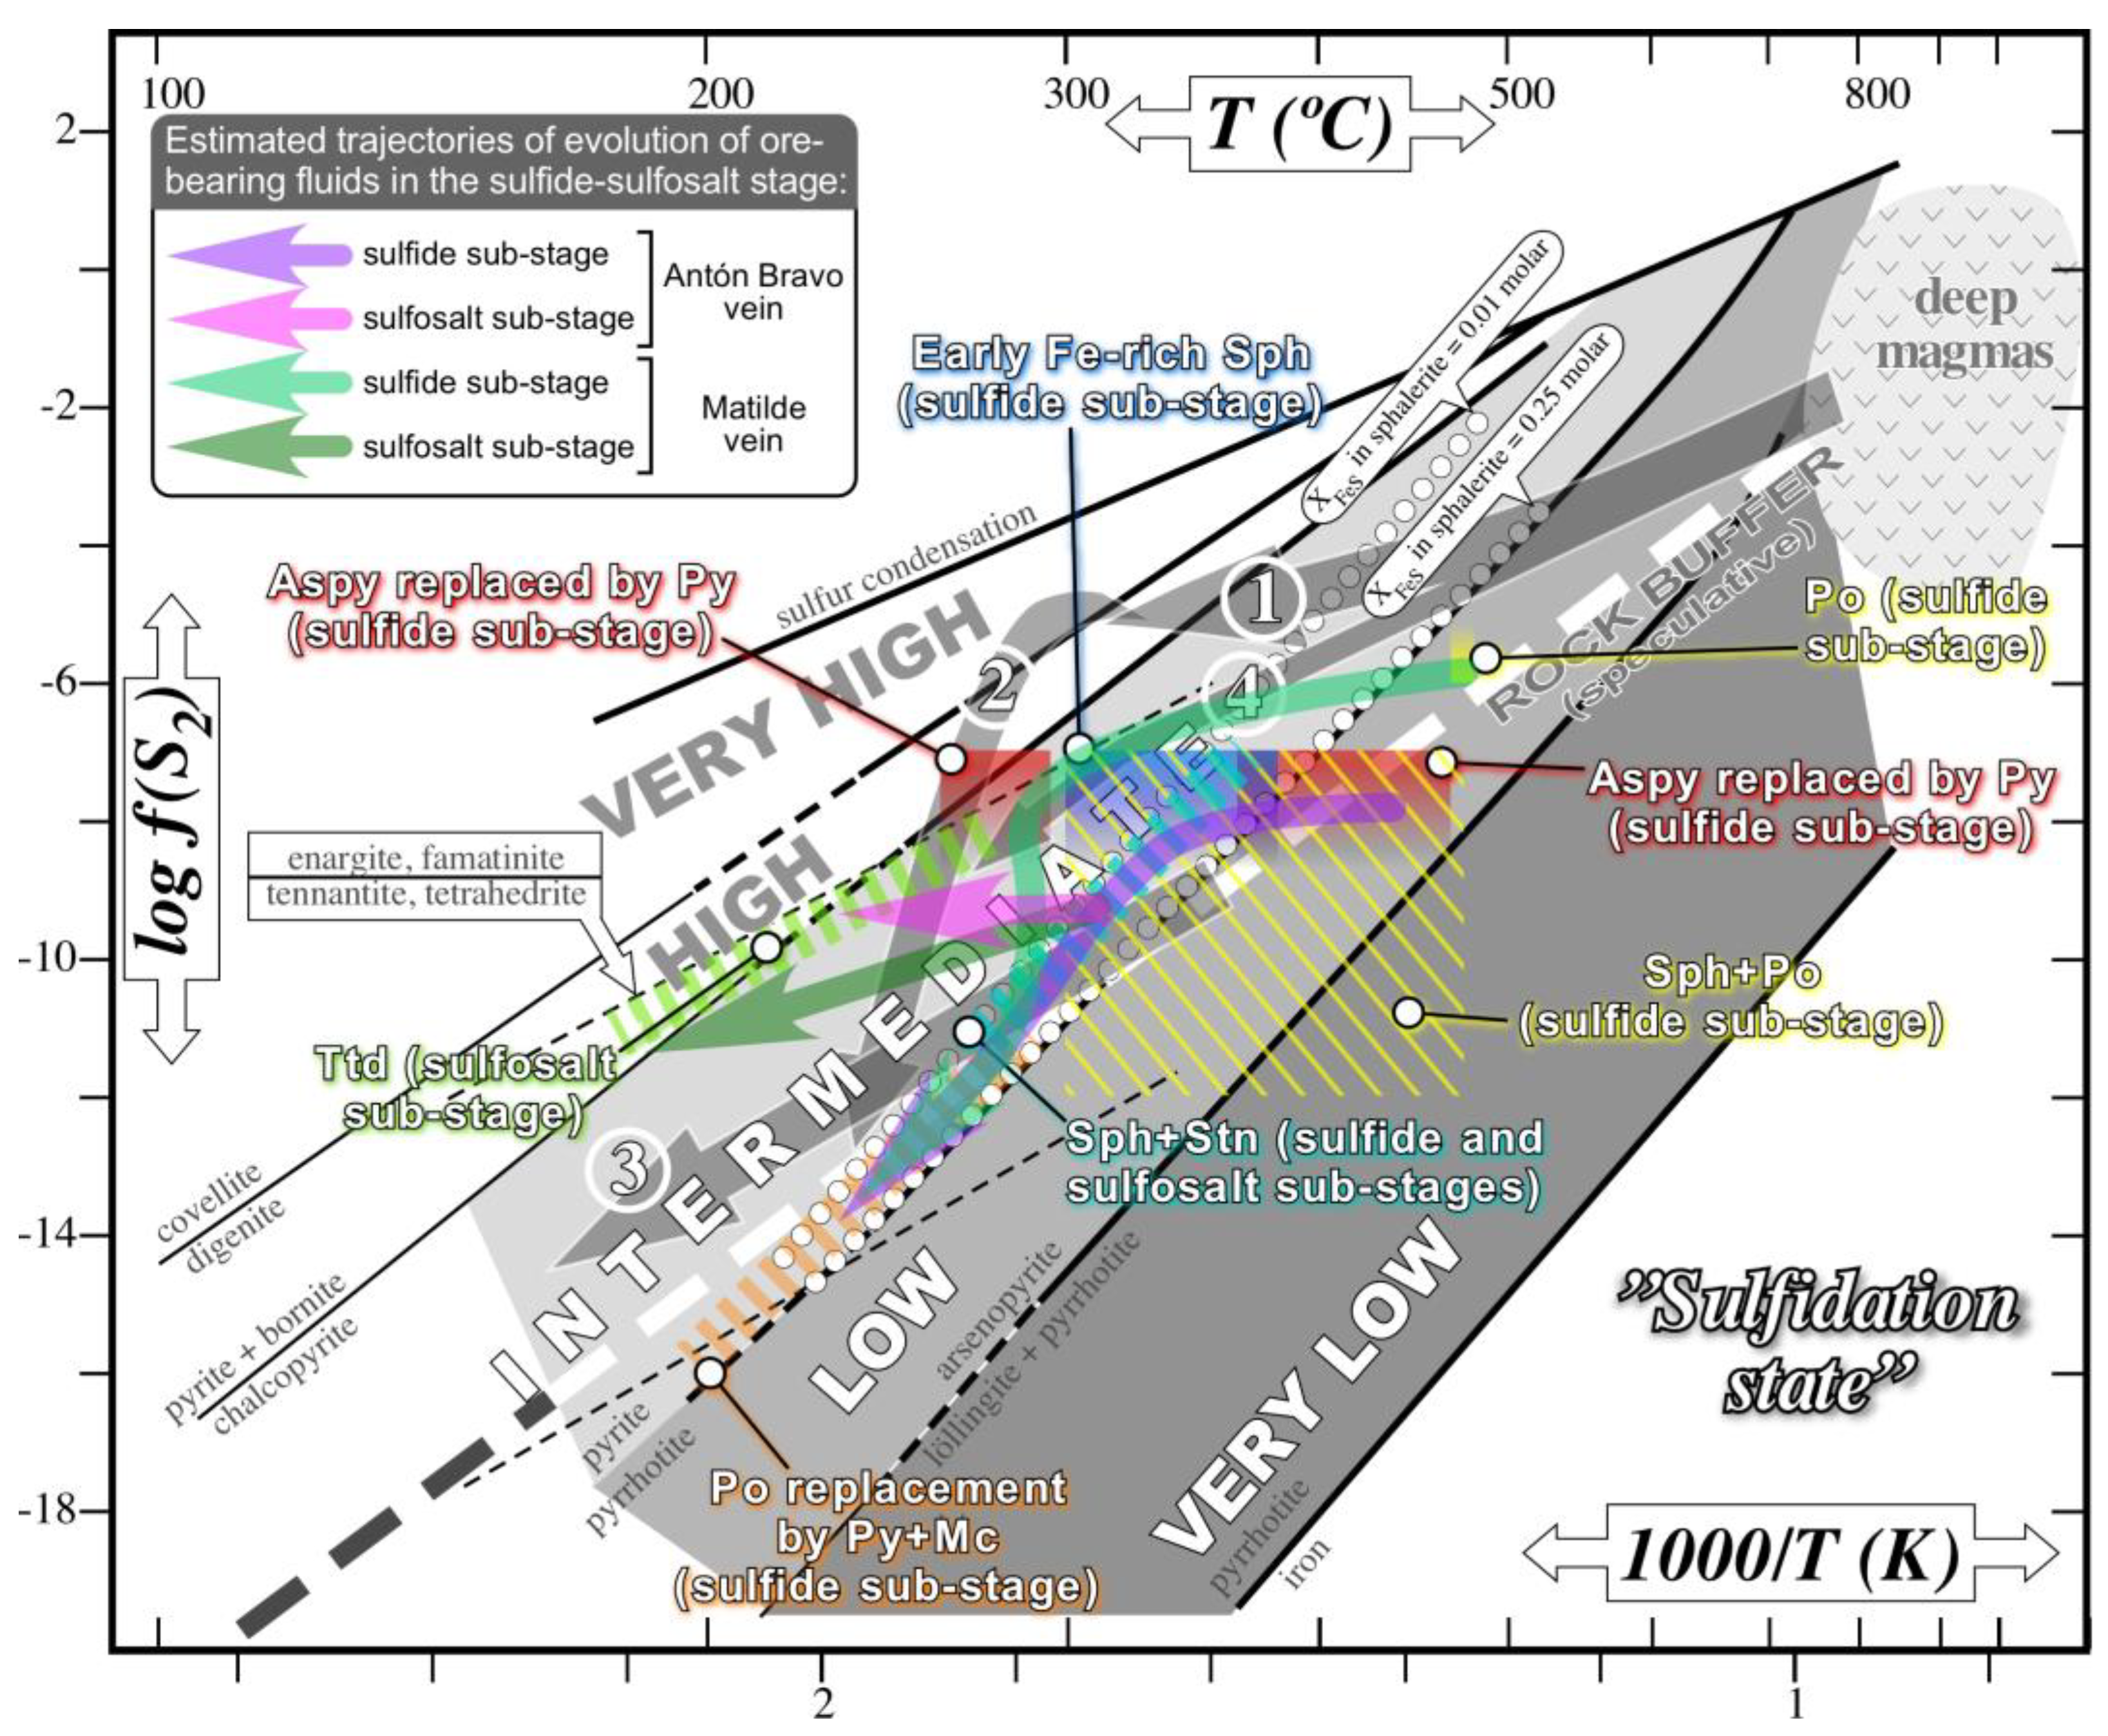
Possible pathways of fluid evolution leading to the deposition of the sulfides and sulfosalts in the Antón Bravo and Matilde veins from the Huari Huari deposit are drawn on a ƒ(S2) vs. T diagram in Figure 16.

6.2. Mineralogical Expression of Indium

Discrete indium minerals (e.g., indite, roquesite, and laforêtite) were not observed in ores from Huari Huari. However, remarkable concentrations of indium were detected in several sulfides and sulfosalts, namely sphalerite and stannite (Figure 7), probably in solid solutions with roquesite. In-bearing sphalerite has been previously described e.g. [9,12,13,14,69,70], and stood out as the chief sulfide in the production of this metal in a variety of mineral deposits, including Sn–Zn Bolivian deposits [16,18,23]. Stannite and chalcopyrite were also described to bear important concentrations of In [10,71,72,73]. Chalcopyrite was reported to host the largest amount of this metal in some deposits [74]. A recent study by Bauer et al. [19] suggested that in skarn deposits from Erzgebirge (Germany), chalcopyrite was the chief host for In, and that extremely high concentrations (up to 20 wt. % In) in sphalerite were the result of hydrothermal overprinting after the destabilization of In-bearing chalcopyrite. In contrast, sectors of sphalerite that were apparently unaffected by overprinting yielded maximum concentrations of 5 wt. % In. In Huari Huari, the occurrence of chalcopyrite was minor, so that a major role of this phase in the hosting and redistribution of In as suggested by Bauer et al. [19] was not conceivable. Besides, and unfortunately, grain sizes of chalcopyrite crystals in Huari Huari were too small to be reliably analyzed by EPMA.
Indium mineralization in Huari Huari can be largely contextualized in the sphalerite–stannite–roquesite pseudoternary system (Figure 8), for which an incomplete solid solution between the three end-members has been described [11,51,75,76]. As for the solid solution between stannite and sphalerite, molecular proportions of roquesite in solid solution within sphalerite crystals (up to 3.1 mol. % CuInS2) were far out of the miscibility gap, which in the ZnS–CuInS2 join was defined between 29 and 41 mol. % ZnS by Parasyuk et al. [75] and between 10 and 40 mol. % ZnS by Schorr and Wagner [76]. Solid solutions between sphalerite–stannite and roquesite were due to coupled substitutions involving Zn, Fe, Cu, Sn, and In [9]. Different authors have proposed a series of coupled substitutions for the incorporation of In into the structure of sphalerite, where the (Cu+ + In3+) ↔ 2Zn2+ substitution was the most habitually invoked e.g., [10,11,14,16,19,20,69,77,
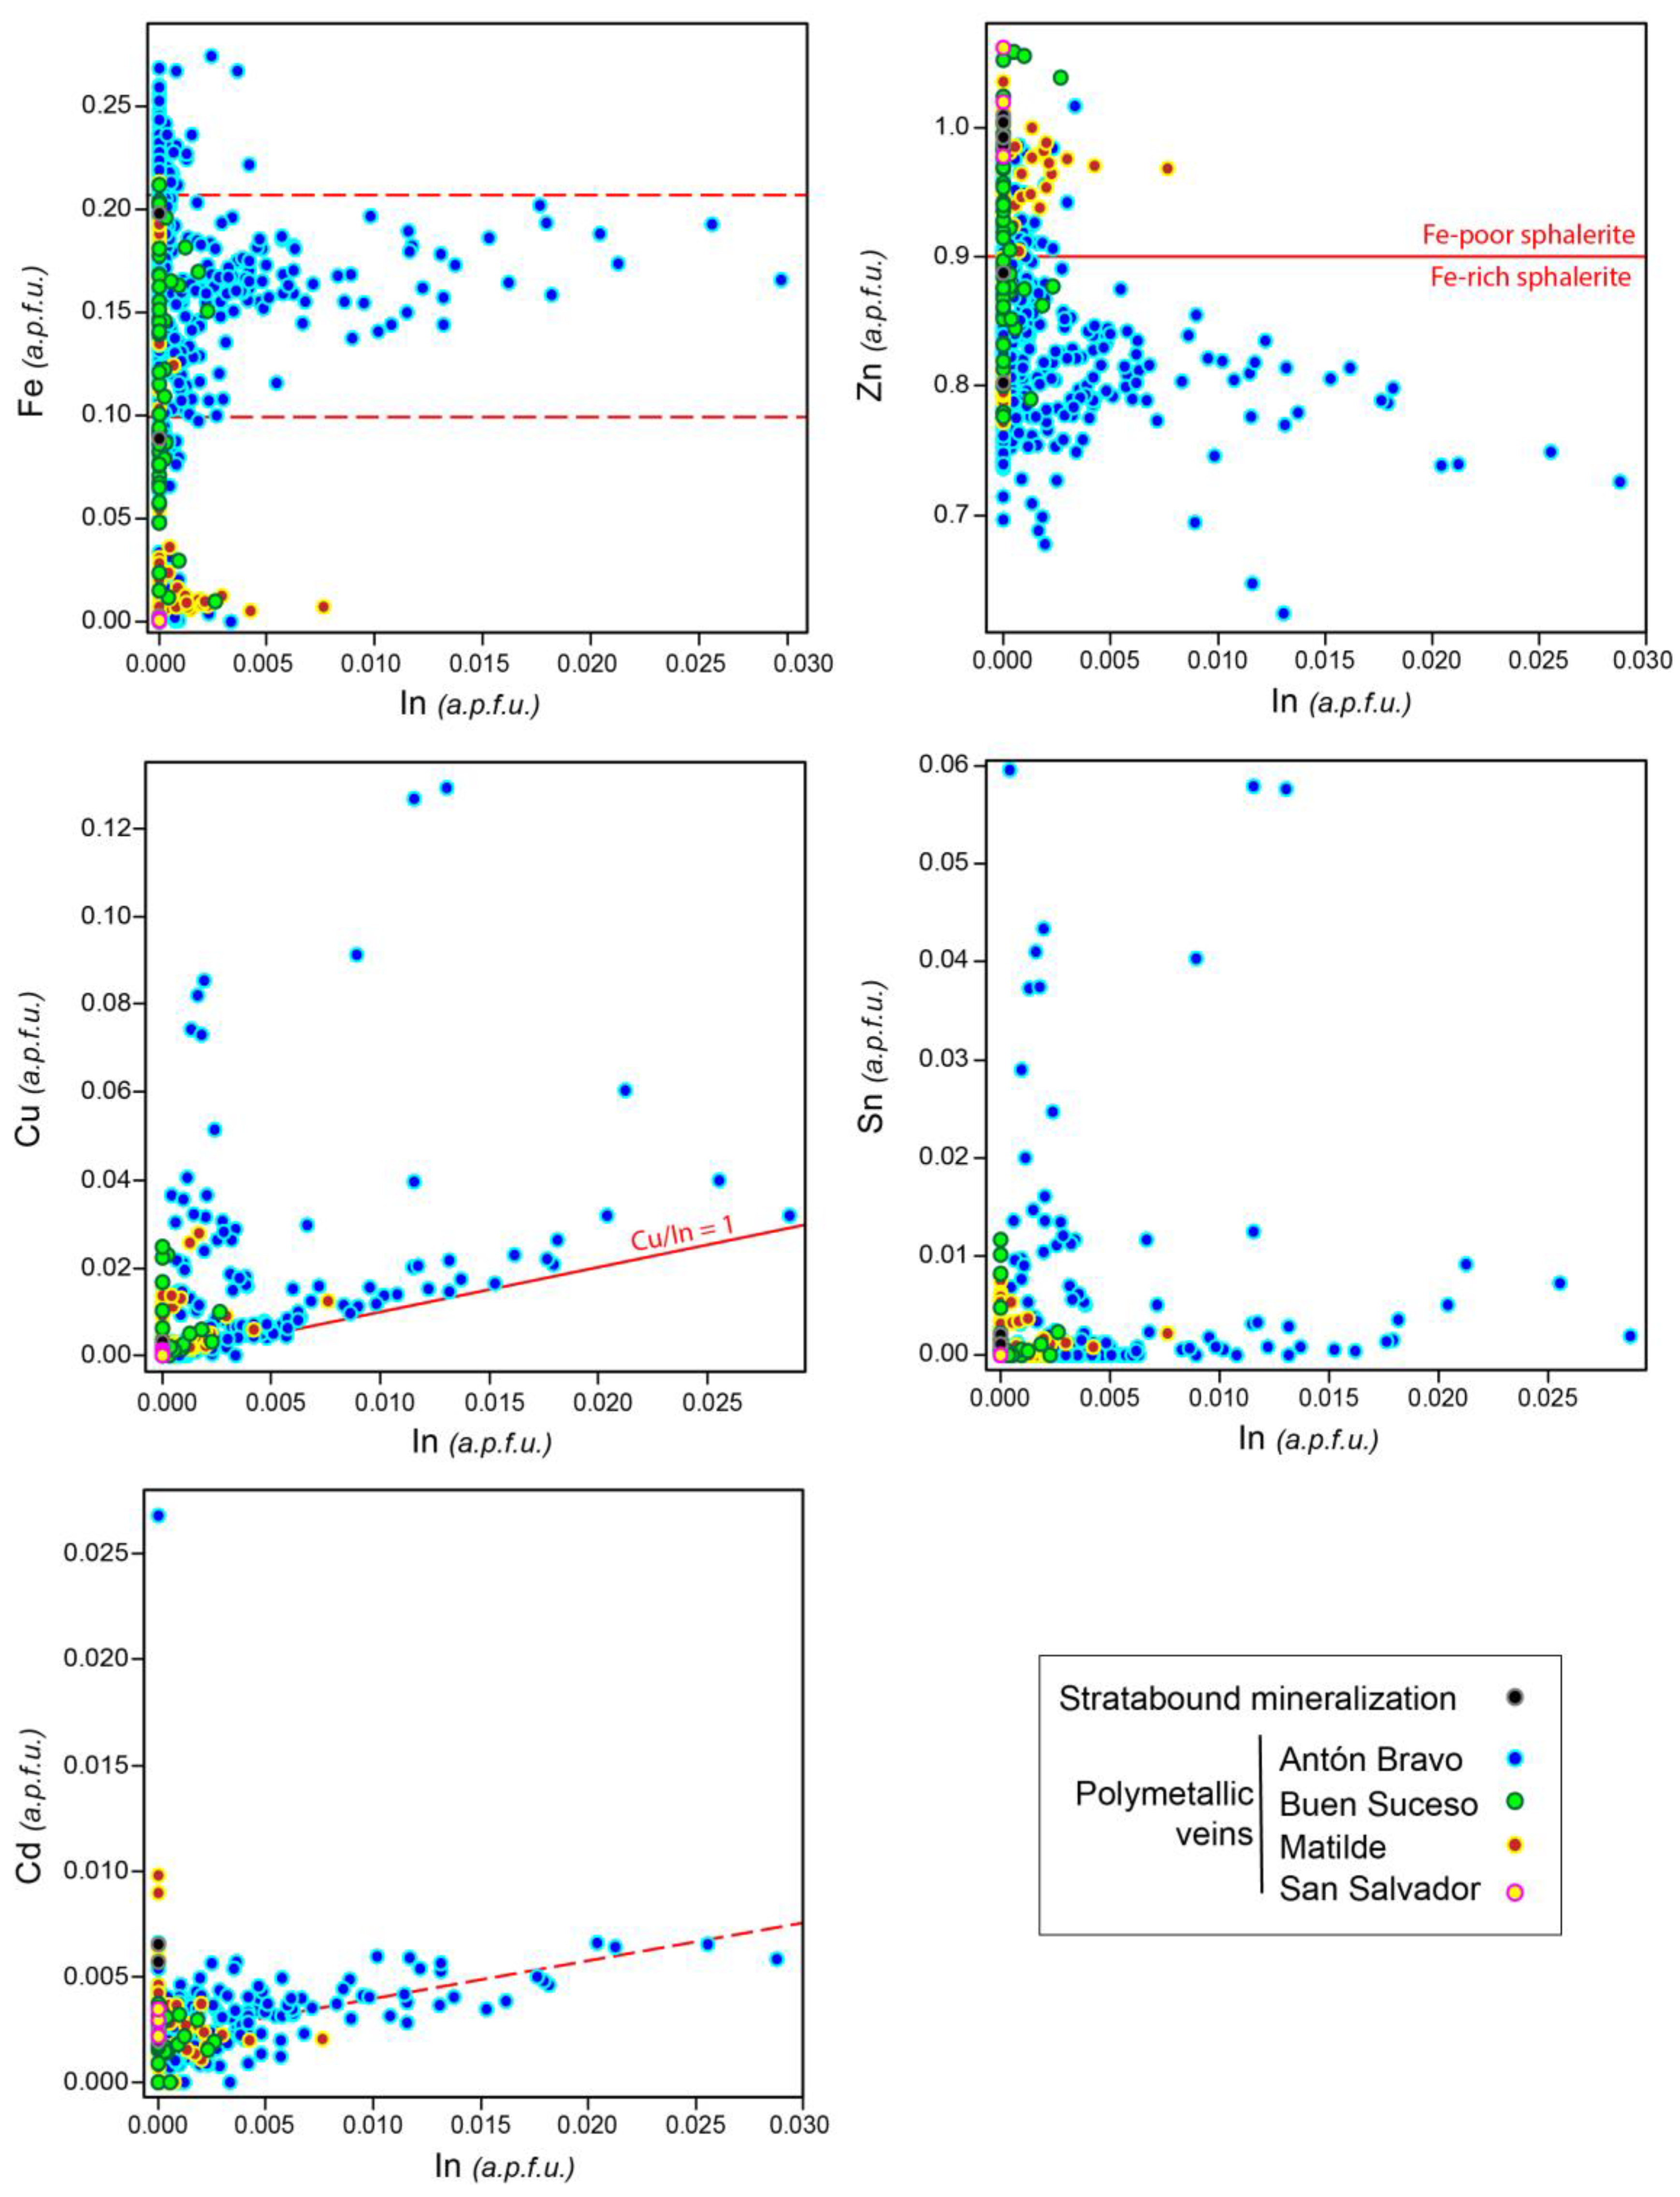
78]. The observed correlation between Cu and In, with Cu/In mostly around one and negative correlations between these two elements and Zn (Figure 9 and 
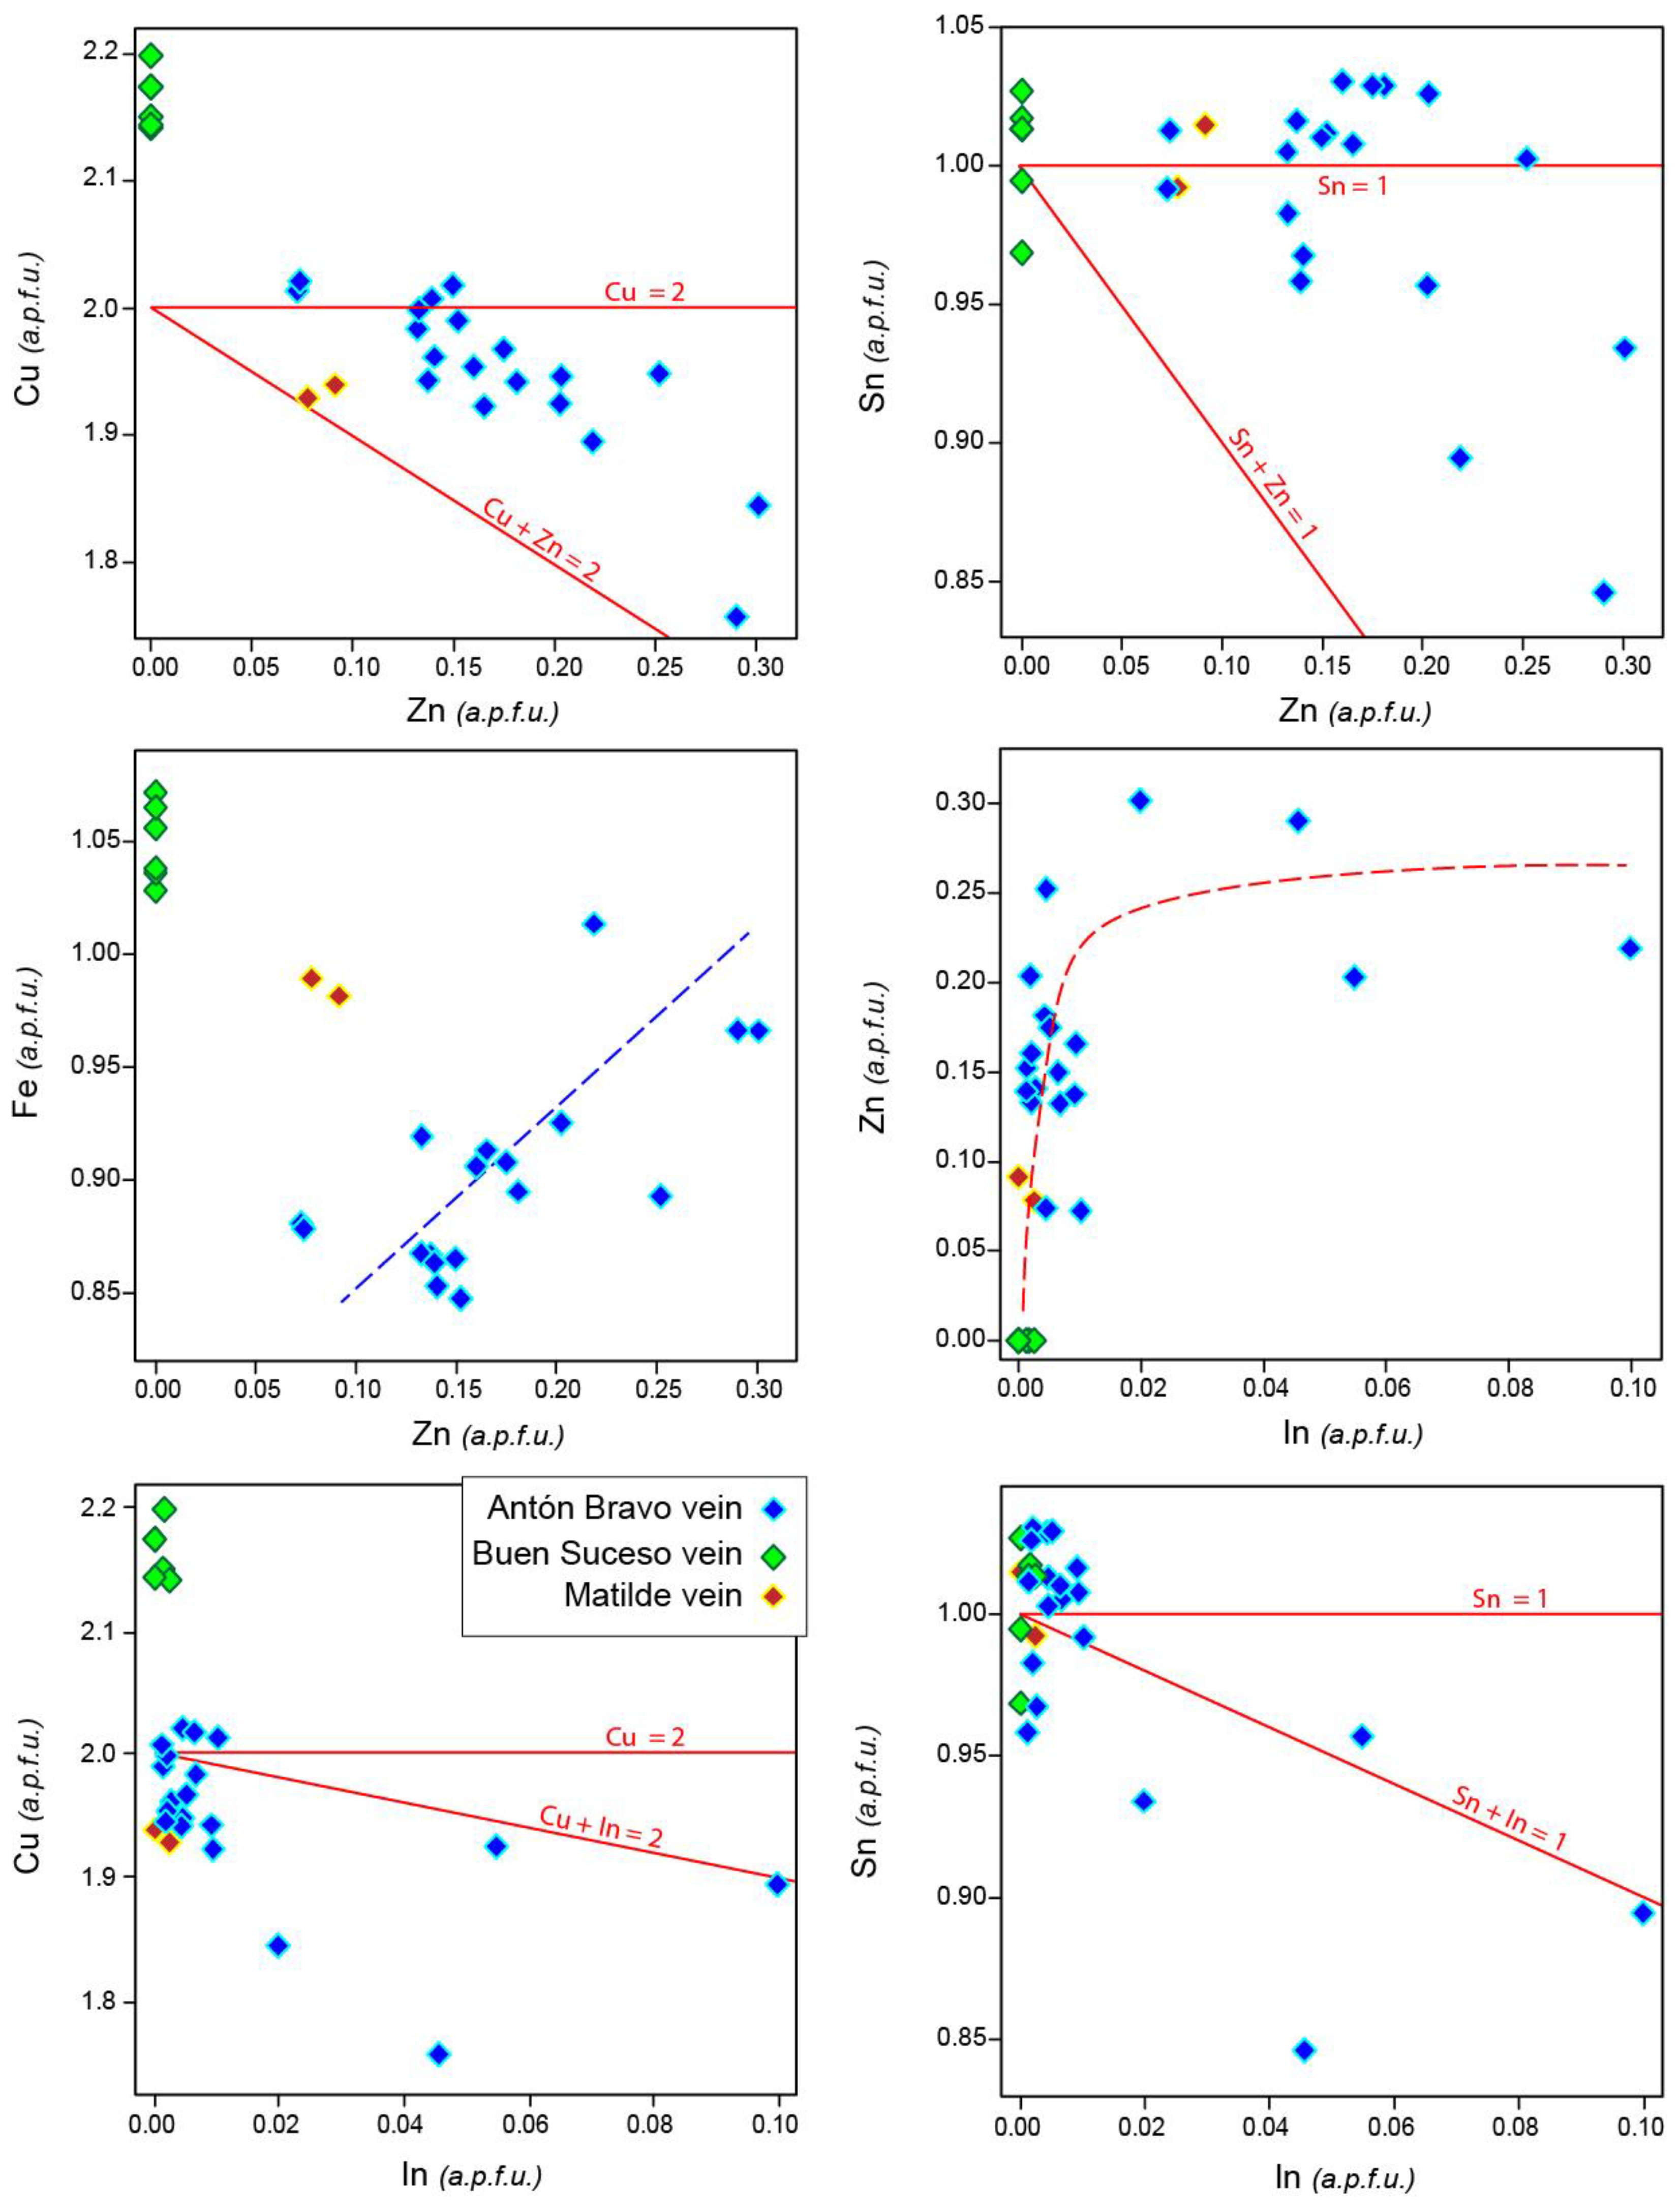
Figure 10), supported this substitution scheme. However, some enrichment in In at Cu/In > 1 was observed. Enrichment significance in the evolution framework of the mineralizing system is discussed below. In a similar way, the atomic proportions of In in stannite showed a negative correlation with Cu and Sn that in part adjusted to Cu + In = 2 and Sn + In = 1 (Figure 11) and might be explained as an In3+ ↔ (Cu+ + ½ Sn4+) coupled substitution, with a consequent release of Fe2+ to the system.
Roquesite, probably the most common In phase in tin-polymetallic mineral deposits [10,11,15], was not found in the studied ores despite a thorough search and the relatively high concentration of In. Cook et al. [12] noted that this mineral occurred, as a rule, in deposits with very low or nil Zn. In sphalerite-rich systems, the systematic partitioning of In into this sulfide precluded oversaturation in In and the exsolution of discrete In minerals. In contrast, formation of In minerals was favored in those mineralizing systems in which Zn was too scarce to form enough sphalerite to incorporate the available In in its lattice. Therefore, roquesite had no chance to form in the Huari Huari deposit because sphalerite was widespread.
The (Cu+ + In3+) ↔ 2Zn2+ coupled substitution is stoichiometrically anticipated for pristine sphalerite, but it apparently works independently of the concentration of Fe (and other elements) in the structure of sphalerite. This would be the case for sphalerite in Huari Huari, in which the highest In concentrations were associated with Fe-rich sphalerite, but no apparent atomic correlation existed between both elements (Figure 9 and Figure 10). This idea was further favored by Fe-poor sphalerite that hosted important concentrations of In e.g., [11,12,77]. In contrast, the availability of Cu represented an essential prerequisite for the introduction of In into the sphalerite lattice by way of the (Cu+ + In3+) ↔ 2Zn2+ coupled substitution [12,77]. This might be a key observation for the mineralization of In at the Huari Huari district, in which the highest In concentrations were restricted to a particular section in the paragenetic sequence that was defined by the introduction of Cu to the mineralization, as illustrated by the occurrence of Cu minerals such as stannite and trace chalcopyrite (Figure 7). Thus, it would follow that high Fe and In contents in sphalerite were incidental.
Shimizu and Morishita [14] determined trapping temperatures for fluid inclusions hosted in sphalerite from the Toyoha deposit (Japan) that were slightly higher in In-rich sphalerite (mean value at 305 °C) than in In-free sphalerite (mean value at 258 °C). This led them to suggest that In was transported by a high-temperature fluid also enriched in Cu and Sn. For sphalerite from the Huari Huari deposit, the temperature bracket in which the highest In concentrations occurred were indirectly approximated by the geothermometric constraints explained above. Earliest sphalerite, with the highest Fe concentrations that probably began to crystallize at temperatures ~450 °C (Figure 10), was poor in In. In contrast, sphalerite cocrystallized with stannite at temperatures between 250 and 350 °C (Figure 15) yielded the maximum concentrations of In described here. Later generations of almost pure sphalerite, crystallized at lower temperatures along with Ag–Pb sulfosalts, were In-free.
In addition to a coupled substitution at high temperatures in the presence of Cu, a diffusion phenomenon during cooling was proposed by Schwarz-Schampera and Herzig [10] as a chief mechanism for the accumulation of In in the structure of sulfides. According to these authors and their references, exsolution processes resulting in chalcopyrite and other mineral “diseases” (diffusion-induced segregations, DIS) were essential players in the redistribution of In in sphalerite. Interdiffusion of Cu + In in sphalerite increased with increasing sulfur fugacity and iron content in the presence of water [79,80]. Both requisites were fulfilled in In-bearing sphalerite from Huari Huari. An enhanced diffusion of Cu + In helped to explain the erratic values in the concentration of both elements even for sphalerite crystals that belonged to the same generation or along single bands in oscillatory zoned crystals. It may also explain the formation of Cu + In-rich interdiffusion fronts along crystal margins or contacts with exsolved minerals (e.g., stannite or chalcopyrite), which might have acted as collectors during segregation [10]. Such phenomenon could explain the relative enrichment in Cu and In along the contacts between sphalerite and very fine exsolutions of stannite and probably also the local In enrichments at Cu/In > 1 (Figure 10; also noted by Johan [77]).

6.3. Temporal and Spatial Controls of Indium Distribution

The paragenesis of In concentrations in ore minerals from the Huari Huari district (Figure 7) showed the incorporation of this element during a particular stage in the evolution of the mineralization. This stage was characterized by: (1) the crystallization of a first generation of sphalerite, which was Fe-rich, locally alternated with crystallization of stannite during the main sulfide deposition; (2) a relatively high temperature, probably between 250 and 350 °C, at increasing f(S2); and (3) a high activity of Cu recorded in the composition of the sphalerite itself and by the exsolution of Cu-bearing minerals such as stannite and chalcopyrite. In detail, first-generation sphalerite that cocrystallized with pyrrhotite out of the pyrite stability field (with Fe above 0.20 a.p.f.u.) yielded only subordinate In enrichments (Figure 10), whereas In enrichment attained its maximum in sphalerite with Fe between 0.10 and 0.20 a.p.f.u., a composition that was compatible with a cocrystallization with pyrrhotite and pyrite. Low-temperature, almost pure sphalerite crystals of second and third generations were generally In-poor.
The thorough mineralogical study used here as a basis for geochemical determinations also allowed for assessing the distribution of In between the different mineralization styles and on the district scale. High values of In were restricted to vein mineralization, whereas the analyzed sulfides (including scarce sphalerite) in stratiform mineralization yielded In concentrations below the lower detection limit. Also, there were remarkable differences in the distribution of In between the studied vein groups. For example, sphalerite crystals from the Antón Bravo vein contained up to 3.49 wt. % In, up to 0.90 wt. % In in the Matilde vein, and up to 0.29 wt. % In in the Buen Suceso vein. One could expect major changes in the composition of sphalerite beyond the content of In that could justify sharp differences in the conditions of crystallization of first-generation sphalerite in each vein (see Section 6.1). Our study illustrates that first-generation sphalerite from the three vein groups yields a similar spectrum of Fe contents (i.e., molecular FeS; [56,57]) in which maximum concentrations of In are found (Figure 9 and Figure 10). In stark contrast, the concentration of Cu in sphalerite strongly differs from vein to vein, with maximum values in crystals from the Antón Bravo vein (Figure 9). Thus, although first-generation sphalerite probably began to crystallize at temperatures around 450 °C in the three vein groups and then cooled down toward the apparently favorable temperature bracket for the incorporation of In into sphalerite (~250° to 350 °C; [14]), only those sectors of the district with relatively high concentrations of Cu in the hydrothermal system accumulated high concentrations of In. The ultimate reason why the studied veins have contrasting activity of Cu remains unknown.
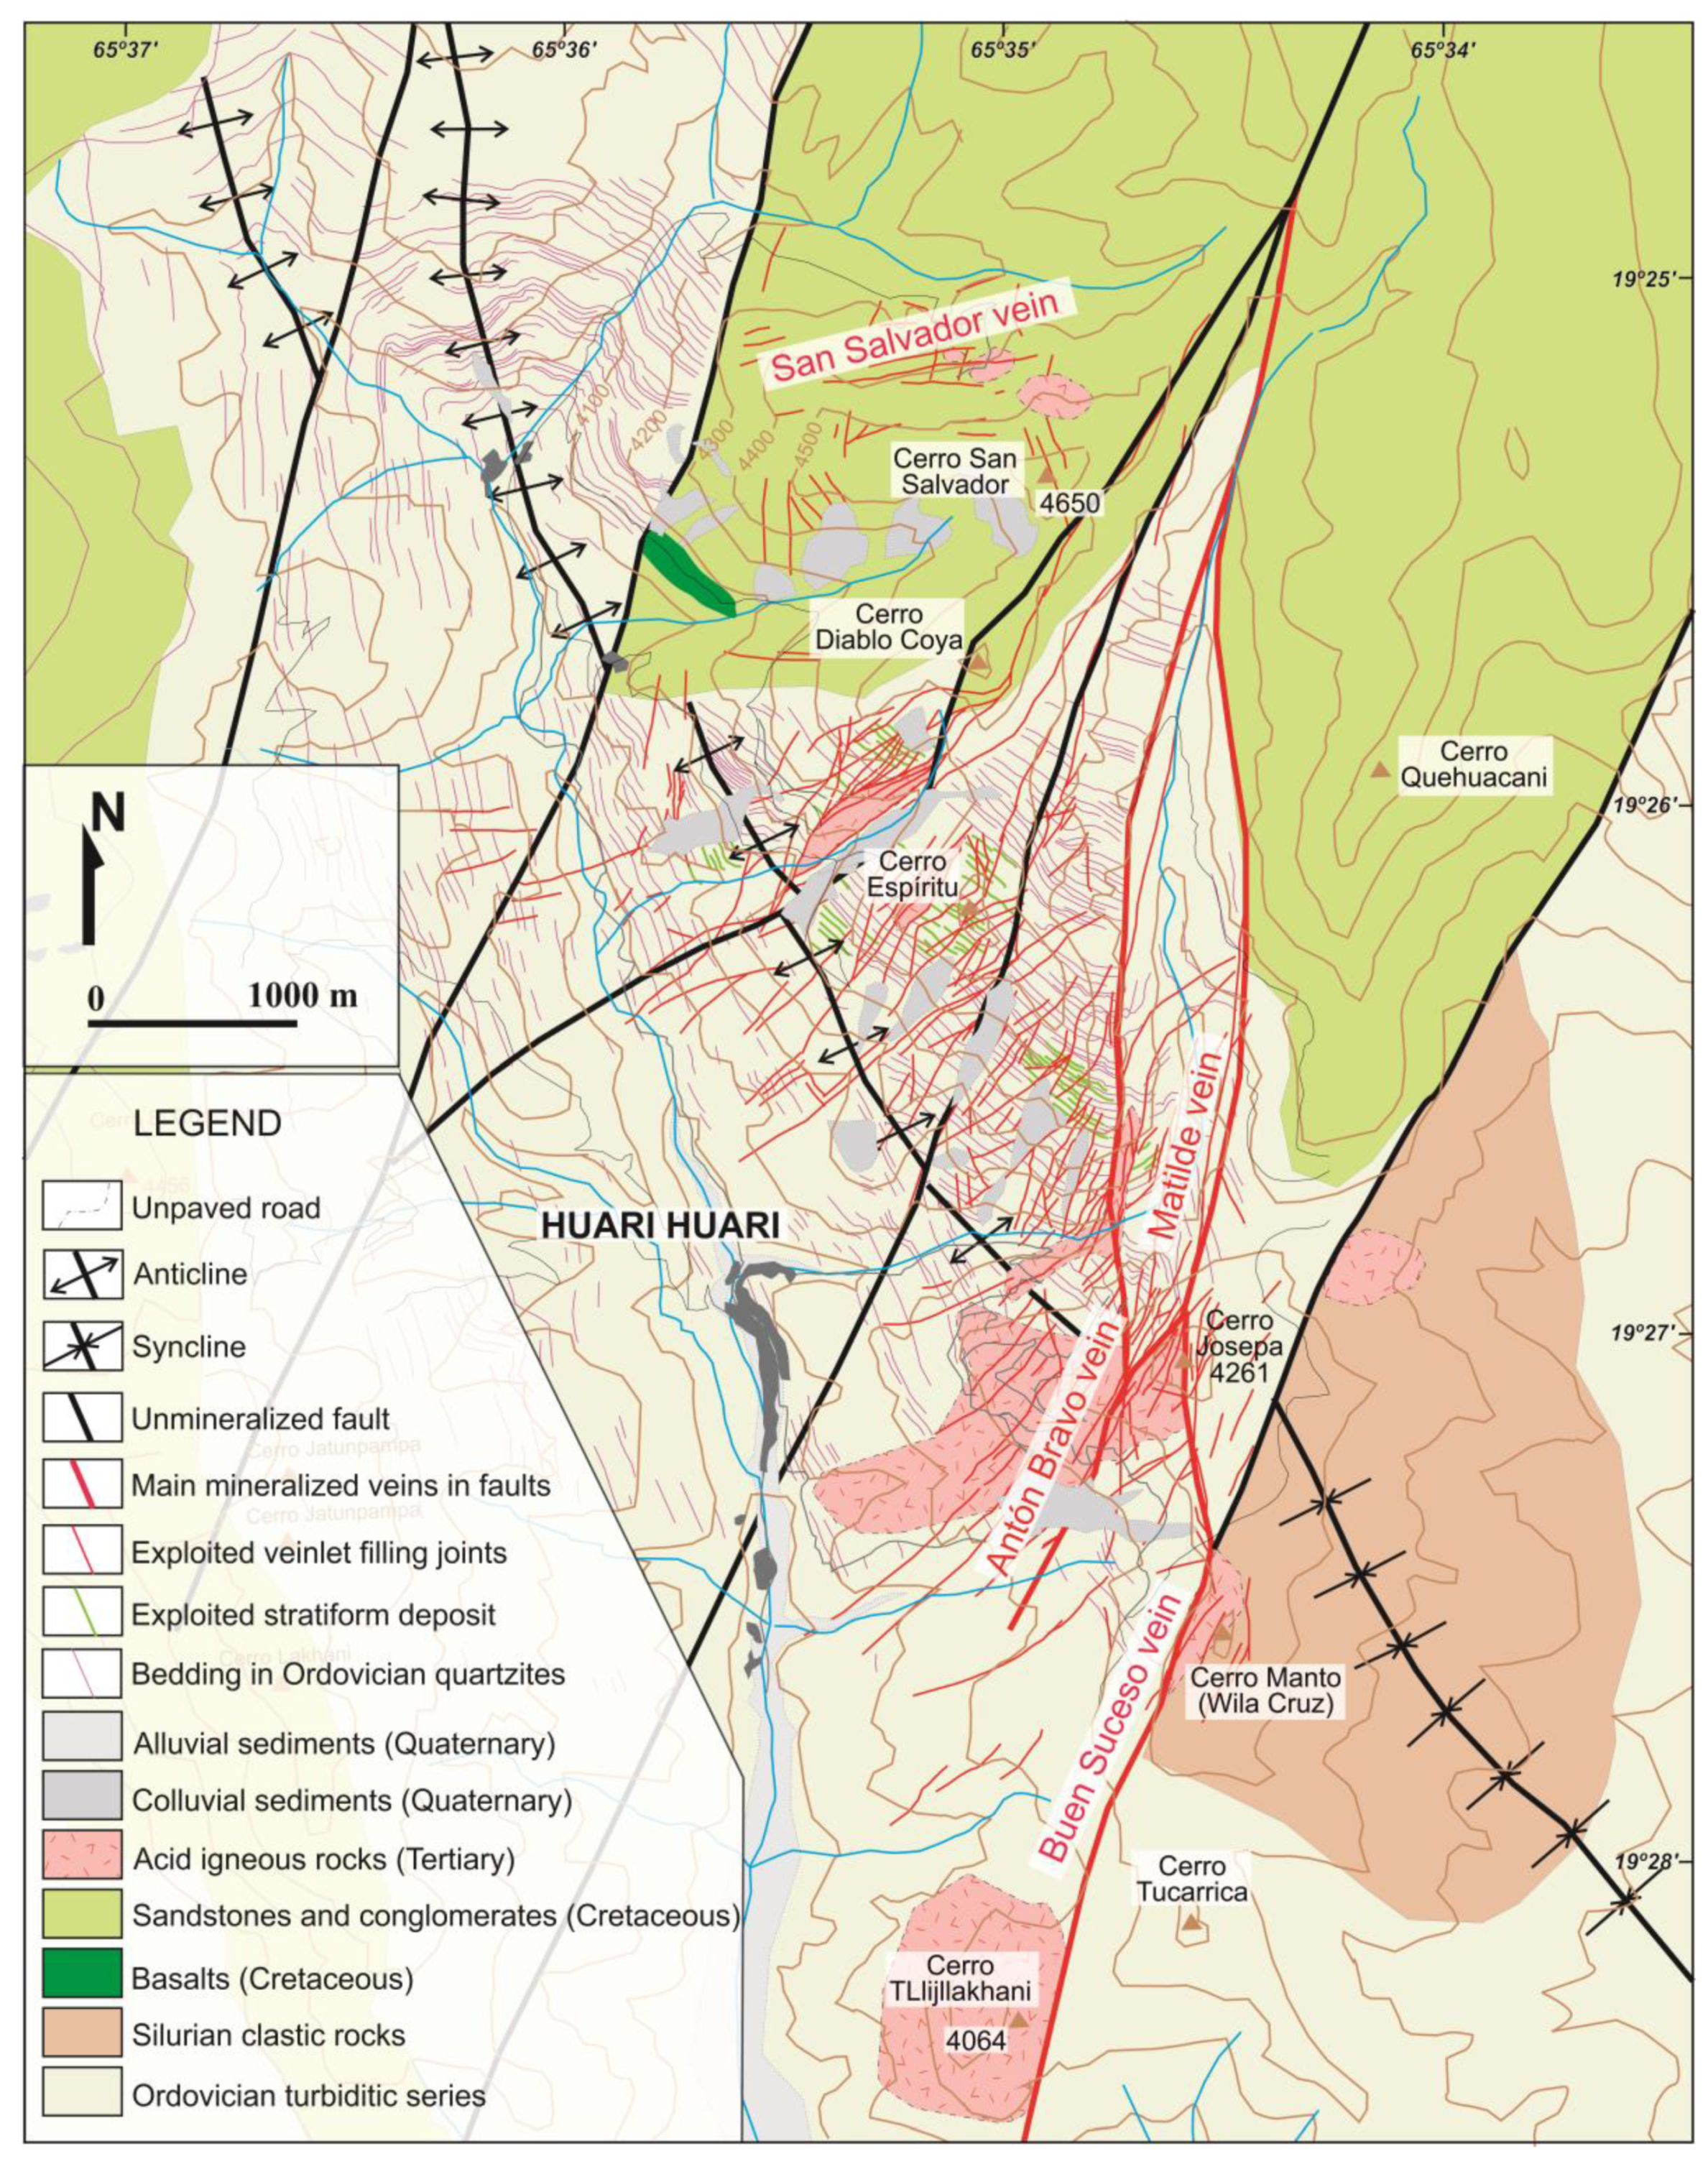
As a starting hypothesis for further studies, we speculate that mineralizing fluids in the Antón Bravo vein, in a central position in the Huari Huari district (Figure 2), might have had a higher magmatic contribution than other areas in the district. This implied a higher Cl availability that facilitated the transport of In and Cu as chloride complexes [10,81]. This hypothesis is being tested in ongoing fluid inclusion microthermometry and stable isotope geochemistry studies.

7. Conclusions

(1). Ore mineralization in the Huari Huari district included stratiform and (economically more important) polymetallic vein mineralization hosted by Paleozoic metamorphosed shales, quartzites, and Mesozoic sandstones.
(2). Ore minerals in the stratiform mineralization included abundant pyrite and lesser amounts of sphalerite, cassiterite, and galena. The concentrations of In in these phases were below the lower detection limit.
(3). Mineralization in the polymetallic veins was made up of a cassiterite- and quartz-rich stage followed by a sulfide-rich stage and an Ag–Pb sulfosalt-rich stage. Sphalerite was the most abundant sulfide in the deposit and recorded a protracted crystallization lifespan, initially cocrystallized with pyrrhotite, subsequently with pyrite, and then with sulfosalts in the latest stage. From its early to late generations, sphalerite became progressively depleted in FeS and other minor components. Geothermometric constraints along the paragenetic sequence in the sulfide-sulfosalt stages suggested a continuous decrease in temperatures from an initial 450 °C and an increase in f(S2).
(4). Indium occurred preferentially in Fe-rich sphalerite (up to 3.49 wt. % In) and in stannite (up to 2.64 wt. % In) in the form of roquesite solid solutions within the (Zn,Fe)S–Cu2FeSnS4–CuInS2 pseudoternary system. We suggested that the incorporation of indium in these minerals was produced through the coupled substitution (Cu+ + In3+) ↔ 2Zn2+ in sphalerite and In3+ ↔ (Cu+ + ½ Sn4+) in stannite. Indium and Fe in sphalerite were not correlated, and their concurrent high concentrations were probably circumstantial, at least during the initial mineral deposition and before the occurrence of exsolution phenomena.
(5). The highest In values were found in sphalerite with relatively high Cu concentrations and/or sphalerite with conspicuous stannite and chalcopyrite exsolutions as well as in sphalerite interspersed with stannite in zoned crystals. Cocrystallization temperatures between sphalerite and stannite were constrained between 250 and 350 °C.
(6). Copper activity was probably the key factor that explained the distribution of In concentrations along the paragenetic sequence and among different structures in this district. We interpreted that even the input of fluids with modest quantities of dissolved Cu in Cu-poor mineralizing systems (like Huari Huari) could be instrumental in the concentration of In. Consequently, evidence for high Cu activity during the crystallization of sphalerite (e.g., stannite and chalcopyrite exsolutions) can be prospective for In in xenothermal, Bolivian-type vein systems.

Author Contributions

Conceptualization, L.T., J.C.M., and P.A.; fieldwork, L.T., J.C.M., M.C., D.M., L.G., A.M., B.T., and D.A.; methodology, L.T., J.C.M., M.C., D.M., L.G., N.P.S., B.T., D.A., and J.F.-d.-P.; writing—original draft preparation, L.T., J.C.M., and D.M.; writing—review and editing, A.C., P.A., and O.A.

Funding

This study benefitted from the Peruvian CONCYTEC-FONDECYT-World Bank project 107-2018-BM, the budget granted by the Generalitat de Catalunya (Autonomous Government of Catalonia) to the Consolidated Research Group SGR 444 and the AECID project A3/042750/11.

Acknowledgments

The help and hospitality extended by the miners from the Huari Huari cooperative during sampling are gratefully acknowledged. We appreciate the technical support by Dr. Xavier Llovet (Centres Científics i Tecnològics, Universidad de Barcelona, CCiT-UB) during the acquisition of the EPMA data. We appreciate constructive comments from two anonymous reviewers, which have helped us to improve the manuscript.

Conflicts of Interest

The authors declare no conflict of interest. The funders had no role in the design of the study; in the collection, analyses, or interpretation of data; in the writing of the manuscript, or in the decision to publish the results.

References

  1. European Commission, Critical Raw Materials. Available online: https://ec.europa.eu/growth/sectors/raw-materials/specific-interest/critical_en (accessed on 1 April 2019).
  2. Schulz, K.J.; DeYoung, J.H., Jr.; Seal, R.R., II; Bradley, D.C. Critical Mineral Resources of the United States—Economic and Environmental Geology and Prospects for Future Supply; U.S. Geological Survey Professional Paper; U.S. Geological Survey: Reston, VI, USA, 2017.
  3. Kesler, S.E.; Simon, A.C. Mineral Resources, Economics and the Environment, 2nd ed.; Cambridge University Press: Cambridge, UK, 2015; pp. 243–244. [Google Scholar]
  4. Bleiwas, D.I. Byproduct Mineral Commodities Used for the Production Of Photovoltaic Cells; U.S. Geological Survey Circular; US Geological Survey: Reston, VI, USA, 2010; Volume 1365, pp. 1–10.
  5. Jorgenson, J.D.; George, M.W. Mineral Commodity Profile: Indium. In U.S. Geological Survey Open-File Report 2004-1300. Available online: https://pubs.usgs.gov/of/2004/1300/2004-1300.pdf (accessed on 3 December 2018).
  6. Werner, T.T.; Mudd, G.M.; Jowitt, S.M. The world’s by-product and critical metal resources part III: A global assessment of indium. Ore Geol. Rev. 2017, 86, 939–956. [Google Scholar] [CrossRef]
  7. Pavlova, G.G.; Palessky, S.V.; Borisenko, A.S.; Vladimirov, A.G.; Seifert, T.; Phan, L.A. Indium in cassiterite and ores of tin deposits. Ore Geol. Rev. 2015, 66, 99–113. [Google Scholar] [CrossRef]
  8. Lerouge, C.; Gloaguen, E.; Wille, G.; Bailly, L. Distribution of In and other trace metals in cassiterite and associated minerals in Sn ± W ore deposits of western Variscan Belt. Eur. J. Mineral. 2017, 29, 739–753. [Google Scholar] [CrossRef]
  9. Ohta, E. Occurrence and chemistry of indium-containing minerals from the Toyoha Mina, Hokkaido, Japan. Min. Geol. 1989, 39, 355–372. [Google Scholar]
  10. Schwarz-Schampera, U.; Herzig, P.M. Indium: Geology, Mineralogy and Economics; Springer: Heidelberg, Germany, 2002. [Google Scholar]
  11. Moura, M.A.; Botelho, N.F.; Carvalho de Mendonça, F. The indium-rich sulfides and rare arsenates of the Sn-In-mineralized Mangabeira A-type granite, central Brazil. Can. Mineral. 2007, 45, 485–496. [Google Scholar] [CrossRef]
  12. Cook, N.J.; Sundblad, K.; Valkama, M.; Nygård, R.; Ciobanu, C.L.; Danyushevsky, L. Indium mineralization in A-type granites in southeastern Finland: Insights into mineralogy and partitioning between co-existing minerals. Chem. Geol. 2011, 284, 62–73. [Google Scholar] [CrossRef]
  13. Jovic, S.M.; Guido, D.M.; Melgarejo, J.C.; Páez, G.N.; Ruiz, R.; Schalamuk, I.B. The indium-bearing minerals of the Pingüino polymetallic vein system, Deseado massif, Patagonia, Argentina. Can. Mineral. 2011, 49, 931–946. [Google Scholar] [CrossRef]
  14. Shimizu, T.; Morishita, Y. Petrographic, chemistry and near-infrared microthermometry of indium-bearing sphalerite from the Toyoha polymetallic deposit, Japan. Econ. Geol. 2012, 107, 723–735. [Google Scholar] [CrossRef]
  15. Jonsson, E.; Högdahl, K.; Majka, J.; Lindeberg, T. Roquesite and associated indium-bearing sulfides from a Paleoproterozoic carbonate-hosted mineralization: Lindbom’s prospect, Bergslagen, Sweden. Can. Mineral. 2013, 51, 629–641. [Google Scholar] [CrossRef]
  16. Murakami, H.; Ishihara, S. Trace elements of indium-bearing sphalerite from tin-polymetallic deposits in Bolivia, China and Japan: A femto-second LA-ICPMS study. Ore Geol. Rev. 2013, 53, 223–243. [Google Scholar] [CrossRef]
  17. Belissont, R.; Boiron, M.C.; Luais, B.; Cathelineau, M. LA-ICP-MS analyses of minor and trace elements and bulk Ge isotopes in zoned Ge-rich sphalerites from the Noailhac—Saint Salvy deposit (France): Insights into incorporation mechanisms and ore deposition processes. Geochim. Cosmochim. Acta 2014, 126, 518–540. [Google Scholar] [CrossRef]
  18. Jiménez-Franco, A.; Alfonso, P.; Canet, C.; Trujillo, J.E. Mineral chemistry of In-bearing minerals in the Santa Fe mining district, Bolivia. Andean Geol. 2018, 45, 410–432. [Google Scholar] [CrossRef]
  19. Bauer, M.E.; Seifert, T.; Burisch, M.; Krause, J.; Richter, N.; Gutzmer, J. Indium-bearing sulfides from the Hämmerlein skarn deposit, Erzgebirge, Germany: Evidence for late-stage diffusion of indium into sphalerite. Miner. Deposita 2019, 54, 175–192. [Google Scholar] [CrossRef]
  20. Bauer, M.E.; Burisch, M.; Ostendorf, J.; Krause, J.; Frenzel, M.; Seifert, T.; Gutzmer, J. Trace element geochemistry of sphalerite in contrasting hydrothermal fluid systems of the Freiberg district, Germany: Insights from LA-ICP-MS analysis, near-infrared light microthermometry of sphalerite-hosted fluid inclusions, and sulfur isotope geochemistry. Miner. Deposita 2019, 54, 237–262. [Google Scholar]
  21. Heuschmidt, B.; Bellot de la Torre, J.; Miranda Angles, V.; Claure Zapata, M. Las Areas Prospectivas de Bolivia para yacimientos metalíferos. Boletín del Servicio Nacional de Geología y Minería 2002, 30, 1–154. [Google Scholar]
  22. Roskill Information Services. The Economics of Indium, 6th ed.; Roskill Information Services Ltd.: London, UK, 1996. [Google Scholar]
  23. Ishihara, S.; Murakami, H.; Marquez-Zavalia, M.F. Inferred indium resources of the Bolivian tin-polymetallic deposits. Resour. Geol. 2011, 61, 174–191. [Google Scholar] [CrossRef]
  24. Ahlfeld, F.; Schneider-Scherbina, A. Los yacimientos minerales y de hidrocarburos de Bolivia; Ministerio de Minas y Petróleo: La Paz, Bolivia, 1964; pp. 1–388. [Google Scholar]
  25. Kelly, W.C.; Turneaure, F.S. Mineralongy, paragenesis and geothermometry of the tin and tungsten deposits of the Eastern Andes, Bolivian. Econ. Geol. 1970, 65, 609–680. [Google Scholar] [CrossRef]
  26. Arce-Burgoa, O. Metalliferous Ore Deposits of Bolivia, 2nd ed.; SPC Impresores: La Paz, Bolivia, 2009; pp. 1–233. [Google Scholar]
  27. Suarez-Soruco, R. Compendio de Geología de Bolivia; Servicio Nacional de Geología y Minería, Yacimientos Petrolíferos Fiscales Bolivianos: Cochabamba, Bolivia, 2000; pp. 39–76. [Google Scholar]
  28. Jiménez, N.; López-Velásquez, S. Magmatism in the Huarina belt, Bolivia, and its geotectonic implications. Tectonophysics 2008, 459, 85–106. [Google Scholar] [CrossRef]
  29. Wörner, G.; Schildgen, T.F.; Reich, M. The Central Andes: Elements of an extreme land. Elements 2018, 14, 225–230. [Google Scholar] [CrossRef]
  30. Wörner, G.; Mamani, M.; Blum-Oeste, M. Magmatism in the Central Andes. Elements 2018, 14, 237–244. [Google Scholar] [CrossRef]
  31. Sempere, T. Phanerozoic Evolution of Bolivia and Adjacent Regions; American Association of Petroleum Geologists (AAPG) Memoir: Tulsa, OK, USA, 1995; Volume 62, pp. 207–230. [Google Scholar]
  32. Sempere, T.; Hérail, G.; Oller, J.; Bonhomme, M.G. Late Oligocene-Early Miocene major tectonic crisis and related basins in Bolivia. Geology 1990, 18, 946–949. [Google Scholar] [CrossRef]
  33. Lehmann, B.; Ishihara, S.; Michel, H.; Miller, J.; Rapela, C.; Sanchez, A.; Tistl, M.; Winkelmann, L. The Bolivian tin province and regional tin distribution in the Central Andes: A reassessment. Econ. Geol. 1990, 85, 1044–1058. [Google Scholar] [CrossRef]
  34. Lehmann, B.; Dietrich, A.; Heinhorst, J.; Metrich, N.; Mosbah, M.; Palacios, C.; Schneider, H.J.; Wallianos, A.; Webster, J.; Winkelmann, L. Boron in the Bolivian tin belt. Miner. Depos. 2000, 35, 223–232. [Google Scholar] [CrossRef]
  35. Ishihara, S. The granitoid series and mineralization. Econ. Geol. 1981, 75th Anniv. Volume. 458–484. [Google Scholar] [CrossRef]
  36. Clark, A.H.; Farrar, E.; Caelles, J.C.; Haynes, S.J.; Lortie, R.B.; McBride, S.L.; Quirt, G.S.; Robertson, R.C.R.; Zentilli, M. Longitudinal variations in the metallogenetic evolution of the Central Andes: A progress report. Geol. Assoc. Can. Spec. Pap. 1976, 14, 23–58. [Google Scholar]
  37. Sillitoe, R.H. Andean mineralization: A model for the metal-logeny of convergent plate margins. Geol. Assoc. Can. Spec. Pap. 1976, 14, 59–100. [Google Scholar]
  38. Sillitoe, R.H. Musings on future exploration targets and strategies in the Andes. Econ. Geol. Sp. Publ. 2004, 11, 1–14. [Google Scholar]
  39. Mlynarczyk, M.S.J.; Williams-Jones, A.E. The role of collisional tectonics in the metallogeny of the Central Andean tin belt. Earth Planet. Sci. Lett. 2005, 240, 656–667. [Google Scholar] [CrossRef]
  40. Fontboté, L. Ore Deposits in the Central Andes. Elements 2018, 14, 257–261. [Google Scholar] [CrossRef]
  41. Sillitoe, R.H.; Halls, C.; Grant, J.N. Porphyry tin deposits in Bolivia. Econ. Geol. 1975, 70, 913–927. [Google Scholar] [CrossRef]
  42. Turneaure, F.S. The Bolivian tin-silver province. Econ. Geol. 1971, 66, 215–225. [Google Scholar] [CrossRef]
  43. Cunningham, C.G.; Zartman, R.E.; McKee, E.H.; Rye, R.O.; Naeser, C.W.; Sanjinés, O.; Ericksen, G.E.; Tavera, F. The age and thermal history of Cerro Rico de Potosi, Bolivia. Miner. Deposita 1996, 31, 374–385. [Google Scholar] [CrossRef]
  44. Kempe, U.; Lehmann, B.; Wolf, D.; Rodionov, N.; Bombach, K.; Schwengfelder, U.; Dietrich, A. U-Pb SHRIMP geochronology of Th-poor, hydrothermal monazite: An example from the Llallagua tin-porphyry deposit. Geochim. Cosmochim. Ac. 2008, 72, 4352–4366. [Google Scholar] [CrossRef]
  45. Putzer, H. Metallogenetische Provinzen in Stidamerika. Schweizerbart; E. Schweizerbart’sche Verlagsbuchhandlung: Stuttgart, Germany, 1976; p. 316. [Google Scholar]
  46. Sugaki, A.; Hueno, H.; Shimada, N.; Kusachi, I.; Kitakaze, A.; Hayashi, K.; Kojima, S.Y.; Sanjines, O. Geological study on the polymetallic ore deposits in the Potosi District, Bolivia. Sci. Rep. Tohoku Univ. 1983, Series III. 15, 409–460. [Google Scholar]
  47. Ludington, S.; Orris, G.J.; Cox, D.P.; Long, K.R.; Asher-Bolinder, S. Mineral deposit models. In Geology and Mineral Resources of the Altiplano and Cordillera Occidental, Bolivia; U.S. Geological Survey and Servicio Geologico de Bolivia, Ed.; U.S. Geological Survey: Denver, CO, USA, 1975; pp. 63–89. [Google Scholar]
  48. SERGEOMIN, Mapa Geológico de Bolivia, Scale 1:1,000,000; Servicio Nacional de Geología y Minería and Yacimientos Petrolíferos Fiscales Bolivianos: La Paz, Bolivia, 2001.
  49. Díaz-Martínez, E.; Grahn, Y. Early Silurian glaciation along the western margin of Gondwana (Peru, Bolivia and northern Argentina): Palaeogeographic and geodynamic setting. Palaeogeogr. Palaeocl. 2007, 245, 62–81. [Google Scholar] [CrossRef]
  50. Fink, R.J. Sedimentology and stratigraphy of the Upper Cretaceous-Paleocene El Molino Formation, Eastern Cordillera and Altiplano, Central Andes, Bolivia: Implications for the tectonic development of the Central Andes. Master’s Thesis, LSU. 3925, Louisiana State University and Agricultural and Mechanical College, LA, USA, August 2002. [Google Scholar]
  51. Oen, I.S.; Kager, P.; Kieft, C. Oscillatory zoning of a discontinuous solid-solution series: Sphalerite-stannite. Am. Mineral. 1980, 65, 1220–1232. [Google Scholar]
  52. Sugaki, A.; Kojima, S.; Shimada, N. Fluid inclusion studies of the polymetallic hydrothermal ore deposits in Bolivia. Miner. Deposita 1988, 23, 9–15. [Google Scholar] [CrossRef]
  53. Müller, B.; Frischknechtm, R.; Seward, T.M.; Heinrich, C.A.; Camargo Gallegos, W. A fluid inclusion reconnaissance study of the Huanuni tin deposit (Bolivia), using LA-ICP-MS micro-analysis. Miner. Deposita 2001, 36, 680–688. [Google Scholar] [CrossRef]
  54. Kretschmar, U.; Scott, S.D. Phase relations involving arsenopyrite in the system Fe-As-S and their application. Can. Mineral. 1976, 14, 364–386. [Google Scholar]
  55. Sharp, Z.D.; Essene, E.J.; Kelly, W.C. A re-examination of the arsenopyrite geothermometer: Pressure considerations and applications to natural assemblages. Can. Mineral. 1985, 23, 517–534. [Google Scholar]
  56. Scott, S.D.; Barnes, H.L. Sphalerite geothermometry and geobarometry. Econ. Geol. 1971, 66, 653–669. [Google Scholar] [CrossRef]
  57. Hutchison, M.N.; Scott, S.D. Sphalerite geobarometry in the Cu-Fe-Zn-S system. Econ. Geol. 1981, 76, 143–153. [Google Scholar]
  58. Arnold, R.G. Equilibrium relations between pyrrhotite and pyrite from 325 and 743 ºC. Econ. Geol. 1962, 75, 72–90. [Google Scholar] [CrossRef]
  59. Toulmin, P.; Barton, P.B. A thermodynamic study of pyrite and pyrrhotite. Geochim. Cosmochim. Acta 1964, 28, 641–671. [Google Scholar] [CrossRef]
  60. Osadchii, E.G.; Chareev, D.A. Thermodynamic studies of pyrrhotite-pyrite equilibria in the Ag-Fe-S system by solid-state galvanic cell technique at 518–723 K and total pressure of 1 atm. Geochim. Cosmochim. Acta 2006, 70, 5617–5633. [Google Scholar] [CrossRef]
  61. Nakamura, Y.; Shima, H. Fe and Zn partitioning between sphalerite and stannite. In Proceedings of the Joint Meeting of Society of Mining Geologists of Japan; The Japanese Association of Mineralogists, Petrologists and Economic Geologists and the Mineralogical Society of Japan: Sendai, Japan, 1982. (In Japanese) [Google Scholar]
  62. Watanabe, M.; Hoshino, K.; Myint, K.K.; Miyazaki, K.; Nishido, H. Stannite from the Otoge kaolin-pyrophyllite deposits, Yamagata Prefecture, NE Japan and its genetical significance. Resour. Geol. 1994, 44, 439–444. [Google Scholar]
  63. Shimizu, M.; Shikazono, N. Iron and zinc partitioning between coexisting stannite and sphalerite: A possible indicator of temperature and sulfur fugacity. Mineral. Deposita 1985, 20, 314–320. [Google Scholar] [CrossRef]
  64. Sack, R.O.; Lynch, J.V.G.; Foit, F. Fahlore as a petrogenetic indicator: Keno Hill Ag-Pb-Zn district, Yukon, Canada. Mineral. Mag. 2003, 67, 1023–1038. [Google Scholar] [CrossRef]
  65. Ghosal, S.; Sack, R.O. As-Sb energetics in argentian sulfosalts. Geochim. Cosmochim. Acta 1995, 17, 3573–3579. [Google Scholar] [CrossRef]
  66. Einaudi, M.T.; Hedenquist, J.W.; Inan, E.E. Sulfidation state of fluids in active and extinct hydrothermal systems: Transitions from porphyry to epithermal environments. Soc. Econ. Geol. Spec. P. 2003, 10, 285–313. [Google Scholar]
  67. Camprubí, A.; Albinson, T. Epithermal deposits in México—An update of current knowledge, and an empirical reclassification. In Geology of México: Celebrating the Centenary of the Geological Society of México; Alaniz-Álvarez, S.A., Nieto-Samaniego, A.F., Eds.; Geological Society of America: Boulder, CO, USA, 2007; Volume 422, pp. 377–415. [Google Scholar]
  68. Sillitoe, R.H.; Hedenquist, J.W. Linkages between volcanotectonic settings, ore-fluid compositions, and epithermal precious metal deposits. Geol. Soc. Am. 2003, 10, 314–343. [Google Scholar]
  69. Cook, N.J.; Ciobanu, C.L.; Pring, A.; Skinner, W.; Shimizu, M.; Danyushevsky, L.; Saini-Eidukat, B.; Melcher, F. Trace and minor elements sphalerite: A LA-ICPMS study. Geochim. Cosmochim. Acta 2009, 73, 4761–4791. [Google Scholar] [CrossRef]
  70. Cook, N.J.; Ciobanu, C.; Williams, T. The mineralogy and mineral chemistry of indium in sulphide deposits and implications for mineral processing. Hydrometallurgy 2011, 108, 226–228. [Google Scholar] [CrossRef]
  71. Gaspar, O.C. Mineralogy and sulfide mineral chemistry of the Neves Corvo ores, Portugal: Insight into their genesis. Can. Mineral. 2002, 40, 611–636. [Google Scholar] [CrossRef]
  72. Serranti, S.; Ferrini, V.; Masi, U.; Cabri, L.J. Trace-element distribution in cassiterite and sulfides from rubané and massive ores of the Corvo deposit, Portugal. Can. Mineral. 2002, 40, 815–835. [Google Scholar] [CrossRef]
  73. Sinclair, W.D.; Kooiman, G.J.A.; Martin, D.A.; Kjarsgaard, I.M. Geology, geochemistry and mineralogy of indium resources at Mount Pleasant, New Brunswick, Canada. Ore Geol. Rev. 2006, 28, 123–145. [Google Scholar] [CrossRef]
  74. Ivanov, V.V.; Rodionov, D.A.; Tarkhov, Y.A. Character of the distribution and the average content of indium in some mineral from deposits of various genetic types. Gechemistry 1963, 11, 1056–1067. [Google Scholar]
  75. Parasyuk, O.V.; Voronyuk, S.V.; Gulay, L.D.; Davidyuk, G.Y.; Halka, V.O. Phase diagram in the of the CuInS-ZnS system and some physical properties of solid solutions phases. J. Alloy. Compd. 2003, 348, 57–64. [Google Scholar] [CrossRef]
  76. Schorr, S.; Wagner, G. Structure and phase relations of the Zn[2x](CuIn)[1 − x]S [2] solid solution series. J. Alloy. Compd. 2005, 396, 202–207. [Google Scholar] [CrossRef]
  77. Johan, Z. Indium and germanium in the structure of sphalerite: An example of coupled substitution with copper. Miner. Petrol. 1988, 39, 211–229. [Google Scholar] [CrossRef]
  78. Cook, N.J.; Ciobanu, C.L.; Brugger, J.; Etschmann, B.; Howard, D.L.; de Jonge, M.D.; Ryan, C.; Paterson, D. Determination of the oxidation state of Cu in substituted Cu-In-Fe-bearing sphalerite via μ- XANES spectroscopy. Am. Mineral. 2012, 97, 476–479. [Google Scholar] [CrossRef]
  79. Bente, K.; Doering, T. Solid-state diffusion in sphalerites: An experimental verification of the “chalcopyrite-disease”. Eur. J. Mineral. 1993, 5, 465–478. [Google Scholar] [CrossRef]
  80. Bente, K.; Doering, T. Experimental studies on the solid state diffusion of Cu + In in ZnS and on “Disease”, DIS (Diffusion Induced Degregations), in sphalerite and their geological applications. Miner. Petrol. 1995, 53, 285–305. [Google Scholar] [CrossRef]
  81. Seward, T.M.; Henderson, C.M.B.; Charnock, J.M. Indium(III) chloride complexing and solvatation in hydrothermal solutions to 350 ºC: An EXAFS study. Chem. Geol. 2000, 167, 117–127. [Google Scholar] [CrossRef]
Figure 1. Regional geological map showing the location of the study area (Huari Huari deposit: white box). Inset shows the location of the map within the Eastern Cordillera (Andean morphotectonic units are after Arce-Burgoa [26]).
Minerals 09 00304 g001
Figure 2. Geological map showing the distribution of veins in the Huari Huari mining district. The location of this map is shown in Figure 1.
Minerals 09 00304 g002
Figure 3. Field photographs illustrating structures, lithologies, and textures of hosting rocks in the Huari Huari district. (A) General, SW-looking view of the Cerro Vera Cruz hill, hosting most of the Antón Bravo vein; notice the trace of the vein on the surface, which is picked out by open stopes, pits (red arrow), adits, and waste dumps (yellow arrows). (B) Contact (dashed yellow line) between Paleozoic metamorphosed sedimentary strata (left, red dashed line) and a dacite dome (right) in Cerro Manto hill, which hosts a large portion of the Buen Suceso vein; see location of the picture in A. (C) Dacite breccia observed in the Cerro Manto hill. (D) Deep red aplite dikes cut massive dacites in the Cerro Manto hill. (E) Esperanza level adit, close to the Huari Huari village; notice that the gallery is dug in Silurian shales of the Uncía formation. (F) Folded Ordovician quartzites of the San Benito formation in the core of the Huari Huari anticline.
Minerals 09 00304 g003
Figure 4. Photomicrographs of representative stratiform mineralization in the Huari Huari district. (A,B) Sulfide minerals in this sample form discontinuous veinlets, either parallel or perpendicular to bedding, or replace selective units (yellow arrow; transmitted plane polarized light (A) and reflected light (B)). (C) Pyrite mineralization around rounded detrital quartz grains (reflected light). (D) Sphalerite and goethite in this sample occupy interstitial positions between rounded quartz grains (reflected light). (E) Cassiterite (needle tin variety) occurs along a narrow quartz veinlet in a sandstone host (reflected light). (F) Minute cassiterite crystals occupy the spaces between detrital quartz grains along with zoned pyrite crystals (notice that pyrite is tarnished on purpose to emphasize crystal zoning; reflected light). Abbreviations: cst = cassiterite; gth = goethite; sl = sphalerite; py = pyrite; and qz = quartz.
Minerals 09 00304 g004
Figure 5. Photomicrographs of representative polymetallic vein mineralization in the Huari Huari district. (A) General view of the contact between a silicified host and a sphalerite-rich vein. Note that a first band of Fe-rich (dark) sphalerite is overgrown by slender subhedral quartz crystals, which also wrap rock fragments, thus drawing a cockade texture. A later generation of sphalerite, towards the core of the vein, is relatively poor in Fe (dark red in the image: transmitted, plane-polarized light). (B) Needle tin cassiterite coating a fragment of silicified host rock enclosed in sphalerite and partially replaced and overgrown by massive sphalerite (reflected light). (C) Banded vein showing an outer narrow layer of arsenopyrite and quartz, inner layers of younger sphalerite and cassiterite, and a central filling of siderite (reflected light). (D) Slender needle tin cassiterite developed inward central porosity along a siderite–sphalerite vein (reflected light). (E) Subhedral crystals of arsenopyrite and pyrite show conspicuous engulfment and microporosity filled with sphalerite. Sphalerite contains numerous chalcopyrite blebs (reflected light). (F) Sphalerite surrounds and fills porosity in anhedral, engulfed pyrite crystals (reflected light). (G) Early arsenopyrite, partly replaced by sphalerite, veined by pyrite (reflected light). (H) Early pyrrhotite pervasively replaced by sphalerite, pyrite (showing “bird’s eye” textures developed by concentric growths of pyrite in early stages of pyrrhotite replacement) and marcasite; the latter concentrates along the contacts between the other phases (reflected light). (I) Marcasite forms microscopic veinlets penetrating pyrrhotite and sphalerite (reflected light). (J) Marcasite veined early sphalerite and formed colloform overgrowths over this phase towards the core of the vein (reflected light, crossed polars). (K) Sphalerite vein crosscut by a marcasite vein (reflected light). (L) Remnants of pyrrhotite and galena are pervasively replaced by marcasite (reflected light). Abbreviations: aspy = arsenopyrite; cpy = chalcopyrite; cst = cassiterite; gn = galena; mc = marcasite; po = pyrrhotite; py = pyrite; qz = quartz; RF = host rock fragment; sid = siderite; and sl = sphalerite.
Minerals 09 00304 g005
Figure 6. Photomicrographs of representative polymetallic vein mineralization in the Huari Huari district. (A) Oscillatory-zoned stannite–sphalerite; remnants of pyrrhotite are strongly replaced by sphalerite (reflected light). (B) Detail of the oscillatory zoning of stannite and sphalerite; note the different brightness in sphalerite that points out zoning within this mineral as well. An outer band of sphalerite partially replaced the one of stannite, thus suggesting that both minerals formed alternately in time, and that the latter was not an exsolution from the former (backscattered electron image, BSE). (C) A first generation of sphalerite (sl1) is veined by a second generation of sphalerite (sl2); the contact between both served as a collector for stannite (BSE). (D) Complex texture in which corroded sphalerite is wrapped by stannite (which also lined vugs within this phase) and an interstitial overgrowth of miargyrite and argentian tetrahedrite. Pyrargyrite is mostly located along the contacts between stannite and miargyrite or tetrahedrite (reflected light). (E) Intergrowth between jamesonite bundles and sphalerite (reflected light). (F) Interstitial to quartz crystals, bladed and feathery jamesonite crystals gave way to an intergrowth of cassiterite and sphalerite. Semseyite was partially replaced by jamesonite (BSE). (G) Zonal arrangement of sphalerite, jamesonite, and pyrargyrite; notice that the porosity within sphalerite shows bladed morphologies similar to those of jamesonite remnants, probably related to dissolution of early jamesonite, and that such porosity was partially lined by pyrargyrite (reflected light). (H) An early assemblage of quartz, arsenopyrite, and cassiterite is veined by jamesonite. Semseyite, and probably galena, are late to jamesonite and partially replaced it (BSE). (I) Interstitial space between arsenopyrite, quartz, and jamesonite is lined by an assemblage of needle tin cassiterite, plagionite, semseyite, and galena. Notice that the contacts between these phases served as collectors for galena. The same assemblage penetrated along jamesonite blades to the right (BSE). (J) Jamesonite was partly replaced by andorite and galena concentrated along interstitial spaces to bladed jamesonite crystals (BSE). (K) Miargyrite, galena, and staročeskéite interstitial to stannite–sphalerite. Miargyrite was partially replaced by staročeskéite. Galena accumulated along the crystal contacts, formed blebs within miargyrite, and veined both miargyrite and staročeskéite (BSE). (L) Distorted franckeite and galena partially replaced by marcasite (BSE). Abbreviations: and = andorite; aspy = arsenopyrite; cst = cassiterite; frck = franckeite; gn = galena; jms = jamesonite; mc = marcasite; mia = miargyrite; plg = plagionite; po = pyrrhotite; py = pyrite; pyr = pyrargyrite; qz = quartz; sem = semseyite; sl = sphalerite; star = staročeskéite; stn = stannite; and td = tetrahedrite group minerals.
Minerals 09 00304 g006
Figure 7. Paragenetic sequences deduced for hypogene mineralization in the Huari Huari district. The width of the bars approximates the relative abundance of the listed minerals. Location of the mineral phases or generations yielding highlighted concentrations of In, and the maximum concentration for this metal are indicated in color. The timing of crystallization shown in the paragenetic sequence is relative to observations made on each vein system and the stratiform mineralization; therefore, it does not necessarily indicate absolute timing.
Minerals 09 00304 g007
Figure 8. Plot of the analyzed sphalerite and stannite grains from the Huari Huari district in the Zn + Fe + Cd + Mn vs. Cu + Ag vs. Sn + In ternary diagram. The composition of mineral end-members of interest is also plotted and includes chalcopyrite (cpy), kësterite (kës), roquesite (rqs), sphalerite (sl), and stannite (stn). The compositional variation of sakuraiite (sak) and petrukite (pet) is also shown (bold, red line).
Minerals 09 00304 g008
Figure 9. Correlation between elements in sphalerite from the Huari Huari district.
Minerals 09 00304 g009
Figure 10. Correlation between In and other elements in sphalerite from the Huari Huari district.
Minerals 09 00304 g010
Figure 11. Correlation between elements in stannite from the Huari Huari district.
Minerals 09 00304 g011
Figure 12. Pb vs. Sb binary plot for galena from the Huari Huari district.
Minerals 09 00304 g012
Figure 13. Plot of the analyzed tetrahedrite group minerals and Ag–Cu–Sb sulfosalts from the Huari Huari district in the Ag2S vs. Cu2S vs. Sb2S3 + As2S3 ternary diagram (left) and of the tetrahedrite group minerals in the As/(As + Sb) vs. Ag/(Ag + Cu) and Zn/(Zn + Fe) binary diagrams (right).
Minerals 09 00304 g013
Figure 14. Binary temperature composition plot showing arsenopyrite composition in the f(S2) buffered arsenopyrite + pyrite + pyrrhotite and pyrrhotite + arsenopyrite + pyrite assemblages (fields are after [54]). Key: Apy = arsenopyrite, As = native arsenic, L = liquid, Lö = löllingite, Po = pyrrhotite, and Py = pyrite.
Minerals 09 00304 g014
Figure 15. Binary log (XFeS/XZnS)sphalerite vs. log (XFeS/XZnS)stannite plot showing results for sphalerite and stannite from Huari Huari. Isotherms (dashed red lines) are based on data by Nakamura and Shima [61]. Blue dotted lines show log f(S2) in the pyrrhotite stability field after Scott and Barnes [56]. The 20.8 mol. % FeS line in sphalerite corresponds to the composition of sphalerite in equilibrium with pyrrhotite at 1 bar [56]. Composition fields of coexisting stannite–sphalerite in Japanese deposits are shown for comparison [62,63].
Minerals 09 00304 g015
Figure 16. Diagram correlating temperature and sulfur fugacity for the sulfidation states of hydrothermal fluids in the formation environments of porphyry and epithermal deposits, defined according to the stability fields of key minerals, with the approximate sulfidation paths determined by the metallic mineral associations in the sulfide–sulfosalt stage at the Huari Huari deposit (in purple and pink). The lines dotted in white represent the sulfidation curves for common contents of FeS in sphalerite, deduced from Figure 5 in Einaudi et al. [66] and adopted from Camprubí and Albinson [67]. The sulfidation trajectories determined for the sulfide and sulfosalt substages were constructed by using the mineral sequence determined in Figure 7 and the key interrelationships between minerals as follows: (1) arsenopyrite replacement by pyrrhotite, (2) coprecipitation of sphalerite and stannite, (3) replacement of pyrrhotite by pyrite and marcasite (“bird’s eye” textures), and (4) precipitation of tetrahedrite after stannite. Trajectories 1, 2, and 3 (in white, in circles) are those described for porphyry copper deposits, base-metal veins associated to porphyries (or “looping path” of magmatic fluids), and active geothermal fluids (or “geothermal path”), respectively, according to Einaudi et al. [66]. Trajectory 4 (in white, in a circle) is a speculative “flattened looping path” that aims to explain the sulfidation trajectories deduced for Mexican epithermal deposits, according to Camprubí and Albinson [67]. The general diagram and the information it bears was largely adapted from Einaudi et al. [66] and Sillitoe and Hedenquist [68]. The areas in which the depicted reactions were deduced to take place, as deduced in this paper, were determined as follows: (1) The boxes in red and deep blue and yellow that fade downward do so from the maximum value of sulfur fugacity that was obtained in this study. Similarly, the yellow box that fades upward does so from the minimum value of sulfur fugacity that was obtained in this study. The box striped in yellow denotes the case in which maximum and minimum values for sulfur fugacity are available. (2) The boxes striped in light blue, orange, and green were positioned below or above the stability limit for the characteristic minerals or reactions to which they referred (orange for the replacement of pyrrhotite by pyrite and marcasite, green for tetrahedrite) or the approximate FeS content in sphalerite that coprecipitated with stannite (light blue). The length of these boxes was determined by the range of temperatures at which the depicted reactions were determined to occur as of this study. Key: Aspy = arsenopyrite, Mc = marcasite, Po = pyrrhotite, Py = pyrite, Sph = sphalerite, Stn = stannite, and Ttd = tetrahedrite.
Minerals 09 00304 g016
Table 1. Representative analyses of arsenopyrite and pyrrhotite from the Huari Huari district, including chemical composition in wt. % and at. % (electron probe microanalyses). Lower detection limits are given in Table 2.
MineralArsenopyritePyrrhotite
Vein GroupAntón BravoMatildeAntón Bravo
Sample13151315127212751275132813302018hh112018hh11
Analysis1920114182189118122B-06B-07
As (wt. %)42.0543.3144.3542.8042.690.14b.d.l.b.d.l.b.d.l.
S20.7421.1319.9021.2819.7539.2939.1139.6238.90
Fe34.4534.4135.2435.0733.8859.5959.6460.6560.89
Sb2.070.32b.d.l.b.d.l.b.d.l.b.d.l.b.d.l.b.d.l.b.d.l.
Seb.d.l.b.d.l.0.300.210.88b.d.l.b.d.l.b.d.l.b.d.l.
Znb.d.l.0.100.041.501.71b.d.l.b.d.l.0.430.10
Cub.d.l.b.d.l.0.02b.d.l.b.d.l.b.d.l.b.d.l.b.d.l.b.d.l.
Pb0.090.05b.d.l.0.090.12b.d.l.0.110.110.13
Bib.d.l.b.d.l.b.d.l.b.d.l.b.d.l.0.050.09b.d.l.b.d.l.
Inb.d.l.b.d.l.b.d.l.b.d.l.b.d.l.b.d.l.b.d.l.b.d.l.b.d.l.
Total99.4099.3399.94100.9699.1199.0698.95100.81100.02
As (at. %)30.4631.1232.0130.2431.110.08---
S35.1135.4833.5635.1433.6453.4153.3053.0652.62
Fe33.4833.1734.1233.2433.1346.5046.6646.6347.29
Sb0.920.14-------
Se--0.200.140.61----
Zn-0.090.041.211.43--0.280.07
Cu--0.02------
Pb0.020.01-0.020.03-0.020.020.03
Bi-----0.010.02--
In---------
b.d.l.: below detection limit.
Table 2. Summary of element concentrations in sphalerite from the Huari Huari district (electron probe microanalysis data).
Wt. % SZnFeCuSnCdMnAgInGeGa
d.l. 0.010.030.020.020.040.080.020.060.030.020.03
Entire district (n = 560)MIN30.4341.66b.d.l.b.d.l.b.d.l.b.d.l.b.d.l.b.d.l.b.d.l.b.d.l.b.d.l.
MAX34.7768.3016.128.376.982.910.392.043.490.080.64
Av.33.1256.568.210.360.220.280.020.040.170.000.07
Stratiform mineralization (n = 6)MIN32.5553.26b.d.l.b.d.l.b.d.l.0.23b.d.l.b.d.l.b.d.l.b.d.l.b.d.l.
MAX33.6768.2211.240.210.250.770.100.54b.d.l.b.d.l.0.20
Av.33.1263.972.810.080.080.420.02---0.06
Polymetallic veins (n = 554)MIN30.4341.66b.d.l.b.d.l.b.d.l.b.d.l.b.d.l.b.d.l.b.d.l.b.d.l.b.d.l.
MAX34.7768.3016.128.376.982.910.392.043.490.080.64
Av.33.1257.498.260.360.220.280.020.040.170.000.07
Antón Bravo (n = 429)MIN30.4341.66b.d.l.b.d.l.b.d.l.b.d.l.b.d.l.b.d.l.b.d.l.b.d.l.b.d.l.
MAX34.7765.8316.128.376.982.910.082.043.490.080.63
Av.33.2756.469.190.380.240.290.020.040.210.000.07
Buen Suceso (n = 60)MIN30.4552.000.54b.d.l.b.d.l.b.d.l.b.d.l.b.d.l.b.d.l.b.d.l.b.d.l.
MAX33.5366.9811.821.611.430.410.070.380.290.040.64
Av.32.2259.746.370.200.120.240.020.040.030.000.06
Matilde (n = 62)MIN32.1352.39b.d.l.b.d.l.b.d.l.b.d.l.b.d.l.b.d.l.b.d.l.b.d.l.b.d.l.
MAX33.8568.2912.361.830.921.110.390.280.900.080.43
Av.32.9561.914.060.350.200.280.040.040.070.010.08
San Salvador (n = 3)MIN31.2867.510.03b.d.l.b.d.l.0.26b.d.l.n.a.b.d.l.b.d.l.b.d.l.
MAX33.8668.300.080.080.030.380.04n.a.b.d.l.b.d.l.0.34
Av.32.6667.830.050.040.020.330.02n.a.--0.11
d.l.: lower detection limit; b.d.l.: below detection limit; n.a.: not analyzed; MIN: minimum value; MAX: maximum value; and Av.: average value.
Table 3. Representative analyses of sphalerite crystals from the Huari Huari district, including chemical composition, structural formulas normalized to S = 1, and molecular composition (electron-microprobe data). Lower detection limits are given in Table 2.
Mineralization StyleStratiformPolymetallic Veins
Vein Group--San SalvadorMatildeBuen Suceso
Sample1322132113191329133012781280128212951329
Analysis23dh2712edbsec27
S (wt. %)33.3432.9431.2833.3132.3833.4932.5732.7633.2833.31
Zn60.3566.6367.6853.6266.8953.1258.2359.1863.7653.62
Fe5.160.170.0412.360.0411.808.557.002.7912.36
Cub.d.l.0.21b.d.l.0.17b.d.l.0.680.21b.d.l.b.d.l.0.17
Sn0.25b.d.l.b.d.l.0.08b.d.l.0.60b.d.l.0.04b.d.l.0.08
Cd0.270.270.38b.d.l.0.380.310.180.170.21b.d.l.
Ag0.54b.d.l.b.d.l.b.d.l.b.d.l.b.d.l.b.d.l.b.d.l.b.d.l.b.d.l.
Mnb.d.l.0.10b.d.l.b.d.l.b.d.l.0.03b.d.l.0.03b.d.l.b.d.l.
Inb.d.l.b.d.l.b.d.l.b.d.l.b.d.l.b.d.l.0.270.04b.d.l.b.d.l.
Geb.d.l.b.d.l.b.d.l.0.06b.d.l.b.d.l.b.d.l.b.d.l.b.d.l.0.06
Gab.d.l.b.d.l.b.d.l.b.d.l.b.d.l.b.d.l.b.d.l.0.64b.d.l.b.d.l.
Total99.91100.3299.3999.5999.69100.02100.0099.87100.0499.59
S (a.p.f.u.)1.001.001.001.001.001.001.001.001.001.00
Zn0.890.991.060.791.010.780.880.890.940.79
Fe0.090.000.000.210.000.200.150.120.050.21
Cu-0.00-0.00-0.010.00--0.00
Sn0.00--0.00-0.00-0.00-0.00
Cd0.000.000.00-0.000.000.000.000.00-
Ag0.00---------
Mn-0.00---0.00-0.00--
In------0.000.00--
Ge---0.00-----0.00
Ga-------0.01--
(Zn, Cd, and Mn)S (mol. %)90.799.499.978.599.978.284.987.895.178.5
FeS9.10.30.121.10.119.814.612.14.921.1
Cu2FeSnS40.00.00.00.10.00.50.00.00.00.1
CuInS20.00.00.00.00.00.00.20.00.00.0
Miner. StylePolymetallic Vein
Vein GroupAntón Bravo
Sample133213342018-hh3A2018-hh3A2018-hh1412891289128912891331
Analysis2aA-47F-08A-04A-11C-01C-06C-10h
S (wt. %)32.7532.7332.8632.6533.8433.4533.1233.5833.6332.26
Zn59.5057.0749.5649.8950.0647.5165.8349.8950.7359.70
Fe7.107.839.9310.989.7715.631.0915.6115.177.73
Cu0.060.733.932.582.141.07b.d.l.0.10b.d.l.b.d.l.
Sn0.04b.d.l.1.120.880.23b.d.l.b.d.l.b.d.l.b.d.l.0.14
Cd0.280.350.740.750.700.320.210.420.400.12
Agb.d.l.b.d.l.b.d.l.b.d.l.b.d.l.b.d.l.b.d.l.b.d.l.b.d.l.b.d.l.
Mn0.03b.d.l.b.d.l.b.d.l.b.d.l.b.d.l.b.d.l.b.d.l.b.d.l.b.d.l.
Inb.d.l.1.052.502.993.49b.d.l.b.d.l.0.10b.d.l.0.09
Geb.d.l.b.d.l.b.d.l.b.d.l.b.d.l.b.d.l.b.d.l.b.d.l.b.d.l.b.d.l.
Ga0.300.25b.d.l.b.d.l.b.d.l.b.d.l.b.d.l.b.d.l.b.d.l.0.63
Total100.06100.02100.64100.72100.3098.05100.3899.73100.13100.66
S (a.p.f.u.)1.001.001.001.001.001.001.001.001.001.00
Zn0.890.860.740.750.730.700.970.730.740.91
Fe0.120.140.170.190.170.270.020.270.260.14
Cu0.000.010.060.040.030.02-0.00--
Sn0.00-0.010.010.00----0.00
Cd0.000.000.010.010.010.000.000.000.000.00
Ag----------
Mn0.00---------
In-0.010.020.030.03--0.00-0.00
Ge----------
Ga0.000.00-------0.01
(Zn, Cd, and Mn)S87.784.573.874.076.271.198.173.174.286.7
FeS12.213.516.318.217.127.31.926.725.813.1
Cu2FeSnS40.00.00.90.70.20.00.00.00.00.0
CuInS20.00.92.12.63.10.00.00.10.00.0
a.p.f.u.: atoms per formula unit. b.d.l.: below detection limit.
Table 4. Representative analyses of stannite group minerals from the Huari Huari district, including chemical composition and structural formulas normalized to S = 4 (electron-microprobe data). Lower detection limits are given in Table 2.
Vein GroupMatildeB. SucesoAntón Bravo
Sample1329132912692018hh3A2018hh3A2018hh202018hh14128912891289
Analysis140141e-38A-16E-04B-01A-09B-03B-04B-05
S (wt. %)28.9028.9228.2529.6229.2629.5530.6129.3029.1429.33
Cu27.6227.7930.0229.2129.1127.7426.6428.3728.4128.28
Sn26.5527.1726.0127.7425.9624.4723.9727.9527.7627.86
Fe12.4512.3612.7710.9311.0013.0412.8811.5611.5211.27
Zn1.151.35b.d.l.2.302.083.304.532.392.603.04
Ag2.081.47b.d.l.0.081.880.740.240.680.520.55
In0.06b.d.l.b.d.l.0.030.032.641.250.050.130.05
Total98.8199.0697.2299.0199.32101.48100.12100.30100.08100.38
S (a.p.f.u.) 14.004.004.004.004.004.004.004.004.004.00
Cu1.931.942.141.992.011.891.761.951.971.95
Sn0.991.010.991.010.960.890.851.031.031.03
Fe0.990.981.040.850.861.010.970.910.910.88
Zn0.080.09-0.150.140.220.290.160.180.20
Ag0.090.06-0.000.080.030.010.030.020.02
In0.00--0.000.000.100.050.000.010.00
Zn/(Fe + Zn)20.070.090.000.150.140.180.230.150.160.19
1 a.p.f.u.: atoms per formula unit; 2 atomic proportions; and b.d.l.: below detection limit.
Table 5. Representative analyses of galena and tetrahedrite group minerals from the Huari Huari district, including chemical composition and structural formulas normalized to S = 1 for galena, S = 13 for the apthonite variety of tetrahedrite, and Sb = 4 for argentian tetrahedrite (electron probe microanalysis data). Lower detection limits are given in Table 2, except for Pb (d.l. = 0.03), Bi (d.l. = 0.04), Sb (d.l. = 0.04), and As (d.l. = 0.11).
MineralGalenaTetrahedrite
Variety ApthoniteArgentian Tetrahedrite
Vein GroupAntón BravoBuen SucesoMatildeAntón Bravo
Sample13151274127412701270132813282018hh32018hh32018hh32018hh3
Analysis896976773303165668697
S (wt. %)13.7512.8412.8512.6312.9323.7823.7522.4322.2521.6322.02
Sb4.820.852.62b.d.l.b.d.l.27.8927.7927.2229.1726.4627.51
Asb.d.l.b.d.l.b.d.l.b.d.l.b.d.l.0.850.92b.d.l.b.d.l.b.d.l.b.d.l.
Pb80.9384.3982.4984.7278.970.09b.d.l.0.03b.d.l.0.05b.d.l.
Cub.d.l.b.d.l.b.d.l.b.d.l.b.d.l.32.5232.0020.0317.5118.9020.47
Ag0.160.350.910.791.948.138.1724.4625.5727.4824.33
Znb.d.l.b.d.l.b.d.l.0.122.015.155.341.571.491.801.67
Fe0.060.260.200.040.160.400.394.864.154.494.78
Bi0.231.111.131.944.680.05b.d.l.0.07b.d.l.0.08b.d.l.
Snb.d.l.b.d.l.b.d.l.b.d.l.b.d.l.b.d.l.b.d.l.b.d.l.b.d.l.b.d.l.b.d.l.
Inb.d.l.0.03b.d.l.b.d.l.b.d.l.b.d.l.b.d.l.b.d.l.b.d.l.b.d.l.b.d.l.
Ge0.250.530.21b.d.l.b.d.l.b.d.l.0.03b.d.l.b.d.l.b.d.l.b.d.l.
Ga0.100.080.090.120.15b.d.l.b.d.l.b.d.l.b.d.l.b.d.l.b.d.l.
Total100.30100.44100.50100.55101.0198.9898.52100.75100.27100.94100.86
S (a.p.f.u.) 11.001.001.001.001.0013.0013.0012.5211.5912.4212.16
Sb0.090.020.05--4.014.014.004.004.004.00
As-----0.200.22----
Pb0.911.020.991.040.950.01-0.00-0.00-
Cu-----8.978.845.644.605.475.70
Ag0.000.010.020.020.041.321.334.063.964.693.99
Zn---0.000.081.381.430.430.380.510.45
Fe0.000.010.010.000.010.120.121.561.241.481.52
Bi0.000.010.010.020.060.00-0.01-0.01-
Sn-----------
In-0.00---------
Ge0.010.020.01---0.01----
Ga0.000.000.000.000.01------
As/(As+Sb) 2-----0.050.050.000.000.000.00
Ag/(Ag+Cu) 2-----0.130.130.420.460.460.41
Zn/(Zn+Fe) 2-----0.920.920.220.230.260.23
1 a.p.f.u.: atoms per formula unit; 2 atomic proportions, tetrahedrite group minerals; and b.d.l.: below detection limit.
Table 6. Representative analyses of andorite, diaphorite, staročeskéite, jalpaite, miargyrite, pyrargyrite, franckeite, semseyite, and jamesonite from the Huari Huari district, including chemical composition and structural formulas normalized to S (electron probe microanalysis data). Lower detection limits are given in Table 2, except for Pb (d.l. = 0.03), Bi (d.l. = 0.04), Sb (d.l. = 0.04), and As (d.l. = 0.11).
MineralAndoriteDiaphoriteStaročeskéiteJalpaiteMiargyritePyrargyriteFranckeite
Vein GroupAntón BravoAntón BravoAntón BravoMatildeAntón BravoAntón BravoMatilde
Sample131513342018hh3A13292018hh3A2018hh3A2018hh3A2018hh3A13301323
AnalysisB ssa4A-3815A-36A-37A-17B-41262
S (wt. %)21.4819.1119.8913.5021.4521.6117.4217.4719.5720.27
Sb40.2526.2129.69b.d.l.41.9741.7222.0922.969.779.98
As0.470.32b.d.l.b.d.l.b.d.l.b.d.l.b.d.l.b.d.l.0.130.46
Pb24.0829.1032.850.100.050.180.150.0953.9649.32
Ag11.4923.508.9175.5336.1836.5959.8959.540.410.93
Sn0.73b.d.l.b.d.l.b.d.l.b.d.l.b.d.l.b.d.l.b.d.l.12.4314.59
Cu0.020.620.034.880.330.070.130.16b.d.l.0.02
Znb.d.l.0.000.054.310.05b.d.l.b.d.l.0.09b.d.l.1.89
Fe0.350.580.330.100.07b.d.l.b.d.l.0.032.522.61
Cdb.d.l.b.d.l.0.23b.d.l.b.d.l.b.d.l.b.d.l.b.d.l.b.d.l.b.d.l.
Bi0.120.165.84b.d.l.0.050.080.140.050.210.22
Inb.d.l.b.d.l.b.d.l.b.d.l.b.d.l.b.d.l.b.d.l.b.d.l.b.d.l.b.d.l.
Ge0.09b.d.l.b.d.l.b.d.l.0.03b.d.l.b.d.l.b.d.l.0.100.08
Gab.d.l.0.04b.d.l.b.d.l.b.d.l.b.d.l.b.d.l.b.d.l.0.09b.d.l.
Total99.0899.6497.8298.42100.18100.2599.82100.4099.19100.37
S (a.p.f.u.) 16.008.006.002.002.002.003.003.0014.0014.00
Sb2.962.892.36-1.031.021.001.041.841.81
As0.060.06------0.040.14
Pb1.041.881.530.000.000.000.000.005.975.27
Ag0.952.920.803.331.001.013.073.040.090.19
Sn0.06-------2.402.72
Cu0.000.130.000.360.020.000.010.01-0.01
Zn--0.010.310.00--0.01-0.64
Fe0.060.140.060.010.00--0.001.031.03
Cd--0.02-------
Bi0.010.010.27-0.000.000.000.000.020.02
In----------
Ge0.01---0.00---0.030.02
Ga-0.01------0.03-
MineralSemseyiteJamesonite
Vein GroupAntón BravoAntón Bravo
Sample1315131513151315131513151315131513151334
Analysis13141516b231113b16b
S (wt. %)18.9718.8220.8221.1120.8820.9620.8420.8620.8921.12
Sb31.0829.4734.3034.5434.6134.7634.6734.6234.5634.44
As0.320.300.460.290.390.350.450.360.510.48
Pb48.7850.8041.1540.9540.8840.5940.9040.2541.0040.89
Agb.d.l.0.18b.d.l.b.d.l.b.d.l.b.d.l.b.d.l.b.d.l.b.d.l.b.d.l.
Sn0.200.150.260.220.200.260.280.400.270.27
Cub.d.l.b.d.l.b.d.l.b.d.l.0.020.03b.d.l.b.d.l.b.d.l.b.d.l.
Znb.d.l.0.04b.d.l.b.d.l.0.060.200.190.48b.d.l.b.d.l.
Fe0.040.032.572.552.532.622.622.542.582.55
Cdb.d.l.b.d.l.b.d.l.0.17b.d.l.b.d.l.b.d.l.b.d.l.b.d.l.b.d.l.
Bi0.140.190.050.120.110.110.040.150.110.08
Inb.d.l.b.d.l.b.d.l.b.d.l.b.d.l.b.d.l.b.d.l.b.d.l.b.d.l.b.d.l.
Ge0.100.650.540.120.080.080.170.100.140.07
Ga0.040.100.060.040.050.050.04b.d.l.b.d.l.0.06
Total99.68100.73100.21100.1199.82100.01100.2399.76100.0799.95
S (a.p.f.u.) 121.0021.0014.0014.0014.0014.0014.0014.0014.0014.00
Sb9.068.666.076.036.116.116.136.126.106.01
As0.150.150.130.080.110.100.130.100.150.14
Pb8.368.774.284.204.244.194.254.184.254.19
Ag-0.06--------
Sn0.060.050.050.040.040.050.050.070.050.05
Cu----0.010.01----
Zn-0.02--0.020.060.060.16--
Fe0.030.020.990.970.971.001.010.980.990.97
Cd---0.03------
Bi0.020.030.000.010.010.010.000.020.010.01
In----------
Ge0.050.320.160.030.030.020.050.030.040.02
Ga0.020.050.020.010.020.010.01--0.02
1 a.p.f.u.: atoms per formula unit; b.d.l.: below detection limit.

