
Size Distribution, Elemental Composition and Morphology of Nanoparticles Separated from Respirable Coal Mine Dust

1
Department of Materials Science and Engineering, College of Mines and Earth Sciences, University of Utah, Salt Lake City, UT 84112, USA
2
Department of Chemical Engineering, Michigan Technological University, Houghton, MI 49931, USA
*
Author to whom correspondence should be addressed.
†
Present address: Imessa Research, 630 Komas Dr, Suite 300, Salt Lake City, UT 84108, USA.
Minerals 2023, 13(1), 97; https://doi.org/10.3390/min13010097
Submission received: 19 December 2022
/
Revised: 30 December 2022
/
Accepted: 4 January 2023
/
Published: 7 January 2023
(This article belongs to the Special Issue Mineralogic Analysis of Respirable Dust)
Abstract
:Nanoparticles, defined as particles with one dimension below 100 nm, contribute little to the total mass concentration in respirable coal mine dust (RCMD) toxicological studies, but they could have a considerable part in the adverse health effects by RCMD inhalation. It has been shown that inhaled nanoparticles can penetrate deep into the lung and could plausibly contribute to acute and chronic pulmonary diseases by triggering oxidative stress formation and inducing inflammation. RCMD nanoparticles from samples collected in an underground mine in the United States were analyzed by a particle separation technique, field-flow fractionation (FFF), for size, morphology, and elemental composition. Two sub-techniques, asymmetrical flow field-flow fractionation (AsFlFFF), and sedimentation field-flow fractionation (SdFFF) were used to increase the detection size range. Nanoparticles with a size range between 25–400 nm were detected. Fractions were collected throughout the size distribution and were analyzed by electron microscopy and inductively-coupled plasma mass spectrometry (ICP-MS). Electron micrographs showed the presence of carbonaceous particles, mineral particles, diesel particles, and aggregates. Major and trace elements such as Si and Ca were detected in high abundance in all fractions. Other metals included Mg, Fe, Al, Cs, and Pb. Higher relative concentrations of Cs and Pb were observed at the size range below 30 nm. The data suggests that nanoparticles in RCMD can be highly reactive, either as a result of their size or their potential to carry toxins such as transition and heavy metals. To the best of the authors’ knowledge, this is the first data on the size, morphology, and composition of RCMD nanoparticles with a size below 100 nm.
1. Introduction
Respirable coal mine dust (RCMD) is a complex mixture of carbonaceous and mineral particles with variations in size and shape. Accumulation of RCMD in the lungs of underground coal miners results in severe respiratory damage that can ultimately progress to lethal coal workers’ pneumoconiosis (CWP). The occurrence of CWP dropped to a low of 2.1% in the 1990s, but increased to 3.1% in the 2000s, particularly among the miners in the Appalachia region [1]. The recent resurgence of CWP, despite observing all the health and safety rules and regulations imposed by the National Institute for Occupational Safety and Health (NIOSH), and Mine Safety and Health Administration (MSHA), has prompted new research to understand and prevent a further upward trend of CWP occurrence in coal miners.
In a report published by NIOSH [2], some possible reasons for this resurgence were cited as; regulations and compliance, location of the mine, thin-seam mining, and the composition of the coal. Others have also pointed out the effects of the mine size [3] the silica content [4] and recently the size and composition of RCMD [5,6].
Once the RCMD particles pass the upper respiratory tract and enter the lungs, their uptake, clearance, and translocation are governed by their physicochemical characteristics such as angularity, surface charge, solubility, surface area, and exposed surface ions. Research on the inhalation toxicology of nanoparticles has demonstrated that particle size is an important factor in the uptake, clearance, and translocation of nanoparticles in the human body [7,8,9]. Airborne nanoparticles that can reach the alveolar region cannot be effectively cleared by macrophages and are retained longer by the alveolar cells, leading to increased uptake by the lymphatic tissue [10] and trigger elevated oxidative stress through their various interactions [7,11,12]. It has been suggested that ultrafine particles in air pollution cause acetylation of histones leading to the unwinding of deoxyribonucleic acid (DNA) and increasing transcription for pro-inflammatory genes [8,13]. Single ultrafine particles are very small in comparison to the cellular structures and can cross the cellular membranes [14]. In addition, nanoparticles can interact with different bacteria in the lung, rupture the bacterial cell, and potentially generate reactive oxygen species (ROS). There are also concerns that surface-active nanoparticles can bind to dangerous contaminants such as lipopolysaccharides (LPS) and induce inflammatory response when inhaled [15]. In addition, the presence of nanoparticles in single or aggregate form, may interfere with the lung clearance of larger particles and result in fibrosis. Nanoparticles can penetrate deep to the alveoli and cross the air–blood barrier where they can translocate to primary organs such as liver, spleen, and heart [16].
Recently, scanning electron microscopy (SEM), combined with energy dispersive x-ray analysis (EDX) has been used extensively to characterize RCMD particles for size, shape, and elemental composition in the size range of 0.1–10 μm [4,17,18]. The major particle groups in RCMD were identified as carbonaceous coal dust particles, aluminosilicates, carbonate minerals originating from the rock dusting process, and sub-micron particulates originating from diesel engines, with the sub-micron size comprising 50%–80% of the total analyzed particles. It was also demonstrated that not only diesel particles but also both coal and rock dust particles could be present in the nano-sized fraction of the RCMD [5,18]. The SEM-EDX method has the advantage of assigning chemical composition directly to a particle with a known size and shape. However, to have representative data, at least hundreds of particles on a filter need to be counted and measured individually at different locations of the filter. Data acquisition and image processing can be time-consuming. In addition, often the particles are not deposited individually and are aggregated with smaller or larger particles, which can make the analysis more problematic.
The utility of a separation technique, field-flow fractionation (FFF), in the separation and characterization of RCMD nanoparticles has been demonstrated recently [18]. Field-flow fractionation (FFF) is a family of elution and separation techniques [19] in which the particles can be separated in a thin channel under a physical field. The analysis yields a size distribution. Fractions can be obtained and analyzed by ancillary techniques such as electron microscopy and mass spectrometry. In this study, two field-flow fractionation sub-techniques were utilized to separate and obtain data on the size distribution, morphology, and size-based elemental composition of nanoparticles in RCMD. To the best of our knowledge, this is the first data on the size, morphology, and composition of RCMD nanoparticles with a size below 100 nm.
2. Materials and Methods
2.1. RCMD Sampling and Sample Preparation
Coal mine dust samples from an underground mine in the Western United States were collected using gravimetric dust samplers placed at the feeder, bolter, and miner locations. The respirable fraction (d < 10 μm) was collected and deposited on a 0.8 μm polycarbonate filter, using a 10 mm Dorr-Oliver cyclone. The coarse fraction was collected at the bottom of the cyclone. The cyclone pump operated at an airflow rate of 2 L per minute. The sampling duration was 9 h.
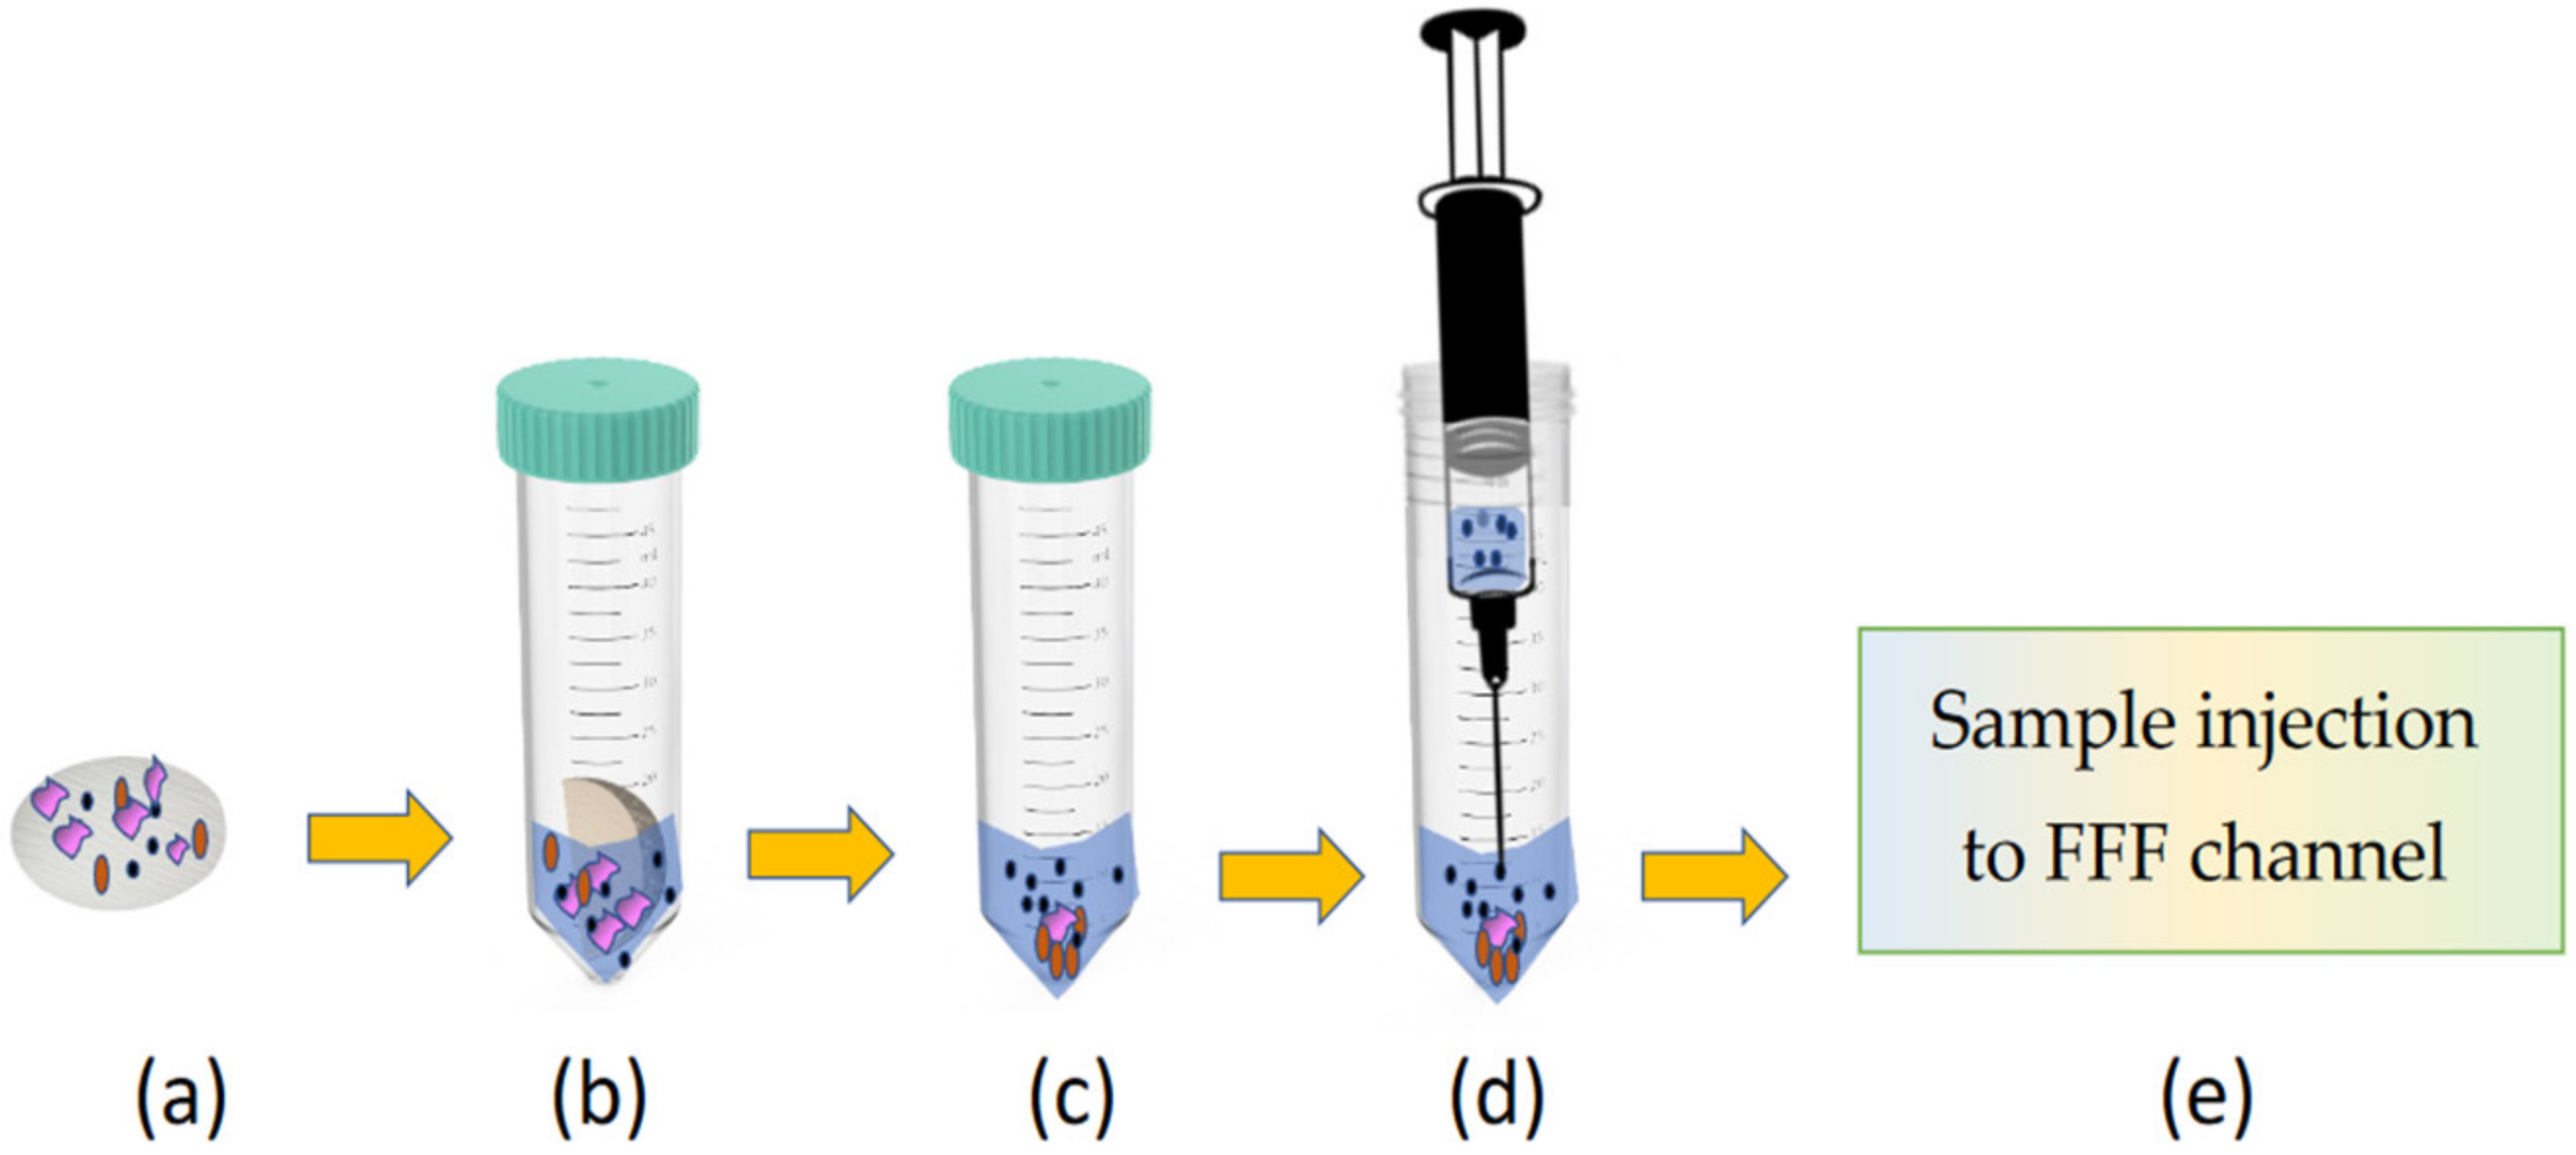
RCMD particles were isolated by placing the filter paper in a polycarbonate test tube, adding 2 mL of the carrier fluid, and mixing using a vortex mixer for 30 s, followed by 5 min of bath sonication. The extraction procedure was repeated once a day for 3 days to ensure the extraction of the maximum amount of RCMD sample from the filter paper. On the third day, the samples were settled for two hours to exclude mineral particles with diameters over 1 μm and samples were taken accordingly, using a microneedle. (Figure 1). The two-hour time frame was selected using the settling velocity of a mineral spherical particle with a 1 μm diameter and density of 2.6 g/cm3. This step was necessary to minimize the interference and steric elution of particles over 1 μm in diameter.
2.2. Transmission Electron Microscopy (TEM)
A 5 μL aliquot of the fractions collected along the size distribution was placed on a 200-mesh carbon-coated copper grid (Electron Microscopy Sciences, Hatfield, PA, USA) and air-dried at room temperature. The grid was then imaged by an FEI Tecnai t12 electron microscope (FEI Hillsboro, OR, USA) operating at a 120 kV accelerating voltage. Sizes of nanoparticles were measured using the NIH ImageJ software (National Institute of Health, Bethesda, MD, USA, https://imagej.nih.gov).
2.3. Inductively Coupled Plasma Mass Spectrometry (ICP-MS)
Fractions were collected every 2 min for asymmetrical flow field-flow fractionation (AsFlFFF) runs or every 5 min for sedimentation field-flow fractionation (SdFFF) runs for elemental analysis. Fractions were collected in 50 mL polypropylene, sterile, and metal-free centrifuge tubes (VWR, Radnor, PA, USA), and were digested with 5% nitric acid. An Agilent 8900 ICP-QQQ Tandem quadrupole mass-spectrometer (ICP-MS/MS) with an octopole reaction system, located at the Department of Geology and Geophysics at the University of Utah was used for the elemental analysis of the digested RCMD nanoparticles. Three sets of blank samples were analyzed with each set of samples and the data were corrected accordingly.
2.4. Field-Flow Fractionation (FFF)
Field-Flow Fractionation (FFF) is a set of chromatography-like separation techniques, that can be used for the separation and characterization of particles in a range of a few nm to tens of microns. Various FFF sub-techniques have been used extensively for the separation and characterization of particles, nanoparticles, proteins, macromolecules, and viruses since the 1970s [20,21,22,23]. The theory has been fully developed for almost all sub-techniques [19,24]. A detailed explanation of particle separation in FFF can be found elsewhere [19,25,26]. Briefly, in FFF the sample separation takes place in a thin (thickness of hundreds of microns), flat, channel filled only with the carrier fluid and with no stationary phase. An external physical force, which can be an incoming flow, a centrifugal, electric, or thermal field, is applied perpendicular to the flow stream of the suspended particles throughout the separation.
In a typical experiment, the particles are injected into the channel, and then the channel flow is bypassed to allow the sample particles to interact with the incoming field for a certain time (relaxation period). During relaxation, the external force pushes the particles towards the lower part of the channel (the accumulation wall), where the particles reach an equilibrium position depending on their Brownian motion and the extent of the applied force. In the normal FFF mode, the smaller particles will have equilibrium positions closer to the center of the channel and the larger particles will be closer to the accumulation wall. After the relaxation period, the channel flow is resumed, and the particles will be carried out of the channel by the laminar flow (see Figures S1 and S2 in Supplementary Materials).
The preliminary result from an FFF run is a “fractogram”, analogous to a “chromatogram”, which depicts the sample retention time or retention volume versus the detector signal (usually a UV detector). The UV signal gives the mass concentration of the sample in the volume passing through the UV cell (dmc/dV). The size distribution is the fraction of the total sample in each size range, or the “relative mass” (dmc/dd). To produce the size distribution, the x -axis is converted to size using FFF equations. The y-axis is converted to “relative mass” by multiplying the UV signal (dmc/dV) by (dV/dd). Thus, the “relative mass” observed later in the size distribution data, is not the absolute mass. It indicates the mass of the particles within that specific size increment, relative to the total area of the size distribution graph.
Depending on the applied force, different properties of the particles can be directly calculated from the elution time. In flow FFF (FlFFF), the applied force is an incoming flow of the carrier fluid through porous frits. The lower channel wall is covered with an ultrafiltration membrane to minimize sample loss. In FlFFF, the obtained parameter is the diffusion coefficient, which is converted to the hydrodynamic diameter. In sedimentation FFF (SdFFF), the obtained parameter is “buoyant mass”, which is then converted to an equivalent spherical diameter, from the difference in the densities of the particles and the carrier fluid. For convenience, both diameters are referred to as “diameter” in the manuscript. Since FFF is an elution technique, the result is a size distribution rather than an average size.
Both asymmetrical flow FFF (AsFlFFF) and sedimentation FFF (SdFFF) were used in this research. In AsFlFFF, the channel is trapezoidal, and the calculations are not straightforward for the power programmed field. Therefore, in AsFlFFF the size was obtained by calibrating with nanoparticle standards in the given size range under the same conditions that have been used for sample separation. For SdFFF, the size was calculated directly from the elution time using the following equation:
where k is the Boltzmann constant. T is the temperature (K), w is the channel thickness (m), G is the centrifugal acceleration (m s−2), Δρ is the density difference between the particle and the carrier fluid (kg m−3). t0 is the void time (s), the time for a non-retained component to exit the channel and is given by: , where V0 is the channel void volume (m3) and is the volumetric carrier flow rate (m3 s−1).
AsFlFFF experiments were performed using a PostNova AF2000 system and the SdFFF experiments were performed using a Postnova Analytics SdFFF system. In both techniques, the signal was detected using UV detection at 254 nm (SPD-20A, Shimadzu, Kyoto, Japan). Data processing was performed using the FFFAnalysis program (Postnova Analytics, Landsberg, Germany). A solution of 0.05% Fl-70 (Fisher Scientific, Waltham, MA, USA) was used as the carrier liquid. The sample injection volume was 100 μL. For AsFlFFF the channel flow rate was 1 mL/min and the crossflow (field) rate was 2 mL/min. For SdFFF, the field was 1800 rpm and the channel flow rate was 1 mL/min. For both techniques, the field was reduced by power programming to decrease the run time.
3. Results
3.1. Size Distribution of RCMD Nanoparticles
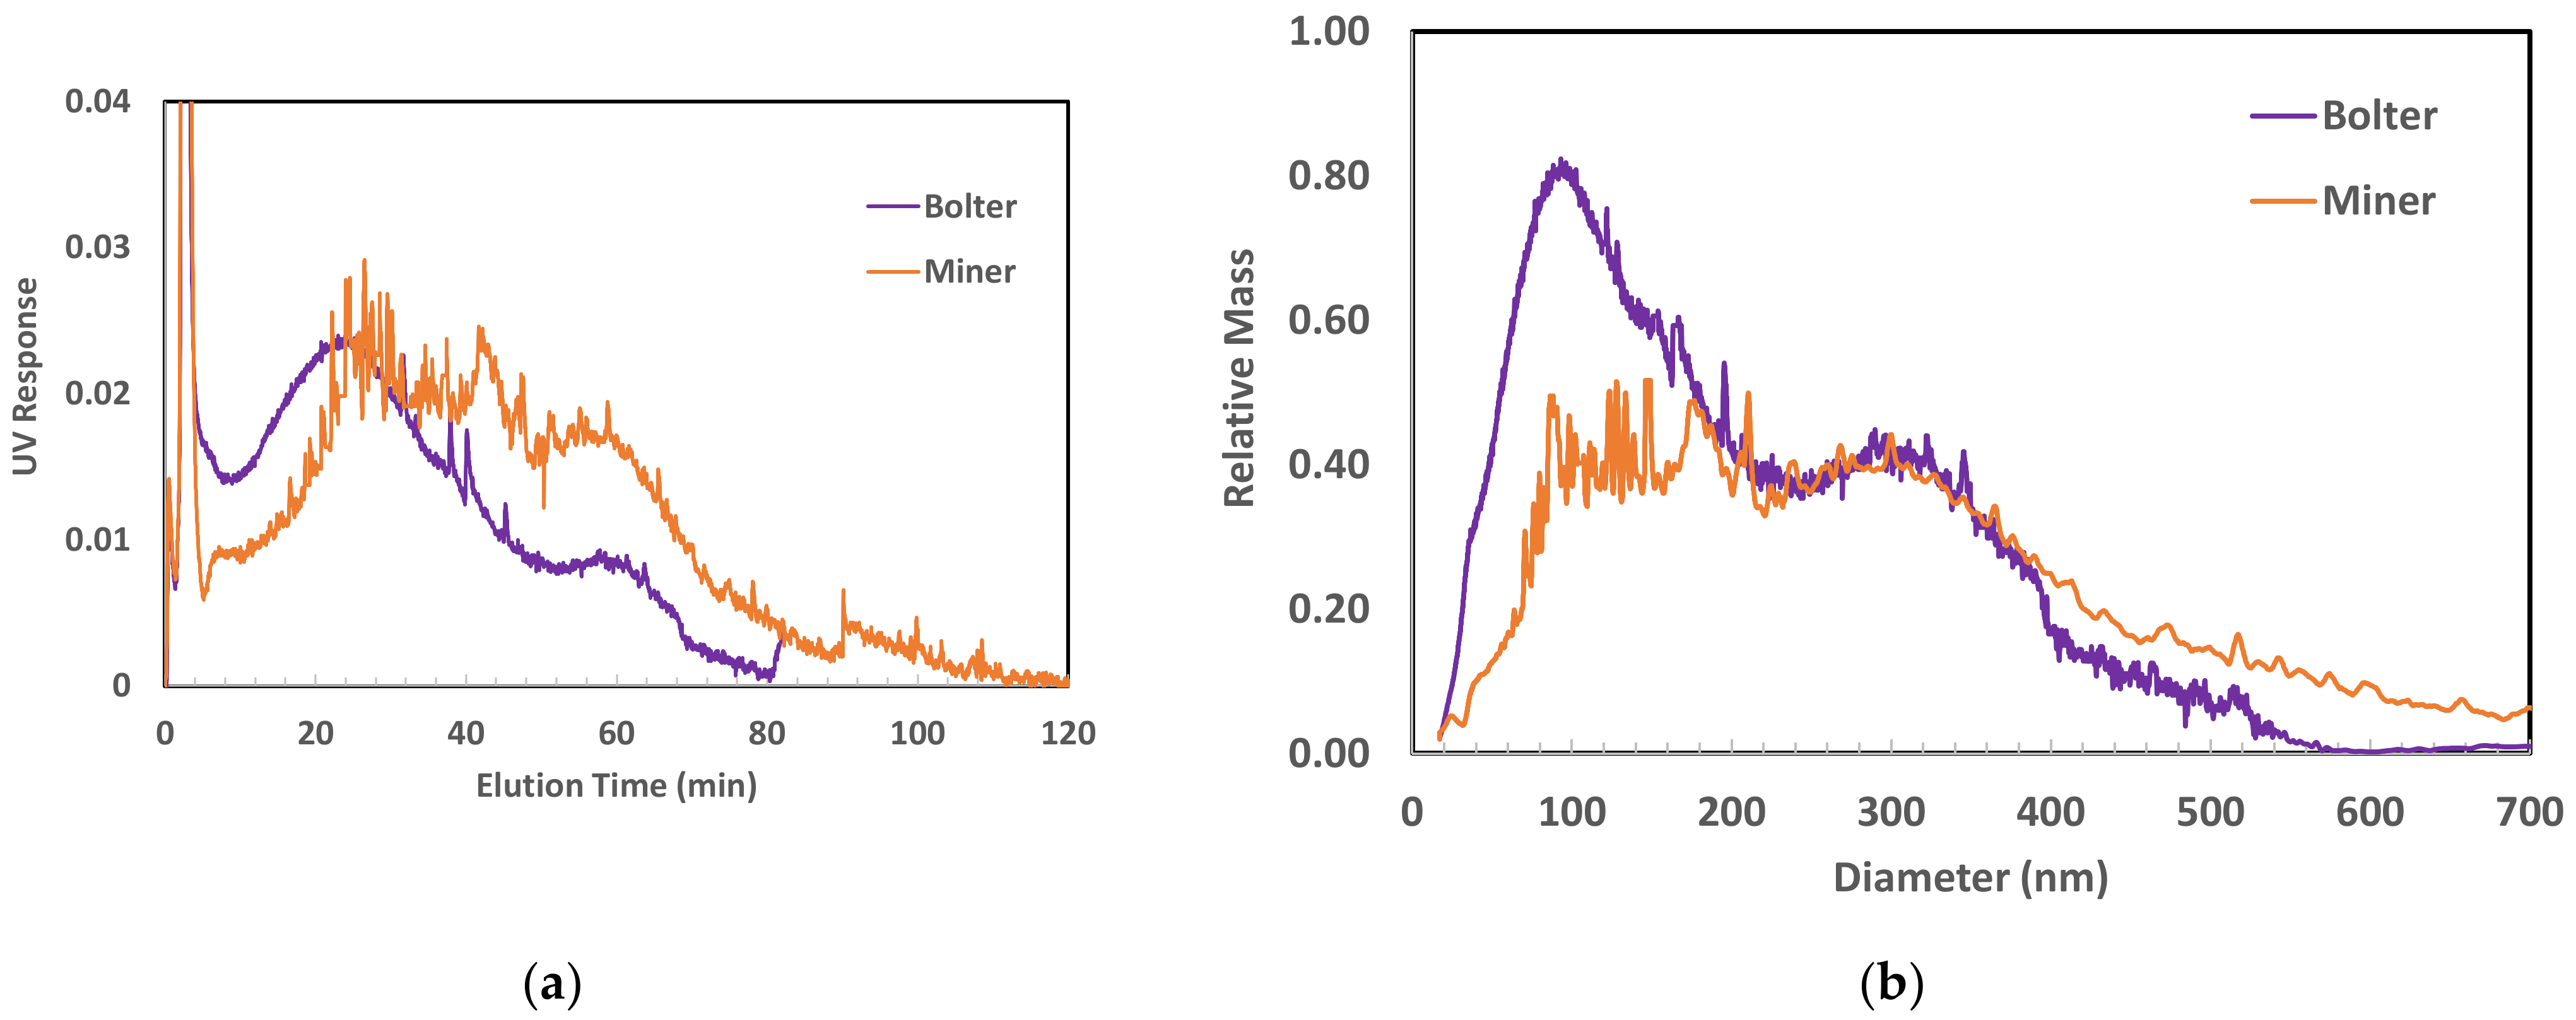
Elution profiles and size distributions of the RCMD samples from the bolter and the miner sites, obtained by SdFFF, are shown in Figure 2. The narrow peak at 2.5 min is called the “void peak” and shows the population of the sample species that were not retained by the applied force. In SdFFF, the applied force is the centrifugal force, and the sample species are separated by their buoyant mass. Therefore, low density carbonaceous materials and mineral particles typically smaller than 30 nm in diameter [25] cannot be retained and will elute with the void peak. The elution profile of both samples showed peaks at around 25 min and 60 min.
Size distributions for the samples analyzed by SdFFF were obtained directly from the elution time, using Equation (1). The size range detected by SdFFFF was about 50–450 nm for the bolter and 60–550 nm for the miner sample, with main peaks around 100 nm and 300 nm. Since the same injection volume was used for both samples, it can be speculated that the bolter sample had a higher population of nanoparticles up to 200 nm in diameter.
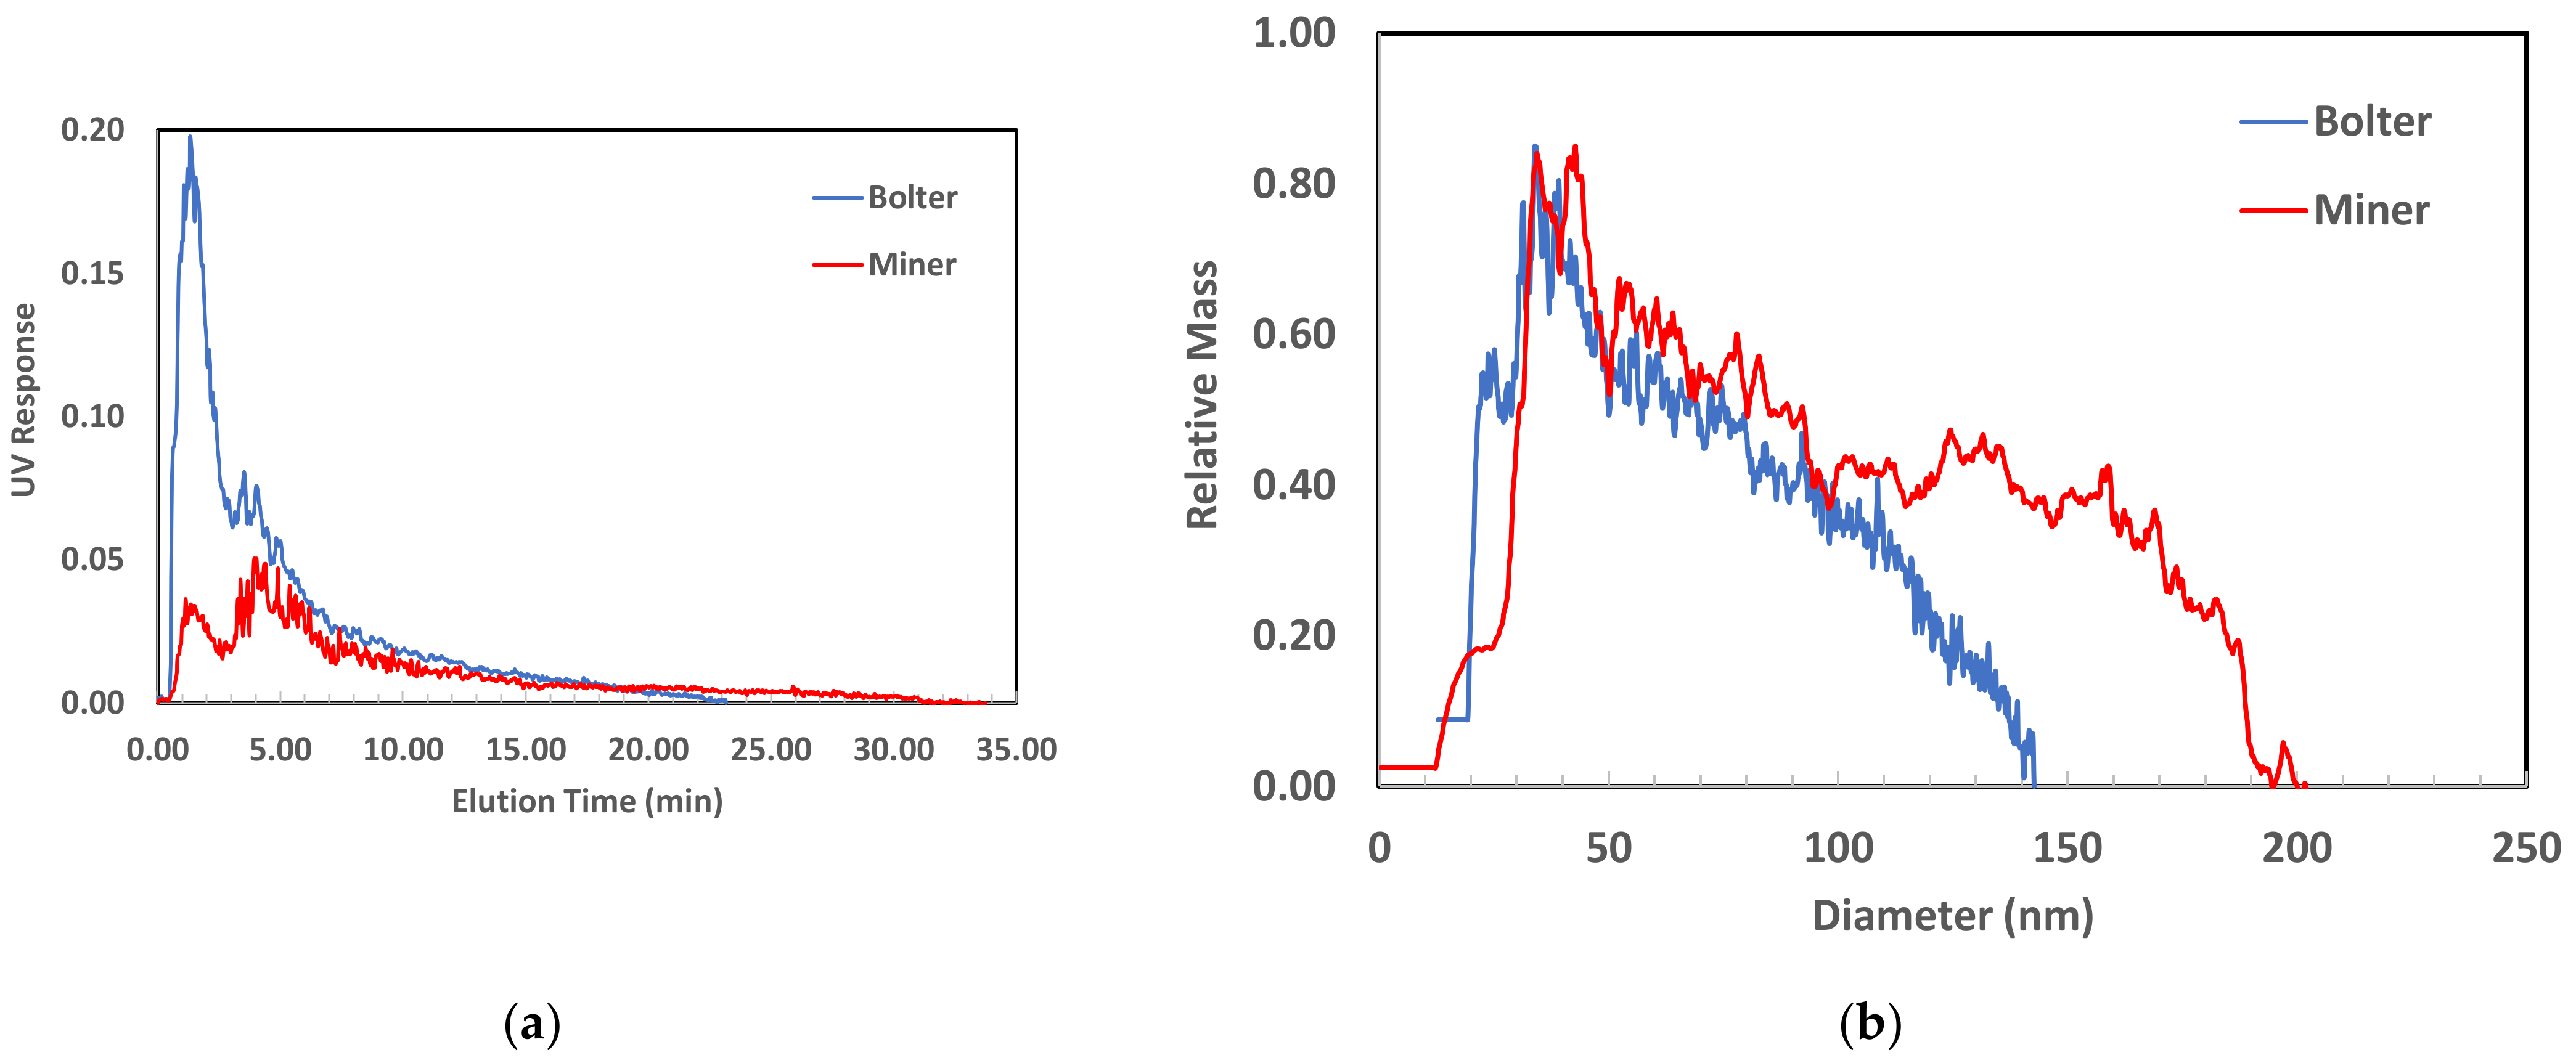
Elution profiles and size distributions of the same samples were also obtained by AsFlFFF (Figure 3). The applied force in AsFlFFF is a crossflow and the particles are separated according to the difference in their diffusion coefficients. Therefore, nanoparticles with smaller size and lower density, that were not retained by the centrifugal field in SdFFF, could be separated by the applied field in AsFlFFF. The elution profile for both samples does not show a void volume, which indicates that most of the smaller nanoparticles were eluted from the channel. However, the elution profiles ended at about 25–30 min, suggesting that the larger nanoparticles might have been retained by the membrane covering the lower part of the channel. Sample recovery in AsFlFFF was examined by analyzing the bolter sample using different injection volumes and measuring the area of the elution profile. When the injection volume doubled, the area under the peak doubled as well (see Figure S3 in Supplementary Materials). Hence, it is possible that the larger particles irreversibly interacted with the membrane inside the channel. This issue will be investigated further to improve the sample recovery. However, the size distributions show that nanoparticles with hydrodynamic diameters between 25–100 nm were separated using AsFlFFF. The size distributions obtained by the two FFF sub techniques clearly complement one another and can be used to characterize both the smaller and larger end of the RCMD nanoparticles.
Size distributions obtained by both techniques show that the RCMD nanoparticles in the sample recovered from the miner site contained slightly larger nanoparticles. This trend was observed for another set of samples analyzed from the same mine [18], and also for a sample recovered from a mine in Eastern USA. The size range of the nanoparticles detected by AsFlFFF was 25–130 nm for the bolter sample and 25–180 nm for the miner sample. The size range detected by SdFFFF was about 50–450 nm for the bolter and 60–550 nm for the miner samples.
The sample from the feeder was analyzed with both AsFlFFF and SdFFF. In both cases, the sample did not show a high enough signal for size analysis. This agrees with our initial analysis that the samples from the feeder did not have as many nanoparticles as samples from the bolter and miner sites.
Future work will use multiple filters for sample collection to increase the signal intensity and improve the quality of the fractograms. More work is also needed to improve sample recovery in the AsFlFFF system. Nevertheless, both techniques are very promising for the analysis of RCMD nanoparticles. The analysis time is also considerably short. A typical AsFlFFF run took about 25 min and an SdFFF run was completed in 90 min.
3.2. Electron Microscopy Images of Bulk and Isolated RCMD Nanoparticles
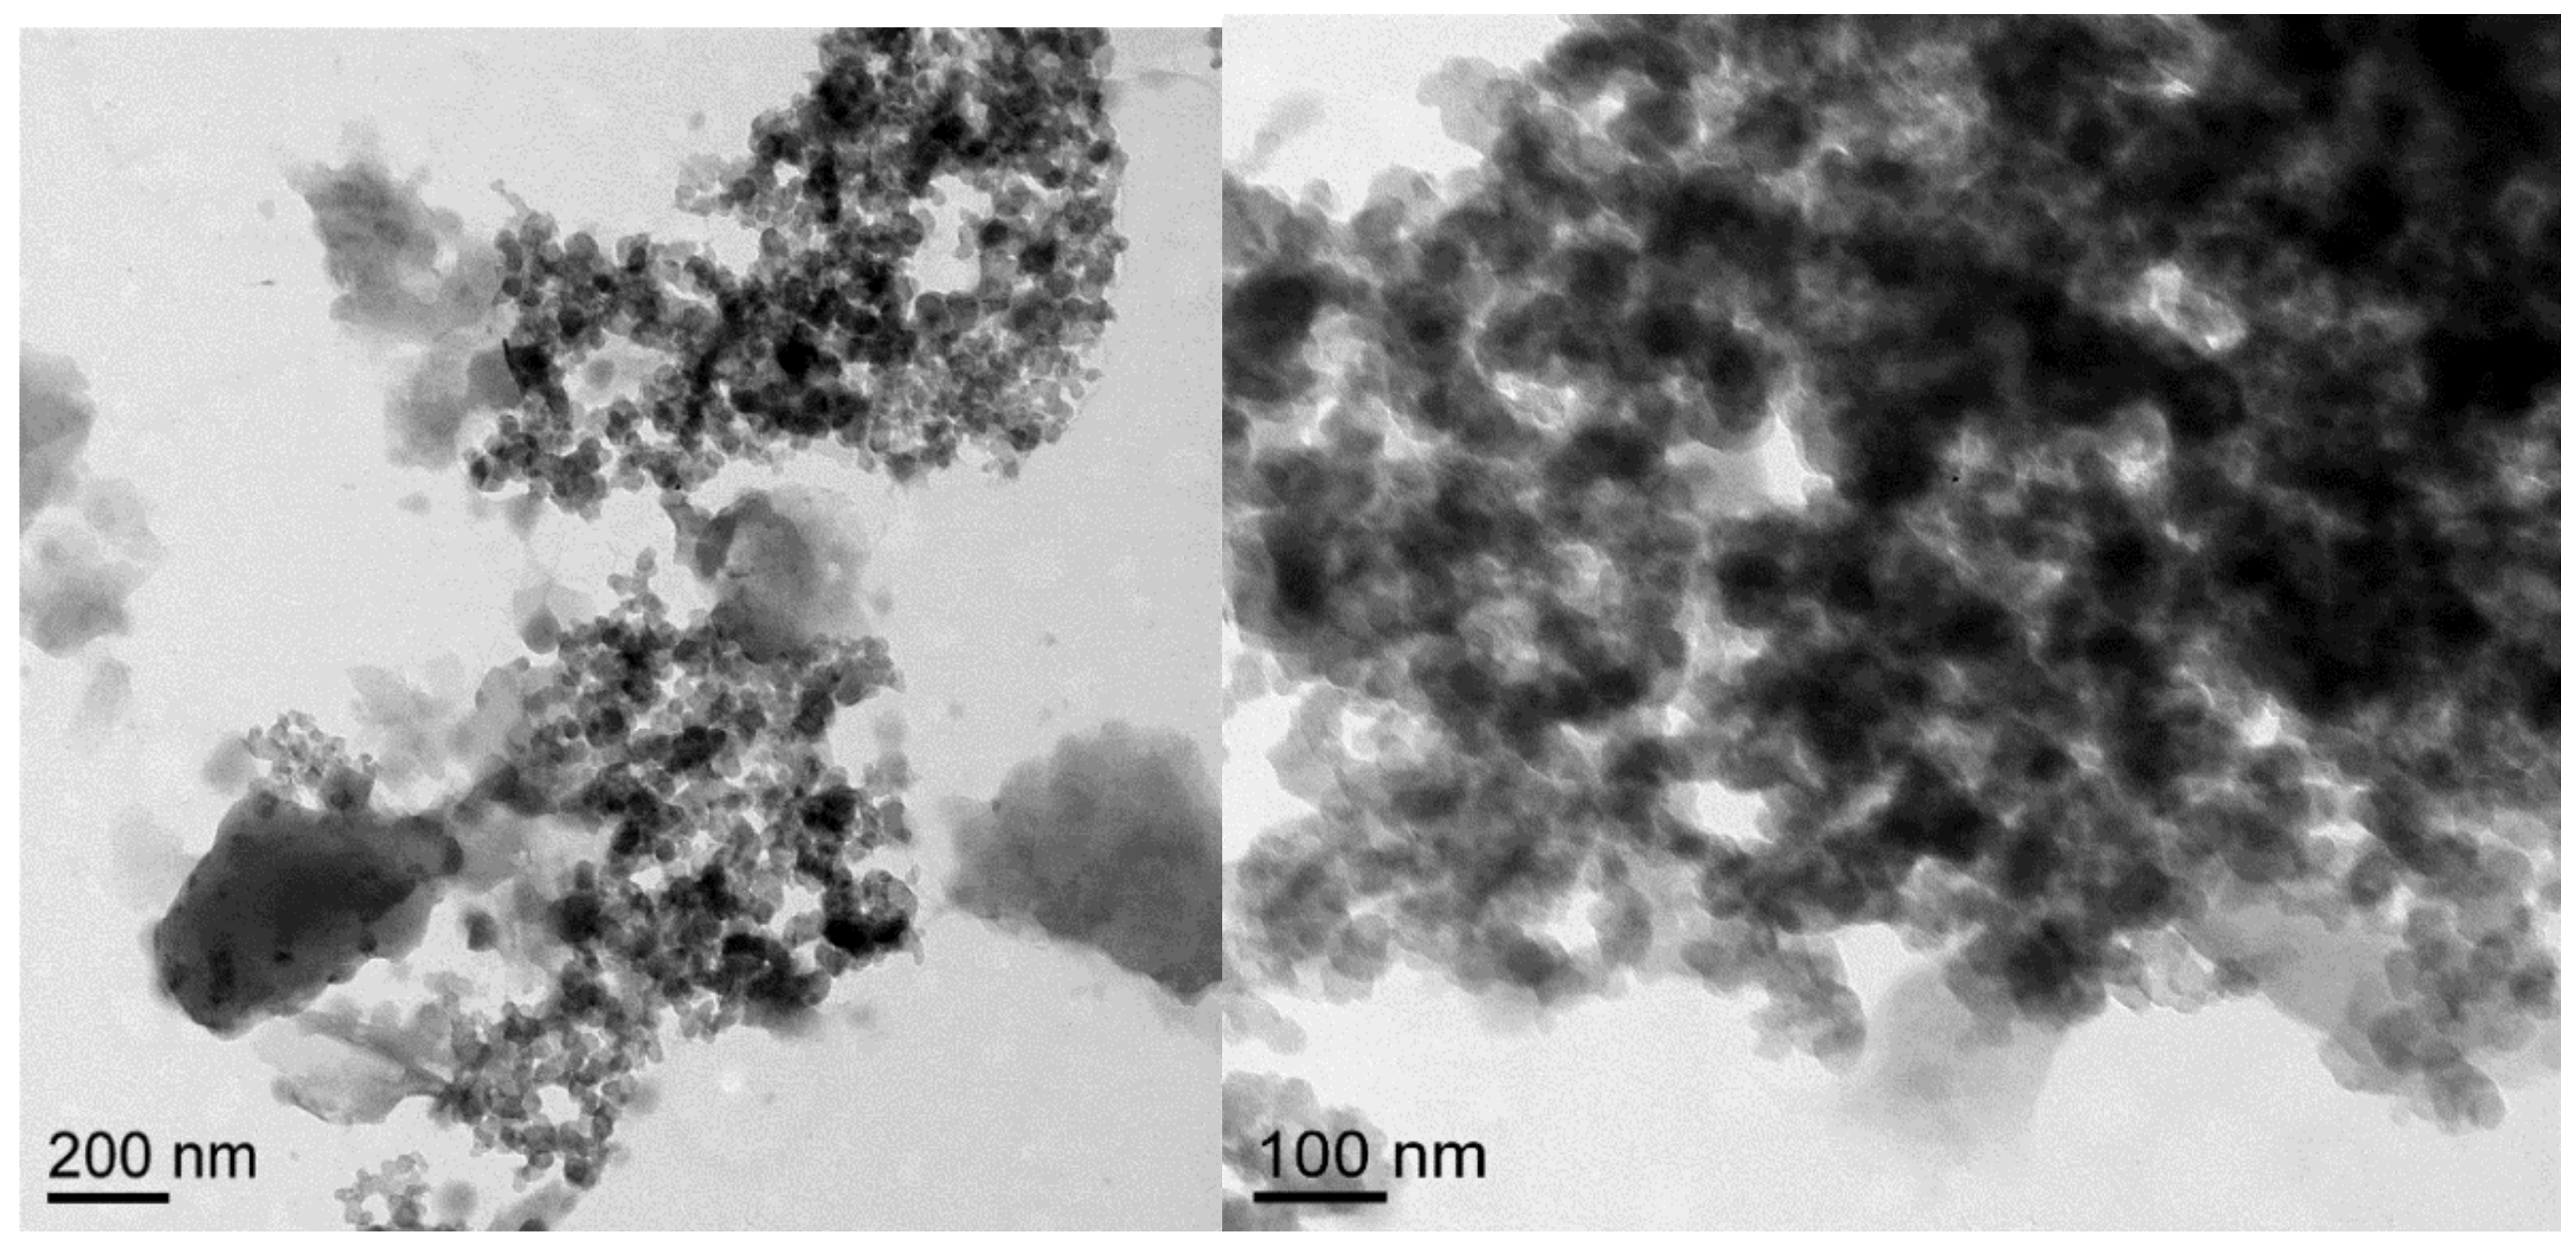
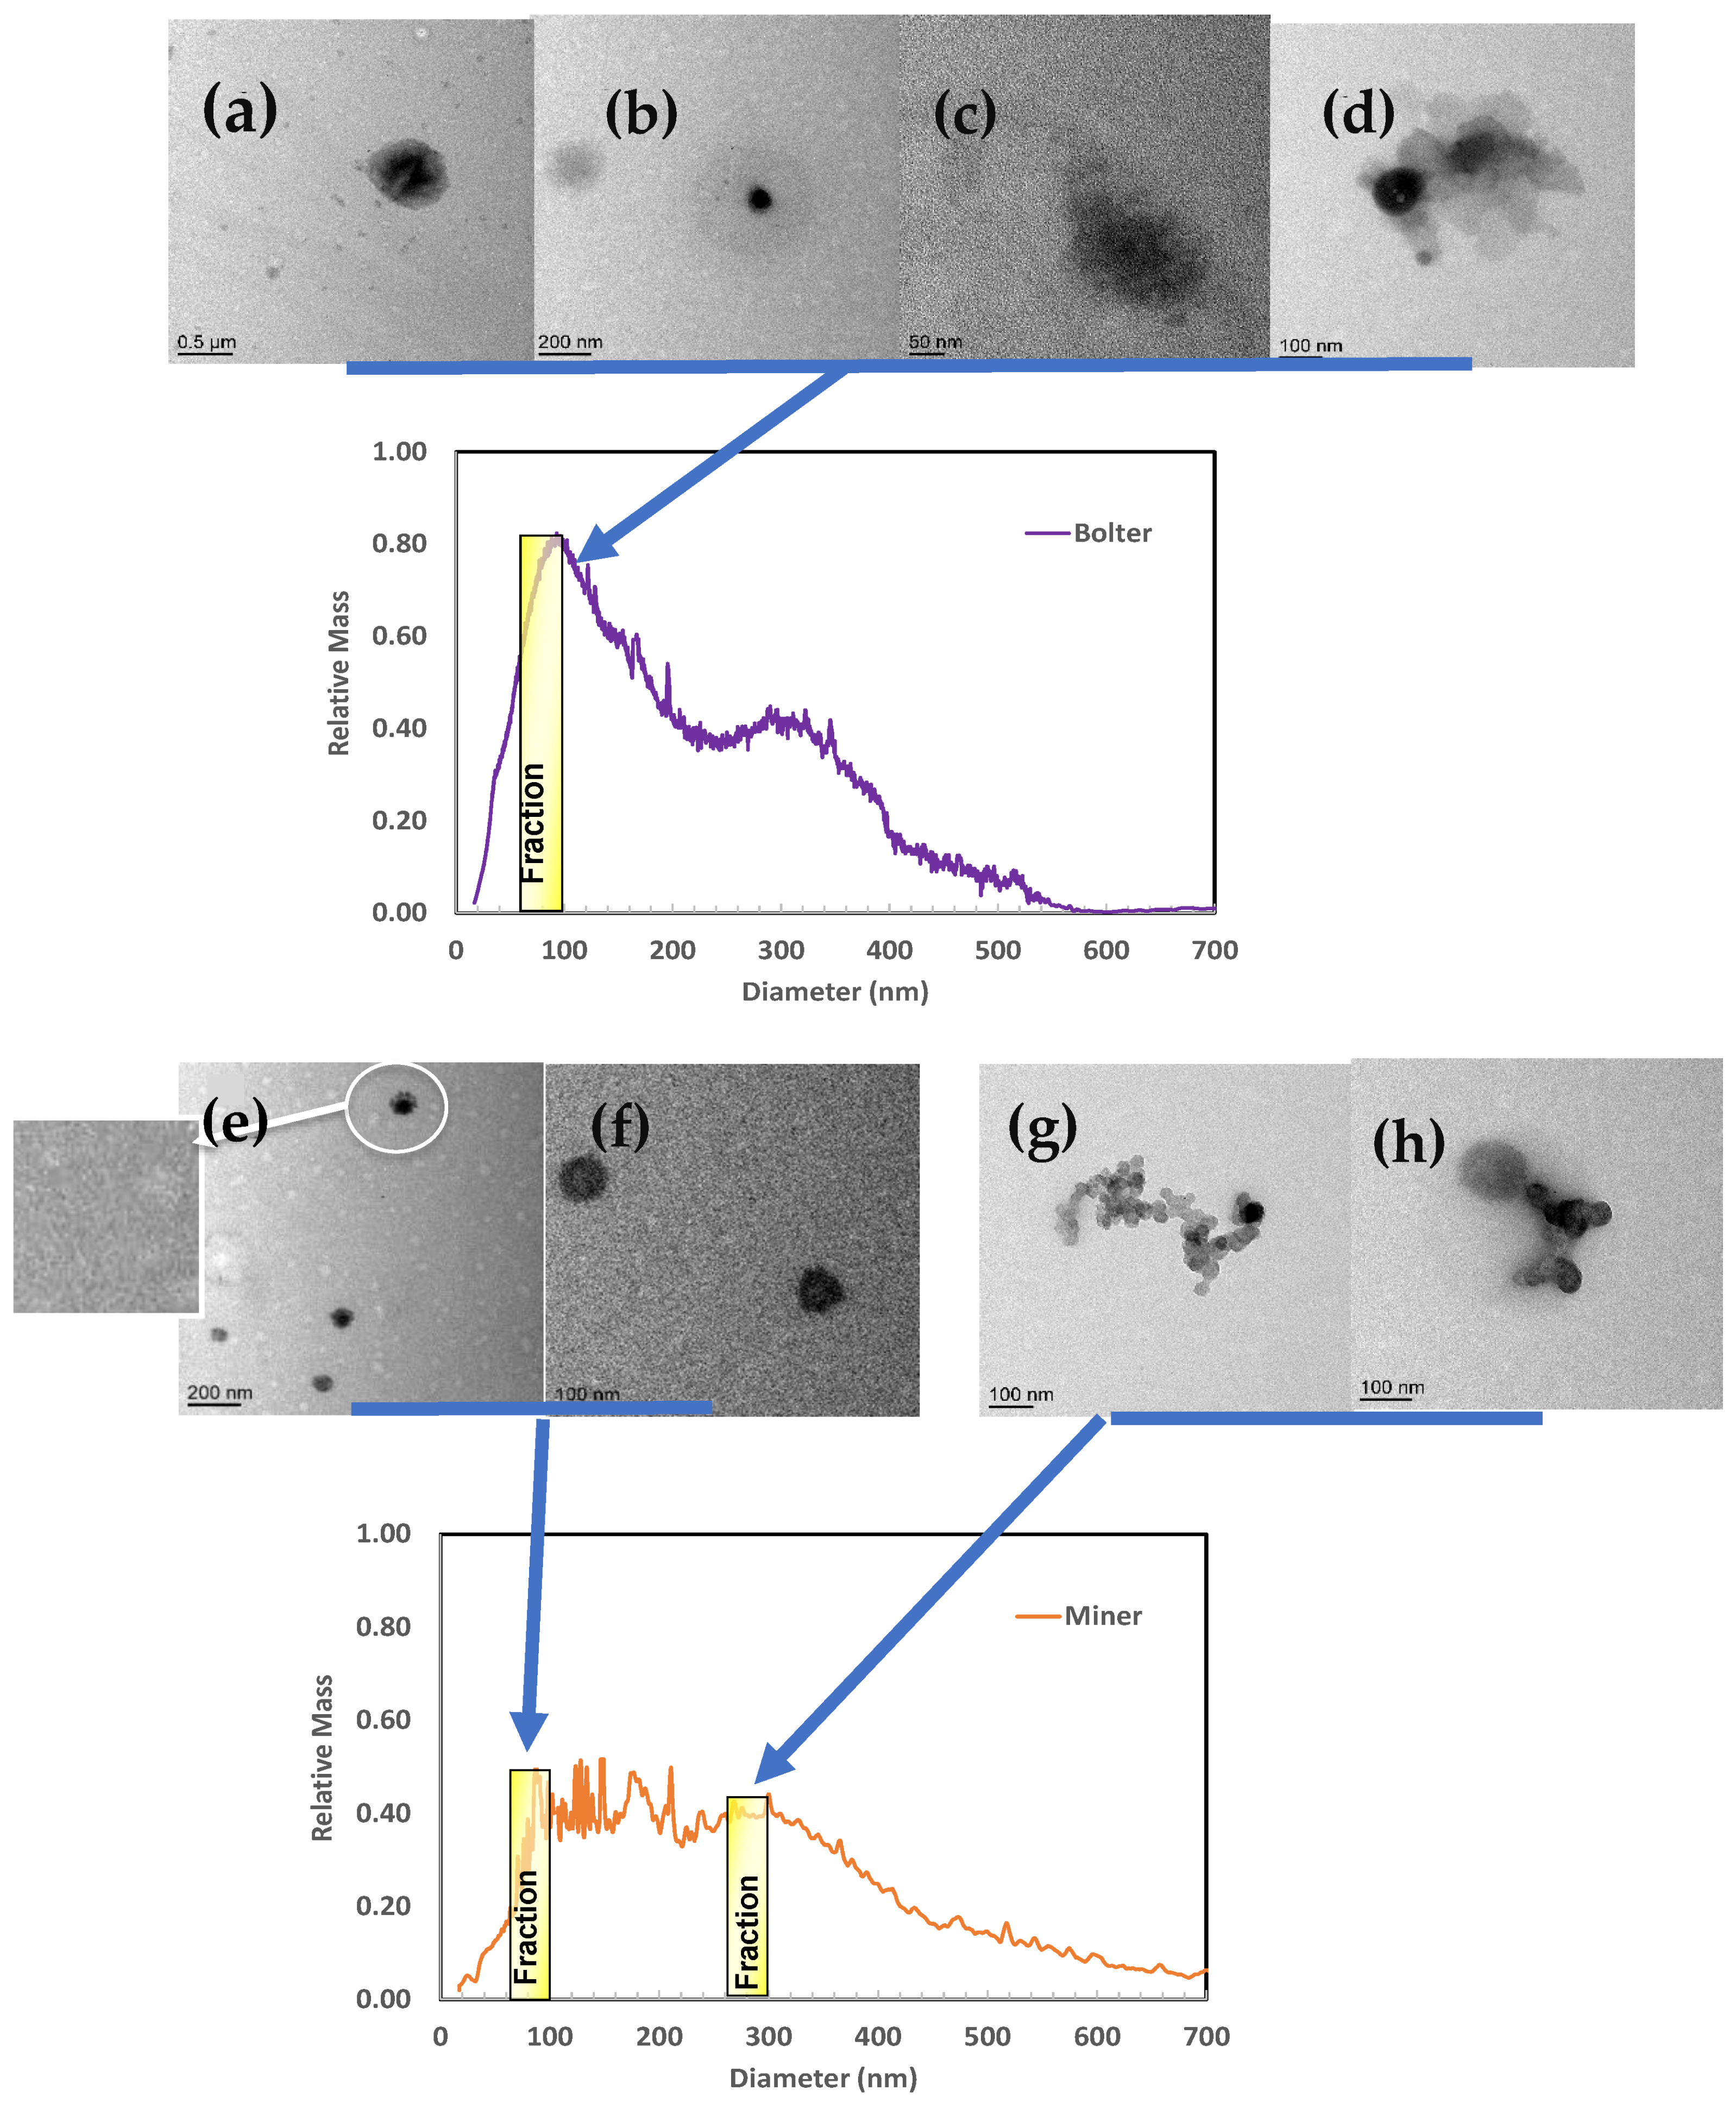
High-resolution TEM images of the bulk RCMD sample from the bolter site after settling out most of the particles with d > 1 μm, and before injection to the FFF channel, are shown in Figure 4. Both images show an abundance of nanoparticles that look like coal or diesel particles, as well as larger, more transparent, and flaky particles that resemble aluminosilicate minerals.
The morphology of the particles isolated in the fractions is very consistent with the TEM images reported in the literature from diesel, coal and mineral particles released during stages of coal burning [27]. The carbonaceous material can be observed in different forms, e.g., the small particles and the inhomogeneous structure with darker and lighter areas in Figure 5a,c, the spherical dark structures in Figure 5b,d–f. The flakey, transparent, and irregularly shaped particles in 5d are aluminosilicates. The aggregate structure in Figure 5g is a soot particle, composed of nanoparticles with diameters of 10–25 nm. The particle in Figure 5h seems to be an aggregate of carbonaceous nanoparticles.
In addition to providing information about the morphology of the individual RCMD particles, size measurements for the isolated particles also confirmed the FFF separation. For the bolter sample, the diameter from FFF was 50–100 nm. The size of the particles from TEM was 40–125 nm (Figure 5a–c). For the miner sample, the size for the first fraction from FFF was 50–100 nm. TEM showed a size of 40–100 nm. The size from the second fraction was 250–300 nm. The longest dimension of the soot aggregate was 340 nm.
Figure 5d shows a large aggregate, with a size of 430 nm, which seems to have been eluted with the smaller particles. This is a special case, called the “steric effect”, when the mean Brownian displacement from the wall is less than the particle radius, due to large size or mass. Therefore, the separation will be controlled by the hydrodynamic lift forces rather than the applied field. This issue will be addressed with improved analysis in future research.
It should also be noted that the size obtained from FFF is either the hydrodynamic diameter (AsFlFFF) or equal spherical diameter (SdFFF) of particles dispersed in a liquid. The diameter obtained from TEM is calculated from the projected area of a dried sample. Therefore, some variations between sizes obtained by different techniques are expected. Nevertheless, measurements obtained by both FFF and TEM are very close and within a few nanometers. Such high-resolution images of RCMD coal particles can be obtained because of the initial separation of nanoparticles by FFF. To the best of our knowledge, these are the first images of isolated RCMD nanoparticles.
3.3. Size-Based Elemental Composition of RCMD Nanoparticles
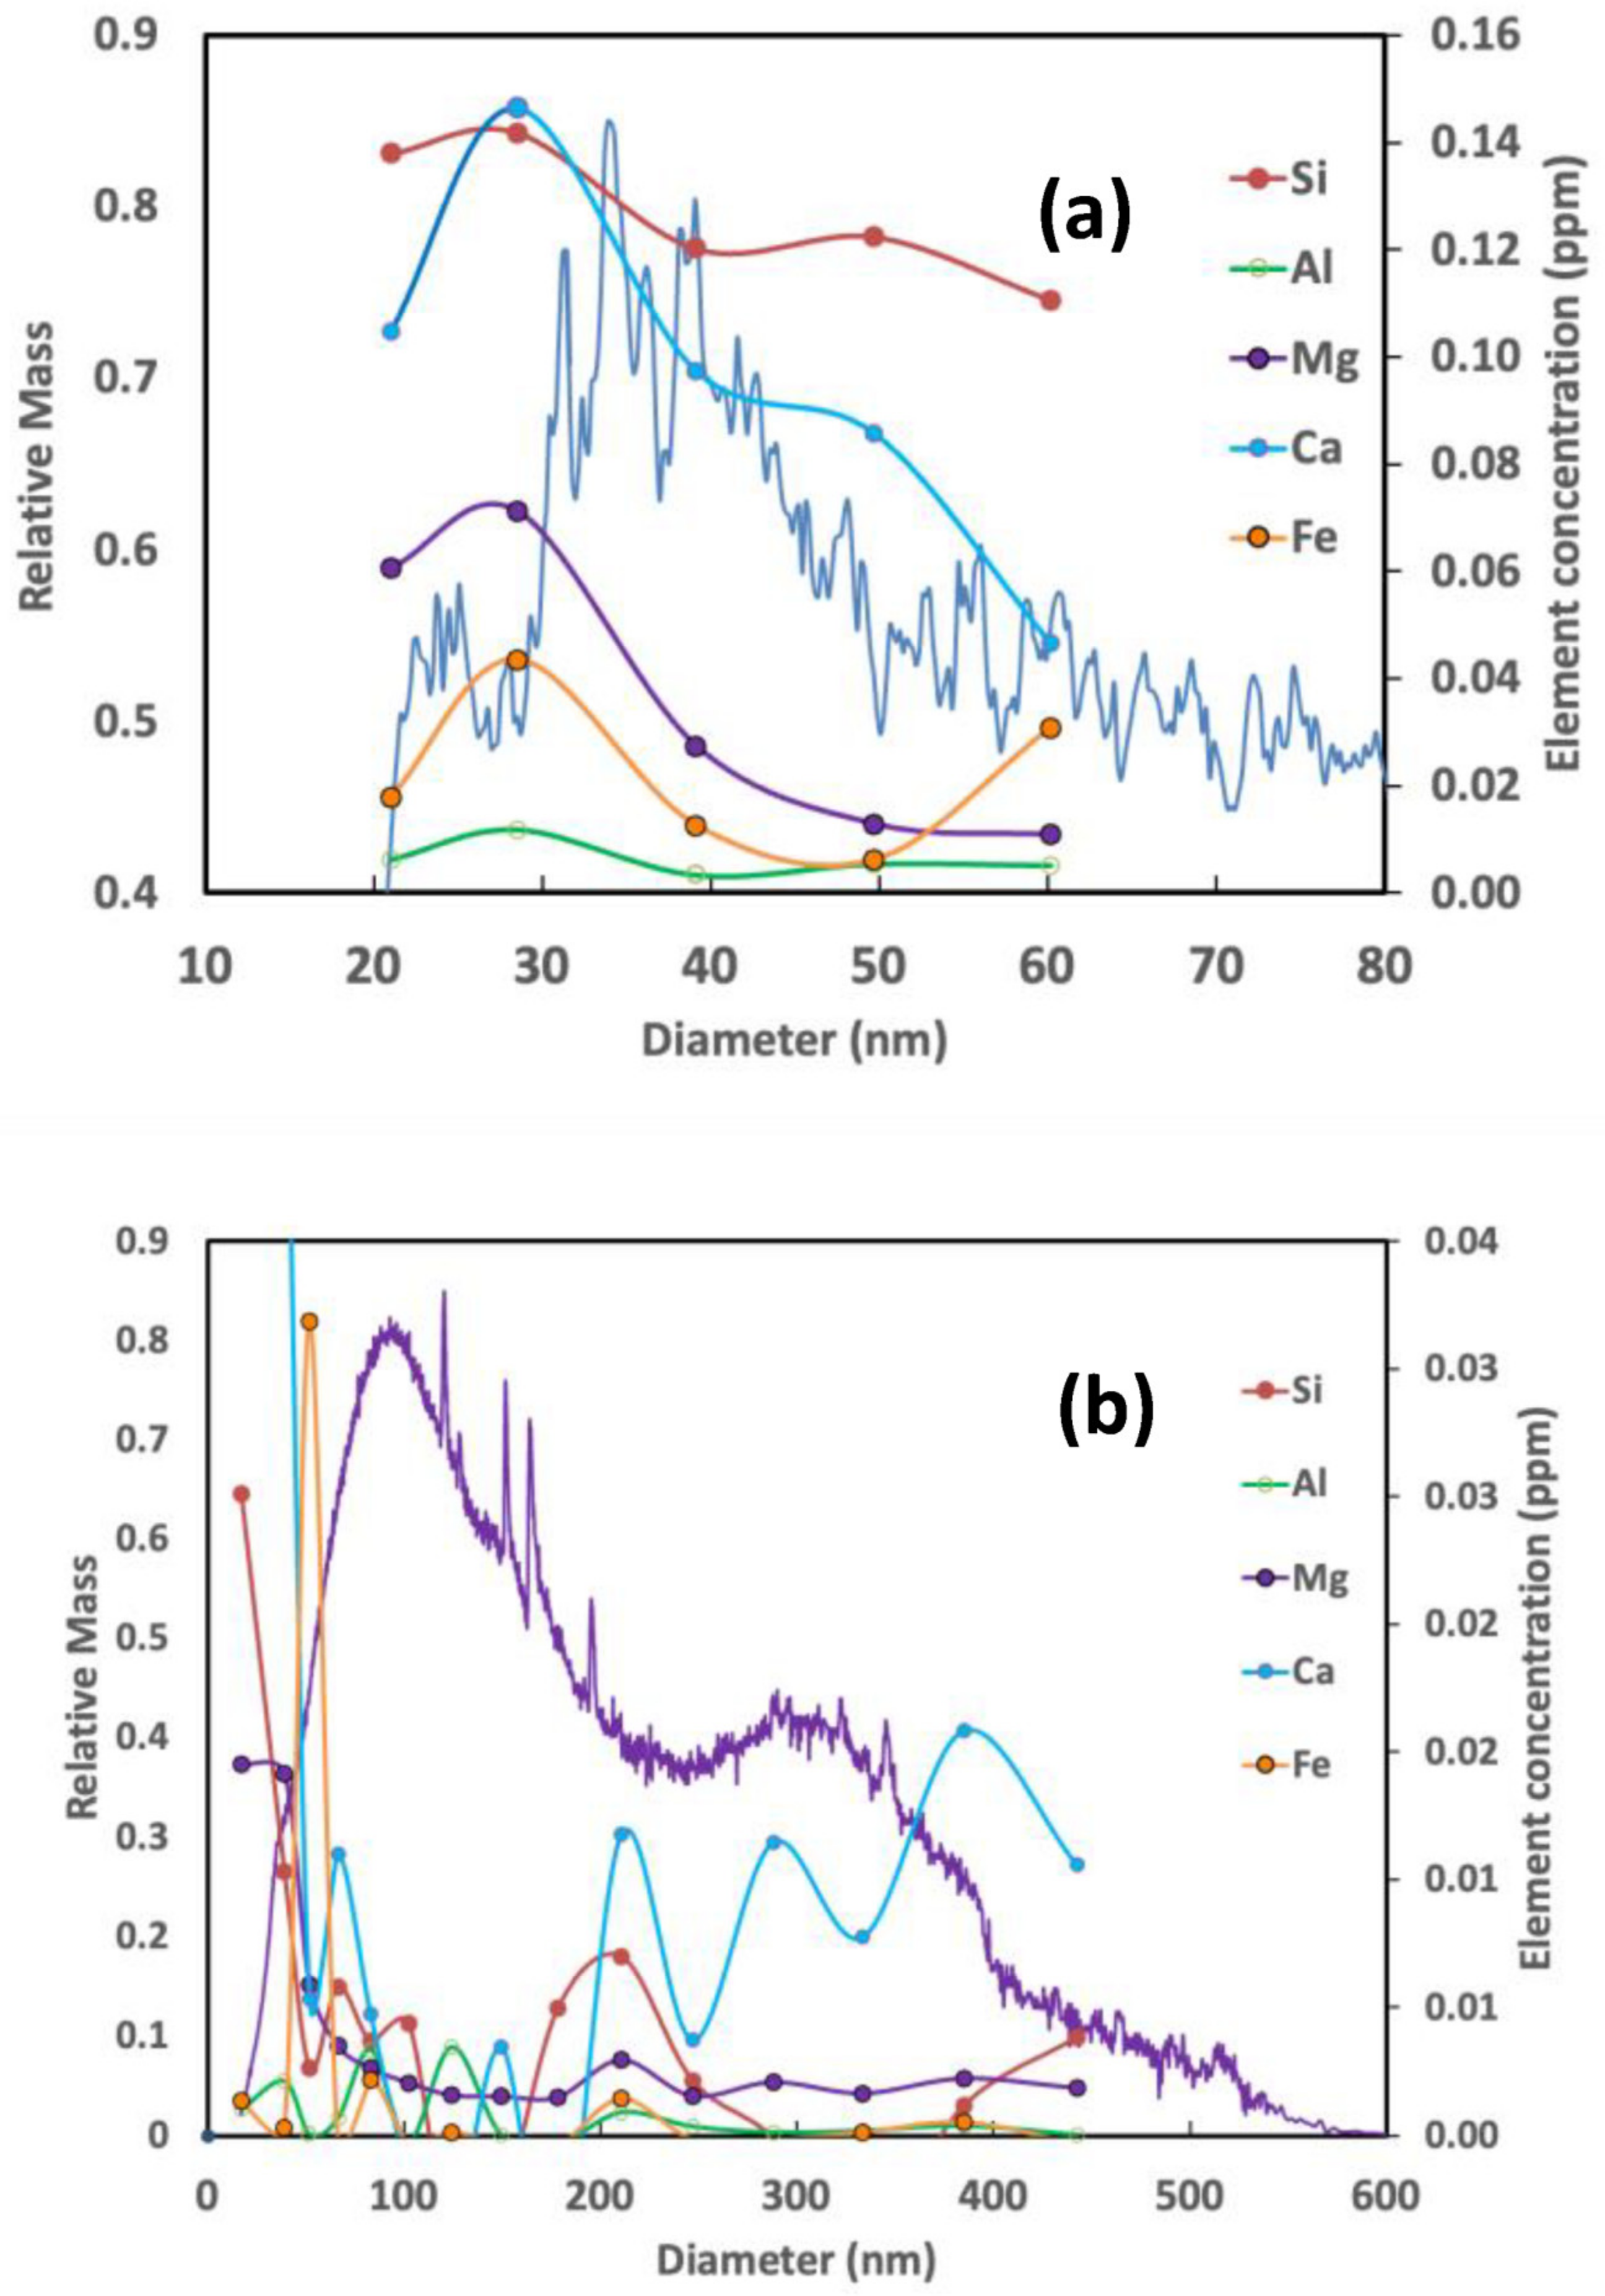
Figure 6a illustrates the size distribution obtained from AsFlFFF (blue line) and the size-based elemental composition for the major elements Si, Al, Ca, Fe and Mg in the RCMD sample from the bolter site. Si seemed to be the most abundant element, followed by Ca and Mg. For particles larger than 40 nm in diameter, Si had a higher concentration than Al. This trend suggests that Si could be associated with Al in clay minerals. In larger particles, Si concentration is much higher than Al, suggesting it is present as unbound silica as well. Ca was the second most abundant element. Ca and Mg showed a similar size distribution trend, following the particle size distribution, which suggests that they might be co-associated with RCMD nanoparticles.
Figure 6b shows the size distribution of the same sample obtained by SdFFF and its size-based elemental composition. Si, Ca and Mg were the three elements with the highest and Al and Fe with the least abundance, analogous to the results obtained by AsFlFFF. For all elements, the concentrations were higher for particles with a diameter smaller than 100 nm, which confirmed the results obtained by AsFlFFF (Figure 6a). The concentration of Ca increased for particles with a diameter over 200 nm. All elements showed an increase in concentration around d~200 nm. This feature needs to be further investigated and confirmed.
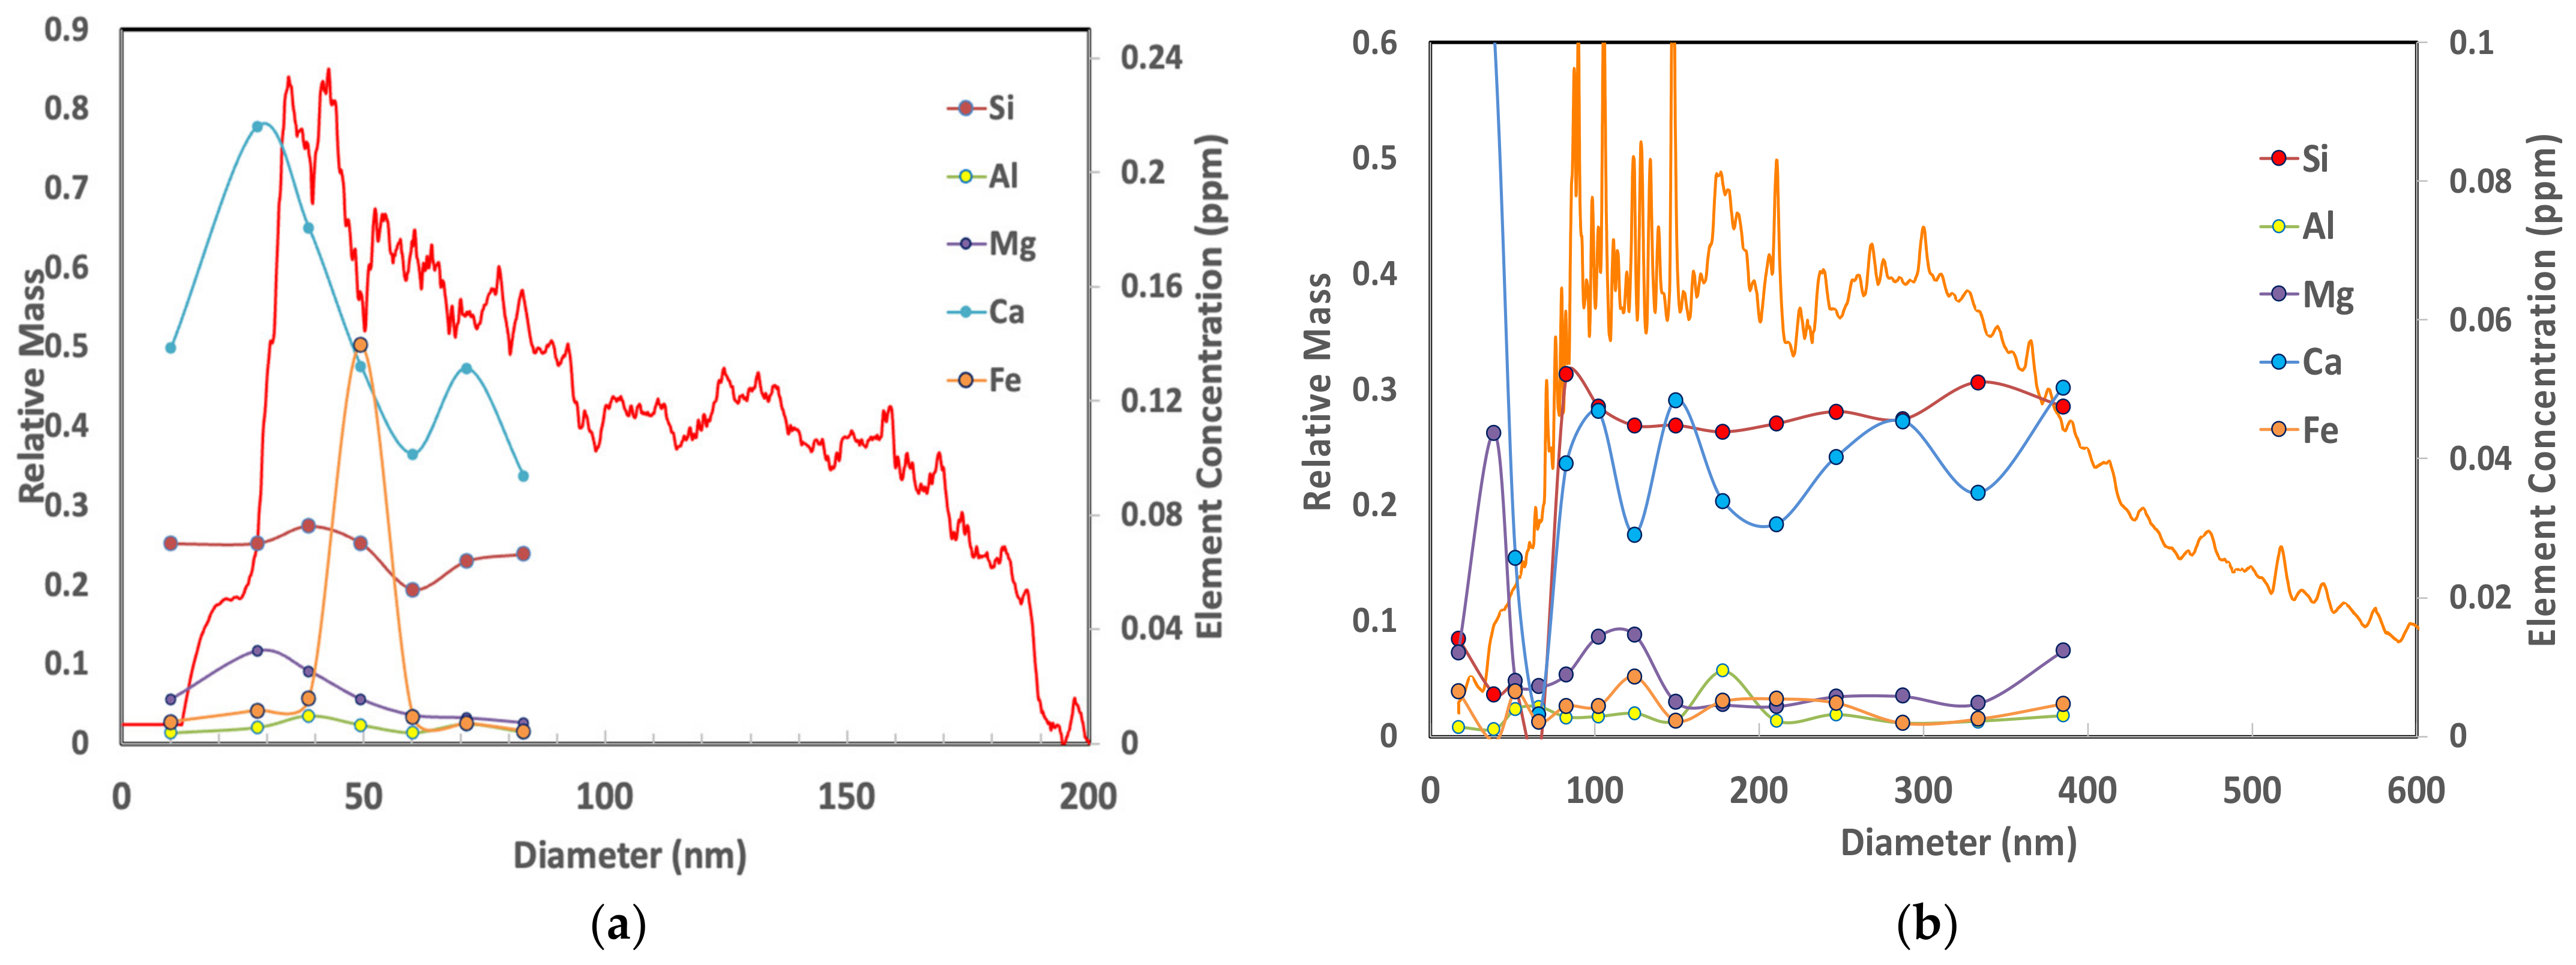
Size-dependent composition of the RCMD sample collected from the miner site is shown in Figure 7, using both AsFlFFF and SdFFF. Similar to the results obtained for the bolter site, Si and Ca were the most abundant elements, followed by Mg.
One interesting phenomenon is the reversal of Ca and Si concentration in the particles below and above 100 nm. The SdFFF data (Figure 7b) shows that in nanoparticles (d < 100 nm) the Ca content is higher relative to Si. The trend reverses after d~100 nm. The data obtained by AsFlFFF for nanoparticles confirms the SdFFF data, showing a relatively higher concentration of Ca in nanoparticles relative to Si. Interestingly, the experiments performed on two separate instruments and using different techniques yielded similar results.
Elemental composition analysis by both AsFlFFF and SdFFF techniques for both sites (Figure 6 and Figure 7) suggest that nanoparticles with d < 80 nm are highly enriched in Si, Ca and Mg. Comparing the relative concentrations and trends of the minerals, it can be suggested that Si could be present as unbound silica (SiO2) or associated with Al in clay particles. Si could also be associated with Ca as tremolite (Ca2Si8O22(OH)2). Mg and Ca might be associated together as dolomite, (Ca, Mg (CO3)2). Extra Ca could have originated from the limestone treatment at the mine surface. It has been known that exposure to silica in both micro and nano size is associated with an increased risk of developing lung diseases such as silicosis, chronic bronchitis, chronic obstructive pulmonary disease, emphysema, pulmonary tuberculosis, and even lung cancer in some studies [28]. Therefore, the high concentration of Si in the nanometer size range, its different formations (bound or crystalline), and its contributions to the toxicity of RCMD need further exploration.
The relatively higher concentrations of Ca, Mg and Fe in the particles with a hydrodynamic diameter smaller than 30 nm are of particular interest. We have shown previously that the adsorption of cations to smaller particles can increase their surface charge [29]. The abundance of cations in RCMD particles smaller than 30 nm suggests that these particles can be highly charged and may exacerbate the toxicological effects of RCMD.
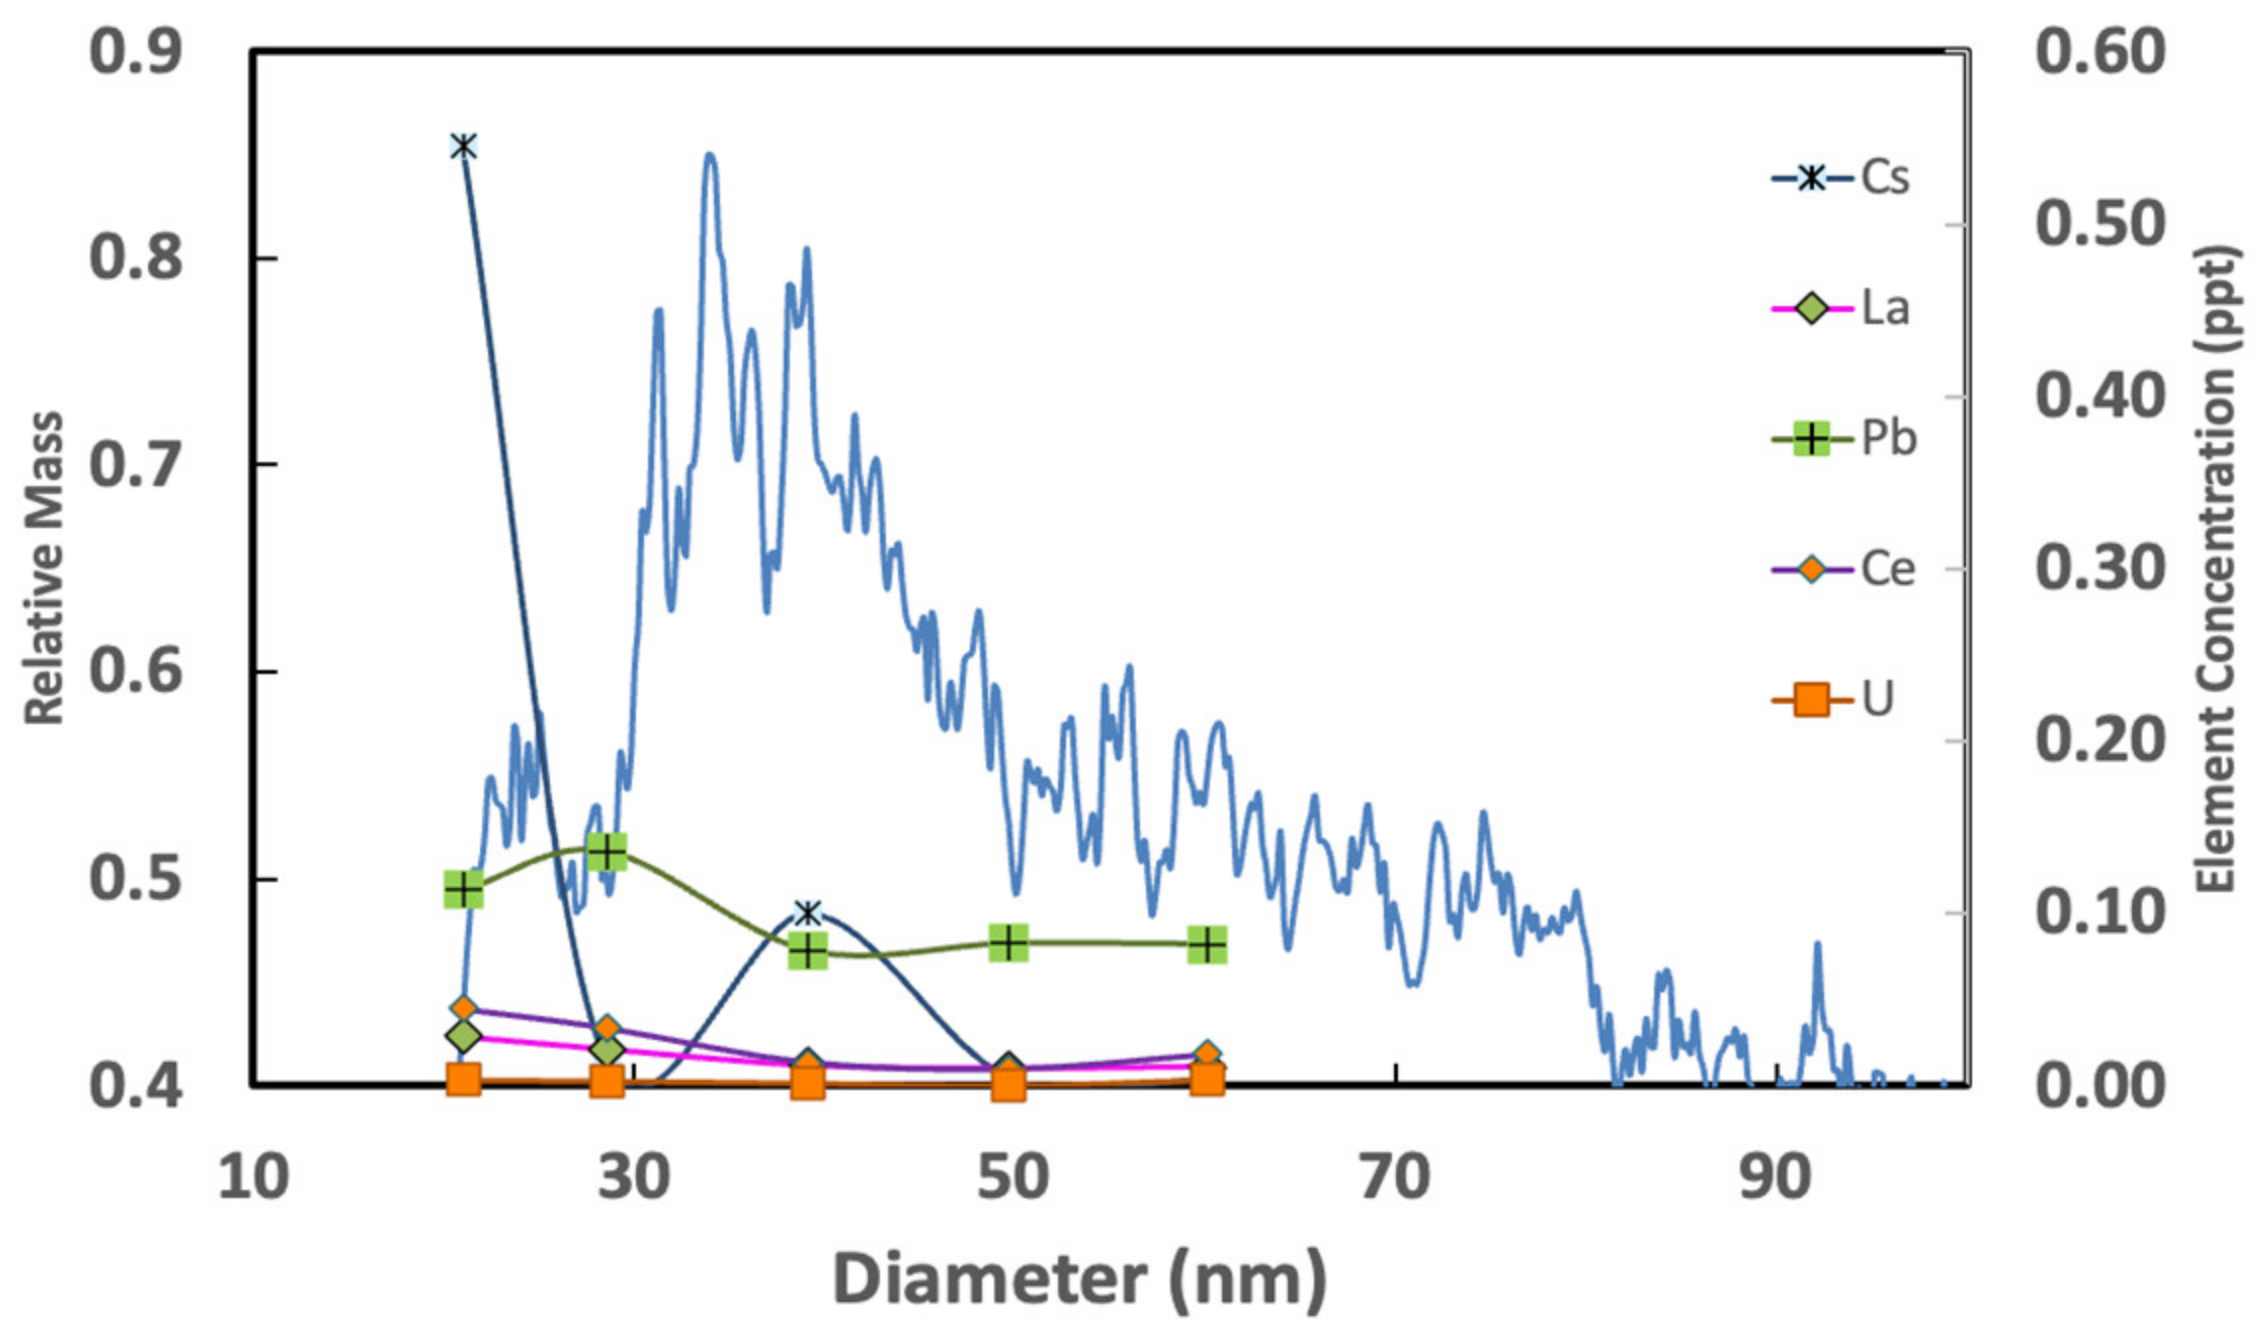
Size-dependent concentration of trace elements Cs, La, Pb, Y, Ce and U in particles with d ≤ 60 nm in the bolter sample are shown in Figure 8. The size distribution was obtained by AsFlFFF (blue line). The relative concentrations of these elements were very low; therefore, they were not analyzed by SdFFF for this sample. The concentrations of Hg and As in all size fractions were below the detection limit of the instrument (0.001 ppt for Hg and 0.002 ppt for As).
Figure 8 shows that among the analyzed elements, Cs and Pb had the highest concentrations. Based on the graph, it can be speculated that Cs is highly associated with particles having a diameter of less than 30 nm. Pb seemed to be adsorbed to the surface as the concentration was decreased with an increase in the particle size. It is also possible that Pb is associated with different types of particles (carbon vs. clay). Ce, Y, La and U were also present in the fractions.
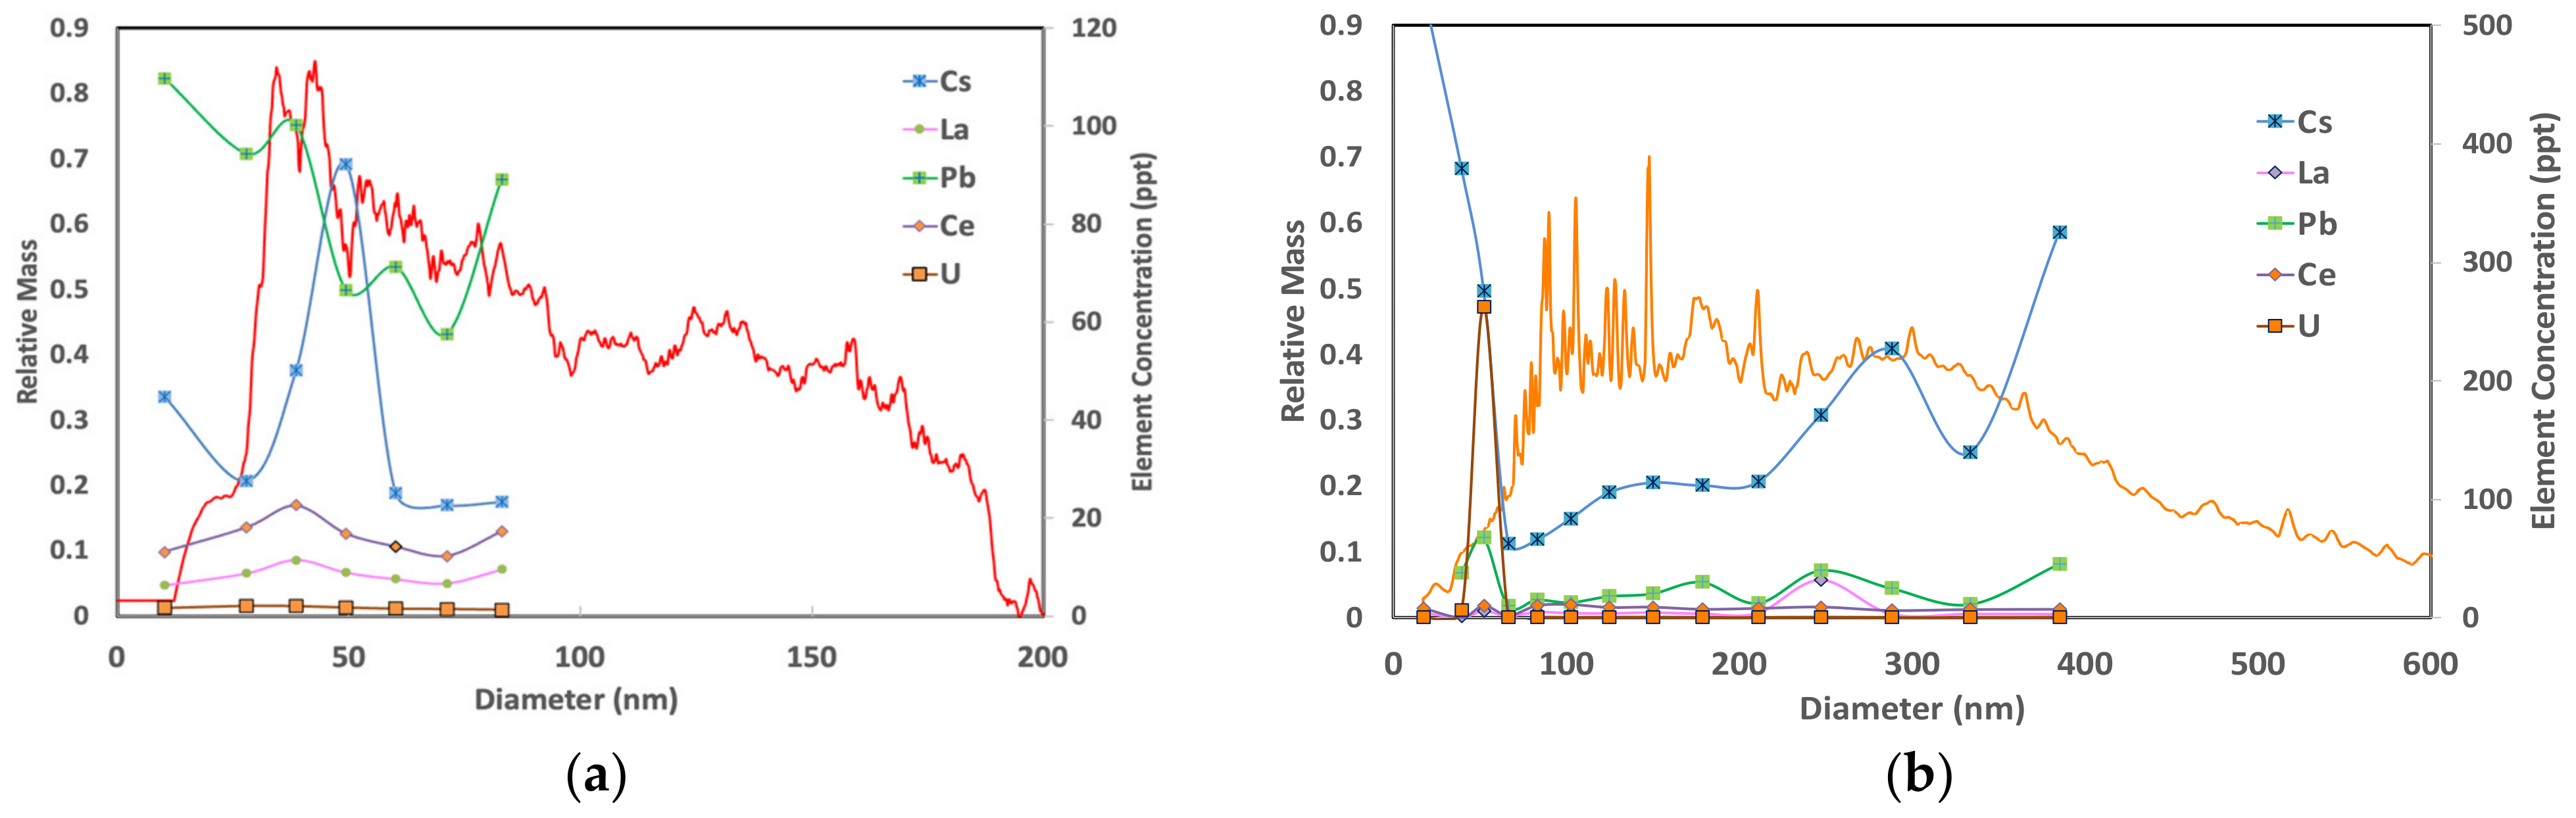
The size-dependent concentration of trace elements Cs, La, Pb, Ce and U, obtained from SdFFF and AsFlFFF in the miner samples are shown in Figure 9. The orange and red lines show the UV response (size distribution). Cs and Pb concentrations were relatively higher than all other trace elements, which is comparable to the trend observed for the bolter sample.
Comparison of the Cs and Pb concentrations obtained by SdFFF and AsFlFFF at the nanoparticle level illustrates another interesting feature. As mentioned before, in AsFlFFF the accumulation wall is covered by an ultrafiltration membrane. Nanoparticles are mostly retained in the channel due to the pore size and charge of the ultrafiltration membrane. However, ions can pass through the membrane and might not be detected. In SdFFF, there is no membrane, and the accumulation wall is stainless steel. Ionic species cannot be retained by the field, but they will end up in the void peak and can be detected by ICP-MS. Data shows that at particles below 100 nm, Cs has a higher concentration than Pb. However, the AsFlFFF data presents a higher concentration of Pb relative to Cs. This suggests that Cs in RCMD particles could be present mainly in the ionic and soluble form and the Cs ions have probably passed through the ultrafiltration membrane that covers the accumulation wall in AsFlFFF.
Size-based elemental composition of the RCMD samples collected from two sites in the same mine can be compared for trends. It appears that the concentration of Si were relatively high (especially compared to Al) in nanoparticles for both sites, leading to the possibility that some of the Si might be present in RCMD in crystalline form. The miner site results showed very high concentrations of Ca and Si even for particles up to 400 nm. This can be related to the release of free silicate and limestone during mining operations. A comparison of the trace element analysis between the miner and bolter samples shows very high concentrations of Cs and Pb in both sites. U, Ce, and La were present at both sites as well.
The literature on the concentration of trace elements in coal is extremely rare. An extensive work by Sarver et al. [5], covered the elemental and morphological analysis of RCMD particles in the size range of 100 nm < d < 10 μm from eight mines in northern and central Appalachia. Their results showed a strong correlation between very fine carbon particles (d < 400 nm), and metals such as Zn, Cu, Ni, Cr. The authors concluded that many of the particles in the “very fine range”, including metals, originate from diesel exhaust in the mines. Our AsFlFFF and TEM results also showed a high concentration of nanoparticles in the size range below 30 nm. Moreno et al. [30] reported a higher ratio of Al to Mg, Ca, and Fe for coal mine dust from Slovenia. Our results indicated a lower concentration of Al compared to Mg, Ca, Fe, and Si along the size distribution. These outcomes should be compared only qualitatively, since the techniques and the sample size, as well as the analysis methods, were quite different.
Coal Clarke values [31] estimates the average concentration of trace metals in coal in the sequence: Ce > La >> Pb > Cs, U, whereas our ICP-MS analyses of individual fractions of RCMD nanoparticles showed a higher concentration of Pb relative to Cs within the size distribution. The Clarke values are obtained by meticulous calculations of data obtained from numerous sites all around the world for bulk coal and sedimentary rocks, whereas the ICP-MS data obtained in this study is specific to RCMD nanoparticles within the analyzed size fraction. However, studies showed that concentrations of nanoparticles in coal and coal combustion products can vary by location and size [5,30,32]. Moreno et al. [30] showed that Pb had a higher concentration in the fraction d < 2.5 μm, followed by Ce and La, and found a low concentration for Cs. In the study by Lu et al. [32], metal analysis of narrow size fractions of coal combustion showed a difference between the concentrations of the metals in PM1–10 and PM1. Al, Pb and Ca had higher concentration in PM1, compared to PM1–10. Lin et al. [33], reported a higher concentration for several metals in the nanoparticle fraction relative to the coarse fraction for particles collected alongside a high traffic road.
Metals in RCMD nanoparticles can contribute significantly to the toxicological effects of RCMD. Transition metal elements such as Fe have been associated with the release of free radicals and their concentrations in RCMD nanoparticles should be monitored carefully [34]. In addition, metal ions adsorbed to surfaces of nanoparticles in RCMD can alter the surface charge of their host nanoparticles, and increase the ability of inhaled RCMD nanoparticles to bind to negatively charged proteins and cell membrane, causing oxidative stress. The higher relative concentration of Pb, a well-known neurotoxin, in RCMD nanoparticles warrants further investigation. Accumulation of Pb in the body can result in severe brain damage, kidney failure, and damage to the reproductive system. The small size and high quantity of metals in RCMD nanoparticles can have serious implications for the health and safety of coal miners. Special attention should also be given to the forms of Si in the nanoparticle fraction of RCMD, and specifically, how aggregation or the increased specific surface area affects its toxicity. Laboratory studies on human bronchial epithelial cells have shown that surface area of silica can be an important parameter in triggering oxidative stress responses [35].
4. Conclusions
RCMD nanoparticles were sampled from different sites of an underground mine in the Western United States. Samples were separated by size, and narrow size fractions were analyzed for morphology and elemental composition using two field-flow fractionation techniques. The presented preliminary results demonstrated the complex nature of RCMD nanoparticles and provided an insight into the potential toxicity of nanoparticles in coal mine dust.
Nanoparticles in the forms of carbonaceous particles, clay minerals, diesel particles, and aggregates were isolated and observed in the RCMD samples. Elemental composition analysis showed that nanoparticles in RCMD could be carriers of toxic elements such as Fe, Pb, U, and Cs. More work is in progress to improve the isolation procedure and the FFF methodologies to provide quantitative elemental concentration data.
Toxicological effects of nanoparticles have been studied for many years. It has been proposed that nanoparticles can be responsible for much of the toxicity of PM10 particles [8]. Studies on the mechanisms of lung injury of PM10, (d < 10 μm) particles suggested that the ultrafine part (PM0.1, d < 100 nm) and transition elements are the major components that cause oxidative stress, and that the ultrafine particles caused three times more inflammation when equal masses of carbon black with both size fractions were instilled into the lungs of rats [8]. Other studies have also shown the elevated toxicology of engineered nanoparticles relative to micron-sized particles. In addition to the lung injury and CWP, translocation of nanoparticles and harm to vital organs such as liver, spleen, kidney, and brain are other debilitating effects of RCMD nanoparticles. It is important to understand how much of the RCMD toxicity is associated with RCMD nanoparticles. Further research on the toxicity of separate size fractions of RCMD, should help segregate the effects of nano and micron-sized particles on the health of coal miners. The effectiveness of such studies will depend on the efficiency of separation of discrete size fractions. A complete understanding of the surface properties of RCMD nanoparticles is also important. It is well documented that apart from size, the large specific surface area, surface charge, aggregation state, and morphology of nanoparticles contribute to their reactivity and potential toxicity.
RCMD toxicity has been measured mainly in terms of mass and exposure length. These two metrics clearly do not reflect the toxicity posed by nanoparticles considering their negligible mass. The present research along with other research in the literature clearly demonstrates that the toxicity of nanoparticles could play a major part in the adverse effects of RCMD inhalation. Inclusion of nanoparticle toxicity studies in the hazard assessment of RCMD particles could provide an insight into the increase observed in CWP occurrences. Perhaps as a first step, “mass” can be replaced by “surface area/mass” as an RCMD toxicity metric.
Supplementary Materials
The following supporting information can be downloaded at: https://www.mdpi.com/article/10.3390/min13010097/s1, Figure S1: Schematic diagram of particle separation in an FFF channel; Figure S2: Channel designs in Sedimentation FFF (SdFFF) and Asymmetrical Flow FFF (AsFlFFF); Figure S3: Comparison of injection volumes in AsFlFFF for the bolter sample.
Author Contributions
Methodology, experimental and original draft preparation S.A.; review and editing, S.A., L.P., X.W., T.A. and J.D.M.; project administration, L.P.; funding acquisition, L.P., X.W., S.A. and J.D.M. All authors have read and agreed to the published version of the manuscript.
Funding
This research was funded by the National Institute for Occupational Safety and Health (NIOSH), grant number 75D30119C05527.
Acknowledgments
The authors would like to acknowledge the financial support from the National Institute for Occupational Safety and Health (NIOSH). The authors would also like to thank Randy Reed, at NIOSH as well as Soheyl Tadjiki at Postnova Analytics USA for valuable and helpful discussion throughout the project. The authors would also like to acknowledge the help of Diego Fernandez, at the Department of Geology and Geophysics, the University of Utah with the ICP-MS analyses of RCMD nanoparticles, Nancy Chandler at the University of Utah Core Facilities for obtaining the TEM images, and Dorrie Spurlock for her assistance in the final preparation of the manuscript. The authors are also grateful for the constructive comments of two anonymous reviewers.
Conflicts of Interest
The authors declare no conflict of interest.
References
- Blackley, D.J.; Halldin, C.N.; Scott Laney, A. Continued increase in prevalence of coal workers’ pneumoconiosis in the United States, 1970–2017. Am. J. Public Health 2018, 108, 1220–1222. [Google Scholar] [CrossRef]
- Coal Mine Dust Exposures and Associated Health Outcomes, A Review of Information Published Since 1995. Department of Health and Human Services, Centers for Disease Control and Prevention, National Institute for Occupational Safety and Health. DHHS (NIOSH) Publication No. 2011-172. 2011. Available online: https://www.cdc.gov/niosh/docs/2011-172/pdfs/2011-172.pdf (accessed on 19 December 2022).
- Blackley, D.J.; Halldin, C.N.; Wang, L.M.; Scott Laney, A. Small mine size is associated with lung function abnormality and pneumoconiosis among underground coal miners. Occup. Environ. Med. 2014, 71, 690–694. [Google Scholar] [CrossRef]
- Johann-Essex, V.; Keles Rezaee, C.M.; Scaggs-Witte, M.; Sarver, E. Respirable coal mine dust characteristics in samples collected in central and northern Appalachia. Int. J. Coal. Geol. 2017, 182, 85–93. [Google Scholar] [CrossRef]
- Sarver, E.; Keles, C.; Rezaee, M. Beyond conventional metrics: Comprehensive characterization of respirable coal mine dust. Int. J. Coal. Geol. 2019, 207, 84–95. [Google Scholar] [CrossRef]
- Liu, T.; Liu, S. The impacts of coal dust on miners’ health: A review. Environ. Res. 2020, 190, 109849. [Google Scholar] [CrossRef]
- Oberdörster, G. Lung dosimetry: Pulmonary clearance of inhaled particles. Aerosol Sci. Technol. 1993, 18, 279–289. [Google Scholar] [CrossRef] [Green Version]
- MacNee, W.; Donaldson, K. Mechanism of lung injury caused by PM10 and ultrafine particles with special reference to COPD. EurRespir J. 2003, 21 (Suppl. S40), 41–51. [Google Scholar] [CrossRef]
- Liu, Q.; Guan, J.; Qin, L.; Zhang, X.; Mao, S. Physicochemical properties affecting the fate of nanoparticles in pulmonary drug delivery. Drug Discov. Today 2020, 25, 150–159. [Google Scholar] [CrossRef]
- Choi, H.S.; Ashitate, Y.; Lee, J.H.; Kim, S.H.; Matsui, A.; Insin, N.; Bawendi, M.G.; Semmler-Behnke, M.; Frangioni, J.V.; Tsuda, A. Rapid translocation of nanoparticles from the lung airspaces to the body. Nat. Biotechnol. 2010, 28, 1300–1303. [Google Scholar] [CrossRef] [Green Version]
- Saleh, Y.; Antherieu, S.; Dusautoir, R.; Yalleman, L.; Sotty, J.; De Sousa, C.; Platel, A.; Perdrix, E.; Riffault, V.; Fronval, I.; et al. Exposure to atmospheric ultrafine particles induces severe lung inflammatory response and tissue remodeling in mice. Int. J. Environ. Res. Public Health 2019, 16, 1210. [Google Scholar] [CrossRef]
- Donaldson, K.; Stone, V.; Gilmour, P.S.; Brown, D.M.; Macnee, W. Ultrafine particles: Mechanisms of lung injury. Phil. Trans. R Soc. Lond A 2000, 358, 2741–2749. [Google Scholar] [CrossRef]
- Bräuner, E.V.; Forchhammer, L.; Møller, P.; Simonsen, J.; Glasius, M.; Wåhlin, P.; Raaschou-Nielsen, O.; Loft, S. Exposure to ultrafine particles from ambient air and oxidative stress-induced DNA damage. Environ. Health Perspect. 2007, 115, 1177–1182. [Google Scholar] [CrossRef]
- Geiser, M.; Rothen-Rutishauser, B.; Kapp, N.; Schurch, S.; Kreyling, W.; Schulz, H.; Semmler, M.; Im Hof, V.; Heyder, J.; Gehr, P. Ultrafine particles cross cellular membranes by nanphagocytic mechanisms in lungs and in cultured cells. Environ. Health Pesrpect. 2005, 113, 1556–1560. [Google Scholar]
- Li, Y.; Shi, Z.; Radauer-Preiml, I.; Andosch, A.; Casals, E.; Luetz-Meindl, U.; Cobaleda, M.; Lin, Z.; Jaberi-Douraki, M.; Italiani, P.; et al. Bacterial endotoxin(lipopolysaccharide) binds to the surface of nanoparticle, interferes with biocorona formation and induces human monocyte inflammatory activation. Nanotoxicology 2017, 11, 1157–1175. [Google Scholar] [CrossRef] [Green Version]
- Moller, W.; Felten, K.; Sommerer, K.; Scheuch, G.; Meyer, G.; Meyer, P.; Haussinger, K.; Kreyling, W.G. Deposition, retention, and translocation of ultrafine particles from the central airways and lung periphery. Am. J. Respir. Crit Care Med. 2008, 177, 426–432. [Google Scholar] [CrossRef]
- Johann-Essex, V.; Keles, C.; Sarver, E. A computer-controlled SEM-EDX routine for characterizing respirable coal mine dust. Minerals 2017, 7, 15. [Google Scholar] [CrossRef] [Green Version]
- Pan, L.; Golden, S.; Assemi, S.; Sime, A.F.; Wang, X.; Gao, Y.; Miller, J.D. Characterization of particle size and composition of respirable coal mine dust. Minerals 2021, 11, 276. [Google Scholar] [CrossRef]
- Giddings, J.C. Field-flow fractionation: Analysis of Macromolecular, colloidal, and particulate materials. Science 1993, 260, 1456–1465. [Google Scholar] [CrossRef]
- Levin, S.; Stern, L.; Ze’evl, A.; Levy, M.Y. Characterization of submicrometer emulsions uing sedimentation field-flow fractionation with power field programming. Anal. Chem. 1994, 66, 368–377. [Google Scholar] [CrossRef]
- Assidjoa, E.; Chianéa, T.; Dreyfussa, M.-F.; Cardot, P.J.P. Validation procedures of sedimentation field-flow fractionation techniques for biological applications. J. Chrom. B 1998, 709, 197–207. [Google Scholar] [CrossRef]
- Giddings, J.C.; Yang, F.J.; Myers, M.N. Flow field-flow fractionation: New method for separating, purifying, and characterizing the diffusivity of viruses. J. Virol. 1977, 21, 131–138. [Google Scholar] [CrossRef]
- Assemi, S.; Tadjiki, S.; Donose, B.C.; Nguyen, A.V.; Miller, J.D. Aggregation of fullerol C60(OH)24 nanoparticles as revealed using flow field-flow fractionation and atomic force microscopy. Langmuir 2010, 26, 16063–16070. [Google Scholar] [CrossRef]
- Giddings, J.C. A new separation concept based on a coupling of concentration and flow nonformalities. Sep. Sci. 1966, 1, 123–125. [Google Scholar]
- Tadjiki, S.; Assemi, S.; Deering, C.E.; Veranth, J.M.; Miller, J.D. Detection, separation, and quantification of unlabeled silica nanoparticles in biological media using sedimentation field-flow fractionation. J. Nanopart. Res. 2009, 11, 981–988. [Google Scholar] [CrossRef]
- Assemi, S.; Newcombe, G.; Hepplewhite, C.; Beckett, R. Characterization of natural organic matter fractions separated by ultrafiltration using flow field-flow fractionation. Water Res. 2004, 38, 1467–1476. [Google Scholar] [CrossRef]
- Wang, W. Characteristics of individual particles emitted from an experimental burning chamber with coal from the lung cancer area of Xuanwei, China. Aerosol. Air Qual. Res. 2019, 19, 355–363. [Google Scholar] [CrossRef]
- Barnes, H.; Goh, N.S.L.; Leong, T.L.; Hoy, R. Silica-associated lung disease: An old-world exposure in modern industries. Respirology 2019, 24, 1165–1175. [Google Scholar] [CrossRef] [Green Version]
- Assemi, S.; Sharma, S.; Tadjiki, S.; Prisbrey, K.; Ranville, J.; Miller, J.D. Effect of surface charge and elemental composition on the swelling and delamination of montmorillonite nanoclays using sedimentation field-flow fractionation and mass spectroscopy. Clays Clay Miner. 2015, 63, 457–468. [Google Scholar] [CrossRef]
- Moreno, T.; Trechera, P.; Querol, X.; Lah, R.; Johnson, D.; Wrana, A.; Williamson, B. Trace element fractionation between PM10 and PM2.5 in coal mine dust: Implications for occupational and respiratory health. Int. J. Coal Geol. 2019, 203, 52–59. [Google Scholar] [CrossRef]
- Ketris, M.P.; Yudovich, Y.E. Estimation of Clarkes for carbonaceous biolithes: World averages for trace element contents in black shales and coals. Int. J. Coal Geol. 2009, 78, 135–148. [Google Scholar] [CrossRef]
- Lu, S.; Hao, X.; Liu, D.; Wang, Q.; Zhang, W.; Liu, P.; Zhang, R.; Yu, S.; Pan, R.; Wu, M.; et al. Mineralogical characterization of ambient fine/ultrafine particles emitted from Xuanwei C1 coal combustion. Atmos. Res. 2016, 169, 17–23. [Google Scholar] [CrossRef]
- Lin, C.-C.; Chen, S.-J.; Huang, K.-L. Characteristics of metals in nano/ultrafine/fine/coarse particles collected beside a heavily trafficked road. Environ. Sci. Technol. 2005, 39, 8113–8122. [Google Scholar] [CrossRef]
- Harrington, A.D.; Hylton, S.; Schoonen, M.A.A. Pyrite-driven reactive oxygen species formation in simulated lung fluid: Implications for coal workers’ pneumoconiosis. Environ. Geochem. Health 2012, 34, 527–538. [Google Scholar] [CrossRef]
- Eom, H.-J.; Choi, J. Oxidative stress of silica nanoparticles in human bronchial epithelial cell, Beas-2B. Toxicol Vitr. 2009, 23, 1326–1332. [Google Scholar] [CrossRef]
Figure 1.
Isolation of RCMD particles. (a) Filter paper containing the RCMD particles was placed in 2 mL of the carrier fluid, (b) mixed by a vortex mixer followed by 3 bath sonication treatments every 24 h. (c) The suspension was settled for two hours to exclude the fraction over 1 micron in diameter. (d) A total of 100 μL of the sample was drawn from the top 0.5 cm using a micro syringe, (e) the sample was injected to the FFF channel for size analysis.

Figure 2.
Elution profiles (a) and size distributions (b) of the RCMD samples obtained from the bolter and the miner sites using SdFFF.
Figure 2.
Elution profiles (a) and size distributions (b) of the RCMD samples obtained from the bolter and the miner sites using SdFFF.

Figure 3.
Elution profiles (a) and size distributions (b) of the RCMD samples obtained from the bolter and the miner sites using AsFlFFF.
Figure 3.
Elution profiles (a) and size distributions (b) of the RCMD samples obtained from the bolter and the miner sites using AsFlFFF.

Figure 4.
TEM images of the bulk RCMD sample from the bolter after sample preparation and before injection to the FFF channel.
Figure 4.
TEM images of the bulk RCMD sample from the bolter after sample preparation and before injection to the FFF channel.

Figure 5.
TEM images of the isolated RCMD nanoparticles from the bolter and the miner samples showing carbonaceous (a–f) aggregate of aluminosilicate particles (d), soot aggregate (g)and aggregate of carbonaceous particles (h). The yellow bar on the size distribution graphs shows the location of the fraction taken.

Figure 6.
Size-dependent elemental distribution for major elements, Si, Al, Ca, Fe and Mg in nanoparticles isolated from the bolter sample. The blue (a) and purple (b) lines show the size distribution, measured by asymmetrical flow field-flow fractionation (a) and sedimentation field-flow fractionation (b).

Figure 7.
Size-dependent elemental distribution of major elements, Si, Al, Ca, Fe and Mg in nanoparticles isolated from the miner sample. The red (a) and orange (b) lines show the size distribution, measured by asymmetrical flow field-flow fractionation (a) and sedimentation field-flow fractionation (b).

Figure 8.
Size-dependent elemental distribution of trace elements, Cs, La, Pb, Y, Ce, and U in nanoparticles with hydrodynamic diameters d ≤ 60 nm, isolated from the bolter sample. The blue line shows the size distribution, measured by asymmetrical flow field-flow fractionation (AsFlFFF). Trace elements for the bolter sample by SdFFF were not measured.

Figure 9.
Size-dependent elemental distribution of trace elements Cs, La, Pb, Ce, and U in nanoparticles isolated from the miner sample. The red (a) and orange (b) lines show the size distribution, measured by AsFlFFF (a) and SdFFF (b).
Figure 9.
Size-dependent elemental distribution of trace elements Cs, La, Pb, Ce, and U in nanoparticles isolated from the miner sample. The red (a) and orange (b) lines show the size distribution, measured by AsFlFFF (a) and SdFFF (b).

Disclaimer/Publisher’s Note: The statements, opinions and data contained in all publications are solely those of the individual author(s) and contributor(s) and not of MDPI and/or the editor(s). MDPI and/or the editor(s) disclaim responsibility for any injury to people or property resulting from any ideas, methods, instructions or products referred to in the content. |
© 2023 by the authors. Licensee MDPI, Basel, Switzerland. This article is an open access article distributed under the terms and conditions of the Creative Commons Attribution (CC BY) license (https://creativecommons.org/licenses/by/4.0/).
Share and Cite
MDPI and ACS Style
Assemi, S.; Pan, L.; Wang, X.; Akinseye, T.; Miller, J.D. Size Distribution, Elemental Composition and Morphology of Nanoparticles Separated from Respirable Coal Mine Dust. Minerals 2023, 13, 97. https://doi.org/10.3390/min13010097
AMA Style
Assemi S, Pan L, Wang X, Akinseye T, Miller JD. Size Distribution, Elemental Composition and Morphology of Nanoparticles Separated from Respirable Coal Mine Dust. Minerals. 2023; 13(1):97. https://doi.org/10.3390/min13010097
Chicago/Turabian StyleAssemi, Shoeleh, Lei Pan, Xuming Wang, Titilayo Akinseye, and Jan D. Miller. 2023. "Size Distribution, Elemental Composition and Morphology of Nanoparticles Separated from Respirable Coal Mine Dust" Minerals 13, no. 1: 97. https://doi.org/10.3390/min13010097
Note that from the first issue of 2016, this journal uses article numbers instead of page numbers. See further details here.