1. Introduction
The copper deposits of the Keweenaw Peninsula native copper district contain the world’s largest accumulation of native copper. They are notable for consisting of almost entirely native copper; the deposits produced 5 billion kg of refined copper from 1845 to 1968 [
1,
2]. The first major mining rush in North America in the early to mid-1840s to the Keweenaw Peninsula was sparked by an 1841 geologic report written by Douglass Houghton, Michigan’s first state geologist [
3]. A major geologic study in the 1920s culminated with publication of U.S. Geological Survey Professional Paper 144 [
4]. Just before commercial mining ended and the underground mines left to flood, U.S. Geological Survey geologist, White, published a district-wide review including a detailed analysis of current thinking on genetic models [
5]. The district has not benefited as much as elsewhere from the explosion in modern analytical methods in the last 50 years.
There is a long history elsewhere of using light stable isotopes to determine hydrothermal fluid sources. Only two previous light stable isotope studies have been published on the Keweenaw Peninsula native copper district [
6,
7]. These studies supported the long-standing hypothesis that the native copper ore-forming hydrothermal fluids were dominantly generated by burial metamorphic processes [
5,
6,
7,
8,
9]. However, these two studies also differed in the possible involvement of seawater and magmatic waters in the ore-forming hydrothermal fluids. Bornhorst and Woodruff [
10] used light stable isotopes to propose fluid mixing as an important process to help explain isotopic variability. We initiated this light stable isotope study to evaluate fluid mixing, but subsequently expanded the scope to the sources of hydrothermal fluids. We have compiled 157 district-wide bulk oxygen and carbon stable isotope data on calcite from published studies and added 239 new oxygen and carbon spot analyses by Secondary Ion Mass Spectrometry (SIMS) from a select number of samples. The new data are provided in the
Supplementary Materials to this publication. District-scale inferences of the nature of the hydrothermal fluids of the Keweenaw Peninsula native copper district are the focus of this publication.
2. Geologic Setting
The Midcontinent Rift system extends over 2000 km from Kansas to Lake Superior (
Figure 1). The rift-related rocks were deposited between 1.15 to 0.95 Ga [
11,
12,
13]. About 25 km of the Mesoproterozoic basalt-dominated rift-filling section is overlain by about 8 km of clastic sedimentary rocks and are largely hidden beneath the center of Lake Superior northwest of the Keweenaw Peninsula. Rift-related rocks are exposed around the Lake Superior region (
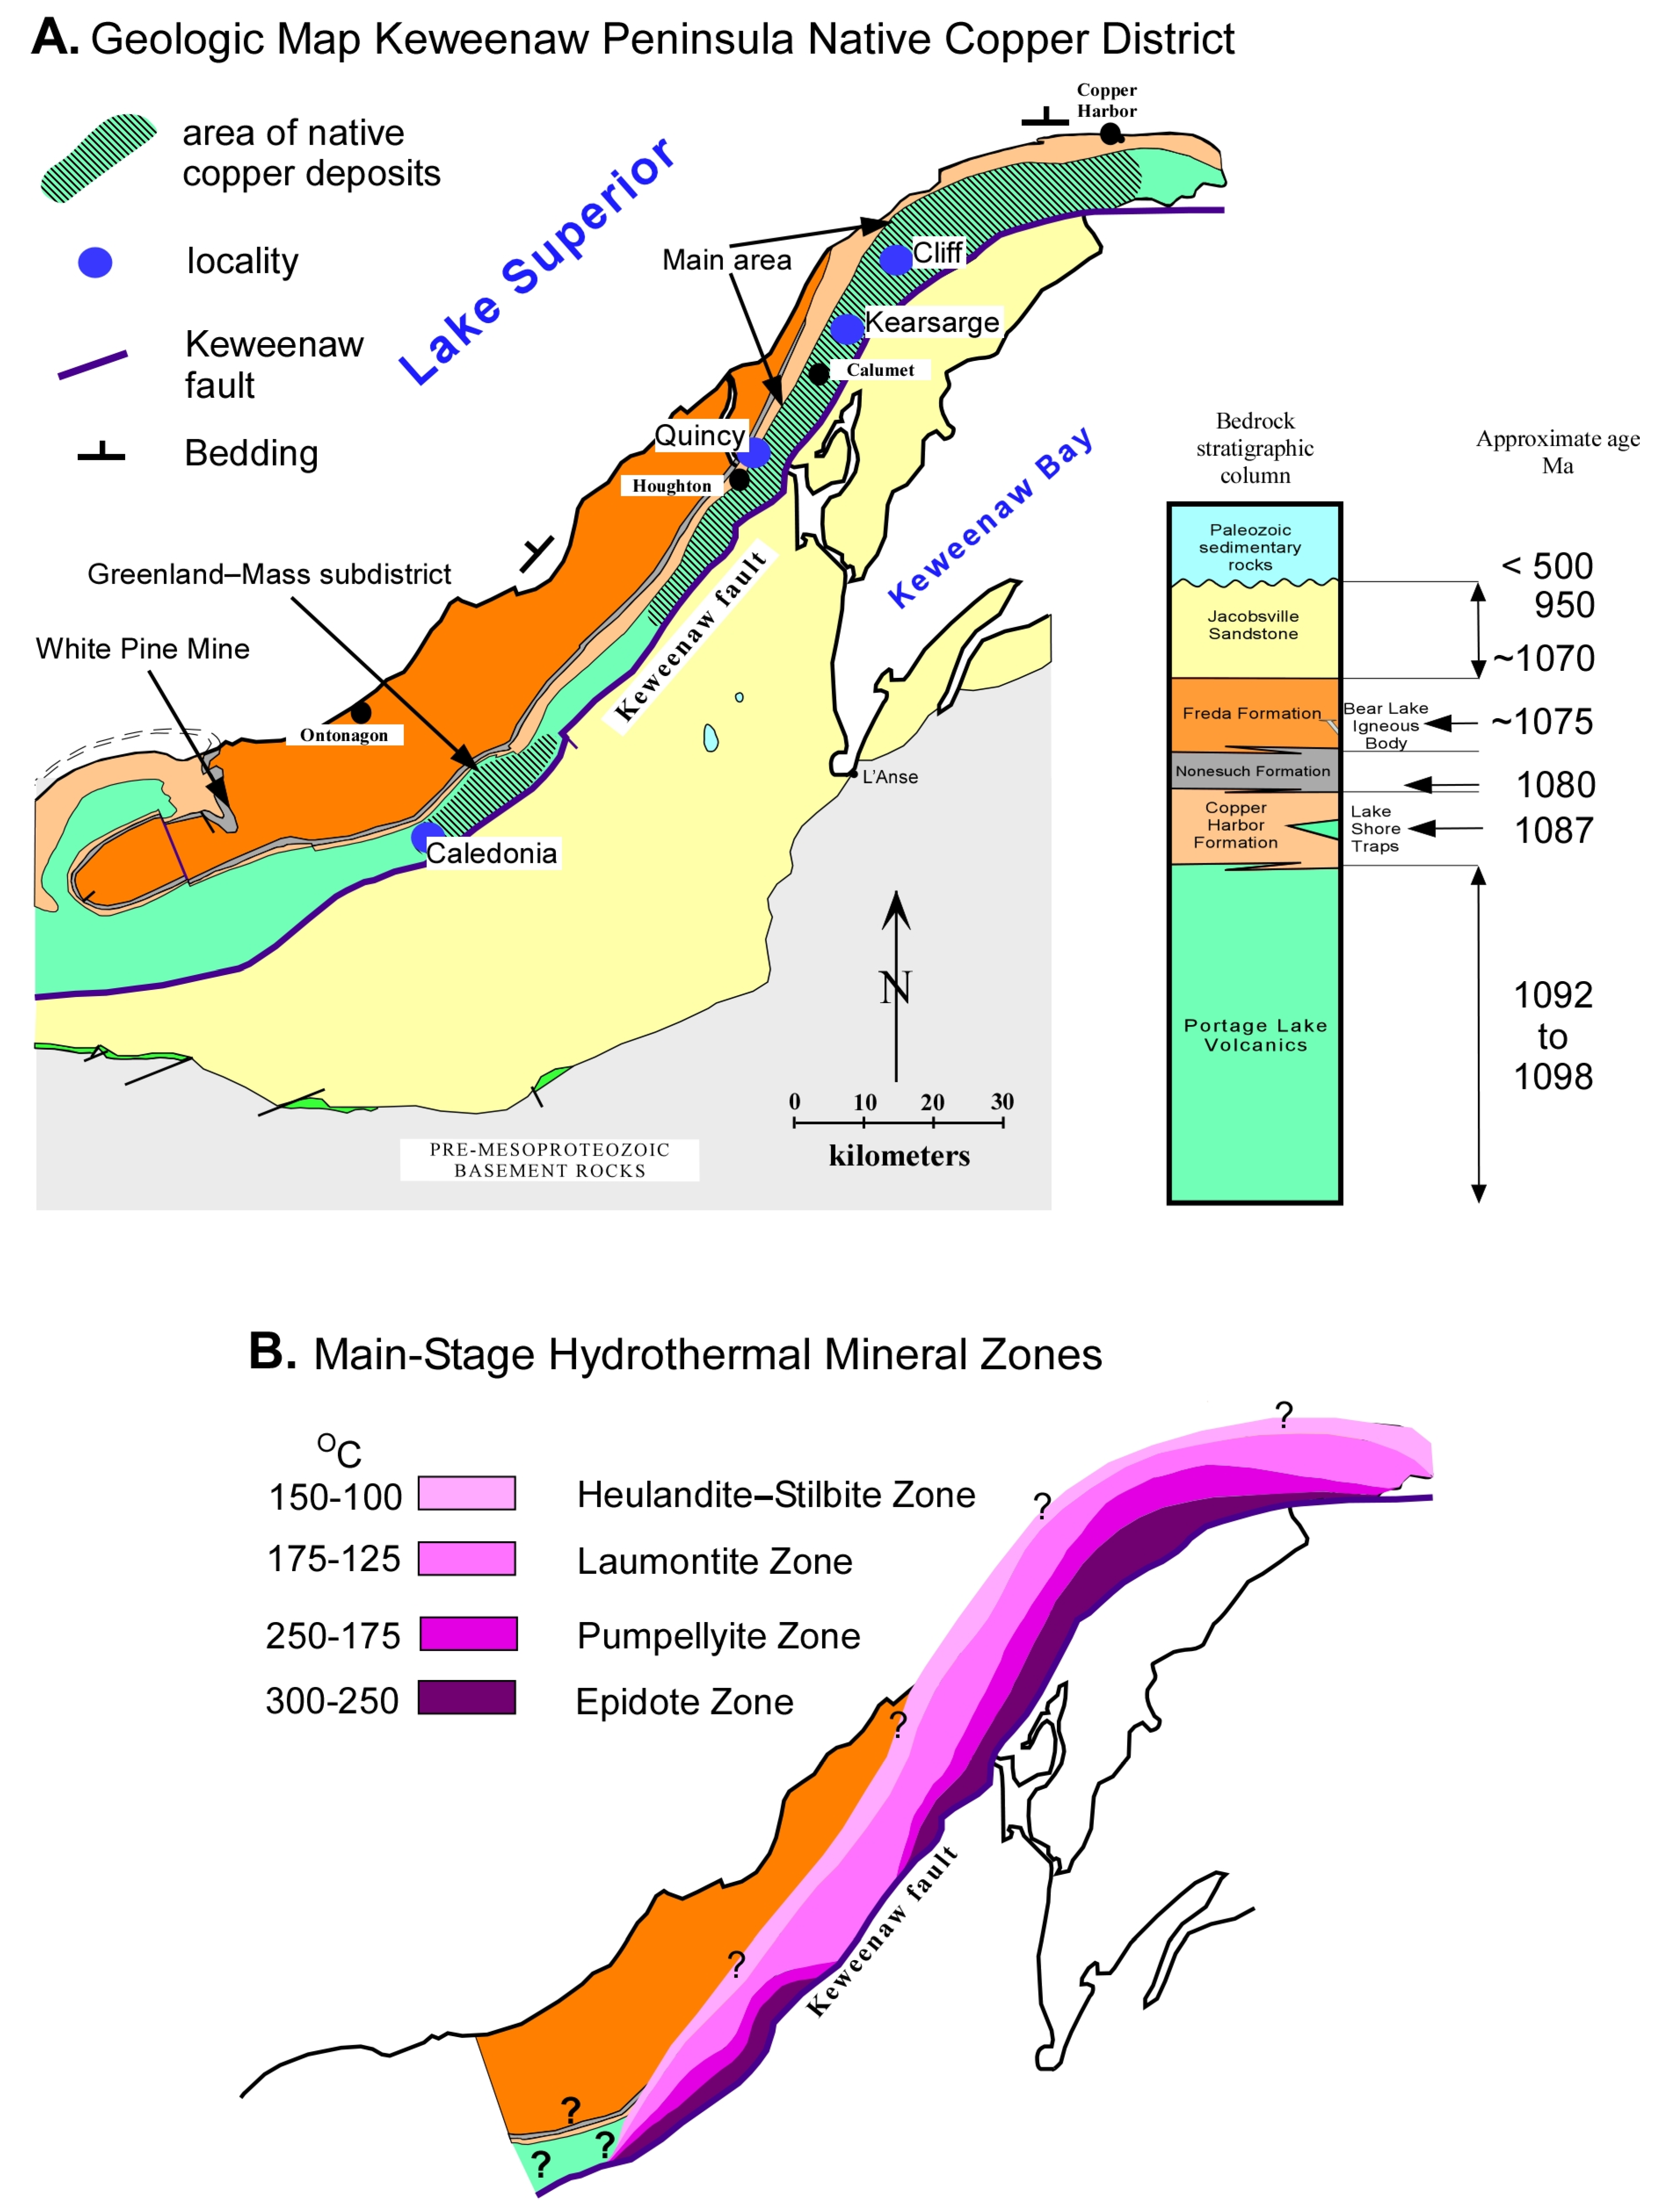
Figure 1). On the Keweenaw Peninsula, the exposed rift-filling basalt-dominated Portage Lake Volcanics (PLV) section is about 5 km thick with the base of the section truncated by the reverse Keweenaw Fault (
Figure 2). The PLV was deposited between about 1098 to 1092 Ma [
14]. Exposed on the eastern and southern edge of the Jacobsville Sandstone basin, the stratigraphically older volcanics of the Powder Mill Group were deposited from about 1098 to 1100 Ma [
15]. The PLV is composed of about 200 subaerial basalt flows, a few rhyolite flow-dome-horizons and intrusives near the base of the exposed section, and scattered interflow clastic sedimentary rock layers [
4,
5,
16,
17]. The subaerial basalt lava flows consist of a massive interior capped by an amygdaloidal and/or brecciated flow top; typically flows are around 10 to 20 m thick. Brecciated flow tops generally have higher porosity than amygdaloidal flow tops and are better ore host rocks. The interflow clastic sedimentary rocks within the PLV range from a few cm up to 40 m thick and consist of red-colored conglomerate with lesser amounts of interbedded, red-colored sandstone and sometimes red-colored siltstone and shale [
5]. The conglomerate consists of pebble-sized to boulder-sized clasts of rift-related volcanic rocks that are sub-rounded to angular in texture. The clasts are dominantly felsic, though they range from mafic to felsic compositions.
The clastic sedimentary rocks directly overlying the PLV are red-colored conglomerate and sandstone of the Copper Harbor Formation with abundant calcite cement and exposed thicknesses of up to 2000 m (
Figure 2). They were deposited in a semi-arid to arid climate [
19] in alluvial fans extending into the rift [
20]. There is an interval of basaltic subaerial lava flows (Lake Shore Traps) within the Copper Harbor Formation deposited about 1087 Ma [
14]. The Copper Harbor Formation is conformably overlain by gray to black siltstone and shale of the Nonesuch Formation with exposed thickness of up to 215 m where it is overlain by the Freda Formation [
21]. The Nonesuch Formation was deposited about 1080 Ma [
22]. The depositional setting of the Nonesuch Formation has been proposed as either lacustrine or marine [
21]. However, recent studies support the interpretation that the Nonesuch was deposited in a shallow marine embayment or marine-influenced estuarine system [
23,
24]. In addition, Jones et al. [
22] have suggested that all of the Copper Harbor Formation is part of a “braided fluvial-evaporitic shoreline-marine embayment triplet” and not non-marine as previously interpreted. This marine related interpretation is consistent with long-lasting and extensive incursions of seawater into the rift during the extended period of clastic sedimentation following the waning and ending of rift volcanism. The Nonesuch Formation is gradational into overlying fluvial red-colored very fine sandstone, siltstone, and shale of the Freda Formation with exposed thicknesses of up to 4000 m (
Figure 2) and indicates the transition to the end of marine incursions into the rift. The youngest known magmatism in the Midcontinent Rift is a single flow-dome-intrusive body (Bear Lake igneous body) emplaced in the Freda Formation at about 1075 Ma [
25].
These rift-filling rocks dip towards the center of the rift as a result of syn-depositional sagging and compression late in the history of the rift (
Figure 2 and
Figure 3) [
2]. A late regional compressional event connected with continental collision along the Grenville tectonic zone beginning at about 1070 to 1040 Ma [
26,
27] produced many lesser faults and fractures (
Figure 1). The reverse Keweenaw fault (
Figure 2) was formed by Grenville tectonism with a protracted history from 1070 to 950 Ma [
13,
28]. The rift-flanking Jacobsville Sandstone consists of fluvial red-to-white-colored sandstone and was likely deposited during the compressional event in association with the protracted development of the Keweenaw fault.
The native copper deposits of the Keweenaw Peninsula were formed during a regional hydrothermal event between about 1070 to 1040 Ma (
Figure 3) [
30,
31,
32]. The age of the regional hydrothermal event is corroborated by radiometric dating from the native copper associated main-stage minerals in the main area of the Keweenaw Peninsula native copper district, native copper and associated minerals that cross cut the sedimentary rock hosted chalcocite deposit at the White Pine Mine, and the main metamorphogenic-hydrothermal event in the North Shore Volcanic Group. Bornhorst [
33] proposed that faults and fractures formed during late rift Grenville compression integrated the pathways for movement of ore-forming fluids leading to the formation of the native copper deposits and main-stage minerals. This is consistent with the age of the Keweenaw fault and the regional metamorphic/hydrothermal event from about 1070 to 1040 Ma.
The PLV hosts the most significant deposits of native copper within the tops of subaerial lava flows and interflow conglomerates [
4,
5]. Those occurrences of native copper deposits, from which there has been a production of ~0.5 million kg of copper or more, are concentrated in two separate areas: (1) the main native copper district from South Range to Copper Harbor, and (2) the Greenland-Mass sub-district (
Figure 2). About 58.5% of the produced copper is hosted by brecciated and amygdaloidal flow tops, 39.5% by interflow conglomerate and sandstone layers, and 2% by cross-cutting veins [
1]. In addition to compression-related faults and fractures, the porosity and permeability of the flow tops and interflow conglomerates facilitate the movement of ore-forming fluids and provide open spaces to be filled with precipitated minerals [
4,
5,
6,
7,
9,
34].
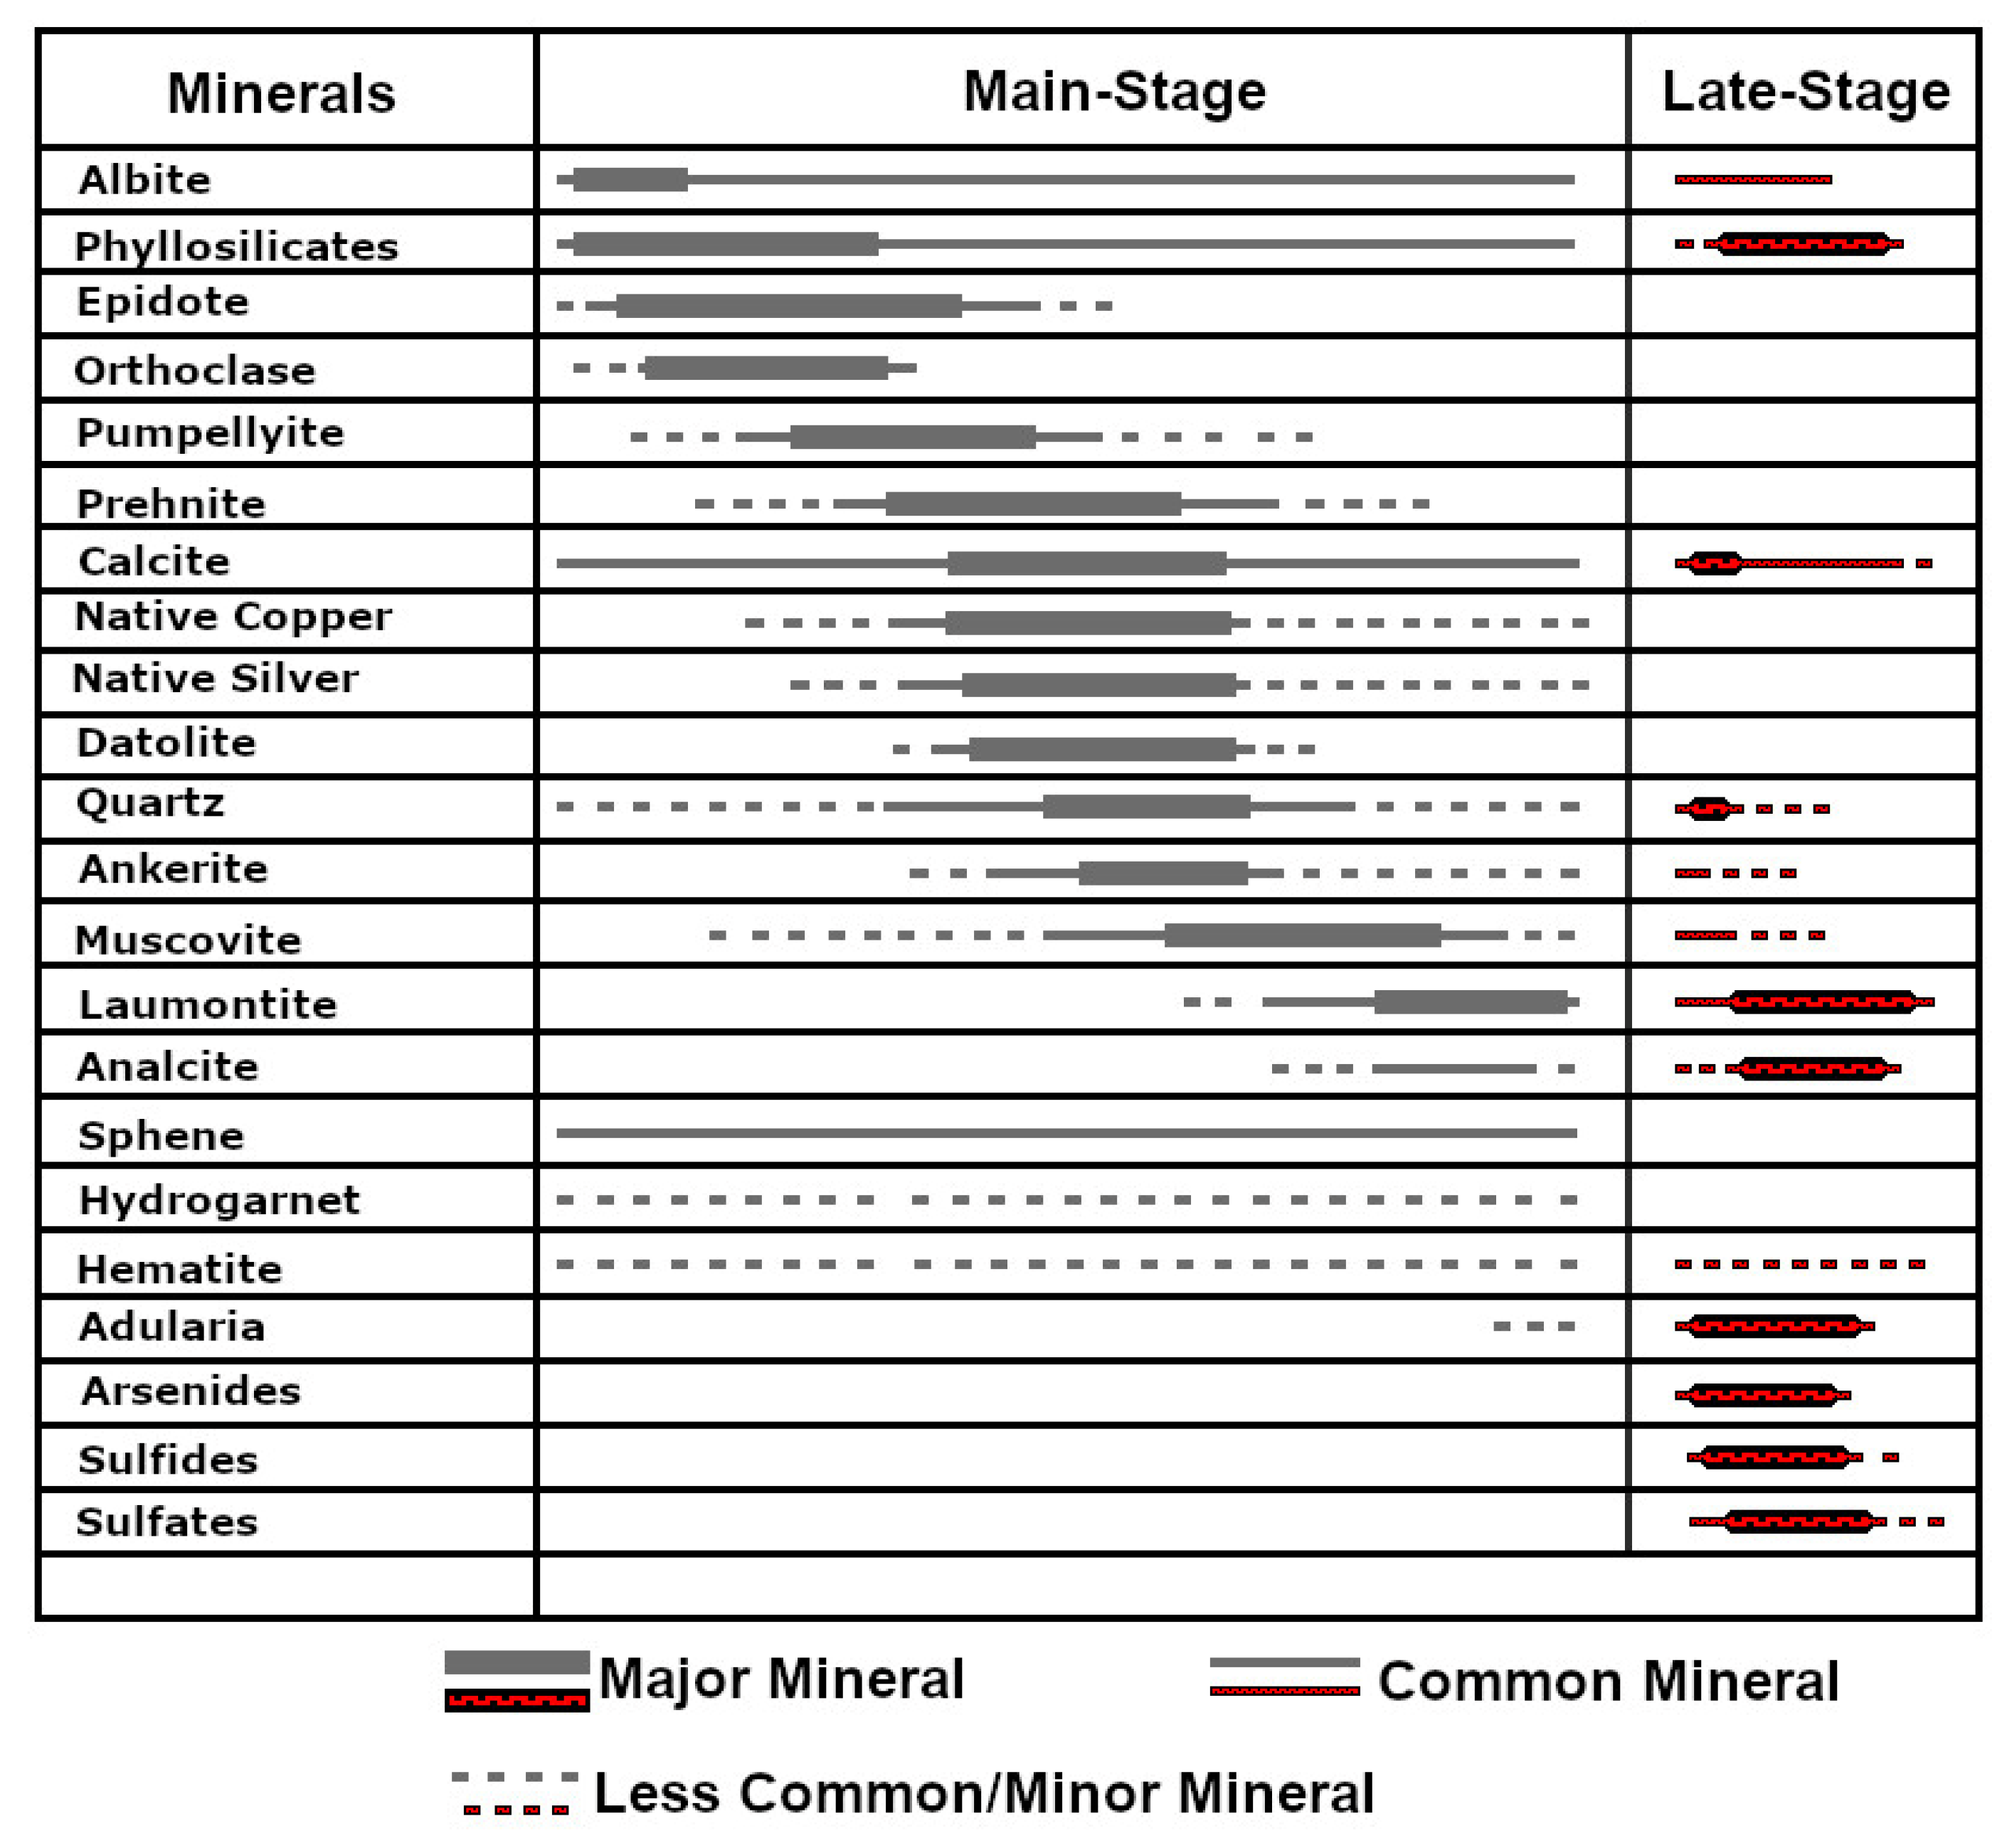
Butler and Burbank [
4] were the first to provide a comprehensive summary of the hydrothermal minerals within the Keweenaw Peninsula native copper district and their temporal relationship (paragenesis) with each other. Their “ore period” has been subdivided here into two stages of hydrothermal mineral formation: main-stage and late-stage (
Figure 4). The precipitation of native copper generally overlaps with all the minerals assigned here to the main-stage, which are interpreted to have formed during the same continuous hydrothermal event.
While widespread, the volumetrically minor late-stage hydrothermal minerals tend to be localized; late-stage minerals are more frequent along thin fractures and faults that cut across native copper mineralization. The late-stage minerals are notably more abundant near the Keweenaw fault in structurally disturbed PLV. Main-stage alteration minerals are notably less abundant adjacent to the Keweenaw fault. This indicates that the Keweenaw fault was not a principal pathway for localizing the main-stage native copper deposits. The late-stage assemblage includes very minor copper sulfide minerals (
Figure 4). Bornhorst and Suchoski [
35] have shown that even a very small amount of sulfur in the hydrothermal fluids would likely lead to precipitation of copper sulfide minerals rather than native copper, suggesting that the late-stage minerals are precipitated from fluids of a different source. The suite of late-stage minerals is indicative of temperatures of formation less than the main-stage minerals within the native copper district [
7]. While late-stage mineralization occurs temporally after the main-stage it is generally assumed to be part of a single continuous hydrothermal event, although the absolute age range of the late-stage event in the Keweenaw Peninsula is unknown. A late calcite vein at the White Pine mine was dated at about 1000 to 1040 Ma [
32] on the low end of the likely age of main-stage hydrothermal activity in the Keweenaw Peninsula but compatible with a continuous late-stage hydrothermal activity. Schmidt [
31] dated a paragenetic late mineral assemblage in the North Shore Volcanic Group to be about 945 to 965 Ma; this event occurred well after the main-stage native copper forming event, and if the late-stage of the Keweenaw Peninsula is continuous with the main-stage, then the 945 to 965 Ma event may represent a pulse of hydrothermal activity after the late-stage of the Keweenaw Peninsula and perhaps not yet recognized as being present in the Keweenaw Peninsula.
3. Mineral Zones and Temperature of Precipitation
The main-stage minerals occur as spatially separatable mineral zones that reflect district wide and regional variations in the fluid composition and/or conditions of mineralization (
Figure 2). In contrast, the late-stage minerals are not zoned but are similar throughout the native copper district. Stoiber and Davidson [
34] were the first to describe the regional pattern of main-stage hydrothermal mineral zoning within the PLV based on the mineral distribution in stratigraphic sections of drill cores and within mines. They used the presence or absence of prehnite, epidote and quartz to mark a line of occurrence, and showed that mineral zones of the native copper district cross cut the strike of the PLV. Later, Jolly and Smith [
9] subdivided the main-stage hydrothermal mineral assemblages within the PLV in a single cross-section of stepped drill cores into three low-grade “burial metamorphic” zones of decreasing grade: epidote zone, pumpellyite zone, and laumontite zone. Subsequently, Livnat [
6] provided additional information on spatial zonation of the minerals and showed that mineral zones dip more shallowly than the strata of the PLV.
The metamorphogenic-hydrothermal mineral assemblages for the North Shore Volcanic Group of Minnesota (
Figure 1) [
36] are mineralogically similar to those of the PLV [
6,
9] and of similar age [
31]. The North Shore Volcanic Group is a rift-related Mesoproterozoic basalt-dominated formation that is stratigraphically beneath the PLV. The main-stage hydrothermal mineral assemblages of the Keweenaw Peninsula can be readily subdivided into the mineral zones used by Schmidt [
36] from highest to lowest grade: (1) the epidote zone characterized by actinolite (not found in the Keweenaw Peninsula), epidote, pumpellyite, prehnite, chlorite, and garnet; (2) the pumpellyite zone characterized by epidote, pumpellyite, prehnite, traces of laumontite, chlorite, potential garnet and corrensite, and (3) the laumontite zone characterized by laumontite, chlorite, calcite, phyllosilicates (corrensite), epistilbite, and quartz. Two of Schmidt’s [
36] zones occur on the Keweenaw Peninsula but are located outside of the native copper district: the heulandite-stilbite zone characterized by laumontite, calcite, phyllosilicates (smectite), heulandite, stilbite, scolecite, mordenite, and epistilbite, and a lower grade thomsonite-scolecite-smectite zone characterized by smectite, thomsonite, calcite, heulandite, scolecite and quartz. Only minerals temporally/genetically related to each other, e.g., main-stage minerals (
Figure 4), can be mapped together. We have created a mineral zonation map based on our analysis of the spatial distribution of the main-stage hydrothermal mineral assemblages within the native copper district (
Figure 2).
Livnat [
6] proposed formation temperatures for the mineral zones mostly based on temperatures of formation of metamorphic mineral assemblages supplemented with stable isotope geothermometry. Püschner [
7] applied a chlorite geothermometer to help estimate the formation temperatures. Their main-stage mineral temperatures of formation are consistent with Schmidt’s [
36] inferred temperatures. Based on these data, we estimate the main-stage formation temperatures for the epidote zone to be 275 ± 25 °C, the pumpellyite zone to be 200–225 ± 25 °C, and the laumontite zone to be 150 ± 25 °C. The mapped mineral zones cross cut the strike of the PLV near the tip of the Keweenaw Peninsula and southwest of the main area of native copper deposits, and on either side of the Greenland-Mass subdistrict (
Figure 2). Since the mineral zones can be equated with temperature, the spatial distribution fits with a district-wide hydrothermal thermal high coincident with the more significant native copper deposits.
The Keweenaw Peninsula late-stage mineral assemblage (
Figure 3) is similar to the laumontite and heulandite-stilbite zones of Schmidt [
36]. The heulandite-stilbite zone is interpreted to have formed at temperatures of <150 °C, whereas the laumontite zone formation temperature is slightly higher. The estimated late-stage mineral formation temperature is 125 ± 25 °C. Within the main area of the native copper district and the Greenland-Mass subdistrict (
Figure 2), the main-stage minerals are readily distinguished from the late-stage minerals. Outside these areas, identifying the late-stage mineral assemblage is difficult because the predicted main-stage mineral assemblage would be more or less the same as the late-stage. Thus, the light stable isotope data in this publication are restricted to the main area of the district and the subdistrict.
6. Discussion
Based on geologic reasoning and inferences, there have been multiple proposed sources of the main-stage hydrothermal fluids over the past century. Several of the possible sources of hydrothermal fluids are constrained, whereas some are not. We first review the currently accepted model of the main-stage hydrothermal system followed by an evaluation of the most likely sources of the main-stage hydrothermal fluid in light of the carbon and oxygen isotope composition of the hydrothermal fluids as calculated from main-stage calcite.
The source of late-stage hydrothermal fluids has only been briefly considered in the published literature. We evaluate the sources of late-stage hydrothermal fluids with our limited oxygen and carbon isotope compositions of the late-stage hydrothermal fluids as calculated from late-stage calcite.
6.1. Review of Main-Stage Hydrothermal System
Since about 1970 it has been widely accepted that native copper ore-forming hydrothermal fluids were generated by burial metamorphism [
5]. Mineralogic, stable isotope, and fluid inclusion studies by Livnat [
6] and Püschner [
7] supported the hypothesis that the ore-forming fluids were dominantly of metamorphic origin. Interpretation of unimodal normally distributed copper isotope composition of hydrothermally precipitated native copper also supports a metamorphic-dominated origin of the ore-forming fluids ([
29,
44]). The correspondence of the timing of native copper deposition and peak temperatures at depth [
45] is consistent with burial metamorphism. The widespread distribution of anomalous amounts of copper in exposed basalt-dominated strata throughout the rift (
Figure 1) is indicative of a large-scale regional hydrothermal event easily explained by burial metamorphic processes. The district-scale regular mineral zones (
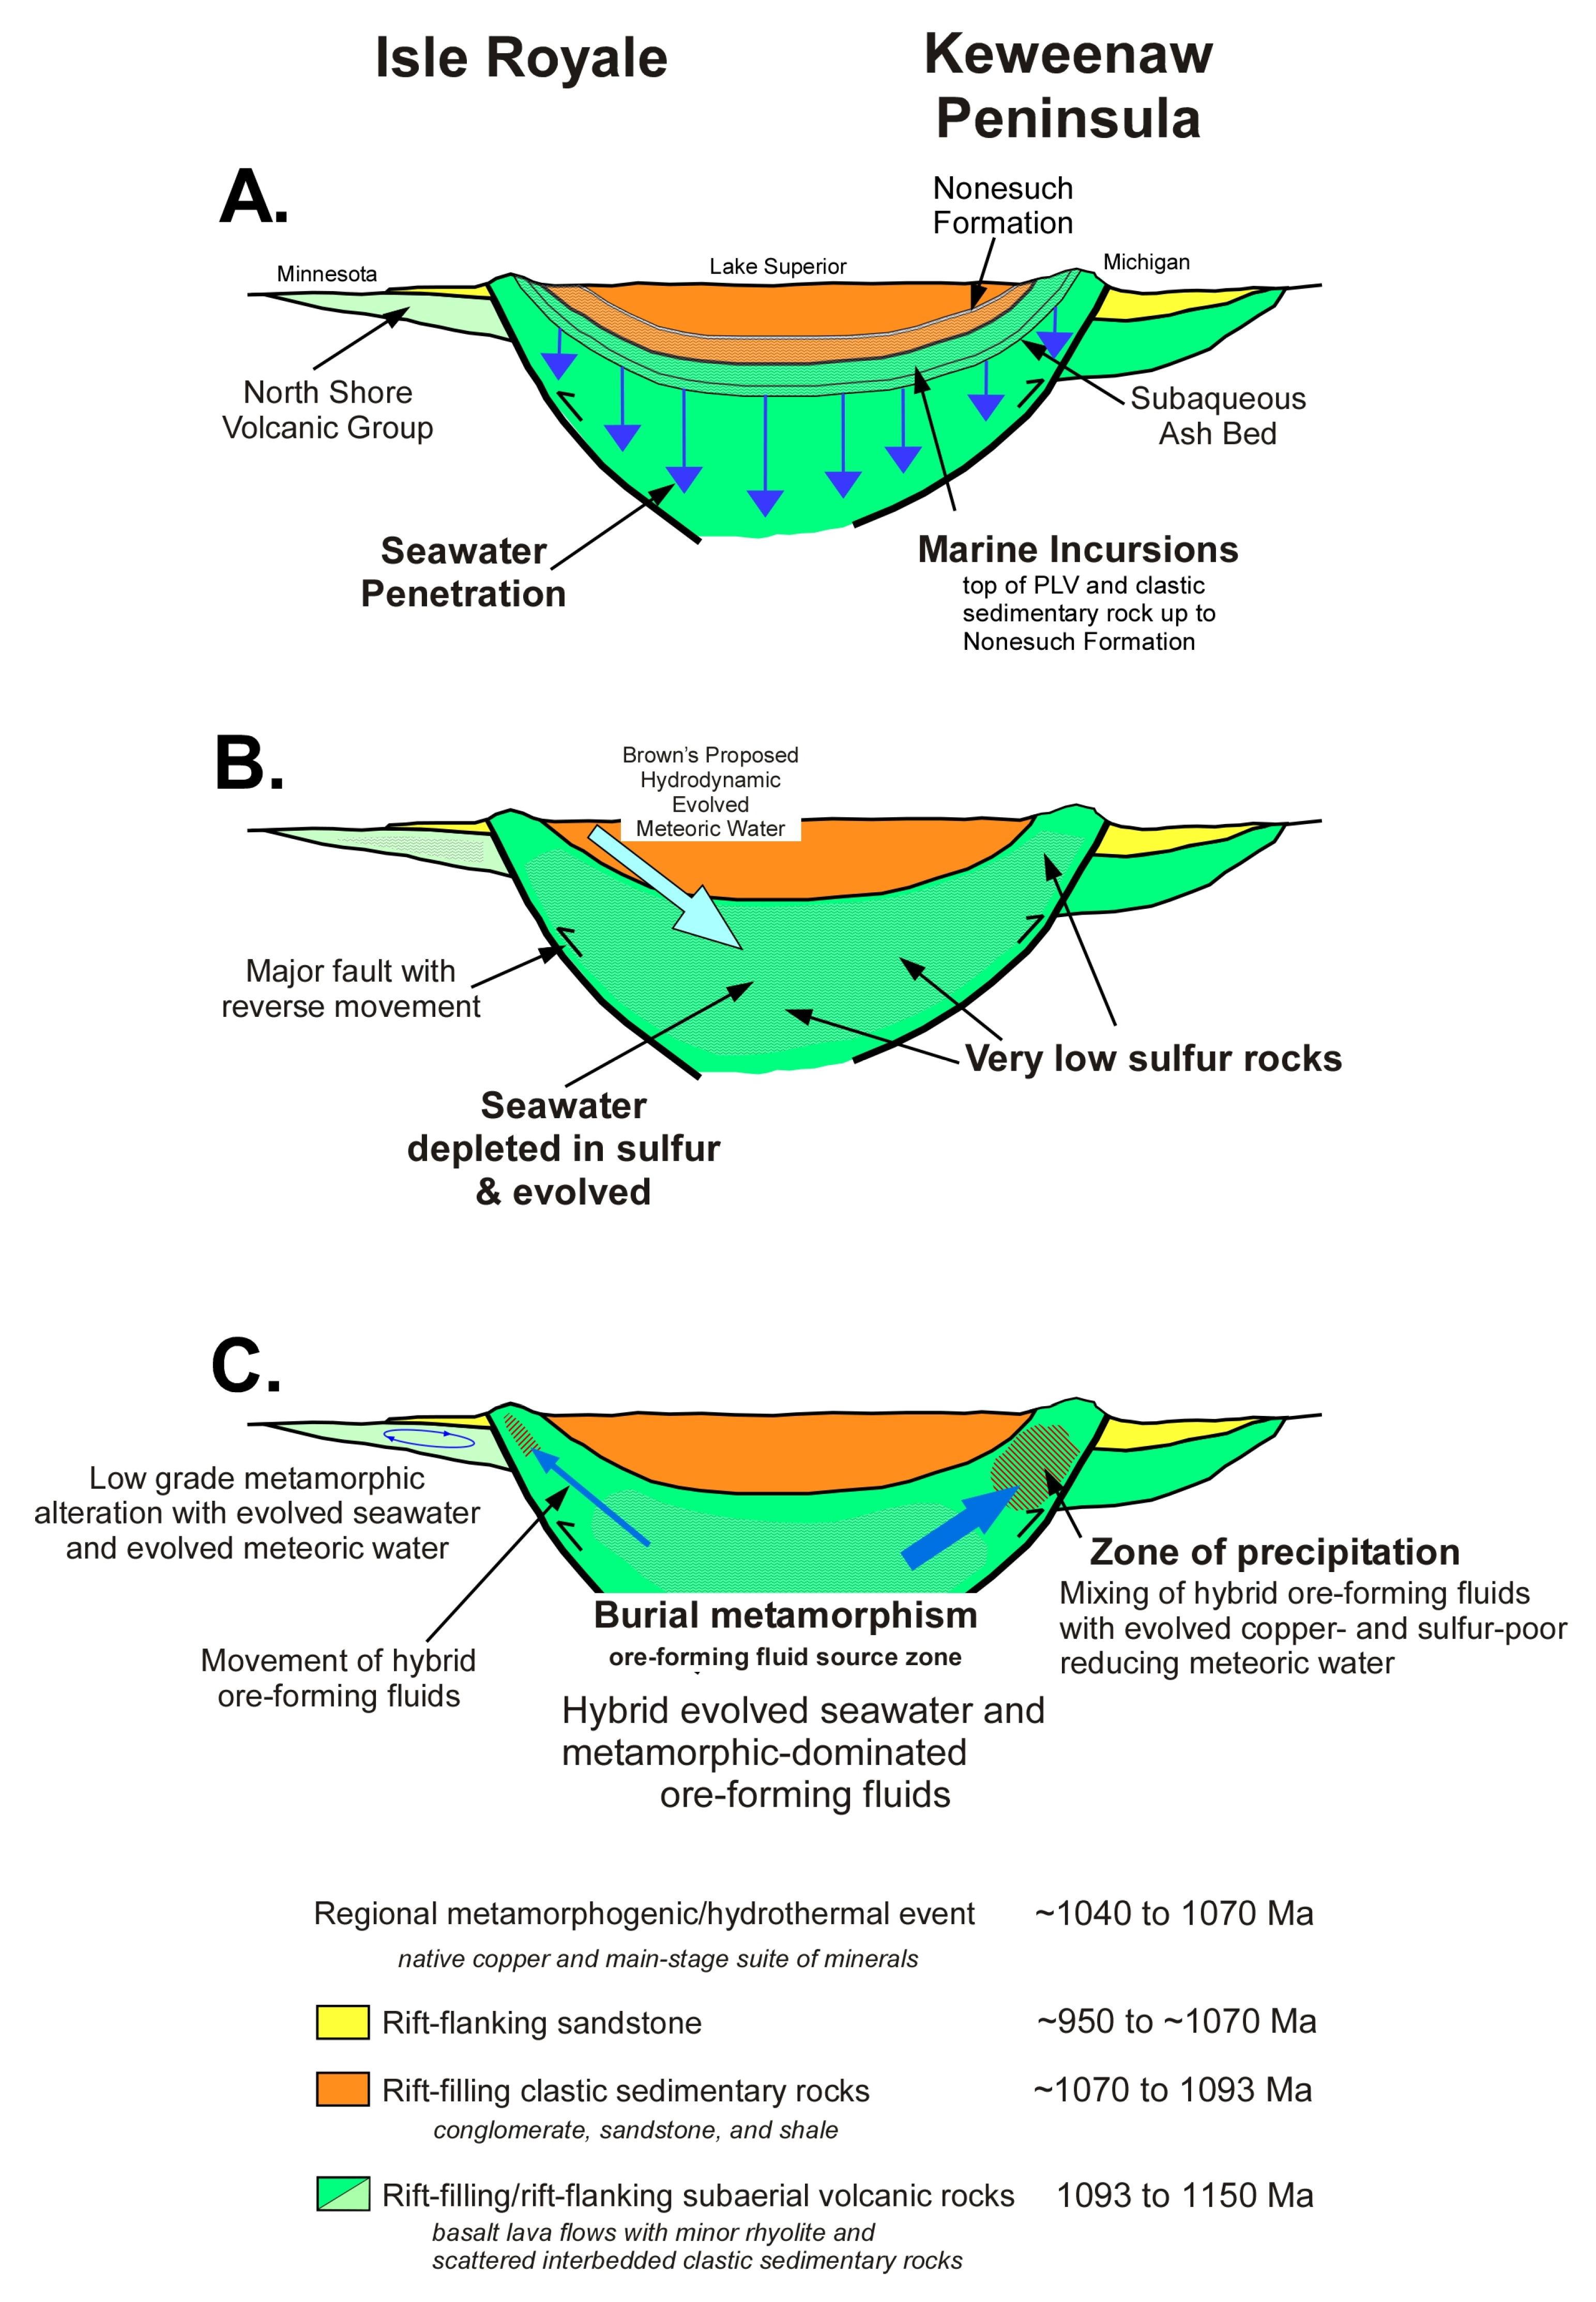
Figure 2) fit well with regional burial metamorphogenic-hydrothermal processes, wherein fluids are focused within the native copper district. The most likely source of most of the copper is from leaching of the rift-filling basalt-dominated volcanic rocks, including from the PLV host rocks, from a zone down-dip and at depth beneath the native copper deposits at temperatures between 300 to 500 °C (
Figure 3) [
5,
29,
45].
The almost exclusive precipitation of native copper during the main-stage hydrothermal event places a significant constraint on the source of hydrothermal fluids. There was a lack of sulfur in the entire hydrothermal system from the rocks in the source zone to the rocks of the pathways of ascending ore-forming fluids and to the PLV host rocks in the zone of precipitation (
Figure 3B) [
5]. The lack of sulfur resulted in native copper instead of copper sulfides. This lack of sulfur can be explained by a low sulfur magma [
29,
44] that loses sulfur by degassing of sulfur from the subaerial volcanic rocks prior to solidification [
5,
46].
The lack of sulfur in the main-stage hydrothermal ore-forming system was used as an argument against involvement of magmatic fluids, and in support of metamorphic fluids, as elsewhere magmatic fluids typically result in sulfide-bearing hydrothermal minerals [
5]. The age of the regional hydrothermal event at about 1070 to 1040 Ma [
30,
31,
32] is more than 15 to 30 million years after emplacement of abundant basalt-dominated volcanic rocks of the Midcontinent Rift which generally ended about 1085 Ma [
47]; the youngest exposed igneous body in the Midcontinent Rift is about 1075 Ma (Bear Lake igneous body within the Freda Sandstone (
Figure 2) [
25]. The age gap between known igneous activity and the hydrothermal event suggests that magmatic fluids were not a significant contributor to the ore-forming fluids, and any contribution would have more likely come from the waning stage of deep crystallizing magma bodies such as in the upper mantle or lower crust. Livnat’s [
6] interpretation of his light stable isotope data did not acknowledge any component of magmatic fluids, while Püschner’s [
7] interpretation of his stable isotope data led him to conclude that although a contribution of magmatic fluids to the ore-forming fluid was not indicated, neither could a magmatic fluid contribution be excluded.
Jolly [
8] demonstrated that ore-forming hydrothermal fluids were likely at least moderately saline. Püschner and Kelly [
7,
48] documented high salinity ore-forming fluids using fluid inclusion studies. Brown [
49,
50] reasoned that moderate to high salinity of the ore-forming fluids was an essential component of the ore-forming fluids and that metamorphic processes were not likely capable of generating high enough salinity. Thus, the ore-forming fluids could not be composed of only metamorphic fluids, as an outside source of salinity was required.
Brown [
49,
50] proposed that downward-moving hydrodynamically evolved formation water with a meteoric source entered the source zone and contributed salinity and copper to the metamorphic-dominated processes generating the ore-forming fluids. In Brown’s [
49,
50] model, meteoric water begins at shallow depths in the rift-filling clastic sedimentary rocks overlying the PLV and overlying the source zone (
Figure 3B). This meteoric water spends considerable time reacting with and evolving in these sedimentary rocks, gaining salinity by dissolving evaporitic minerals from postulated evaporite horizons and from cement as the water moved downward and into the source zone. Brown [
49,
50] proposed that a highland area on the Isle Royale limb of the rift (
Figure 3B) led to gravity-driven meteoric water flow. Brown’s [
49,
50] proposed hydrodynamic evolved formation waters with a meteoric source are analogous to volumetrically abundant evolved meteoric water in major sedimentary basins, well recognized for their role in mineral deposits [
51]. Brown’s model [
49,
50] does not satisfy the constraint of very low to no sulfur in the ore-forming fluids as he did not provide a mechanism to deplete sulfur that was very likely acquired from dissolution of evaporitic minerals. In addition, the copper isotope signature of native copper is not consistent with a significant amount of copper in the hydrodynamic evolved meteoric water leached from the clastic sedimentary rocks unless it was overwhelmed by metamorphogenic-derived copper. Bornhorst and Mathur [
29,
44] also argue that the more complex nature of a hydrodynamic model is less consistent with the observed limited copper isotopic variability. Thus, it seems unlikely that hydrodynamic evolved meteoric water was the principal outside source of salinity, but a limited contribution cannot be precluded.
If Brown’s [
49,
50] salinity constraint is correct, Bornhorst [
52] hypothesized that evolved formation water with a seawater source is a reasonable source of salinity in the ore-forming fluids. Modern midocean ridge vent systems expel evolved seawater hydrothermal fluids that are very low or devoid in sulfur [
53,
54]. Sulfur-bearing seawater is heated as it moves downward through tholeiitic basalt and at about 130 to 150 °C anhydrite begins to precipitate, which removes sulfur from the evolving seawater. There is likely insufficient available Ca in the fluids to completely remove all of the sulfur. Albitization of the basalt, beginning at about 250 °C, provides abundant Ca to the hydrothermal fluid, which is more than enough for additional precipitation of anhydrite to remove all of the sulfur from the fluids leaving an excess of Ca from derived by albitization. This excess results in Ca-rich brines that are characteristic of burial metamorphism of basalts in continental rift systems [
55]. The ore-forming fluids of the Keweenaw Peninsula are likely Ca-rich brines [
6,
48]. This mechanism to deplete sulfur from evolved seawater allows closed to open system formation water (seawater) to be a viable source of salinity in the ore-forming fluids (
Figure 3C). Even less depletion of sulfur is needed for Mesoproterozoic seawater as compared to modern seawater because Mesoproterozoic seawater is notable for being comparatively low in sulfur [
56].
Precipitation of native copper and associated main-stage minerals is hypothesized to be the result of cooling of the fluids and reaction of the fluids with host rocks [
8,
29]. Bornhorst and Woodruff [
10] hypothesized that in addition to these two mechanisms, mixing of ore forming fluids with copper-poor and sulfur-poor shallow reduced meteoric waters played a role in precipitation, although their evidence was not conclusive. The initial object of this research was to test this hypothesis with new oxygen and carbon stable isotope data.
6.2. Main-Stage Hydrothermal Fluid Oxygen Isotope Composition
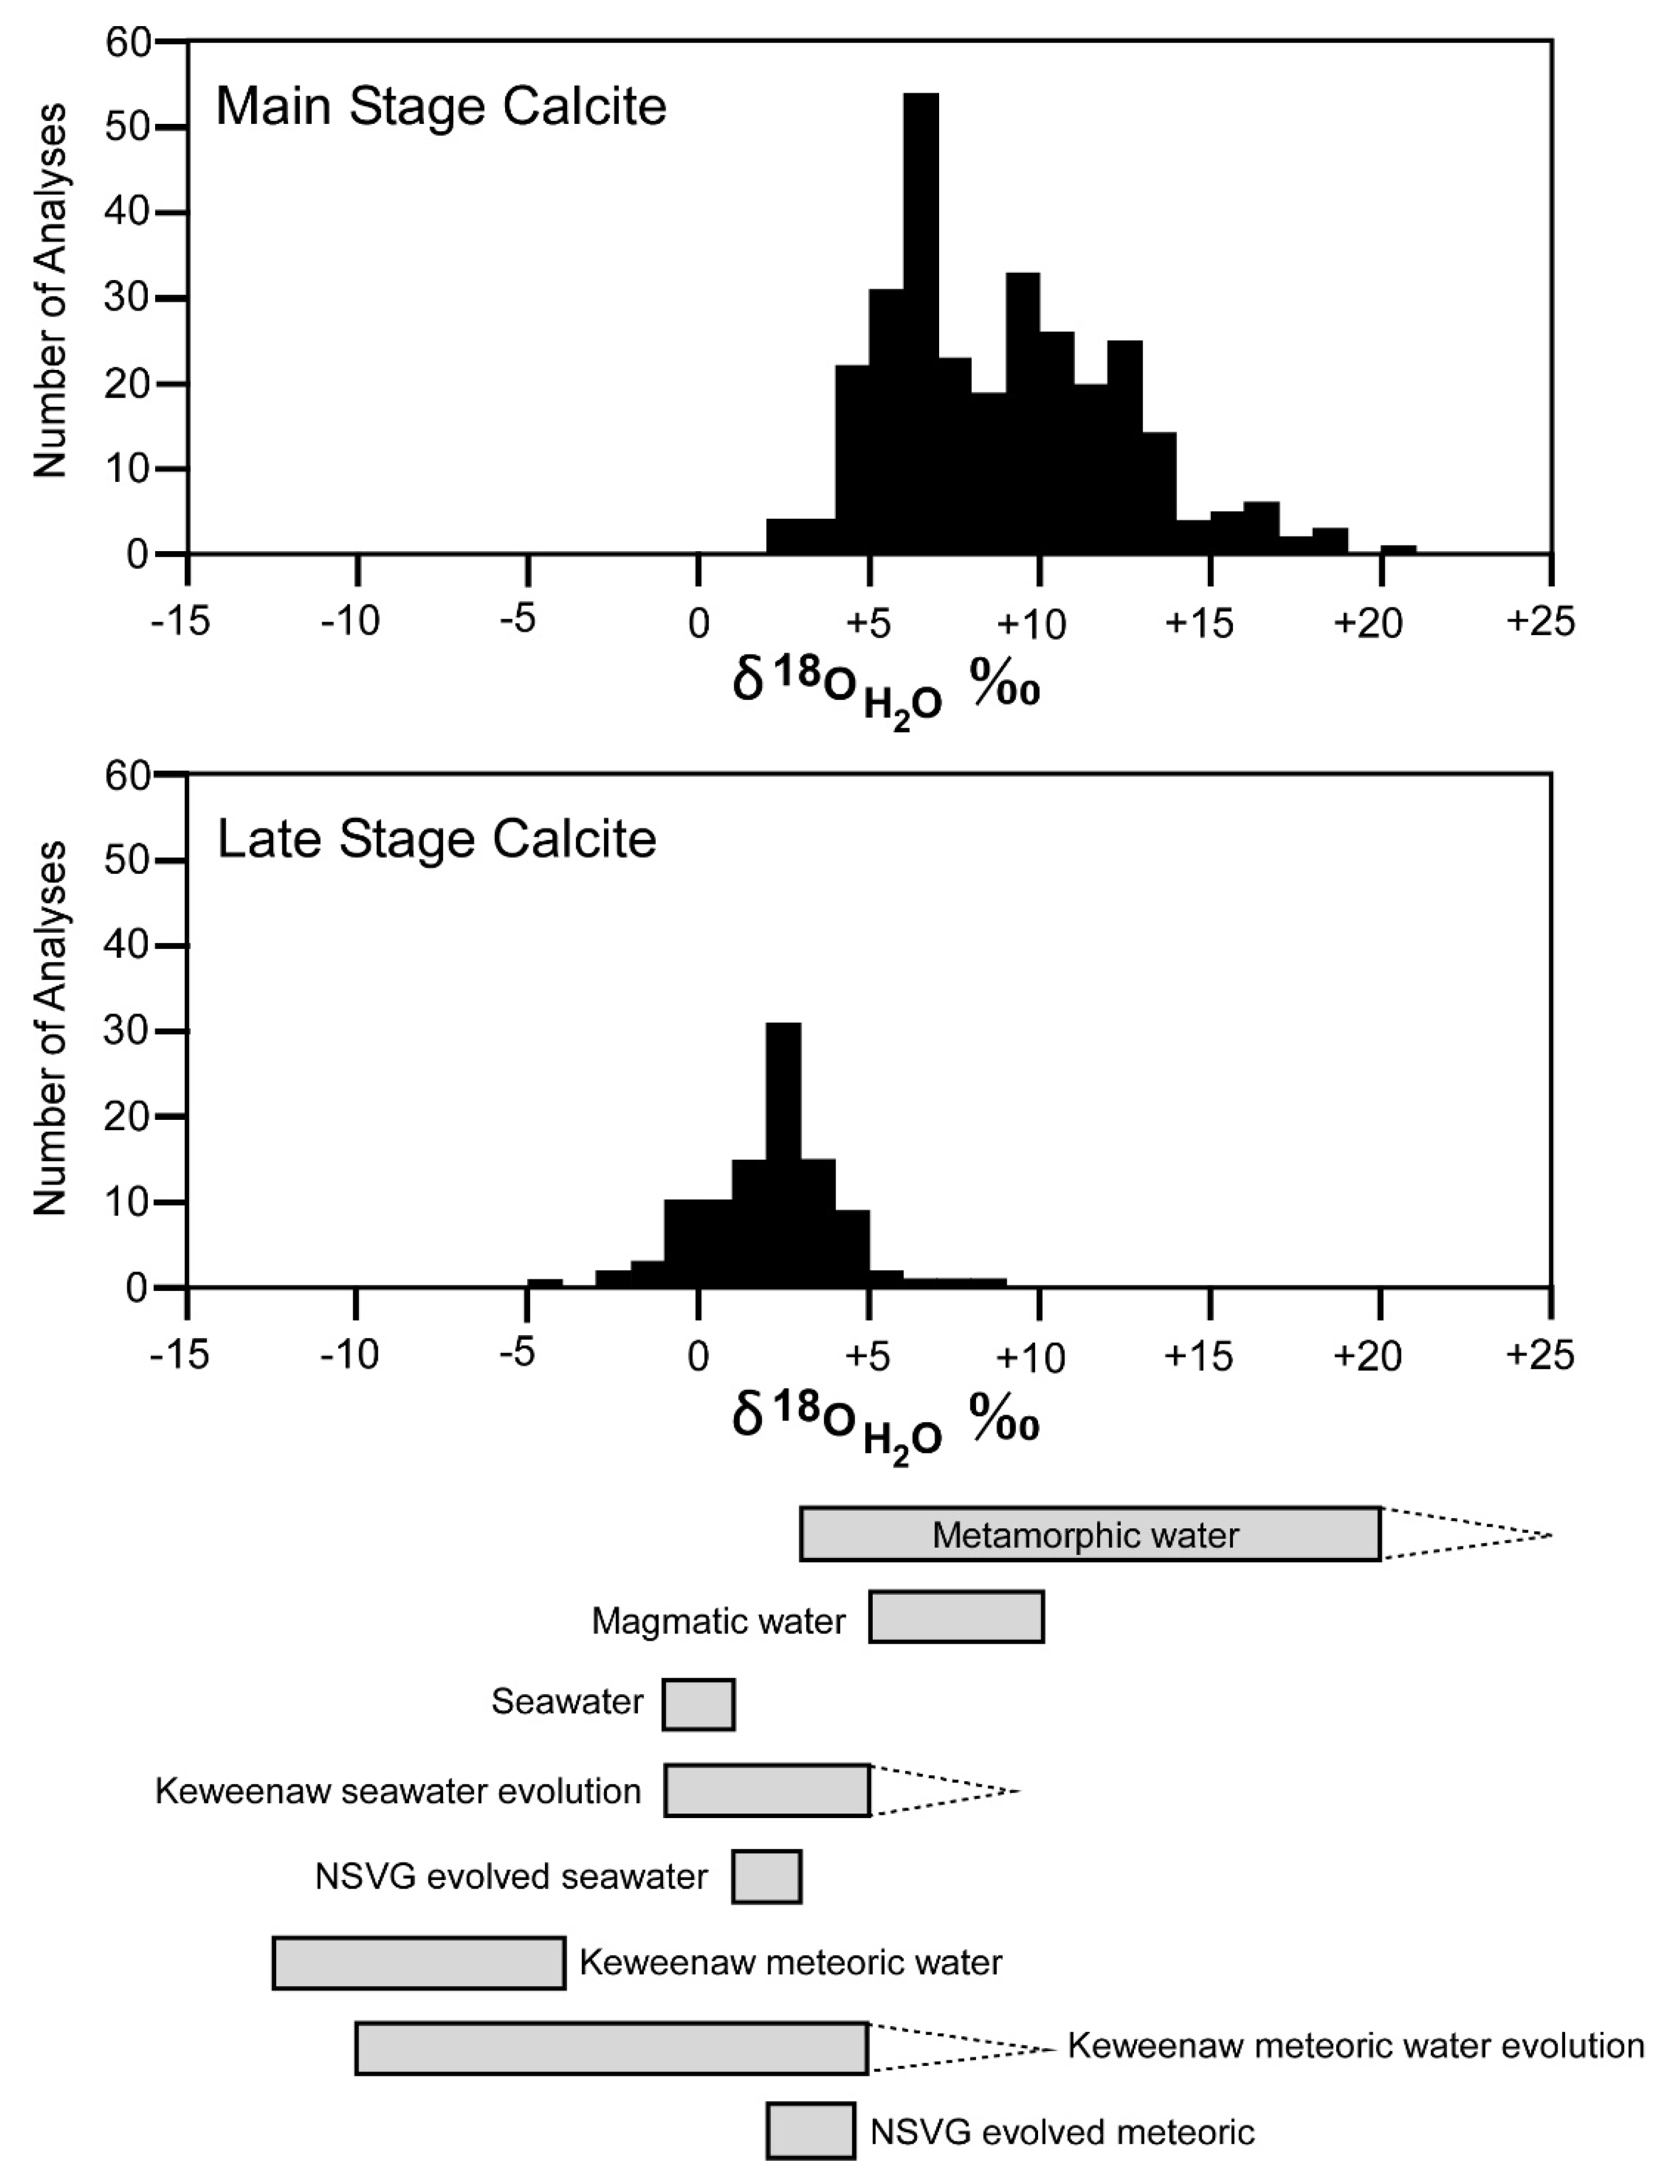
The δ
18O
H2O values were mostly within the range for metamorphic waters proposed by Sharp [
51] (
Figure 7). Only three samples fell below −3‰. Values of δ
18O
H2O greater than +10‰ were within the δ
18O
H2O range for only metamorphic waters; these represent ~30% of the measured values. While it is possible to explain the δ
18O
H2O as almost exclusively of metamorphic origin, the standard metamorphic range is large enough to encompass the wide variety of world-wide metamorphic protoliths and variable conditions. Thus, such a range is not necessarily applicable to a single geologic setting.
The isotopic composition of metamorphic waters depends on factors such as cumulative or bulk δ
18O composition of the protolith, temperature, fluid-to-rock ratio, fractionation between the rock and fluid, fraction of element remaining, and batch (closed system) versus Rayleigh (open system) fractionation [
51,
59]. Metamorphic fluids with high δ
18O
H2O, tend to be from metamorphosed sedimentary rocks with pre-metamorphic elevated δ
18O. Metamorphic dehydration reactions typically result in a shift in whole-rock values of less than a few per mil and more commonly less than 1‰ [
51]. Thus, the isotopic composition of metamorphic fluids, for a first approximation, can be assumed to be similar to the pre-metamorphic bulk rock isotopic composition.
The thick rift-filling section within the source zone (
Figure 3) is basalt-dominated with interbedded rhyolite and volcaniclastic sedimentary layers. Livnat [
6] found that the least altered massive flow interiors of basalt lava flows of the rift-filling PLV have whole-rock δ
18O typically between +7‰ to +8‰ and up to +10‰. These interiors of flows were likely δ
18O enriched by pre-metamorphic processes [
6]. Park and Ripley [
58] found that 80% of the whole rock δ
18O from the massive interiors of basalt lava flows from the North Shore Volcanic Group (NSVG), stratigraphically slightly older than the PLV, to be less than +10‰ and values of least altered NSVG volcanic and hypabyssal rocks to be in the +5‰ to +8‰. The rift-filling rhyolitic rocks in the PLV have elevated whole-rock δ
18O between +12‰ to +16‰ enriched by pre-metamorphic processes [
6]. In addition to the volcanic rocks, volumetrically minor, immature, volcaniclastic conglomerate and sandstone are interbedded with exposed rift-filling volcanic rocks. These volcaniclastic sedimentary rocks are composed of clasts of mostly rhyolite with lesser basalt and are expected to have pre-metamorphic whole-rock δ
18O elevated above values for basalt or rhyolitic rocks because of limited
18O-rich weathering products and pre-metamorphic meteoric water alteration. The volcaniclastic whole-rock δ
18O is likely between about +10‰ to +20‰. The proportion of the source zone rocks is not well defined, in large part because of a large amount of buried stratigraphic section. As the hydrologic pathways change over time during metamorphism, it is reasonable to expect that individual batches of metamorphic fluid could be derived from a restricted volume of rocks of lesser abundance. Thus, the possible range in the isotopic composition of batches of fluids derived by metamorphic processes could be from between +5‰ to +20 ‰, or perhaps slightly higher. We estimate that the most common δ
18O
H2O of a batch of fluid derived by metamorphic processes is about +7‰ to +13‰. By this reasoning, it is possible to explain most of the δ
18O
H2O values as simply derived by metamorphic processes, with the higher values representing batches of fluid derived from restricted volumes of rock. However, in addition to the three δ
18O
H2O values of +3‰ or less, there are an additional 26 values of +5‰ or less, for a total of 29 values or 10% of the values that are not easily explained by metamorphic processes alone. Those values between +5‰ to +7‰ are less easily explained by metamorphic processes alone, as they are below the predicted most common values of the metamorphogenic-hydrothermal fluid. We interpret that all δ
18O
H2O values of +7‰ or less, or a total of 116 values (40% of the data), are readily explained by mixing between a metamorphic-derived fluid and an additional fluid. To explain all of the lower δ
18O
H2O values of the hydrothermal fluids, the oxygen isotope composition of this added fluid was less than about +2‰.
The oxygen isotope data are consistent with metamorphic processes dominating the ore-forming hydrothermal fluids; however, we conclude that metamorphic processes alone are not responsible for the entirety of the large variation in oxygen isotopic composition of the hydrothermal fluids (
Figure 7). An additional type of fluid was likely involved in the hydrothermal system.
6.3. Main-Stage Hydrothermal Fluid Oxygen and Carbon Isotope Co-Variation
The carbon isotope composition of the hydrothermal fluids when combined with the oxygen isotope composition provides an additional constraint on the sources of waters in the hydrothermal system, although the carbon isotope fingerprint of the source of waters is less clear. The predicted conditions of ore-forming fluid [
6,
8] indicate that calculated δ
13C
CO2 is approximately δ
13C
ƩC of the fluids [
43].
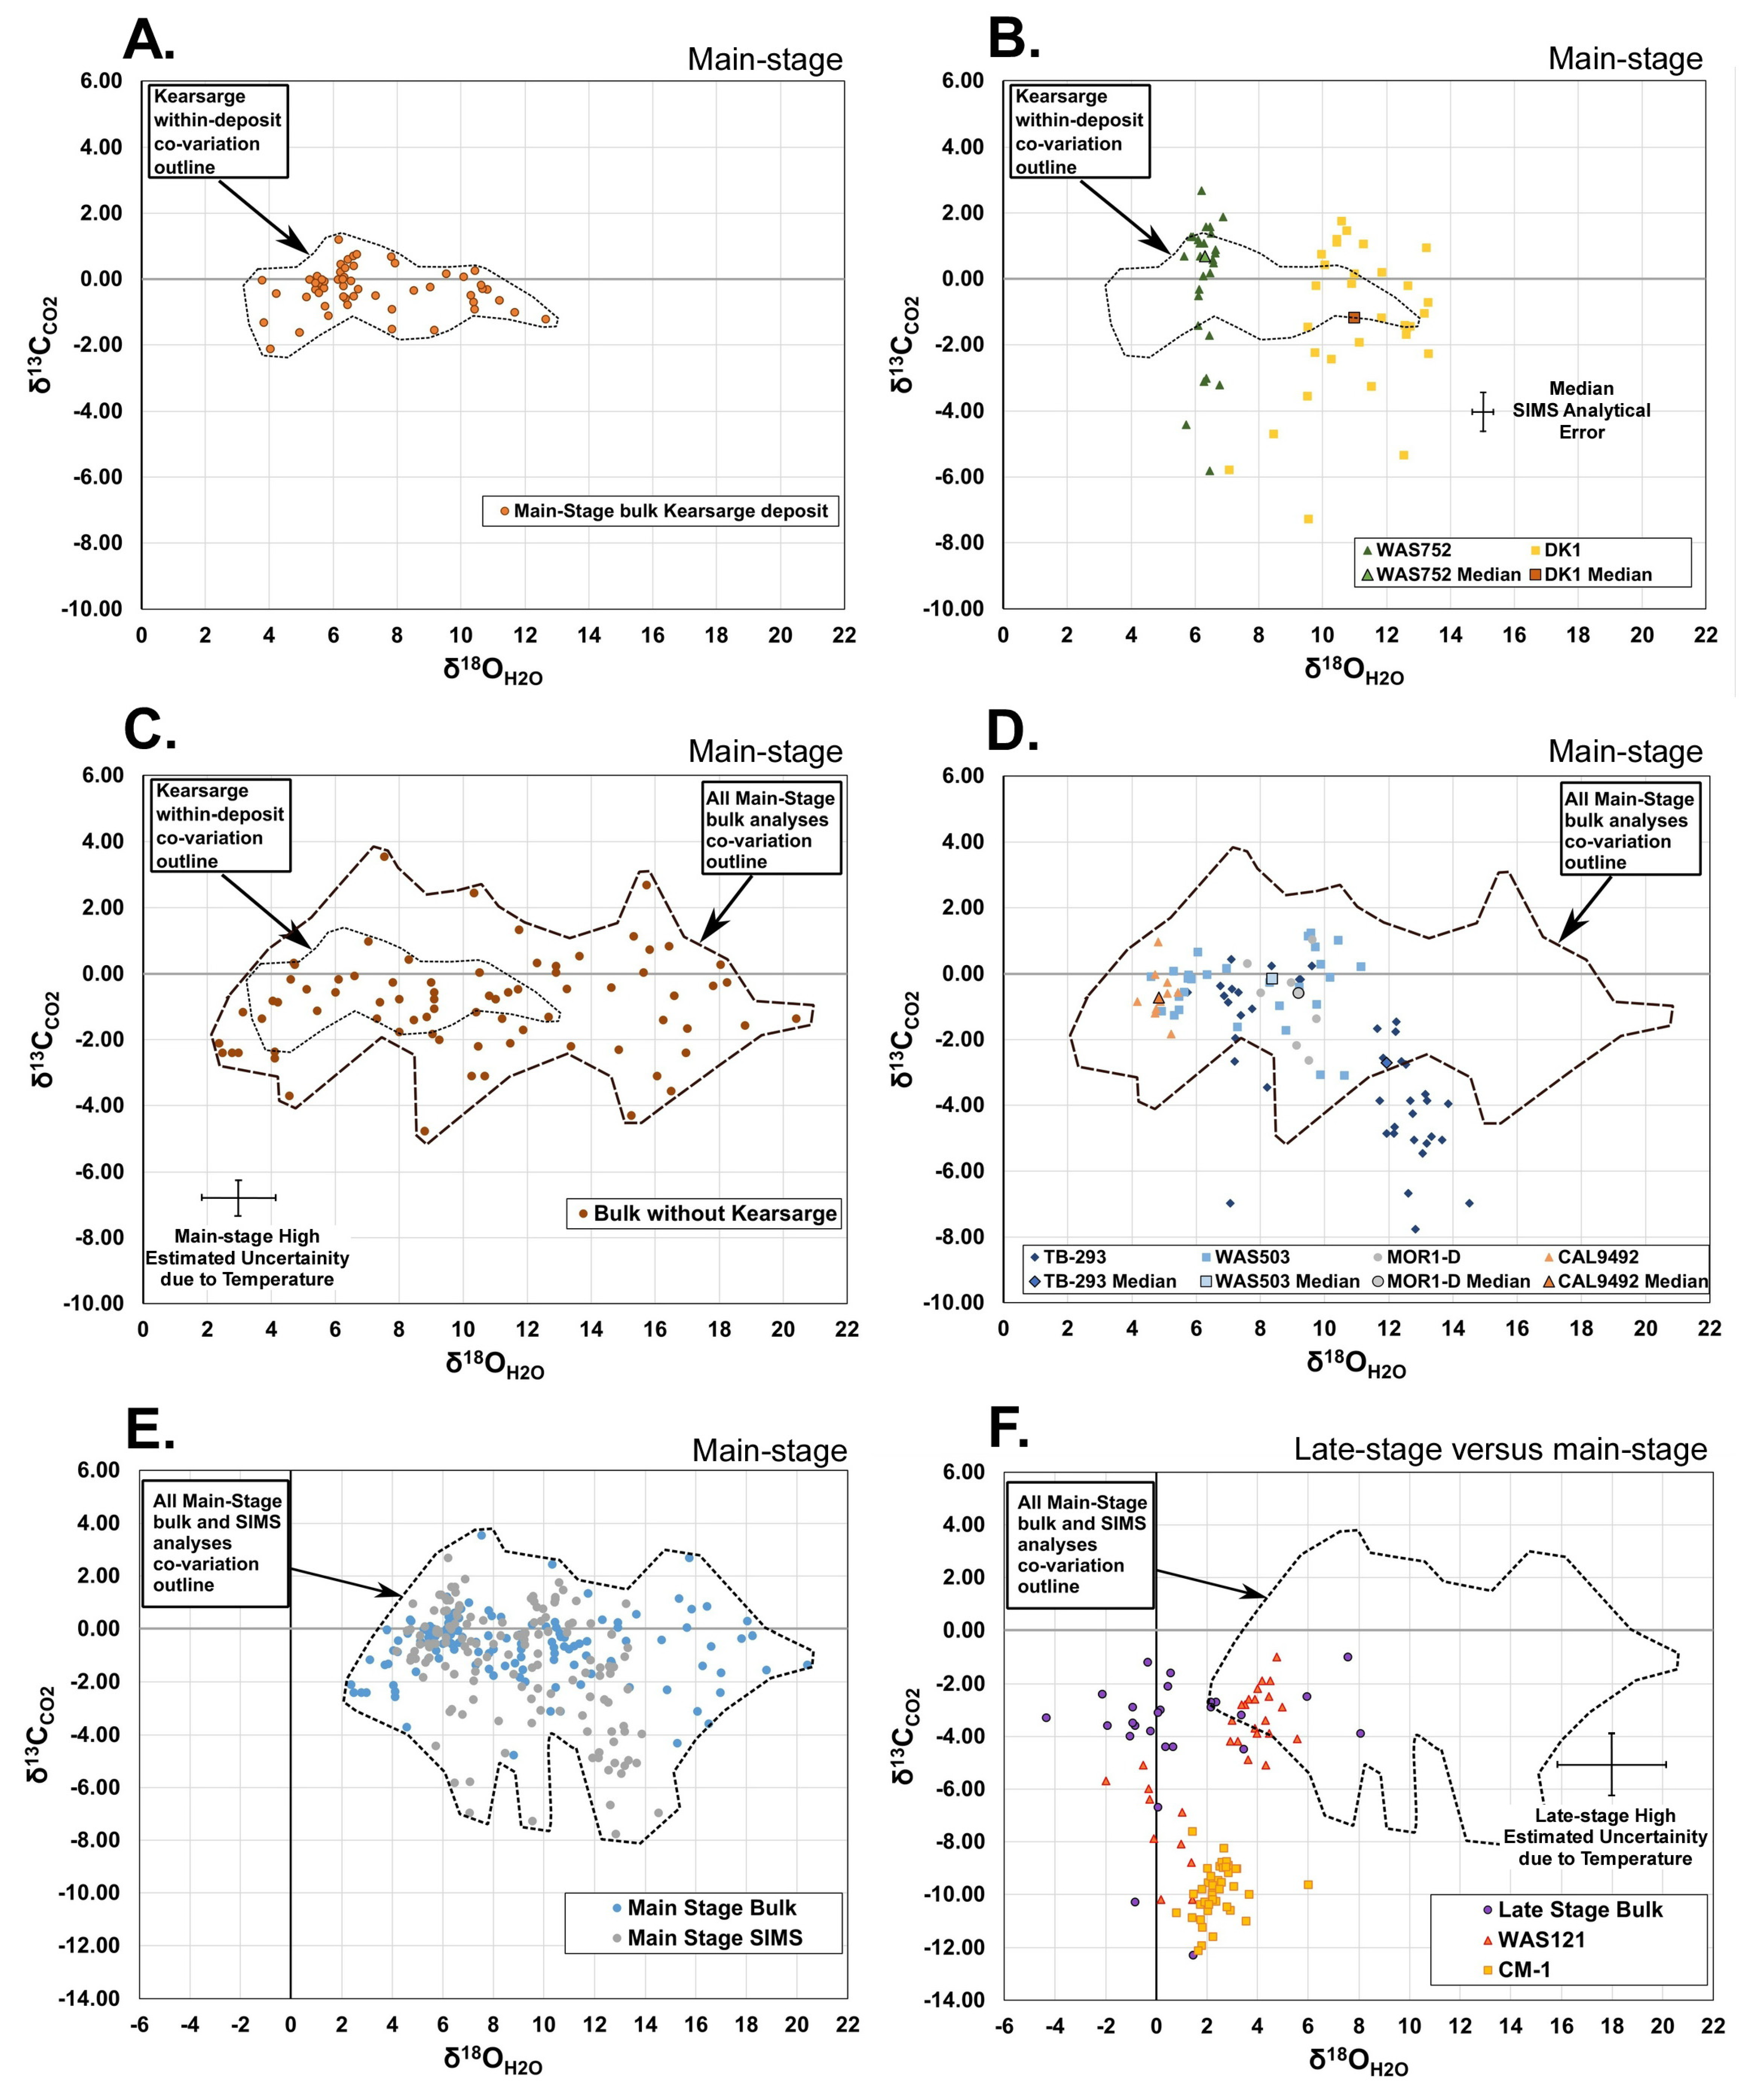
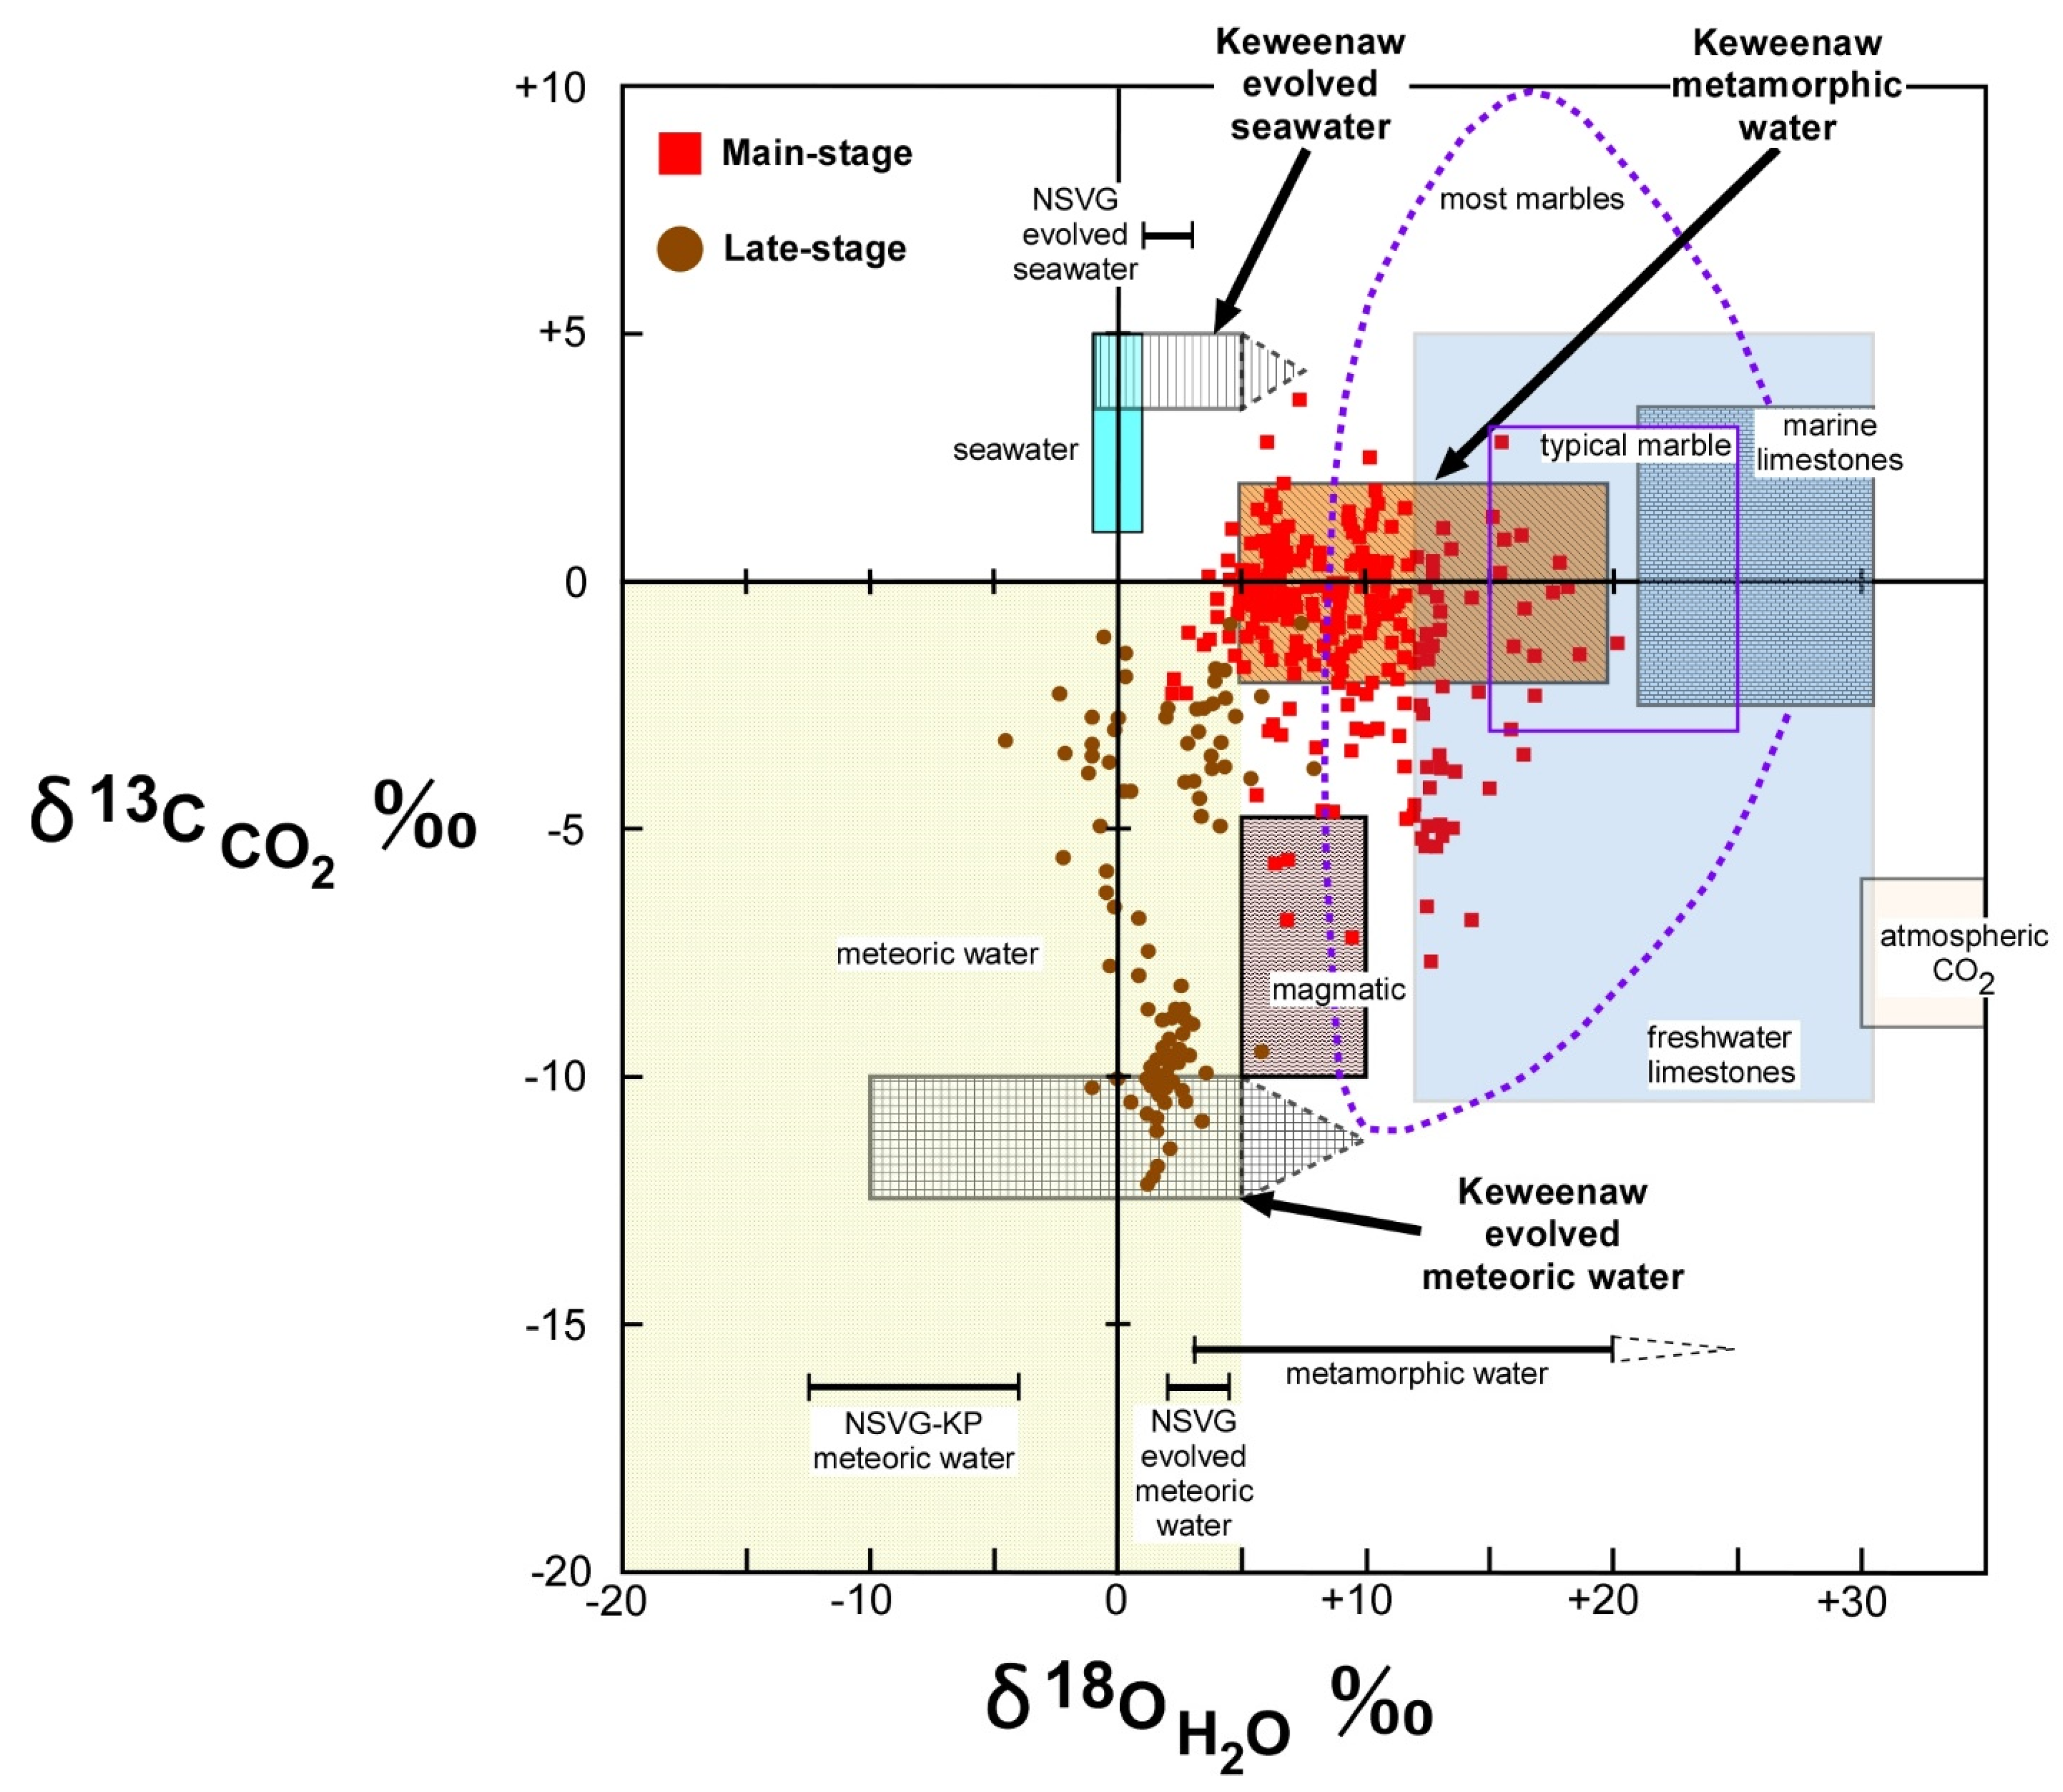
Most of the δ
13C
CO2 values calculated for the hydrothermal fluids fell within a band between −2‰ to +2‰, with the highest concentration between −1‰ to +1‰, with variable δ
18O
H2O (
Figure 5E and
Figure 8). The band is approximately in the middle of the carbon isotope range for marble and marine limestone and is above the carbon isotope range of magmatic CO
2 with only few values falling within the magmatic range (
Figure 8). The δ
13C
CO2 values fell within the carbon isotope range for freshwater limestone.
Like oxygen, the carbon isotope composition of hydrothermal fluids derived via metamorphism depends on several factors, especially the bulk δ
13C composition of the protolith and, similarly, the metamorphic derived CO
2 is expected to have about the same isotopic composition as the protolith being metamorphosed. The source area igneous rocks are expected to have a low abundance of carbon with magmatic δ
13C of −10‰ to −4‰. We expect the abundance of magmatic carbon in the rift-filling basalt-dominated source rocks will be overwhelmed by post-emplacement pre-metamorphic added carbon. Pre-metamorphic carbon is also likely the dominant source of carbon in the interbedded red-colored volcaniclastic sedimentary rocks. The climatic setting of the Midcontinent Rift was arid to semi-arid [
19,
23] and such climates are well known for the formation of widespread caliche. In continental arid and semi-arid regions caliche is an important sink of carbon [
60]. The similarity of δ
13C in carbonates since the Mesoproterozoic suggests that modern oceanic and atmospheric carbon isotopic values are generally representative of the Mesoproterozoic. Caliche influenced calcite cement has been documented in interbedded volcaniclastic sedimentary rocks within PLV as well as the overlying clastic sedimentary rocks of the Copper Harbor Formation [
19,
61]. Caliche forms in the tops of subaerial basalt lava flows and along fractures. Caliche on young basalt in Arizona, USA has a δ
13C of between −7‰ to +14‰, midpoint of about +3.5‰, as compared to atmospheric CO
2 δ
13C of −7‰ [
62]. Calcite cement and caliche precipitated from water in equilibrium with an atmospheric CO
2 of −7‰, has a δ
13C of about +3‰ at 25 °C. Evaporation resulting in residual waters that then precipitate calcite results in elevated δ
13C above +3‰. The δ
13C values of freshwater limestones of between −11‰ to +5‰ and marine limestones between −4‰ to +4‰ (
Figure 8) provide an additional guide to values for diagenetic carbonate as both meteoric water and seawater could have been present in pore spaces given a non-marine and/or marine environmental setting, which was likely present during deposition of the younger PLV and interbedded volcaniclastic sedimentary rocks. Livnat [
6] determined δ
13C of −1.6 to −4.6‰ for several calcite samples from the overlying Copper Harbor Formation, which are lithologically and environmentally similar to interbedded volcaniclastic sedimentary rocks within the PLV. He classified these samples as calcite cement; however, the origin of this carbonate is uncertain. The range in comparative carbon isotopic composition of pre-metamorphic calcite is large, we estimate possible range in bulk whole-rock δ
13C could be from −4‰ to +4‰ and more likely −2‰ to +2‰, and perhaps within an even smaller range. This bulk whole-rock δ
13C is capable of yielding fluids with metamorphic δ
13C
CO2 that matches the most common carbon isotopic compositions of the hydrothermal fluids from −2‰ to +2‰ and shown as Keweenaw metamorphic water in
Figure 8. Carbon isotope values on both the high and low sides of the most common values may not be the result of metamorphic processes alone.
The oxygen and carbon isotope data are consistent with metamorphic processes dominating the ore-forming hydrothermal fluids. The higher carbon isotope values, above the probable metamorphic range of δ13CCO2 −2‰ to +2‰ were few (four values) and can be readily explained by addition of a fluid with δ13CCO2 of +4‰ or greater (slightly above the highest value). The oxygen isotope composition of this added fluid is not constrained but is likely within the range of observed values.
There was a total of 61 δ
13C
CO2 values (23%) with −2‰ or less that were not easily explained simply by metamorphic processes. Of these values, 22 (8%) have δ
13C
CO2 values with −4‰ or less and are more difficult to explain by metamorphic processes alone. These lowest δ
13C
CO2 values had corresponding δ
18O
H2O between about +5‰ to +15‰ (
Figure 8). The outer envelope of the lower δ
13C
CO2 values converges on δ
13C
CO2 about −10‰ and δ
18O
H2O about +10‰. Mixing of a fluid with δ
13C
CO2 of −10‰ or less could readily explain the lower values as well as δ
13C
CO2 values between −2‰ and −4‰. The oxygen isotope composition of this added fluid is not constrained, but the lowest carbon isotope values suggest the oxygen isotope composition could be within or near the range of measured values.
6.4. Main-Stage Hydrothermal Fluids
A significant amount of the oxygen and carbon isotopic data can be explained by metamorphic fluids alone. However, a significant number of samples are outside of the probable range for metamorphic processes and are not easily explained by metamorphic processes alone. In addition, the low isotopic contrast between metamorphic fluids and likely additional fluids, and the relatively wide range of isotopic composition of metamorphic fluids alone, are permissive of the ore-forming fluids being dominated by metamorphic fluids but also containing a significant amount of other fluids. As described above, the absolute values and heterogeneity of the data are best interpreted to have been the result of mixing of the metamorphic waters with at least two additional waters at two different depths. The carbon isotopes suggest that one of these waters had δ13CCO2 of +4‰ or greater to explain the highest δ13CCO2 values, and the other had δ13CCO2 of −10‰ or less to explain the lower values. At least one of these fluids had δ18OH2O +2‰ or less to explain the lowest δ18OH2O fluids.
There are several candidates for the source of the additional waters. Based on only δ
18O
H2O, the likely candidates are (a) seawater or evolved seawater; (b) meteoric water, and/or evolved meteoric water; and/or magmatic water (
Figure 7). The simplest choice for the source of the additional fluid with δ
13C
CO2 of +4‰ or greater is seawater or evolved seawater (
Figure 8). Given the bulk carbon isotopic composition of the source zone, it seems less likely that evolved meteoric water could have reached δ
13C
CO2 of +4‰ or greater, a value greater than the bulk composition of the source zone. We have estimated the bulk composition of the clastic sedimentary rocks overlying the source zone in which Brown’s [
49,
50] proposed meteoric waters hydrodynamically evolved (
Figure 5B). Compared to the bulk composition, the hydrodynamic evolution of meteoric water in the overlying clastic sedimentary rocks is unlikely to have reached high enough δ
13C
CO2. Evolved seawater could have had high enough δ
13C
CO2 and low enough δ
18O
H2O (+2‰ or less) to explain both the high δ
13C
CO2 and low δ
18O
H2O of the hydrothermal fluids. We propose that evolved formation water with a seawater source mixed with metamorphic-dominated fluids. The mixing of metamorphic fluids with evolved seawater not only explains some of the isotopic variation, it also provides an outside source of salinity for the ore-forming fluids, a critical constraint, as proposed by Brown [
49,
50]. Given the low isotopic contrast, it is permissible that even those samples readily explained by metamorphic fluids alone could have a significant amount of evolved seawater.
Low grade metamorphic/hydrothermal alteration of the NSVG formed within the same time interval as the metamorphic/hydrothermal fluid minerals of the Keweenaw Peninsula [
31,
36]. Using oxygen and limited hydrogen isotope data, Park and Ripley [
58] proposed that the alteration of the NSVG formed from fluids that were a mixture of evolved seawater and evolved meteoric water but lacked a metamorphic water component. The NSVG model supports involvement of evolved seawater in the metamorphic/hydrothermal system of the Keweenaw Peninsula. Additionally, Livnat [
6] proposed seawater played an important role in the hydrothermal fluids based on limited isotopic evidence. However, Püschner [
7] reported that his calculations suggest a seawater component in the hydrothermal system was unlikely.
The second added fluid must have a δ
13C
CO2 of about −10‰ or less, but the oxygen isotopic composition is not well constrained. The likely candidates are (a) meteoric water or evolved meteoric water, or (b) magmatic water (
Figure 8). Based on oxygen-hydrogen isotopic paired data from low grade metamorphic alteration minerals in the NSVG, Park and Ripley [
58] proposed that meteoric waters had δ
18O
H2O between about −10‰ to −12.5‰ and evolved to a δ
18O
H2O of +2‰ to +4.5‰. Their NSVG evolved meteoric water mixed with evolved seawater. This evolved meteoric water, with a range of δ
18O
H2O of +2‰ to +4.5‰, could have had low enough δ
13C
CO2, such as −10‰ to −15‰, to be able to explain the δ
18O
H2O and δ
13C
CO2 variation in the Keweenawan hydrothermal fluids. The magnitude of δ
18O
H2O evolution of meteoric water as proposed by Park and Ripley [
58] is less than that observed for formation waters with a meteoric source from elsewhere; where evolution in δ
18O
H2O can be from about −14‰ up to +10‰, as was documented by Sharp [
51]. The geologic arguments presented above suggest that magmatic water was not a significant component of the hydrothermal fluids and is discussed further in the next section. Therefore, we propose that evolved meteoric water was a component of the hydrothermal fluid. The low δ
13C
CO2 composition of this evolved meteoric water suggests that it was reducing and would have to have been very low in sulfur and likely also low in copper.
6.5. Depth of Fluid Mixing of Main-Stage Hydrothermal Fluids
The ore-forming fluid was generated at depth in a source zone below the native copper deposits by metamorphic dominated processes (
Figure 3). This metamorphic fluid mixed with evolved seawater and evolved meteoric water prior to precipitation of main-stage minerals, including native copper. Mixing of metamorphic fluids with additional isotopically different fluids could have occurred at two end-member depths: in the deep source zone undergoing metamorphism with the additional fluid participating in generating the ore-forming fluid, or in the relatively shallow zone of precipitation with the additional fluid participating in reduction of copper from the fluid to precipitate native copper (
Figure 5C).
One of our proposed additional fluids is evolved seawater. Brown [
49,
50] suggested that an outside source of salinity was needed during generation of the ore-forming fluid by metamorphic processes. Evolved seawater added into the deep source zone would have provided salinity in the source zone and thereby participated with burial metamorphic waters to produce a hybrid ore-forming fluid. At depth in the source zone, we expect the isotopically evolved seawater that is added to the metamorphic fluid would become relatively well mixed resulting in a batch of hybrid ore-forming fluid with a more or less homogeneous isotopic composition. Since the difference in the oxygen and carbon isotopic composition between the metamorphic fluid and evolved seawater is small, even a modest to significant proportion of evolved seawater in a well-mixed hybrid may not result in a recognizable isotopic shift from a metamorphic fluid alone. Thus, a significant proportion of evolved seawater in the hybrid ore-forming fluid is, therefore, permissible.
In contrast to the deep source zone, we expect that the degree of mixing between a hybrid ore-forming and an evolved meteoric water in the zone of precipitation would range from poor to well. Shallow mixing would have a much higher degree of isotopic heterogeneity depending on the isotopic contrast between the waters being mixed. In addition, there is likely a temperature contrast between deep and shallow fluids with the deep sourced fluids being hotter. The consistency of the mineral zones suggests that mixing of the deep and shallow fluids was generally good and resulted in a more or less consistent temperature, resulting in consistent mineral zones. Thus, we expect that the temperature variation within the zone of precipitation due to mixing of fluids with different temperatures to be within the uncertainty of temperature within the zones themselves, as discussed in
Section 4.3. The temperature uncertainty can only explain a limited amount of the isotopic variability.
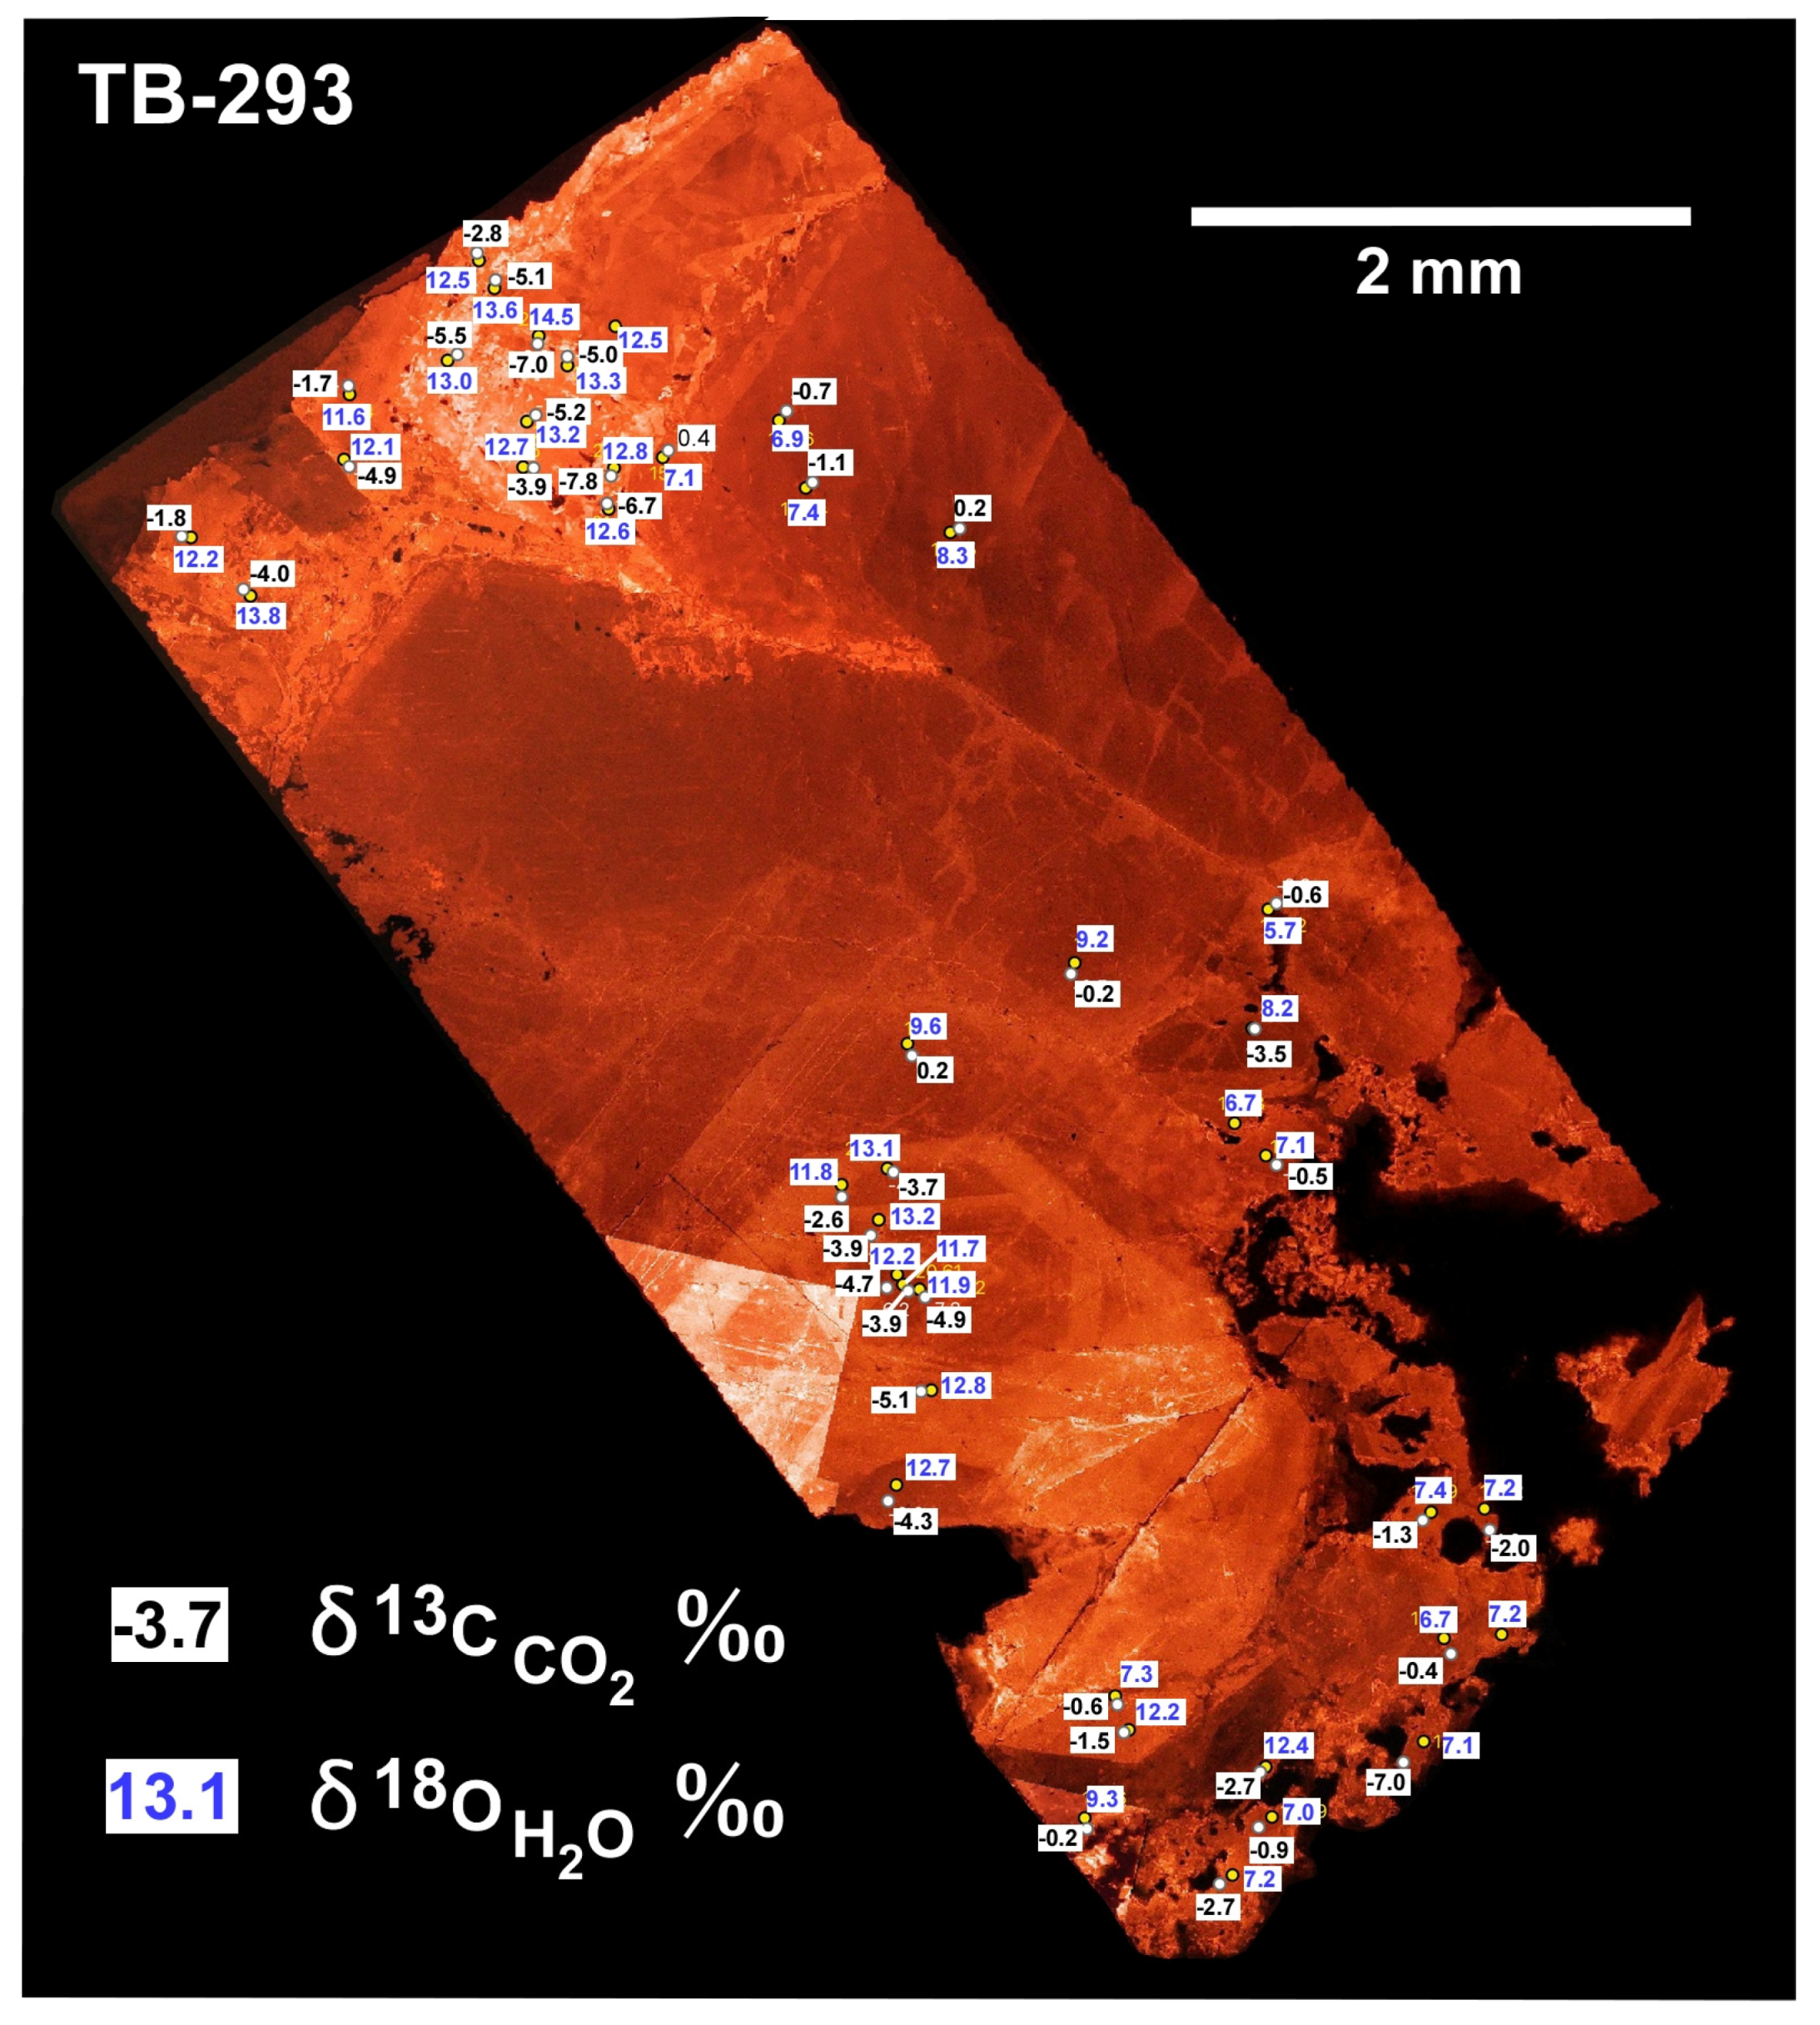
The isotopic composition of the proposed Keweenaw evolved meteoric water is much different than the metamorphic waters or hybrid ore-forming fluid. The spot oxygen and carbon values determined by SIMS document a high degree of within-sample isotopic variation with variation of roughly at least plus or minus 1‰ to 3‰ for both δ
18O
H2O and δ
13C
CO2. This 2‰ variation relative to the median for each (2‰ divided by absolute value of the median) is 24% for oxygen and 360% for carbon. The carbon isotopic data are relatively much more variable than the oxygen isotopic data. There was a high degree of within-sample δ
18O
H2O and especially δ
13C
CO2 variation at the sub-mm to cm scale within a single continuous mass of calcite showing growth rings (
Figure 6). This small-scale variation is especially difficult to ascribe to compositional variation from well-mixed deep processes. The simplest explanation of the high degree of within-sample variation is shallow mixing of evolved meteoric water in the zone of precipitation. The especially high variability in carbon isotope composition of the hydrothermal fluids (
Figure 8) is illuminated by SIMS data (
Figure 5D and
Figure 6) and is apparently averaged away in the bulk data.
The oxygen and carbon isotopic characteristics of magmatic fluids suggest that they potentially could have been mixed with the ore-forming fluids instead of evolved meteoric water (
Figure 8). However, the age range of rift magmatism suggests that if magmatic fluids were a component of the hydrothermal system, it is more likely that such fluids were contributed from deep magma bodies below the source zone during the waning stages of crystallization. Thus, magmatic fluids would have been part of the deep processes where well-mixed metamorphic water and evolved seawater resulted in a hybrid ore-forming fluid. Given the size of the metamorphogenic-hydrothermal system, it is unlikely that magmatic fluids could have made it to shallow depths of the zone of precipitation without becoming part of the hybrid ore-forming fluid. The isotopic data cannot conclusively preclude magmatic fluids as a minor component of hybrid ore-forming fluids as previously concluded by Püschner [
7].
6.6. Late-Stage Fluids
The oxygen and carbon isotopic composition of late-stage calcite was generally different from main-stage calcite (
Figure 5F). There was a bimodal distribution of late-stage carbon and oxygen isotope values less than δ
13C
CO2 ~−5‰ with one group of values overlapping the field of main-stage values and the other being a linear trend with variable carbon from δ
13C
CO2 −12‰ to −1‰ and approximately constant δ
18O
H2O centered around ~0‰ ± 4‰ (
Figure 8). Similar to main-stage fluids, the temperature uncertainty can only explain a limited amount of the isotopic variability.
The overlap between the late-stage and main-stage hydrothermal fluid isotopic compositions suggests they both involve at least one common fluid, likely the hybrid metamorphic-dominated ore-forming fluids (
Figure 8). The two groups of calculated δ
13C
CO2 occur within sample WAS-121 (see
Section 5.3). The cathodoluminescence image of WAS-121 (see
Supplementary Materials) indicates that the group overlapping the field of main-stage values was precipitated before the linear trend; there were at least two pulses of late-stage hydrothermal fluids. Given the low frequency of late-stage hydrothermal fluid oxygen and carbon isotopic values falling within the overlap area, it seems likely that ore-forming fluids were a lessor component in the late-stage hydrothermal fluids. The occurrence of ore-forming hydrothermal fluids in both the main-stage and late-stage hydrothermal event is consistent with the main-stage and late-stage hydrothermal events being continuous with one another.
The linear trend of values is suggestive of mixing of two fluids with different δ
13C
CO2. The likely candidates of these two fluids are either two different meteoric waters or seawater and meteoric water (
Figure 8). The late-stage fluid with δ
13C
CO2 ~−1‰ or greater and δ
18O
H2O ~0‰ could be either seawater or meteoric water, likely shallow evolved seawater. It is unlikely that this fluid is of the same origin as the main-stage evolved sulfur-depleted seawater contributed at depth into the source zone. The relatively low temperatures of precipitation of the late-stage minerals are consistent with the evolution of late-stage seawater in the relatively shallow environment near the depth of the zone of precipitation. In this environment evolved seawater would not necessarily become depleted in sulfur. Since the late-stage fluids are associated with the precipitation of copper sulfides, one of them had a significant amount of sulfur. A late-stage hydrothermal fluid containing shallow evolved seawater with sulfur could have provided the needed late-stage source of sulfur. Alternatively, a late-stage fluid with these isotopic characteristics could have been evolved meteoric water containing sulfur instead of shallow evolved seawater.
The late-stage fluid with δ
13C
CO2 ~−14‰ or less and δ
18O
H2O ~0‰ is likely an evolved meteoric water. This fluid is isotopically similar to the main-stage evolved meteoric water mixed with hybrid ore-forming fluid in the zone of precipitation. If this late-stage fluid is of the same origin as the main-stage evolved meteoric fluid, then it is likely very low or devoid in sulfur requiring the other late-stage fluid to be sulfur-bearing, as described above. Alternatively, this fluid could have been sulfur-bearing consistent with a reducing characteristic indicated by the low δ
13C
CO2. This late-stage evolved meteoric water is similar in δ
18O to the evolved meteoric water component proposed by Park and Ripley [
58] for the NSVG (
Figure 8).
The oxygen and carbon isotopic composition of late-stage hydrothermal fluids suggests that they were likely the result of mixing of three different fluids. A minor component of the late-stage hydrothermal fluids was hybrid metamorphic-dominated ore-forming fluids. The late-stage hydrothermal fluids were dominated by either two types of evolved meteoric waters or evolved meteoric water and seawater. In contrast to the main-stage hydrothermal fluids, at least one of the sources of the late-stage hydrothermal fluids was sulfur-bearing as they precipitated copper sulfides. We favor the hypothesis that the late-stage hydrothermal fluids were dominated by a mix of evolved meteoric water, of similar composition as main-stage meteoric water with shallow evolved seawater and main-stage hybrid metamorphic-dominated native copper ore-forming fluid.
The Paleoproterozoic rocks underlying the edges of the Mid-continent rift contain scattered pyrite in marine deposited sedimentary rocks, metamorphosed before Keweenawan time, and could have been saturated in seawater. As the main-stage ore-forming hydrothermal system collapsed, it is a reasonable hypothesis that seawater from within these rocks could have become a part of the late-stage hydrothermal system, providing a source of sulfur.


