Article

Determination of Potentially Harmful Element (PHE) Distribution in Water Bodies in Krugersdorp, a Mining City in the West Rand, Gauteng Province, South Africa

by
Michael Shapi
1,
Maryam Amra Jordaan
1,*,
Andile Truelove Mbambo
1,
Theophilus Clavell Davies
1,
Emmanuel Chirenje
2 and
Mpumelelo Dube
2
1
Faculty of Natural Sciences, Mangosuthu University of Technology, 511 Mangosuthu Highway, Durban 4031, South Africa
2
Council for Geoscience, Tshwane 0184, South Africa
*
Author to whom correspondence should be addressed.
Minerals 2021, 11(10), 1133; https://doi.org/10.3390/min11101133
Submission received: 23 August 2021 / Accepted: 13 September 2021 / Published: 15 October 2021
(This article belongs to the Special Issue Treatment, Beneficiation, and Valorization of Acid Mine Drainage)

Abstract

:
The town of Krugersdorp in South Africa is the locus of an important wildlife game reserve, the Krugersdorp Game Reserve (KGR), which is juxtaposed by the (<1000 m) down-gradient of the large-scale gold mining outfits of Mintails Mogale Gold (MMG) and Rand Uranium (RU). The aim of the study was to determine the concentration levels of potentially harmful elements (PHEs) that have accumulated due to post-mining activities in the local water bodies in Krugersdorp and to use these data as a prerequisite and basis for formulation of the most appropriate remediation measures. Thirty water samples were collected and analysed in situ for: water temperature, pH, dissolved oxygen (mgl−1), dissolved oxygen (%), total dissolved solids (TDS), oxidation/reduction potential (ORP), and electrical conductivity (EC). This was later followed by laboratory analyses of aliquots of the water samples by ICP-MS for twelve PHEs whose concentration ranges were: As (0.70–32.20), Ag (0.16–105.00), Al (1.00–41.00), Co (0.07–6.16), Cr (1.60–5.00), Cu (0.80–8.00), Fe (23.00–117.00), Mn (0.14–12 255.00), Ni (0.20–7.00), Pb (0.80–6.30), V (1.90–55.20), and Zn (2.20–783.00). Areas of the town where excessive concentration levels of these elements have negatively impacted the health of its wildlife population and surrounding ecosystems are identified, and credible mitigation measures proffered.

1. Introduction

Potentially harmful elements (PHEs) are defined as “… elements that are toxic at certain concentrations to one or more species, but in many cases are also essential nutrients at lower concentrations …” [1]. These elements are ubiquitous in the environment and are associated with natural occurrence (weathering of parent materials or stem from pedogenetic processes) at levels that are regarded as trace (<1000 mg kg−1, and rarely toxic); however, they can also be released from anthropogenic activities [2]. The hydrological environment receives wastes and may serve as the ultimate repository for these anthropogenically remobilized heavy elements [3].
These metallic elements, metalloids, and trace elements are viewed as systemic toxicants that are known to induce numerous organ damages, even at lower levels of exposure [3]. In moderation, some of these PHEs, such as cobalt (Co), copper (Cu), chromium (Cr), iron (Fe), magnesium (Mg), manganese (Mn), molybdenum (Mo), nickel (Ni), selenium (Se), and zinc (Zn), are considered essential elements needed for the normal functioning of the human body. Heavy metals, cadmium (Cd), chromium (Cr), lead (Pb), mercury (Hg), and metalloid Arsenic (As) are highly toxic and are known carcinogens and therefore are of great public health concern [1,2,3,4,5,6]. Acid mine drainage arises predominantly when the mineral pyrite interacts with oxygenated water. The study location therefore encompasses the typical activities that are a source of heavy metal contamination of the ground and surface water [6].
A recent research publication revealed high levels of contamination for As and Co in soils in the Krugersdorp region [6]. This led the investigators of this paper to believe that potentially harmful elements (PHEs) may have accumulated in the surrounding water bodies over the years. PHEs are elements that pose a threat if they exist in values higher than the permissible levels in land and water sources. Furthermore, South Africa, as a developing country, still has a large population of rural and low income communities, which are largely dependent on ground water for essential daily activities, such as drinking, cooking, washing clothes, and crop irrigation. Chronic exposure to heavy metals can result in a range of health issues, such as cancer, cardiovascular diseases, body disorders, and rare skin conditions [5].
Krugersdorp has a long history of gold mining and ore processing activities and has contributed to the formation of acid mine drainage (AMD), which has infiltrated into water in the vicinity of the abandoned mines and surrounding landfills [6]. Acid mine drainage arises predominantly when the mineral pyrite interacts with oxygenated water [6,7]. The study location therefore encompasses the typical activities that are a source of heavy metal contamination of the ground and surface water.
The obvious deterioration of natural water quality through percolation and interaction with the soil and the impact of acid mine drainage (AMD) from the West Rand Basin (Figure 1), inspired the need to garner more detailed information on the levels of concentration of PHEs in the surrounding waterbodies. Such information would also enable the distribution patterns as well as the fate of PHEs around the mining area at Krugersdorp to be more precisely established. The cumulation of this knowledge, it is thought, would form the basis for formulation of the most appropriate remedial measures.

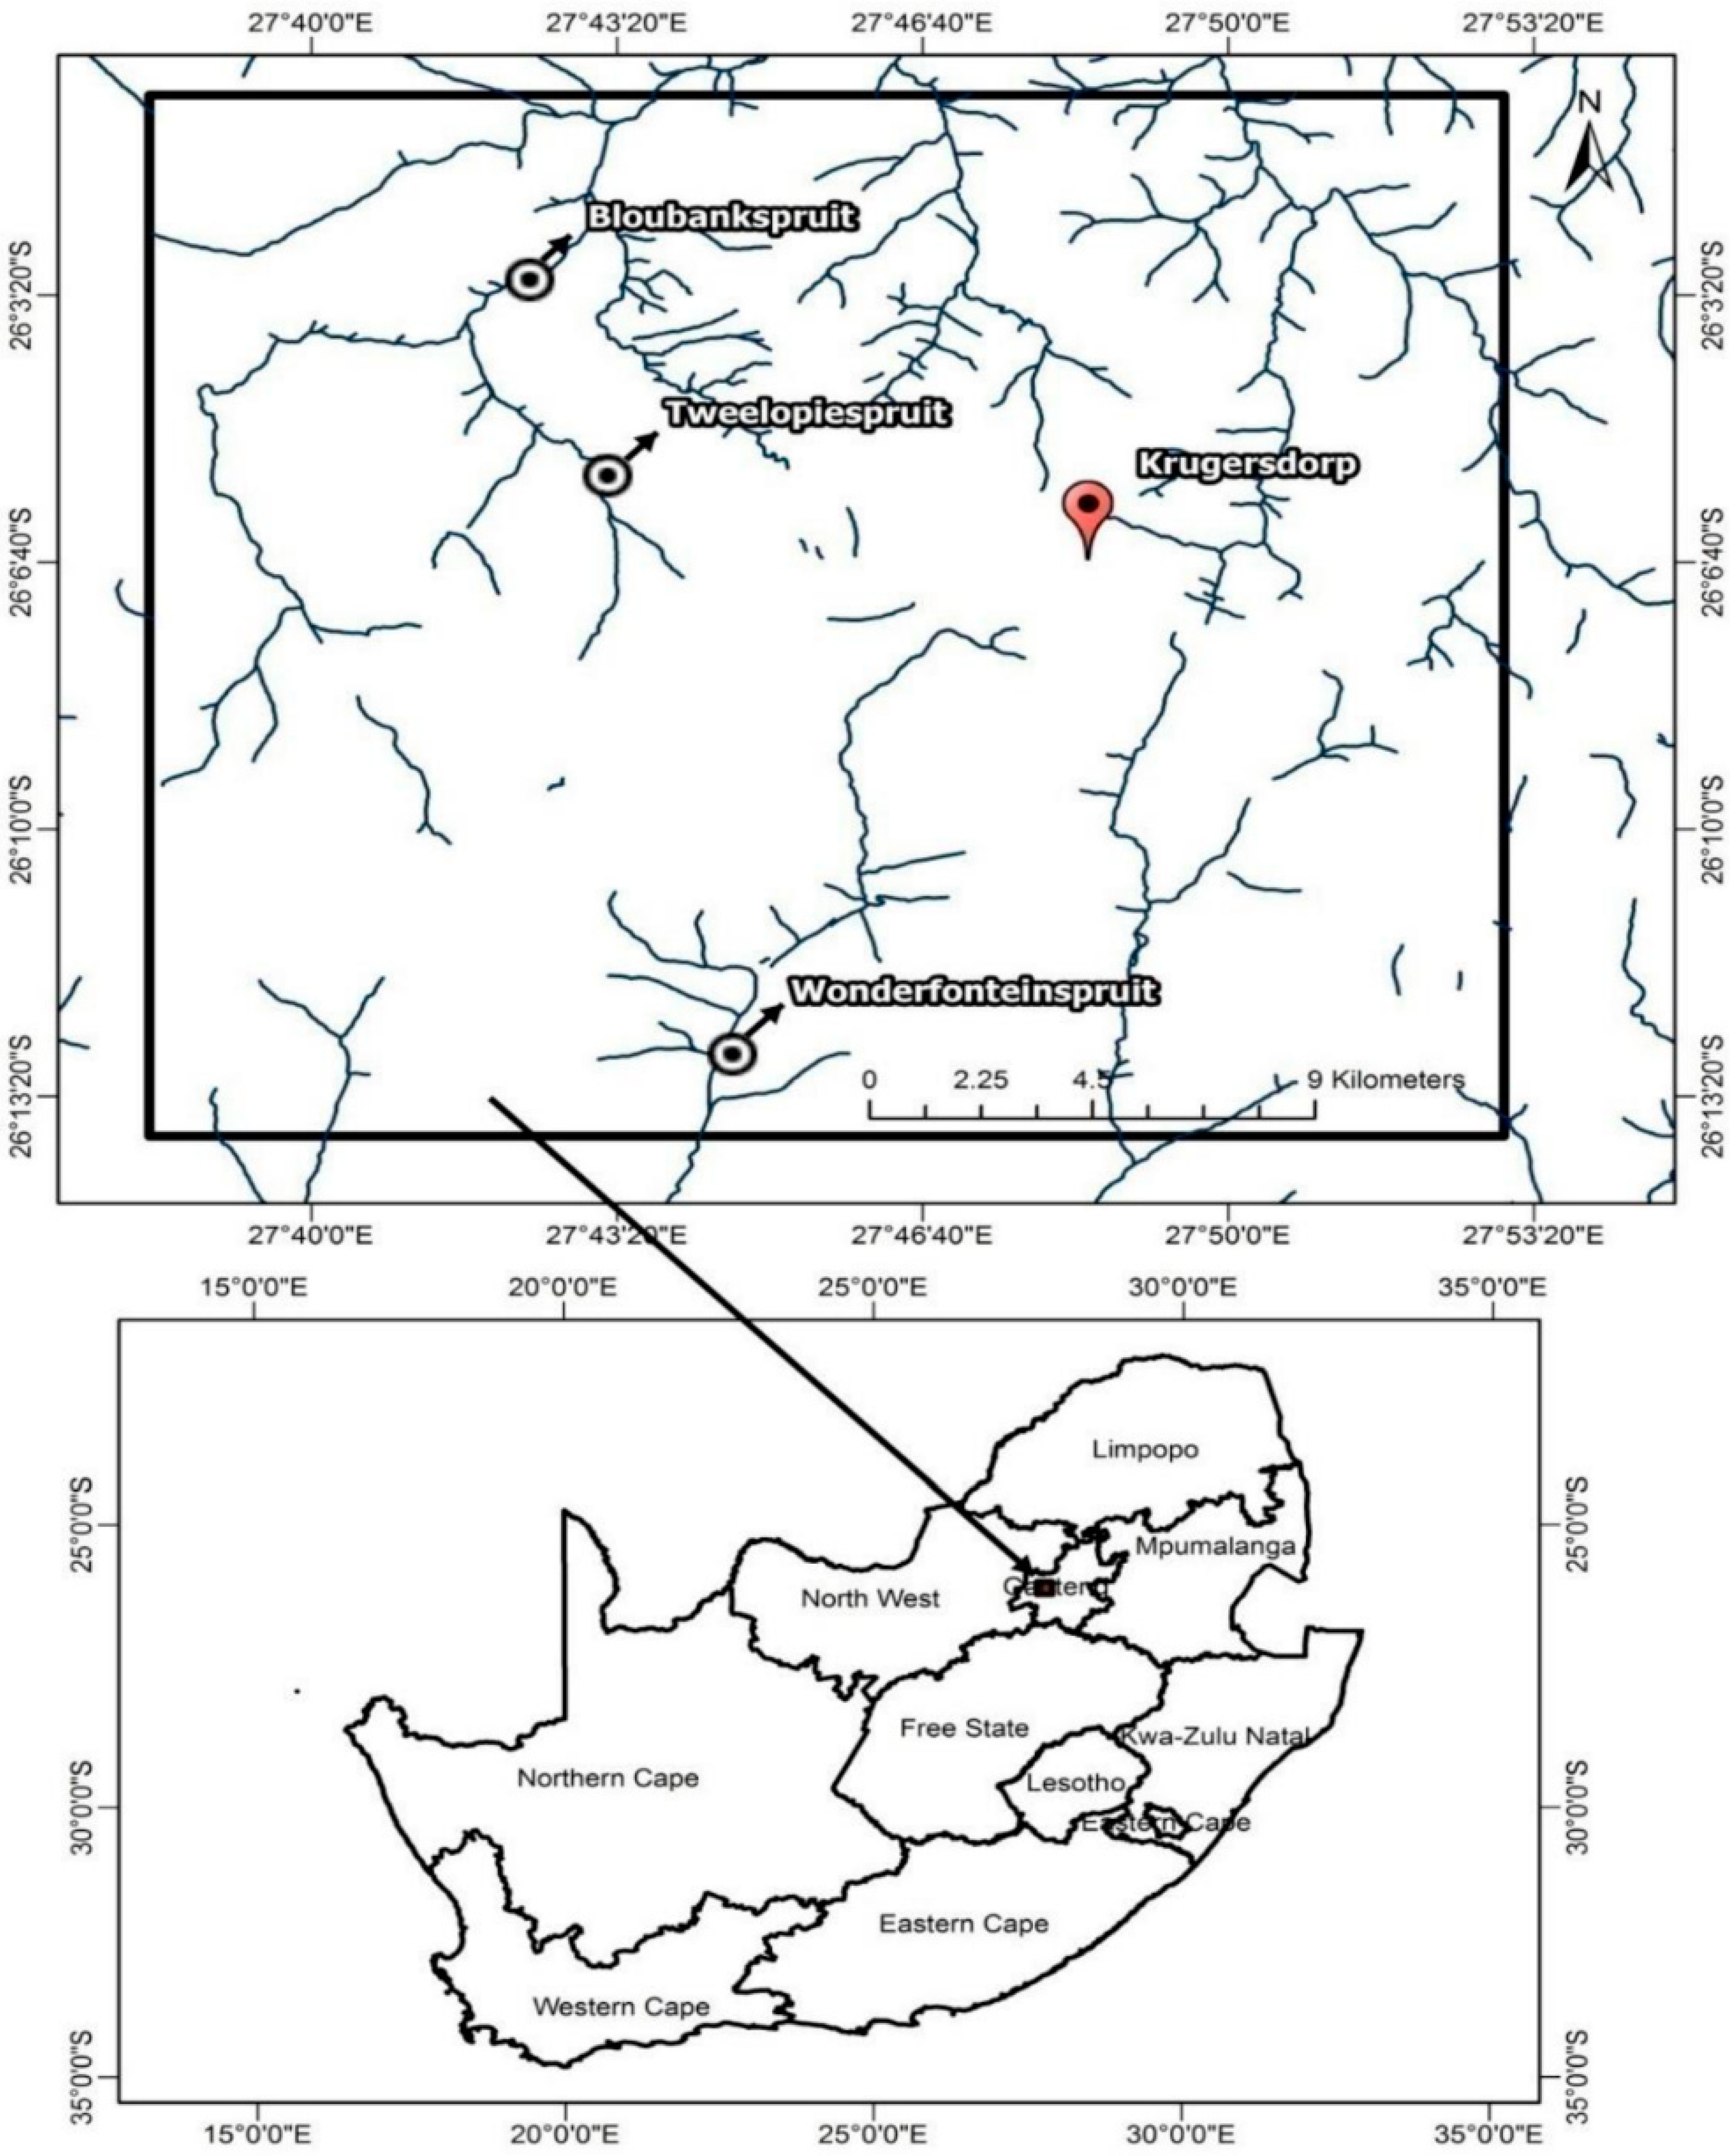
2. Characteristics of the Study Setting
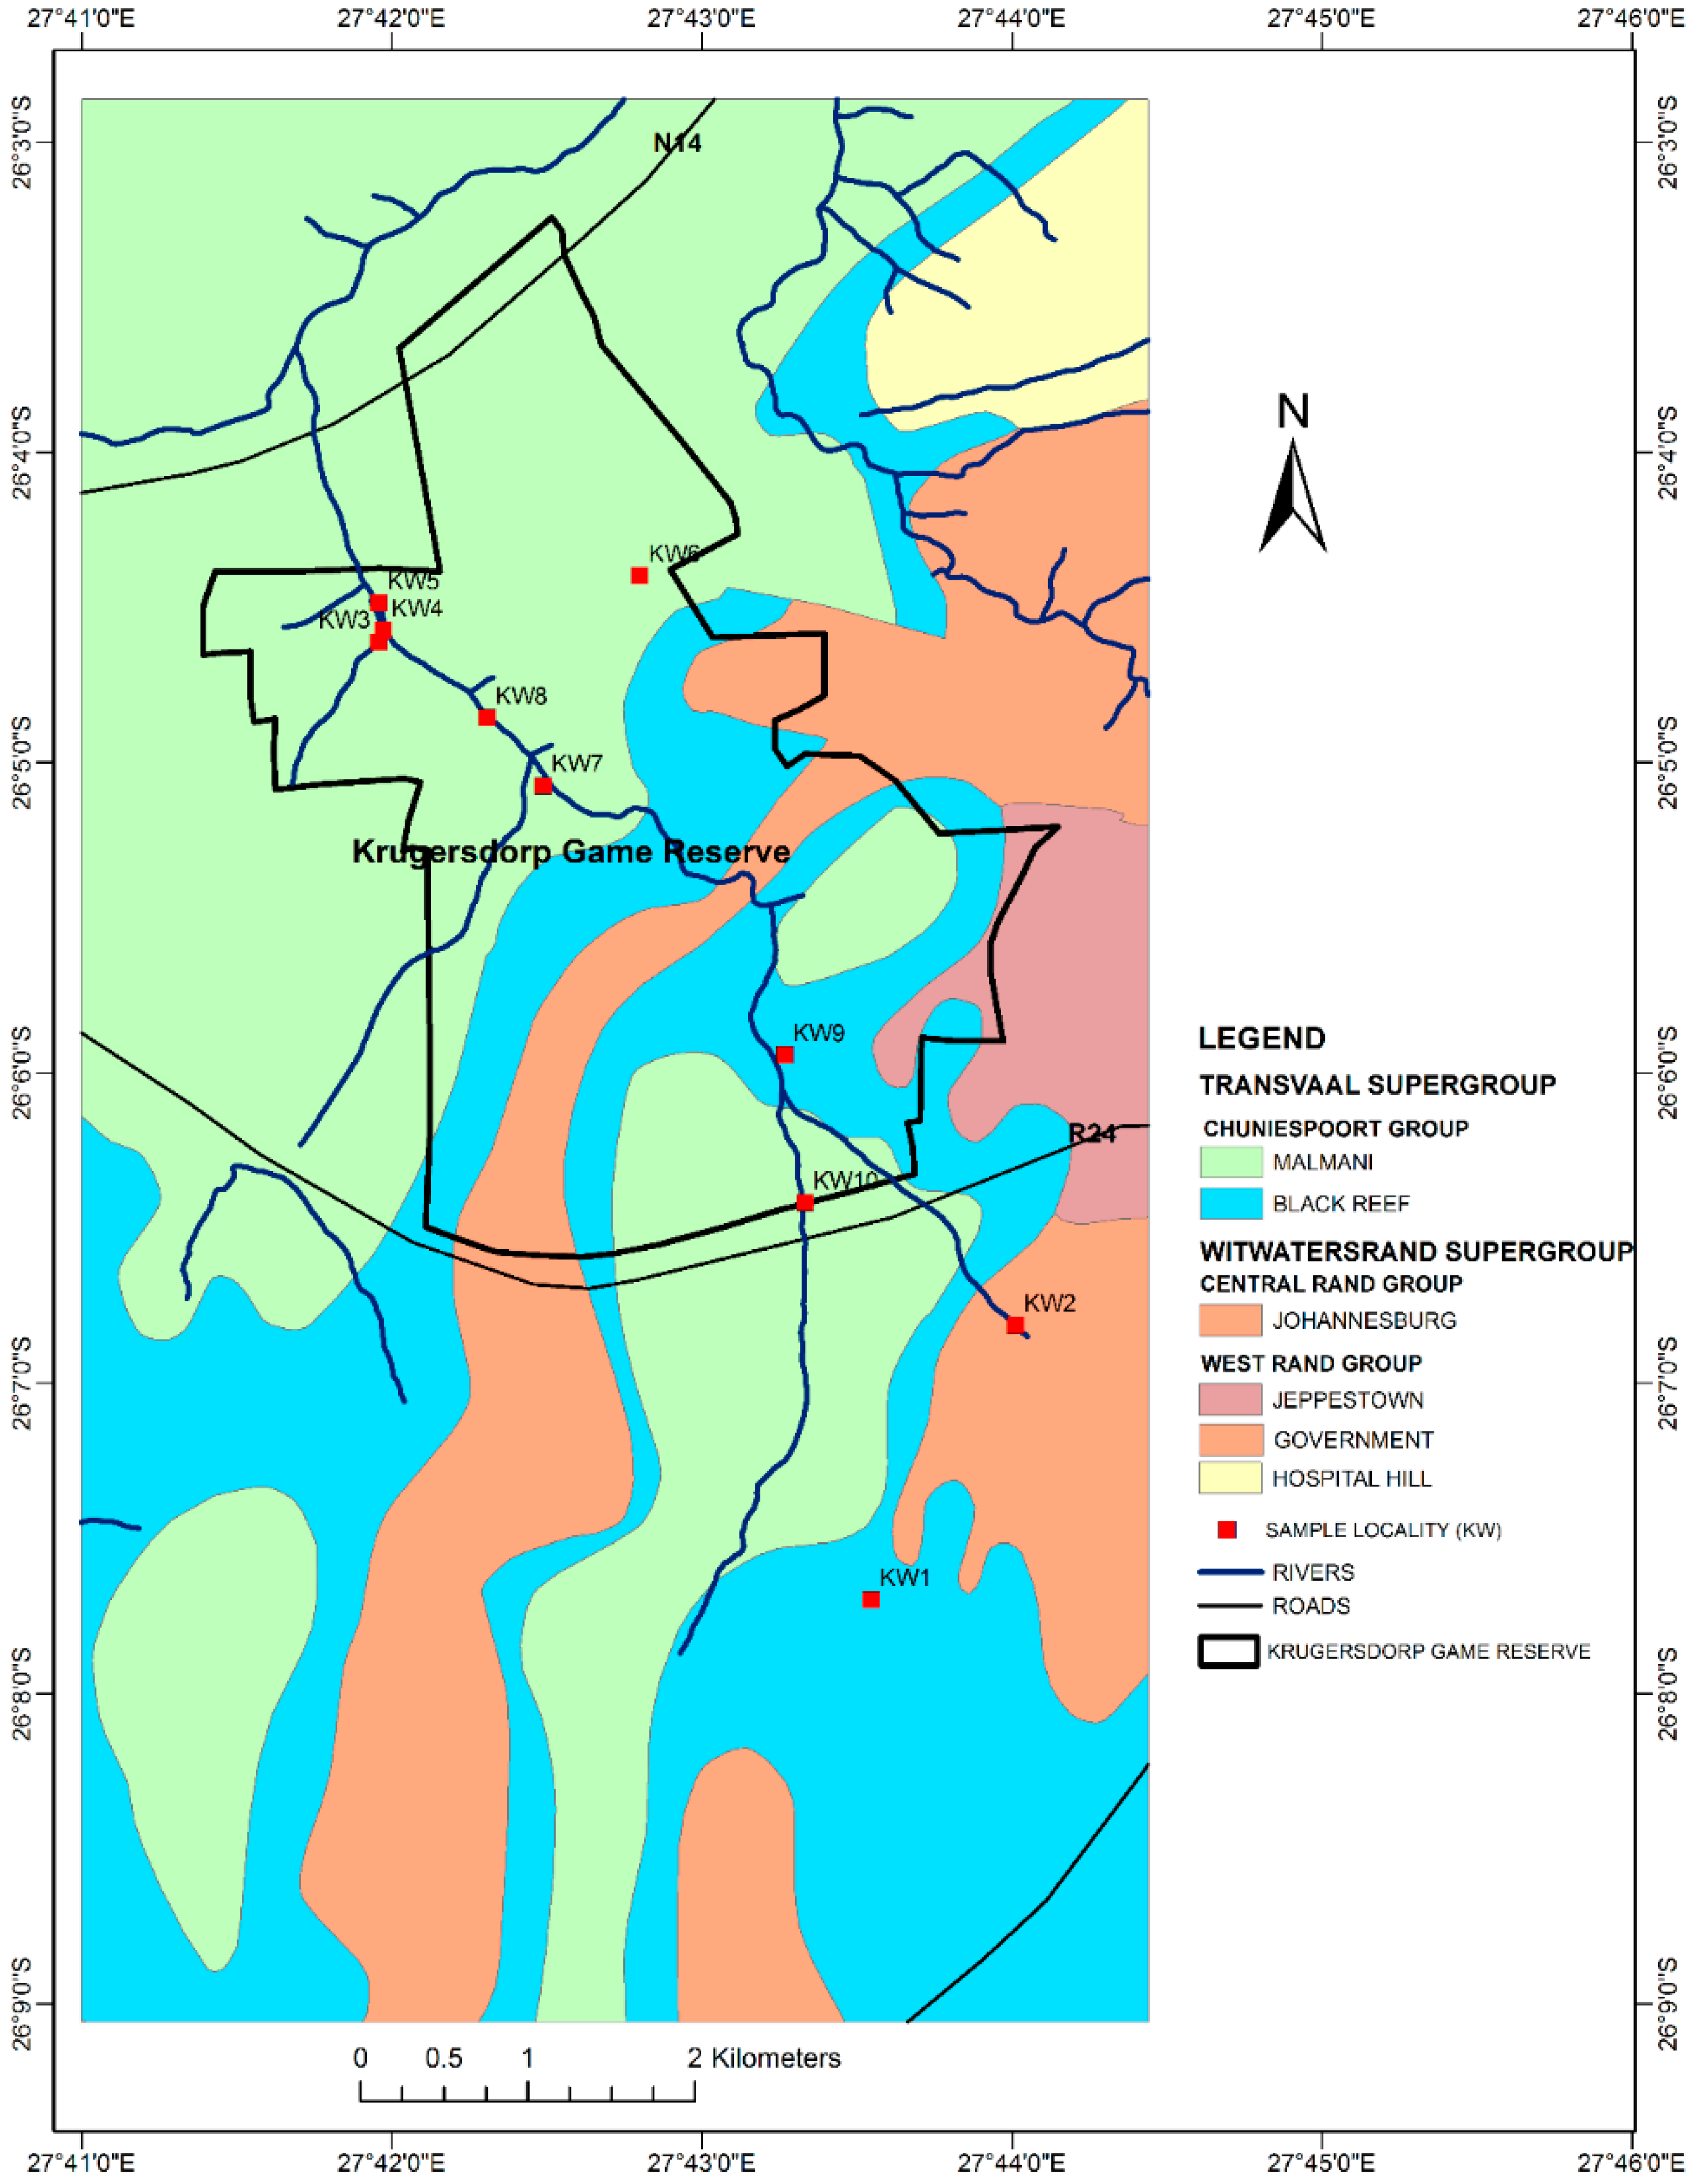
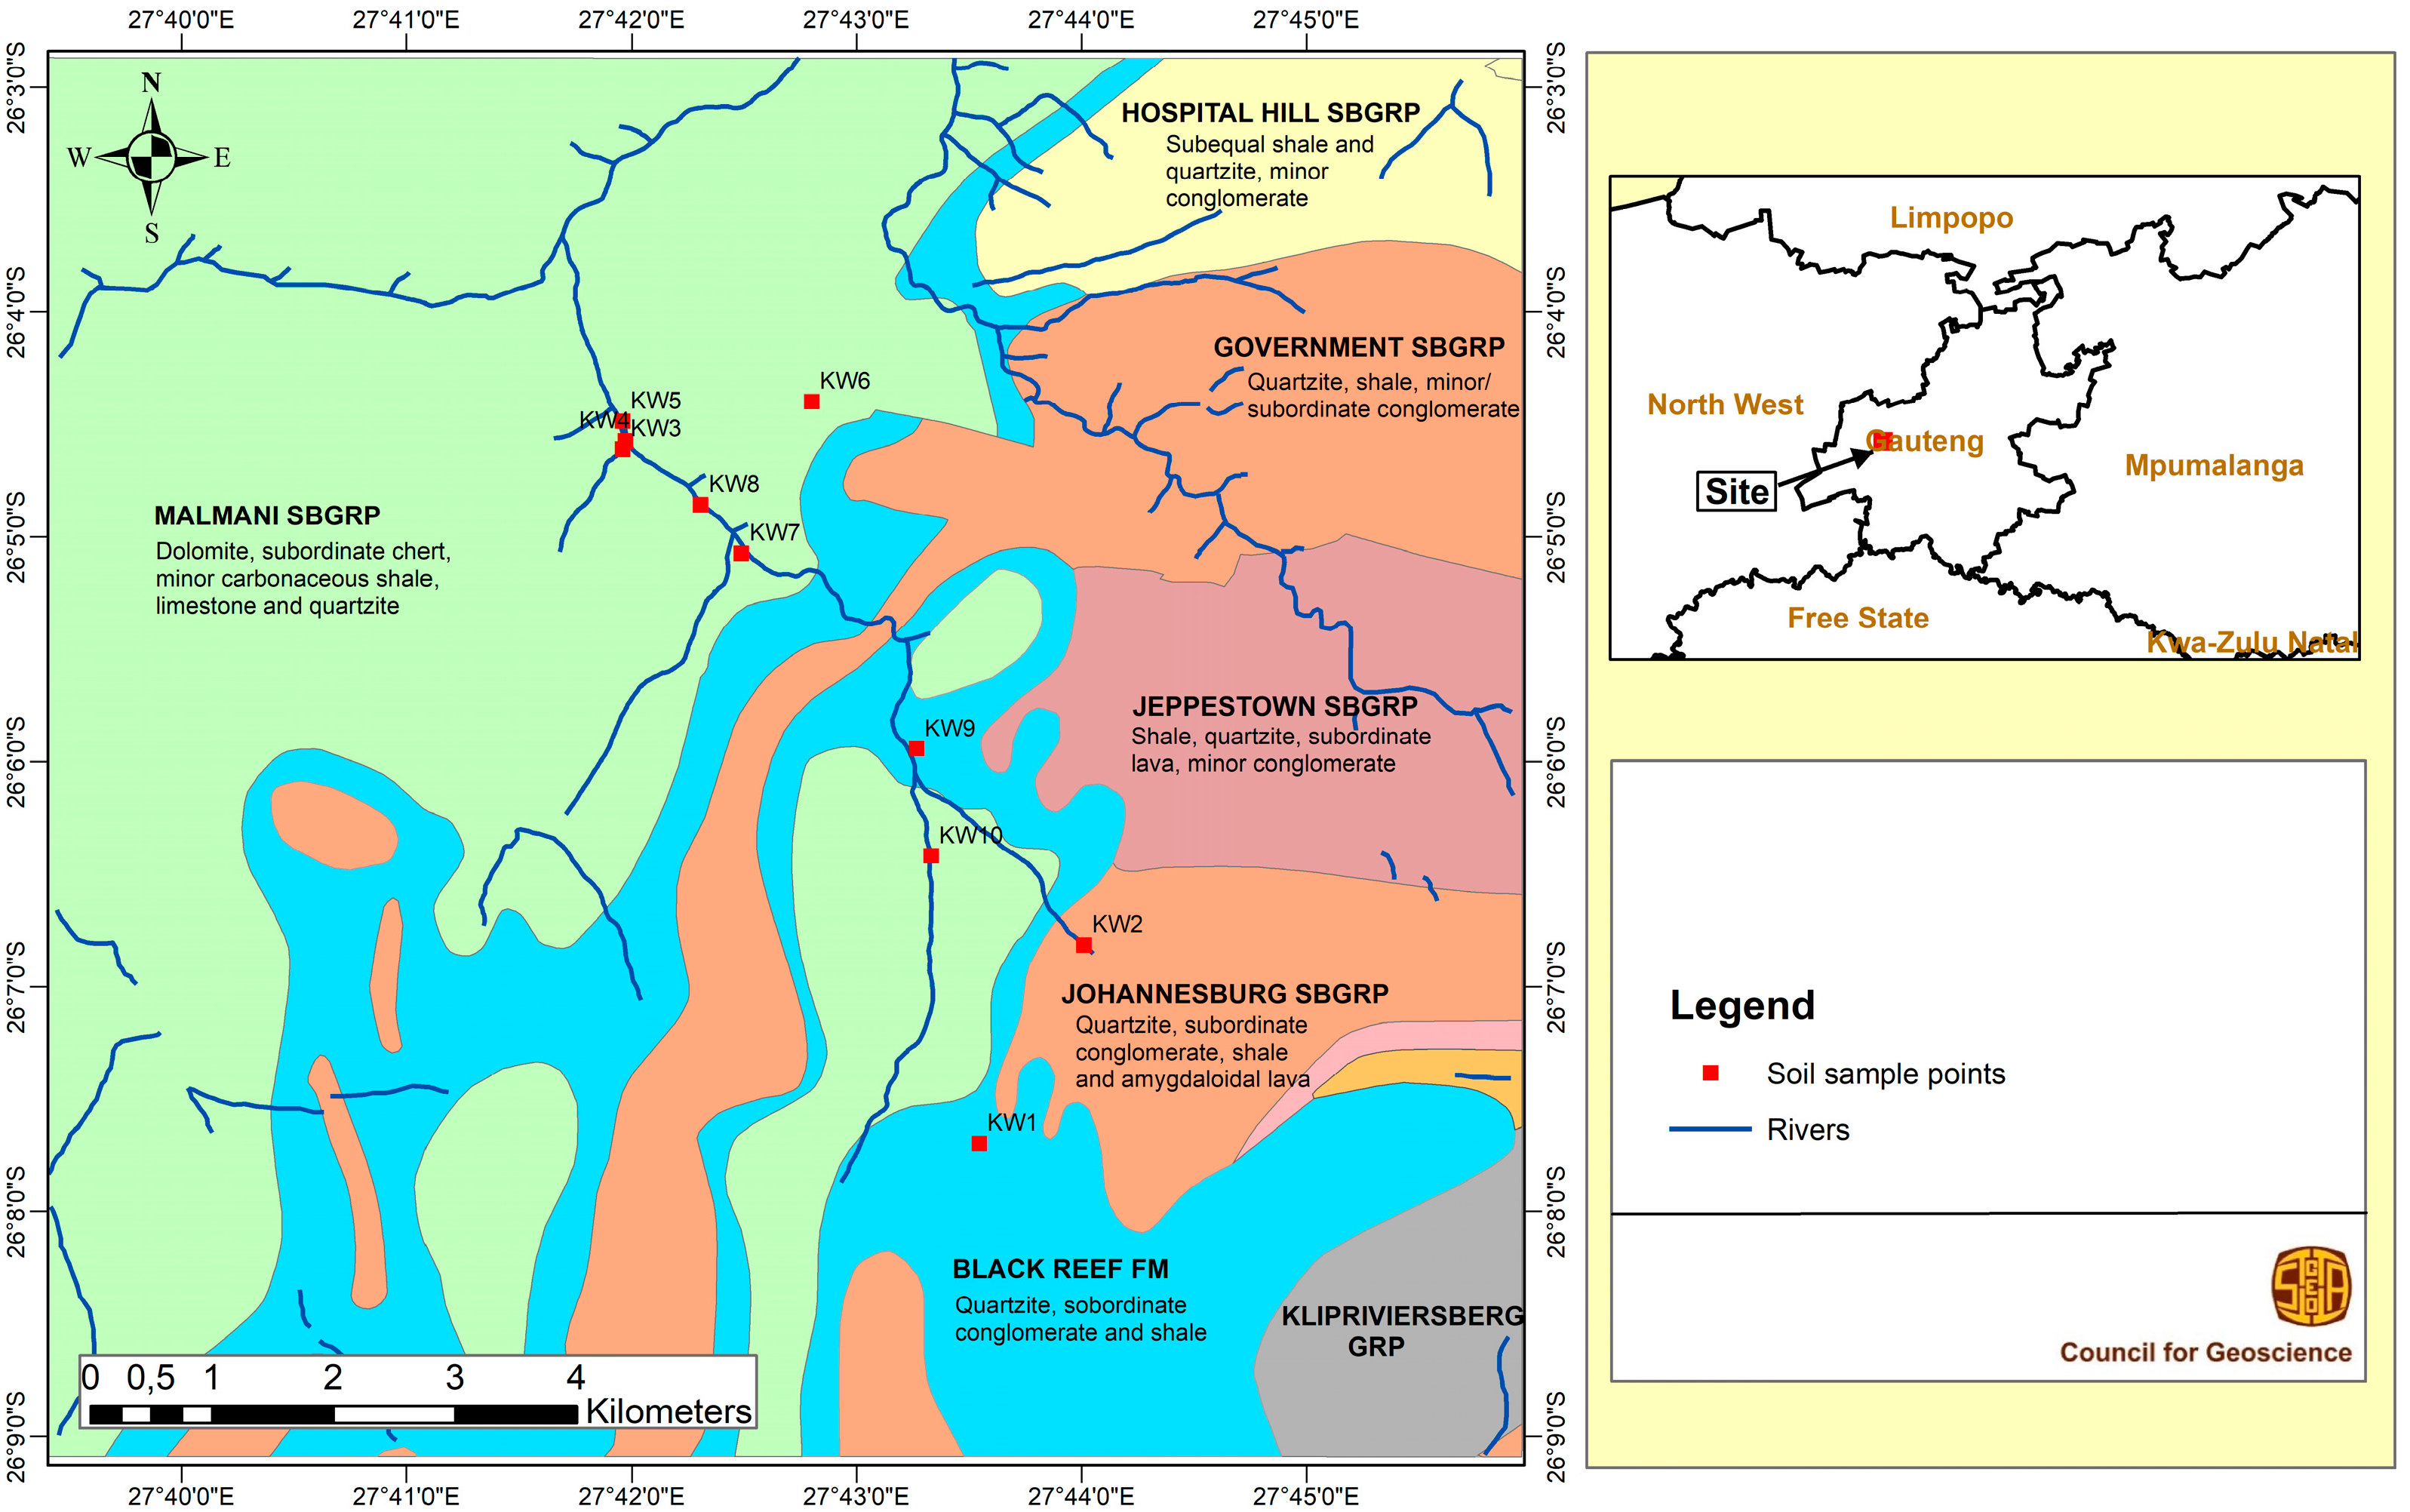
Krugersdorp (26°6′0″ S; 27°46′0″ E) (Figure 1), located in the West Rand of Gauteng province in South Africa, is a mining town with a population of approximately 378,821 (WPR, 2020). The town covers a total area of about 247.22 km2. Krugersdorp has long been known for mining of gold, manganese, iron, asbestos, and lime, which has contributed significantly to the economy of South Africa. With its 1400 hectare game reserve, the KRG (Figure 1) is a colossal tourist amenity, hosting a wide variety of bird species (over 200) and wildlife, including animals such as lions, buffalos, giraffes, zebra, antelope, roan, gemsbok, and hippos. Other attractions include an eco-adventure park, the South African National Bird of Prey Centre, and the Railway and Steam Train Museum.
Two large-scale mining consortiums at Krugersdorp, Mintails Mogale Gold (MMG) and Rand Uranium (RU), were largely abandoned, but reactivated in recent years, re-mining old gold tailings dams and dumps.
The main repercussion from the mining of gold and uranium is the production of AMD, which has, for a long time, been a concern in water quality assessment and ecosystem integrity of Krugersdorp. Short et al. [8], for example, have reported serious impacts on health of animals and humans that drink the water from the Tweelopiesspruit (Figure 1). Movement of mining-derived PHEs in the subsoil in Tweelopiesspruit have been known to move outwards to surrounding waterways [8].

2.1. Geology

Krugersdorp lies at an elevation of 1740 m northwest of Johannesburg on the western ridge margin of the Witwatersrand Basin, a large elliptical gold-producing area in South Africa stretching over an arc of roughly 400 km [7]. The Basin is underlain by an underground geological formation also known as the Witwatersrand Basin [9].
The gold in this basin occurs in the coarse-grained conglomerates forming the upper portions of the “Witwatersrand Supergroup” that hosts roughly 7000 m of sedimentation [9]. It is found here in association with uranium, quartz, carbon seams, phyllosilicates, and pyrite. The mineralisation of the Witwatersrand reefs is extensive, and a total of 70 ore minerals, including diamonds, have been documented from the Witwatersrand conglomerates [9].
Krugersdorp consists mainly of dolomite and chert of the Malmani Subgroup, as well as quartzite, conglomerate, and shale of the Black Reef Formation, both of the Transvaal Sequence. The key geological feature at Krugersdorp is the band of dolomite running through the study area (Figure 2). The surface geology (Figure 2) of the area encompassing the MMG, RU, and KGR sector of Krugersdorp is likewise characterized by dolomitic strata that represent an outlier associated with the Vaalian (2.65–2.43 Ga) Chuniesport Group (the Malmani Subgroup).
Geologically, the KGR can be divided into two main portions: a southern plateau underlain by arenite of the Black Reef Formation with outcroppings of Malmani subgroup dolomite, and a northern, lower-lying, and steeper portion also underlain by dolomite [9]. These two portions are separated by an escarpment of Black Reef and Government Reef quartzites.
Dolerite intrusions, mainly in the form of subvertical dyke structures, and occasionally in the form of sub-horizontal sills, represent equally significant structural elements in the sub-region (Hobbs and Cobbing [10]). The structural geology of the KGR and its possible relevance to groundwater movement has been described by Hobbs and Cobbing [10].
The West Rand, which encompasses the study sites (MMG, RU, and KGR), is the smallest of about nine main goldfields within the Witwatersrand Supergroup. Underground mining stopped in this region in 1998 [11].

2.2. Hydrogeology

The hydrogeological network of the study area consists of different aquifers, characterised by <100 m2/d to high >1000 m2/d transmissivity values. The Tweelopies Spruit, once a non-perennial stream, bisects the KGR from the north. Groundwater occurs in the weathered and fractured sedimentary rocks of the Witwatersrand Supergroup (Figure 2). The river has flowed continuously since mine water decant began discharging AMD into the stream in 2002, according to Hobbs and Cobbing [12]. Several seeps, non-perennial drainage lines, and springs are scattered around the reserve (Figure 2).
The KGR lies immediately downslope (<1000 m) of the locus of AMD, coming largely from the MMG and RU settings. Other potential receptors of AMD include neighbouring smallholdings and, further afield, the Cradle of Humankind World Heritage Site.
There are limited sources of streamflow data available in South Africa. These include simulated streamflow for catchments across South Africa and measured river-flow at specific rivers around the country. Olivier et al. (2013) [13] have demonstrated the seasonal-to-interannual predictability of river-flow over the summer rainfall areas of South Africa using various fields from a coupled general circulation model as predictors in statistical post-processing system. A comprehensive overview of flow-gauging structures in South African rivers is given in Wessels and Rooseboom (2009) [14].

2.3. Other Physiological Characteristics

The climate in Krugersdorp is sub-humid, warm and temperate. About 759 mm of precipitation falls annually. In winter, there is much less rainfall than in summer, with most precipitation falling in January, averaging 142 mm. The driest month is August with only 7 mm of rainfall.
In South Africa, rain falls mainly in the summer months, and is considered the main contributor to summer steam flow variation [15], though Whitmore (1971) and Schulze et al. (1997) have suggested that, on average, only 9% of streamflow variation can be attributed to rainfall, with evaporation playing the larger role [16,17].
The average annual temperature in Krugersdorp is 15.6 °C; the warmest month of the year is January, with an average temperature of 20.1 °C. In June, the average temperature, 9.1 °C, is the lowest average temperature of the whole year.
The vegetation of the study area comprises generally flat or slightly undulating grasslands—mainly grasses and shrubs, with few scattered small trees in places. Remnants of native vegetation, shrubby and thorn-tree species, occur mainly on hilly ground where there has been no disturbance from mining, urbanization, or clearing for cultivation. Vast areas of open grassland exist in the KGR, which also has a densely wooded valley running through it.
The soils of the study area are mainly reddish brown to red, and range in texture from clayey silt through silty clay to loam and vary in depth from less than 400 mm to over 1.2 m deep. At very few sites, sandy clay was also encountered, but the sand content was always less than 10 percent. Although Krugersdorp is designated as an agricultural hub in Gauteng, the general potential for agricultural development remains low.

3. Materials and Methods

3.1. Sampling Strategy

Field sampling took place from 29 November to 06 December, the start of the summer season in South Africa.

3.1.1. Experimental Design

The experimental design involved the collection of a total of thirty water samples (10 composite water samples, each an amalgamation of 3 water samples at every sample location), along streams and springs traversing cultivable and uncultivable lands around the MMG and RU mining areas, including the KGR.
In situ determinations were done on all water samples for seven field hydrogeochemical parameters and laboratory analyses of the 12 selected PHEs carried out by the ICP-MS method, to allow the determination of their spatial variation.

3.1.2. Detailed Experimental Procedure

After recording environmental characteristics at each sampling site (stream or spring) (Figure 2, Table 1), thirty water samples were collected in downstream directions using a teflon dipper, slowly immersed into the water with minimum disturbance. Three samples (A, B, and C) (approximately 500 mL of each sample, totalling approximately 1500 mL) were collected from each of the 10 sampling sites and formed into composites. The three water samples were taken at either side of the steam or spring diametric and at the centre.
About 500 mL of the collected (composited) water sample was then transferred to a polytetrafluoroethylene (PTFE) beaker and the rest transferred to new pre-labelled 250 mL high-density polyethylene (HDPE) sample bottles, properly capped, for the geochemical analyses. Prior to the transfers, sample containers (PTFE beakers and HDPE sample bottles) were washed three times with distilled water and once with the water to be sampled.
Seven water quality parameters (water temperature, pH, dissolved oxygen (mgL−1), dissolved oxygen (%), total dissolved solids (TDS), oxidation/reduction potential (ORP) and electrical conductivity (EC)) were measured in situ in the sample aliquot in the PTFE beaker by immersion of the electrodes of a Hanna multiparameter water analyser.
Laboratory analyses of the 12 selected PHEs (As, Ag, Al, Co, Cr, Cu, Fe, Mn, Ni, Pb, V, and Zn) were carried out by inductively coupled plasma-mass spectrometry (ICP-MS) method to allow the determinations of their spatial variation. This was the analytical method of choice due to the advantage that, even in the case of water samples with low contamination, simultaneous or sequential analysis is possible without special pre-treatment to achieve low detection limits of the elements.
The 10 composite samples were analysed for some 60 PHEs, but only twelve of these elements which were above the detection limit and were therefore the ones selected for further analysis. These are: silver (Ag), iron (Fe), manganese (Mn), vanadium (V), cobalt (Co), aluminium (Al), zinc (Zn), copper (Cu), nickel (Ni), lead (Pb), chromium (Cr), and arsenic (As).
Samples for the geochemical analyses were filtered under suction through 0.45 μm pore diameter filter paper (less than forty-eight hours after arrival) at the Biochemistry Laboratory of the Mangosuthu University of Technology (MUT).
To the first 250 mL aliquot of the sample was added 0.3 mL (about two drops) of ARISTAR grade concentrated hydrochloric acid (HCl); to the second, 250 mL aliquot was added 0.3 mL of ARISTAR grade concentrated nitric acid (HNO3); and a third 250 mL aliquot was preserved without acidification.
All samples were stored under cooled conditions and shipped to the ACME Laboratories Ltd. in Vancouver, BC, Canada, for chemical analyses. There, water samples were analysed for 60 PHEs, including some nutritional elements (micronutrients). A number of elements had concentration levels below their detection limits and were not considered for further data analysis. The analyses of blanks, in-house reference materials (STD TMDA-70), triplicate samples, and the randomisation of sample numbers were performed to ensure quality control and accuracy.

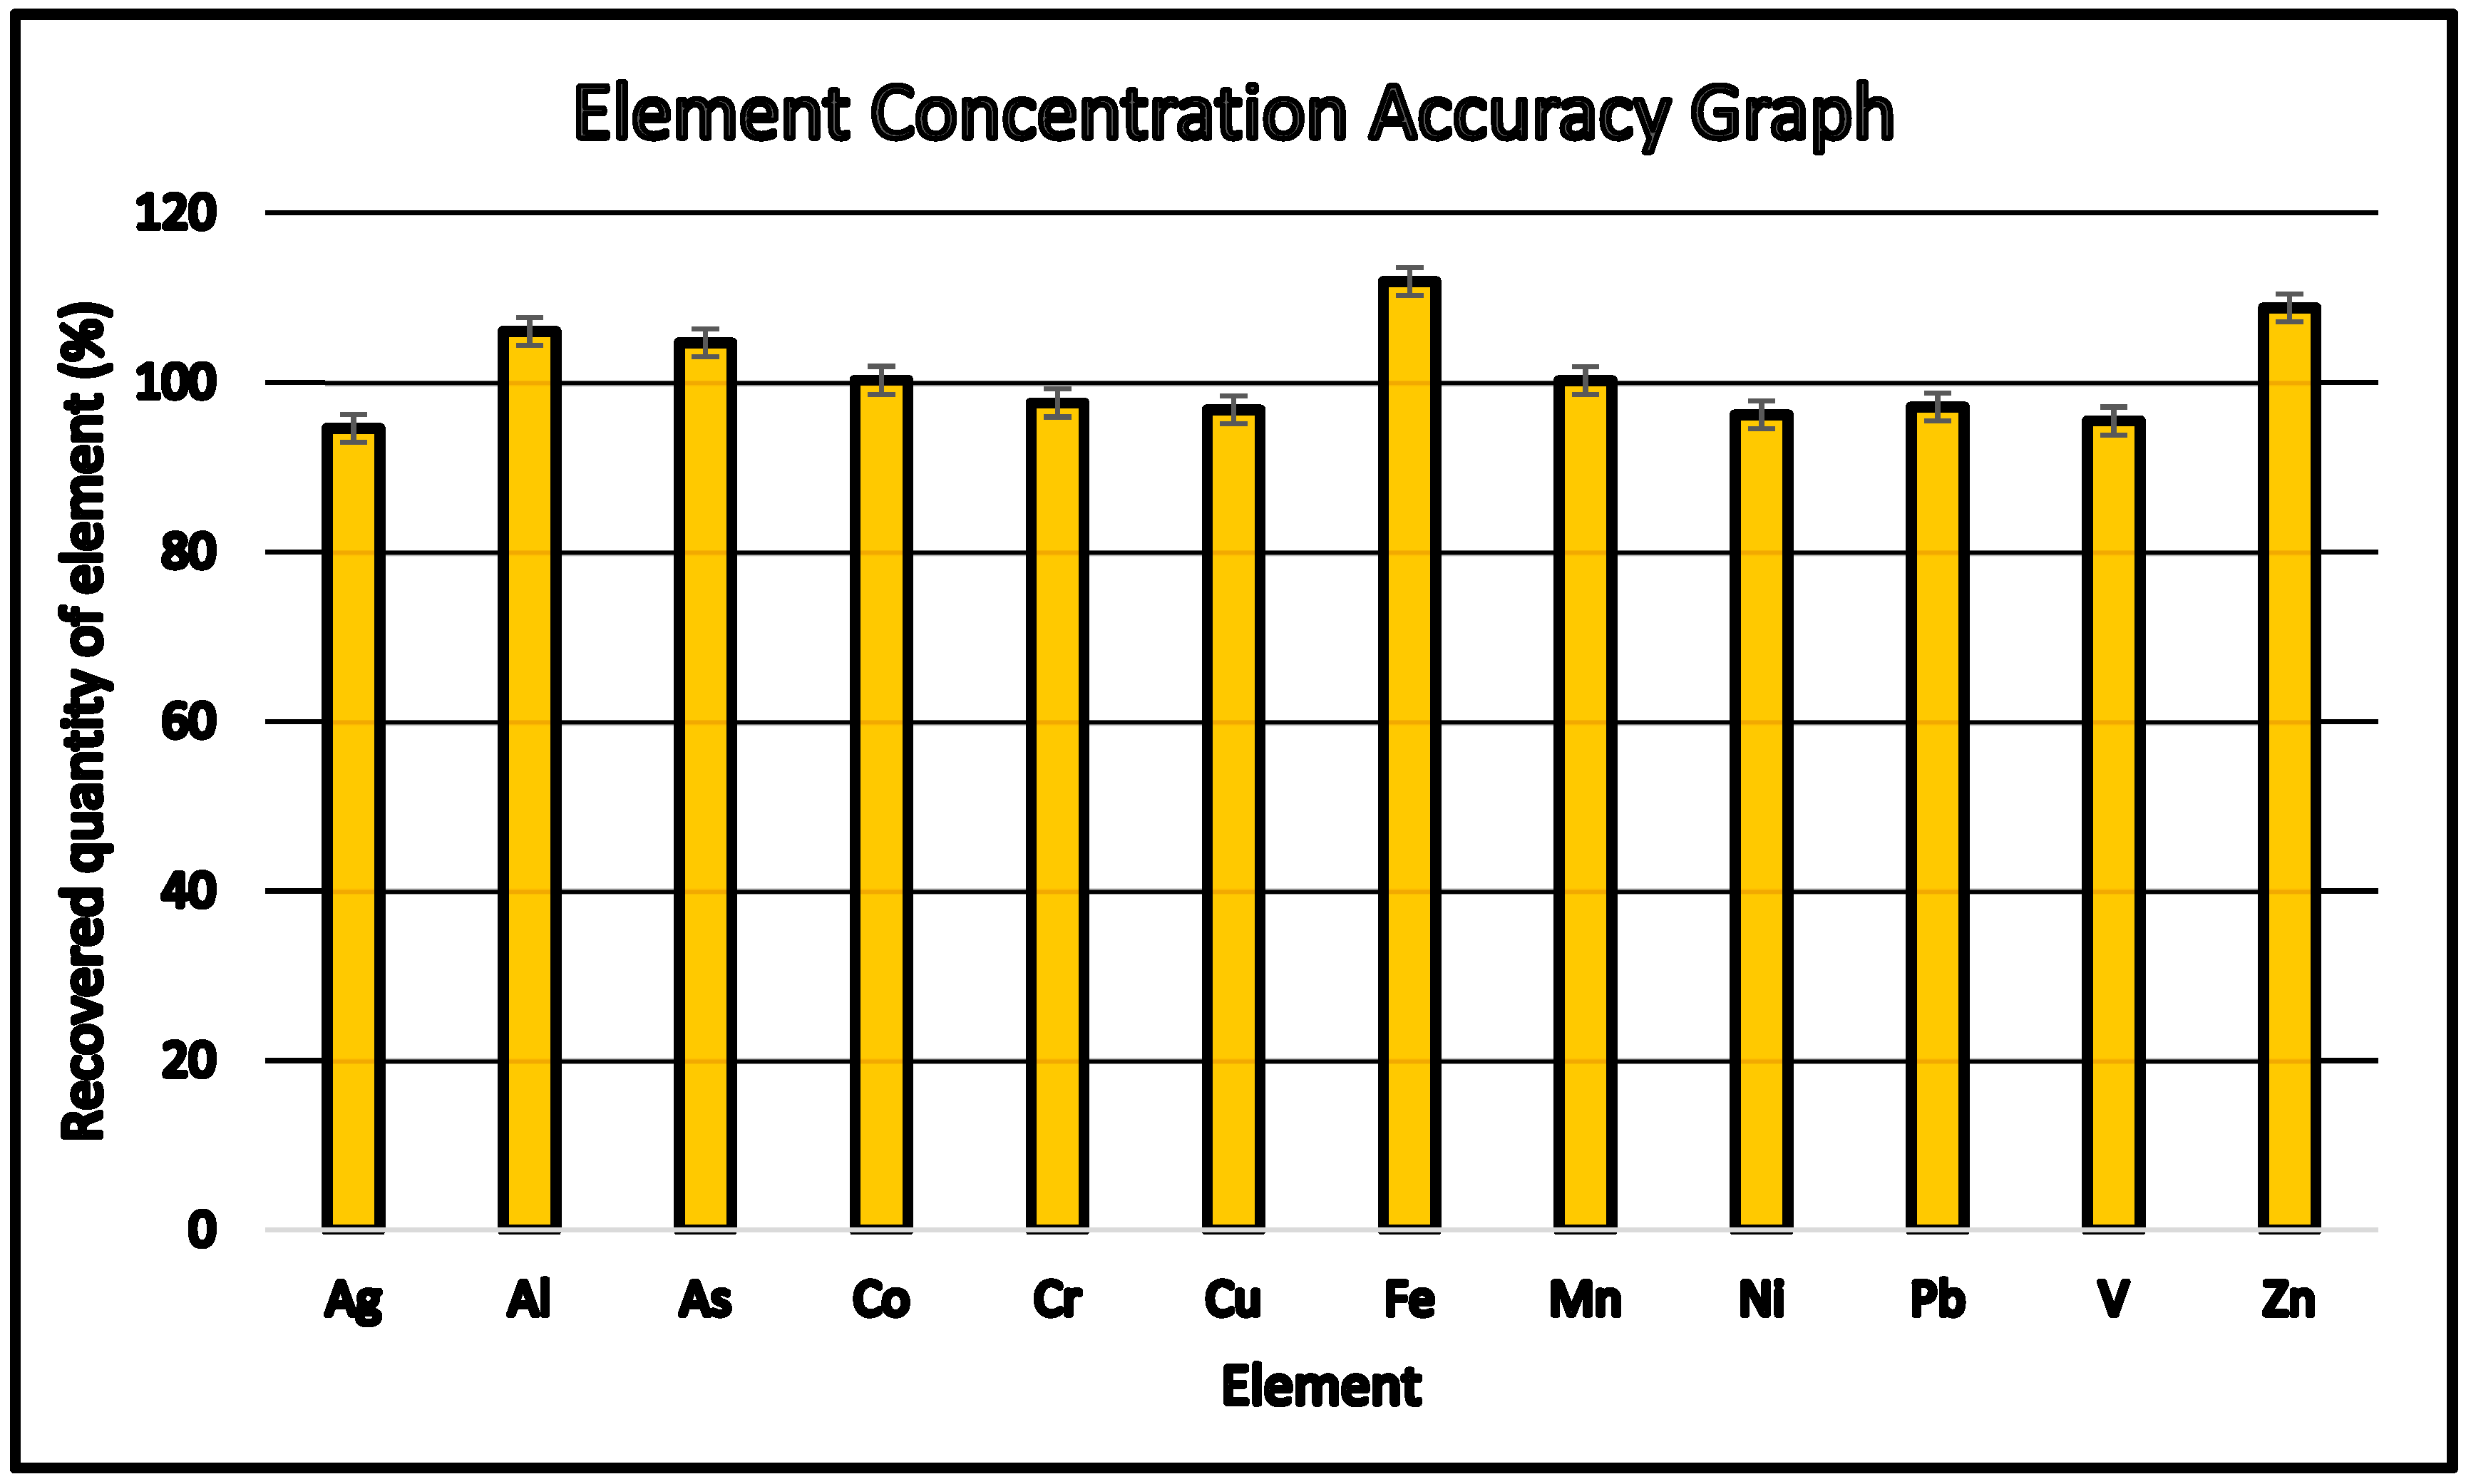
3.2. Quality Control Analysis

Sampling Frame

One sampling goal consideration was whether pollutant concentration data were adequate, or if pollutant load data were needed. In our project, as in regulatory testing projects to determine compliance, concentration data were considered adequate; in which case, equipment and effort to measure flow rate were deemed unnecessary, since flow-weighted concentrations (FWCs) or event mean concentrations (EMCs) were not required [18].
In order to reduce the number of samples in the light of budget, personnel, and laboratory constraints, while maintaining accuracy in determining water quality characteristics, composite sampling strategy was the preferred sampling design. Such a design has the added advantage of reducing sampling error compared to the method of increasing sampling interval [18,19,20].
Thus, in this study, 10 composite water samples were collected, each comprised of a mix of 3 separate samples collected at either stream bank or spring diametric, and the middle of a sample location (Figure 2). For reasons articulated earlier in this section, 30 samples were considered adequate for this study [21,22].

3.3. Analytical Quality Assessment

For quality control purposes, a KW1A sample replica was chosen to fulfil both the quality control (QC) sample and water sample role during testing. The QC sample values were compared with the KW1A initial testing of the sample, which also served as a repeatability and reproducibility measure as one sample was analysed several times. A standard deviation table and comparison graph of the measured concentration were constructed as illustrated in Table 2 and Figure 3, respectively. The concentrations of Ag, Al, As, Co, Cr, Cu, Mn, Ni, Pb, V, and Zn in QC sample were found to be 0.16, 41, 17.22, 0.16, 2.2, 6.8, 133, 2.95, 1.8, 6.1, 38.8, and 47.8 μg L−1, respectively. The concentrations of Ag, Al, As, Co, Cr, Cu, Mn, Ni, Pb, V, and Zn of in the KW1A sample were found to be 0.21, 40, 17.1, 0.14, 1.6, 6.4, 117, 2.62, 1.8, 6.3, 26.8, and 46.1 μg L−1, respectively. Comparisons of the results from the two samples showed good compatibility, with Al, As, Co, Cu, Mn, Ni, and Pb having values close to each other with very low standard deviation values as observed in Table 2. Therefore, the compatibility of the results confirms that the analysis of the PHEs in the water samples produced reliable results with minimum variations.
An in-house reference material, “STD TMDA-70”, was used to determine the accuracy of the results and to test the ICP-MS instrument efficiency. The tables of results of the quantity spiked with the reference material and the recovered amounts of PHEs in solution are given in Table S1. This was to ensure accuracy and precision of the results produced by the instrument with minimal error. Recoveries of the studied elements in solution before the samples were analysed, were calculated and the results plotted in Figure 4. The aliquots recovered for Ag, Al, As, Co, Cr, Cu, Mn, Ni, Pb, V, and Zn were each found to be close to 100%, which indicates that the instrument was functioning at its optimal capability and the results obtained were accurate, precise and reliable [23]. Furthermore, the recovery of analyte close to 100% across the samples indicate that there was normal variation during testing with no significant impact, denoting complete extraction of analyte from the water samples analysed for the PHEs of interest, with minimal losses and good alignment of the analytical system.

4. Results and Discussion

4.1. Hydrochemical Considerations

The results of measurements of water quality parameters at KGR in this study are broadly in line with those obtained from more recent seasonal (wet and dry season) water quality surveys at the KGR and are summarized and discussed in Short et al. (2015) [8]. As observed, significantly lower values (high pH) are obtained during the wet season, as a result of the influx of rain and the dilution effect, but also at certain times during the dry season when treatment of mine effluents is done more efficiently before disposal.
According to Short et al. (2015) [8] water quality surveys, all sites along the Tweelopies Spruit showed poor to critical SASS5 (South African Scoring System, Version 5) scores, which improved slightly to a “fair” score at the downstream end of the Tweelopies Spruit as it drains from the KGR.
The observed groundwater and surface water chemical hydrological characteristics reflect compositions ranging from CaHCO3 and CaMg(CO3)2 to CaSO4 and compositions associated with AMD formation and NaHCO3 precipitation. High concentrations of iron and manganese (~1100 and ~100 ppm, respectively) have been observed as a result of ionic imbalance due to AMD associated water [6,10,11,24]. The high iron values are attributed to pyrite oxidation which produces H+ ions, resulting in a lowered pH resulting in the sustained solubility of the ferric ions.
These dissimilar water resources show variations in salt and metal ion content. Both anionic and cationic composition of the ground and surface waters reflect water–rock interactions in a largely dolomitic substrate (Figure 4), whereby major and minor ionic constituents are leached from primary minerals (carbonates and sulphates) and enriched in the hydrological system. Samples collected from two springs in the study area had major cations, calcium and sodium, but different dominant anions, sulphate and bicarbonate, in the forms Ca(HCO3)2, CaSO4 and NaHCO3. These waters could be classified as calcium-sulphate-type and calcium-bicarbonate-type waters, respectively. Ions typical for AMD (e.g., Mn2+, Cd2+, SO42−) have different effects on the kinetics of carbonate dissolution. Excess concentrations of the SO42− ion can result in an important ionic imbalance. The dissolution of carbonates has a buffering potential on the acidity produced by the sulphide oxidation through the formation of OH and HCO3 ions. The pH is indicative of this process as values ranged between 6.79 and 9.03. AMD is normally associated with a pH lower than 6.79, with high iron and sulphate concentrations [25].
High concentrations of iron and manganese (~1100 and ~100 ppm, respectively) were observed as a result of this ionic imbalance that takes place in the AMD associated water. The ensuing highly acidic water (pH, ca. 3) also liberates mining-related PHEs, which include Mn, Cd, and Fe. Furthermore, the concentrations of Fe in groundwater could increase from dissolution of Fe (II) and Fe (III) minerals. Using manganese as an example, dissolution reactions with pyrite in acidic media can be illustrated by the following reaction:
15MnO2 + 2FeS2 + 14H2SO4 = Fe2(SO4)3 + 15MnSO4 + 14H2O
The overall impact of AMD is very much dependent on local conditions and varies widely, depending on the geomorphology, the climate, and the extent and distribution of the AMD generating deposits [26,27]. So, whenever the impact of AMD is evaluated in South Africa, it is necessary to briefly consider these other factors. The weathering of mine tailings can create acidic conditions and consequently leach PHEs. Previous studies in the area have alluded to the fact that gold mining processes do increase acid generation due to contact of the pyrite-bearing rock with oxygenated water (resulting from rainfall). A large percentage of these gold deposits lie within the Vaal River catchment. The tailing dumps that accumulated after gold extraction normally contain approximately 3% pyrite. An oxidation reaction occurs when the pyrite is exposed to rainwater, which generates sulphuric acid infiltrating throughout, dissolving heavy metals and seeping into local groundwater. This highly acidic polluted water with high sulphate and heavy metal concentrations emerges on surface in the streams draining the tailings dumps. Decanting occurs from the lowest-lying opening to the Western Basin mine void in the Krugersdorp area [27].
During the field campaign (this study), it was observed that more effective treatment of mine wastewaters by MMG and RU had raised the quality of their decant to a pH level of 7 to 8.5. Improved mine water treatment during this time is thought to have produced reduced PHE loadings.

4.2. The Geochemistry of Potentially Harmful Elements (PHEs)

Determining PHE concentrations is of high importance as it forms the basic criterion for stipulating recommended limits for drinking water [28,29]. We infer a temporal and spatial variation in the PHE loadings in the waterways that can be linked to the quality of influent AMD at any given time. The full list of elements determined in water samples in this study is presented in Table S1.
Variations in concentration levels and spatial distribution of all PHEs studied in samples taken along streams and springs are shown in Figure 3 and Figure 4 and in Table 2, Table 3 and Table 4, respectively. These Table 2, Table 3 and Table 4 also show those elements that exhibited either significant concentrations above the detection limits or were of environmental pollution concern and hence were the ones selected for further data analyses.
Average concentrations of PHEs in μg L−1 that were well within predefined MAC limits include: Al (1.00–41.00), Cu (0.800–8.00), Fe (23.00–117.00), Ni (0.20–7.00), Pb (0.80–6.30), Zn (2.20–783.00) as those recommended by WHO (2017) and concomitant references [30]. The relatively low levels of certain PHEs found in our sampled waters can be attributed to a sequestration effect brought about in a dominantly carbonate-type lithology characterizing the study area [31,32], as well as by the rapidly changing chemical quality (well treated/partially treated/untreated) of the mine water discharges (decant) entering the waterways of the KGR. According to Adriano (2001), co-precipitation of PHEs easily takes place during water–rock interaction in a carbonate matrix and other common constituents, such as hydroxides, phosphates, and metal (Fe, Mn, and Al) oxides [31]. These are common reactions that can be considered as major mechanisms by which PHEs are sequestered, limiting their mobility and bioavailability to biota. Combined, sequestration processes could induce an attenuation of metals to levels considered acceptable by regulatory standards by virtue of the decreased risk that they pose [31].
In this lithological setting (carbonate substrate), an effective neutralisation reaction also occurs, leading to downstream improvement in water quality in areas where the drainage interacts directly with the carbonate beds according to the equation.
Table 3. Mean trace metal concentrations (μg L−1) in natural waters (n = 30, triplicate analysis) of the Krugersdorp gold district.
NoSample NamepHAgAlAsCoCrCuFeMnNiPbVZn
DL 0.051.000.500.020.500.1010.000.050.200.100.200.50
1KW1* 00.2117.678.000.171.6013.79114.002.861.934.3016.652.27
2KW28.87BDLBDLBDLBDL4.10BDLBDL2487.33BDLBDLBDLBDL
3KW36.790.228.000.705.67BDL2.602.600.340.801.1051.37.87
4KW46.79BDLBDLBDLBDLBDLBDLBDL8646.33BDLBDLBDLBDL
5KW56.94BDLBDLBDLBDL3.30BDLBDL8139BDLBDLBDLBDL
6KW67.530.162.2012.870.46BDL6.876.8711.201.472.1928.55106.76
7KW76.94BDLBDLBDLBDLBDLBDLBDL10,248.00BDLBDLBDLBDL
8KW86.94BDLBDLBDLBDLBDLBDLBDL10,339.67BDLBDLBDLBDL
9KW98.29105.00BDLBDLBDLBDLBDLBDL11,286.00BDLBDLBDLBDL
10KW109.03100.00BDLBDLBDL2.75BDLBDL11,379.67BDLBDLBDLBDL
* Not available, KW: Krugersdorp water; DL: Detection limit; BDL: Below detection limit.
Table 4. Summary of the ranges in mean PHE concentrations in samples compared with MAC levels predefined by WHO (2017) and concomitant references given below this table.
Potentially Harmful Elements (PHEs)MAC in Water (μg L−1) WHO (2017)Ranges of Water Samples Concentration (μg L−1)
Ag* 1000.16–105.00
Al2001.00–41.00
As100.70–32.20
Co◘ 1–20.07–6.16
Cr0.051.60–5.00
Cu2000 0.80–8.00
FeϮ 20023.00–117.00
Mn4000.14–12,255.00
Ni700.20–7.00
Pb100.80–6.30
V□ 1401.90–55.20
Zn# 3000 2.20–783.00
* This is the WHO (2003a) guideline value for Ag [33]. No guideline value was established in the WHO (2017) Fourth Edition, since “…available data are inadequate to permit derivation of health-based guideline value”. ◘ The guideline value for Co is from WHO (2006) [34]. Ϯ “Iron is not of health concern at levels found in drinking water.” □ Italia Ministero della Salute Decreto (2011), quoted in Crebelli and Leopardi (2012) [35,36]. Drinking water is not a major source of exposure to vanadium compounds worldwide. So, vanadium has not specifically been considered by WHO in its drinking water guidelines, and no guideline value is indicated in the WHO (2017) Fourth Edition. # This is the WHO (2003b) guideline value for Zn [37]. No guideline value was established in the WHO (2017) Fourth Edition, since “Zn is not of health concern at levels found in drinking-water.”.
In addition, the weathering of mine tailings creates acidic conditions, and consequently leach PHEs. During the field campaign (this study), it was observed that more effective treatment of mine wastewaters at certain times by MMG and RU raised the quality of their decant to a pH level of 7 to 8.5. Improved mine water treatment during these times could also result in reduced PHE loading the waterways.
The six PHEs with the highest concentrations in μg L−1 (Table 3 and Table 4), are: Ag (0.16–105.00) with the highest level in site KW9; As (0.70–32.20) with the highest in site KW6; Co (0.07–6.16) with the highest level in site KW6; Cr (1.60–5.00) with the highest level in site KW6; Mn (1.04–12,255.00) with the highest level in site KW10; and V (1.9–55.20) with the highest in site KW6. All these values are in excess of the MAC levels set by the WHO (2017) or other accredited institutions as given in Table 3 for groundwater or drinking water. These results raise a safety concern as many PHEs are required to be within the recommended limits.
Few published data and experimental tests exist on PHE uptake levels by wildlife at KGR through the common wildlife exposure pathways, which are ingestion, inhalation, injection, and absorption through the skin or mucus membranes [38]. However, the connection between soil, grass (forage), and wildlife is generally clear. The trace element (micronutrient, PHE) status of livestock is related to the amount and form (bioavailable/bioaccessible) in which these elements are found in the drinking water and feedstuff [39]. It is only when metals are present in bioavailable forms at excessive levels in drinking water or feedstuff that they have the potential to cause toxicity to wildlife. For example, ruminants develop selenium and copper deficiencies (more correctly, imbalances) if exposed to high levels of S in their feed [40]. Feedstuff at KGR comprises mainly grasses and crops/shrubs.

4.2.1. Silver

Silver is recovered as one of the gold-refining by-products. The high concentration of silver (up to 105 μg L−1) in our study may, therefore, be due to emissions from gold mining at MMG and RU and possibly due to runoff and discharge of wastewater from nearby industrial areas. We know [41] that wastewater effluents represent one of the main routes through which silver nanoparticles (Ag NPs) can reach natural aquatic environments, where interactions with a range of organisms can occur.
Silver occurs naturally in several oxidation states, usually as metallic silver and Ag+; other possible oxidation states are Ag2+ and Ag3+. However, these two latter forms are not of relevance for aqueous solutions under environmental or biological conditions [42]. The highly toxic potential of ionic silver would not be expected under natural environmental conditions, because silver can be readily transferred into biologically nonreactive compounds. Sulphides, dissolved and particulate organic matter, chloride, and enzymes within the biota have all been shown to reduce the toxicity of ionic silver. The implications of Ag toxicity in wildlife are presented in Table 5 [24,43,44].

4.2.2. Arsenic

Arsenic is usually present in natural waters at concentrations of less than 1–2 µg L−1 [30]. In our study, arsenic in water samples is found in concentrations of up to 32.20 μg L−1. This is unsurprising, given that, in waters associated with sulphide mineral deposits, the arsenic concentrations can be significantly elevated [45].
Arsenic is commonly concentrated in sulphide-bearing mineral deposits, such as the gold ores in our study area [46]. It can enter the environment from a variety of sources associated with gold mining, including waste soil and rocks, tailings, atmospheric emissions from ore roasting, and bacterially enhanced leaching [47].
The geochemistry of arsenic generally is a function of its multiple oxidation states, speciation, and redox transformation [48]. The reductive dissolution of As-bearing Fe (III) oxides and sulphide oxidation are the most common and significant geochemical triggers that release arsenic from aquifer sediments into groundwaters.
Information from the few available studies of arsenic in natural waters show that high As concentration in these waters may be due to water–rock interactions that engender the dissolution or oxidation of sulphide minerals, such as arsenopyrite (FeAsS), within quartz vein gold deposits [49]. Sulphide minerals, such as FeAsS and As-substituted pyrite, as well as other sulphide minerals, are susceptible to oxidation in the near-surface environment and quantitatively release significant quantities of arsenic in sediments [45].
Arsenic sorption on calcite is not well understood [50], but it is thought to play a role in the retention and solubility of arsenic in calcareous soils and other environments with abundance of carbonates [50].
With the pervading carbonate substrate in the study area, carbonation of arsenic sulphide minerals, including orpiment (As2S3) and realgar (As2S2), released from gold mining activities at MMG and RU, may be considered an important process in leaching arsenic into the Krugersdorp groundwater system under anaerobic conditions [48,51]. The resulting arseno-carbonate complexes formed, such as As(CO3)2−, As(CO3)(OH)2−, and AsCO3+, are stable in groundwater [52,53]. The reaction of ferrous ion with the thioarsenite from carbonation process can result in the formation of arsenopyrite, which is a common mineral in arsenic-rich aquifers [51]. As (III) carbonate complexes could be significant, though minor, in extremely carbonate-rich waters, such as are found in the waterways of our study area. The implications of As toxicity in wildlife are highlighted in Table 5 [24,43].

4.2.3. Cobalt

The maximum amount of cobalt in our sampled waters was 6.16 μg L−1 (Table 3), over three times the WHO maximum allowed concentrations (MAC) of 1–2 μg L−1 [30].
Cobalt occurs naturally in small concentrations in rocks, soils, plants, and in water [54]. During the rainy season in South Africa, physical and chemical weathering of rocks by water and decomposition of plant waste can lead to higher concentrations of cobalt in waterways [55,56]. See Table 5 for the implications of Co toxicity in wildlife.

4.2.4. Chromium

Chromium is a naturally occurring element that is ubiquitous in the environment. As such, there are natural background levels of the element in the environment. Our measured data show that these levels can vary widely. Chromium ranges between 1.60 and 5.00 μg L−1 in our sampled waters, well outside the MAC value of 0.05 μg L−1 set by WHO in 2017 [30]. As a result, it is difficult to determine a representative background concentration to which the releases from industrial activity would add.
Chromium in the environment is found in different forms and at varying levels of toxicity, depending on pH and redox conditions. In order of generally increasing toxicity, these forms are chromium (0), (III), and (VI). Cr (III) and Cr (VI) are the most stable forms with differing chemical and physical features as well as biological effects [57,58].
Mining processes at MMG and RU involve both exploitation and beneficiation activities, whereby large amounts of metal-rich residues, such as overburden, waste rock, and tailings, stored in open air, are generated. These processes may considerably increase the amount of both Cr (III) and Cr (VI)) released to the environment. Almost all Cr (VI) compounds in the environment are a result of anthropogenic activities [59]. Cr (VI) is also known to be highly soluble in water. It is also bioavailable and toxic. Within the mining residues, many chemical and biological processes take place, and they control chromium speciation, its mobility and availability.
High concentrations of chromium might also be attributed to an acidic environment wherein AMD reacts with high organic matter content to facilitate the reduction in Cr (VI) to nontoxic Cr (III). An opposite reaction can also occur where Cr (IV) is formed from Cr (III) in the presence of minerals containing Mn (IV) oxides given that manganese ores are one of the by-products mined in Krugersdorp.
The bioavailability of chromium is affected by various factors, including the pH of the media, interactions between mineral constituents and/or organic chelating compounds, and the concentrations of carbon dioxide and oxygen [60]. Under these conditions, Cr (III) sorbs onto various ligands and forms insoluble entities which are not bioavailable. Cr (VI) could also form many soluble salts that are bioavailable, and thus be able to cross membranes and cause toxic responses (Table 5) [43,61].

4.2.5. Manganese

Surface waters near mine tailings in the Witwatersrand Basin have always been reported to contain elevated concentrations of manganese, among other PHEs [62,63,64,65,66]. PHEs also coprecipitate with iron and manganese in these streams.
The content of manganese in our sampled waters (up to 12,255 μg L−1) appears excessively high. However, this is unsurprising, given that, even in waters that are essentially free of anthropogenic inputs, dissolved manganese can range from 10 to >10,000 μg L−1 [67]. Elevated manganese contents in the sampled waters can be attributed to underground mining activities for the element, which releases PHEs in mine effluents that are transported into the nearby water bodies.
The environmental chemistry of manganese is, to a large extent, determined by pH and redox conditions. The element exists in the aquatic environment in two main forms: Mn (II) and Mn (IV). Movement between these two forms takes place due to oxidation and reduction reactions that may be abiotic or microbially mediated. At conditions of low pH and redox potential, Mn (II) dominates, with an increasing proportion of colloidal manganese oxyhydroxides above pH 5.5 in non-dystrophic (nutrient-rich) waters. The cycling of sedimentary manganese is governed by the oxygen content of the overlying water, the penetration of oxygen into the sediments, and the amount of benthic organic carbon supply [67]. The negative effects on health are presented in Table 5 [24,43].

4.2.6. Vanadium

Vanadium is present to the tune of up to 55.2 μg L−1 in our sampled waterways.
Vanadium has historically been regarded as a conservative element in surface environments, although there is growing evidence of greater mobility [68].
Almost four-and-a-half decades ago, Bengtsson and Tyler (1976) noted the reasonability (at that time) of regarding vanadium concentrations of 0.1–1 μg L−1 as a normal range in present-day freshwater and concentrations above 2 μg L−1 as representing a polluted state or as indicating an especially high vanadium content in the bedrock of catchment systems [69].
Chemical evolution of global rivers has, since, developed in a way that reflects our changing societal demands, such as the growing need for mining of metals used in modern technology. This has imprinted a dominant anthropogenic signal that reflects dispersed and pervasive environmental releases in the metal cycle in global rivers. Vanadium now has the fourth highest anthropogenic enrichment factor (AEF) in global rivers, behind antimony, cadmium, and nickel [68].
Vanadium is associated with the Carbon Leader Reef (CLR), one of the main gold-producing reefs in the Witwatersrand [70]. The CLR is located in the lower part of the Central Rand Group of the Witwatersrand Supergroup. The high vanadium concentrations in our sampled waters (range 1.90–55.20) can credibly be attributed to anthropogenic sources such as leachates from mine tailings or from wastewater sludge [71].
In predicting the fate and behaviour of vanadium in the environment, we require an understanding of its speciation, its phase association, and its migration and bioavailability characteristics. However, despite the increasing prevalence of vanadium in the environment, including its content in natural waters, we still possess a relatively poor understanding of its geochemistry, relative to other contaminants [68].
There are three stable oxidation states of vanadium: V+3, V+4, and V+5, although it is most commonly found as V+4 or V+5, with V+5 showing greater solubility under toxic conditions. The toxicity is highlighted in Table 5.

5. Conclusions

Accurate quantitative data (total concentrations) of PHEs associated with mine decant and AMD in waterways of the Krugersdorp mining environment are presented. This has long since been a bane whenever baseline data are sought for providing evidence that support the design of credible mitigative measures for the effect of metal toxicity on the local community near the KGR. Within the KGR environment, this study identified six PHEs (e.g., silver, arsenic, cobalt, chromium, manganese and vanadium with concentrations above the allowed MAC levels in the waterways that receive AMD effluents from upstream mining activities at MMG and RU. Using data garnered in this study, we attribute the relatively low (bioavailable) levels of many of the residual PHEs found in the Krugersdorp waterways to a sequestration effect brought about by water–rock interactions in a dominantly carbonate lithological setting, but also to the rapidly changing chemical quality (well treated/partially treated/untreated) of the mine water discharges (decant) entering the KGR hydrological system. The size and morphology of precipitated calcium carbonate influence the mineral solubility and long-term immobilization of co-precipitated contaminants. Additionally, the dissolution of carbonates seemed to have a buffering potential through the formation of OH and HCO3 ions neutralising the acidity produced by the sulphide oxidation. The pH is indicative of this process. Despite our knowledge that carbonates restrict transport and plant PHE uptake from soil to plants, presenting a tipping point, the mechanism is still poorly understood, and deserves much attention. Careful design of such studies would make possible an explanation of the rather complex interactions that account for PHE fluxes in the: “water-soil-plant-herbage” continuum at KGR. There can be little doubt that the water quality and ecological integrity of the Tweelopies Spruit has been severely degraded, affecting the entire aquatic food chain, and with potentially serious health effects on the local animals and humans that drink the water within this locality.
Data from the hydrochemical literature, as well as from the current research, indicate that large amounts of mine pollutants produced mostly in the form of AMD have entered the hydrological system and other environmental compartments of the KGR through ground and surface waters, over several decades of gold mining. These pollutants have caused modifications to natural element cycling in the KGR and adjacent ecosystems. The overall effect of these processes is reflected in the large variability in PHEs contents in many of the samples from waterways in our study areas, which provided a major motivation for proposing further investigation into migration dynamics of PHEs in mine effluents entering the hydrological compartment.
In order to formulate and implement the most appropriate AMD management measures at Krugersdorp, it is necessary to first understand the hydrological environment that defines and informs the groundwater dynamic in the subregion. This dynamic includes the response of the groundwater regime to both natural and anthropogenic recharge mechanisms.
Well-designed quantitative research along these lines will enable the rehabilitation of metal contaminated areas with appropriate indigenous species, allow identification of metal toxicities when they occur, and allow for the effective formulation of regulations controlling metal emissions. These imperatives are considered vital in the formulation of intervention measures such as mitigation (AMD neutralization), rehabilitation, and soil amendment. It is hoped that results from our study will contribute towards the making of informed decisions on site investigations, clean-up actions, and remedy selection.
Finally, we recommend that the design of new mining projects should engender considerations of future post-mining landscapes in order to avoid land degradation. Project planning should take cognizance of, and formulate credible measures for, obviating any perceived resultant pollution from PHEs, their intake through consumption of food crops grown on these lands, and the consequent endangerment of human and wildlife health.

Supplementary Materials

The following are available online at https://www.mdpi.com/article/10.3390/min11101133/s1, Table S1: Full table of Krugersdorp water samples analytical results for PHEs.

Author Contributions

Funding acquisition and conceptualization, M.A.J., M.S. and T.C.D.; data curation and writing—original draft preparation and review and editing, M.S., M.A.J. and A.T.M.; formal analysis and preparation for sending to Canada, T.C.D. and M.S.; Maps, E.C. and M.D. All authors have read and agreed to the published version of the manuscript.

Funding

This research was funded by the 2013 Swedish International Development Agency (SIDA)/IGCP/UNESCO Project 606 grant. Further support for this work came from the Centre for Geological and Mining Research, Garoua, Cameroon, as well as the Research Directorate and the Faculty of Natural Sciences of Mangosuthu University of Technology, South Africa.

Data Availability Statement

There is no data reported in this research.

Acknowledgments

The professionalism shown by ACME Laboratories in Vancouver, Canada in performing analytical work of the highest quality is also gratefully acknowledged.

Conflicts of Interest

The authors declare no conflict of interest. In addition, the funders had no role in the design of the study; in the collection, analyses, or interpretation of data; in the writing of the manuscript, or in the decision to publish the results.

References

  1. Bini, C.; Waswa, M. Potentially harmful elements and human health. In PHEs, Environment and Human Health; Bini, C., Bech, J., Eds.; Springer: Dordrecht, The Netherlands, 2014; Chapter 11; pp. 401–463. [Google Scholar] [CrossRef] [Green Version]
  2. Pereira, S.I.A.; Lima, A.I.G.; De Almeida, E.M.; Figueira, P. Heavy metal toxicity in Rhizobium leguminosarum biovar viciae isolated from soils subjected to different sources of heavy-metal contamination: Effects on protein expression. Appl. Soil Ecol. 2006, 33, 286–293. [Google Scholar] [CrossRef]
  3. Olsson, P.E.; Kling, P.; Hogstrand, C. Mechanisms of heavy metal accumulation and toxicity in fish. In Metal Metabolism in Aquatic Environments; Langston, W.J., Bebianno, M.J., Eds.; Springer: Boston, MA, USA, 1998; pp. 321–350. [Google Scholar] [CrossRef]
  4. Robbins, C.T. Wildlife Feeding and Nutrition; Academic Press: Cambridge, MA, USA, 1983; Available online: https://books.google.com.ng/books?hl=en&lr=&id=rkc-S6Lwe7wC&oi=fnd&pg=PP1&dq=cobalt+toxicity++wildlife&ots=6VzIbQEs8#v=onepage&q=cobalt%20toxicity%20%20wildlife&f=false (accessed on 17 October 2020).
  5. Tchounwou, P.B.; Yedjou, C.G.; Patlolla, A.K.; Sutton, D.J. Heavy metal toxicity and the environment. Exp. Suppl. 2012, 101, 133–164. [Google Scholar] [CrossRef] [Green Version]
  6. Shapi, M.; Jordaan, M.A.; Nadasan, D.S.; Davies, T.C.; Chirenje, E.; Dube, M.; Lekoa, M.R. Analysis of the distribution of some potentially harmful elements (PHEs) in the Krugersdorp Game Reserve, Gauteng, South Africa. Minerals 2020, 10, 151. [Google Scholar] [CrossRef]
  7. Encyclopaedia Britannica (EB). Krugersdorp. 2012. Available online: https://www.britannica.com/place/Krugersdorp (accessed on 16 October 2020).
  8. Short, A.; Bootsma, A.; den Boogert, L.; Eyssell-Knox, A.; Kemp, A.; Pienaar, M.; Rautenbach, N.; van Wyk, J. Biodiversity of Krugersdorp Game Reserve. Specialist Report. 2015. Available online: http://www.themedaeco.co.za/uploads/4/0/4/0/40404047/biodiversity_assessment_of_krugersdorp_game_reserve_final_lo_res.pdf (accessed on 12 October 2020).
  9. Minerals Council of South Africa (MCSA). South Africa: Location and Geology. 2020. Available online: https://www.mineralscouncil.org.za/industry-news/11-mining-in-sa/major-sectors (accessed on 16 October 2020).
  10. Hobbs, P.; Cobbing, J. The Hydrogeology of the Krugersdorp Game Reserve Area and Implications for the Management of the Mine Water Decant. 2007. Available online: http://www.anthonyturton.com/assets/my_documents/my_files/85D_Hobbs&Cobbing.pdf (accessed on 22 October 2020).
  11. Naicker, K.; Cukrowska, E.; McCarthy, T.S. Acid mine drainage from gold mining activities in Johannesburg, South Africa and environs. Environ. Pollut. 2003, 122, 29–40. [Google Scholar] [CrossRef]
  12. Hobbs, P.J.; Cobbing, J.E. A Hydrogeological Assessment of Acid Mine Drainage Impacts in the West Rand Basin, Gauteng Province; Report No. CSIR/NRE/WR/ER/2007/0097/C; CSIR/THRIP: Pretoria, South Africa, 2007; Available online: https://pdfs.semanticscholar.org/b8b3/fe04c33abcf8f60a27e73073464b77e40df8.pdf (accessed on 22 October 2020).
  13. Olivier, C.; Landman, W.A.; Beraki, A. River-flow predictions for the South African mid-summer using a coupled general circulation model. In Proceedings of the 29th Annual Conference of the South African Society for Atmospheric Sciences, Durban, South Africa, 26–27 September 2013. [Google Scholar]
  14. Wessels, P. and Rooseboom, A Flow-gauging structures in South African rivers Part 1: An overview. Water Sci. Adv. 2009, 35, 1–19. [Google Scholar]
  15. Landman, W.A.; Goddard, L. Statistical recalibration of GCM forecasts over southern Africa using model output statistics. J. Climatol. 2002, 15, 2038–2055. [Google Scholar] [CrossRef] [Green Version]
  16. Whitmore, J.S. South Africa’s Water Budget. S. Afr. J. Sci. 1971, 67, 166–176. [Google Scholar]
  17. Schulze, R.E.; Maharaj, M.; Lynch, S.D.; Howe, B.J.; Melvil-Thompson, B. South African Atlas of Agro-Hydrology and Climatology; WRC Report No. TT 82/96; Water Research Commission: Pretoria, South Africa, 1997. [Google Scholar]
  18. Harmel, R.D.; King, K.W.; Slade, R. Automated stormwater sampling on small watersheds. Appl. Eng. Agric. 2003, 19, 667–674. [Google Scholar] [CrossRef]
  19. Miller, P.S.; Engel, B.A.; Mohtar, R.H. Sampling Theory and Mass Load Estimation from Watershed Water Quality Data; ASAE Paper No. 003050; ASAE: St. Joseph, MI, USA, 2000. [Google Scholar]
  20. King, K.W.; Harmel, R.D. Considerations in selecting a water quality sampling strategy. Trans. Am. Soc. Agric. Biol. Eng. 2003, 46, 63–73. [Google Scholar]
  21. Austin, H.W. Sample size: How much is enough? Qual. Quant. 1983, 17, 239–245. [Google Scholar] [CrossRef]
  22. Jacobs, J.A.; Lehr, J.H.; Testa, S.M. Acid Mine Drainage, Rock Drainage, and Acid Sulfate Soils: Causes, Assessment, Prediction, Prevention, and Remediation; Wiley: Hoboken, NJ, USA, 2014. [Google Scholar]
  23. Thompson, M. (Ed.) The Estimation and Use of Recovery Factors AMC Technical Briefs: Recommendation. Document AMCTB 21A. 2008. Available online: https://www.rsc.org/images/recovery-factors-technical-brief-21A_tcm18-214880.pdf (accessed on 21 July 2021).
  24. Nadasan, D.S.; Davies, T.C.; Shapi, M.; Chirenje, E. The distribution of some potentially harmful elements (PHEs) in the Krugersdorp Game Reserve, Gauteng, South Africa: Implications for wildlife health. In Proceedings of the IGCP/SIDA Projects 594 and 606, Closing Workshop, Prague, Czech Republic, 26–28 May 2014. [Google Scholar]
  25. Perlatti, F.; Otero, X.L.; Macias, F.; Ferreira, T.O. Geochemical speciation and dynamic of copper in tropical semi-arid soils exposed to metal-bearing mine wastes. Sci. Total Environ. 2014, 500–501, 91–102. [Google Scholar] [CrossRef] [PubMed]
  26. Akcil, A.; Koldas, S. Acid Mine Drainage (AMD): Causes, treatment and case studies. J. Clean. Prod. 2006, 14, 1139–1145. [Google Scholar] [CrossRef]
  27. McCarthy, T.S. The impact of acid mine drainage in South Africa. S. Afr. J. Sci. 2011, 107, 1–7. [Google Scholar] [CrossRef]
  28. Bureau of Indian Standards (BIS). Indian Standard for Drinking Water—Specification, 2nd ed.; FAD 25; Drinking Water Sectional Committee: New Delhi, India, 2012.
  29. United States Environmental Protection Agency (US EPA). Drinking Water Contaminants. 2015. Available online: https://www.epa.gov/sites/production/files/2015-10/documents/ace3_drinking_water.pdf (accessed on 22 October 2020).
  30. World Health Organization (WHO). Guidelines for Drinking Water Quality; Fourth Edition Incorporating the First Addendum; World Health Organization: Geneva, Switzerland, 2017. [Google Scholar]
  31. Adriano, D.C. Trace Elements in Terrestrial Environments: Biogeochemistry, Bioavailability and Risks of Metals, 2nd ed.; Springer: New York, NY, USA, 2001; p. 860. [Google Scholar]
  32. Mugwa, A.J. Bioprecipitation of Heavy Metals and Radionuclides with Calcium Carbonate in Aqueous Solutions and Particulate Media. Ph.D. Thesis, Cardiff University, Cardiff, UK, 2015. Available online: https://orca.cf.ac.uk/91289/1/2016MugwarAJPhD.pdf (accessed on 19 October 2020).
  33. World Health Organization (WHO). Silver in Drinking-Water. In Background Document for Preparation of WHO Guidelines for Drinking-Water Quality; (WHO/SDE/WSH/03.04/14); World Health Organization: Geneva, Switzerland, 2003. [Google Scholar]
  34. World Health Organization (WHO). Concise International Chemical Assessment Document 69: Cobalt and Inorganic Cobalt Compounds; World Health Organization: Geneva, Switzerland, 2006; Available online: https://www.who.int/ipcs/publications/cicad/cicad69%20.pdf?ua=1https://www.who.int/ipcs/publications/cicad/cicad69%20.pdf?ua=1 (accessed on 11 October 2020).
  35. Italia Ministero della Salute. Attuazione della Direttiva 98/83/CE, Relativa alla Qualità delle Acque Destinate al Consumo Umano. Modifica del Valore Parametrico per il Vanadio. (11A16893). Gazzetta Ufficiale—Serie Generale n. 4, 5 January 2012. [Google Scholar]
  36. Crebelli, R.; Leopardi, P. Long-term risks of metal contaminants in drinking water: A critical appraisal of guideline values for arsenic and vanadium. Ann. Ist. Super Sanità. 2012, 48, 354–361. Available online: http://old.iss.it/binary/publ/cont/ANN_12_04_03.pdf (accessed on 11 October 2020). [CrossRef]
  37. WHO. Zinc in Drinking-Water. In Background Document for Preparation of WHO Guidelines for Drinking-Water Quality; WHO/SDE/WSH/03.04/17; World Health Organization: Geneva, Switzerland, 2003. [Google Scholar]
  38. Davies, T.C.; Mundalamo, H.R. Environmental health impacts of dispersed mineralisation in South Africa. J. Afr. Earth Sci. 2010, 58, 652–666. [Google Scholar] [CrossRef]
  39. Greeff, D. The Impact of Heavy Metal Contamination on the Morphology and Physiology of Small Mammals. Master’s Thesis, University of the Witwatersrand, Johannesburg, South Africa, 2018. [Google Scholar]
  40. Du Toit, S. Practical applications−Effects of mine water drainage on the Krugersdorp Game Reserve. In Proceedings of the Conference on Mine Water Decant, Randfontein, South Africa, 14–15 October 2006. [Google Scholar]
  41. Azimzada, A.; Tufenkji, N.; Wilkinson, K.J. Transformations of silver nanoparticles in wastewater effluents: Links to Ag bioavailability. Environ. Sci. Nano 2017, 4, 1339–1349. [Google Scholar] [CrossRef] [Green Version]
  42. Behra, R.; Sigg, L.; Clift, M.J.; Herzog, F.; Minghetti, M.; Johnston, B.; Petri-Fink, A.; Rothen-Rutishauser, B. Bioavailability of silver nanoparticles and ions: From a chemical and biochemical perspective. J. R. Soc. Interface 2013, 10, 20130396. [Google Scholar] [CrossRef]
  43. Nordberg, G.F.; Fowler, B.A.; Nordberg, M.; Friberg, L.T. (Eds.) Handbook on the Toxicology of Metals, 3rd ed.; Academic Press: Cambridge, MA, USA, 2007. [Google Scholar] [CrossRef]
  44. Ratte, H.T. Bioaccumulation and toxicity of silver compounds: A review. Environ. Toxicol. Chem. 2009, 18, 89–108. Available online: https://setac.onlinelibrary.wiley.com/doi/10.1002/etc.5620180112 (accessed on 13 October 2020). [CrossRef]
  45. Smedley, P.L.; Kinniburgh, D.G. A review of the source, behaviour and distribution of arsenic in natural waters. Appl. Geochem. 2002, 17, 517–568. [Google Scholar] [CrossRef] [Green Version]
  46. Jensen, J. The Role of Carbonate Minerals in Arsenic Mobility in a Shallow Aquifer Influenced by a Seasonally Fluctuating Groundwater Table. All Graduate Theses and Dissertations, 7817. Civil and Environmental Engineering Commons, University of Utah. 2020. Available online: https://digitalcommons.usu.edu/etd/7817 (accessed on 30 January 2021).
  47. Eisler, R. Arsenic Hazards to Humans, Plants, and Animals from Gold Mining. Rev. Environ. Contam. Toxicol. 2004, 180, 133–165. [Google Scholar] [CrossRef]
  48. Herath, I.; Vithanage, M.; Bundschuh, J.; Maity, J.P.; Bhattacharya, P. Natural arsenic in global groundwaters: Distribution and geochemical triggers for mobilization. Curr. Pollut. Rep. 2016, 2, 68–89. [Google Scholar] [CrossRef] [Green Version]
  49. Dold, B. Evolution of acid mine drainage formation in sulphidic mine tailings. Minerals 2014, 4, 621–641. [Google Scholar] [CrossRef] [Green Version]
  50. Mehmood, A.; Hayat, R.; Wasim, M.; Akhtar, M.S. Mechanisms of arsenic adsorption in calcareous soils. J. Agric. Biol. Sci. 2009, 1, 59–65. [Google Scholar]
  51. Kim, M.-J.; Nriagu, J.; Haack, S. Carbonate ions and arsenic dissolution by groundwater. Environ. Sci. Technol. 2000, 34, 3094–3100. [Google Scholar] [CrossRef]
  52. Lee, J.S.; Nriagu, G.O. Arsenic carbonate complexes in aqueous systems. In Biogeochemistry of Environmentally Important Trace Elements; ACS Symposium Series; Cai, Y., Braids, O.C., Eds.; ACS Publications: Washington, DC, USA, 2002; Chapter 3; Volume 835, pp. 33–41. [Google Scholar] [CrossRef]
  53. Neuberger, C.S.; Helz, G.R. Arsenic (III) carbonate complexing. Appl. Geochem. 2005, 20, 1218–1225. [Google Scholar] [CrossRef]
  54. (ATSDR) Agency for Toxic Substances and Disease Registry. Public Health Statement, Cobalt. CAS#: 7440-48-4. 2004. Available online: https://www.atsdr.cdc.gov/toxprofiles/tp.asp?id=373&tid=64 (accessed on 17 October 2020).
  55. Oghenekome, M.E.; Chatterjee, T.K.; Donker, J.M.V.B.; Hammond, N.Q. Geochemistry and weathering history of the Balfour sandstone formation, Karoo basin, South Africa: Insight to provenance and tectonic setting. J. Afr. Earth Sci. 2018, 147, 623–632. [Google Scholar] [CrossRef]
  56. Du Preez, C.C.; van Huyssteen, C.W. Threats to soil and water resources in South Africa. Environ. Res. 2020, 183, 109015. [Google Scholar] [CrossRef] [PubMed]
  57. Djouider, F. Radiolytic formation of non-toxic Cr(III) from toxic Cr(VI) in formate containing aqueous solutions: A system for water treatment. J. Hazard. Mater. 2012, 223–224, 104–109. [Google Scholar] [CrossRef] [PubMed]
  58. Oliveira, H. Chromium as an environmental pollutant: Insights on induced plant toxicity. J. Bot. 2012, 2012, 375843. [Google Scholar] [CrossRef]
  59. WHO. Chromium. In Environmental Health Criteria, 61; World Health Organization: Geneva, Switzerland, 1988; pp. 1–197. [Google Scholar]
  60. Wuana, R.; Okieimen, F.E. Heavy Metals in Contaminated Soils: A Review of Sources, Chemistry, Risks and Best Available Strategies for Remediation. International Scholarly Research Notices. 2011, Volume 2011. Available online: https://www.hindawi.com/journals/isrn/2011/402647/ (accessed on 22 October 2020).
  61. Pawlisz, A.V.; Kent, R.A.; Schneider, U.A.; Jefferson, C. Canadian water quality guidelines for chromium. Environ. Toxicol. Water Qual. 1997, 12, 123–183. [Google Scholar] [CrossRef]
  62. Marsden, D.D. The current limited impact of Witwatersrand gold-mine residues on water pollution in the Vaal river system. J. S. Afr. Inst. Min. Metall. 1986, 86, 481–504. [Google Scholar]
  63. Olobatoke, R.Y.; Mathuthu, M.; Chang, S. Heavy metal concentration in soil in the tailing dam vicinity of an old gold mine in Johannesburg, South Africa. Can. J. Soil Sci. 2016, 96, 299–304. [Google Scholar] [CrossRef]
  64. Ebenebe, P.C.; Shale, K.; Sedibe, M.; Tikilili, P.; Achilonu, M.C. South African mine effluents: Heavy metal pollution and impact on the ecosystem. Int. J. Chem. Sci. 2017, 15, 198. Available online: https://core.ac.uk/download/pdf/222967782.pdf (accessed on 7 October 2020).
  65. Ngole-Jeme, V.M.; Fantke, P. Ecological and human health risks associated with abandoned gold mine tailings contaminated soil. PLoS ONE 2017, 12, e0172517. [Google Scholar] [CrossRef] [PubMed] [Green Version]
  66. Nthunya, L.; Masheane, M.L.; Malinga, S.P.; Nxumalo, E.N.; Mamba, B.B.; Mhlanga, S.D. Determination of toxic metals in drinking water sources in the Chief Albert Luthuli Local Municipality in Mpumalanga, South Africa. Phys. Chem. Earth 2017, 100, 94–100. [Google Scholar] [CrossRef]
  67. Howe, P.D.; Malcolm, H.M.; Dobson, S. Manganese and Its Compounds: Environmental Aspects. Concise International Chemical Assessment 63. 2004. Available online: https://books.google.com.ng/books?hl=en&lr=&id=3nQ0DgAAQBAJ&oi=fnd&pg=PP1&dq=MANGANESE (accessed on 15 October 2020).
  68. Watt, J.A.J.; Burke, I.T.; Edwards, R.A.; Malcolm, H.A.; Mayes, W.M.; Olszewska, J.P.; Pan, G.; Graham, M.C.; Heal, K.V.; Rose, N.L.; et al. Vanadium: A re-emerging environmental hazard. Environ. Sci. Technol. 2018, 52, 11973–11974. [Google Scholar] [CrossRef] [PubMed] [Green Version]
  69. Bengtsson, S.; Tyler, G. Vanadium in the Environment. A Technical Report. 1976. Available online: https://wedocs.unep.org/bitstream/handle/20.500.11822/27970/vanadium.pdf?sequence=1&isAllowed=y (accessed on 15 October 2020).
  70. Viers, J.; Dupré, B.; Gaillardet, J. Chemical composition of suspended sediments in World Rivers: New insights from a new database. Sci. Total. Environ. 2009, 407, 85–868. [Google Scholar] [CrossRef] [PubMed]
  71. Fuchs, S.; Williams-Jones, A.E.; Jackson, S.E.; Przybyłowicz, W. Metal distribution in pyrobitumen of the Carbon Leader Reef, Witwatersrand Supergroup, South Africa: Evidence for liquid hydrocarbon ore fluids. Chem. Geol. 2016, 426, 45–59. [Google Scholar] [CrossRef] [Green Version]
Figure 1. Location of the study area. Source: [6].
Minerals 11 01133 g001
Figure 2. Simplified geological map of Krugersdorp, incorporating water sampling locations KW.
Minerals 11 01133 g002
Figure 3. Plot of the recovered quantities of PHEs in the in-house reference materials STD TMDA-70.
Minerals 11 01133 g003
Figure 4. Simplified geological map of Krugersdorp, incorporating rock types and mine locations (KS6 and KS7) [24].
Minerals 11 01133 g004
Table 1. Description of sampling points.
No.Sampling PointDescription
1KW1 A, B, and CStagnant pool of water near mine tailings
2KW2 A, B, and CStream
3KW3 A, B, and CStream
4KW4 A, B, and CStream
5KW5 A, B, and CStream
6KW6 A, B, and CBorehole
7KW7 A, B, and CStream
8KW8 A, B, and CStream
9KW9 A, B, and CStream
10KW10 A, B, and CStream
Three (3) samples, A, B, and C, were collected from each sampling point.
Table 2. Calculated standard deviation between QC sample and Pulp duplicate KW1A.
ElementAgAlAsCoCrCuFeMnNiPbVZn
KW1A0.2140.0017.100.141.606.40117.002.621.806.3026.8046.10
QC0.1641.0017.220.162.206.80133.002.951.806.1038.8047.80
SD0.040.710.080.010.420.2811.310.230.000.148.491.20
SD: standard deviation.
Table 5. The six PHEs with the highest concentrations with their RfD values (mg L−1) and potential health effects.
Potentially Harmful Elements (PHEs)* Chronic Oral Reference Dose (RfD)Potential Health Effects
Ag0.005 Immune function disorders
As0.0003 Toxic, Carcinogenic, and mutagenic risk; readily absorbed by plants from groundwater and soil
Co0.03Microorganisms (Rhizobium sp.); essential to animals, may harmfully affect heart and lung function
Cr0.003Carcinogenic, mutagenic, and teratogenic and may cause hypersensitivity reactions
Mn0.14Genotoxic and carcinogenic Effects
V0.007 * Decreased fertility, embryolethality, fetotoxicity, and teratogenicity
[24], * [43].
Publisher’s Note: MDPI stays neutral with regard to jurisdictional claims in published maps and institutional affiliations.

