Advanced Geomechanical Model to Predict the Impact of CO2-Induced Microstructural Alterations on the Cohesive-Frictional Behavior of Mt. Simon Sandstone

 , ,
, , 
Abstract
:1. Introduction
2. Materials and Methods
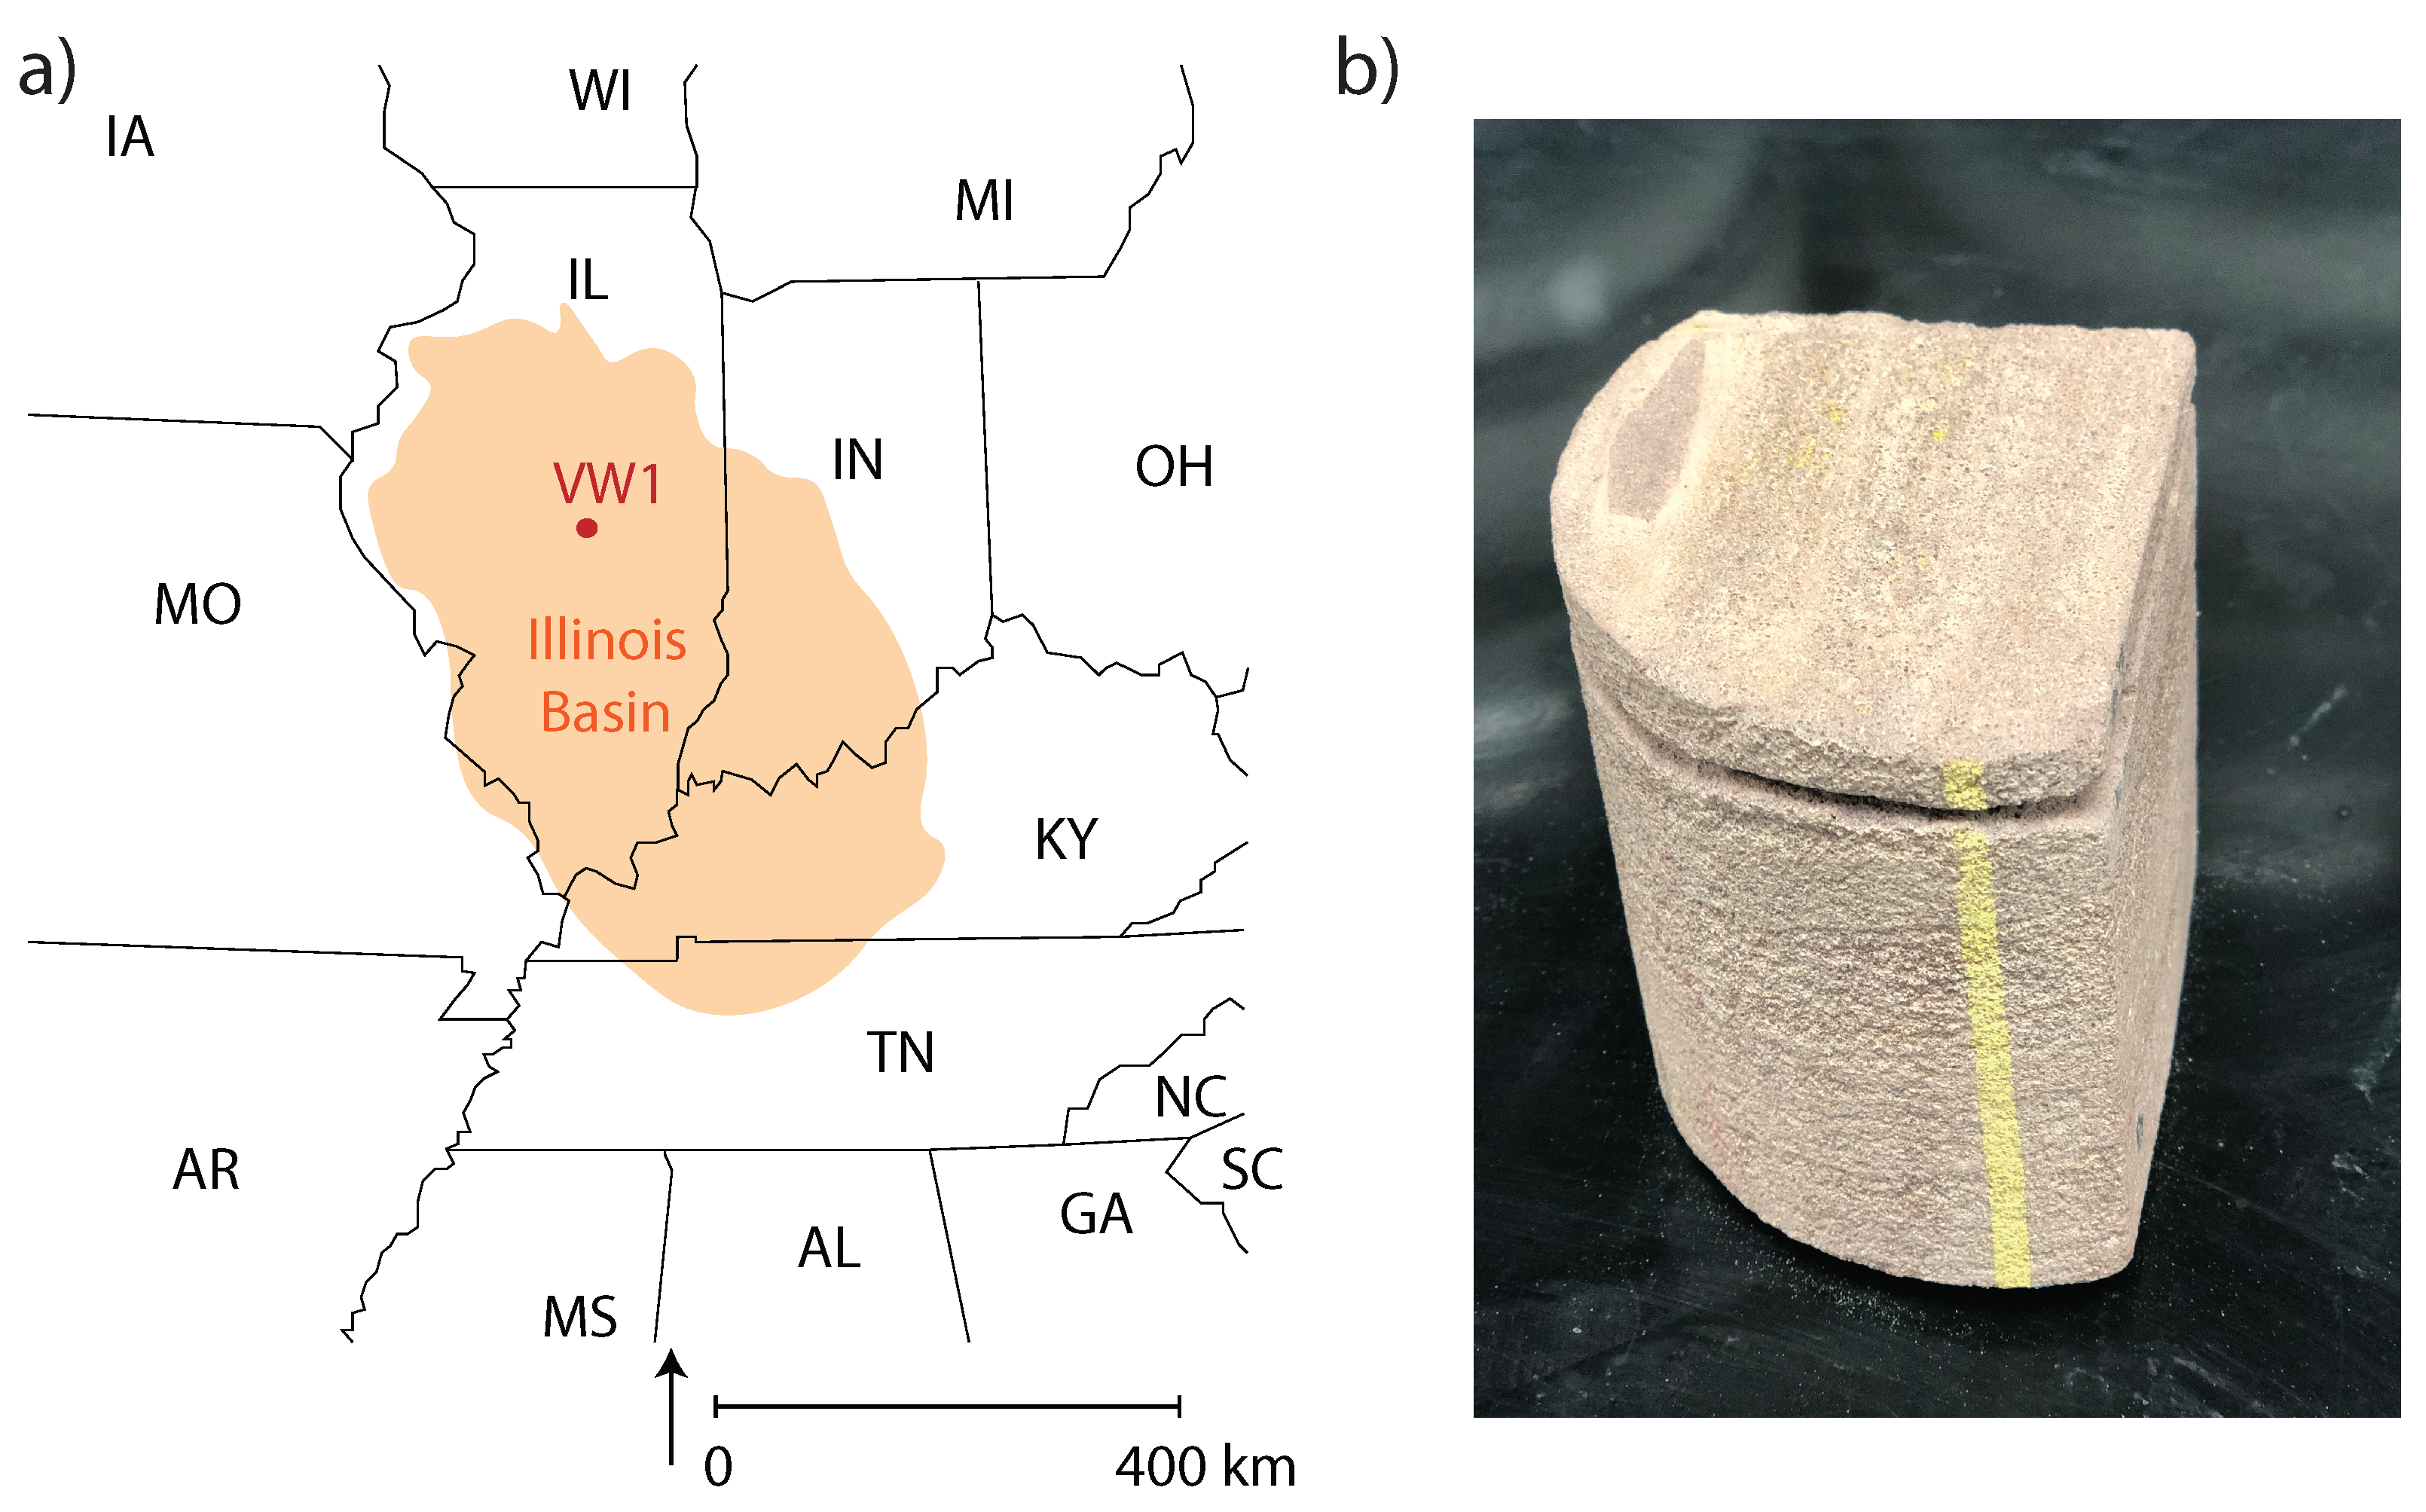
2.1. Materials
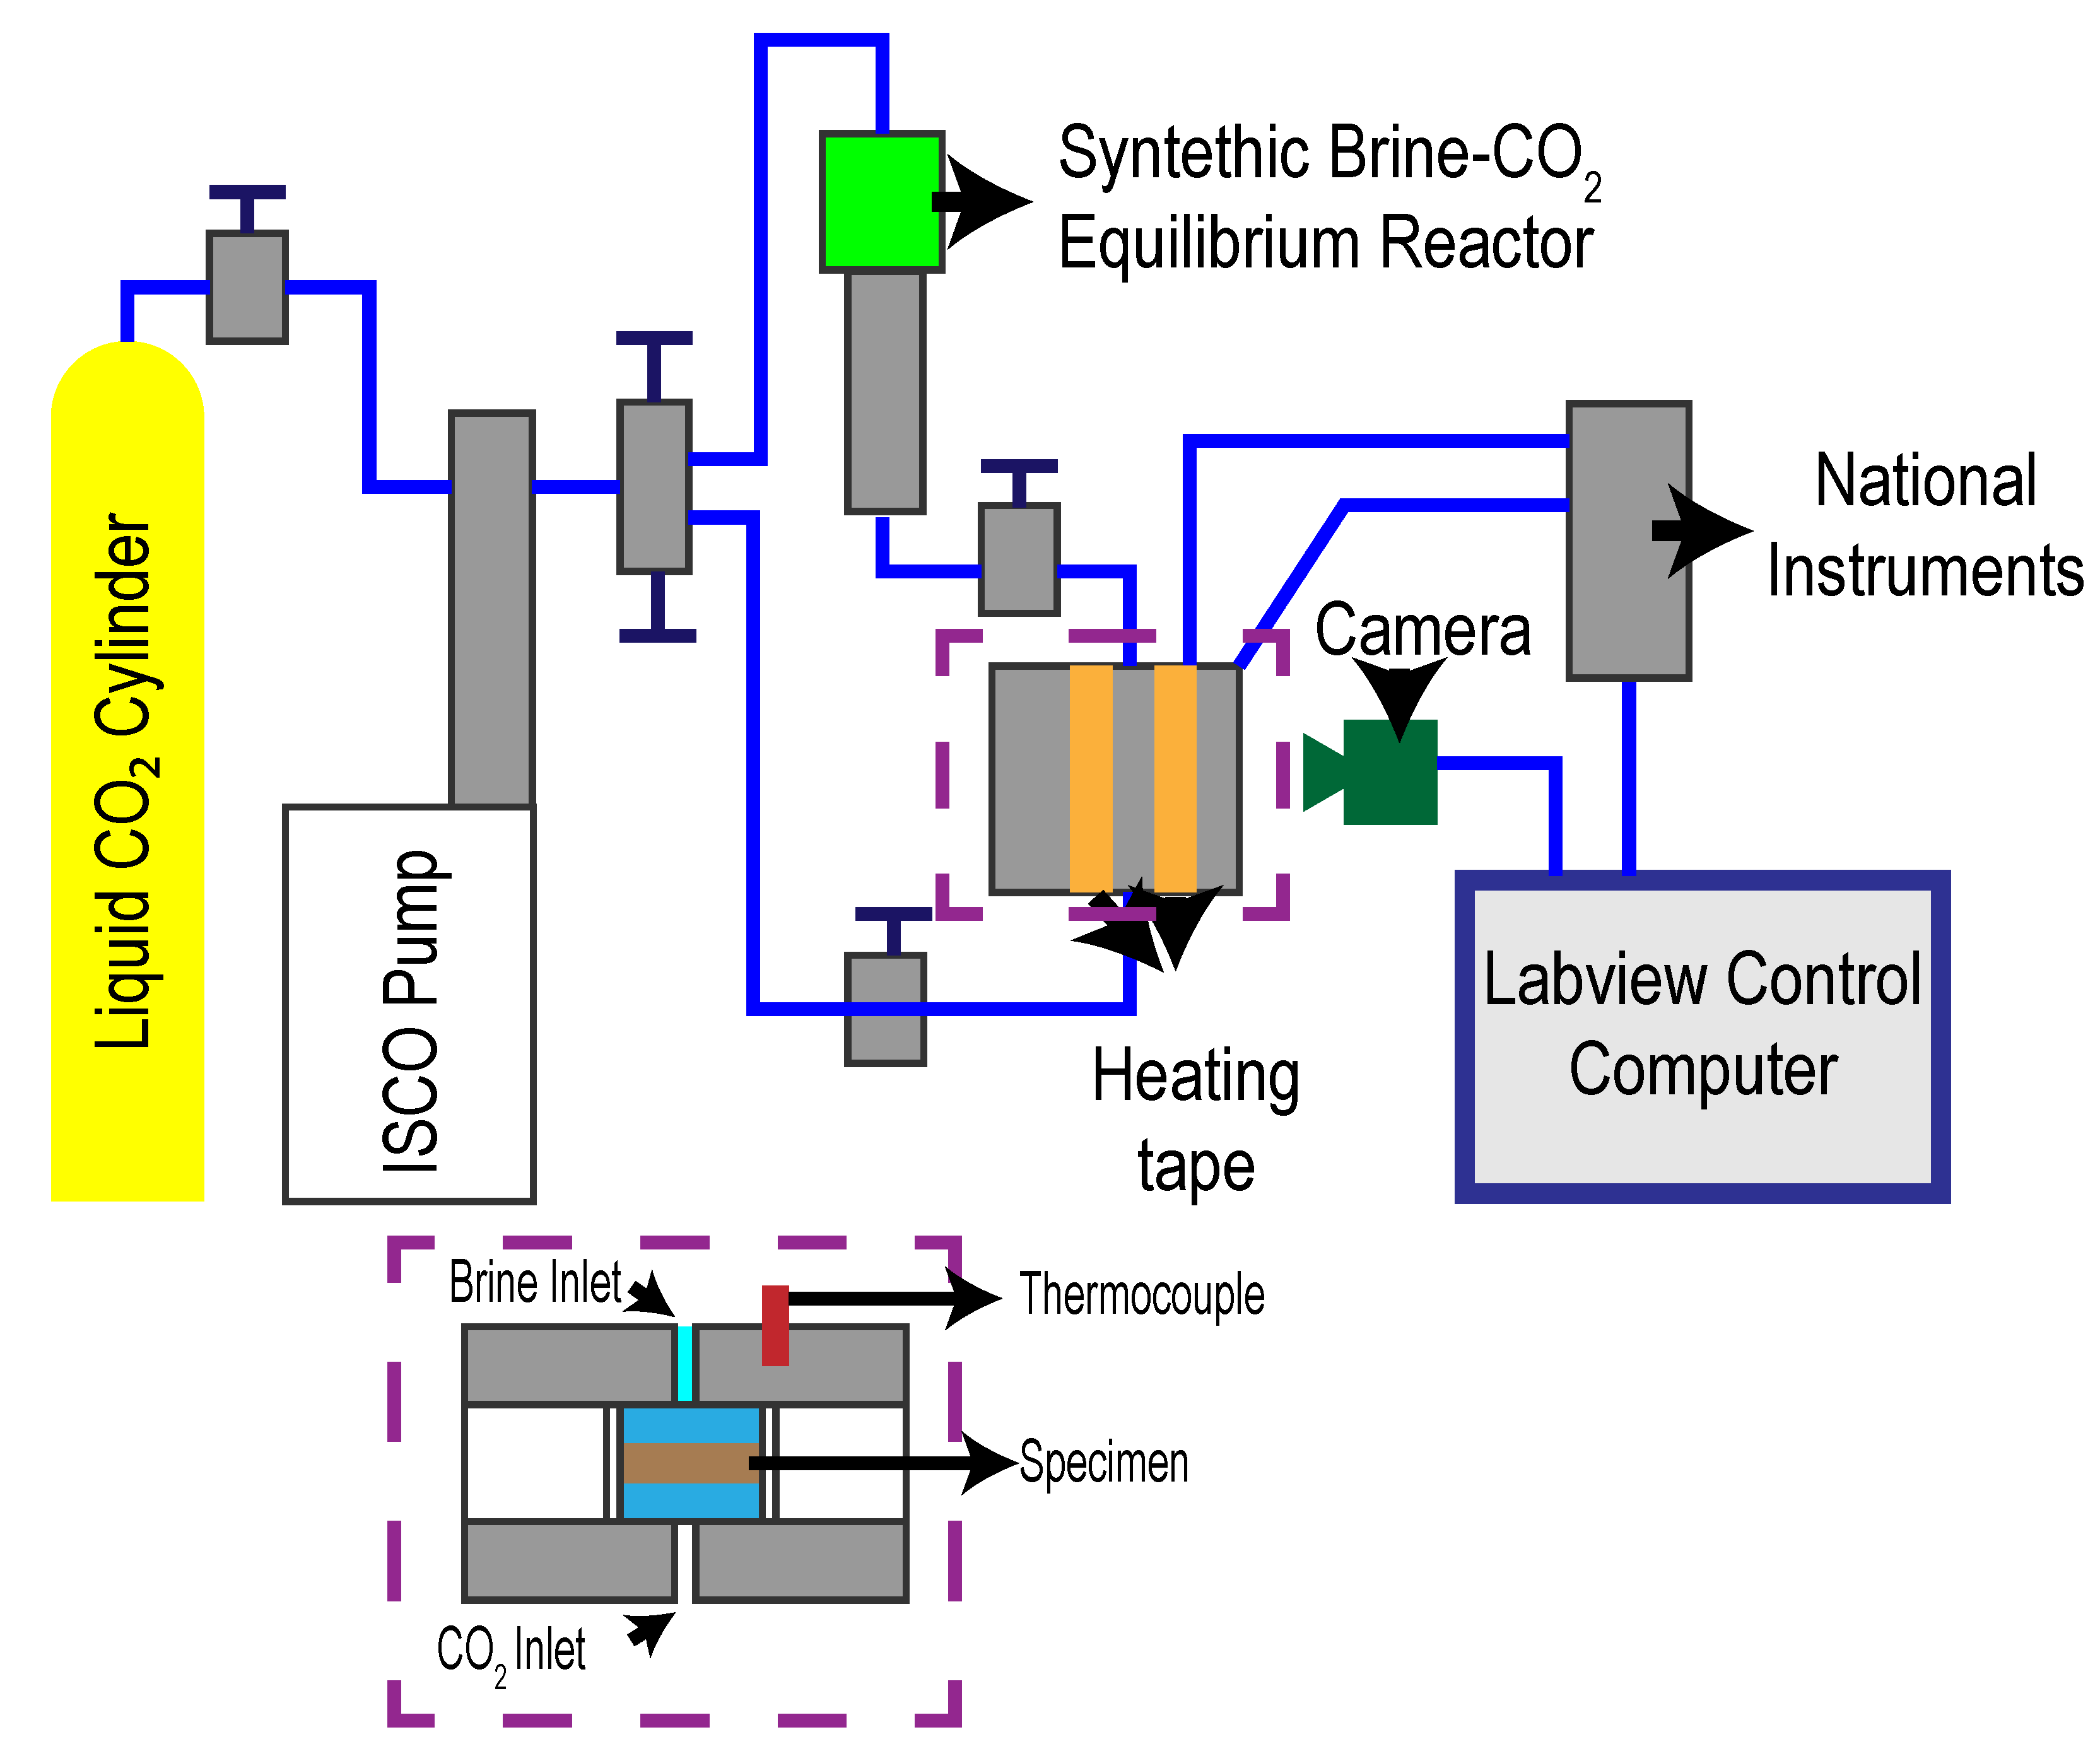
2.2. CO Alteration Experiments
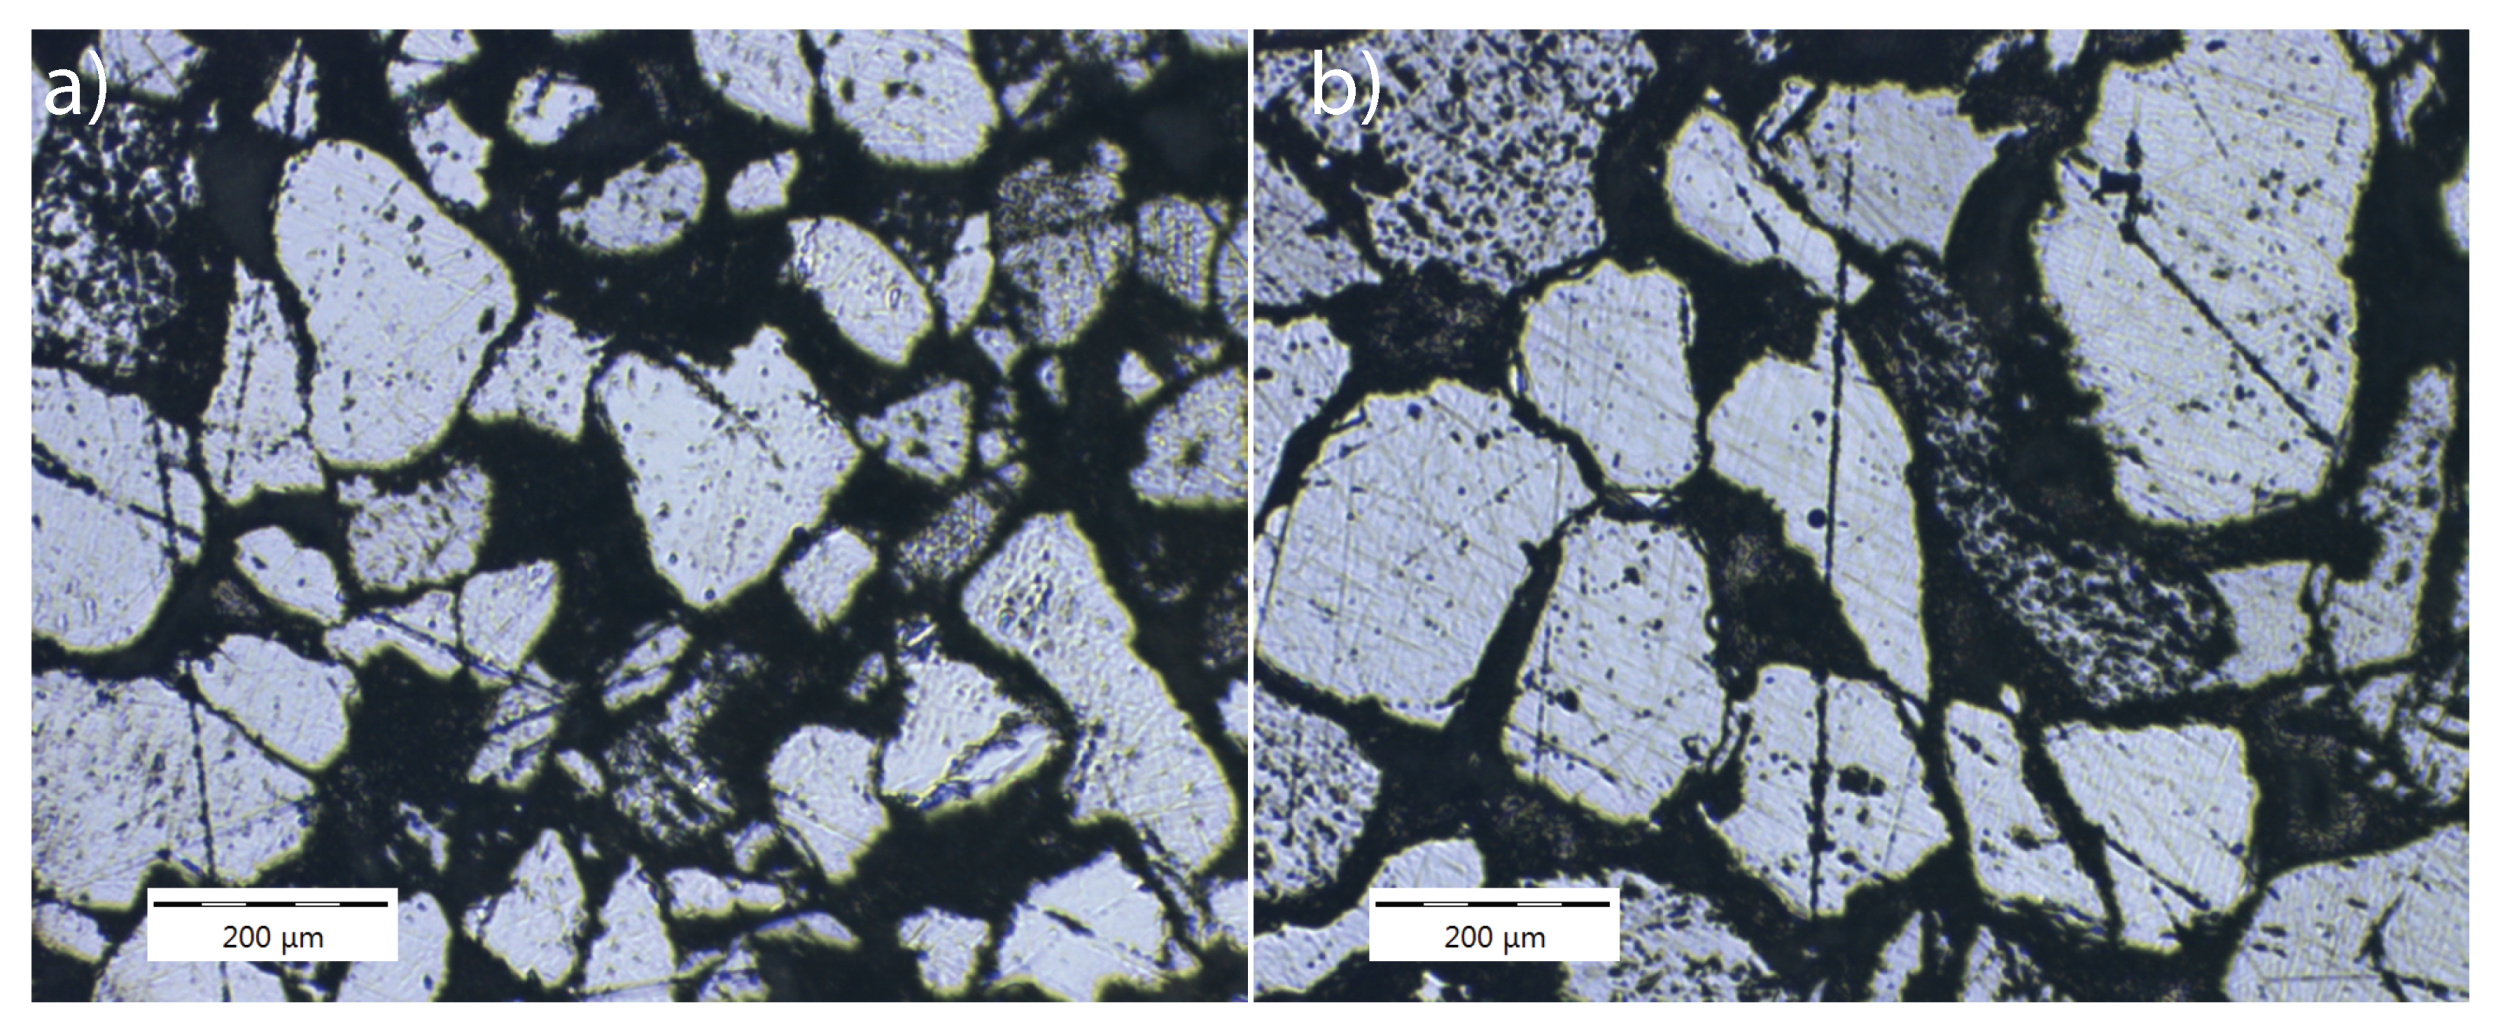
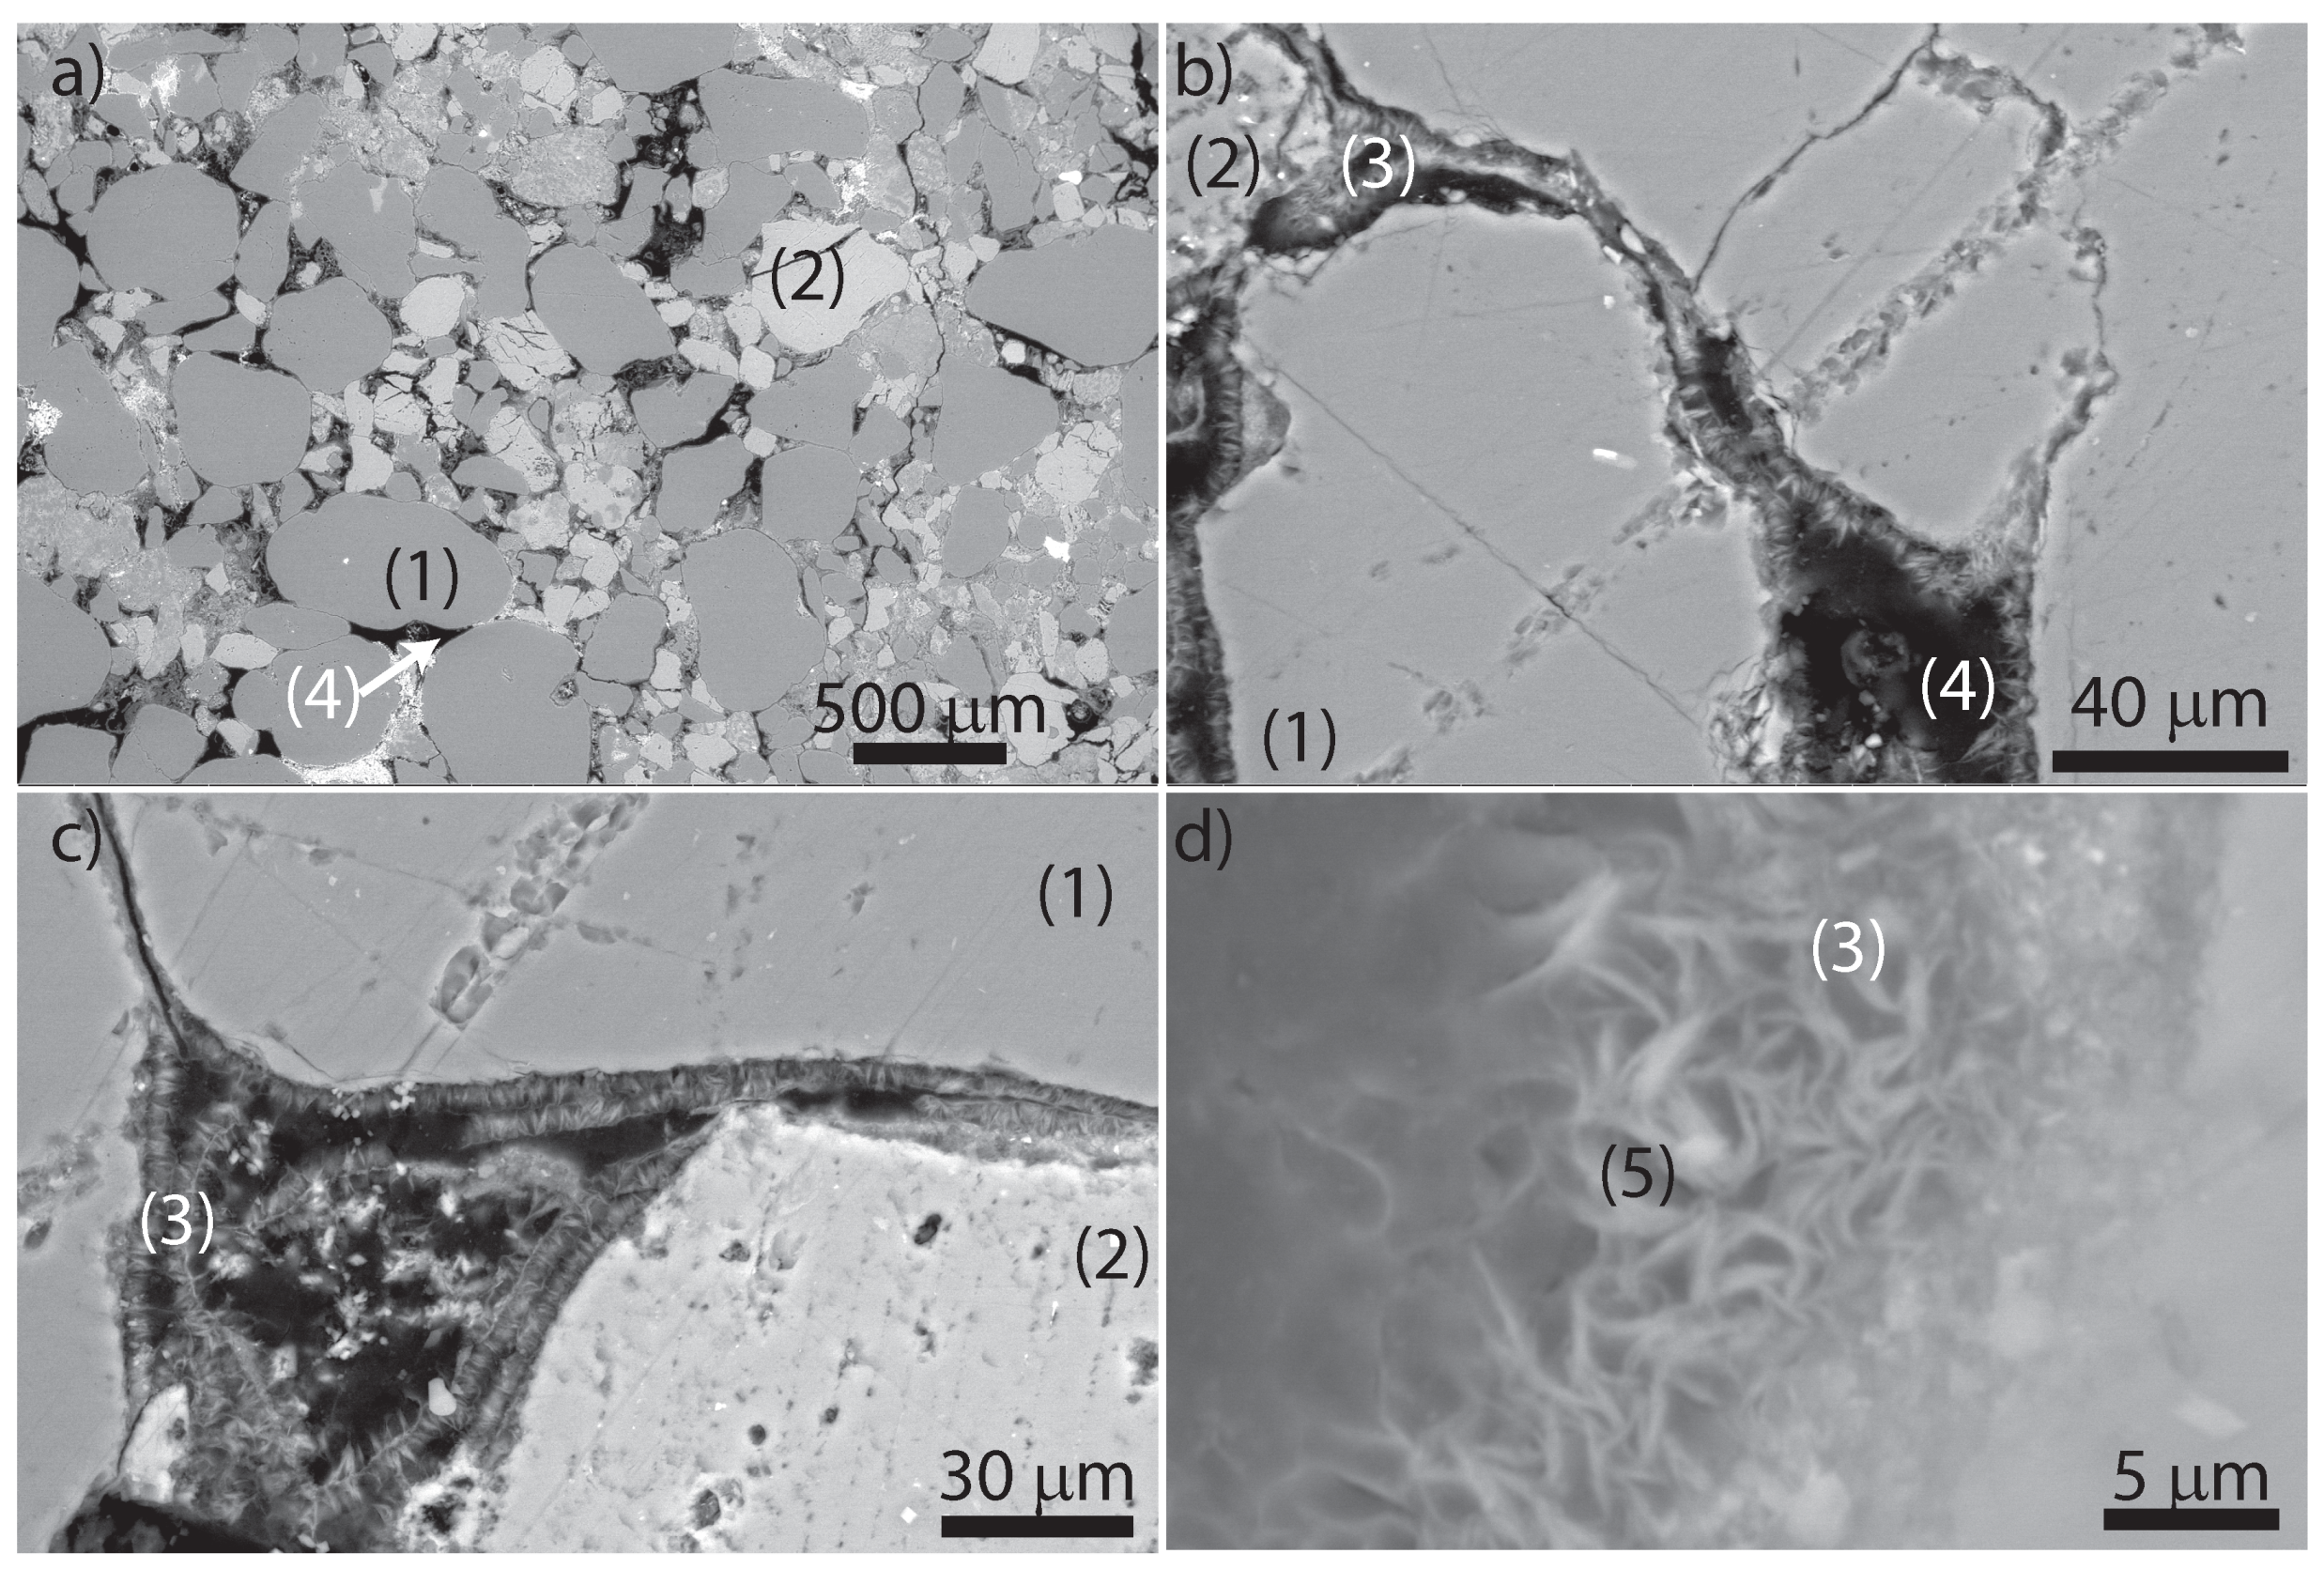
2.3. Grinding and Polishing, Optical Microscopy, and Scanning Electron Microscopy Imaging
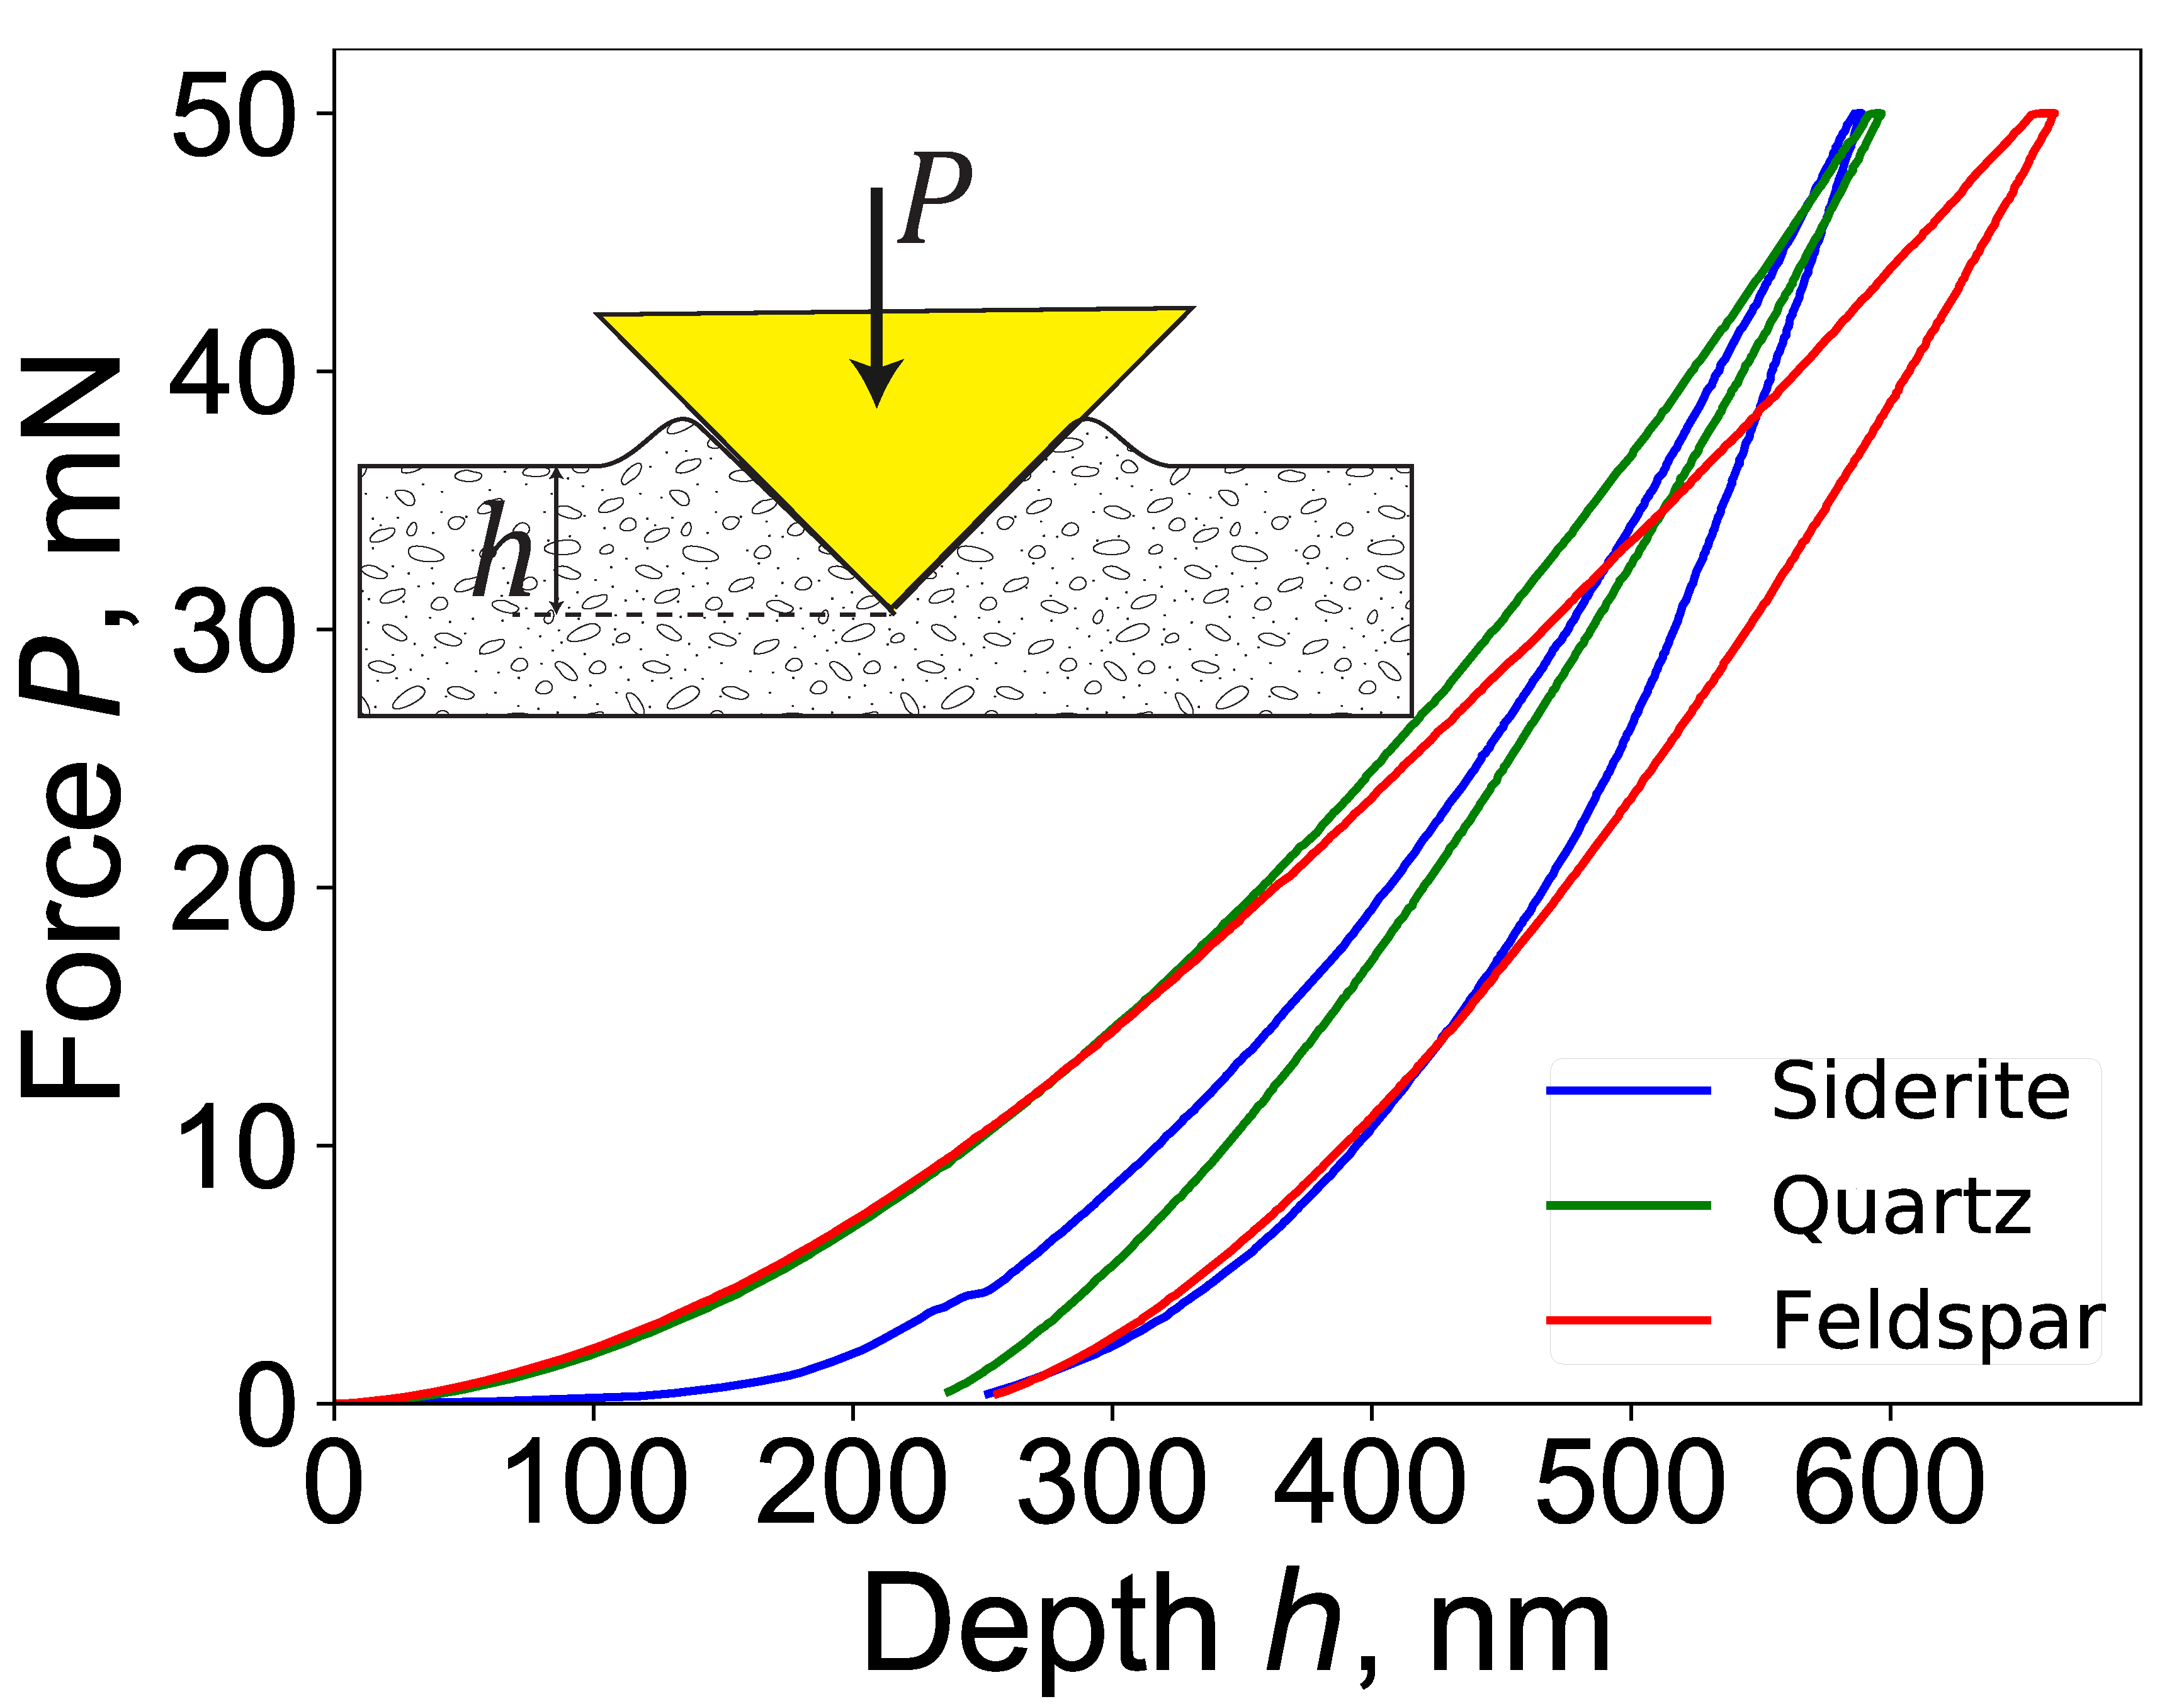
2.4. Grid Nanoindentation Testing
3. Poromechanical Model
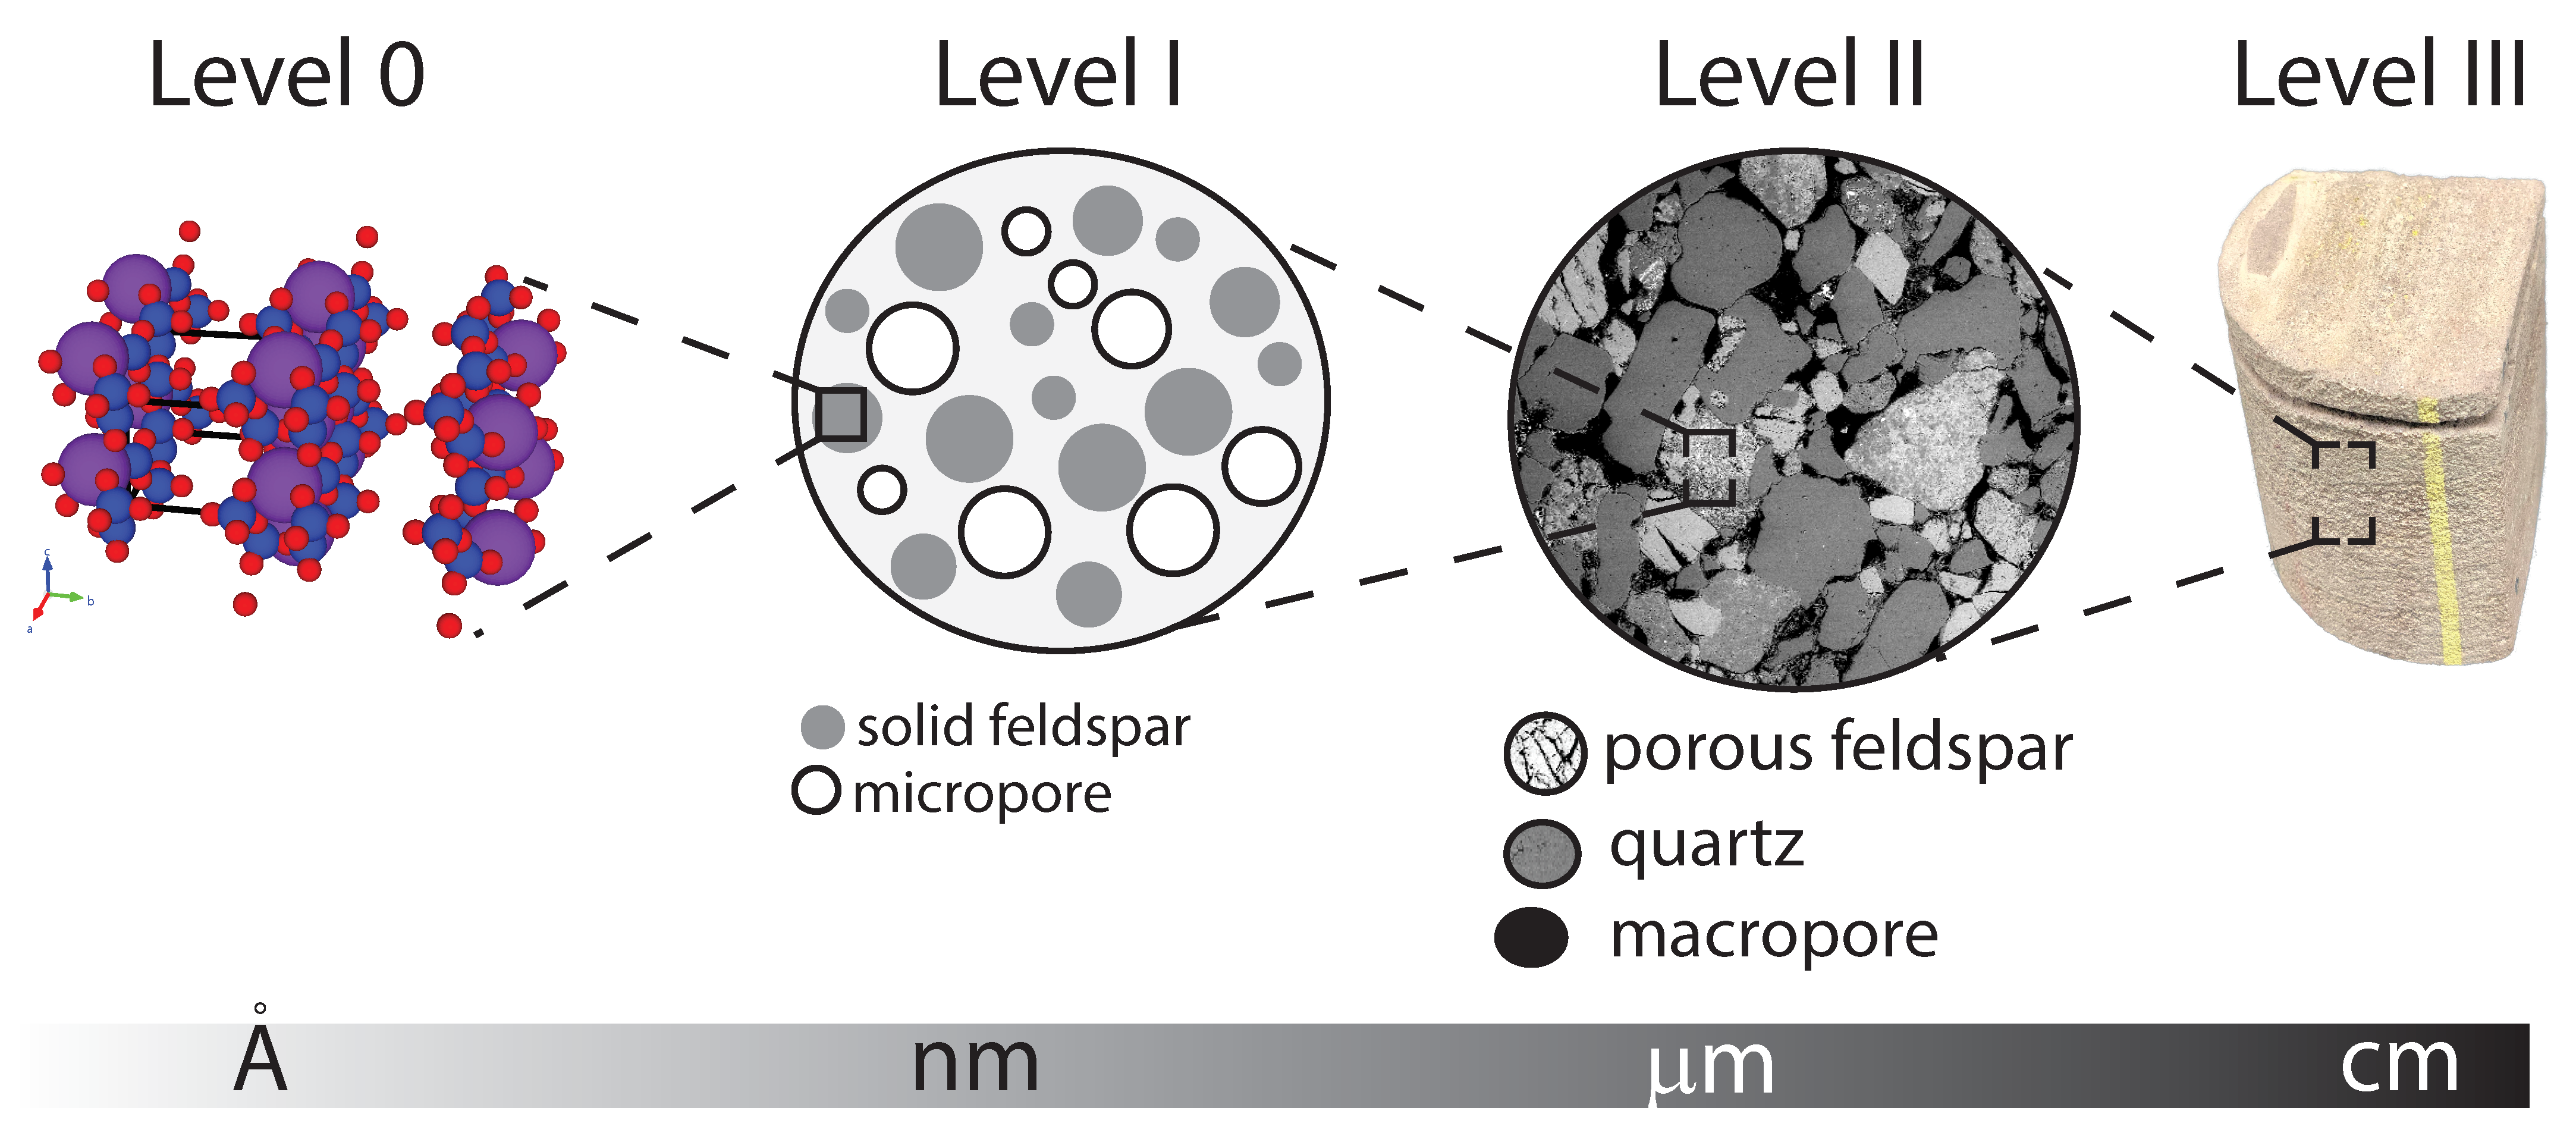
3.1. Conceptual Multiscale Model for Host Rock
3.2. Upscaling of Poro-Elastic Properties
3.2.1. Molecular Level (0) → Pore Level (I)
3.2.2. Pore Level (I) → Core Level (II)
3.3. Casta neda and Willis Variational Framework for Strength Upscaling
3.3.1. Molecular Level (0) → Pore Level (I)
3.3.2. Pore Level (I) → Core Level (II)
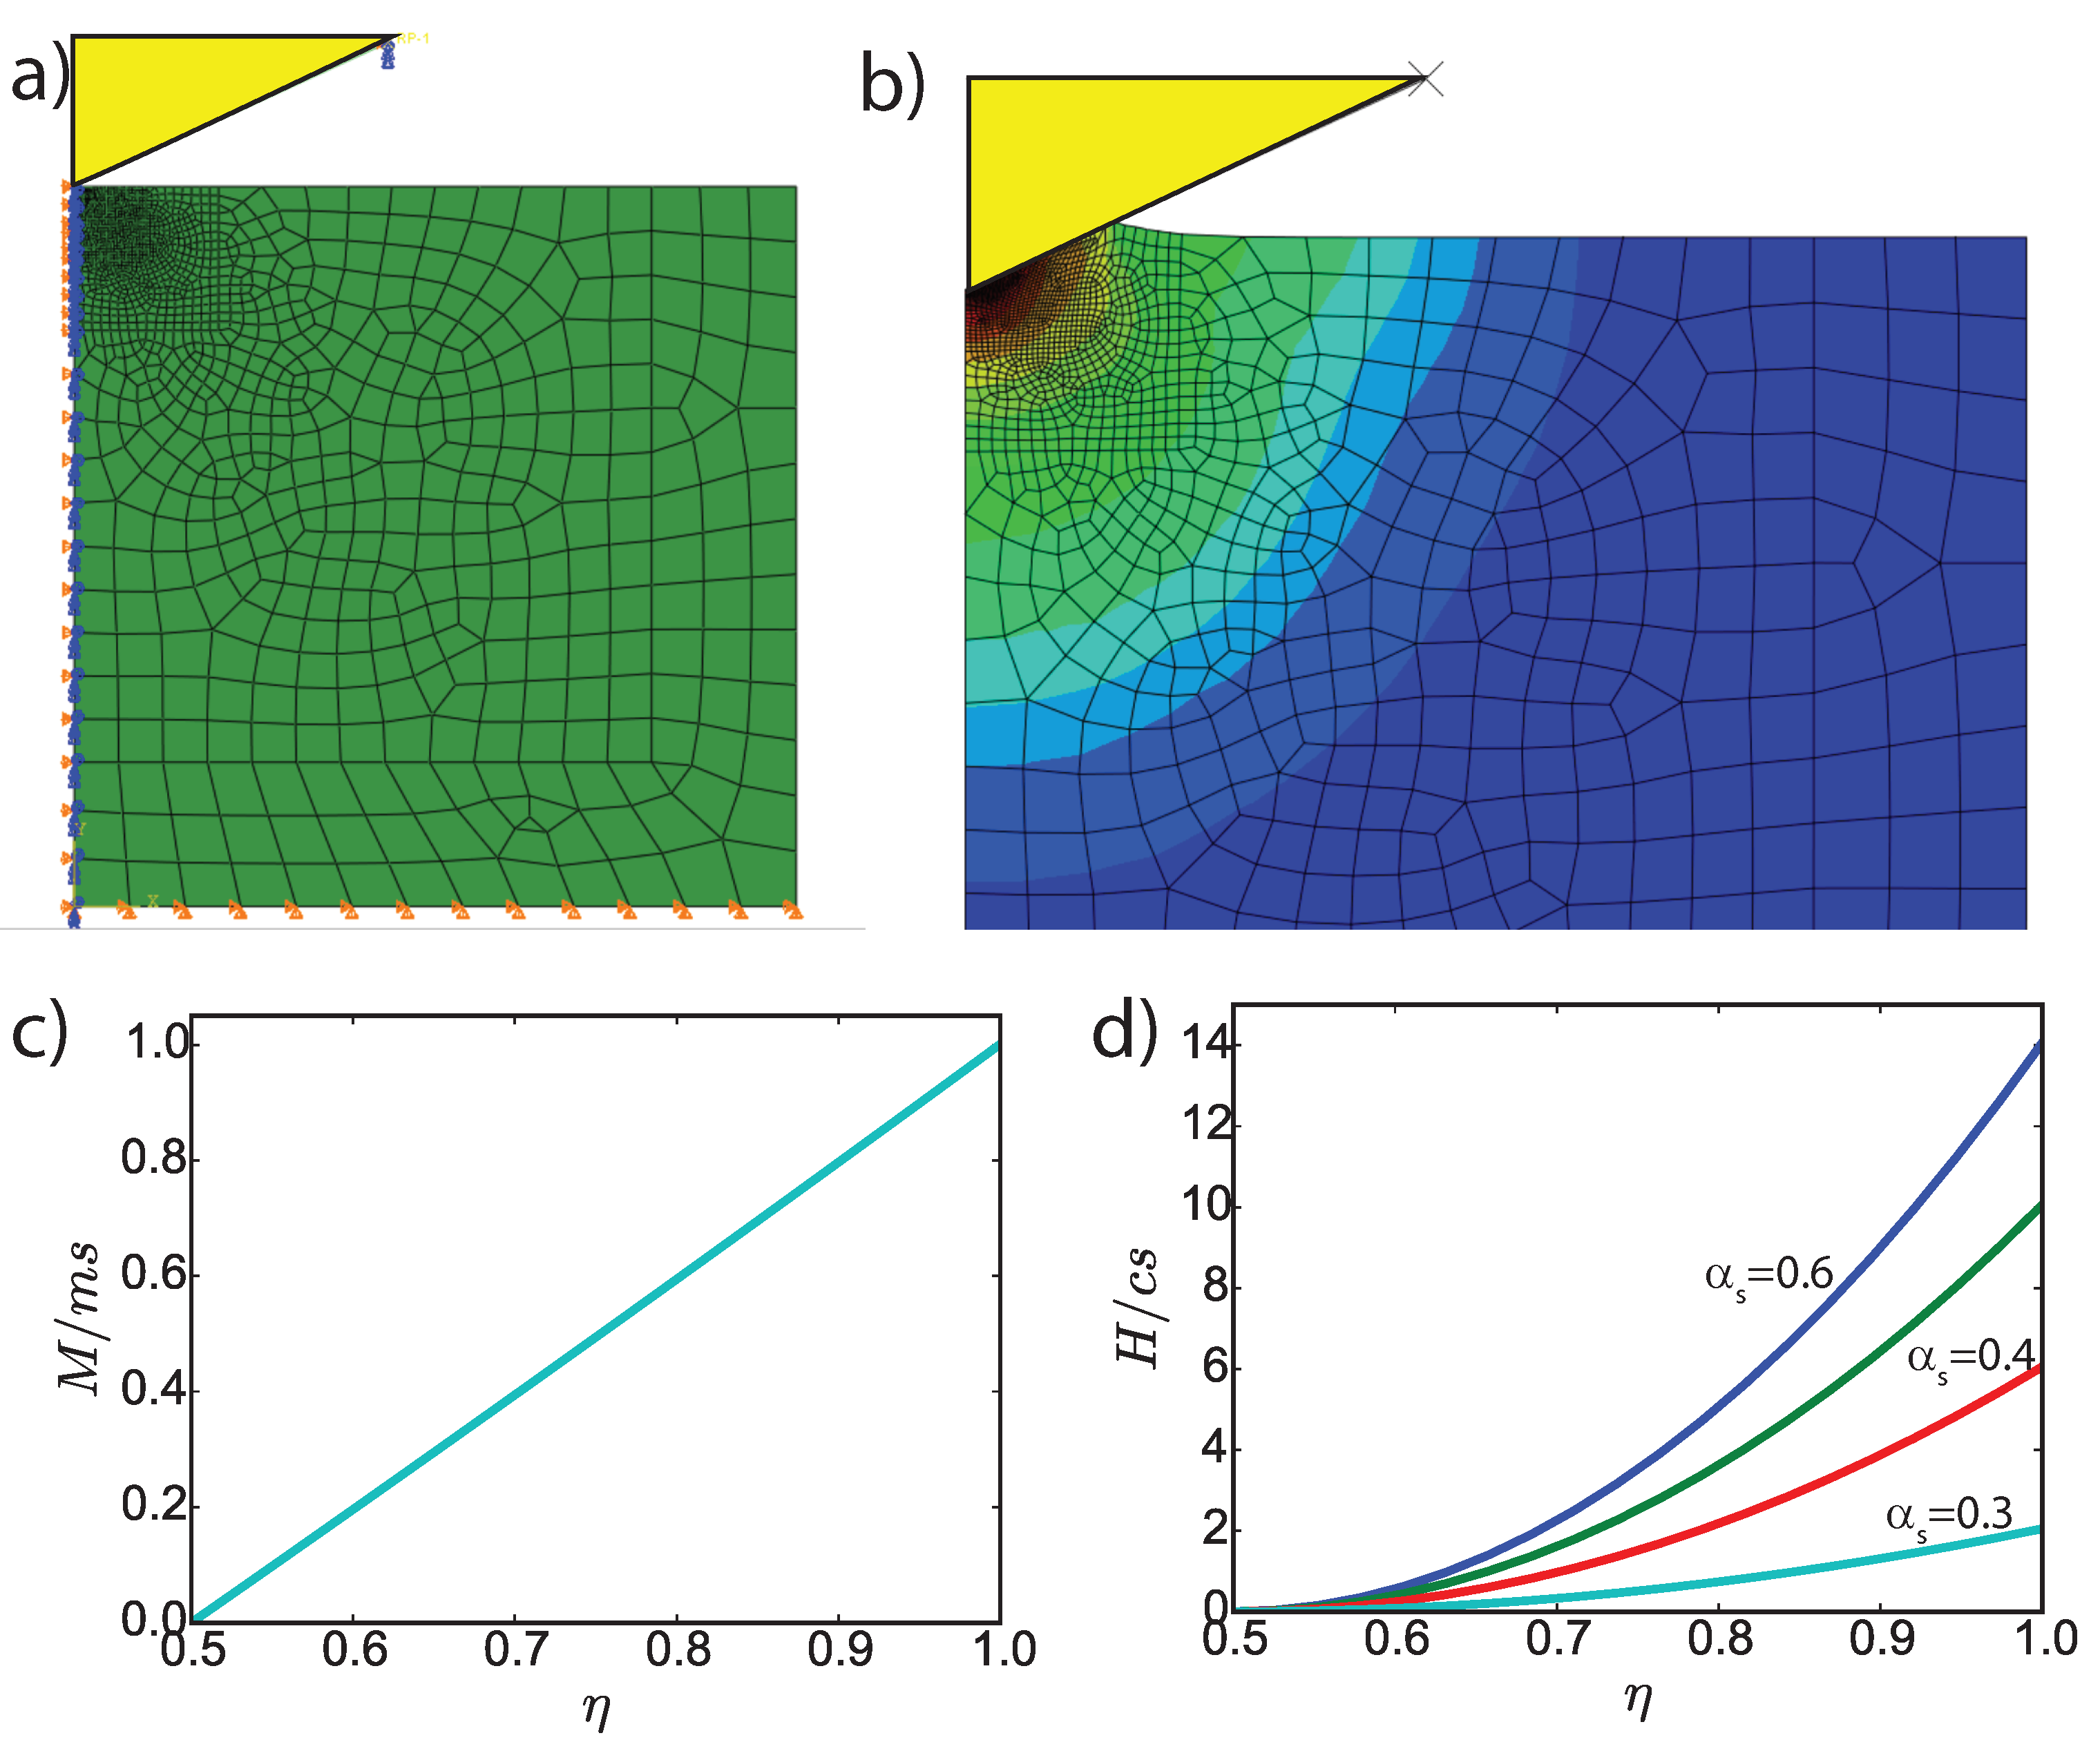
3.3.3. Hardness-Packing Density Relations at Pore Level (I)
4. Results
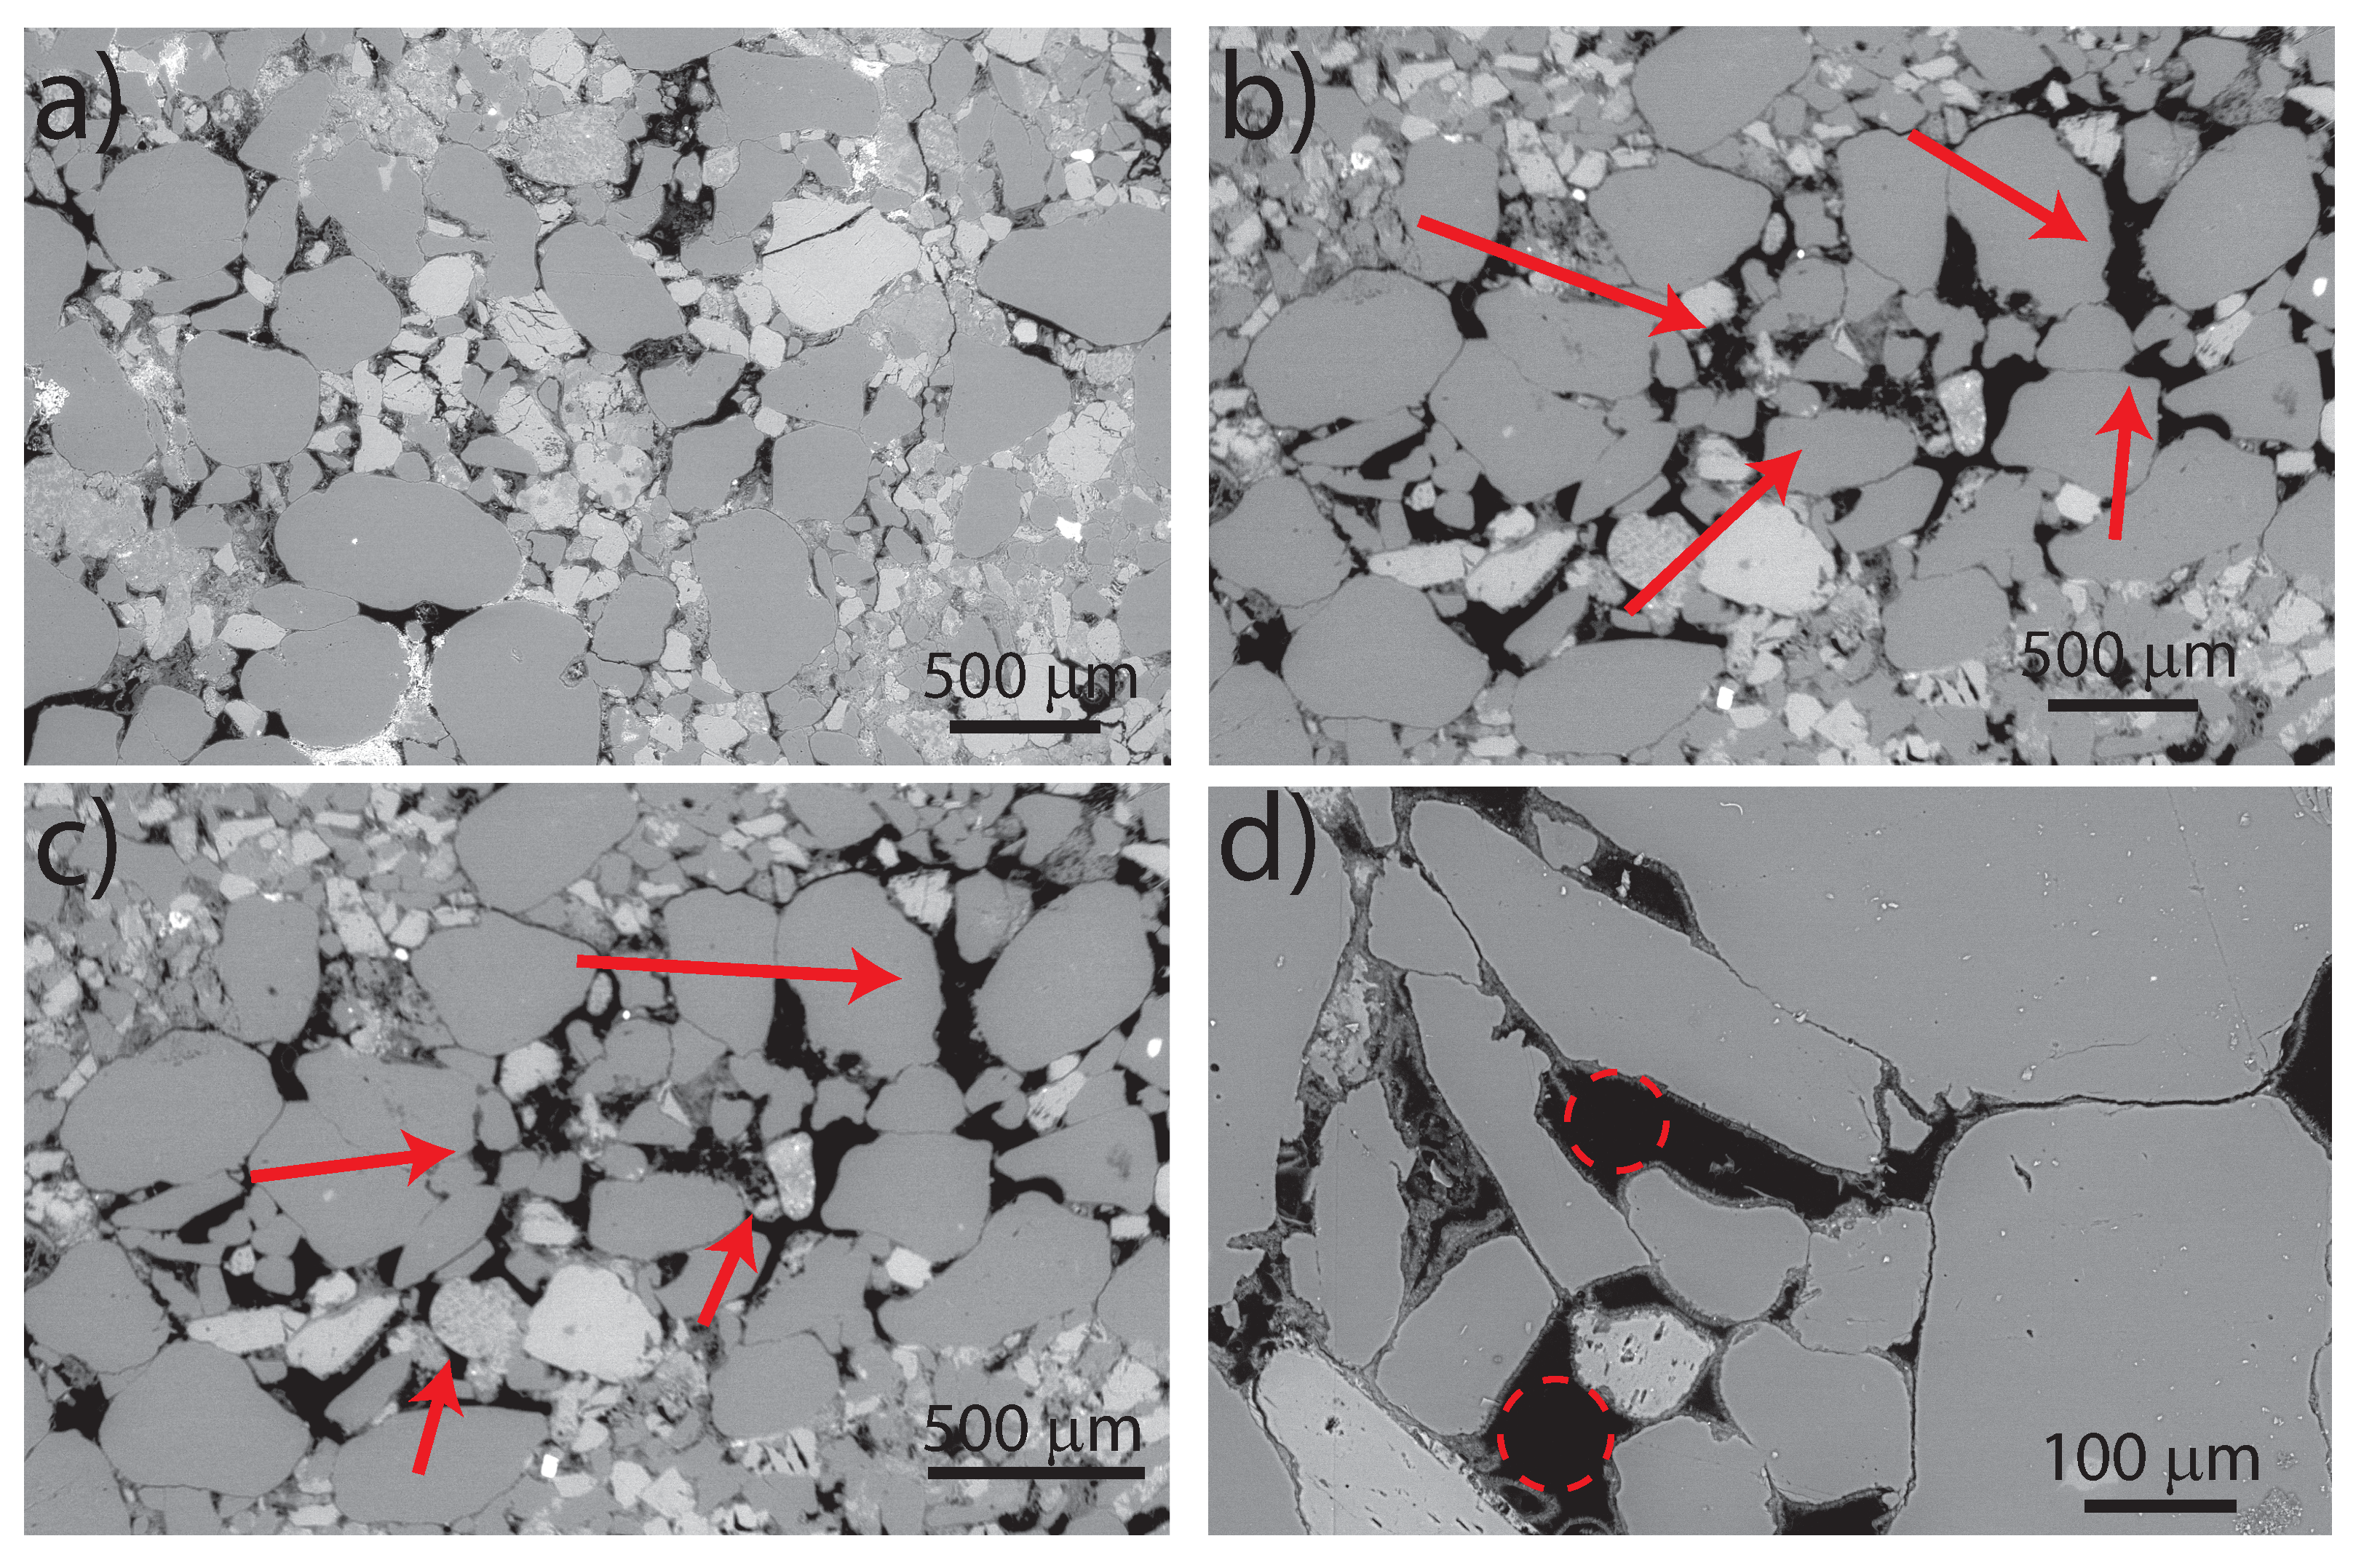
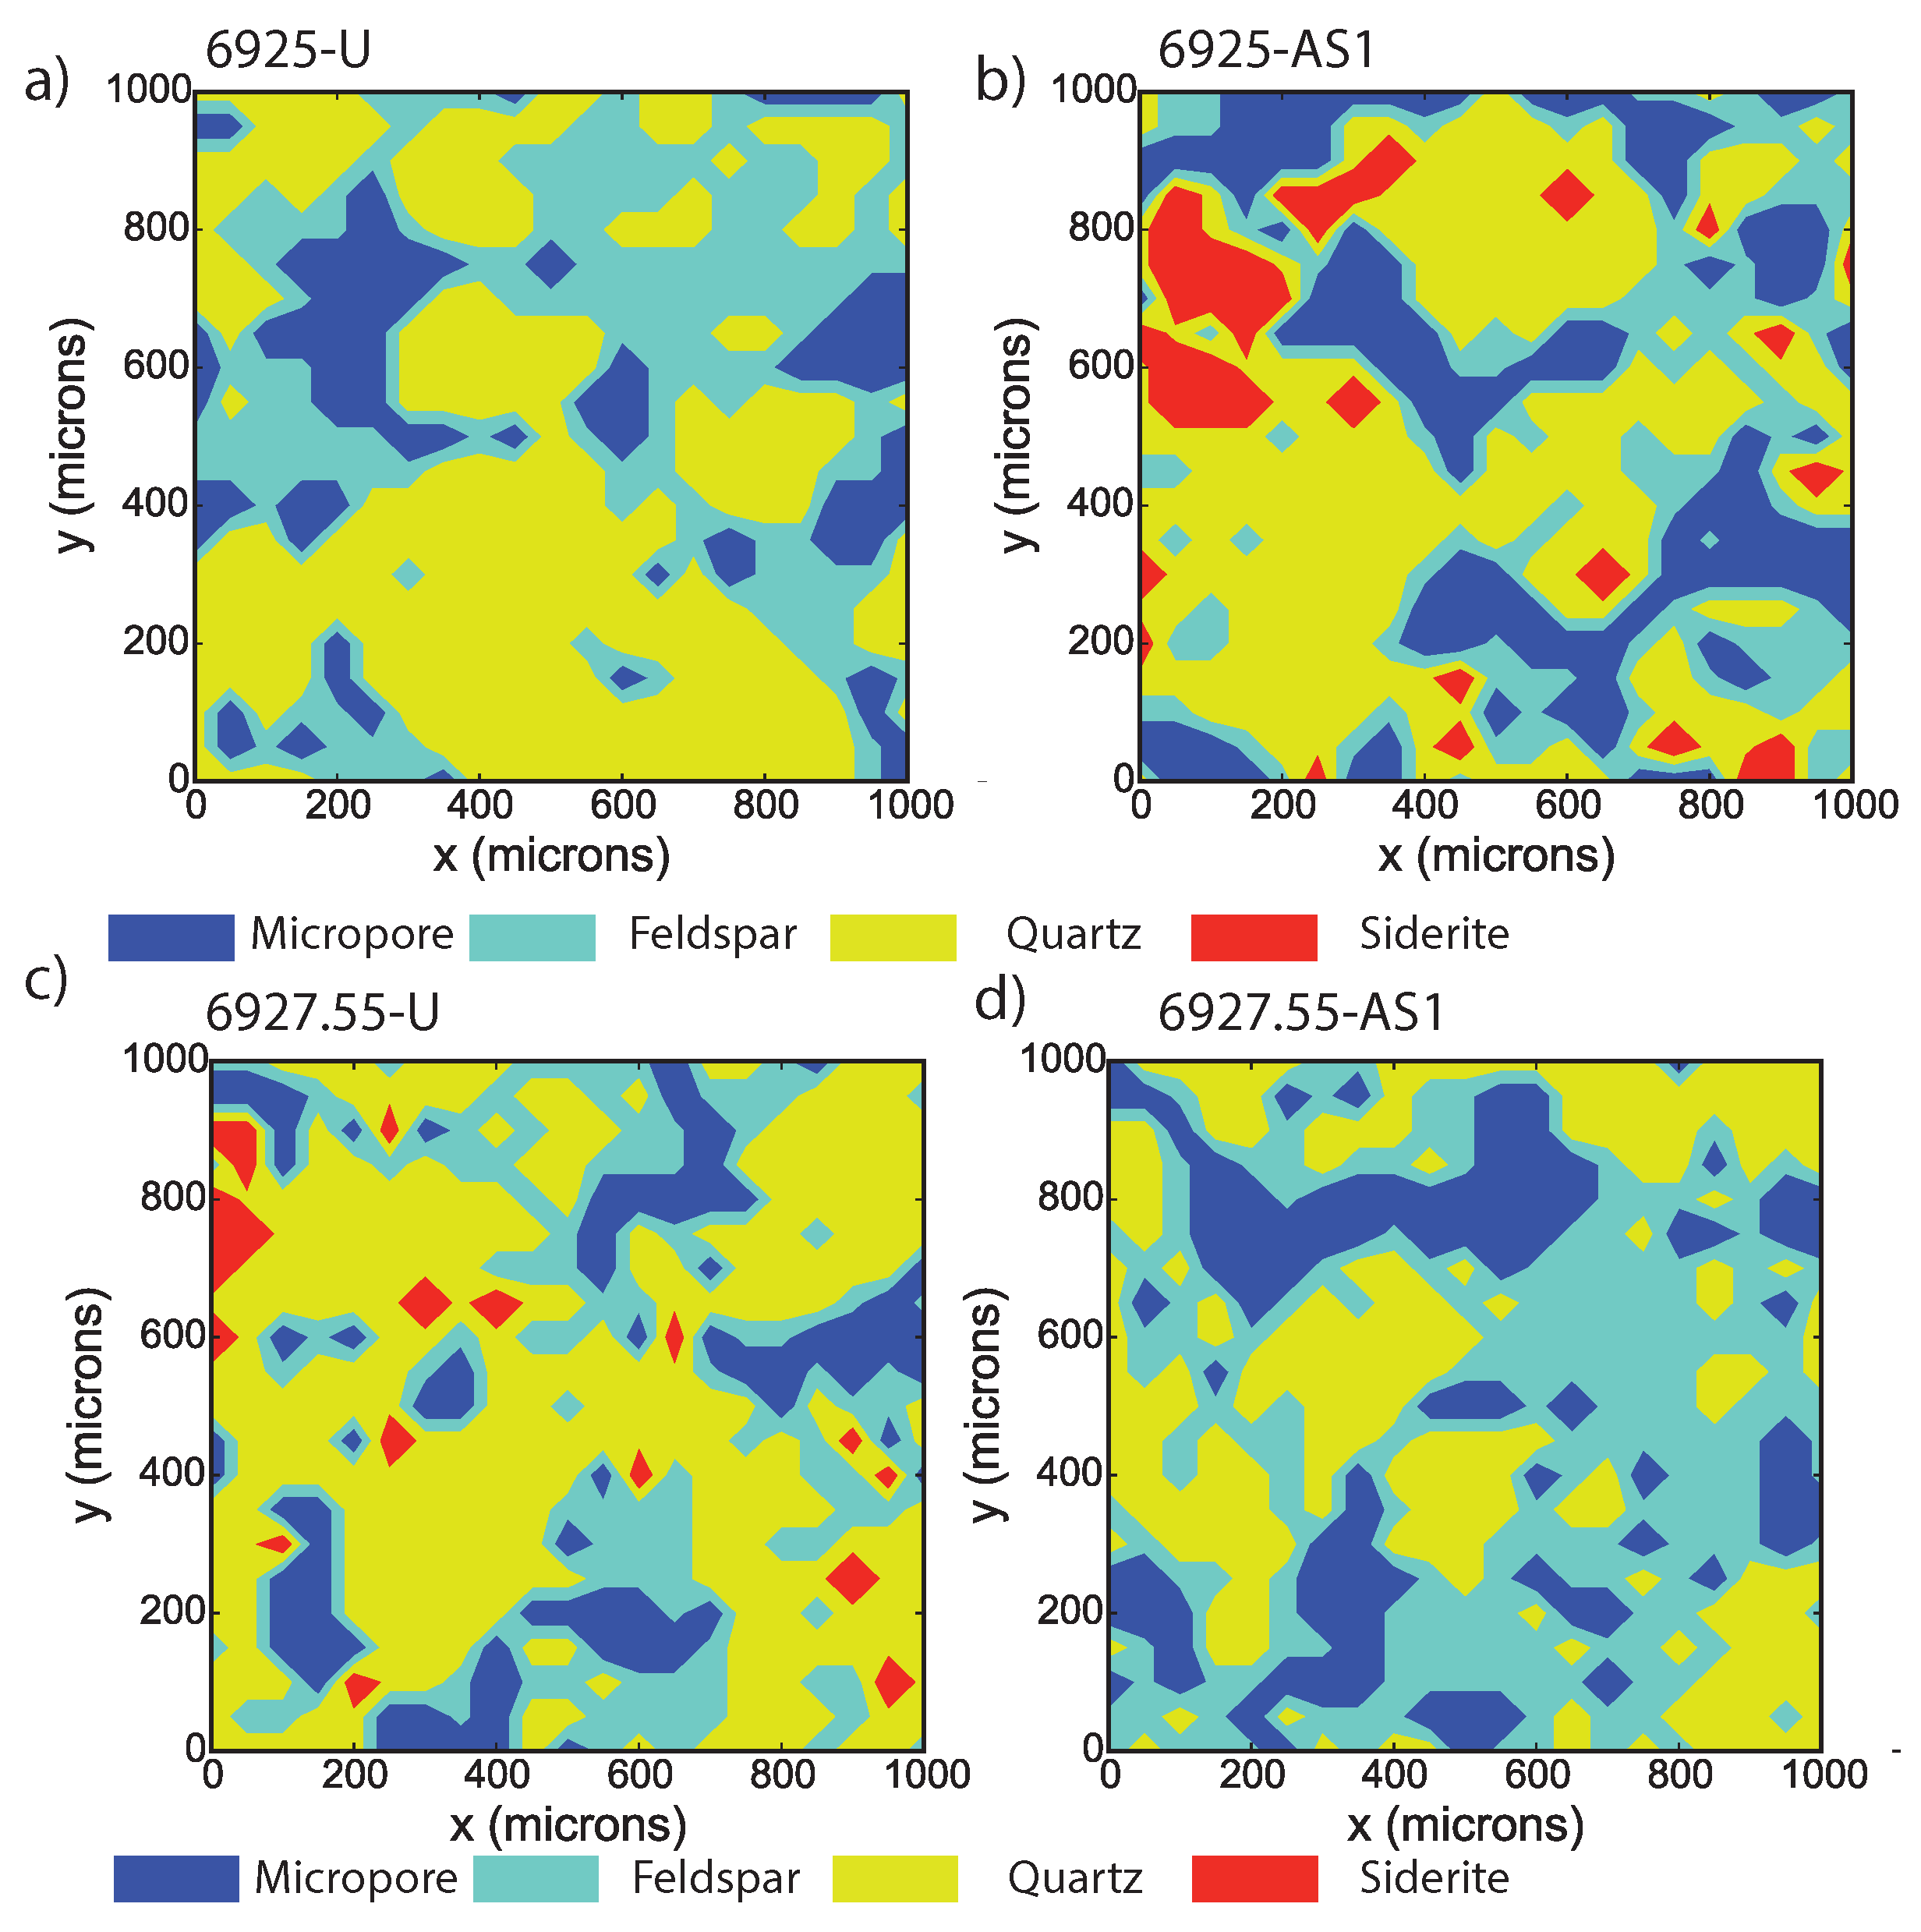
4.1. CO-Induced Micro-Structural Changes at Pore Level (I) from SEM Imaging
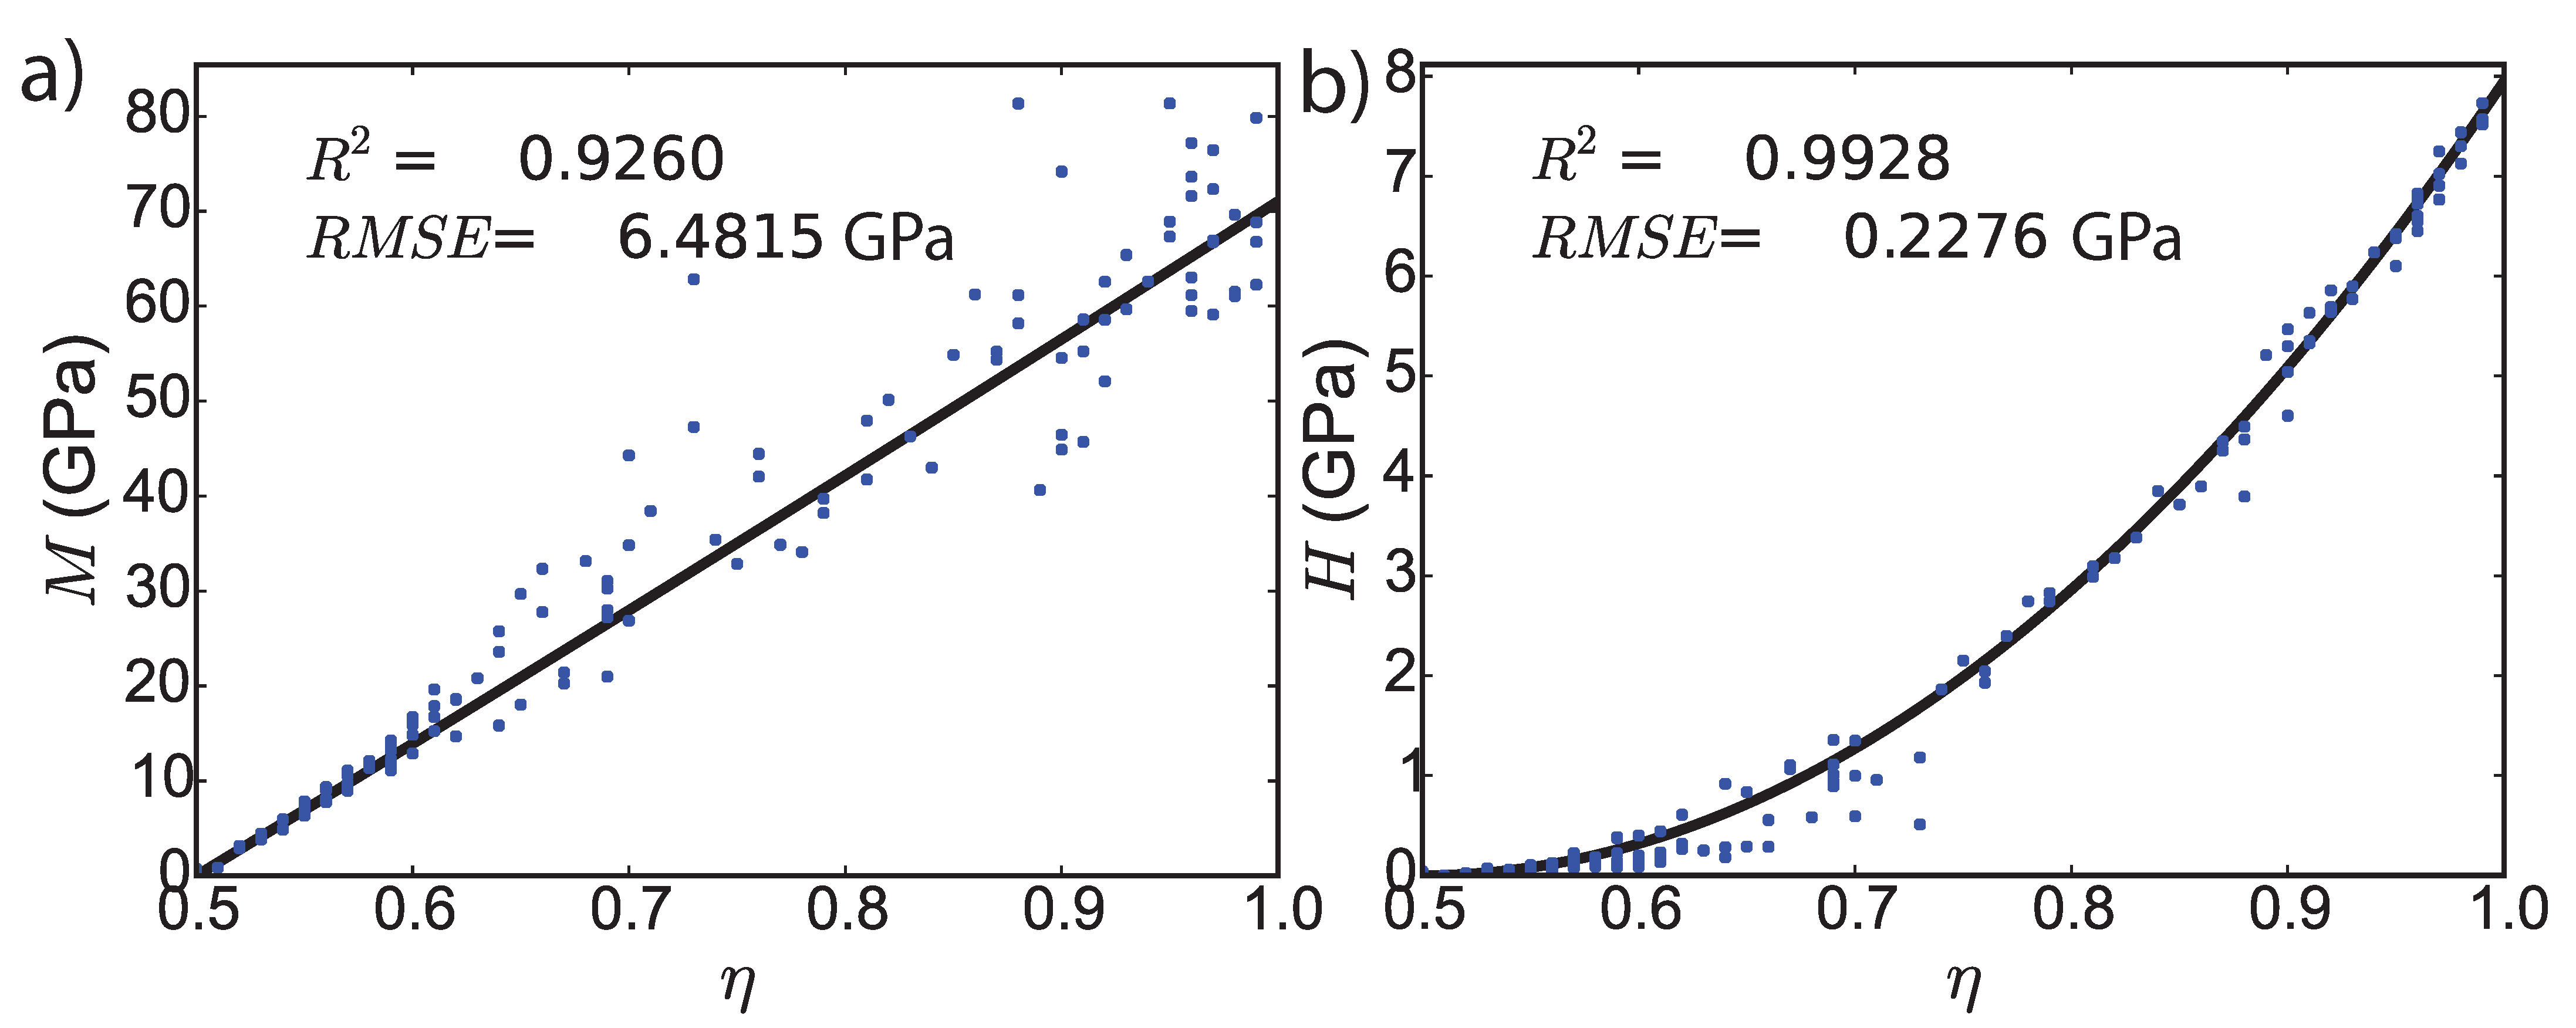
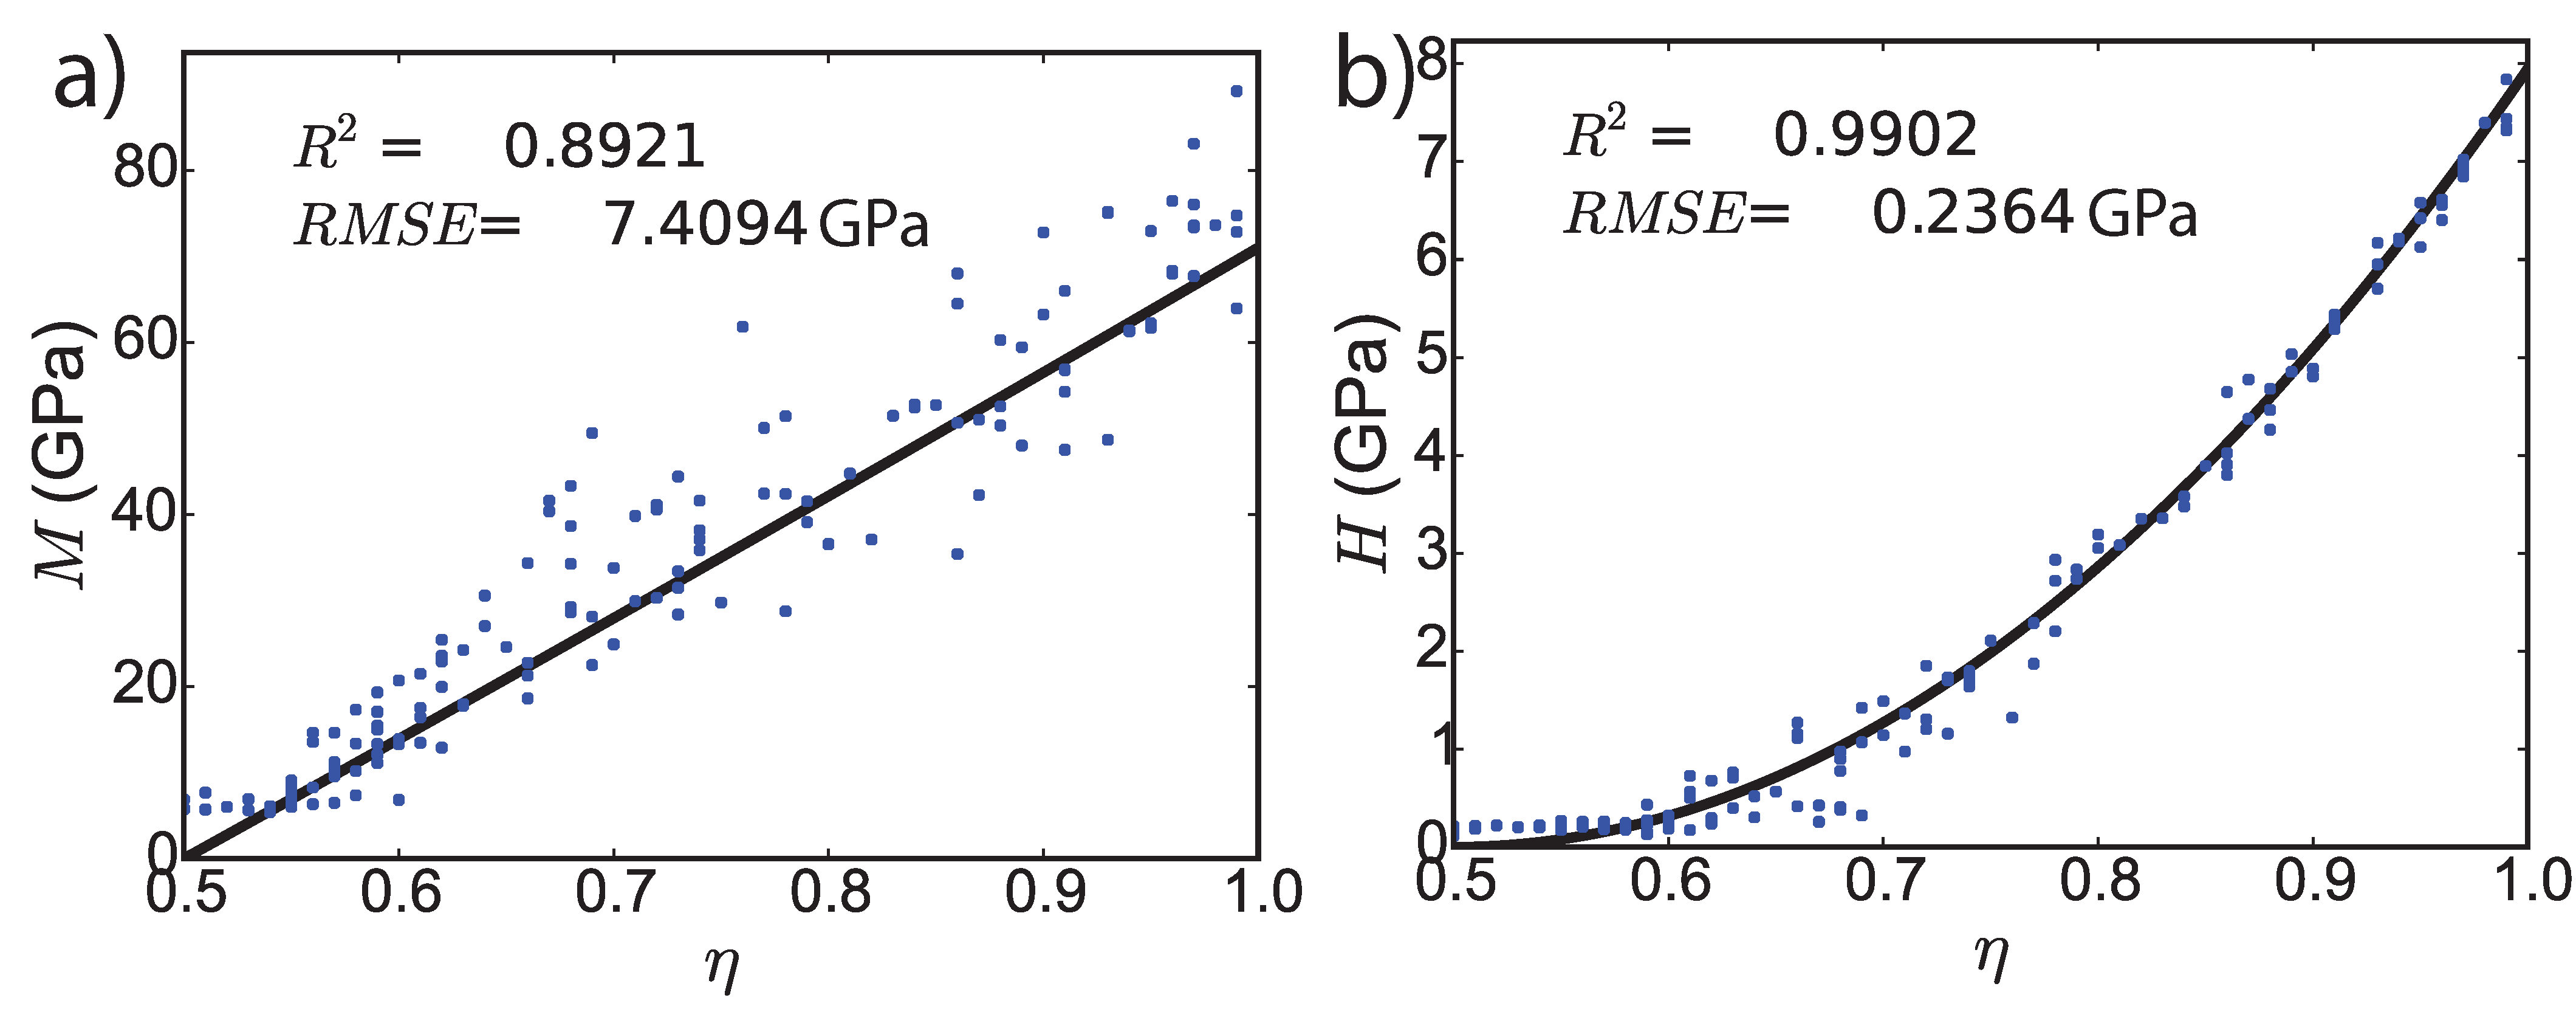
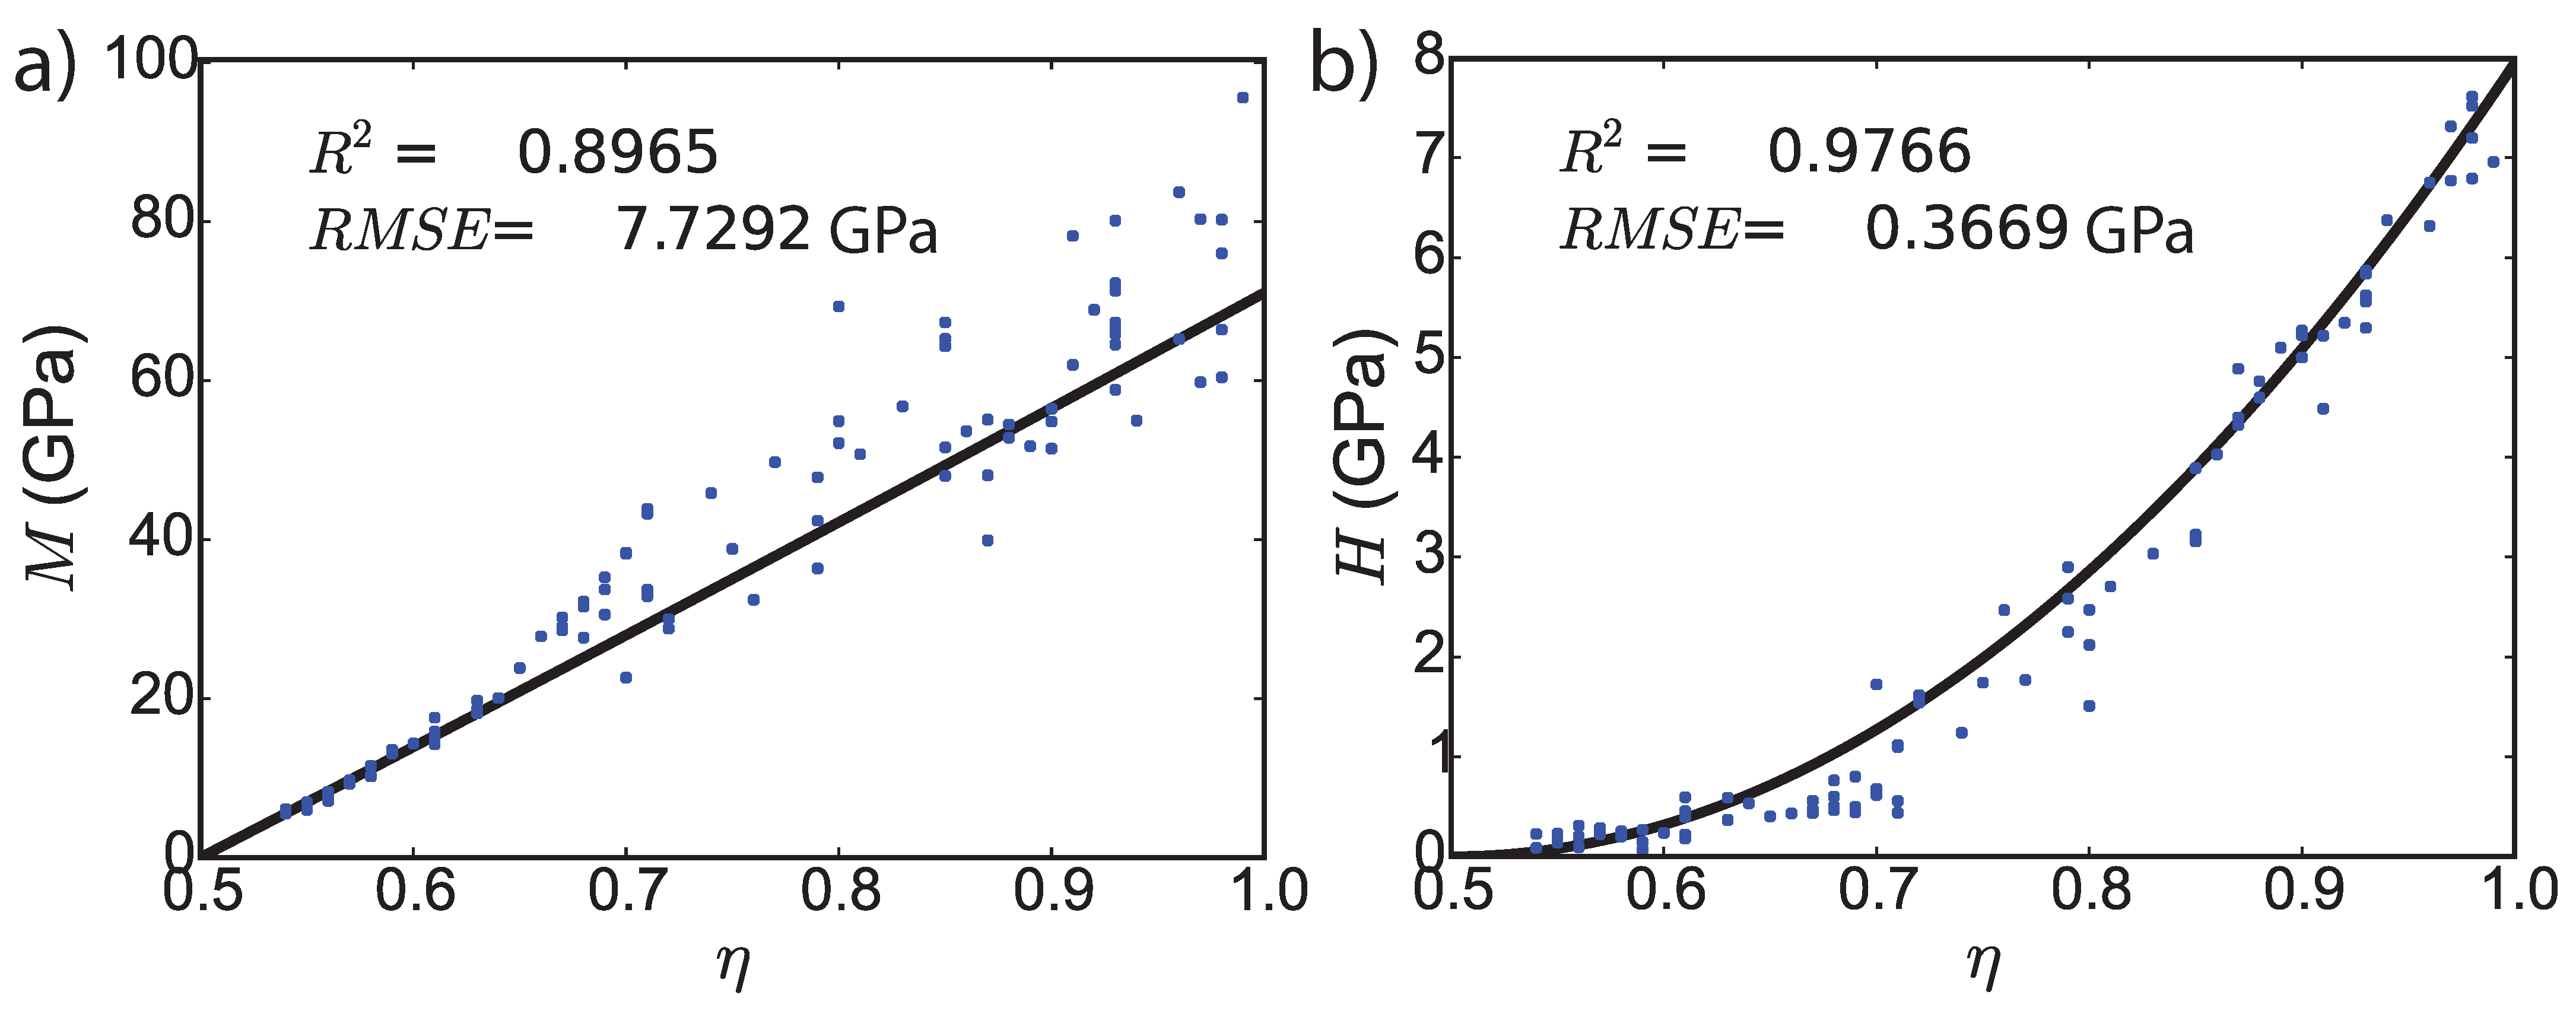
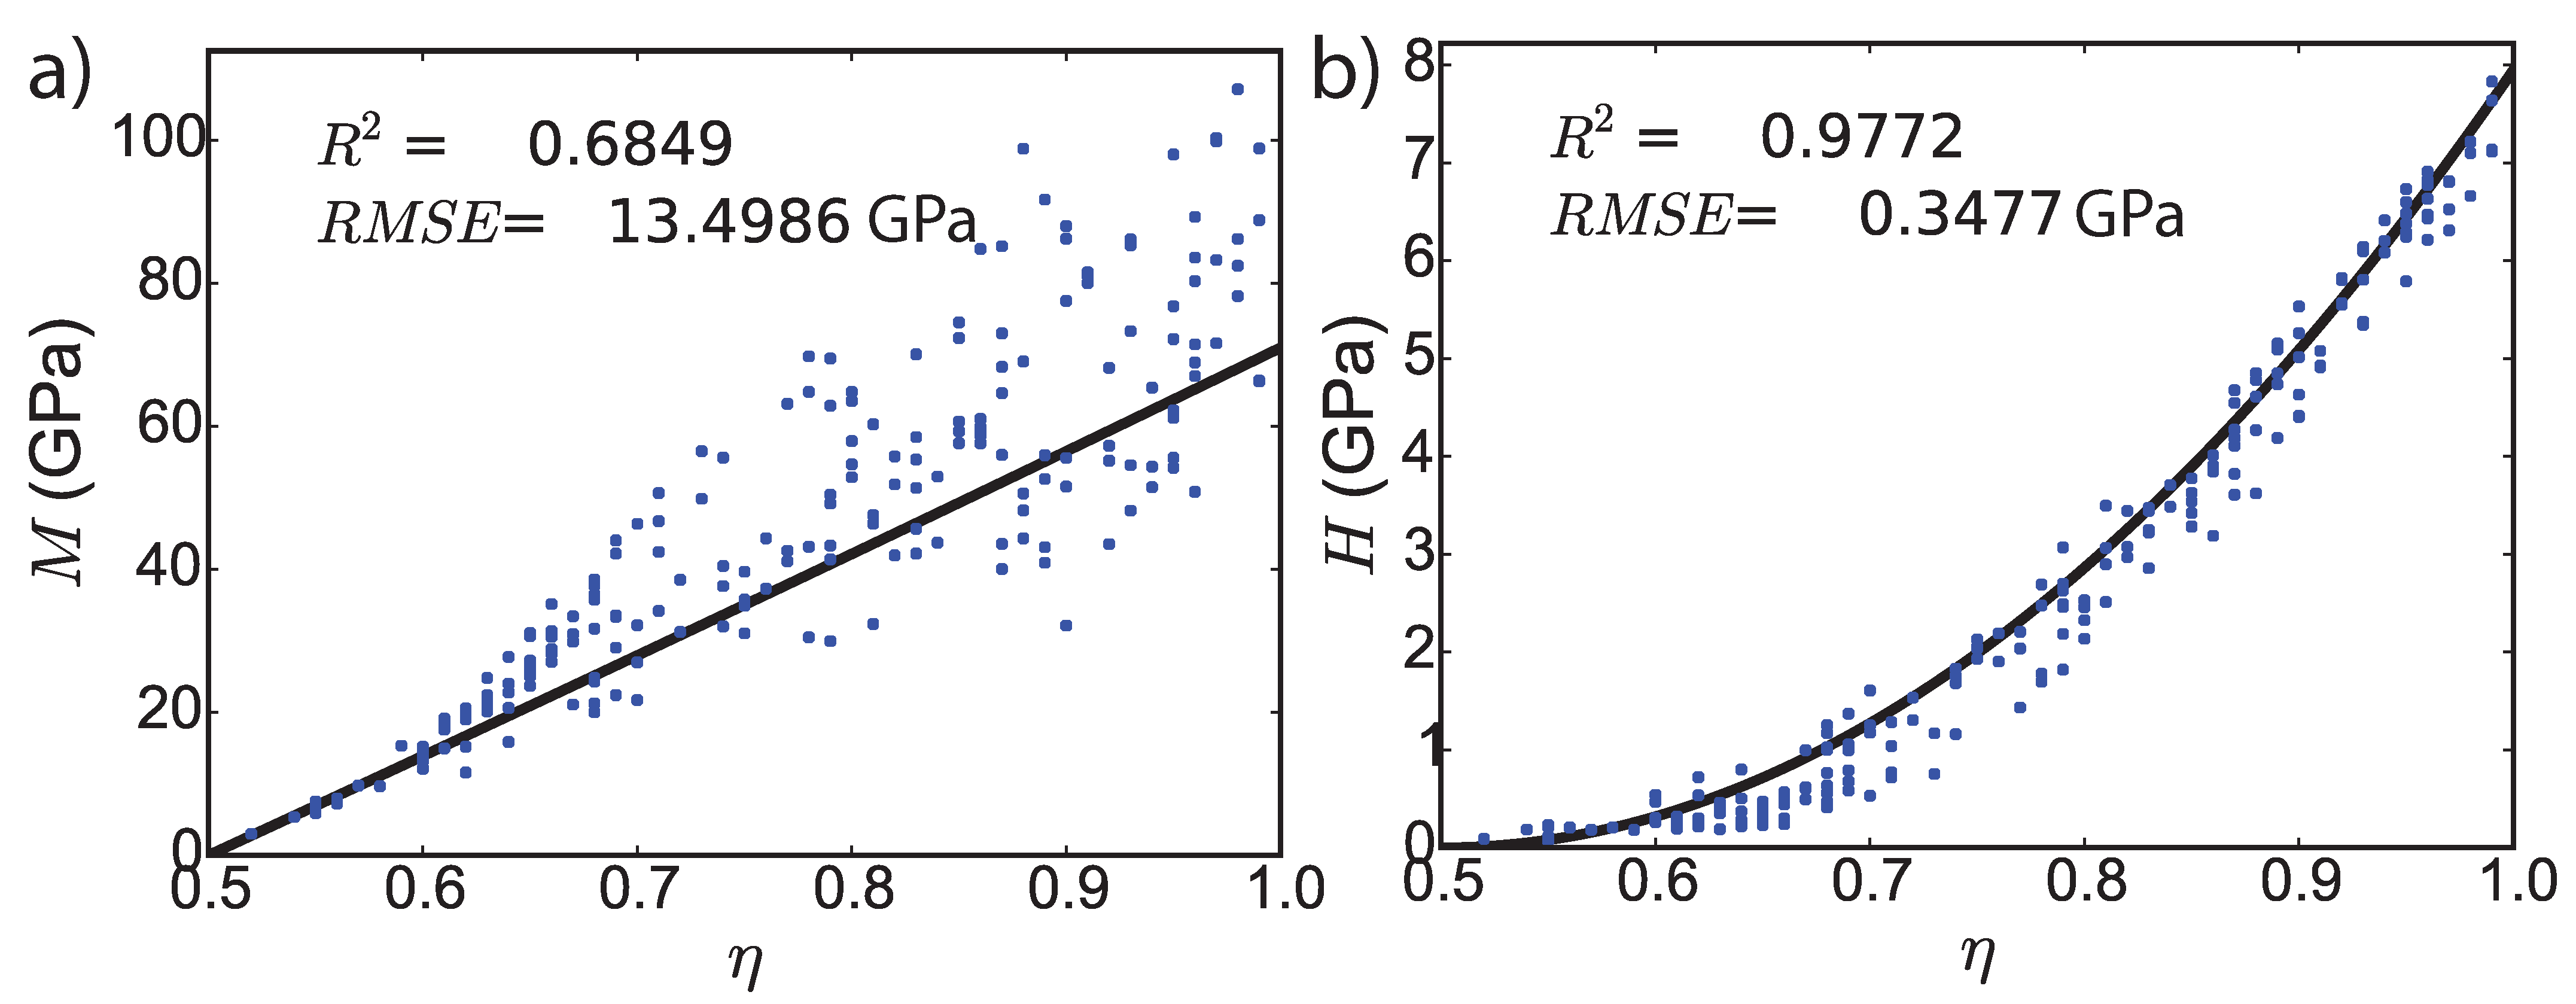
4.2. Calibration and Validation of the Theoretical Model
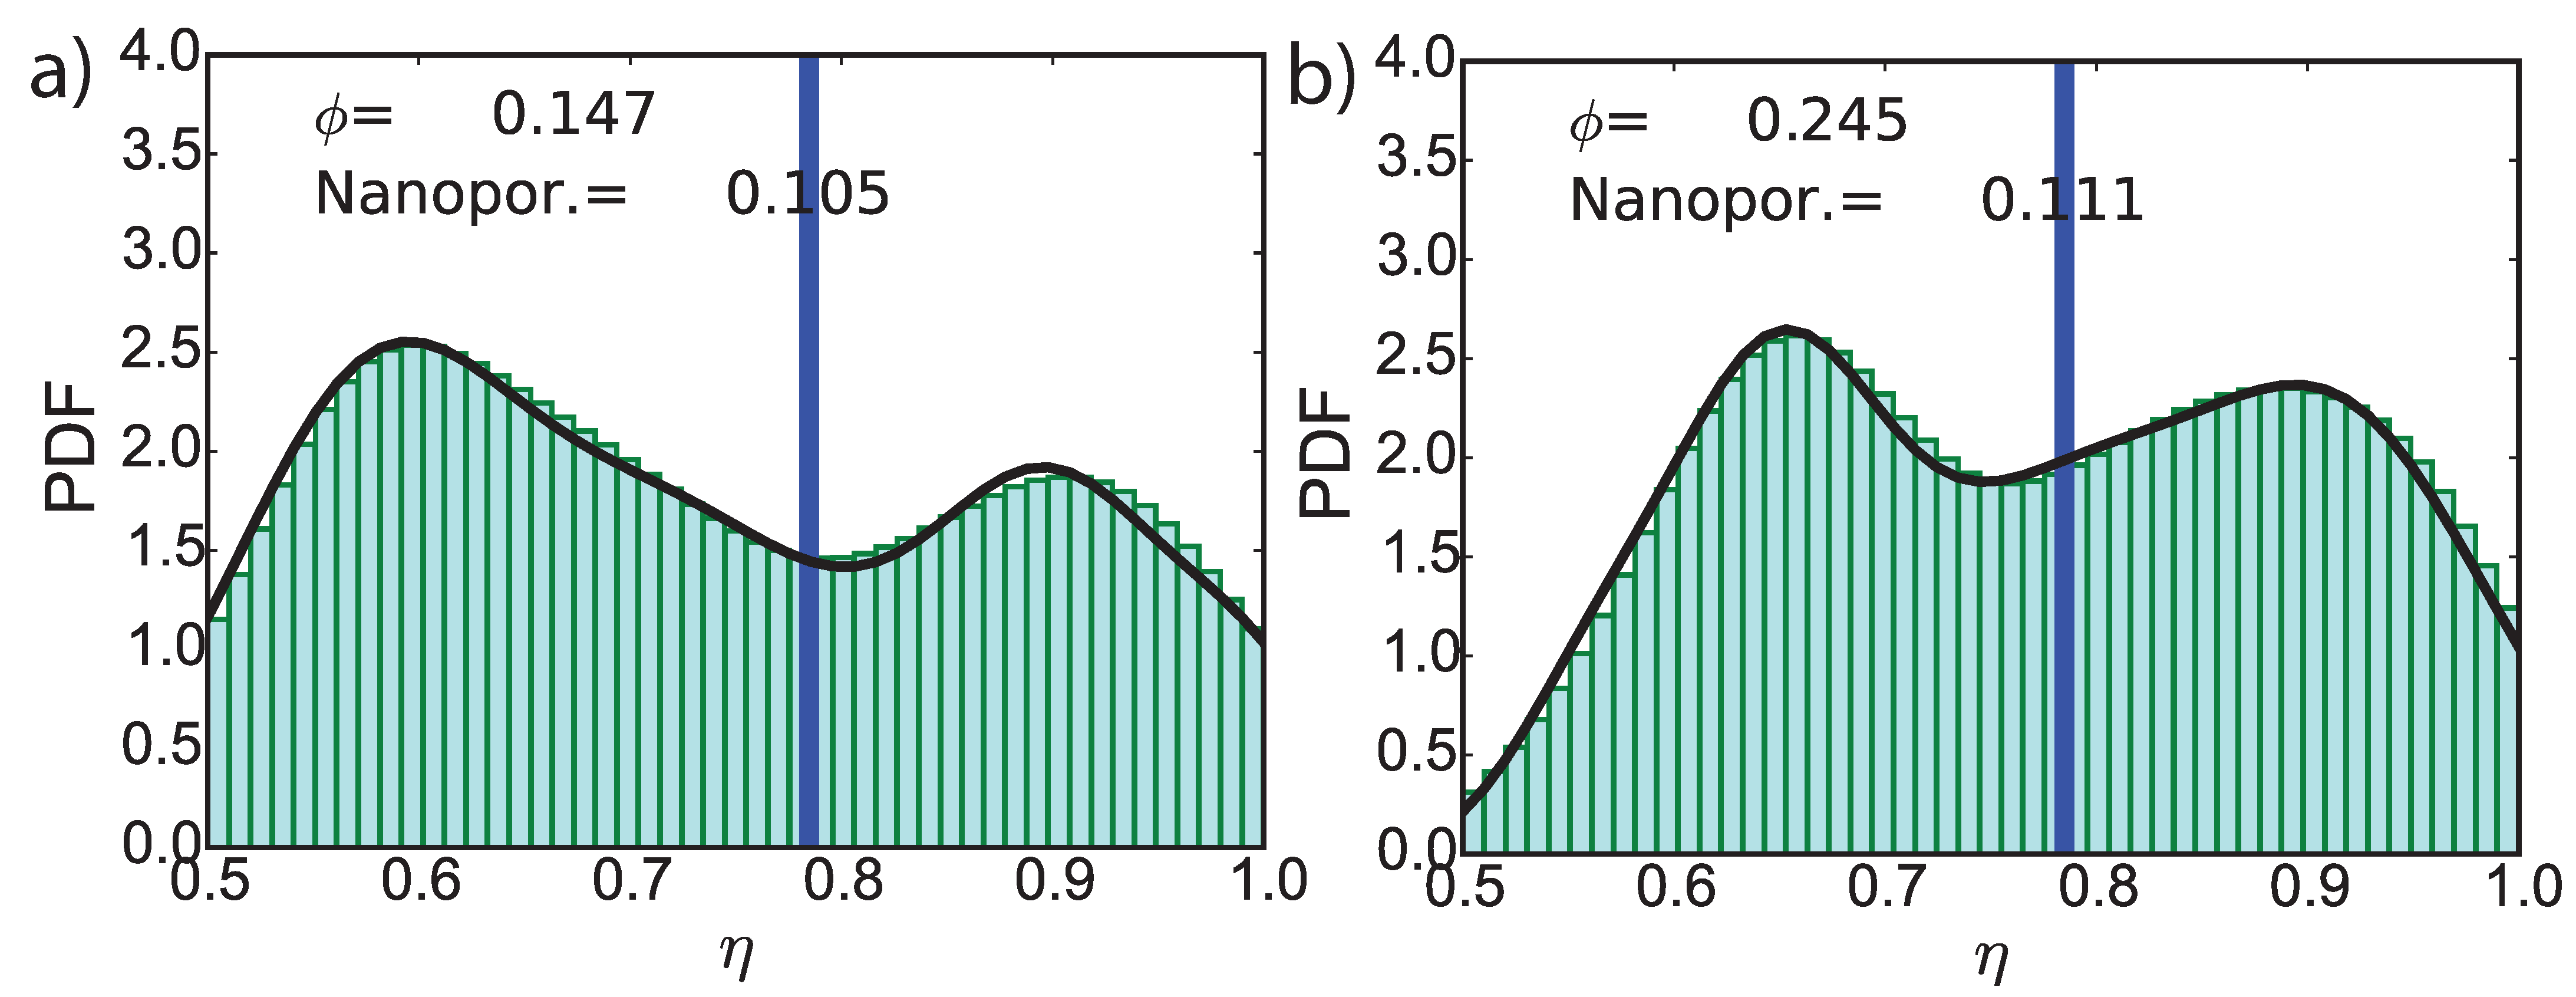
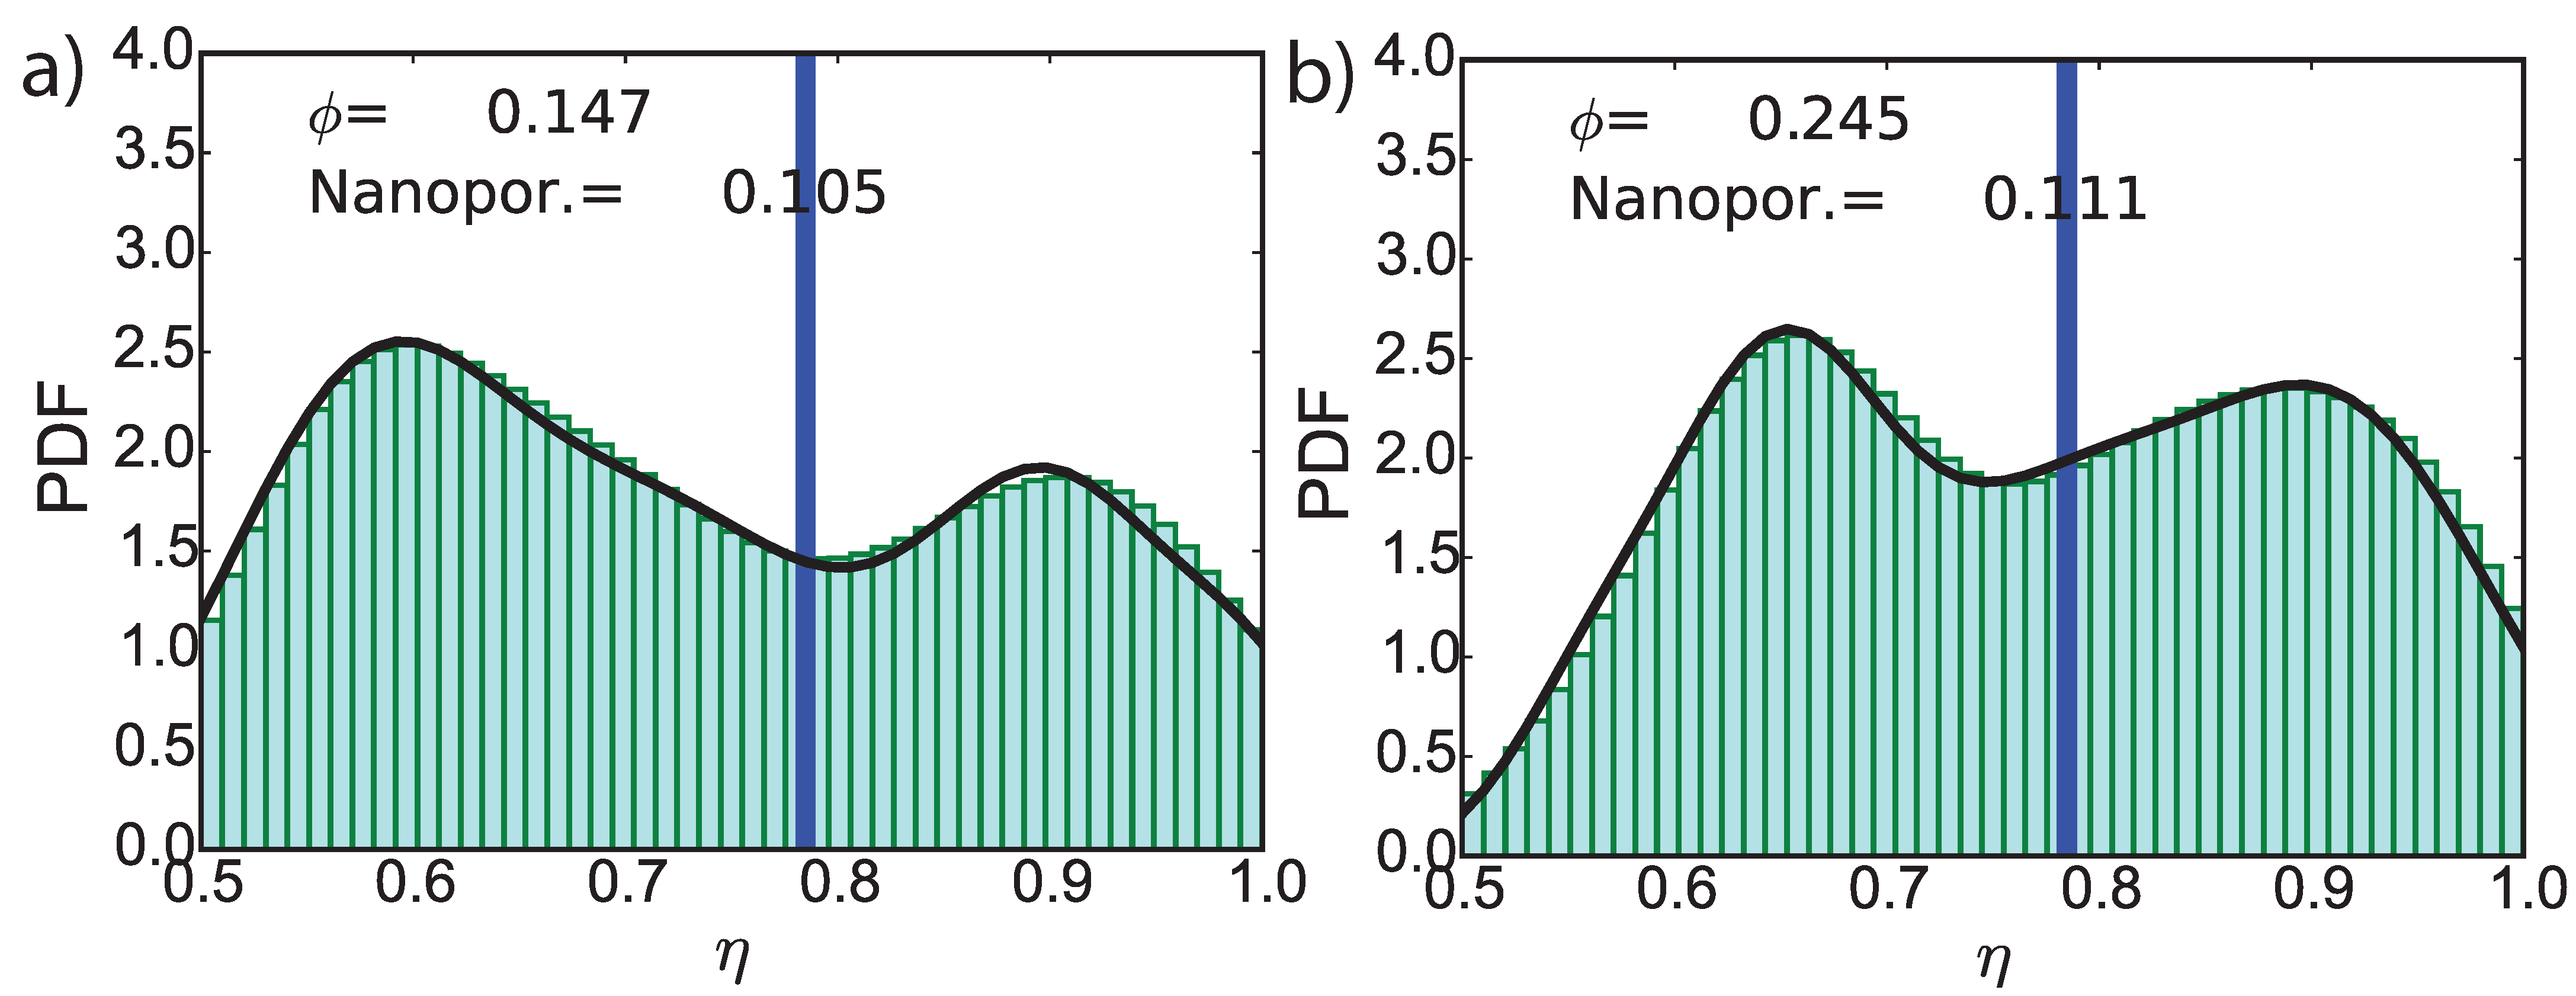
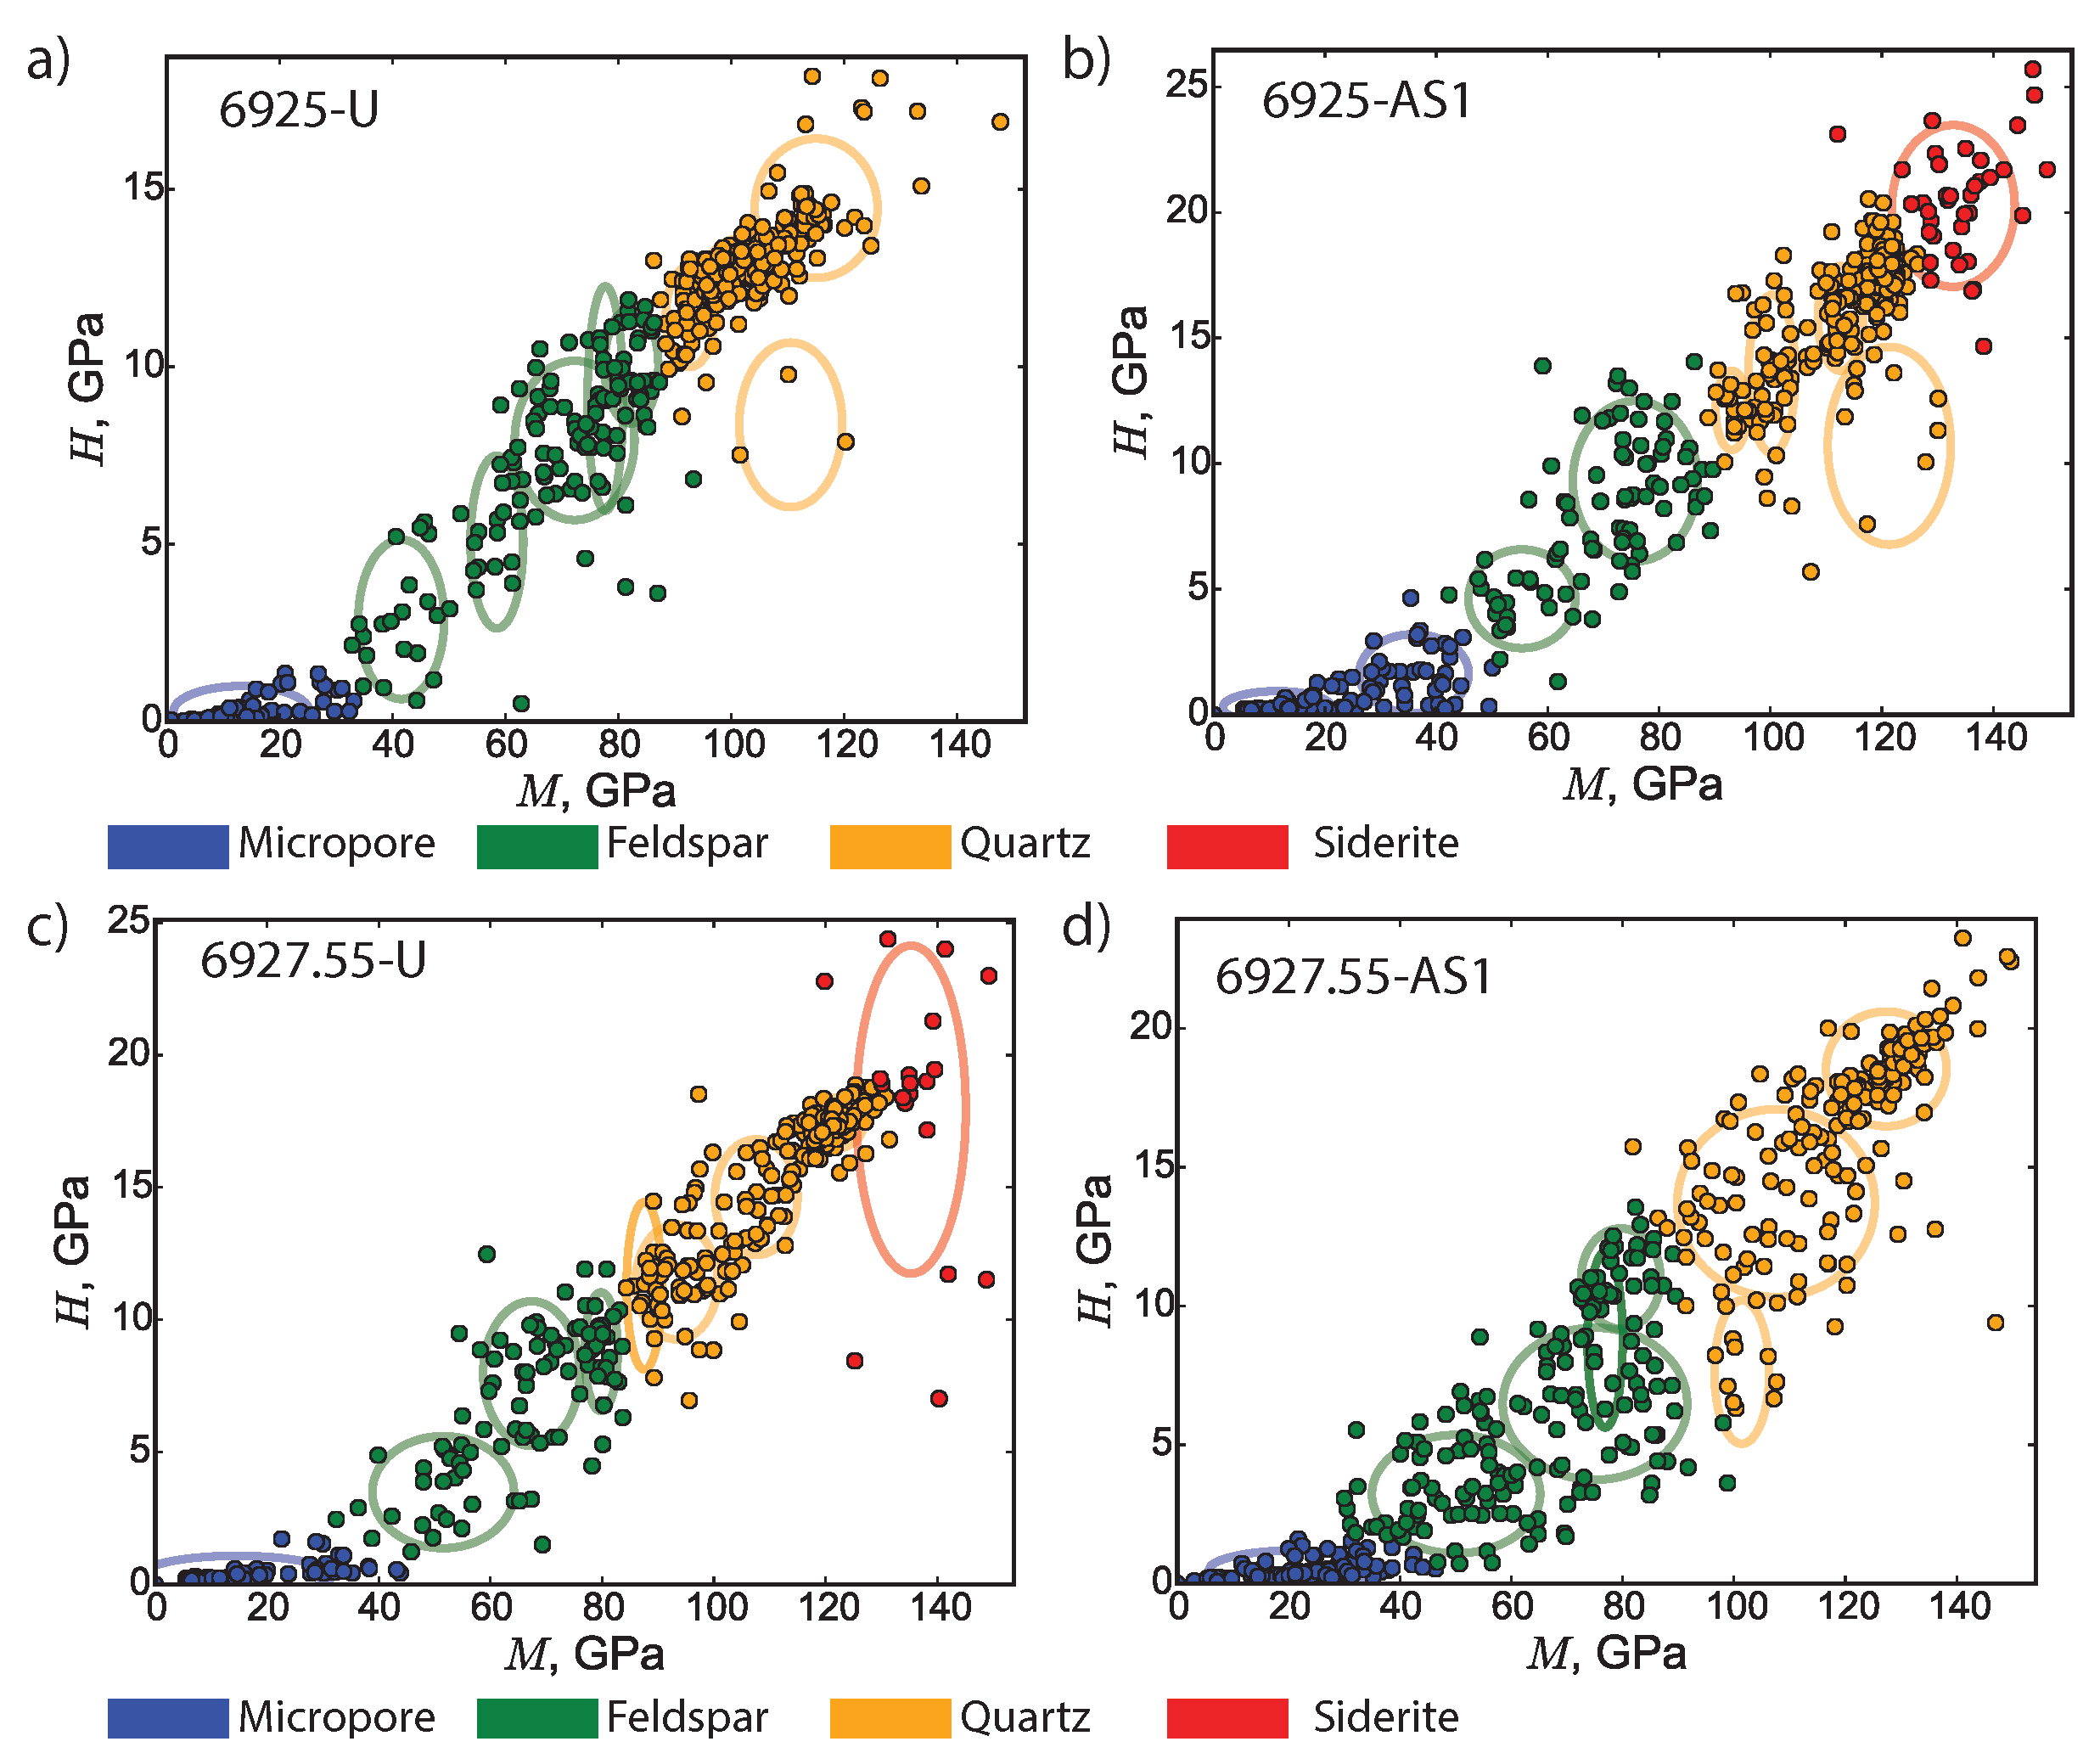
4.3. CO-Induced Micro-Structural Changes at Pore Level (I) Using Nanoindentation Testing Integrated with Micromechanical Modeling
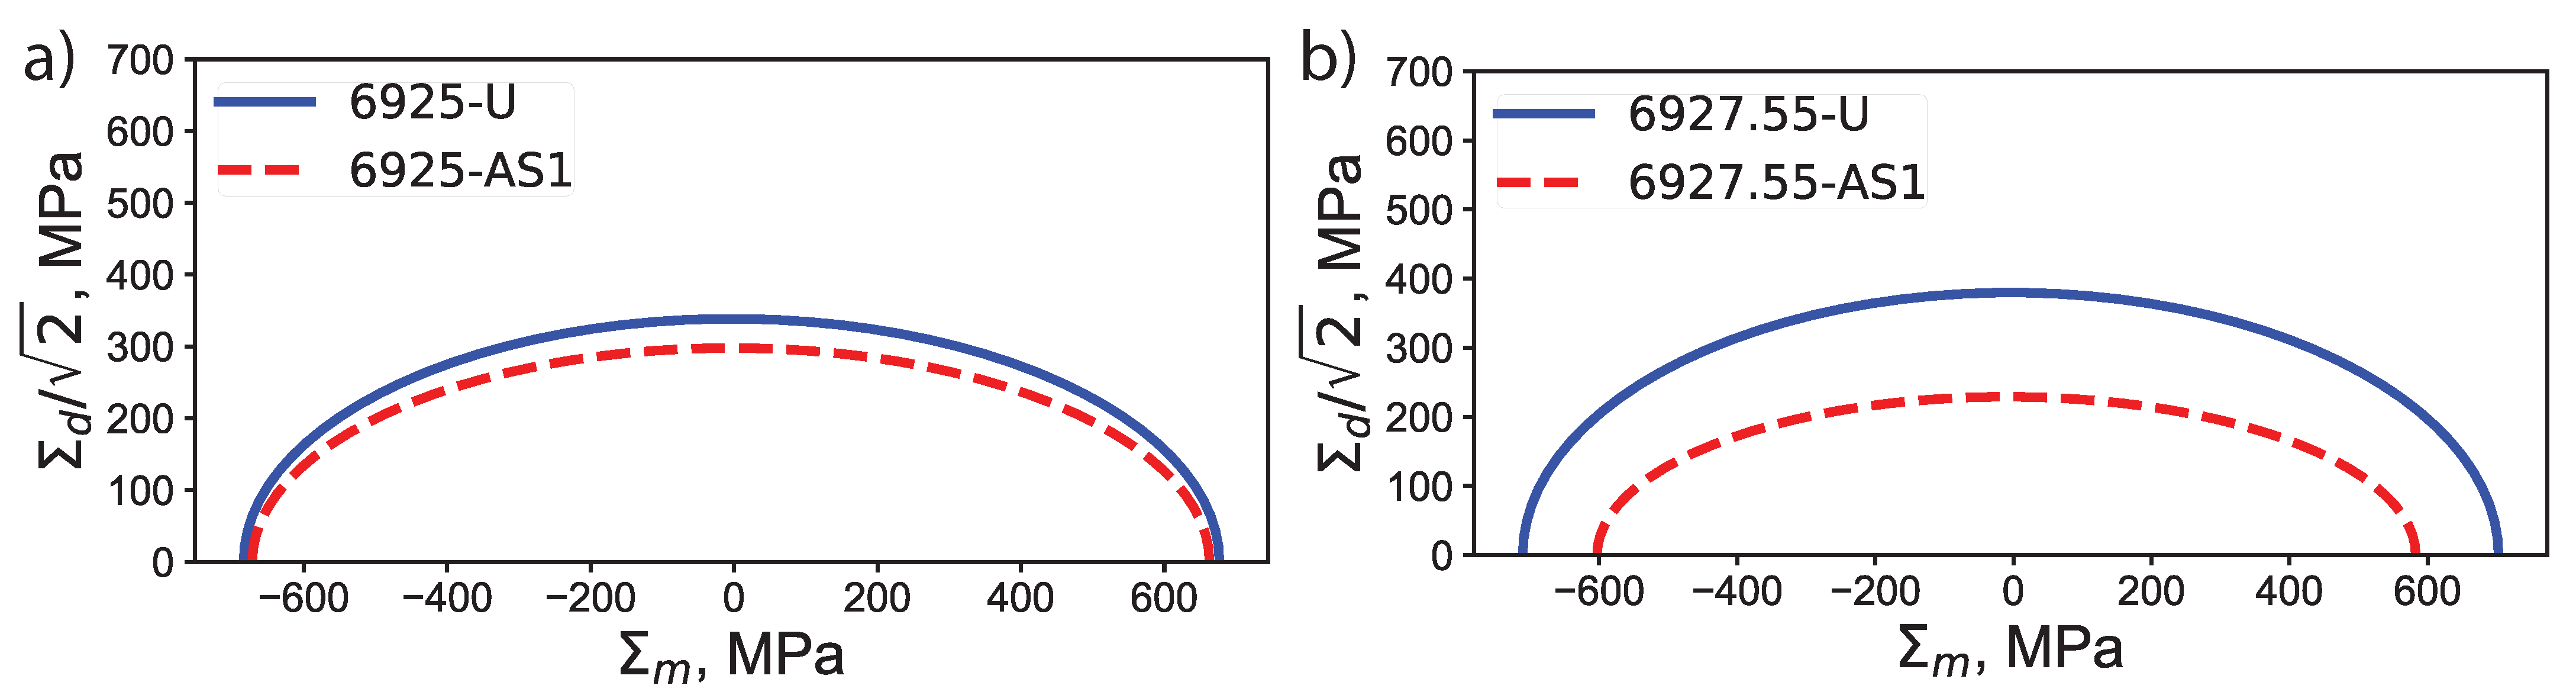
4.4. Changes in Cohesive-Frictional Response at the Core Level (II)
5. Discussion
5.1. Origins of Mechanical Strength in Mt. Simon Sandstone
5.2. CO-Induced Geochemical Reactions
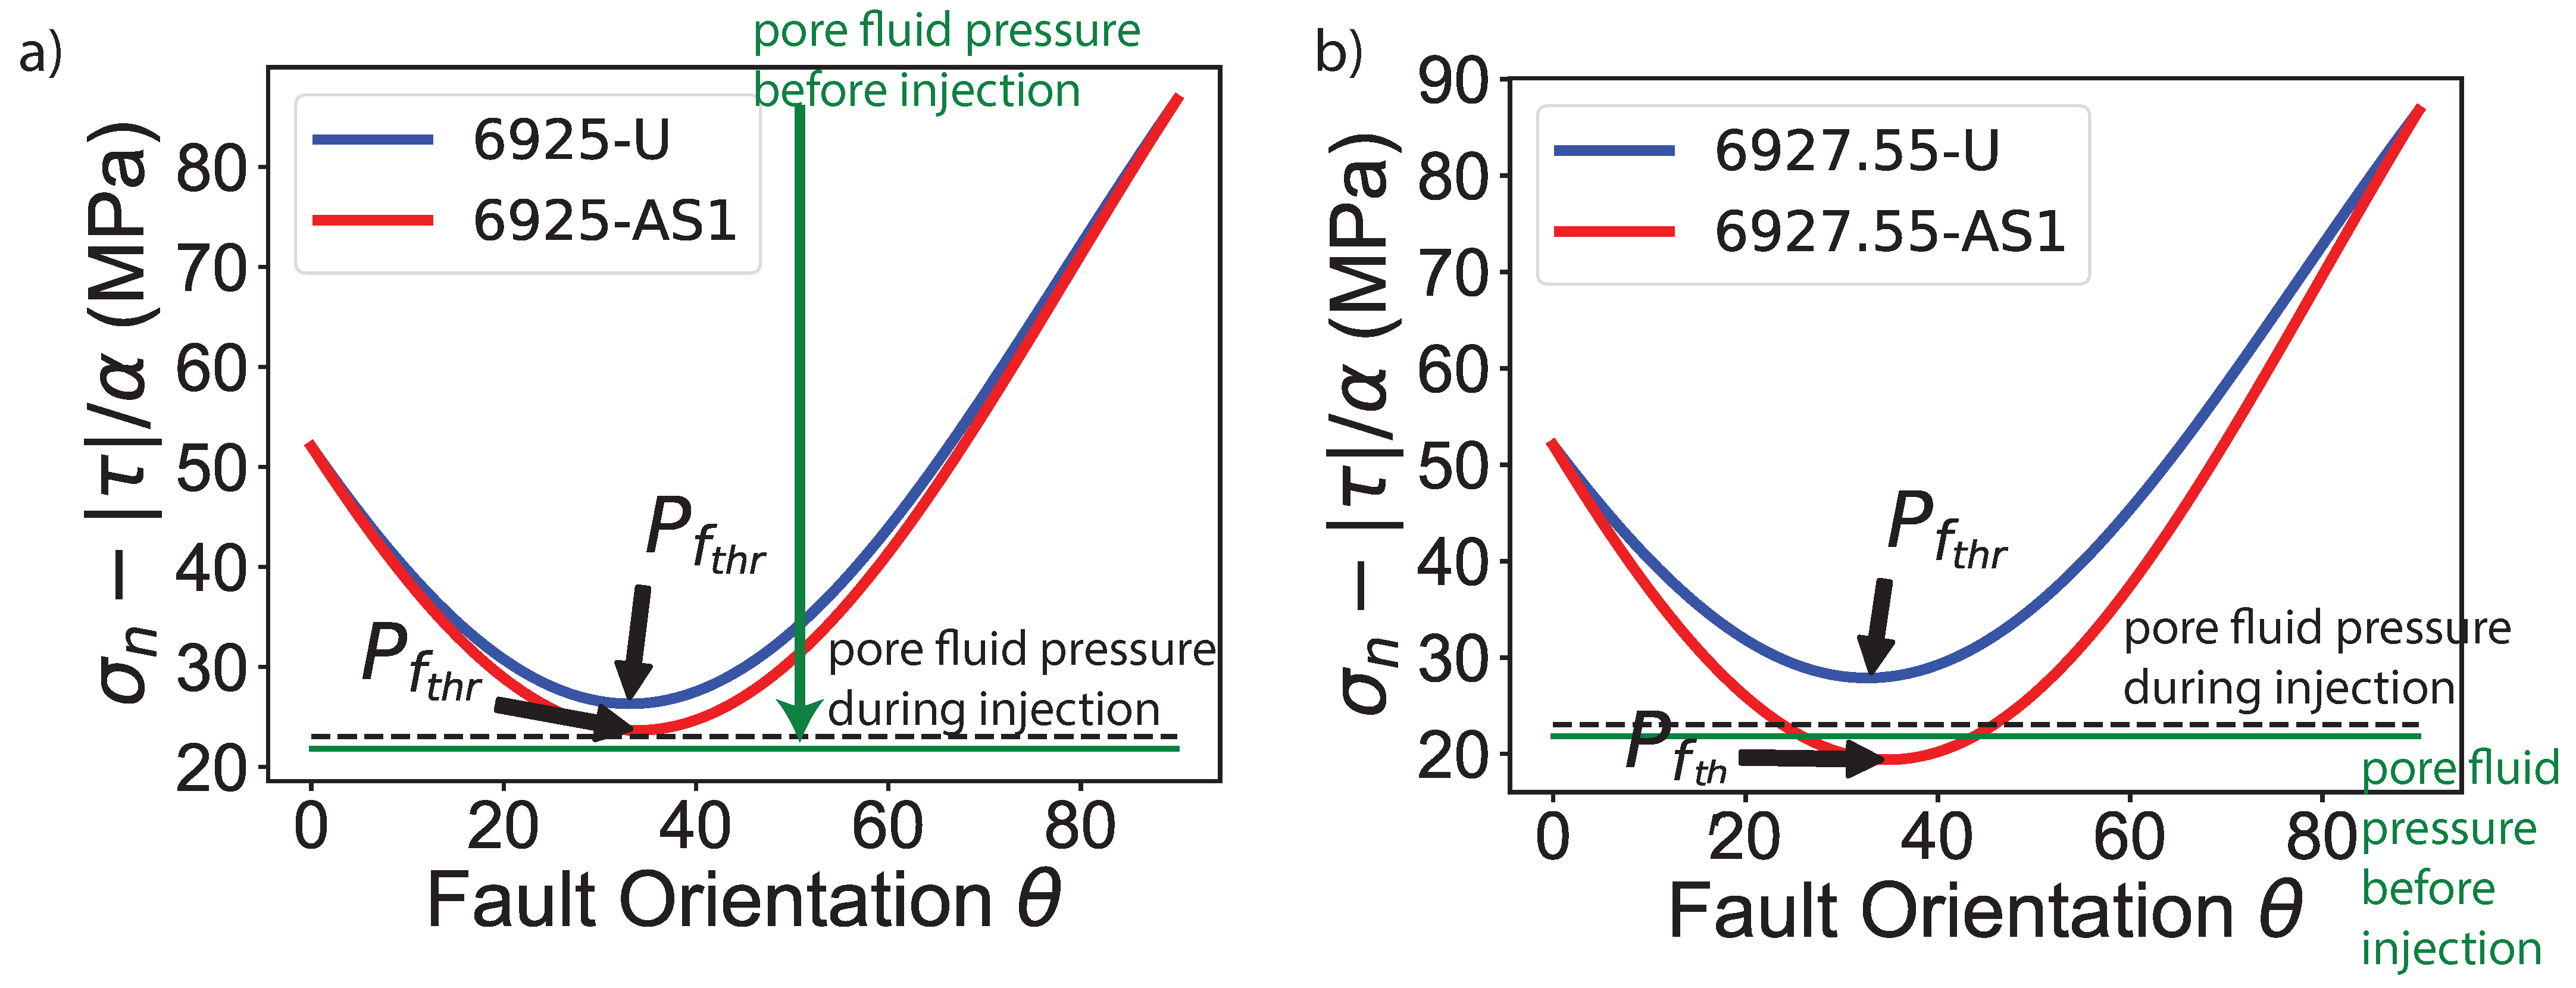
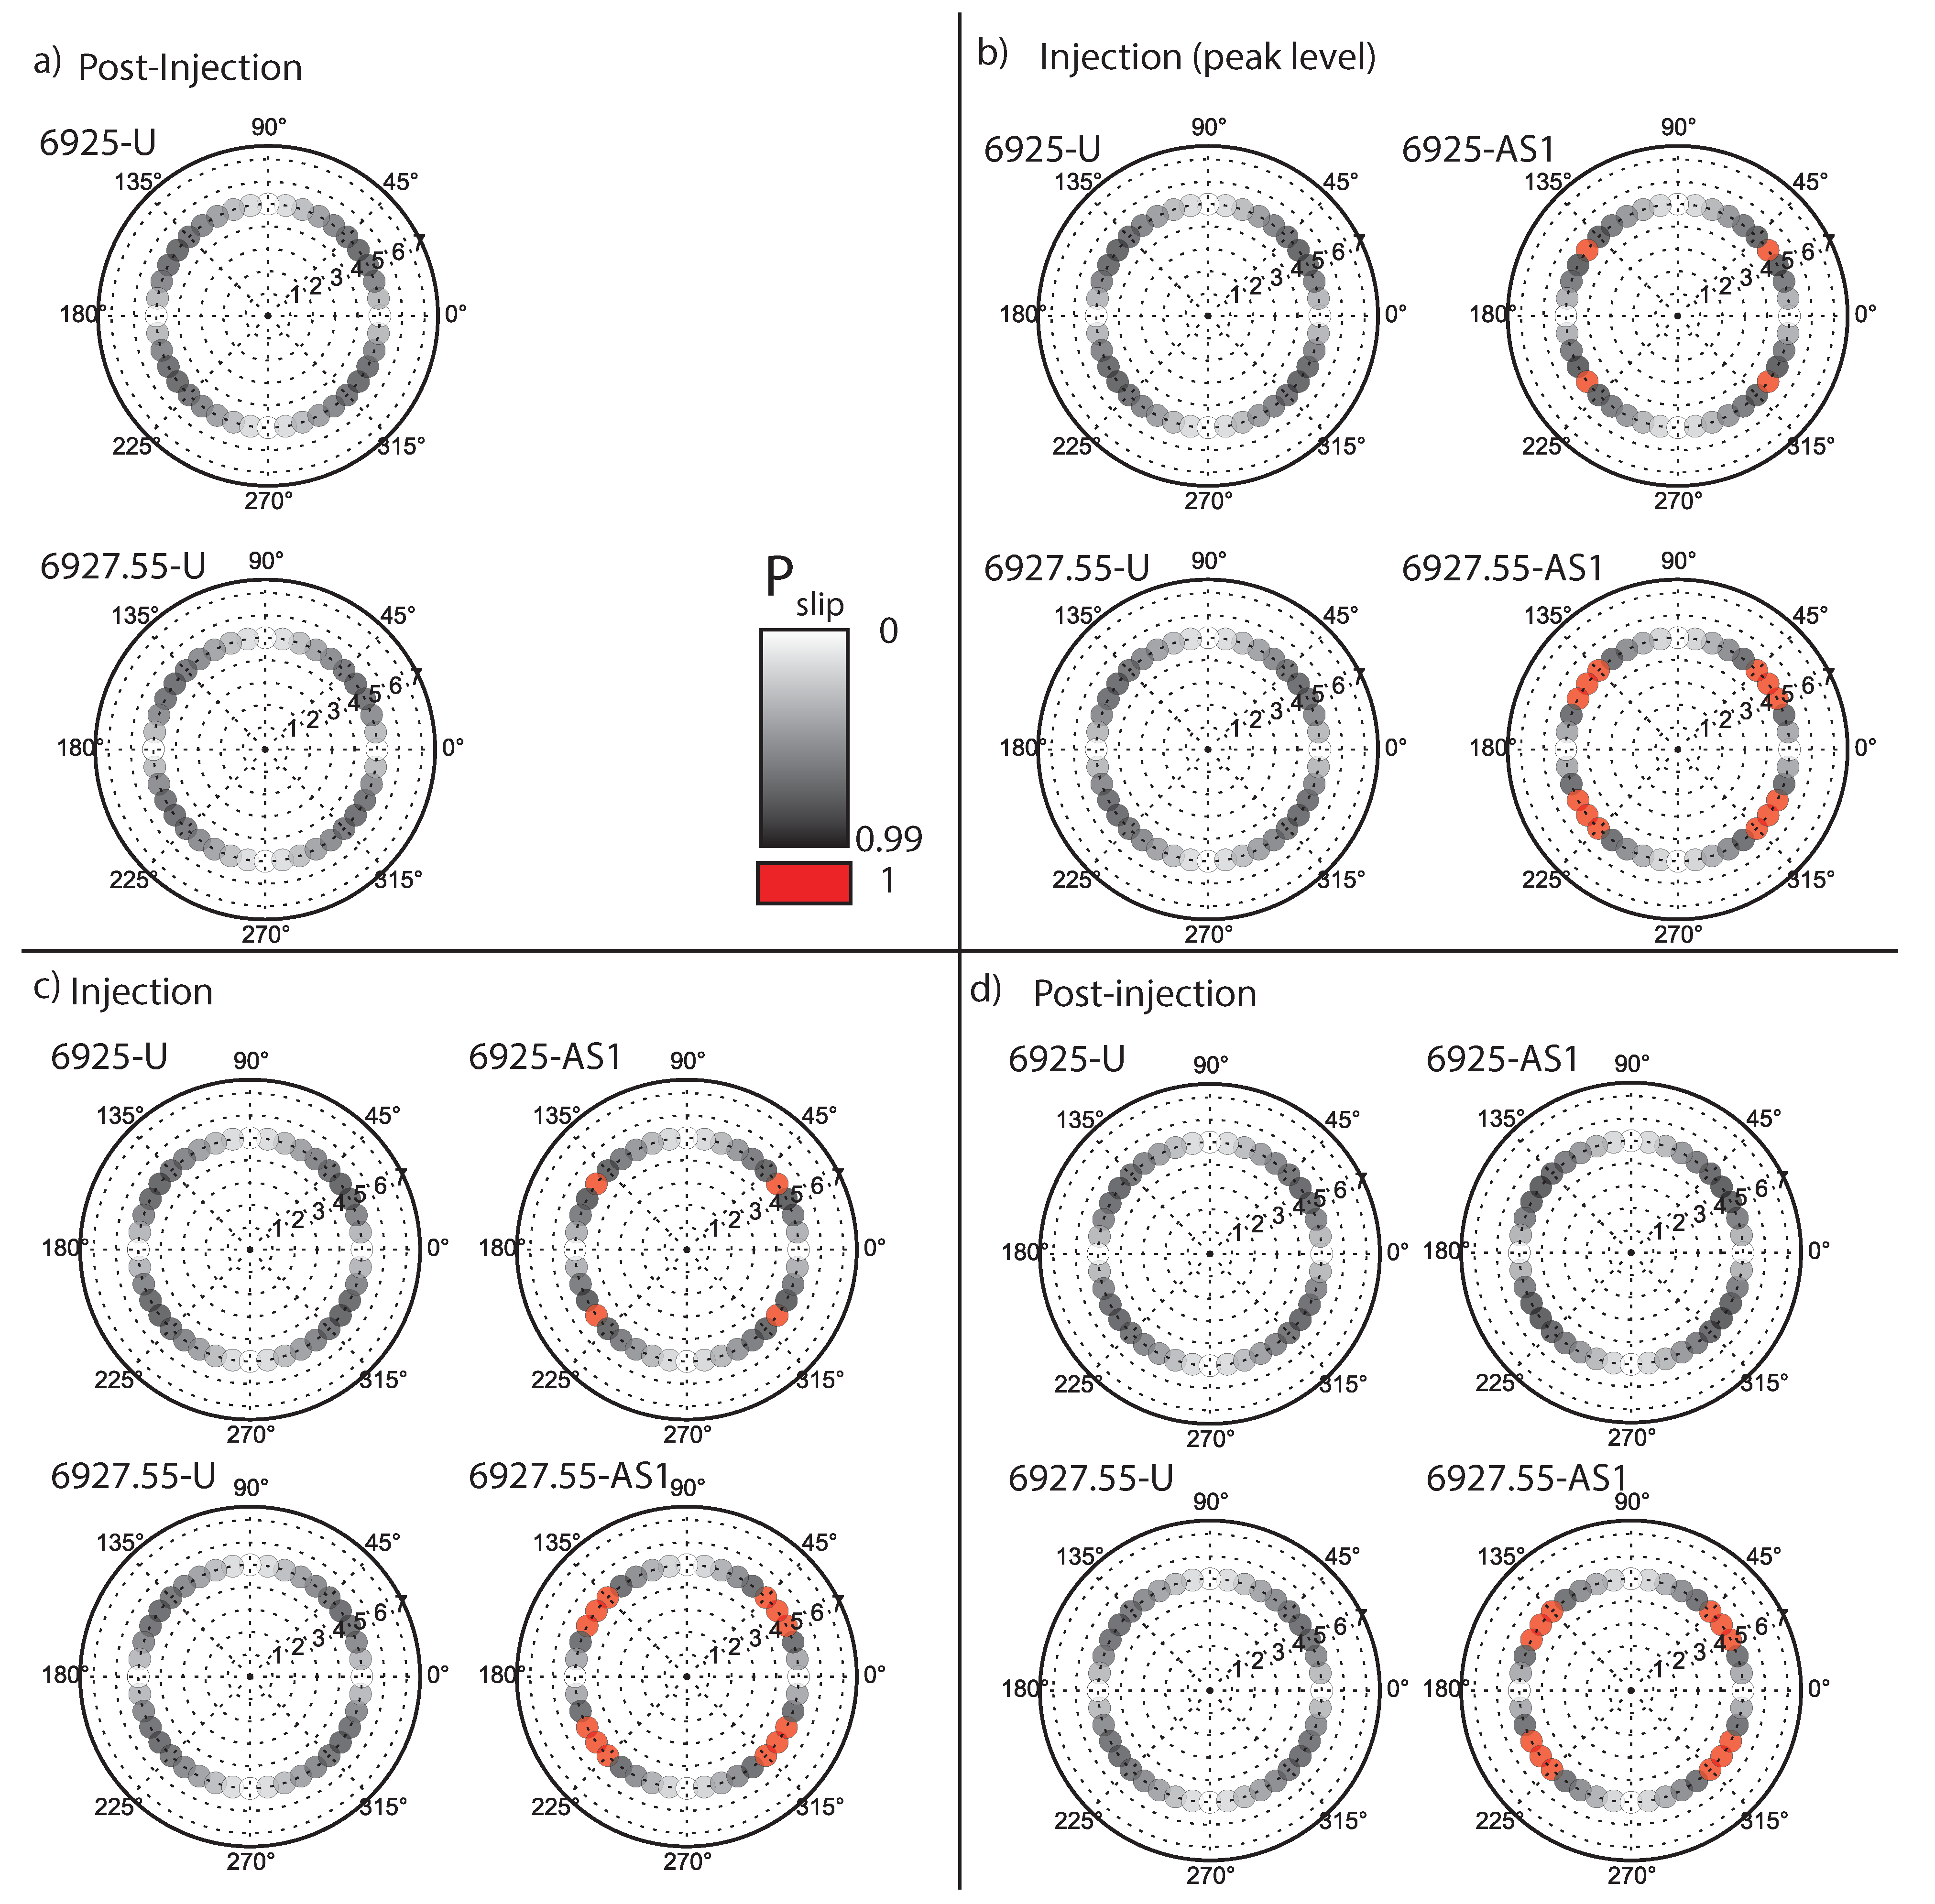
5.3. Implications for CO-Induced Microseismicity
5.4. Induced Microseismicity Within the Illinois-Basin Decatur Project
6. Conclusions
- Incubation with CO-saturated brine, under geological conditions, results in a significant increase in the microporosity and macroporosity.
- CO-induced microstructural changes result in a sharp decrease in the size of the yield surface, and in the value of the friction coefficient.
- The reduction in the friction coefficient, following CO-induced geochemical alterations, leads to a drop in the threshold pore-fluid pressure and an increase in the risk of fault slip.
- Using the Illinois Basin Decatur Project as a case study, our investigation showed that CO-induced geochemical reactions, causing changes in nano- and macroporosity, are a plausible explanation for the surge in microseisimic activity observed during CO injection in the Mt. Simon formation and for the observed residual microseismicity after cessation of the CO injection activities.
Author Contributions
Funding
Acknowledgments
Conflicts of Interest
Abbreviations
| internal friction angle of solid skeleton | |
| long axis of failure envelope at level i | |
| strain concentration tensor of phase j at level i | |
| short axis of failure envelope at level i | |
| Biot coefficient tensor at Level I | |
| Biot coefficient tensors at Level II | |
| cohesion of solid skeleton | |
| stiffness tensor of skeleton at Level 0 | |
| effective stiffness tensor at level i | |
| volumetric strain rate | |
| deviatoric strain rate | |
| grain aspect ratio | |
| global strain tensor | |
| yield function at level i | |
| packing density of solid phase at Level I | |
| H | indentation hardness |
| fourth-order identity tensor | |
| spherical projection fourth order tensor | |
| bulk modulus of solid skeleton at Level 0 | |
| bulk modulus at level i | |
| linear upscaling function for the bulk modulus at level i | |
| deviatoric projection fourth order tensor | |
| plane strain indentation modulus of solid skeleton | |
| shear modulus of solid skeleton at Level 0 | |
| shear modulus at level i | |
| linear upscaling function for the shear modulus at level i | |
| M | indentation modulus |
| Poisson’s ratio of solid skeleton | |
| skeleton Biot modulus at Level I | |
| skeleton Biot moduli at Level II | |
| risk of slip on a cohesionless fault | |
| pore fluid pressure | |
| threshold pore fluid pressure | |
| plastic dissipation potential at level i | |
| microporosity | |
| nanoporosity | |
| eccentricity of failure envelope at level i | |
| global stress tensor | |
| global volumetric stress | |
| global deviatoric stress | |
| prestress | |
| non-linearity function of solid skeleton at Level 0 | |
| homogenized strain rate energy at level i |
Appendix A. Statistical Deconvolution Analysis of Indentation Data


| Material | Apparent Microporosity (%) | Apparent Feldspar Content (%) | Quartz Content (%) | Siderite Content (%) |
|---|---|---|---|---|
| 6925-U | 16.6 | 30.5 | 52.9 | 0 |
| 6925-AS1 | 25.3 | 20.4 | 45.1 | 9.2 |
| 6927.55-U | 16.7 | 21.8 | 57.0 | 4.5 |
| 6927.55-AS1 | 20.7 | 39.8 | 39.5 | 0 |
References
- Available online: https://sequestration.mit.edu/tools/projects/decatur.html (accessed on 16 October 2020).
- Bauer, R.A.; Carney, M.; Finley, R.J. Overview of microseismic response to CO2 injection into the Mt. Simon saline reservoir at the Illinois Basin-Decatur Project. Int. J. Greenh. Gas Control 2016, 54, 378–388. [Google Scholar] [CrossRef] [Green Version]
- Rohmer, J.; Tremosa, J.; Marty, N.C.M.; Audigane, P. Modelling of the CO2-Induced Degradation of a Fractured Caprock during Leakage: Potential for a Mechanical Self-Limiting Process. Rock Mech. Rock Eng. 2017, 50, 2763–2783. [Google Scholar] [CrossRef]
- Bemer, E.; Vincké, O.; Longuemare, P. Geomechanical log deduced from porosity and mineralogical content. Oil Gas Sci. Tech. 2004, 59, 405–426. [Google Scholar] [CrossRef]
- Nguyen, M.T.; Bemer, E.; Dormieux, L. Micromechanical modeling of carbonate geomechanical properties evolution during acid gas injection. In 45th US Rock Mechanics/Geomechanics Symposium; American Rock Mechanics Association: Alexandria, VA, USA, 2011; pp. 26–29. [Google Scholar]
- Arson, C.; Vanorio, T. Chemomechanical evolution of pore space in carbonate microstructures upon dissolution: Linking pore geometry to bulk elasticity. J. Geophys. Res. Solid Earth 2015, 120, 6878–6894. [Google Scholar] [CrossRef]
- Akono, A.T.; Kabir, P.; Shi, Z.; Fuchs, S.; Tsotsis, T.T.; Jessen, K.; Werth, C.J. Modeling CO2-Induced Alterations in Mt. Simon Sandstone via Nanomechanics. Rock Mech. Rock Eng. 2019, 52, 1353–1375. [Google Scholar] [CrossRef]
- Sun, Z.; Espinoza, D.N.; Balhoff, M.T. Discrete element modeling of indentation tests to investigate mechanisms of CO2-related chemomechanical rock alteration. J. Geophys. Res. Solid Earth 2016, 121, 7867–7881. [Google Scholar] [CrossRef] [Green Version]
- Sun, Z.; Espinoza, D.N.; Balhoff, M.T.; Dewers, T.A. Discrete Element Modeling of Micro-scratch Tests: Investigation of Mechanisms of CO2 Alteration in Reservoir Rocks. Rock Mech. Rock Eng. 2017, 50, 3337–3348. [Google Scholar] [CrossRef]
- Sun, Z.; Espinoza, D.N.; Balhoff, M.T. Reservoir rock chemo-mechanical alteration quantified by triaxial tests and implications to fracture reactivation. Int. J. Rock Mech. Min. Sci. 2018, 106, 250–258. [Google Scholar] [CrossRef]
- Espinoza, D.N.; Jung, H.; Major, J.R.; Sun, Z.; Ramos, M.J.; Eichhubl, P.; Balhoff, M.T.; Choens, R.C.; Dewers, T.A. CO2 charged brines changed rock strength and stiffness at Crystal Geyser, Utah: Implications for leaking subsurface CO2 storage reservoirs. Int. J. Greenh. Gas Control 2018, 73, 16–28. [Google Scholar] [CrossRef] [Green Version]
- Sun, Z.; Tang, H.; Espinoza, D.N.; Balhoff, M.T.; Killough, J.E. Discrete element modeling of grain crushing and implications on reservoir compaction. J. Petroleum Sci. Eng. 2019, 171, 431–439. [Google Scholar] [CrossRef]
- Casta neda, P.P.; Willis, J.R. On the overall properties of nonlinearly viscous composites. Proc. R. Soc. A 1988, 416, 217–244. [Google Scholar]
- Casta neda, P.P. The effective mechanical properties of nonlinear isotropic composites. J. Mech. Phys. Sol. 1991, 39, 45–71. [Google Scholar] [CrossRef]
- Shen, W.; He, Z.; Dormieux, L.; Kondo, D. Effective strength of saturated double porous media with a Drucker–Prager solid phase. Int. J. Numer. Anal. Methods Geomech. 2014, 38, 281–296. [Google Scholar] [CrossRef]
- Pichler, B.; Hellmich, C. Upscaling quasi-brittle strength of cement paste and mortar: A multi-scale engineering mechanics model. Cem. Concr. Res. 2011, 41, 467–476. [Google Scholar] [CrossRef]
- Cariou, S.; Ulm, F.J.; Dormieux, L. Hardness–packing density scaling relations for cohesive-frictional porous materials. J. Mech. Phys. Sol. 2008, 56, 924–952. [Google Scholar] [CrossRef]
- Ortega, J.A.; Gathier, B.; Ulm, F.J. Homogenization of cohesive-frictional strength properties of porous composites: Linear comparison composite approach. J. Nanomech. Micromech. 2011, 1, 11–23. [Google Scholar] [CrossRef]
- Bobko, C.P.; Gathier, B.; Ortega, J.A.; Ulm, F.J.; Borges, L.; Abousleiman, Y.N. The nanogranular origin of friction and cohesion in shale—A strength homogenization approach to interpretation of nanoindentation results. Int. J. Numer. Anal. Methods Geomech. 2011, 35, 1854–1876. [Google Scholar] [CrossRef]
- Akono, A.T.; Koric, S.; Kriven, W.M. Influence of pore structure on the strength behavior of particle-and fiber-reinforced metakaolin-based geopolymer composites. Cem. Concr. Compos. 2019, 104, 103361. [Google Scholar] [CrossRef]
- Dormieux, L.; Kondo, D.; Ulm, F.-J. Microporomechanics; John Wiley & Sons: West Sussex, UK, 2006. [Google Scholar]
- Eshelby, J.D. The determination of the elastic field of an ellipsoidal inclusion, and related problems. Proc. R. Soc. A 1957, 241, 376–396. [Google Scholar]
- Zaoui, A. Continuum micromechanics: Survey. J. Eng. Mech. 2002, 128, 808–816. [Google Scholar] [CrossRef] [Green Version]
- Berryman, J.G. Long-wavelength propagation in composite elastic media II. Ellipsoidal inclusions. J. Acoust. Soc. A. 1980, 68, 1820–1831. [Google Scholar] [CrossRef]
- Talbot, D.R.S.; Willis, J.R. Variational principles for inhomogeneous non-linear media. IMA J. Appl. Math. 1985, 35, 39–54. [Google Scholar] [CrossRef]
- Talbot, D.R.S.; Willis, J.R. Some simple explicit bounds for the overall behaviour of nonlinear composites. Int. J. Solid Struct. 1992, 29, 1981–1987. [Google Scholar] [CrossRef]
- Casta neda, P.P. New variational principles in plasticity and their application to composite materials. J. Mech. Phys. Sol. 1992, 40, 1757–1788. [Google Scholar] [CrossRef]
- Castañeda, P.P.; Willis, J.R. Variational second-order estimates for nonlinear composites. Proc. R. Soc. A 1999, 455, 1799–1811. [Google Scholar] [CrossRef]
- Salencon, J. Applications of the Theory of Plasticity in Soil Mechanics; Wiley: Hoboken, NJ, USA, 1977. [Google Scholar]
- Ulm, F.-J.; Coussy, O. Mechanics and Durability of Solids; Volume I, Mechanics of Solids; Prentice-Hall: Upper Saddle River, NJ, USA, 2002. [Google Scholar]
- Akono, A.T.; Druhan, J.L.; Dávila, G.; Tsotsis, T.; Jessen, K.; Fuchs, S.; Crandall, D.; Shi, Z.; Dalton, L.; Tkach, M.K.; et al. A review of geochemical—Mechanical impacts in geological carbon storage reservoirs. Greenh. Gases Sci. Technol. 2019, 9, 474–504. [Google Scholar] [CrossRef]
- Dávila, G.; Luquot, L.; Soler, J.M.; Cama, J. Interaction between a fractured marl caprock and CO2 rich sulfate solution under supercritical CO2 conditions. Int. J. Greenh. Gas Control 2016, 48, 105–119. [Google Scholar] [CrossRef] [Green Version]
- Laubie, H.; Monfared, S.; Radjai, F.; Pellenq, R.; Ulm, F.J. Disorder-induced stiffness degradation of highly disordered porous materials. J. Mech. Phys. Sol. 2017, 106, 207–228. [Google Scholar] [CrossRef] [Green Version]
- Frailey, S.M.; Damico, J.; Leetaru, H.E. Reservoir characterization of the Mt. Simon Sandstone, Illinois Basin, USA. Energy Procedia 2011, 4, 5487–5494. [Google Scholar] [CrossRef] [Green Version]
- Vialle, S.; Vanorio, T. Laboratory measurements of elastic properties of carbonate rocks during injection of reactive CO2 saturated water. Geophys. Res. Lett. 2011, 38. [Google Scholar] [CrossRef]
- Rimmelé, G.; Barlet-Gouédard, V.; Renard, F. Evolution of the petrophysical and mineralogical properties of two reservoir rocks under thermodynamic conditions relevant for CO2 geological storage at 3 km depth. Oil Gas Sci. Technol.—Rev. l’Institut Français du Pétrole 2010, 65, 565–580. [Google Scholar]
- Byerlee, J. Friction of rocks. In Rock Friction and Earthquake Prediction; Byerlee, J., Wyss, M., Eds.; Birkhäuser: Basel, Switzerland, 1987; pp. 615–626. [Google Scholar]
- Rathnaweera, T.D.; Ranjith, P.G.; Perera, M.S.A.; Haque, A.; Lashin, A.; Al Arifi, N.; Chandrasekharam, D.; Yang, S.Q.; Xu, T.; Wang, S.H.; et al. CO2-induced mechanical behaviour of Hawkesbury sandstone in the Gosford basin: An experimental study. Mater. Sci. Eng. A 2015, 641, 123–137. [Google Scholar] [CrossRef]
- Xie, S.Y.; Shao, J.F.; Xu, W.Y. Influences of chemical degradation on mechanical behaviour of a limestone. Int. J. Rock Mech. Min. Sci. 2011, 48, 741–747. [Google Scholar] [CrossRef]
- Shi, Z.; Sun, L.; Haljasmaa, I.; Harbert, W.; Sanguinito, S.; Tkach, M.; Goodman, A.; Tsotsis, T.T.; Jessen, K. Impact of Brine/CO2 exposure on the transport and mechanical properties of the Mt Simon sandstone. J. Petroleum Sci. Eng. 2019, 177, 295–305. [Google Scholar] [CrossRef]
- Yoksoulian, L.E.; Freiburg, J.T.; Butler, S.K.; Berger, P.M.; Roy, W.R. Mineralogical alterations during laboratory-scale carbon sequestration experiments for the Illinois Basin. Energy Procedia 2013, 37, 5601–5611. [Google Scholar] [CrossRef] [Green Version]
- Hawkes, C.D.; McLellan, P.J.; Zimmer, U.; Bachu, S. Geomechanical factors affecting geological storage of CO in depleted oil and gas reservoirs. In Canadian International Petroleum Conference; Petroleum Society of Canada: Calgary, AB, Canada, 2004. [Google Scholar]
- Streit, J.E.; Hillis, R.R. Estimating fault stability and sustainable fluid pressures for underground storage of CO2 in porous rock. Energy 2004, 29, 1445–1456. [Google Scholar] [CrossRef]
- Bauer, R.; Will, R.; Jaques, P.; Smith, V.; Payne, W.G. Pre-thru Post-Injection Monitoring of Microseismicity at Illinois Basin Decatur Project and Static and Dynamic Modeling Efforts for Monitoring and Event Prediction; Midwest Geological Sequestration Consortium: Champaign, IL, USA, 2016. [Google Scholar]
- Finley, R.J.; Frailey, S.M.; Leetaru, H.E.; Senel, O.; Couëslan, M.L.; Scott, M. Early operational experience at a one-million tonne CCS demonstration project, Decatur, Illinois, USA. Energy Procedia 2013, 37, 6149–6155. [Google Scholar] [CrossRef] [Green Version]
- Will, R.; El-Kaseeh, G.; Jaques, P.; Carney, M.; Greenberg, S.; Finley, R. Microseismic data acquisition, processing, and event characterization at the Illinois Basin–Decatur Project. Int. J. Greenh. Gas Control 2016, 54, 404–420. [Google Scholar] [CrossRef] [Green Version]
- Marone, C.; Raleigh, C.B.; Scholz, C.H. Frictional behavior and constitutive modeling of simulated fault gouge. J. Geophys. Res. Solid Earth 1990, 95, 7007–7025. [Google Scholar] [CrossRef]
- Dávila, G.; Dalton, L.; Crandall, D.M.; Garing, C.; Werth, C.J.; Druhan, J.L. Reactive alteration of a Mt. Simon Sandstone due to CO2-rich brine displacement. Geochim. Cosmochim. Acta 2020, 271, 227–247. [Google Scholar] [CrossRef]


| Sample Notation | Burial Depth | Alteration Procedure |
|---|---|---|
| 6925-U | 6925 ft. | None |
| 6925-AS1 | 6925 ft. | Incubation in CO-saturated brine at 50 C and 17.2 MPa for one week |
| 6927.55-U | 6927.55 ft. | None |
| 6927.55-AS1 | 6927.55 ft. | Incubation in CO-saturated brine at 50 C and 17.2 MPa for one week |
| Level | Mechanical Constants | Structural Parameters |
|---|---|---|
| 0 | ||
| I | ||
| II | (,, ) |
| Material | Macroporosity | Microporosity |
|---|---|---|
| 6925-U | 0.181 | 0.083 |
| 6925-AS1 | 0.224 | 0.096 |
| 6927.55-U | 0.147 | 0.105 |
| 6927.55-AS1 | 0.245 | 0.111 |
| Level | Model Parameters |
|---|---|
| 0 | |
| I | |
| II |
| Material | (GPa) | (MPa) | () | (MPa) | |
|---|---|---|---|---|---|
| 6925-U | 23.89 | −3.45 | 0.50 | 40.76 | 338.57 |
| 6925-AS1 | 20.32 | −4.37 | 0.45 | 37.71 | 297.91 |
| 6927.55-U | 30.34 | −4.04 | 0.54 | 42.95 | 379.84 |
| 6927.55-AS1 | 15.93 | −10.18 | 0.39 | 33.79 | 229.10 |
| Material | (MPa) | (psi) | Critical Fault Orientation () |
|---|---|---|---|
| 6925-U | 26.31 | 3815 | ±33 |
| 6925-AS1 | 23.65 | 3430 | ± 34 |
| 6927.55-U | 27.87 | 4042 | ± 33 |
| 6927.55-AS1 | 19.39 | 2812 | ± 35 |
Publisher’s Note: MDPI stays neutral with regard to jurisdictional claims in published maps and institutional affiliations. |
© 2020 by the authors. Licensee MDPI, Basel, Switzerland. This article is an open access article distributed under the terms and conditions of the Creative Commons Attribution (CC BY) license (http://creativecommons.org/licenses/by/4.0/).
Share and Cite
Akono, A.-T.; Werth, C.; Shi, Z.; Jessen, K.; Tsotsis, T.T. Advanced Geomechanical Model to Predict the Impact of CO2-Induced Microstructural Alterations on the Cohesive-Frictional Behavior of Mt. Simon Sandstone. Minerals 2021, 11, 38. https://doi.org/10.3390/min11010038
Akono A-T, Werth C, Shi Z, Jessen K, Tsotsis TT. Advanced Geomechanical Model to Predict the Impact of CO2-Induced Microstructural Alterations on the Cohesive-Frictional Behavior of Mt. Simon Sandstone. Minerals. 2021; 11(1):38. https://doi.org/10.3390/min11010038
Chicago/Turabian StyleAkono, Ange-Therese, Charles Werth, Zhuofan Shi, Kristian Jessen, and Theodore T. Tsotsis. 2021. "Advanced Geomechanical Model to Predict the Impact of CO2-Induced Microstructural Alterations on the Cohesive-Frictional Behavior of Mt. Simon Sandstone" Minerals 11, no. 1: 38. https://doi.org/10.3390/min11010038