Article

Structure of Late Pleistocene and Holocene Sediments in the Petrozavodsk Bay, Lake Onego (NW Russia)

1
Faculty of Geography, Herzen State Pedagogical University of Russia, 191186 Saint Petersburg, Russia
2
Laboratory of Paleolimnology, Northern Water Problems Institute, Federal Research Centre “Karelian Research Center of the Russian Academy of Sciences”, 185030 Petrozavodsk, Russia
3
Institute of Earth Sciences, Saint Petersburg State University, 199034 Saint Petersburg, Russia
4
Seismic Data Analysis Centre (SDAC), Lomonosov Moscow State University, 119991 Moscow, Russia
5
V.S. Sobolev Institute of Geology and Mineralogy, Russian Academy of Sciences, 630090 Novosibirsk, Russia
6
Geological Faculty, Lomonosov Moscow State University, 119991 Moscow, Russia
7
Marine Investigation Centre (MIC), Lomonosov Moscow State University, 119991 Moscow, Russia
8
FSBI VNII Oceangeologia, 190121 Saint Petersburg, Russia
9
Department of Earth Sciences, ETH Zurich, 8092 Zurich, Switzerland
10
Department of Surface Waters—Research and Management, EAWAG Swiss Federal Institute of Aquatic Sciences and Technology, 8600 Dübendorf, Switzerland
*
Author to whom correspondence should be addressed.
Minerals 2020, 10(11), 964; https://doi.org/10.3390/min10110964
Submission received: 13 August 2020 / Revised: 26 October 2020 / Accepted: 26 October 2020 / Published: 28 October 2020
(This article belongs to the Special Issue Mineral and Geochemical Composition of Lake Sediments)

Abstract

:
Here, we present new results from seismic, geological, and geochemical studies conducted in 2015–2019 in the Petrozavodsk Bay of Lake Onego, NW Russia. The aims of these investigations were to (i) to characterize the structure of Quaternary deposits and (ii) provide new evidence of modern geodynamic movements and gas-seepage in Holocene sediments. The structure of the recovered deposits was composed of lacustrine mud, silt and sands from the Holocene, limno-glacial clays (varved clays) from the Late Glacial–Interglacial Transition, and glacial deposits (till) from the Late Pleistocene. The thickness of these deposits varied in different parts of the bay. Many pockmarks created by gases escaping and reaching sediment-water interface were observed in these deposits. Such pockmarks can play a significant role in the geochemical and biological processes in the bottom sediment surface, and gases that escape might modify the physicochemical characteristics of the environment.

1. Introduction

Geological explorations of Lake Onego have been conducted since the 1960s, but research was carried out only with short gravity corers [1].The sediment cores obtained in these studies were no longer than 1–1.5 m, thus only reaching the Upper and Middle Holocene. Only at the end of the last century did Finnish scientists and Karelian Research Center experts conduct geochronological and lithostratigraphic studies [2]. These studies have determined the lake basin formation about 15,000 years before present (yr. BP) [3].
As no seismoacoustic and long-core sediment studies existed in this area, paleogeography of Lake Onego in the Late Pleistocene–Holocene drew upon well-investigated geological sections of Quaternary deposits around the lake basin, including sediment cores from small lakes located near Lake Onego [4]. Demidov [5,6] used these data and the findings of Finnish researchers to present the first model of the development of Lake Onego in the Late Pleistocene and Holocene [2], which has been used until now in different variations. In recent years, the stratigraphy of Lake Onego’ sediments and the main stages of paleogeographic development of the lake basin during the Late Pleistocene–Holocene has become significantly more precise [4,7,8]. However, specific data on the structure of the bottom sediments in Lake Onego are currently not available.
Given the limited knowledge on this issue, a joint research in 2014–2019 was conducted to investigate the stratigraphic features and mineral composition of bottom sediments in the Petrozavodsk Bay of Lake Onego using seismoacoustic, geological, geochemical, and mineralogical methods. In 2015, gas accumulations in the soft lacustrine sediments were discovered during geophysical surveys.

2. Regional Setting

Lake Onego (61°42′ N, 35°25′ E) is the second-largest lake in Europe, and is located at the Baltic (Fennoscandian) Crystalline Shield and Russian Plate boundary. The geological structure and development history of the lake and its drainage basin were explained in previous work [5,6,8,9]. The depression of Lake Onego is of tectonic origin [10]. Its drainage area is composed of Precambrian crystalline rocks and Vendian-Phanerozoic sedimentary rocks, which are resistant to abrasion and partly obscured by overlying Quaternary deposits [11,12]. The oligotrophic waters of Lake Onego are characterized by low mineralization (39–46 mg/L). The area of the water table is 9720 km2. The maximum depth is 127 m, the average depth is 30 m, the length (the longest distance from south to north) is 248 km, and the width is 83 km (Figure 1a).
The Petrozavodsk Bay is located in the northwestern part of Lake Onego, with the town of Petrozavodsk lying on its northwestern shore. The bay stretches from north-west to south-east. From the north-east, it is separated from the Bolshoe (Big) Onego Bay by the Ivanovskie Islands. The bay’s estuary opens into the central part of Lake Onego by a 2-km-wide and 23-m-deep strait. Residents of Petrozavodsk use the bay for industrial, transport, and recreational purposes and draw water for the city’s needs. The maximum depth of the bay is 29 m. The water area is 180 km2.

3. Materials and Methods

3.1. Fieldworks

3.1.1. Seismoacoustic and Sonar Profiling

Seismoacoustic, high-resolution acoustic (by means of a profile recorder), and sonar profiling was carried out in the Petrozavodsk Bay using a detailed seismic grid (Figure 1). Profiles were 7 km long, the distance between them was 250 m. Along the south-western coast, near Petrozavodsk, the spacing between the profiles was reduced to 50 m. In total, 96 km of geophysical profiles have been covered.
Based on the interpretation of seismoacoustic and sonar profiling, locations for five stations were chosen to retrieve sediment samples. At each station, four sediment cores were taken for (1) sample selection and a description of the lithology, (2) stratigraphic studies, (3) radiography with the subsequent determination of geotechnical properties of the bottom sediments, and (4) sampling for gas-geochemical surveys. Navigational referencing of the observations was done by means of GPS with a differential mode, using the reference station installed on the shore.
Seismoacoustic profiling was carried out at a vessel speed of 3–4.5 knots (two research vessels ‘Professor Zenkevich’ and ‘Ecolog’ were used). Excitation of elastic modes was conducted using a Boomer source. This allowed a signal at the center frequency of at least 1000 Hz to be generated. Data logging was performed using a 14-bit seismic station, with a resolution of at least 0.5 ms and recording duration of at least 200 ms in SEG-Y format. For more detailed images of the upper part of the section, a sub-bottom profiler SES-2000 Light was used.
Sonar profiling was carried out by means of the backscattering technique, which allowed images of the lake bottom in a stripe of a specified width along the profile line to be captured. A side-scan sonar was applied for the survey, towed on a rigid bar on the starboard side of the vessel. The antenna of the tool was placed at a depth of 3 m. The applied frequency was 450 kHz, enabling us to explore the surface of the seabed in detail, with a swath width of 100 m and a resolution of 0.5 m. The survey was undertaken at a vessel speed of 4–5 knots, and the signal was emitted six times per second, i.e., every 40–50 cm. Upon the completion of each profile, data were loaded into a processing system based on the RadExPro software package to perform quality control and preprocessing.

3.1.2. Sediment Sampling

Sediment sampling on the ‘Professor Zenkevich’ R/V was carried out by means of a 3-m-long and 127-mm-diameter gravity core sampler with a total weight of 300 kg (Table 1).
The sediment cores from stations ONG-2, ONG-4, and ONG-7 were placed in plastic tubes of an appropriate diameter, hermetically sealed and sent to the laboratories in Petrozavodsk, Moscow, and Saint Petersburg for analyses. Core ONG-5 was squeezed into trays. Next step, the core samples were collected for gas measurements, placed in a shaker, and sent ashore to the laboratory for degassing on the same day.

3.2. Laboratory Analysis
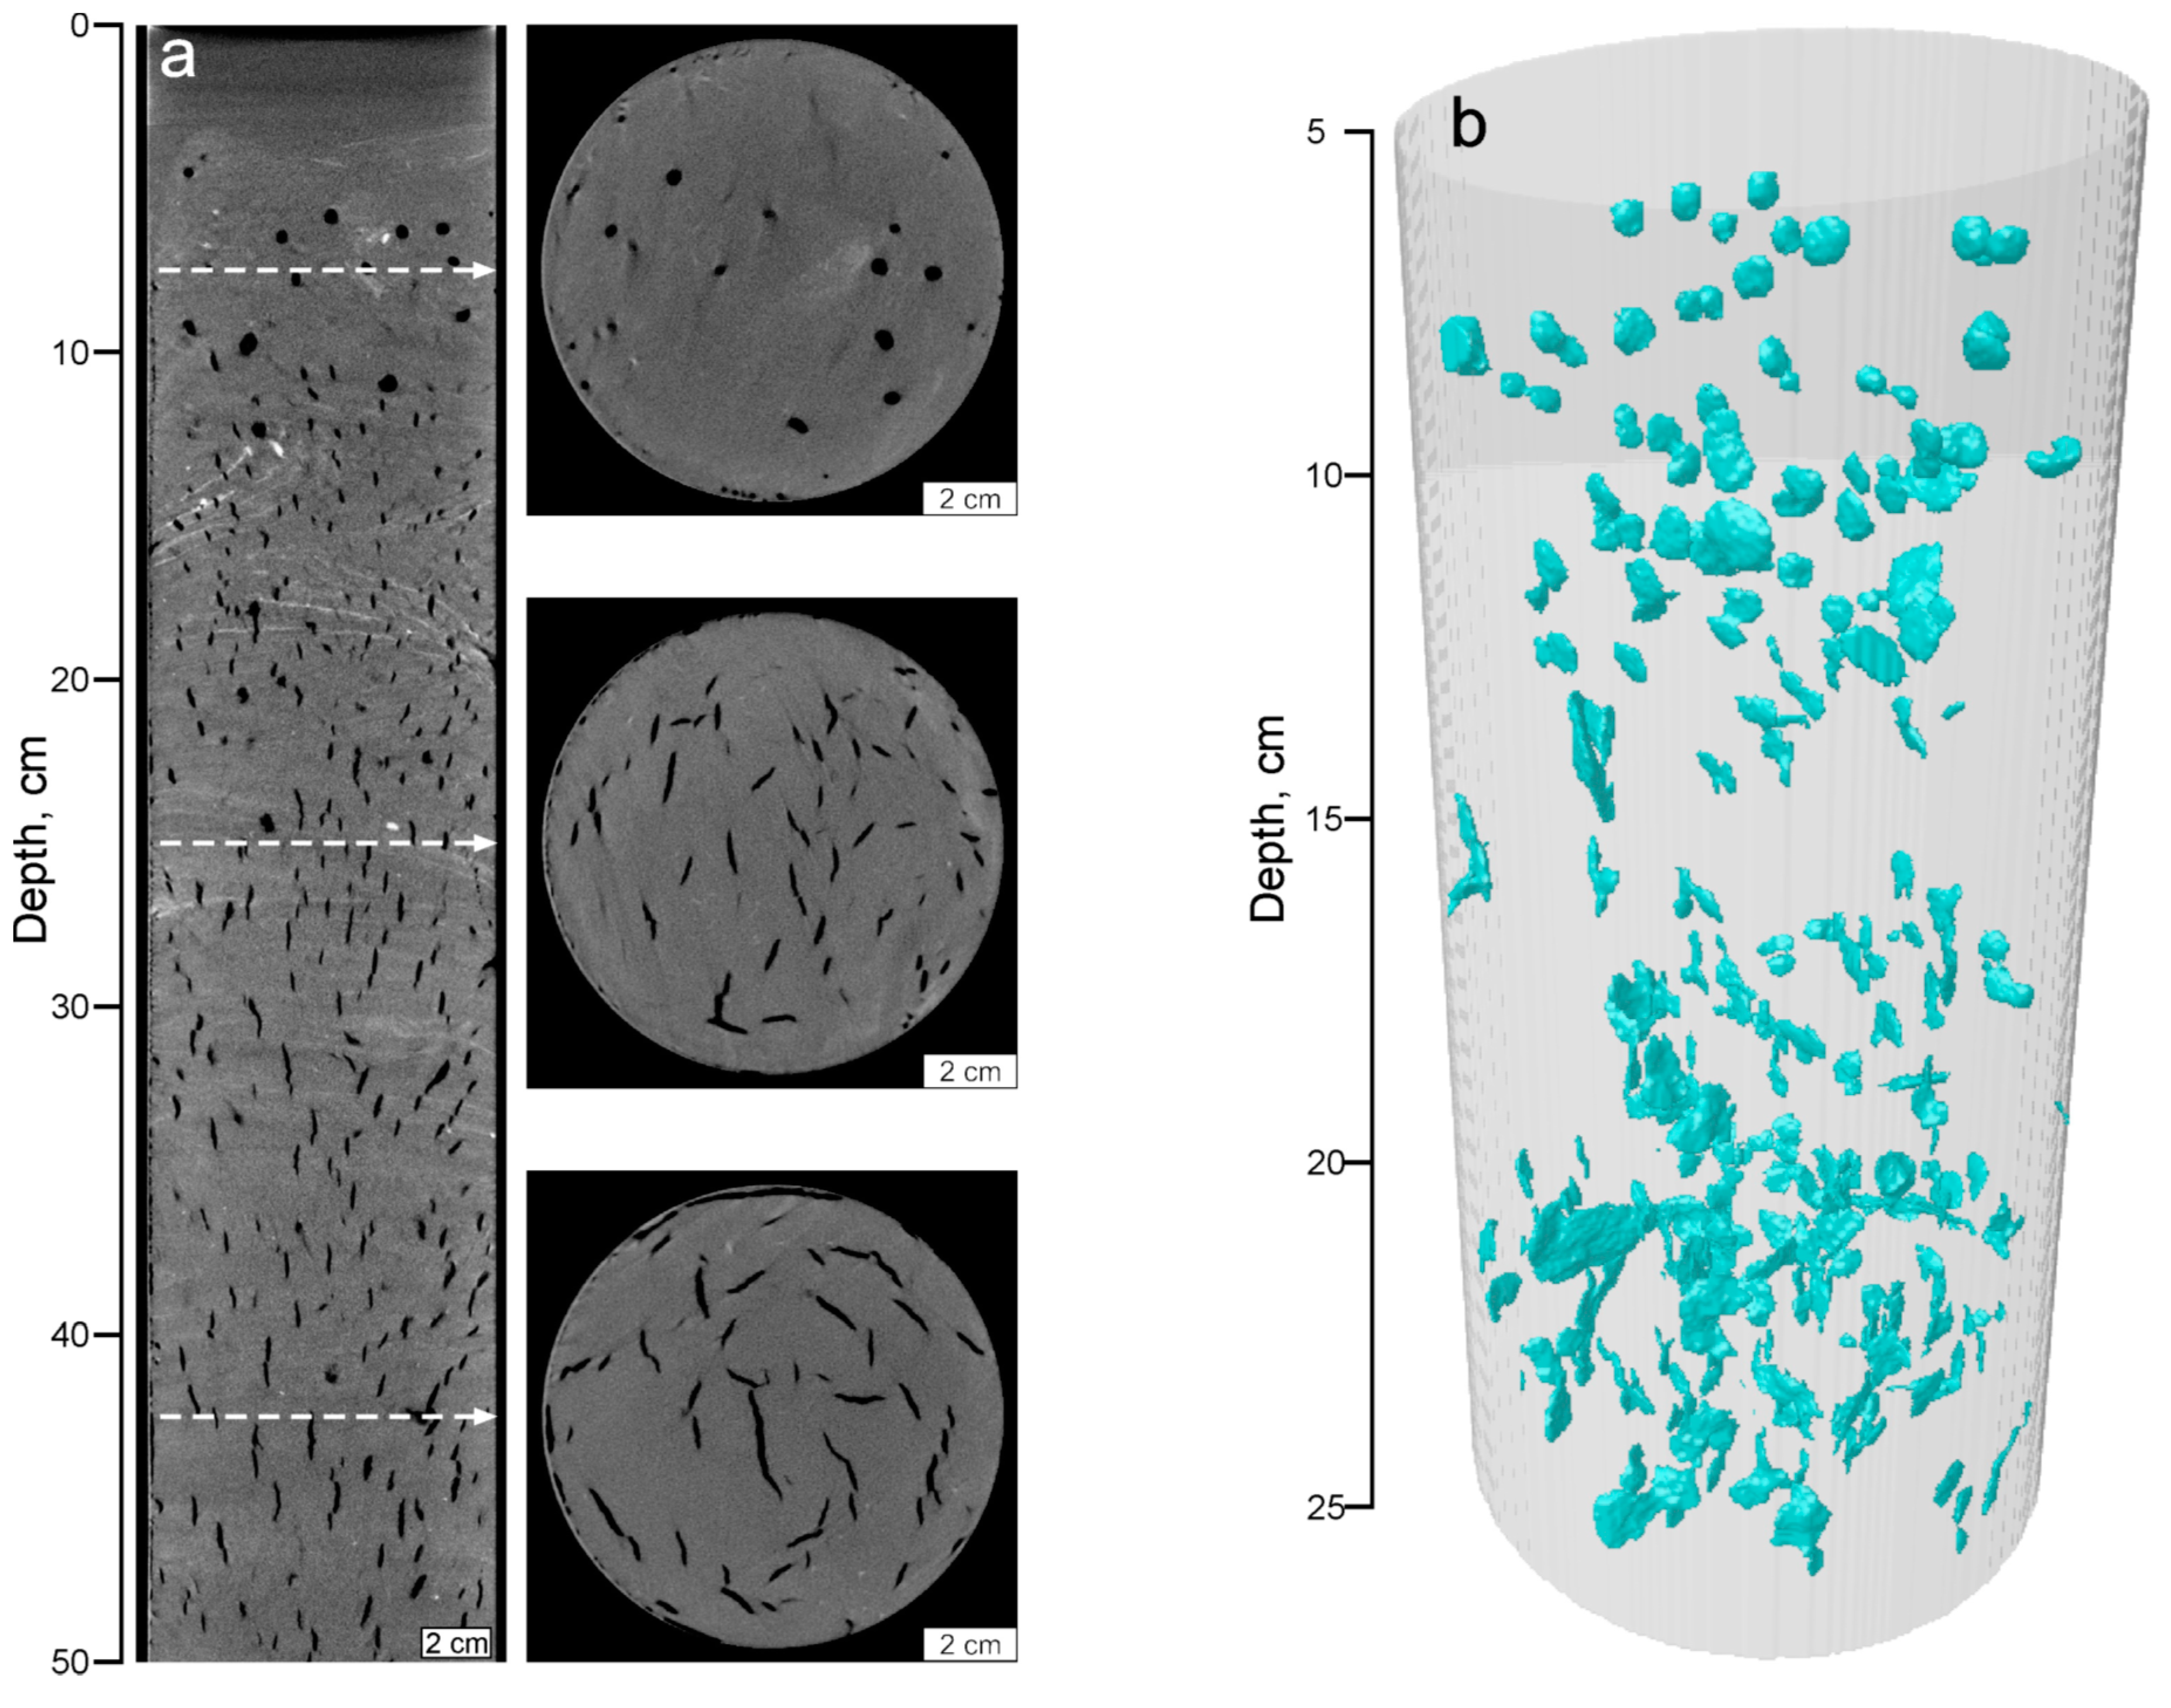
3.2.1. CT Imaging

CT imaging was performed using an RKT-180 (Geologika, Novosibirsk, Russia) scanner to study textural features of the bottom sediments. The cores were scanned vertically with a resolution of 230 µm at 160 keV voltages and a current of 3 A using the oversize spiral mode. The total dataset includes several subscans connected on the vertical axis. Data processing was done with the software TOMO (reconstruction, by Geologika) and Dataviewer/CTan/CTVol (3D model producing and imaging, by SkyScan). The research findings allowed the textural features of the bottom sediments throughout the section to be studied.

3.2.2. Radiocarbon Analyses

Tree bulk sediment samples from core ONG-2 and one bulk sediment sample from core ONG-5 were 14C dated at the Kőppen-Lab (Laboratory of Geomorphological and Paleogeographical Studies of Polar Regions and the World Ocean) of the Institute of Earth Sciences (Saint Petersburg State University, Saint Petersburg, Russia). A liquid scintillation method for measuring the 14C activity in benzene synthesized from carbon-containing samples was used. The details of the laboratory procedures were described by [13,14]. The calibration of 14C dating was conducted using CalPal2007_HULU (http://www.calpal-online.de). The Table 2 represents radiocarbon dates for selected intervals. The table includes information concerning the sample preparation step and results. Total organic carbon amount was obtained by loss-on-ignition method (LOI). Samples for radiocarbon dating were chosen based on maximum organic carbon content in intervals. Charcoal weight is the weight of pure carbon that is represented by charcoal after sample pretreatment stage.

3.2.3. Gas Analyses in Bottom Sediments

Headspace sampling (the vapor phase calibration method) under field conditions was used to identify gaseous hydrocarbons (GHC) composed of C1-C5 in the gas phase of the sediments. A 100 mL sample of the sediments was taken from the core with a syringe and placed into a 270 mL vial containing 120 mL of 5% NaCl solution. Intervals are shown in Table 3. Once closed, this vial was shaken for 3 h on a special rotating platform. The gas was transferred from the headspace bottle to the receiving vial by displacing it with an equal volume of water in a syringe. Compositional analysis of gaseous hydrocarbons (GHC) in the equilibrated gas phase of the bottom sediments was based on the gas chromatography method, using a Shimadzu GC 2014 chromatograph equipped with a flame ionization detector (FID). The carbon isotope composition (C13/C12) in CH4 was measured with an Agilent 6890 N GC (Agilent Technologies, Santa Clara, CA, USA) interfaced to a Finigan Delta S IRMS (Finigan is now part of Thermo Scientific, Bremen, Germany) using a Finigan GC-C II interface. The GC was equipped with a Molsieve column (12 m, 0.32 mm i.d.) and an injection valve. Samples were calibrated regularly against a certified standard, and the resulting isotopic signatures were reported in δ notation and per mil (‰) values vs. VPDB.

3.2.4. Mineralogical Analyses

Mineralogical analyses were carried out for the upper 40 cm at intervals of 1–2 cm at the Analytical Center of the Institute of Geology and Mineralogy, Siberian Branch of Russian Academy of Sciences. The mineral composition of the bottom sediments was determined by powder X-ray diffraction and IR spectroscopy. The samples were studied with an ARL X’TRA diffractometer (Thermo Electron Corporation, Waltham, MA, USA, CuKα radiation). The morphology and phase and chemical compositions of some minerals of the sediments were studied using a MIRA 3 Tescan SEM (Tescan, Brno-Kohoutovice, Czech Republic). The current modification of the equipment uses an Si (Li) energetic detector (OXFORD mark, Oxford 5 of 23 Instruments, Abingdon, UK).

4. Results and Discussion

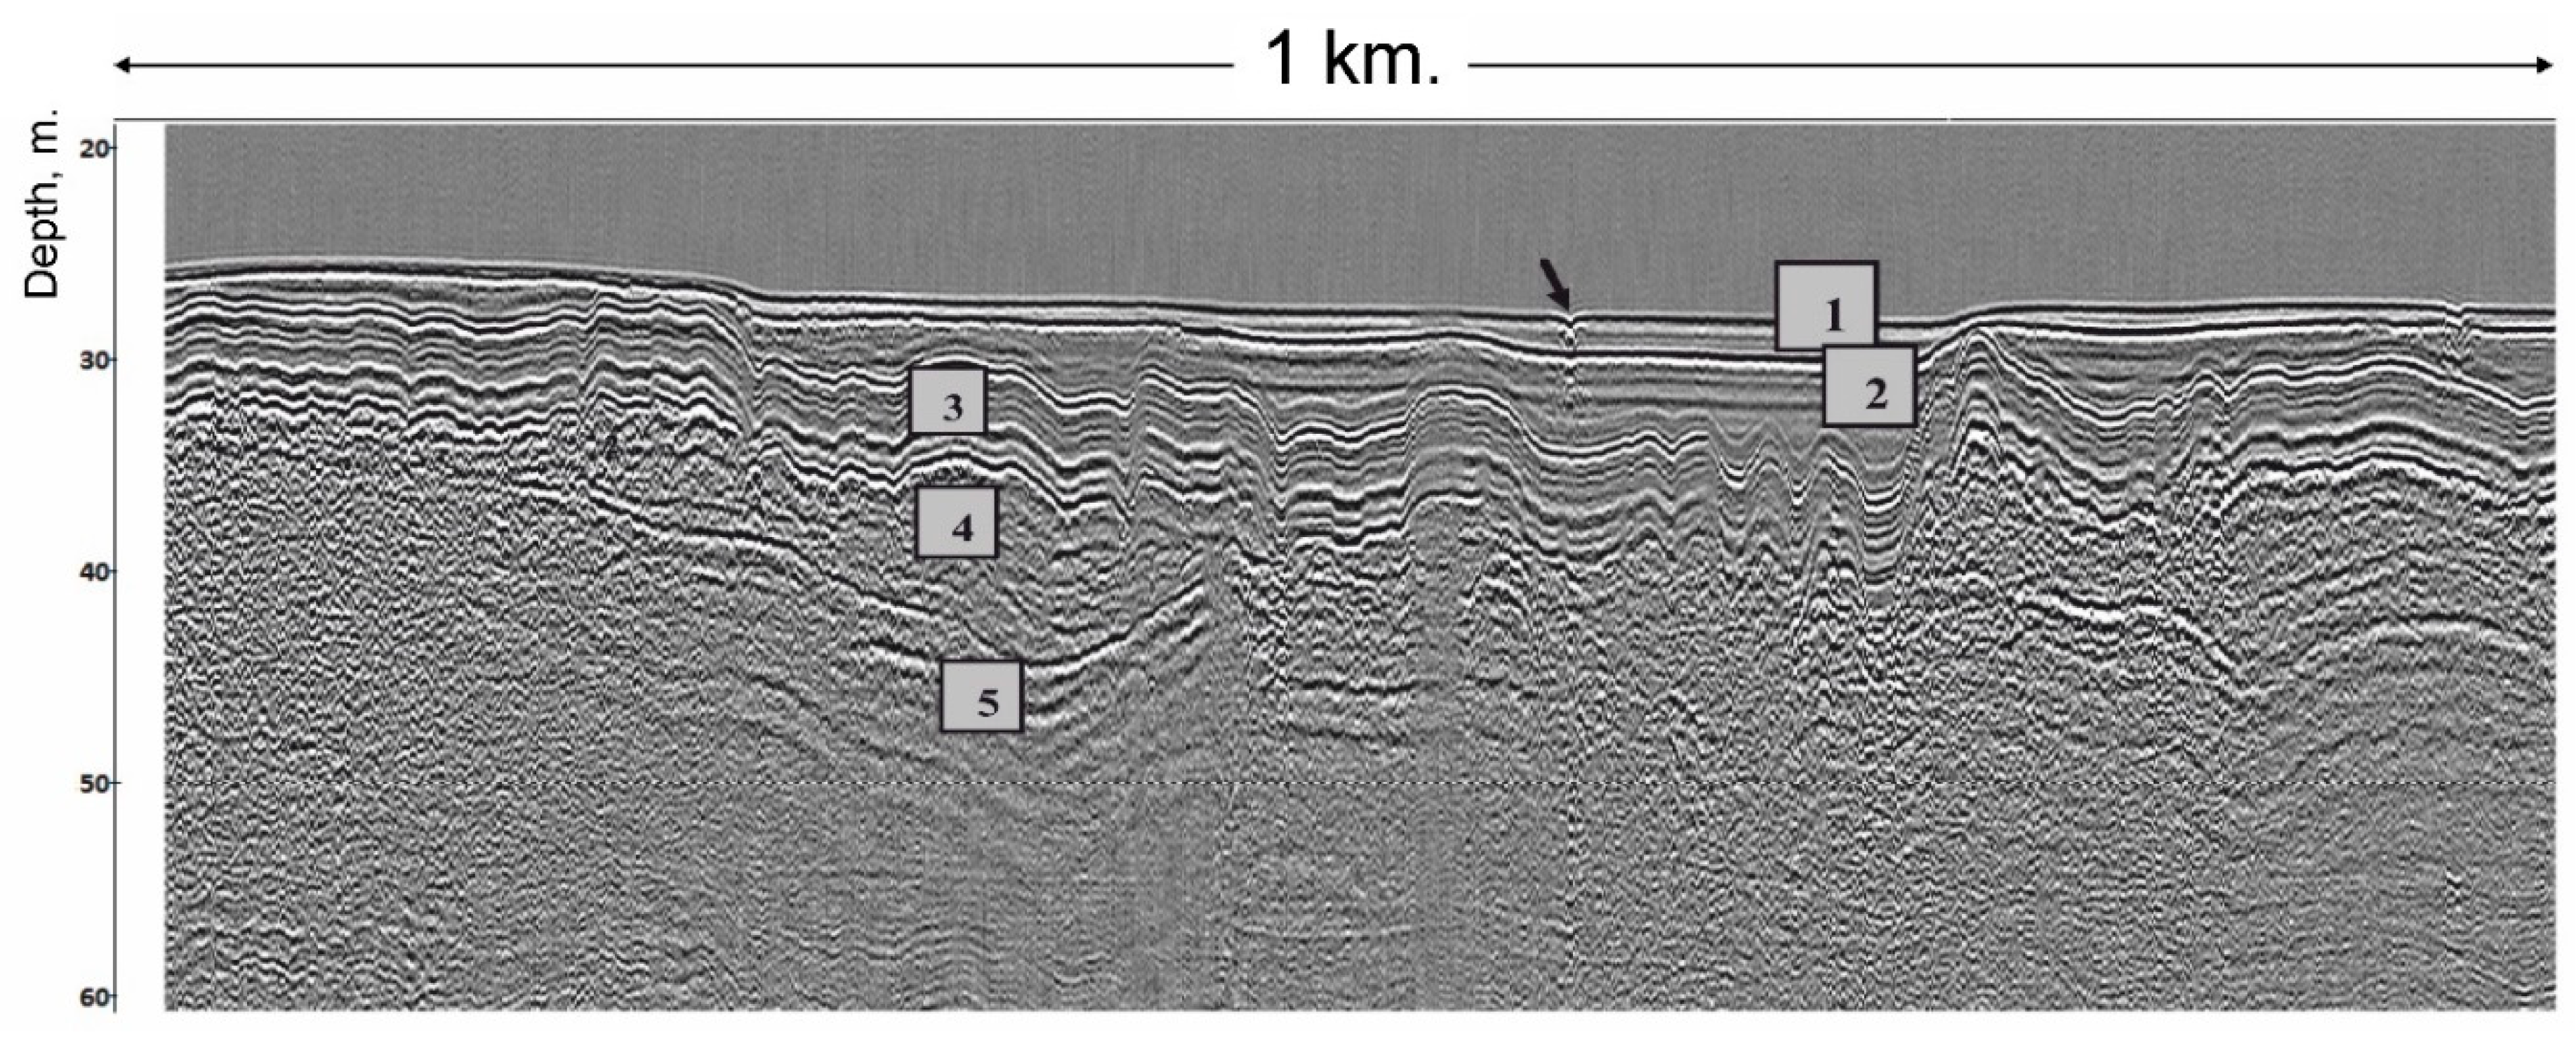
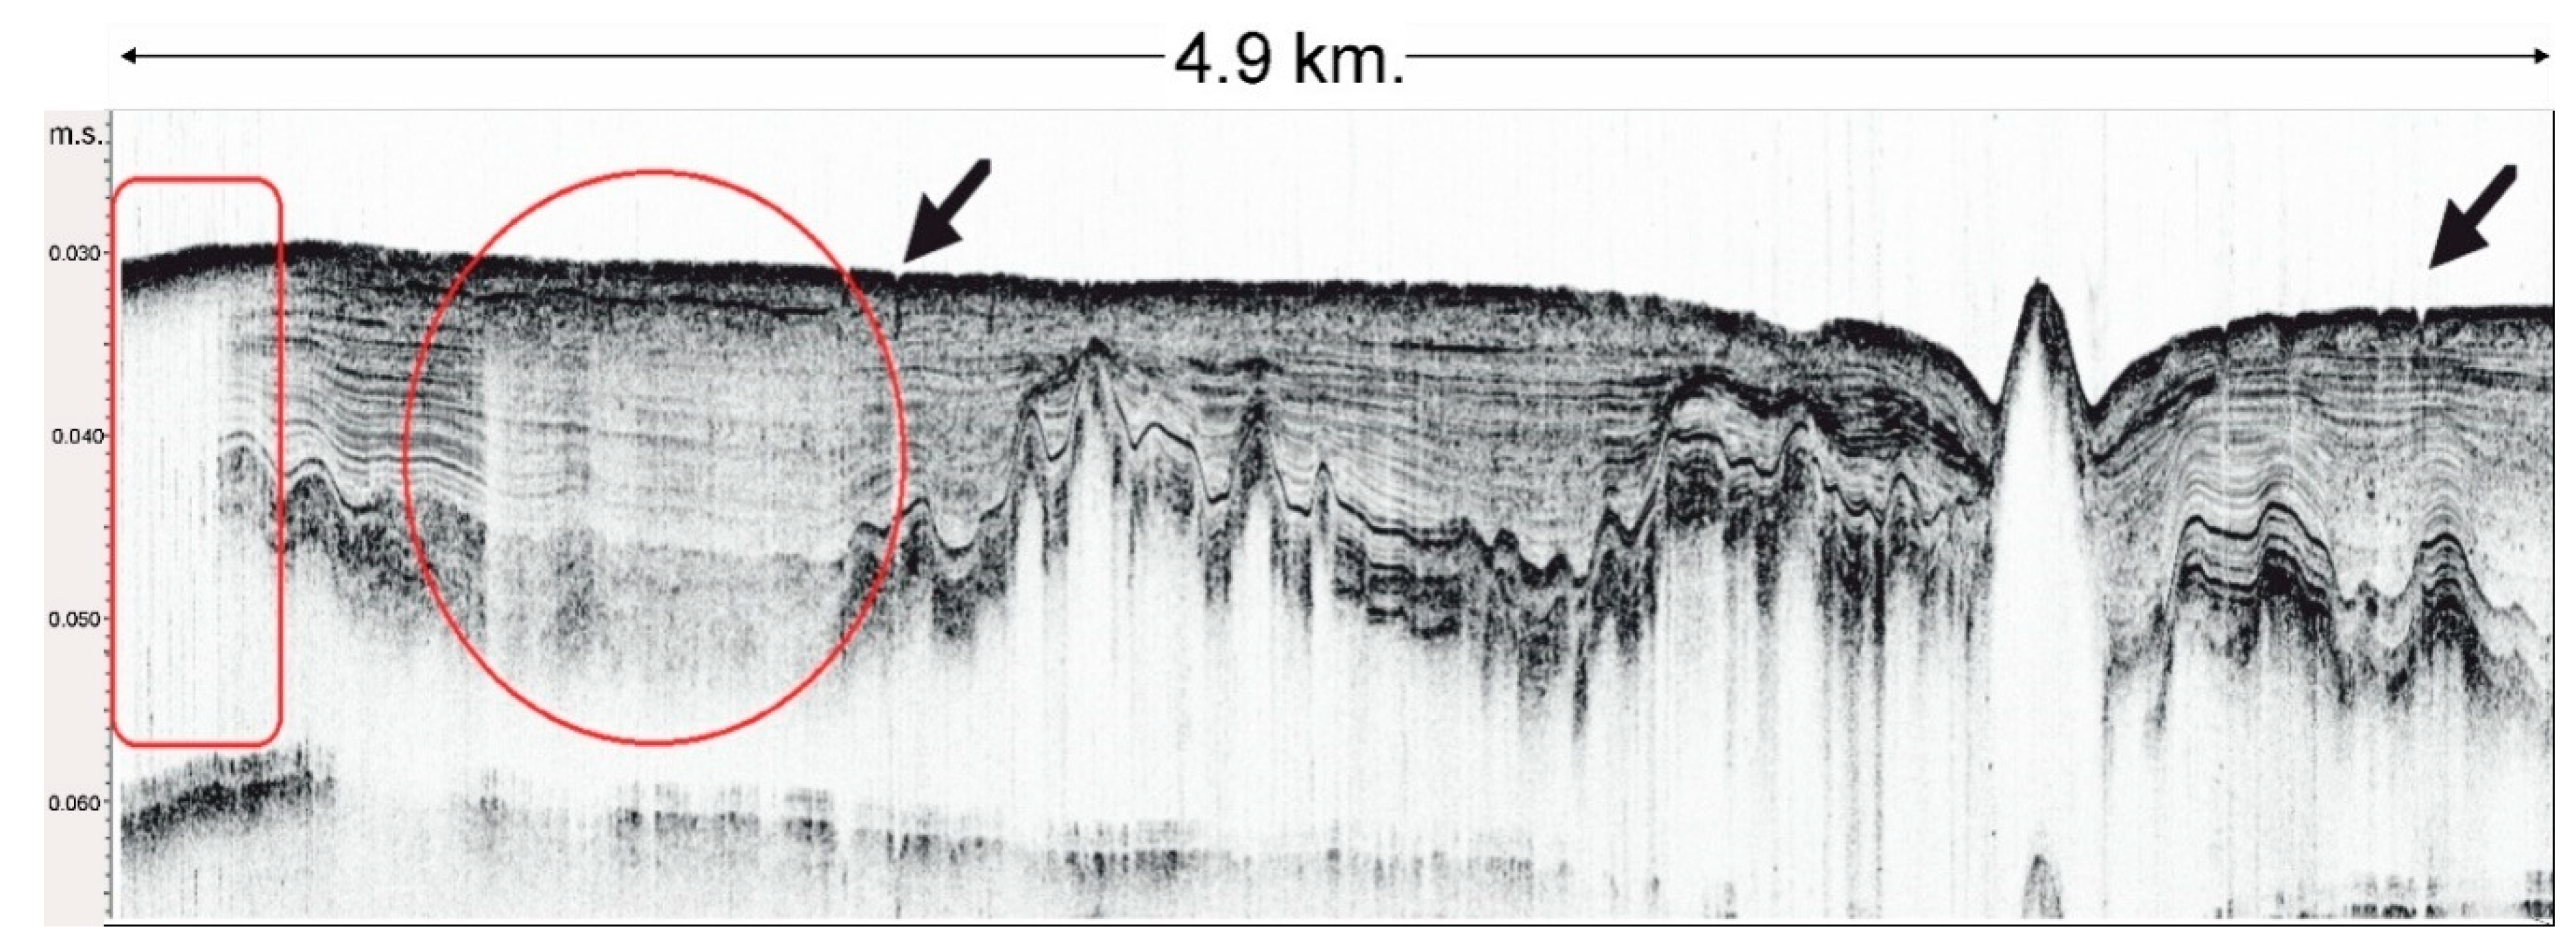
4.1. Seismic Profiles

Seismoacoustic profiling allows to characterize the full section of unconsolidated Quaternary sediments overlapping the bedrock of the Archaean and Proterozoic ages. At present, for all (marine and lake) large water basins of the NW Russia, a typical section of the Quaternary deposits, begins with the moraine of the Valday (Weichselian) glaciation (from the bottom to the top), which is overlain by limno-glacial and lacustrine (marine) sediments. The seismic horizons, which we segregated in seismograms, were compared by analogy with earlier studies on Lake Ladoga [7] with the seismostratigraphic horizons indicated above (Figure 2). It has been established that although the lake bottom topography of the Petrozavodsk Bay is typically subdued, the surface of the Pleistocene limno-glacial clays is uneven and covered by Holocene deposits with distinct cross-bedding (Figure 3).
Gas concentrations were also detected in Holocene sediments characterized by a great thickness. Often, near these clusters, steep ledges were found in the thickness of the pre-Holocene sediments (Figure 3). This may indicate that gas fluids can be supplied via these currently activated tectonic disturbances. This is confirmed by the presence of pockmarks at the bottom of the lake [15].

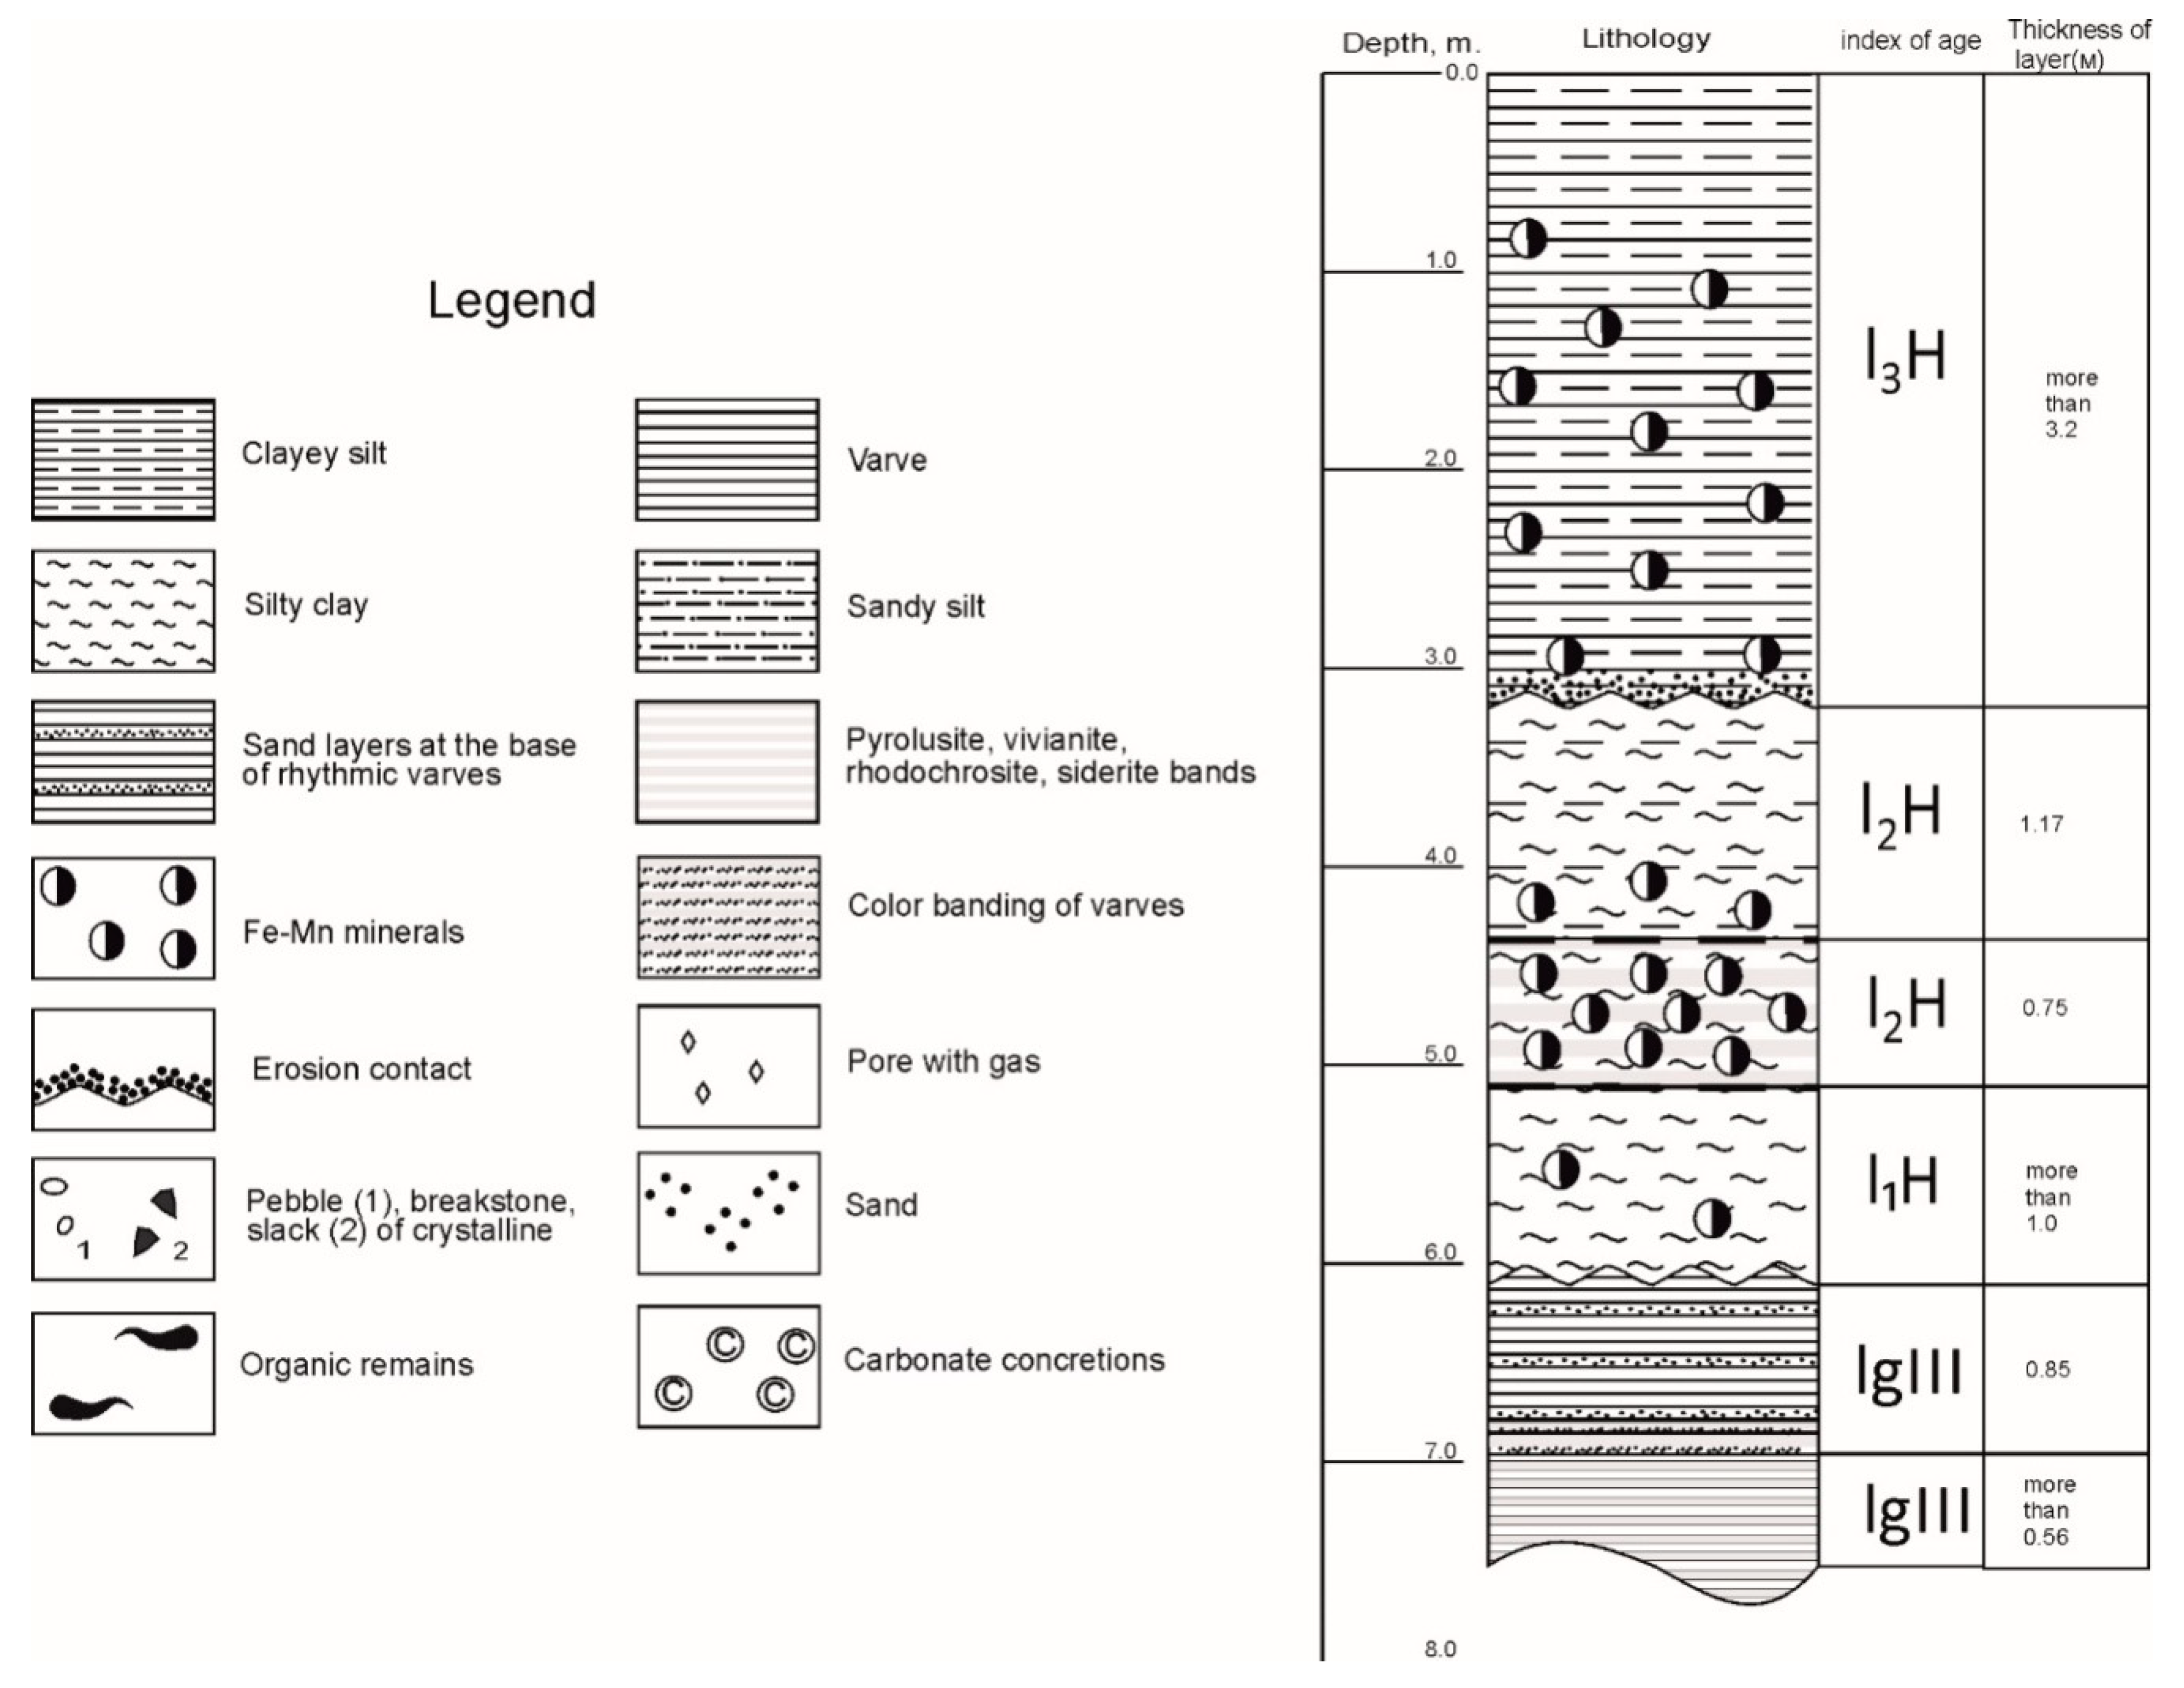
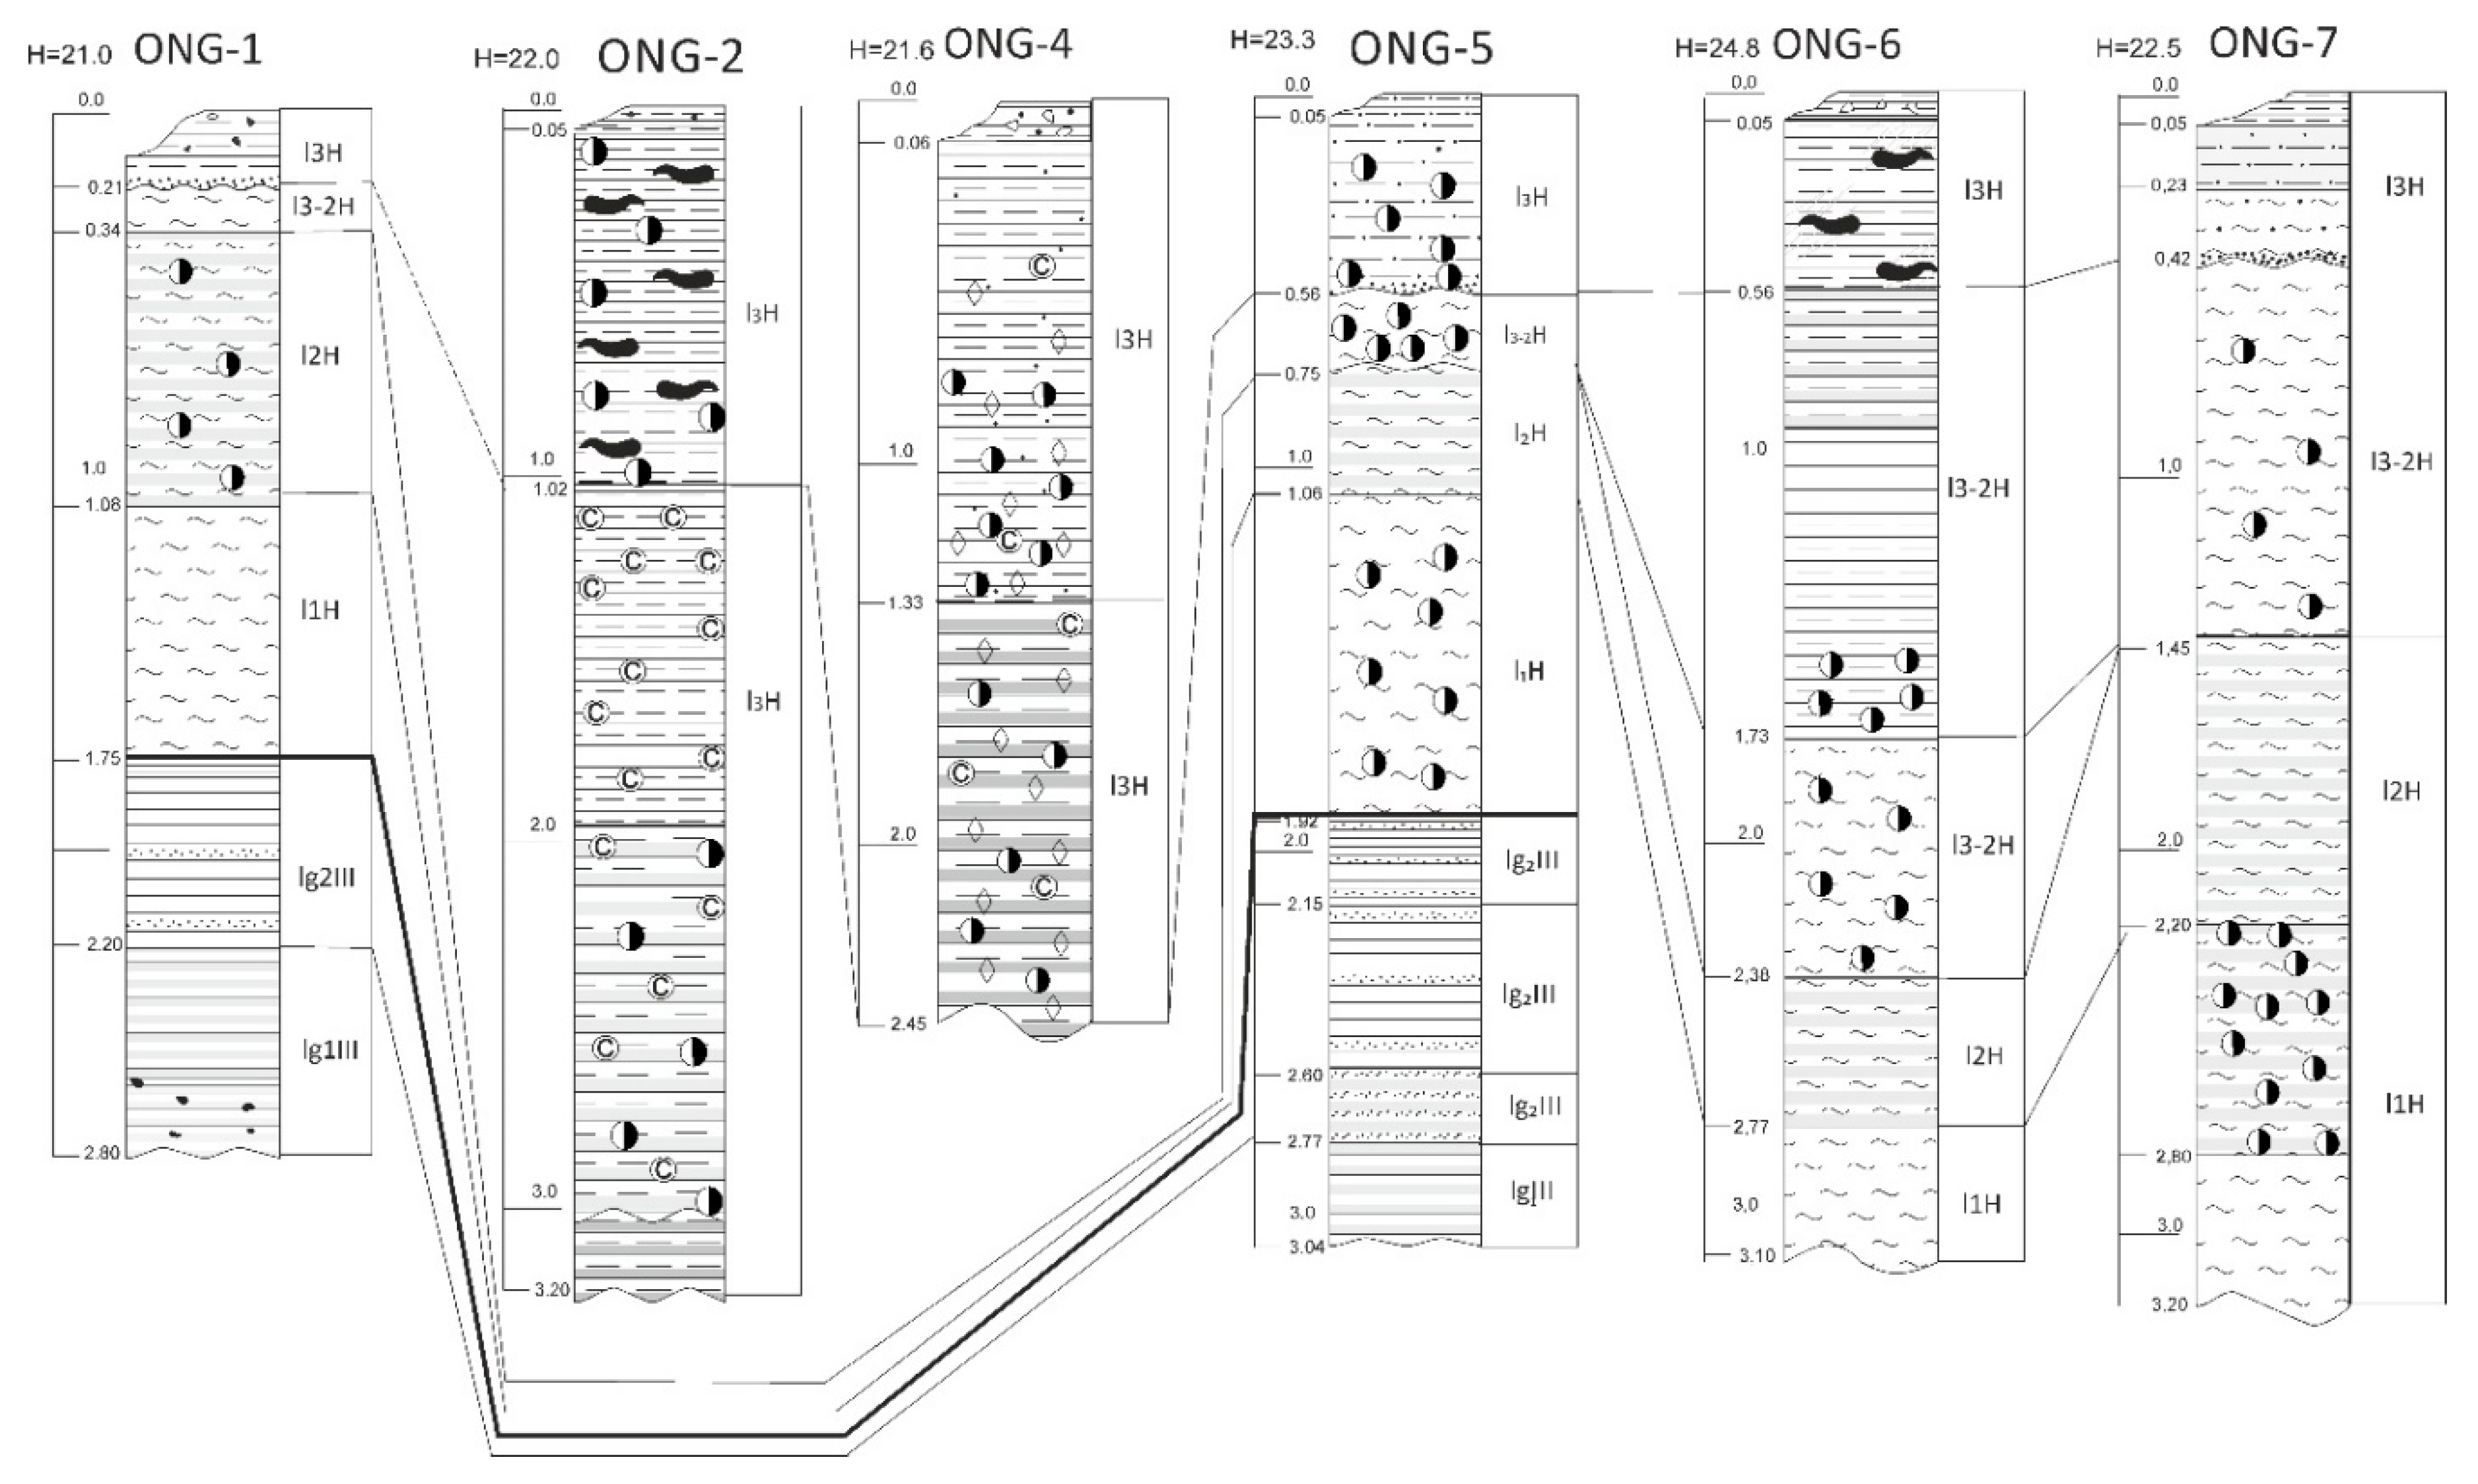
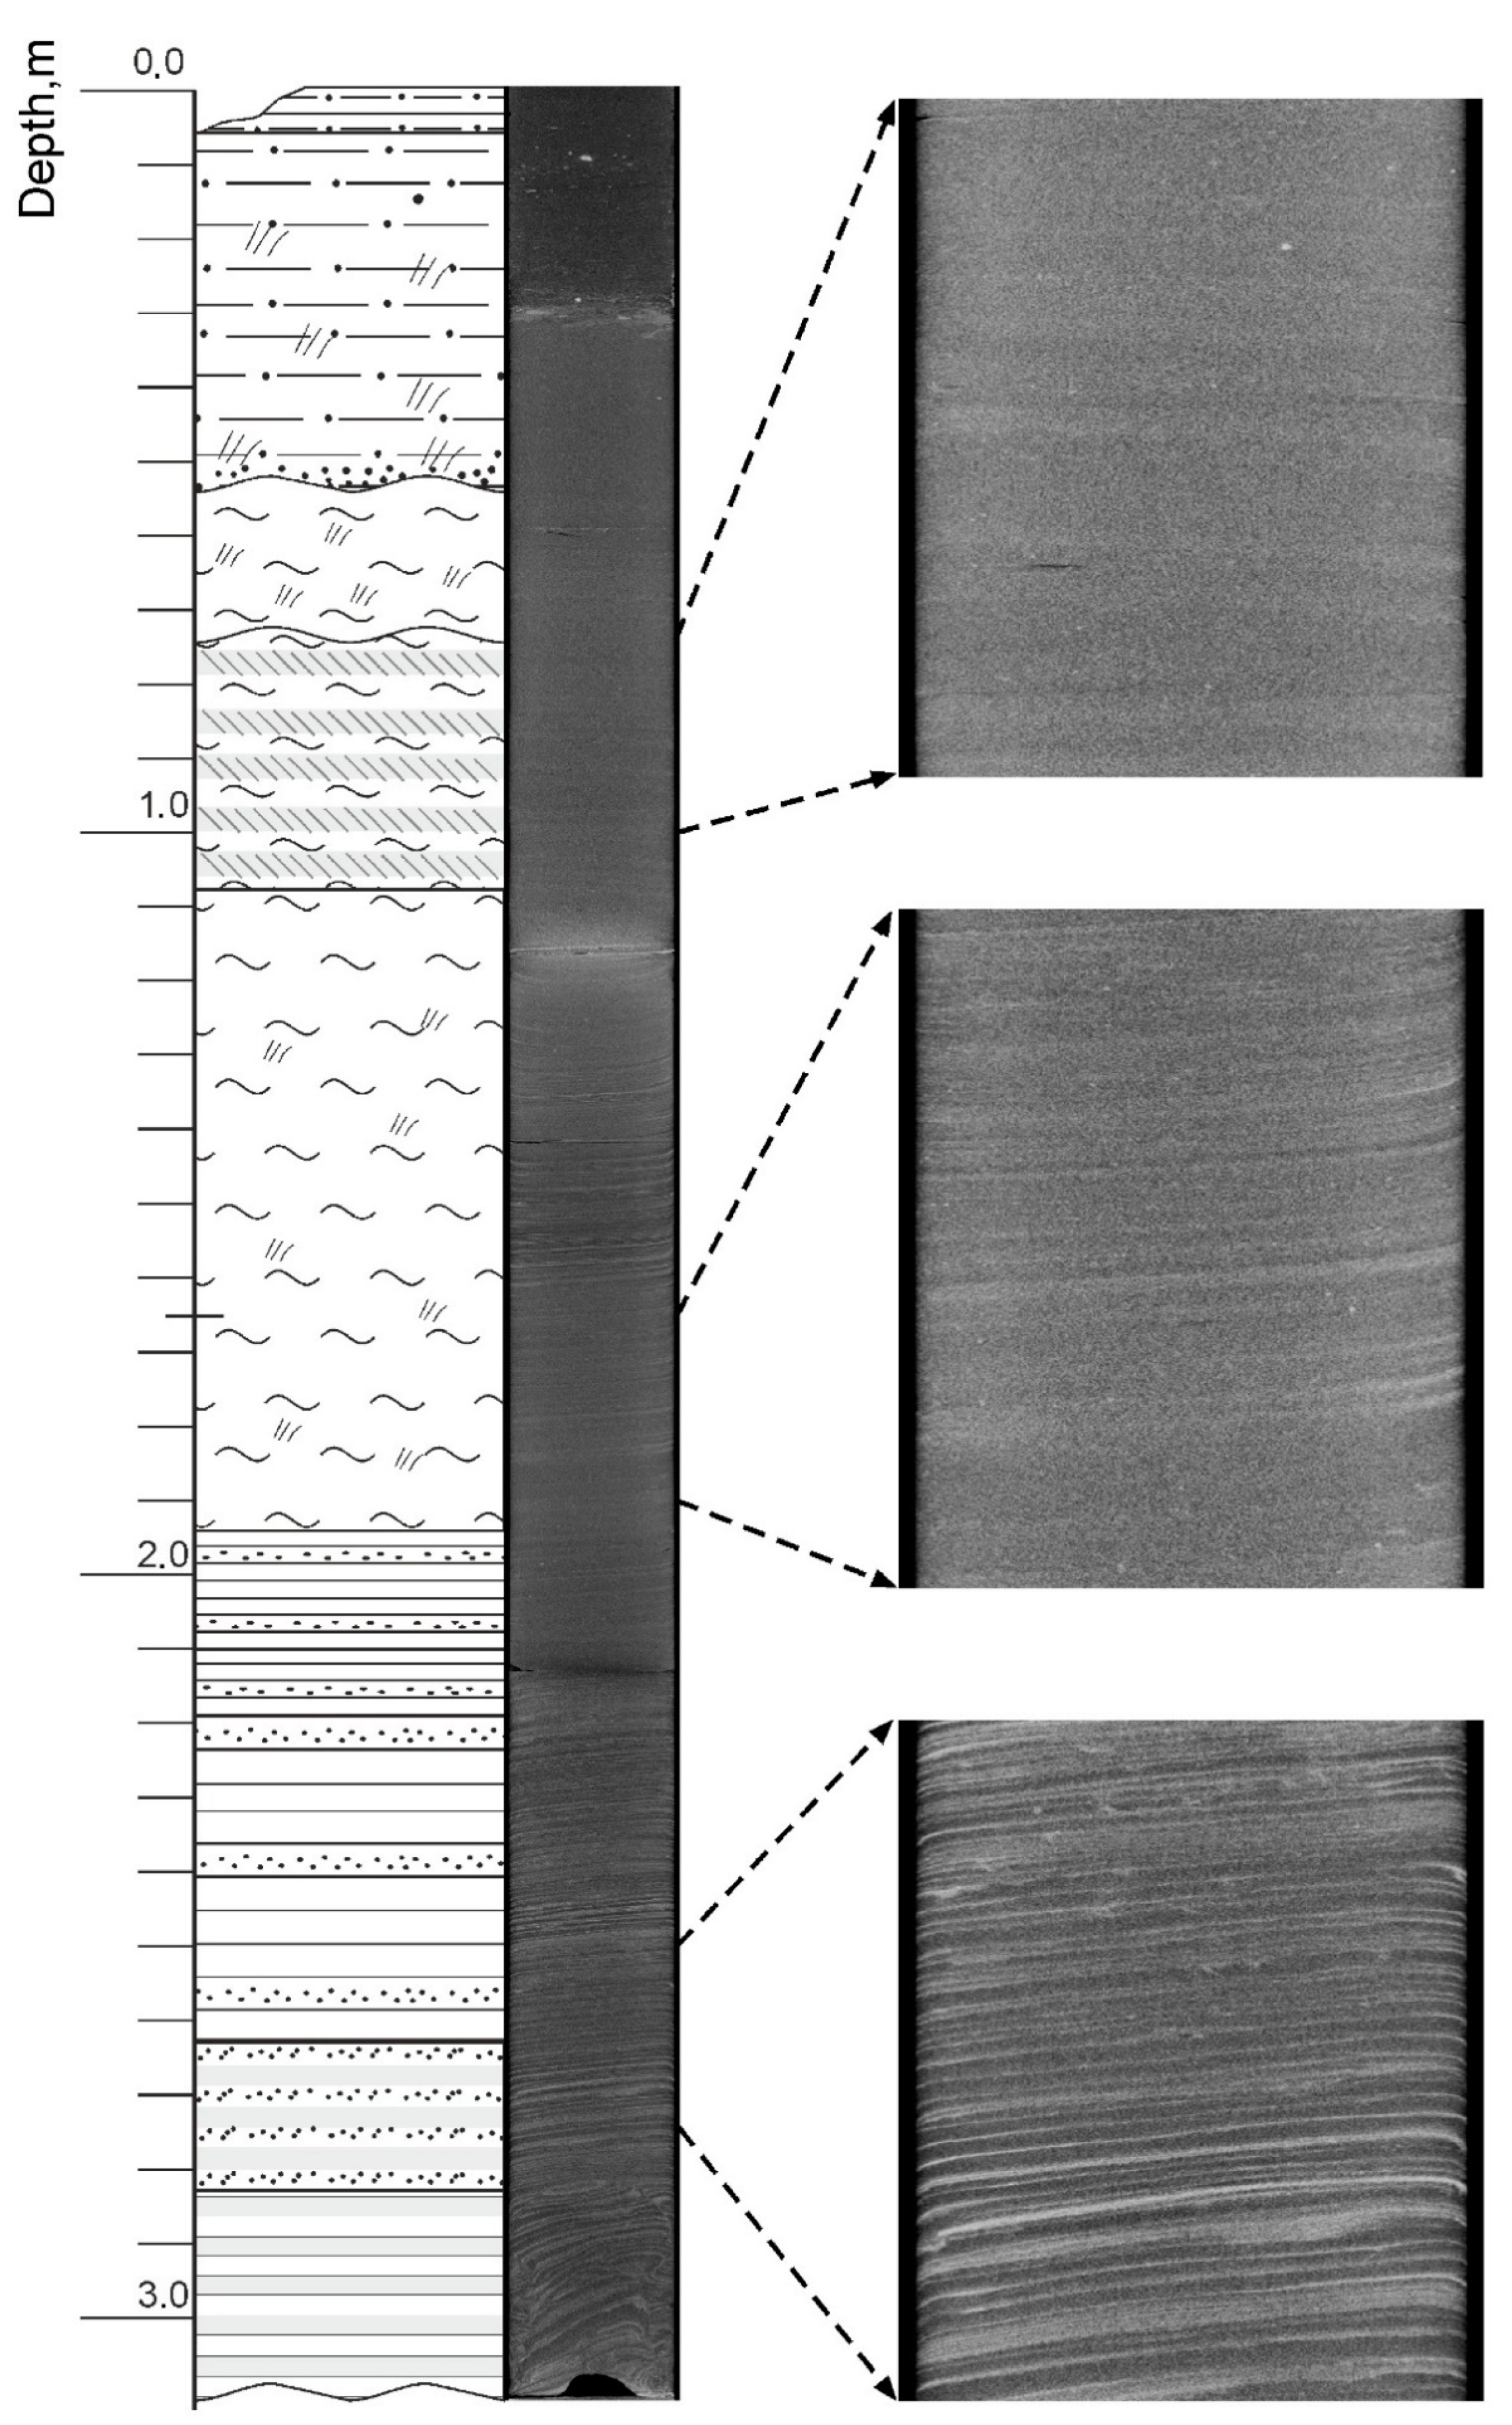
4.2. Stratigraphic Features

Information about stratigraphic features of the Quaternary deposits of the Petrozavodsk Bay was obtained as a result of geological sampling and bottom drilling. Currently, the official stratigraphic scheme of NW Russia [16] includes the following units, which builds up the bottom of the lakes (top to bottom):
  • Holocene lacustrine deposits—silt and sand (lH, where l—lacustrine)
  • Upper Pleistocene deposits of local Ice Lakes—varved clays (lgIII, where lg—limno-glacial)
  • Tills and fluvioglacial deposits of Upper Pleistocene—coarse sand with pebbles, clays with boulders, boulder loam (gIII; fIII, where g—glacial, f—fluvio-glacial)
According to coring and geological sampling in the Petrozavodsk Bay, recovered deposits were subdivided to 5 lithological units:
Lithological unit 1. Liquid silty-clay gyttja with organic remains, greenish-gray (Figure 4). Thickness of this unit—0.3–0.35 m. There is a zone of oxidation at the top of this unit, <1 cm thick. Sometimes, thickness of this unit may be less due to an underwater erosion. In the interval from 20 to 30 cm, there are thin layers of black, green, and fawn-colored minerals (rhodochrosite, siderite, Mn-Fe hydroxides). The number and distribution of microlayers in the cores are different. Further down this unit, silts and clays become denser and the layering becomes thinner and more distinct. The number of black bands in the sediment increases towards bottom of this unit, which is correlated with an increase of the organic matter [17].
Lithological unit 2. Gray and brown-gray silty-clay (Figure 5). The thickness of it varies from 0.2 to 1.1 m. This unit is denser than the overlying one. Authigenous minerals become more crystalized. Sediments are microlaminated. This can be seen in the tomographic image (Figure 13). Lamination is related to intercalation of bright and dark microlayers. The color of the layers on the tomogram is related to the iron content and sediment density. Towards the bottom sediments of this unit, the contrast of the layers on the tomogram becomes higher, and its thickness increases. The lower boundary is often regular, sharp, and sometimes it is eroded.
Lithological unit 3. Typical unlaminated clays or thin-laminated limno-glacial (varved) clays (Figure 6). The thickness varies from 0.1 to 1.5 m. In the uppermost part the gradation layering is seen clearly. Thickness of microvarves increases to the bottom. In some sediment sequences from central part of Lake Onego the thickness of varves varies from 1 to 1.5 cm. In this unit, there is a marking “pink” horizon with a thickness of 0.3–0.4 m. This microlaminated clays are called “pink clay layer” [5,8].
Lithological unit 4.Typical varved clays with graded layering with thickness up to 3–4 m (Figure 7). The thickness of a pair of layers reaches 7–10 mm (Figure 7). These deposits were discovered during sampling in the Central part of Lake Onego and in the Petrozavodsk Bay.
Lithological unit 5. Sandy clays or clayey sands with thickness up to 1 m. Gray, non-laminated, with coarse sand and pebbles. This unit was identified only in the Petrozavodsk Bay.
Lithostratigraphy of investigated deposits shown at Figure 8, and the correlation between the sediment cores shown at Figure 9.
According to data of previous studies [1,11], we can correlate all Lithological Units with geological horizons of NW Russia. Units 1 and 2 are related to Upper (1) and Lower (2) Holocene. Unit 3 correlates with limno-glacial deposits of the Upper Pleistocene. Unit 4 corresponds to limnoglacial deposits (Valday horizon) (Figure 4). More accurate information about age of Holocene deposits was gained from radiocarbon dating.
Lithological and seismo-stratigraphic units correlate well. Lithological unit 5 correlates with glacial horizon, which includes fluvio-glacial deposits. Lithological units 3 and 4 correlate with limno-glacial horizon, which was diagnosed by seismic (seismic-acoustic) profiling where the significant feature is seismic layering, which gets in line with layering of the deposits. Lithological units 2 and 1 are not expressed on seismic profiles (Figure 2 and Figure 3).

4.3. Radiocarbon Dating
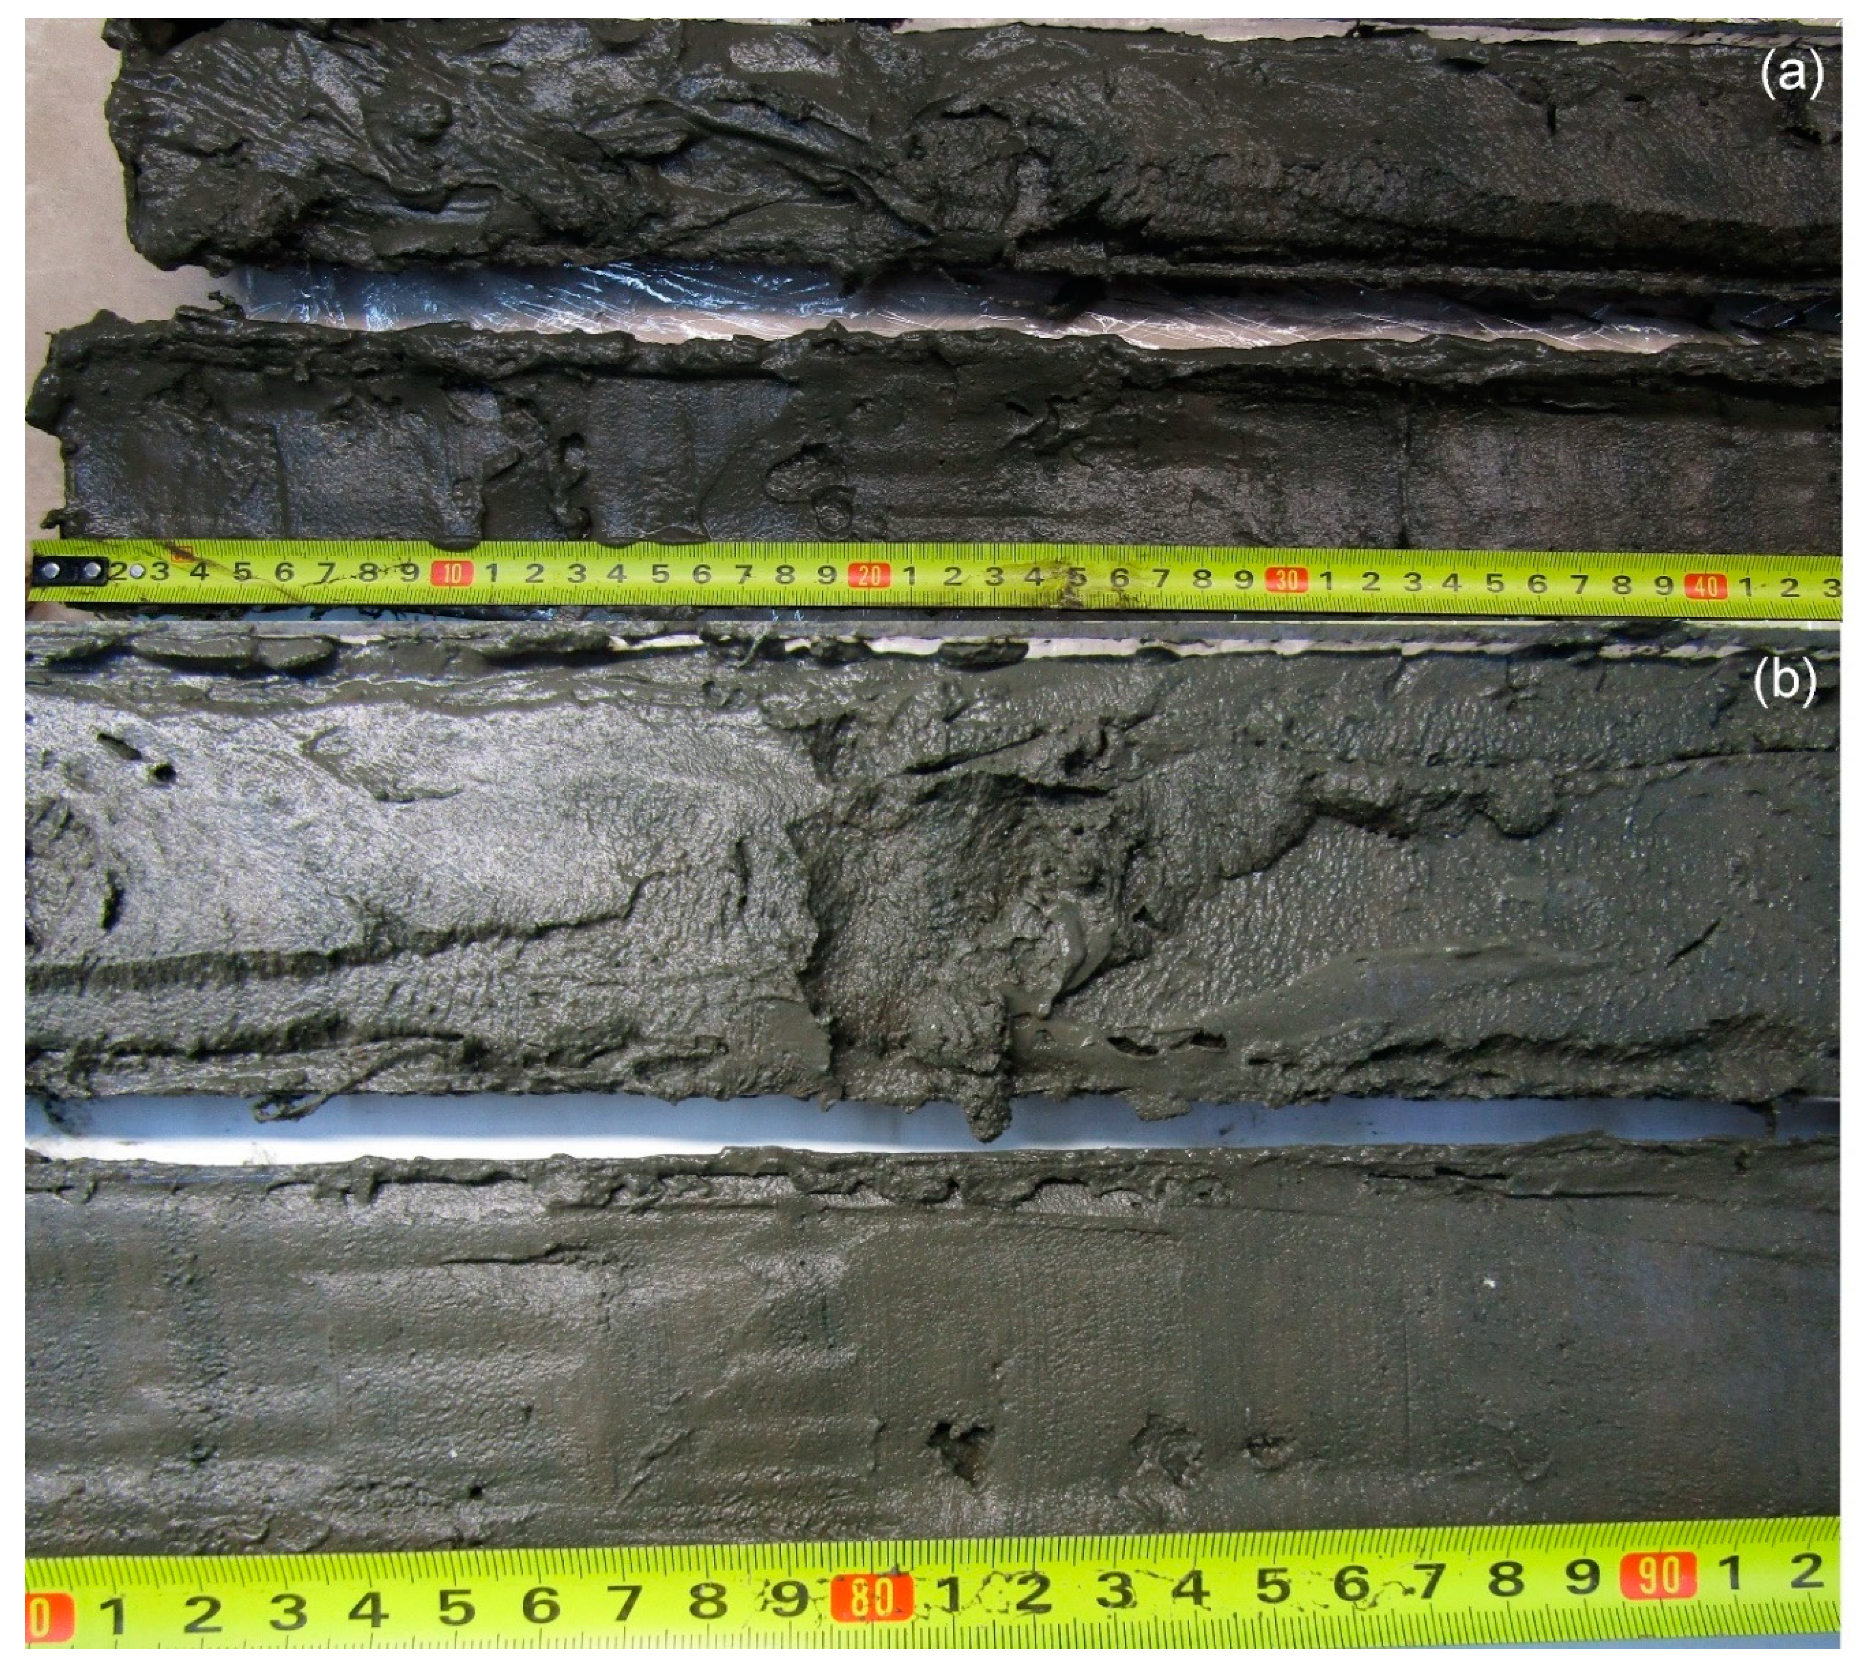
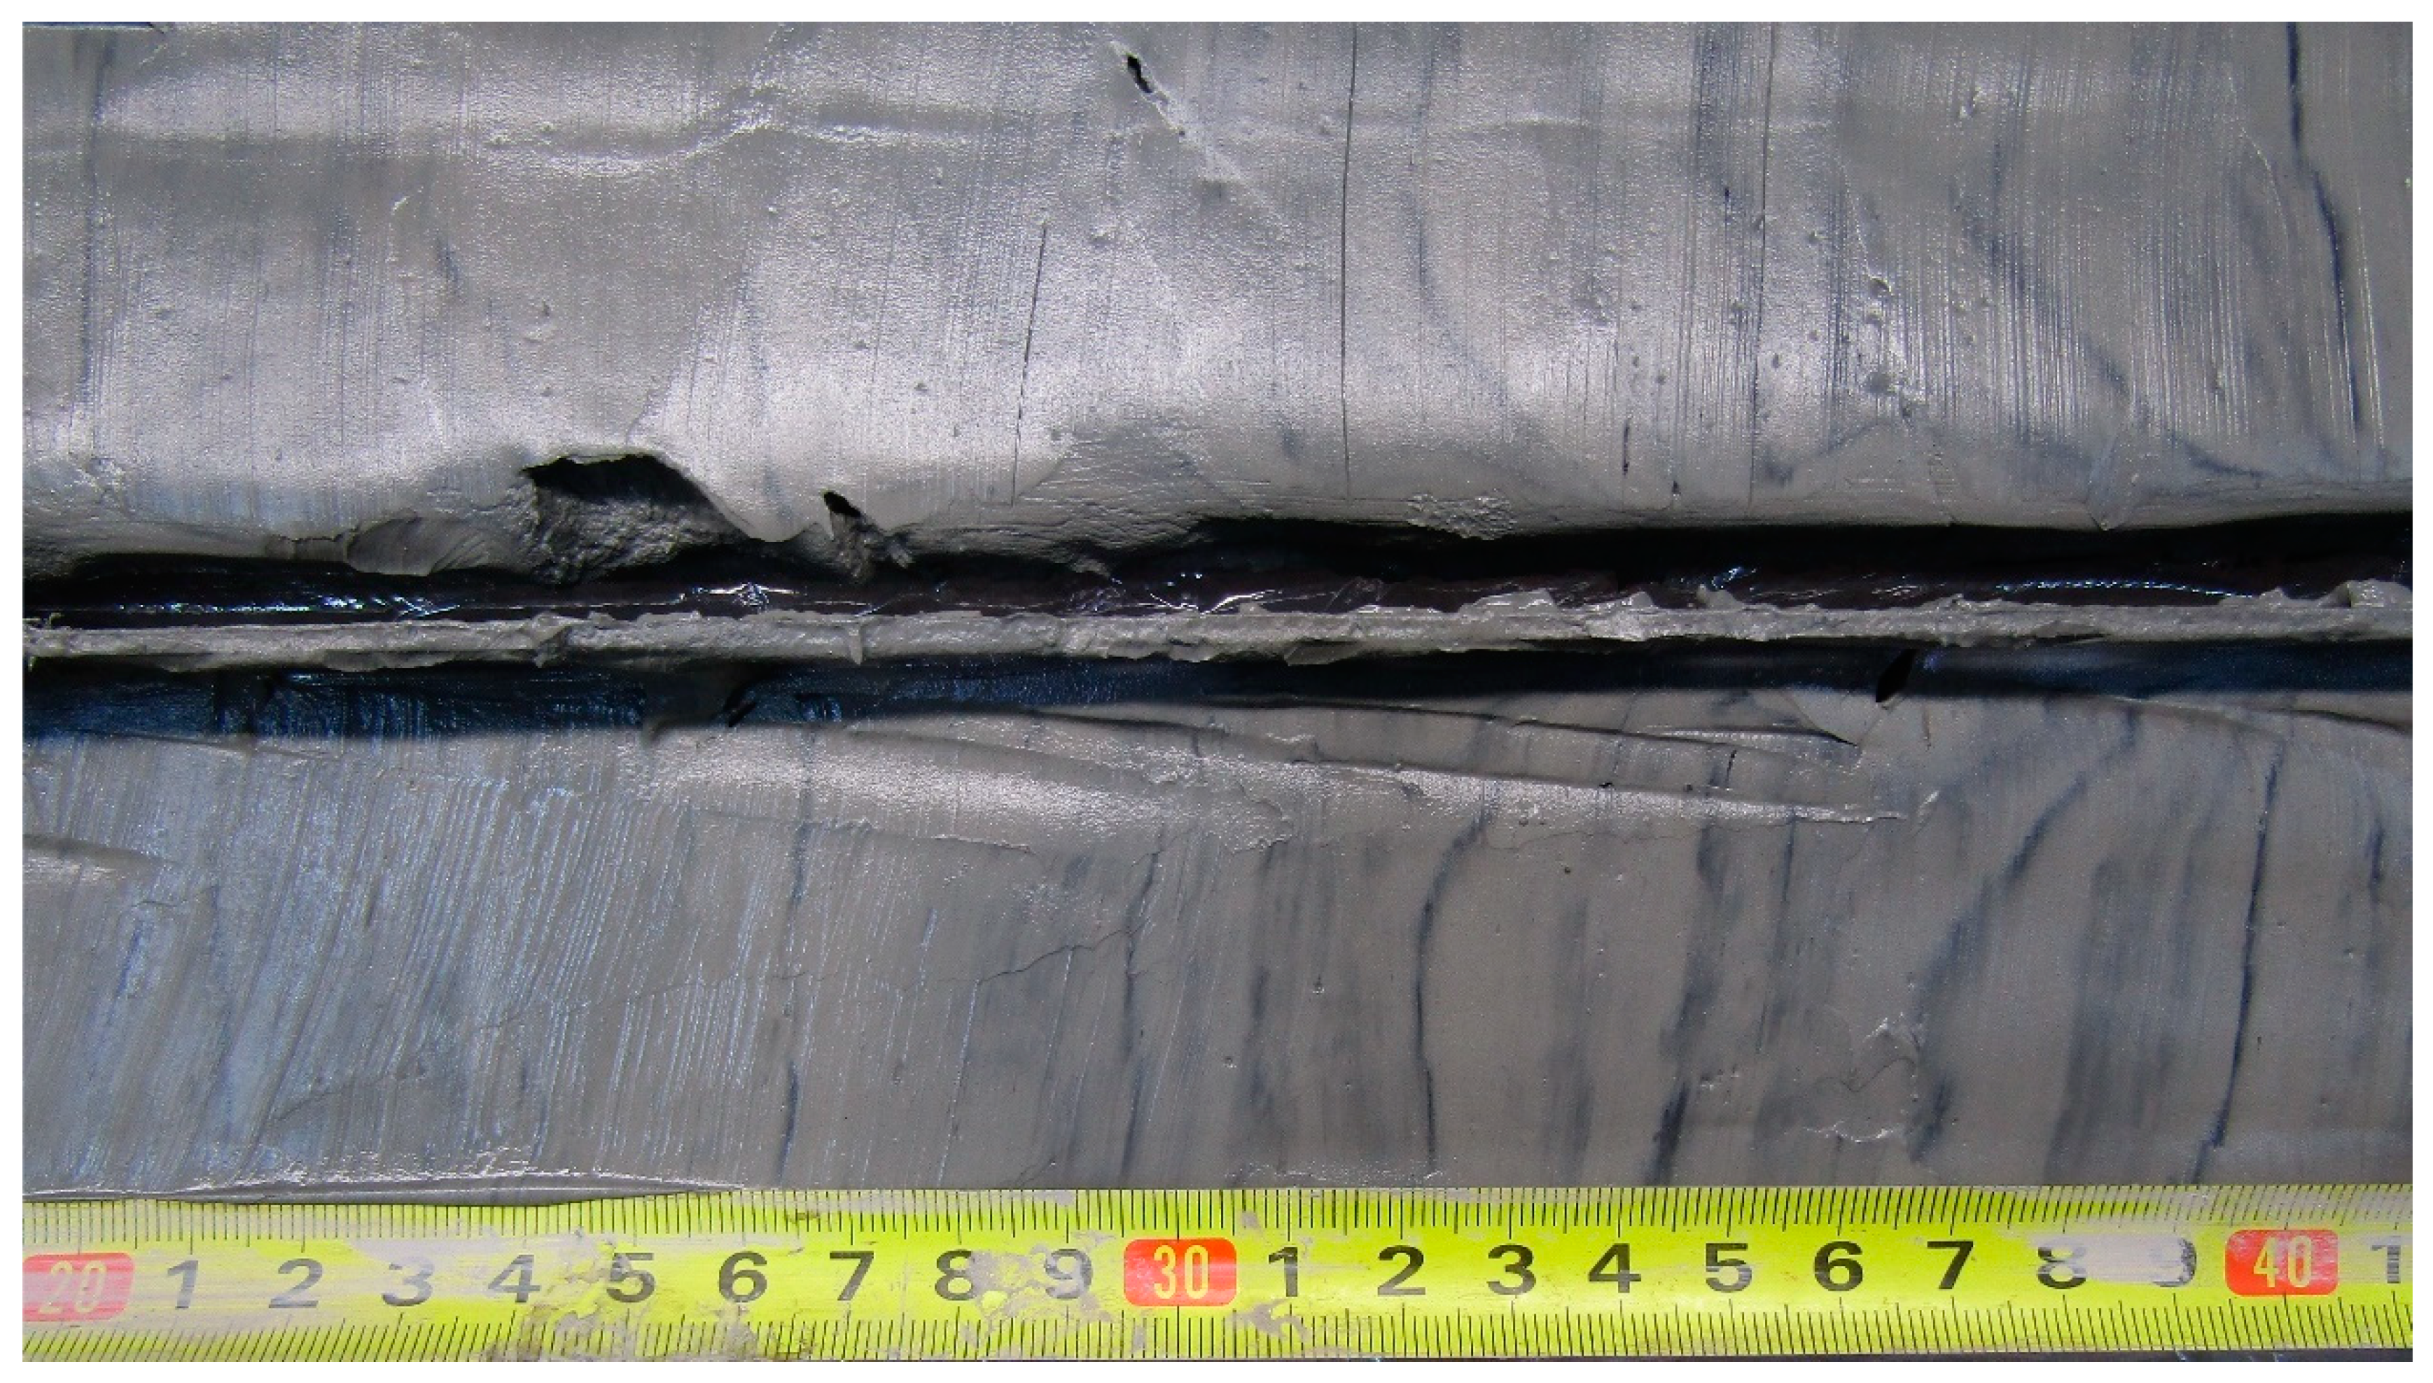
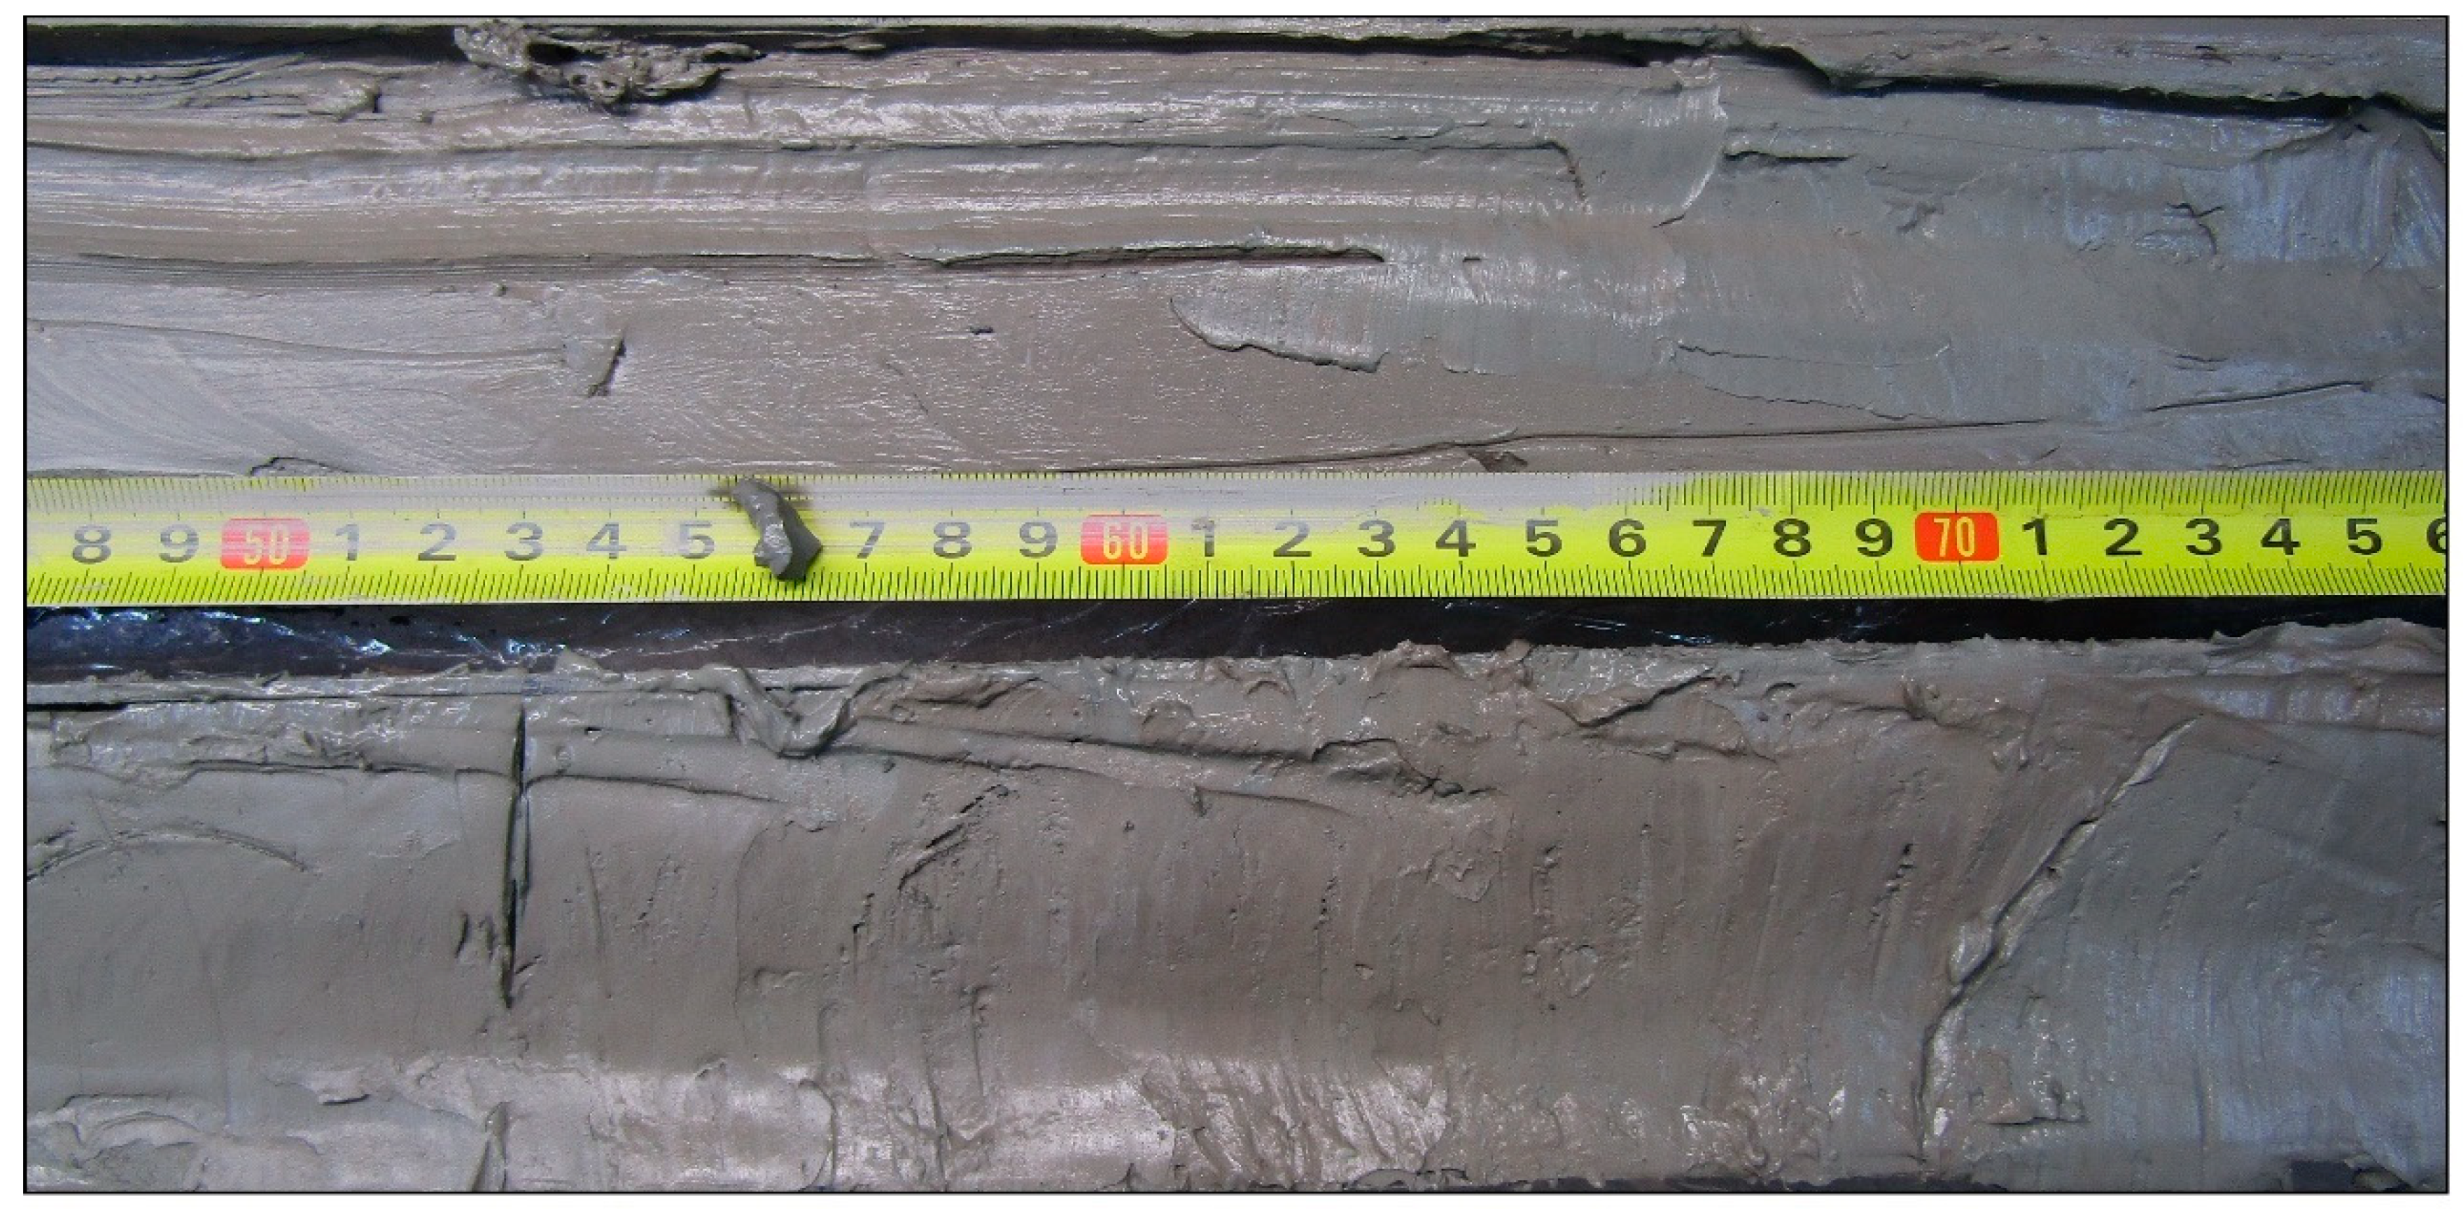
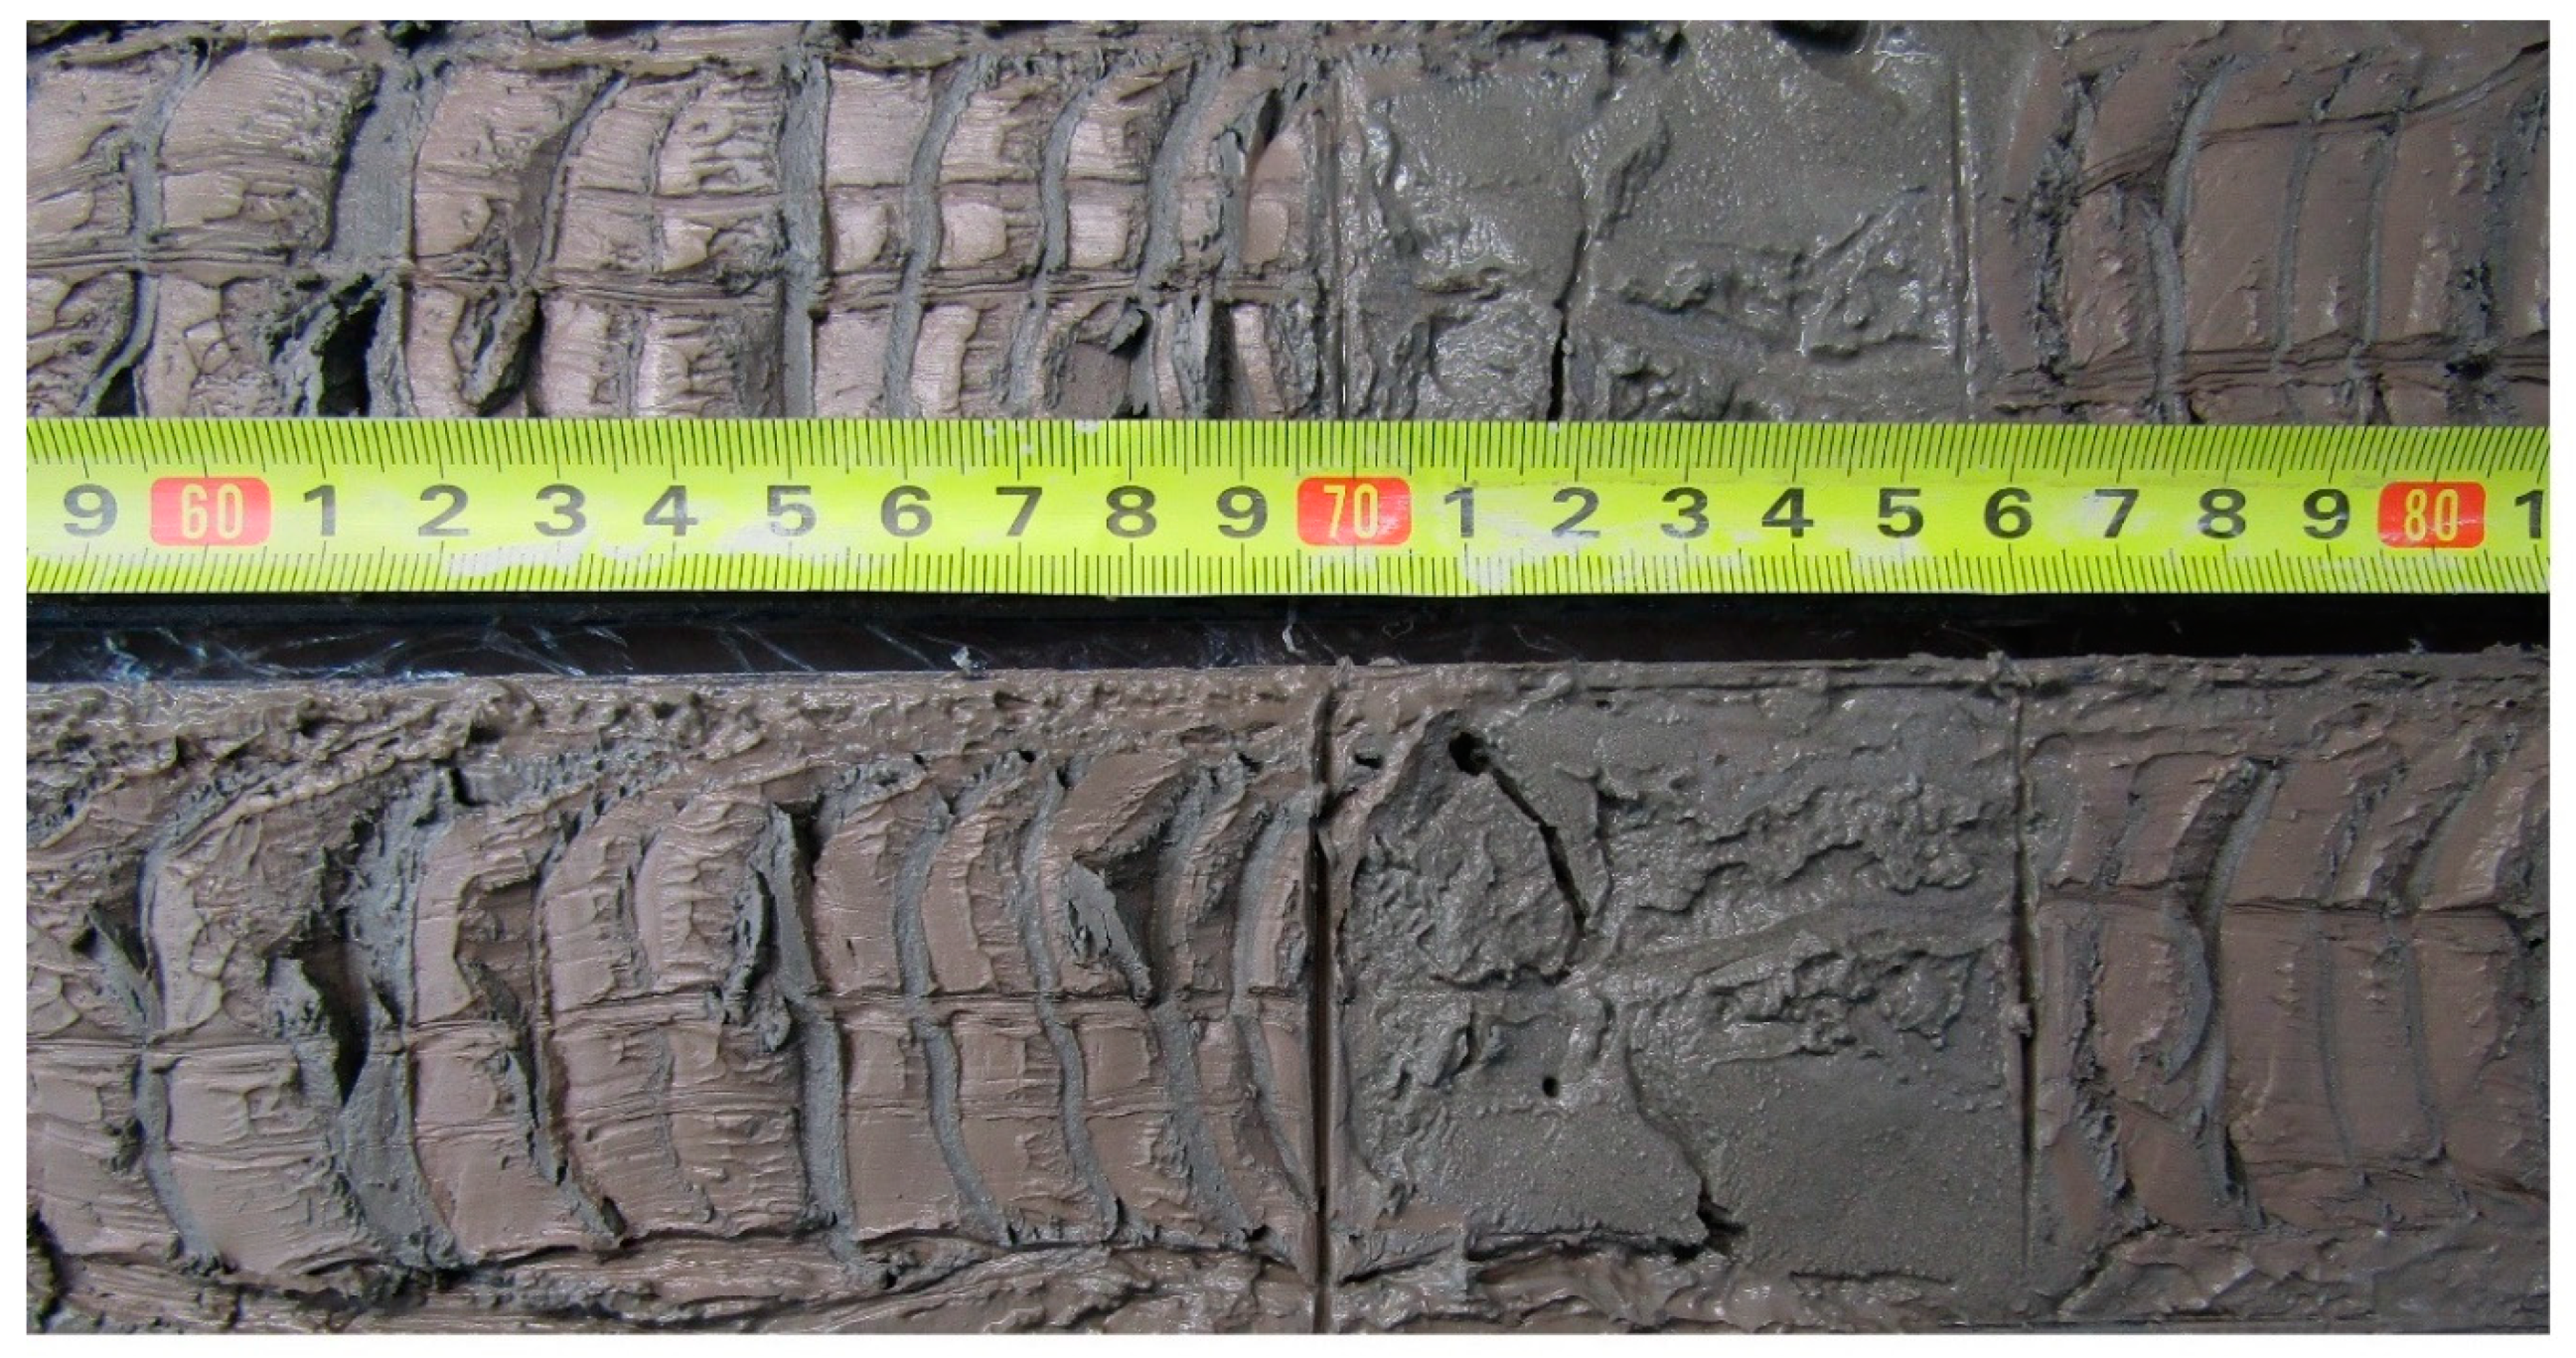
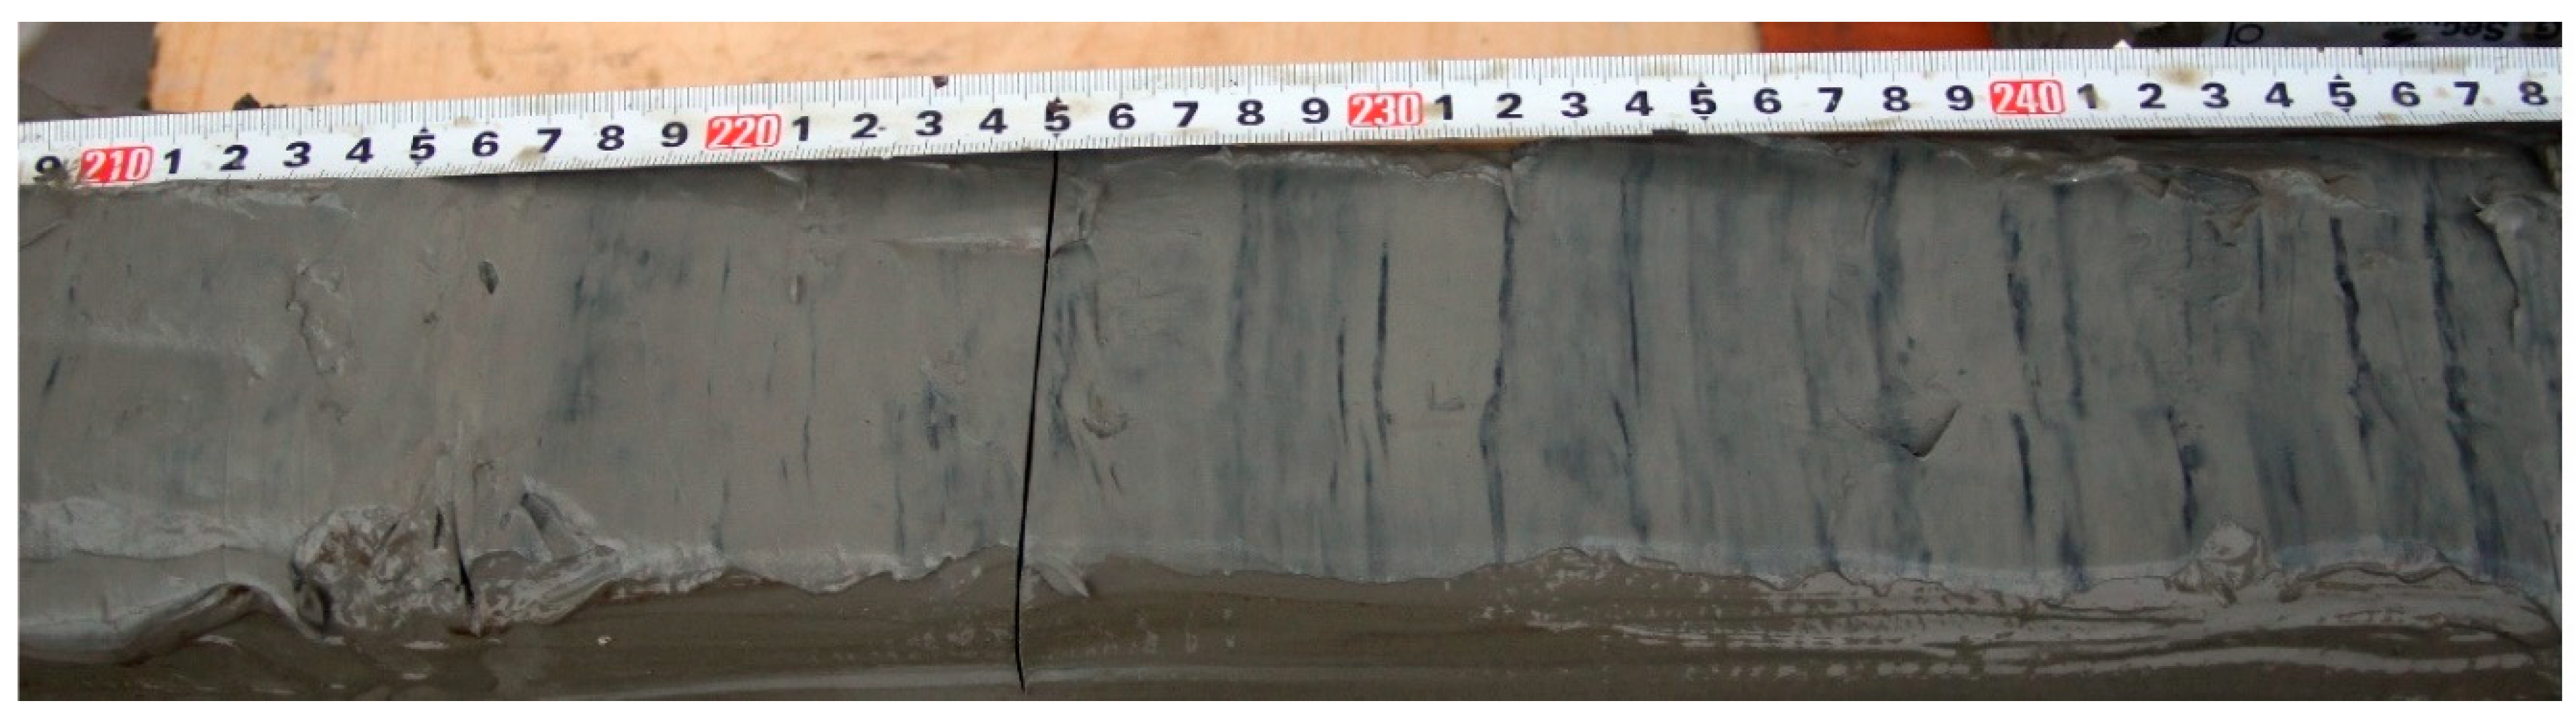
Sediment cores ONG-2 and ONG-5 were radiocarbon dated (Figure 10). Radiocarbon absolute dates were determined from bulk organic matter. It was only present in sufficient quantities in the part of the studied sediment cores (Table 2).
The sedimentation rates were based on radiocarbon dating of bottom sediments from ONG-2 core. At interval from 0.5 m down to 1.65 m, the estimated sedimentation rate is estimated ~1.1 mm/year. This speed is slightly higher than previously calculated for Lake Ladoga (0.4 mm per year) [4]. Such fast sedimentation is not peculiar for huge and deep lakes. High sedimentation rates in the Ladoga and Onega lakes occurred during the late glacial period, when large subglacial lakes existed in their place and a huge amount of detritus and suspended material came from the glacier and from the open areas around the lakes that were not covered with soil and vegetation [4]. One explanation for the high rate of sedimentation may be the fact that the Petrozavodsk Bay is a receiver of water from the River Shuya.
A fairly old date (4680 ± 260 yr. cal. BP) from the upper horizon in column ONG-5 may be associated with either erosion of the upper horizons of sediments underwater current or aging. Possibly, the samples from interval of 45–50 cm (ONG-5) are contaminated by older carbon. This contamination could have occurred during the core manipulations in the laboratory or by natural isotope fractionation during increasing lake water mixing.
Concerning ONG-5 core the date of 4680 ± 260 cal. BP belongs to the end of Atlantic period and it is confirmed by published data. Filimonova and Lavrova (2017) [18] established the Atlantic-Subboreal transition around 4700 cal. BP in their overview of data obtained for Lake Onega.

4.4. Lamination

Black- (complex oxides/hydroxides of Mn and Fe), green- (vivianite), and cream-colored (rhodochrosite and siderite) microlayers can be observed in gray-green mud (Figure 11, lithological units 1 and 2) [17]. The number of microlayers and their distribution in different cores varies. Importantly, the redox barrier zone in the upper parts of the sediment columns from the areas with an increased gas concentration coincides with the sediment–water interface (a slightly oxidized layer <1 cm thick). We identified this upper horizon as belonging to the Late Holocene. Its thickness is 20–35 cm.
The underlying horizons usually contain the same sediments, but with more numerous thin layers composed of manganese oxides and hydrous oxides, and vivianite, rhodochrosite, and siderite formations with various morphologies and degrees of crystallinity, forming banded diagenetic textures (Figure 11). In addition, sediments change their consistency: they become more viscous, soft, and highly plastic. Usually, this is observed in the cores at a depth of 20–30 cm. The thickness is no less than 1 m.
The contact between the Late Holocene and underlying the Middle Holocene sediments is often unconformable. This indicates a break in sedimentation at this time. Erosion at the base of the upper horizon is clearly visible in the tomogram (Figure 12). Due to organic matter enrichment, iron and manganese minerals form in the sediments. These features indicate an increase in the supply of organic matter to the lake basin. Our previous studies on Lake Ladoga [4] have shown that this process is usually associated with a climatic optimum of the Holocene. We can also assign the same age to the deposits of the second unit.
The lower horizon consists of gray and brownish-gray silty-clay of a homogeneous fluid consistency, although slightly more consolidated compared with the overlying sediments. As is the case with sediments of Lake Onego, more carefully examined from a stratigraphic point of view [4], these deposits relate to the units of the Early Holocene (Preboreal and Boreal periods). In sediment core ONG-5 a microvarved clay unit was described at a depth of 1.74 m beneath the Holocene gyttja units. This layering is very clearly demonstrated in the tomogram (Figure 12).
Microvarves are reflected in the alternation of more and less light and dark X-ray absorbing interlayers (due to the presence of iron minerals and/or a higher bulk density). As one moves further down the section, the contrast between the layers becomes more visible, while their thickness slightly increases. A decrease in the thickness of layers is probably related to the withdrawal of the ice margin from the varved clay accumulation area. The total thickness of exposed varved clays is about two meters.

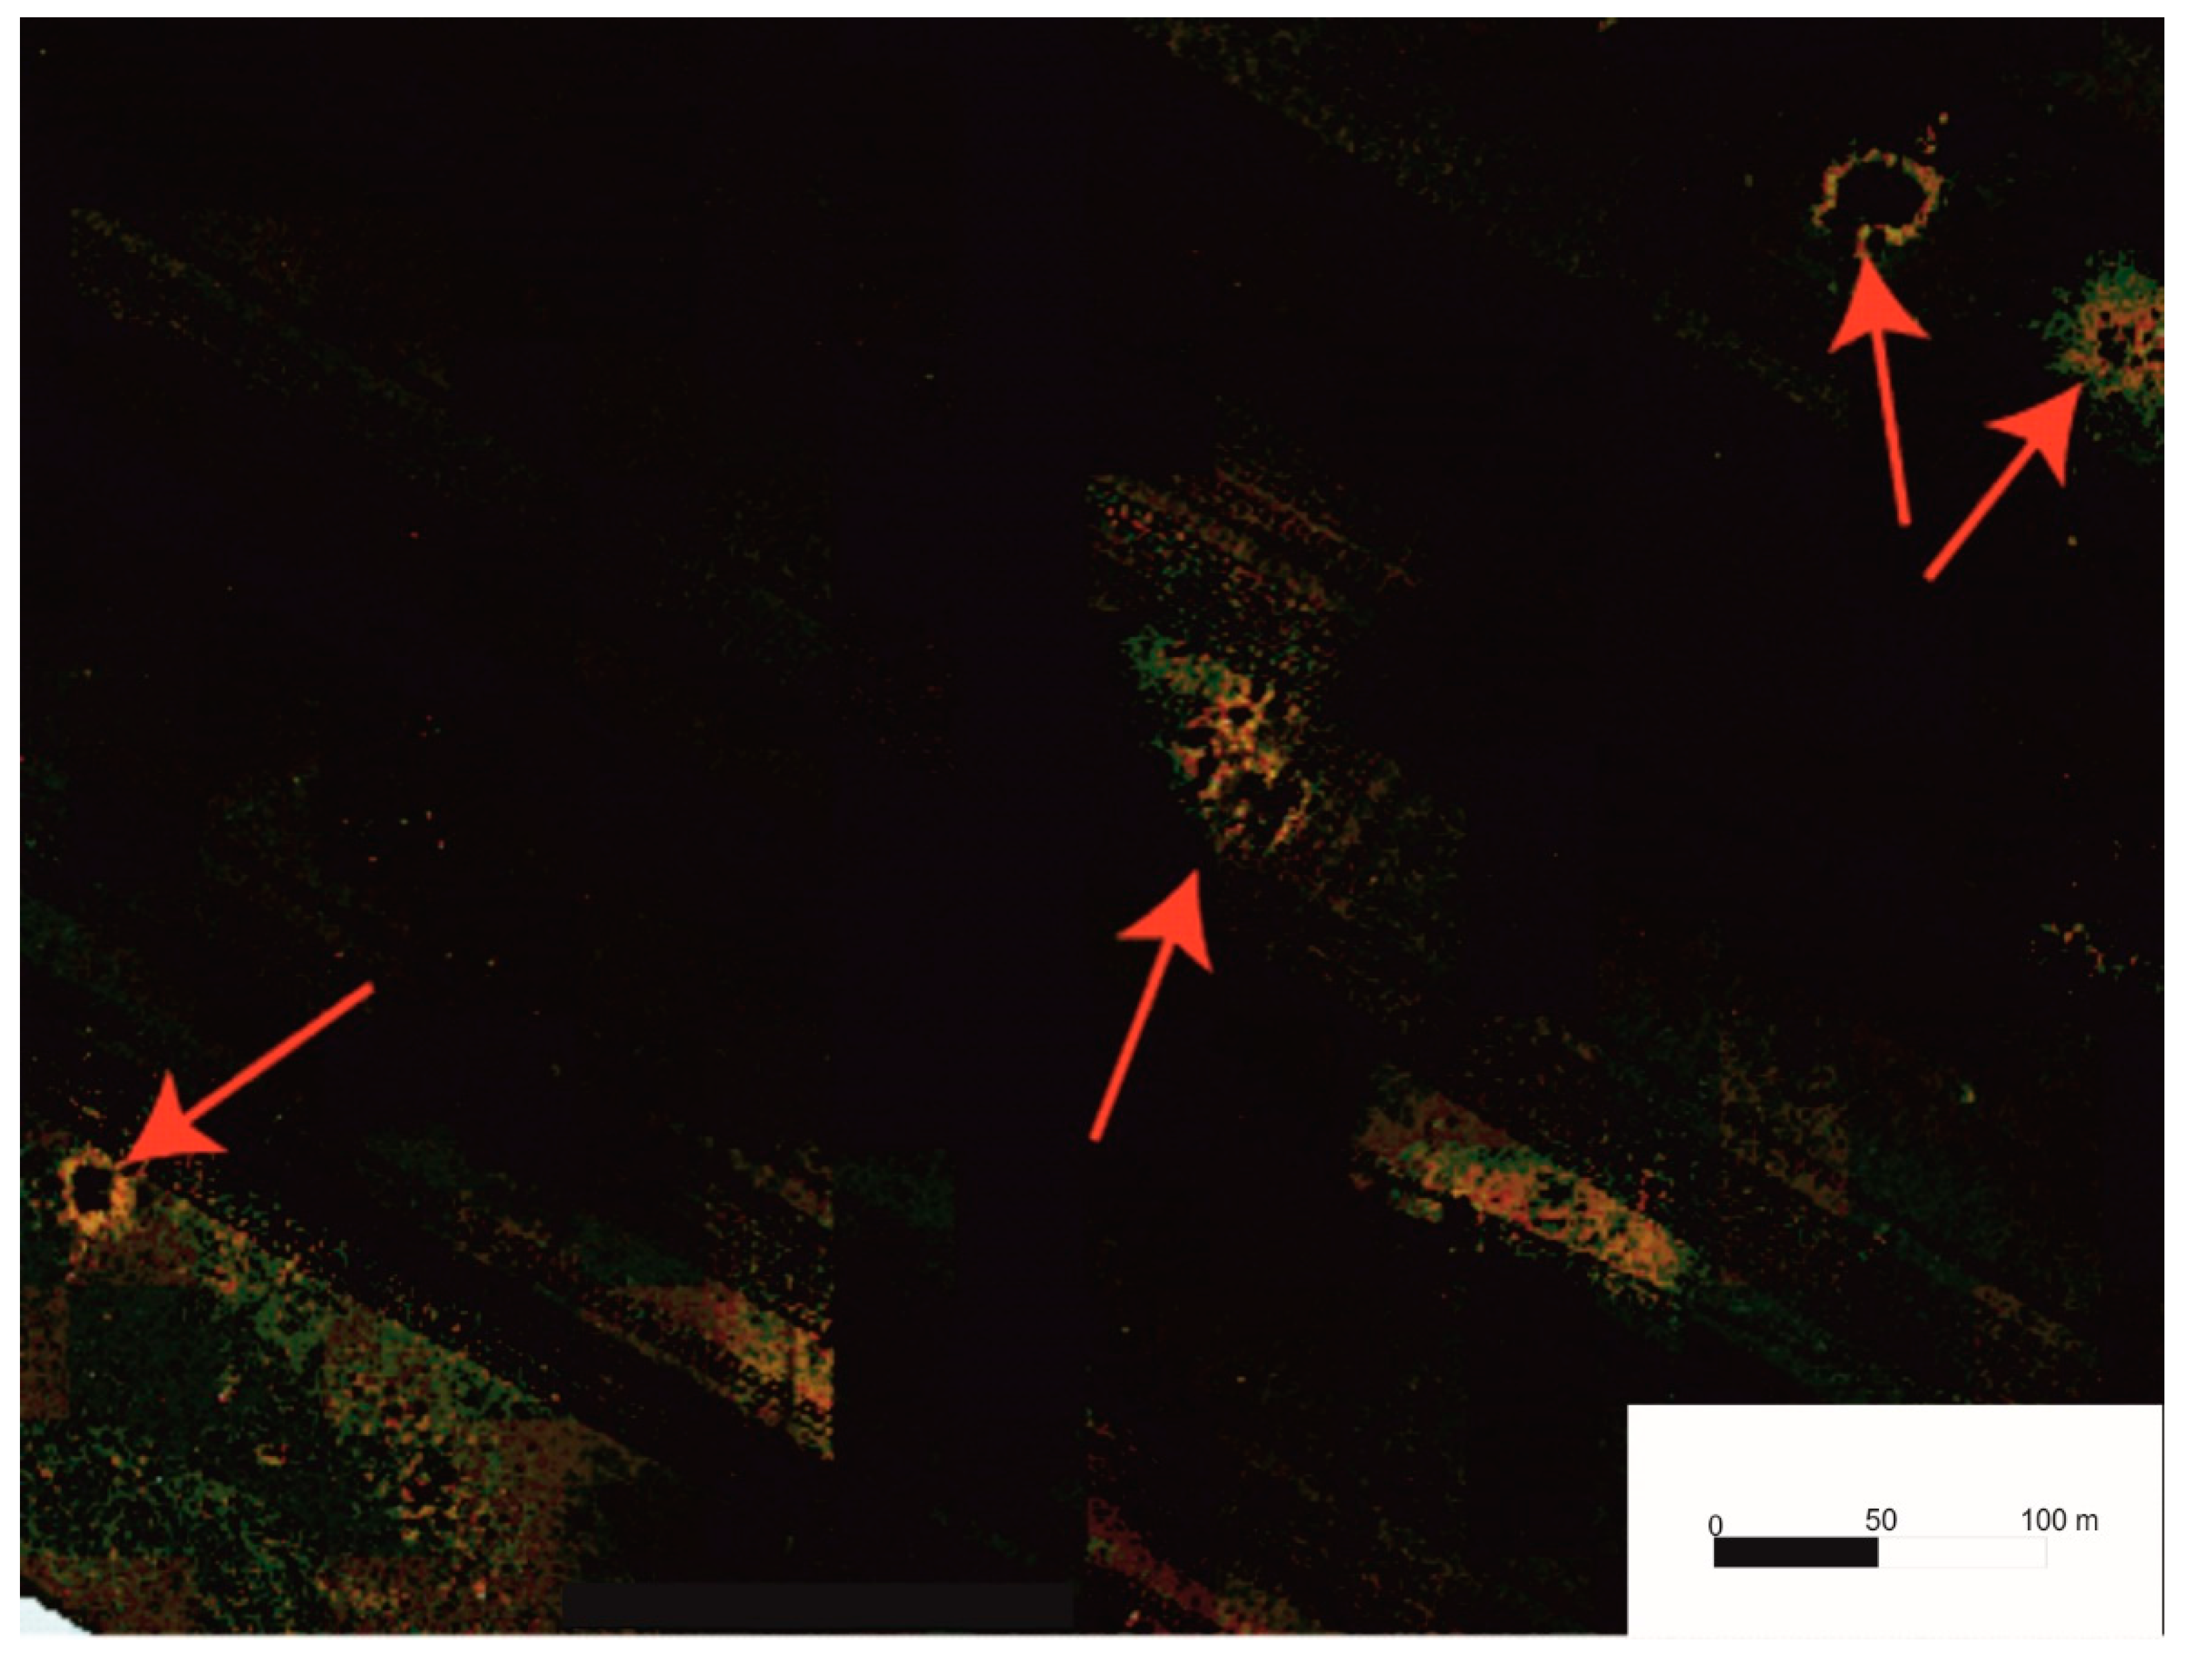
4.5. Gas Accumulation in the Petrozavodsk Bay Bottom Sediments

This study is the first to examine gas accumulations in the sediments of Lake Onego. The obtained seismograms contain background noise in the form of clusters of bubbles (Figure 3) that are usually located in areas of thick bottom sediments and do not entirely block the record. A clearer picture of gas accumulations could be observed in seismic profiles, where whole sections of a seismic profile are characterized by a reduced image resolution. The seismic lines also revealed distinctive structures of gaseous fluid emissions from the sediment deposits, so-called pockmarks (Figure 13 and Figure 14).
According to the radiography data, a large number of pores can be seen in the sedimentary cores of gas-saturated sediments (Figure 15). Most of these newly formed cavities have the shape of lenses oriented along the vertical axis. In the upper part of the core, they acquire a rounded shape. This is a consequence of the extremely rapid formation of pores, which occurs immediately after the core leaves the water due to the difference in pressures in the bottom and surface parts of the water column.
The concentrations of gaseous hydrocarbons of a C1-C5 composition in the gas phase of sediments from the Petrozavodsk Bay are shown in Table 3.
All samples analyzed in this study are characterized by elevated methane concentrations exceeding 1000 ppm. C2-C5 hydrocarbon gases are characterized by low methane concentrations, which is manifested by the high rates of CH4/ƩC2-C5 (>500). The highest methane concentration in the sediments was observed at station ONG-2 at the depth interval of 170–174 cm below the lake floor (b.l.f.). The lowest methane concentration was registered at station ONG-7 at the depth interval of 84–89 cm b.l.f. The peak value of ƩC2-C5 was recorded in the samples from ONG-7 at the depth interval of 41–45 cm b.l.f., which showed high concentrations of isobutylene (2154 ppm) and isopentane (8269 ppm).
The distribution of values of CH4/ƩC2-C5 was determined by the concentration of methane, which is typical for hydrocarbon gases of microbial origin [19]. In all cases, isopentane prevails among the C2-C5 hydrocarbon gases. This feature is particularly interesting and requires further verification. Isopentane is an atypical component of the gas phase in sediments, both marine and lacustrine, and we have not found any references on its discovery and origin in previous research. Relatively low concentrations of ethane/ethylene may indicate active microbiological processes [20], possibly associated with the activities of methanogenic and methanotrophic microbiota. Unlike marine ecosystems, freshwater ecosystems have limited resources of electron acceptors (mainly in the form of sulfate), so the anaerobic oxidation of methane is of little importance in the carbon cycle, and methane actively flows into the water column and the atmosphere [20]. Therefore, the surveyed region and Lake Onego in particular, may substantially contribute to atmospheric methane emissions. The study outcomes are of particular importance due to the great interest in different sources of emissions and re-evaluations of their contribution to the global methane budget. For that reason, this region requires further research.
The isotopic composition δ13C-CH4 was examined in cores ONG-2 and ONG-4. The values ranged from −68.4 to −69.3‰ VPDB and from −70.4 to −73.7‰ VPDB in cores ONG-2 and ONG-4, respectively. These values clearly confirm the microbial (diagenetic) origin of methane. Notably, the δ13C-CH4 values tend to decrease upwards in both cores. This usually occurs through the activation of methanogenesis processes, as during methane oxidation, the light isotope 12C decays first, and the remaining methane becomes enriched with the heavier isotope 13C [19]. Methanogenesis in the upper parts of the section may only prevail if pore waters do not contain sulfate ions, which is often the case with freshwater lakes.

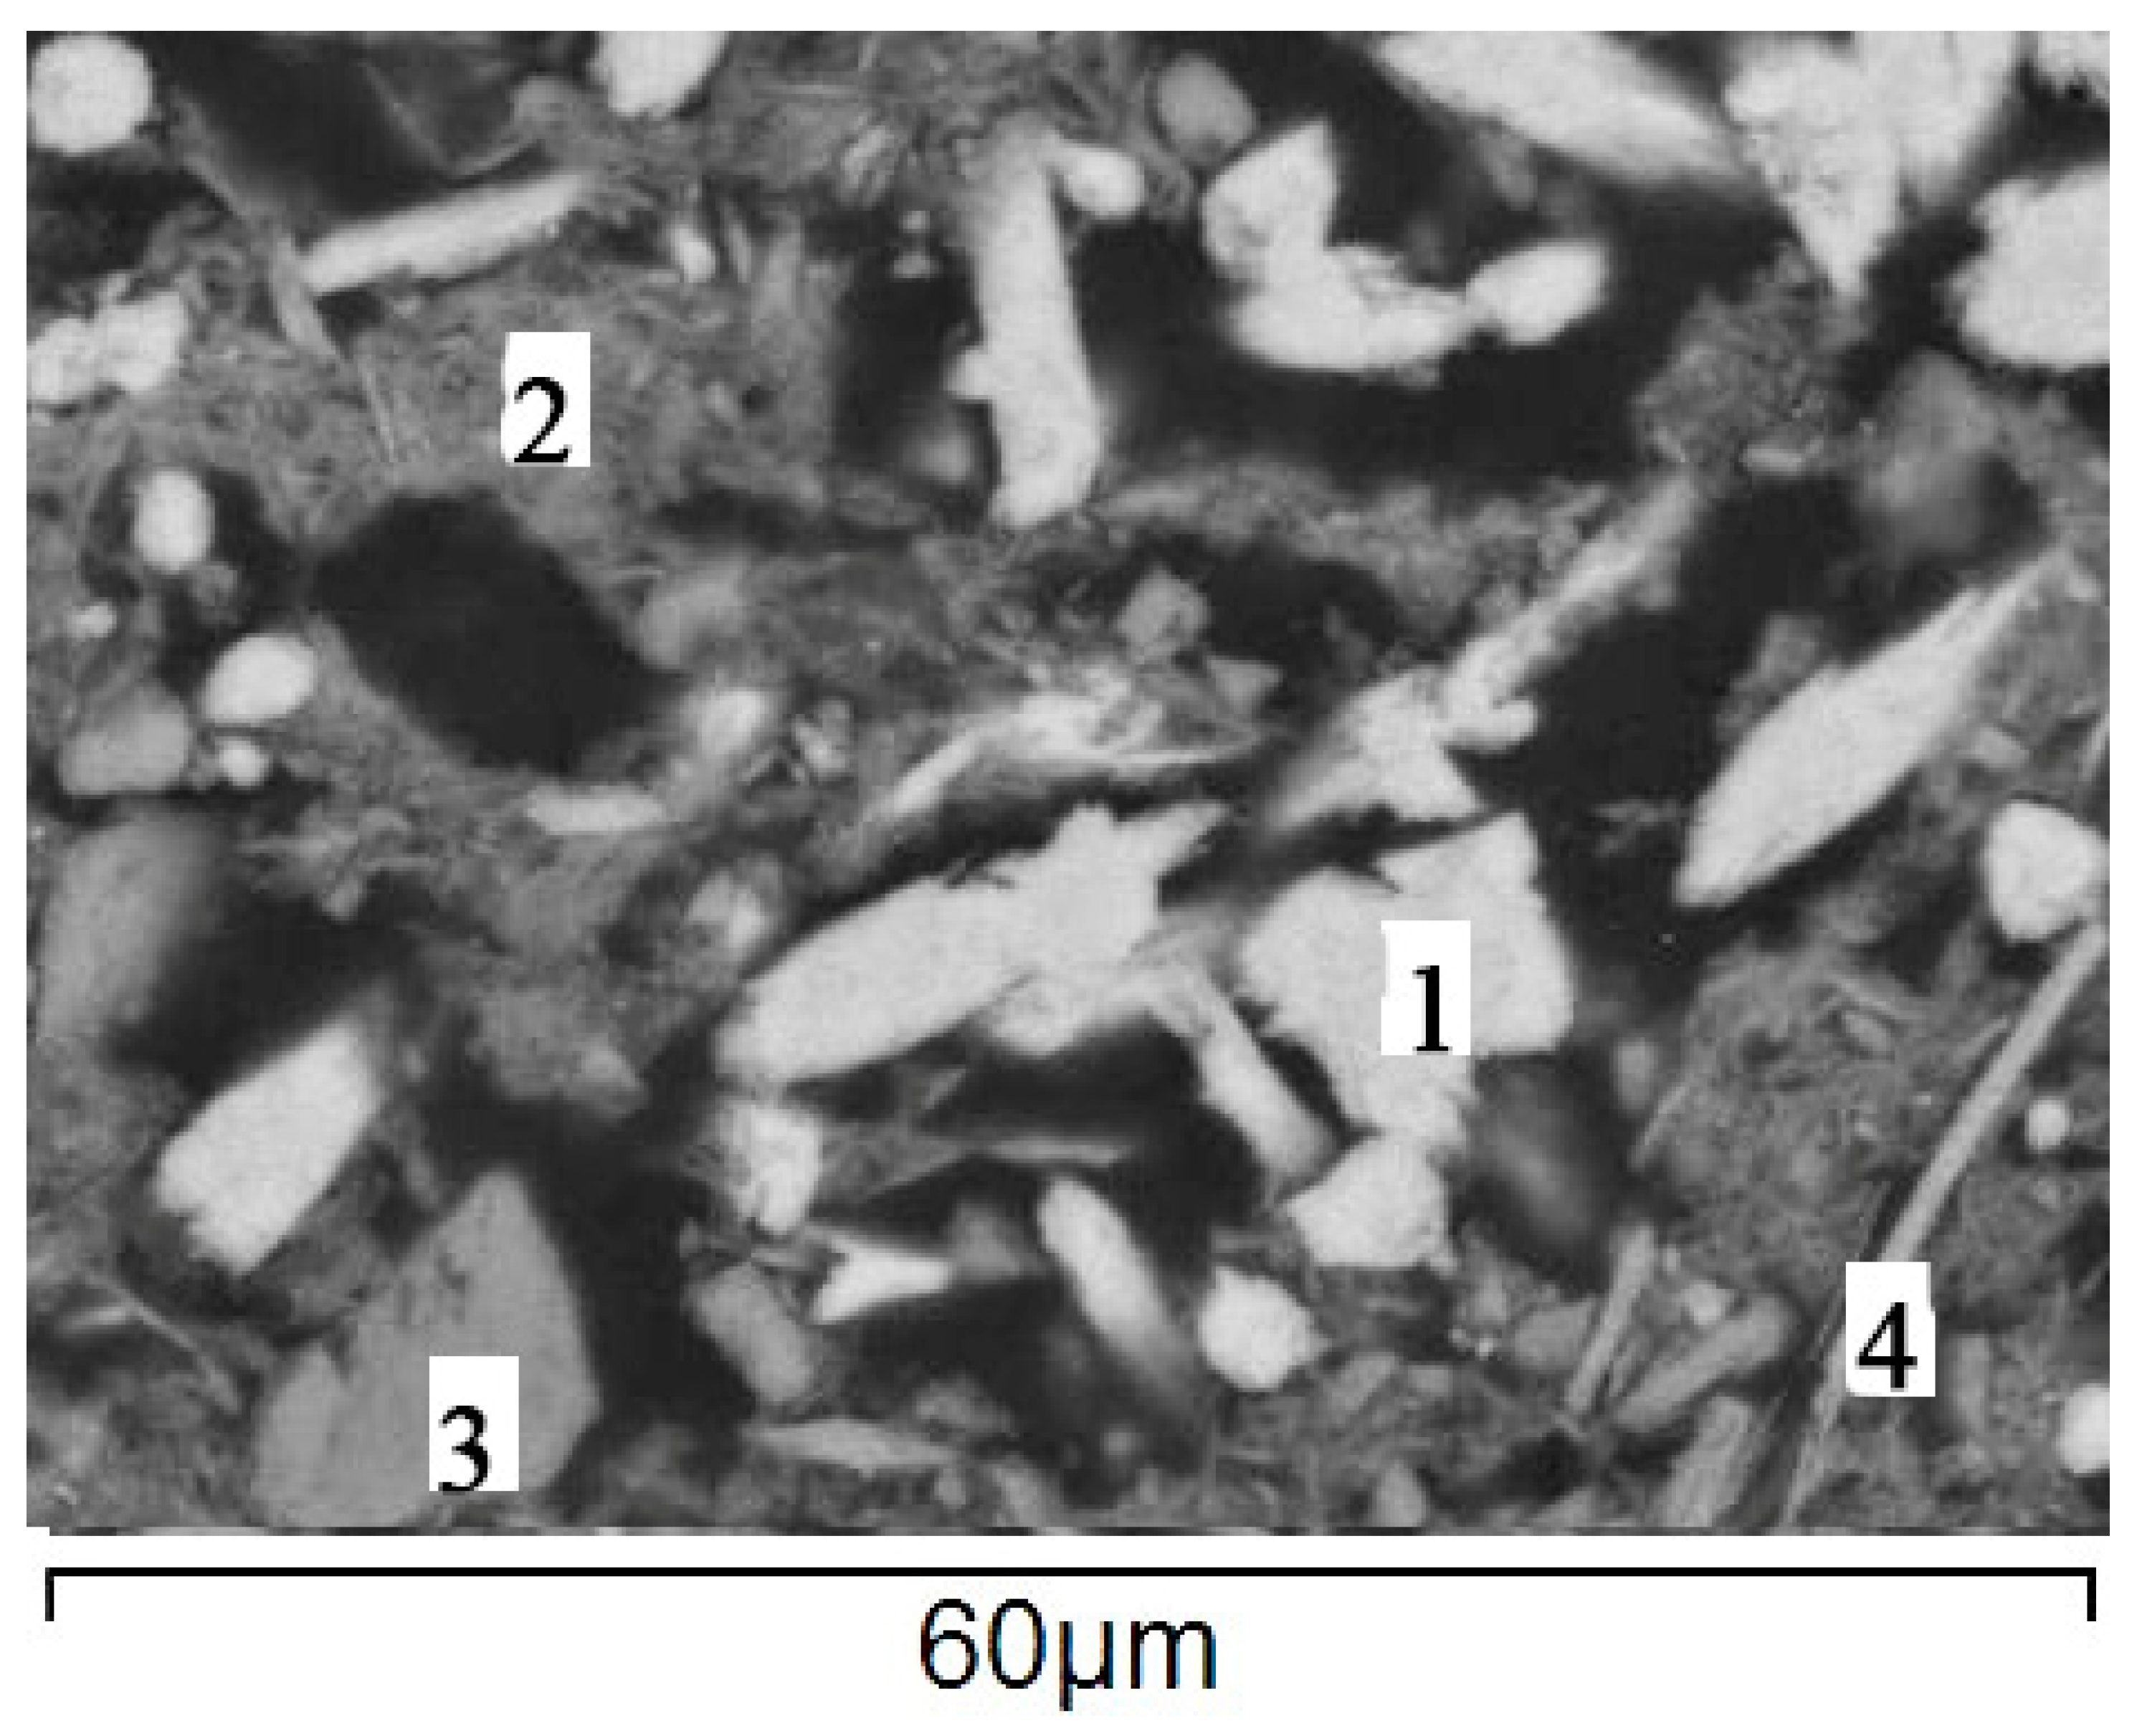
4.6. Mineralogy in Cores ONG-4 and ONG-7

The mineral composition of bottom sediments was studied directly on the sedimentary cores used in this study. According to previous studies conducted by the authors, it was found that the mineral composition of the bottom sediments of lake Onega is formed by minerals (quartz, feldspar, muscovite), which were introduced into the lake from river runoff and aerosols, as well as autigenic minerals. In contrast to wells from other areas of the lake, the mineral phases of Fe and Mn are represented by pyrolusite, vivianite, rhodochrosite, and siderite already in the upper first centimeters of sediments [17,21]. In addition to these minerals, there are opal (diatoms), Fe-Illite, and Fe-chlorite. [21]. The concentration of rhodochrosite, siderite, and vivianite increases in the zones of gas-saturated Silts (Figure 16). Measurements of microbial activity in the bottom sediments of the Petrozavodsk Bay showed the presence of sulfate-reducing and methane-forming bacteria in the recovery zone, although their number was quite low [22]. Numerous studies have shown that CH4 oxidation and microbial melanogenesis are widely developed when methane diffusion processes from deeper sediments to poorly lithiated layers are detected in modern bottom sediments. These processes were accompanied by the formation of autigenic carbonates. It is possible that the presence of methane leads to the formation of vivianite, rhodochrosite and siderite in large quantities. The geochemical evidence for this process consists in the marked enrichment of diagenetic carbonates with the 12C isotope [23]. To confirm this hypothesis, additional studies of the isotopic composition of carbonates should be conducted in the future.

5. Conclusions

For the first time, comprehensive geological and geophysical studies were conducted in the Petrozavodsk Bay of Lake Onego. It includes: seismoacoustic (in different variations) profiling, sonar profiling, and sediment coring with heavy gravity corers. The sediment cores were examined by tomography, revealing gas seven distinctive lithological units and gas accumulation in pockmarks of Lake Onego sediments.
The seismic profiles showed that the surface of pre-Holocene sediments is rugged and dissected, with some scarps probably caused by Holocene geodynamic movements. These scars sometimes occur near areas of gas release.
This study is the first provide evidence based on geophysical data for gas emission in lacustrine sediments in NW Russia. A significant gas accumulation in sediments must be taken into account in the ecological assessment of a lake. The chemical composition of gases in the bottom sediments of Lake Onego were elevated in methane concentrations exceeding 1000 ppm.
The formation of autigenic carbonates (rhodochrosite and siderite) in the surface layer of bottom sediments of the Petrozavodsk Bay of Lake Onego in significant quantities is associated with the processes of methane oxidation. Confirmation of this hypothesis for the formation of Mn Fe carbonates requires isotopic studies in the future. Based on the studied sediment cores and their calibrated dates, we have proposed a lithostratigraphic scheme that might be relevant for the entire Lake Onego.

Author Contributions

Conceptualization, D.S., V.S. and A.R.; methodology, A.R., V.S., D.S., N.B., N.D., M.P. and V.K.; fieldworks, A.R., N.B., M.P., N.D., A.L., Y.K., A.O.; software, M.T. and M.A.; validation, V.S., D.S. and A.R.; formal analysis, V.K., D.K. and A.K.; investigation, D.S., A.R., V.S., N.B., M.T., M.P., M.A., P.B., N.D., V.K., D.K., A.L., N.S., A.K., N.K., Y.K., A.O.; resources, V.S., D.S., V.K. and M.T.; data curation, V.S. and A.R.; writing, original draft preparation, D.S., A.R., N.B., V.S., V.K., P.B.; writing, review and editing, D.S., A.R., V.S., V.K. and P.B.; visualization, V.S., N.K. and P.B.; supervision, V.S. and D.S.; project administration, D.S. All authors have read and agreed to the published version of the manuscript.

Funding

The research was supported by Russian Science Foundation (RSF No. 18–17-00176), the Ministry of Science and Higher Education of the Russian Federation (project No. FSZN-2020-0016), by grants from Saint Petersburg State University (No. 18.42.1258.2014, 18.42.1488.2015, and 0.42.956.2016 for field research and No. 18.40.68.2017 for the purchasing of scientific equipment), by grants from the Russian Foundation for Basic Research (RFBR NN 18-05-00303& 19-05-50014), by the FEEL foundation (“Life Under the Ice project” http://wiki.epfl.ch/ladoga). A survey was conducted on the topic “Hardware and software systems development for the search, exploration, geophysical and geochemical monitoring of the exploitation of hydrocarbon reservoirs, including remote regions and challenging climate conditions”, with funding from the Ministry of Science and Higher Education of the Russian Federation, using equipment purchased under the Development Program of Lomonosov Moscow State University (Grant Agreement No. 14.607.21.0187 of 26 September 2017, RFMEFI60717 × 0187).

Conflicts of Interest

The authors declare no conflict of interest.

References

  1. Semenovich, N. Donnye Otlozheniya Onezhskogo Ozera (Bottom Sediments of Lake Onega); Nauka: Leningrad, Russia, 1973; p. 104. [Google Scholar]
  2. Saarnisto, M.; Saarinen, T. Deglaciation chronology of the Scandinavian Ice Sheet from the Lake Onega basin to the Salpausselkä End Moraine. Glob. Planet. Chang. 2001, 31, 333–405. [Google Scholar] [CrossRef]
  3. Saarnisto, M.; Grönlund, T.; Ekman, I. Lateglacial of Lake Onega—Contribution to the history of the eastern Baltic basin. Quat. Int. 1995, 27, 111–120. [Google Scholar] [CrossRef]
  4. Subetto, D.A. OnezhskoeOzero. Obschaya Kharakteristika Donnykh Otlozheniy (The Lake Onego: General Characterizationof the Bottom Sediments); Nauka (Science): Leningrad, Russia, 1990; pp. 89–92. [Google Scholar]
  5. Demidov, I.N. Donnye Otlozheniya i Kolebaniya Urovnya Onezhskogo Ozera v Pozdnelednikovye (Bottom Sediments and the Lake Onego Level Fluctuations in Late Glaciation). Geol. Polezn. Iskop. Karelii (Geol. Min. Resour. Karelia) 2004, 7, 207–218. [Google Scholar]
  6. Demidov, I.N. Degradatsiya Pozdnevaldayskogo Oledeneniya v Basseyne Onezhskogo Ozera (Retreat of the Late Valdai Glaciation in the Lake Onego Basin). Geol. Polezn. Iskop. Karelii (Geol. Min. Resour. Karelia) 2006, 9, 171–182. [Google Scholar]
  7. Subetto, D.A. Donnye Otlozheniya Ozer: Paleolimnologicheskie Rekonstruktsii (Lake Bottom Sediments: Paleolimnological Reconstructions)/Nauchnaya Monografiya (Scientific Monography); Publishing House of Herzen State Pedagogical University of Russia: Saint Petersburg, Russia, 2009; 339p. [Google Scholar]
  8. Hang, T.; Gurbich, V.; Subetto, D.; Strakhovenko, V.; Potakhin, M.; Belkina, N.; Zobkov, M. A local clay-varve chronology of Onega Ice Lake. Quat. Int. 2019, 524, 13–23. [Google Scholar] [CrossRef]
  9. Zobkov, M.; Potakhin, M.; Subetto, D.; Tarasov, A. Reconstructing Lake Onego evolution during and after the Late Weichselian glaciation with special reference to water volume and area estimations. J. Paleolimnol. 2019, 62, 53–71. [Google Scholar] [CrossRef]
  10. Onezhskaya Paleoproterozoyskaya Struktura (Geologiya, Tektonika, Glubinnoe Stroenie i Minerageniya) (The Onego Palaeoproterozoic Structure (Geology, Tectonics, Deep Structure, and Minerageny)); KarRC RAS: Petrozavodsk, Russia, 2011; 431p.
  11. Biske, G.; Lac, G.; Lukashov, A.; Goryunova, N. The Structure and History of the Basin of Lake Onega; Karelia: Petrozavodsk, Russia, 1971; p. 73. [Google Scholar]
  12. Kvasov, D.D. Paleolimnologiya Onezhskogo Ozera (Paleolimnology of the Lake Onego); Proiskhozhdenie Kotloviny Onezhskogo Ozera (The Origin of the Lake Onego Basin); Nauka: Leningrad, Russia, 1976; pp. 7–40. [Google Scholar]
  13. Arslanov, K.A.; Tertychnaya, T.V.; Chernov, S.B. Problems and methods of dating of low-activity samples by liquid scintillation counting. Radiocarbon 1993, 35, 393–398. [Google Scholar] [CrossRef] [Green Version]
  14. Arslanov, K.A. Radiouglerod: Geokhimiya and Geokhronologiya (Radiocarbon: Geochemistry and Geochronology); LGU: Leningrad, Russia, 1987; 300p. [Google Scholar]
  15. Aleshin, M.I.; Gaynanov, V.G.; Tokarev, M.J.; Rybalko, A.E.; Subetto, D.A. The Study of Sub-Bottom Sediments in Petrozavodsk Bay of Lake Onega Using Complex Geological-Geophysical Methods of Data Analysis. Mosc. Univ. Geol. Bull. 2019, 74, 525–531. [Google Scholar] [CrossRef]
  16. Maksimov, A.V.; Bogdanov, Y.B.; Voinova, O.A.; Kossovaya, O.L.; Bakhteev, A.R. State Geological Map of the Russian Federation. Scale 1:1 000 000 (Third Generation); Series: Baltic; Sheet R-(35), 36—Petrozavodsk: Explanatory Note; VSEGEI Cartographic Factory: Saint-Petersburg, Russia, 2015; 400p. [Google Scholar]
  17. Strakhovenko, V.; Subetto, D.; Ovdina, E.; Danilenko, I.; Belkina, N.; Efremenko, N.; Maslov, A. Mineralogical and Geochemical composition of Late Holocene bottom sediments of Lake Onego. J. Great Lakes Res. 2020, 46, 443–455. [Google Scholar] [CrossRef]
  18. Filimonova, L.V.; Lavrova, N.B. The study of Lake Onego and its drainage basin paleogeography using a set of methods. Proc. Karelian Sci. Center RAS 10 Russia 2017, 10, 86–100. [Google Scholar]
  19. Whiticar, M.J. Carbon and hydrogen isotopes systematics of bacterial formation and oxidation of methane. Chem. Geol. 1999, 161, 291–341. [Google Scholar] [CrossRef]
  20. Abrams, M.A. Significance of hydrocarbon seepage relative to petroleum generation and entrapment. Mar. Pet. Geol. 2005, 22, 457–477. [Google Scholar] [CrossRef]
  21. Strakhovenko, V.; Subetto, D.; Ovdina, E.; Belkina, N.; Efremenko, N. Distribution of Elements in Iron-Manganese Formations in Bottom Sediments of Lake Onego (NW Russia) and Small Lakes (Shotozero and Surgubskoe) of Adjacent Territories. Minerals 2020, 10, 440. [Google Scholar] [CrossRef]
  22. Belkina, N.A.; Subetto, D.A.; Efremenko, N.A.; Kulik, N.V. Features of microelements distribution in a blanket of Lake Onego bottom sediments. Nauka i Obrazovanie 2016, 3, 135–139. (In Russian) [Google Scholar]
  23. Lein, A.Y.; Ivanov, M.V. Biogeochemical Cycle of Methane in the Ocean; Vinogradsky Institute of Microbiology, Russian Academy of Sciences: Moscow, Russia, 2009; 576p. [Google Scholar]
Figure 1. Map of geophysical profiles and geological stations location. (a)—Location of Lake (b)—Location of the Petrozavodsk Bay, (c-1)—Coring locations in the Petrozavodsk Bay. Numbers indicate core position, (c-2)—location of the geophysical profiles in the Petrozavodsk Bay. The digits indicate the position: 1—the seismic profile 1 (Figure 2); 2—the seismic profile 2 (Figure 3); 3—the seismic profile with gas accumulation (Figure 13); 4—the sonogram of a pockmark field (Figure 14).
Minerals 10 00964 g001
Figure 2. Seismic stratigraphic structure of sediments in the Petrozavodsk Bay (the position, see Figure 1). Legend: (1) lacustrine sediments of the Middle and Upper Holocene (lH2–3); (2) lacustrine sediments of the Lower Holocene (lH1); (3) limno-glacial sediments (varved clays) of the Late Pleistocene (the Valday (Weichselian) Glacial stage) (lgIII); (4) glacial sediments (till) of the Late Pleistocene (Valday Glacial stage) (gIII); 5: bedrock. The arrow indicates the location of a pockmark.
Minerals 10 00964 g002
Figure 3. The seismic profile (the position, see Figure 1) with a sharp shift of the roof of limno-glacial (varved) clays caused by tectonic dislocation (thick dashed line). The figures in the seismic record show the following: 1: Holocene lacustrine muds; 2: limno-glacial clays; 3: till of the Valday (Weichselian) Glacial stage. Dashed arrows indicate large areas of gas accumulation and solid arrows indicate pockmarks.
Minerals 10 00964 g003
Figure 4. Holocene lacustrine sediments: (a) upper part of Holocene sediments. (b) middle part of Holocene sediments. Diagenetic banding can be seen at the bottom of the unit. Lithological unit 1, core ONG-2.
Minerals 10 00964 g004
Figure 5. The lowermost part of the Holocene lacustrine sediments with clear black diagenetic layers. Lithological unit 2, core ONG-7.
Minerals 10 00964 g005
Figure 6. Limno-glacial sediments. Typical thin-laminated varved clays. Lithological unit 3, core ONG-5.
Minerals 10 00964 g006
Figure 7. Typical varved clays with graded layering. Lithological unit 4, core ONG-5.
Minerals 10 00964 g007
Figure 8. Lithostratigraphic section of Quaternary deposits in the Petrozavodsk Bay. Additionally, here we place legend for Figures 9, 10, and 12.
Minerals 10 00964 g008
Figure 9. Correlation of Quaternary deposits from sediment cores in the Petrozavodsk Bay. Legend, see Figure 8. The bold line demonstrates the Late Pleistocene-Holocene boundary. The core ONG-3 was empty during the sampling of bottom sediments. The coring tube may have fallen on crystalline rocks or boulders.
Minerals 10 00964 g009
Figure 10. Results of the radiocarbon dating in cores ONG -2 and ONG- 5. Legend see Figure 8.
Minerals 10 00964 g010
Figure 11. Core ONG-4. Banded diagenetic structure in Holocene silty-clay (Lithological units 1 and 2). Black bands are composed of manganese oxides and vivianite, rhodochrosite, siderite, and formations with various morphologies and degrees of crystallinity.
Minerals 10 00964 g011
Figure 12. Radiographic contrast cross-section of core ONG-5 and its separate enlarged fragments. The lower part of the column reveals varved clays of the Late Pleistocene period. See Figure 8 for the legend.
Minerals 10 00964 g012
Figure 13. The seismic profile with the gas accumulations (shown in red) in the layers of the Middle and Early Holocene sediments (the position, see Figure 1). The arrows show the location of the pockmarks. m.s.—milliseconds.
Minerals 10 00964 g013
Figure 14. Sonogram of a pockmarks field in the bottom of the Petrozavodsk Bay (the position, see Figure 1).
Minerals 10 00964 g014
Figure 15. (a) Vertical and separate horizontal radiographic contrast section views of the upper 50 cm in core ONG-1; (b) three-dimensional model of the cavity distribution (within the upper 25 cm) resulting from degassing of the sediments.
Minerals 10 00964 g015
Figure 16. Electron micrograph of the minerals forming the bottom sediment layer in Lake Onego at a depth of 5–12 cm (ONG-4). 1—rhodochrosite; 2—thin-plate depositions of Fe-illite + Fe-chlorite + sections of diatoms, composed of opal; 3—feldspar debris; 4—biotite.
Minerals 10 00964 g016
Table 1. Coordinates, water depth, and core lengths of the stations.
No.StationLake Depth (m)Core Length (m)Coordinates
LongitudeLatitude
1ONG 1212.8061°46.12′34°29.32′
2ONG 2 *223.2061°47.72′34°24.77′
3ONG 3 **21.1061°47.84′34°23.86′
4ONG 4 *21.62.4561°47.50′34°24.86′
5ONG 523.33.0461°46.62′34°28.86′
6ONG 624.83.1061°46.10′34°29.97′
7ONG 7 *22.53.2061°46.25′34°29.24′
* The stations where lithological–geochemical studies were conducted.** The core was empty.
Table 2. Results of radiocarbon dating.
Lab IndexCoreDepth, cmLithologyTOC %Charcoal, gBenzene, mlRadiocarbon Age, yr. BP (Scintillator Spectrometer)Calibrated
yr. cal. BP
(Scintillator Spectrometer)
LU-8394ONG-245–50Clayey silt6.431.220.521420 ± 1001340 ± 100
LU-8395ONG-2165–170Clayey silt8.551.060.382420 ± 1002510 ± 130
LU-8396ONG-2230–235Clayey silt7.881.110.414910 ± 1505660 ± 180
LU-8397ONG-549–51Sandy silt8.501.090.394150 ± 1804680 ± 260
Table 3. Composition of gases taken from the cores ONG-2, ONG-4 and ONG-7 of the Petrozavodsk Bay.
Sample NumberSample Depth
(cm)
Methane EthaneEthylenePropanePropylenei-Butanen-Butanei-Butenei-Butylenei-Pentanen-PentaneƩC2-C5CH4/ƩC2-C5C2H6/C2H4δ13C, ‰
CH4C2H6C2H4C3H8C3H6i-C4H10n-C4H10C4H8i-C4H8i-C5H12n-C5H12CH4
Concentration, ppm, in Vapor PhaseVPDB
ONG-210–1310732.0590.5120.4650.3680.522b.d.l. *b.d.l.b.d.l.0.5341.859b.d.l.4.25925201.10-
ONG-220–2310710.9000.678b.d.l.0.2310.505b.d.l.b.d.l.b.d.l.0.5983.603b.d.l.5.6161907--
ONG-240–4317399.1700.4100.4110.4180.484b.d.l.b.d.l.b.d.l.0.4782.404b.d.l.4.60437791.00−73.70
ONG-289–9221386.3160.9071.1920.4510.551b.d.l.b.d.l.b.d.l.0.7343.928b.d.l.7.76227550.76−72.30
ONG-2170–17442787.5880.9110.7780.5470.4740.0250.104b.d.l.0.8233.639b.d.l.7.30058621.17−70.40
ONG-2248–25034558.3561.2221.0360.6670.4630.0510.141b.d.l.0.7862.888b.d.l.7.25447641.18-
ONG-430–3334873.4930.229b.d.l.0.5300.517b.d.l.b.d.l.b.d.l.0.8393.488b.d.l.5.6036224--
ONG-440–4339497.4190.8190.0000.4730.7060.0340.037b.d.l.1.2743.699b.d.l.7.0415609-−69.30
ONG-490–9339976.8430.2780.8150.5590.8440.0850.0570.1010.7633.034b.d.l.6.53761150.34-
ONG-4143–14630363.2870.3160.9250.6000.6590.0650.098b.d.l.1.3375.530b.d.l.9.53231860.34−68.50
ONG-4163–16628176.5360.3110.8560.6600.7020.0480.076b.d.l.1.2673.711b.d.l.7.63136920.36-
ONG-4204–20627135.5850.2321.0040.6190.6370.0630.201b.d.l.0.7604.468b.d.l.7.98433990.23−68.40
ONG-4225–22823719.0200.2610.9690.6190.8520.1610.000b.d.l.1.4504.678b.d.l.8.98826390.27-
ONG-741–453068.731b.d.l.0.7440.2810.3250.1650.013b.d.l.2.1578.269b.d.l.11.953257--
ONG-784–892990.4610.1491.1410.2140.485b.d.l.b.d.l.b.d.l.0.4464.804b.d.l.7.2394130.13-
* b.d.l.: below the detection limit; -: no data.
Publisher’s Note: MDPI stays neutral with regard to jurisdictional claims in published maps and institutional affiliations.

