The Color Palette of the Mosaics in the Roman Villa of Noheda (Spain)
by
 ,
,
Nadine Schibille
1,* ,
,
Cristina Boschetti
1,
Miguel Ángel Valero Tévar
2,
Emmanuel Veron
3 and
Jorge de Juan Ares
1 1
IRAMAT-CEB, UMR5060, CNRS/Université d’Orléans, 3D rue de la Férollerie, CS 60061, 45071 Orléans CEDEX 2, France
2
Departamento de Historia Antigua, Facultad de Humanidades y Ciencias de la Educación, Universidad de Castilla-La Mancha, Av. de los Altares s/n, 16071 Cuenca, Spain
3
CEMHTI-CNRS UPR3079, Site Haute Température, CS 90055, 1D Avenue de la Recherche Scientifique, 45071 Orléans CEDEX 2, France
*
Author to whom correspondence should be addressed.
Minerals 2020, 10(3), 272; https://doi.org/10.3390/min10030272
Submission received: 23 January 2020
/
Revised: 16 March 2020
/
Accepted: 17 March 2020
/
Published: 18 March 2020
(This article belongs to the Special Issue Historical Mineral Pigments)
Abstract
:Excavations at the Roman villa of Noheda (Spain) revealed the remains of an exceptionally elaborate fourth-century floor mosaic that contains a surprisingly large number of glass tesserae, representing a broad spectrum of colors. This paper presents the results of the chemical (LA-ICP-MS) and microstructural analyses (SEM-EDS, XRPD) of 420 glass tesserae from these mosaics. The high number of data allowed us to establish the compositional variability and to elucidate questions of supply in relation to a large-scale artistic campaign. The tesserae from Noheda were almost exclusively made from recycled mixed Roman Mn and Sb base glass, thus demonstrating that recycling of Roman base glasses was common practice in the fourth century, occurring on a near industrial scale. It also suggests that the workshops specializing in the production of mosaic tesserae might have been in the western Mediterranean. A limited number of coloring and opacifying additives (Mn, Co, Cu, Sb, Pb) were identified, which resulted in a wide range of hues. These were differentially associated with various trace elements, which implies the use of different raw materials. A sub-set of red, green, and orange tesserae reflect distinct base glass characteristics as well as coloring technologies that point to an Egyptian provenance.
1. Introduction
Mosaic making in the Roman world included a variety of techniques that were specific to floor, wall, and vault mosaics. Different types of mosaic artisans with special skills were recognized in the fourth-century Edictum de Pretiis Rerum Venalium [1]. This decree, issued by Emperor Diocletian in the year 302 CE, aimed to regulate the maximum price for goods and services in a period of uncontrolled inflation. Within this decree, the creation of floor and wall mosaics is attributed to two distinct artisans, the tessellarius and musivarius, whose daily wages were notably different (50 and 60 denarii per day, respectively). However, given the daily wage of 25 denarii for a common worker, both floor and wall mosaics can be considered a rather costly affair. Furthermore, in order to estimate the economic value of a Roman mosaic, the cost of craftmanship has to be added to the cost of the material [2,3]. According to the Edictum de Pretiis, unworked glass was differently priced, depending on its provenance (13 denarii for one libra of vitrum Iudaicum, 24 for one libra of Alexandrinum). Colored glass was more expensive, ranging from 20 to 30 denarii per libra. Hence, it is clear that mosaics, and especially glass mosaics, were not the kind of decoration affordable for everyone. This is also evident from first-century CE Latin sources that refer to glass in architecture as being ostentatious (e.g., Pliny, N.H, 36, 50). Glass tesserae become more common, especially in wall mosaics after the invention and spread of glass-blowing [4], which led to a depreciation, and as a consequence, radical change in the economy of ancient glass [5]. Judging from the high price attributed to colored glass, however, the use of glass tesserae in mosaics can be considered as a marker of luxury, even as late as the fourth century CE.
The fourth century is a particularly vibrant period for Roman mosaic art, as it reaches its greatest geographic expansion, spreading all the way to the edges of the empire [6]. The increasing wealth of the aristocracy during the first decades of the century may explain the apogee of mosaics [7]. At the same time, the manufacture of glass experienced a transformation as new primary production groups started to supplement the earlier Roman base glasses [8,9,10,11,12,13,14]. Due to the limited data on the compositional and micro-structural characteristics of late antique mosaic tesserae, it is not clear, however, whether the production of glass tesserae underwent similar developments. To date, scholarly attention has focused mostly on case studies in Italy [15,16,17], Albania [18], and the eastern regions of the Empire such as Jordan [19], Syria [20], Cyprus [21], and Turkey [22]. Analytical data for glass tesserae from other parts of the empire such as northern Africa and the Iberian Peninsula are virtually lacking, despite the high technical and artistic quality and significance of mosaic decorations from these regions [23,24].
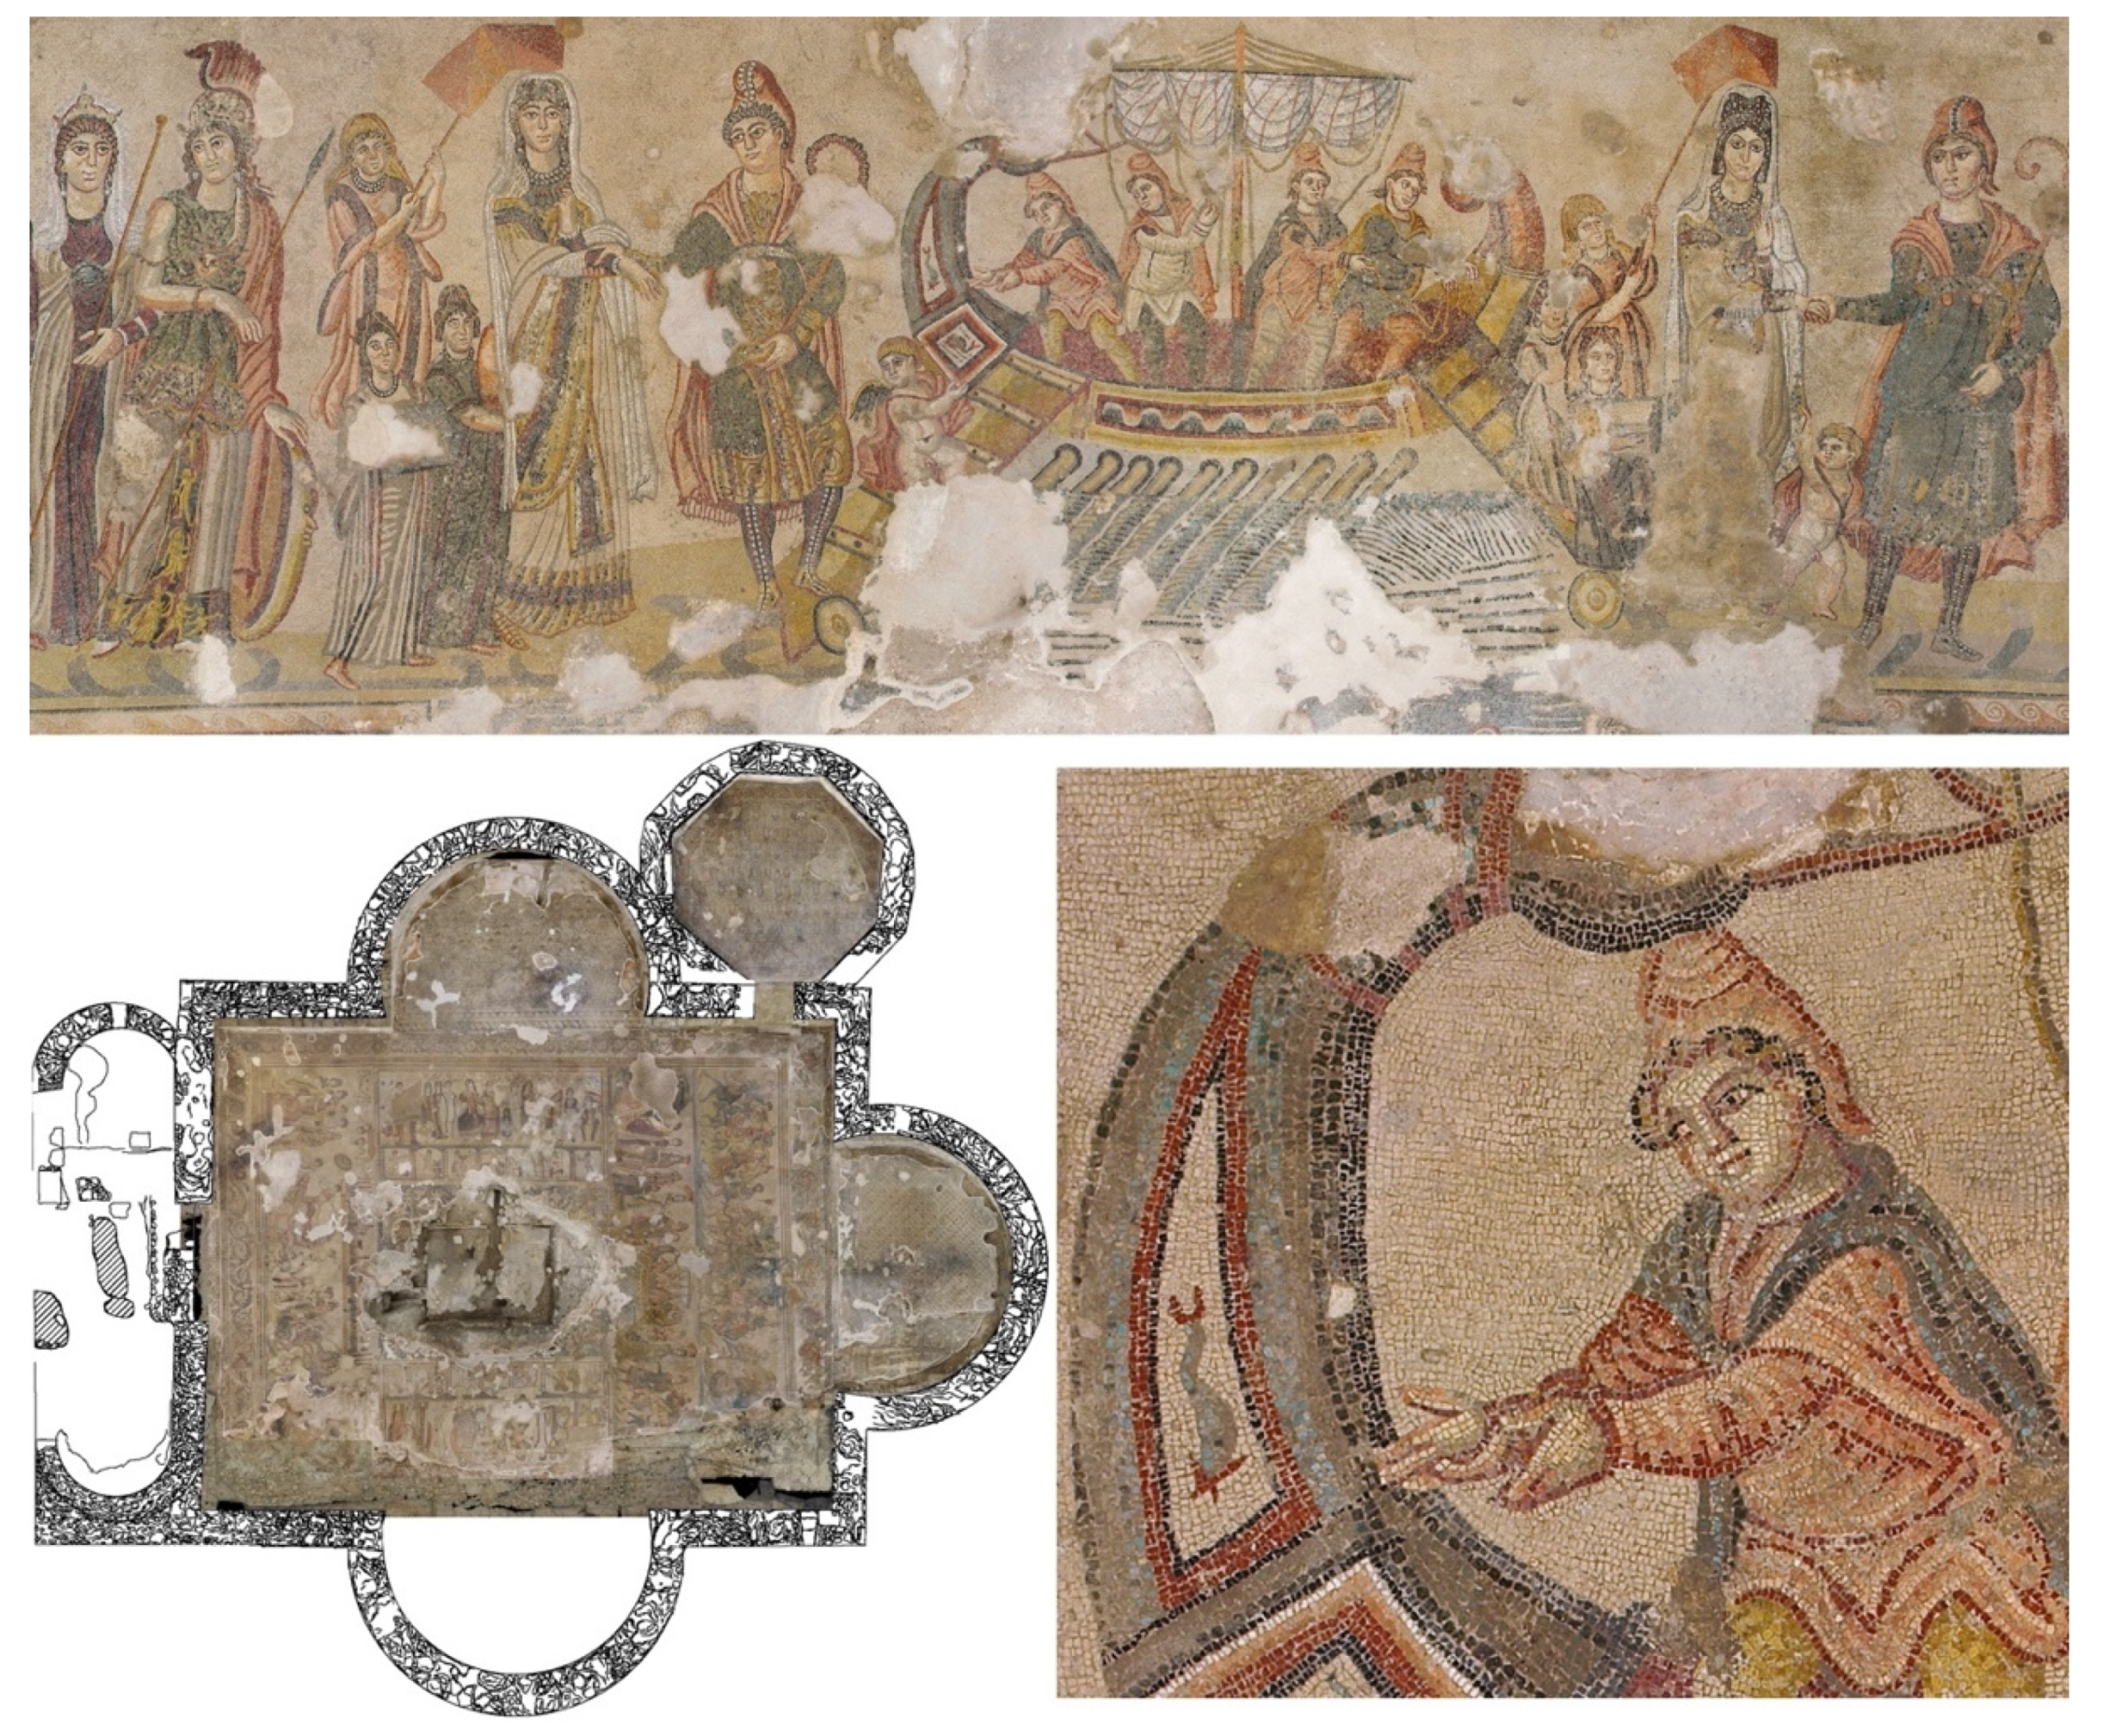
The floor mosaics from the Roman villa at Noheda (Cuenca, Spain) represent a technical and artistic high-point in late Roman mosaic making [25,26,27]. Archaeological investigations unearthed the last phase of the building, dating from the first quarter of the fourth to the late fifth century CE. At this point, a pre-existing villa was expanded, according to the contemporary fashion of monumentalization that is well documented across the empire [28,29,30,31,32,33,34,35]. During this building campaign, the edifice was equipped with private baths and a 290 m2 triclinium, with apses on three sides (Figure 1) [36]. The renovated structure received a lavish decoration and the triconch was entirely paved with mosaic that contained a large proportion of colored and gold leaf glass tesserae [37]. The glass tesserae are all concentrated in the mythological scenes that occupy the central space of the room, while the three apses, which were usually covered by furniture used for dining, are decorated with a simple geometric mosaic made from stone tesserae. This distribution pattern reveals the economic and functional value of glass tesserae that evidently served as artistic highlights in areas that were in plain sight (Figure 1).
Here, we present the detailed chemical and micro-structural results of a substantial number of the glass tesserae from Noheda (n = 420; Table S1). This is the first comprehensive analytical study of any Roman mosaic from the Iberian Peninsula. Previous studies only considered a limited number of samples [38,39]. The large-scale approach provides a reliable basis to investigate and estimate the technological and material variability within a single high-end late antique decorative program. Defining the base glass compositions and variability of the Noheda tesserae allows us, on the one hand, to identify the additives used as pigments and opacifiers and, on the other hand, to assess broader issues related to the history of mosaic making such as the relationships between glass-making, recycling, glass coloring, and mosaic workshops as well as the circulation and supply of colored glass tesserae.
2. Materials and Methods
A group of 420 loose glass tesserae were studied including a wide range of colors and textures of opaque, translucent, and gold-leaf tesserae. The tesserae were all found in the deposit covering the mosaic of the triconch. During the burial phase, the mosaic was partially destroyed by agricultural work. According to the stratigraphic position, the post-depositional history, and the colors that match those of the mosaics in situ (Figure 1), the loose tesserae can be safely attributed to the mosaic of the triconch.
2.1. Analytical Methods
Small samples (<4 mm diameter) of each tessera were removed with a mosaic cutter and embedded in epoxy resin. The resin blocks with ten samples each were then ground and polished to obtain a clean and flat surface. Laser ablation inductively coupled plasma mass spectrometry (LA-ICP-MS) was conducted on the polished cross sections at IRAMAT-CEB (Institut de recherche sur les archéomatériaux, Centre Ernest-Babelon, Orléans, France) using a Resonetics M50E excimer laser coupled with a Thermo Fisher Scientific ELEMENT XR mass spectrometer. The 193 nm laser was operated with 5 mJ energy and a pulse frequency of 10 Hz. The standard spot size of 100 μm was occasionally reduced when saturation caused by elevated manganese levels or the presence of antimony particles occurred. A 20 s pre-ablation time was followed by a 30 s collection time (equivalent to 10 mass scans). Fifty-eight isotopes (from Li to U) were concurrently measured and the signal intensities were subsequently quantified as detailed by Gratuze [40]. The average values of repeated measurements of the standard reference materials Corning A, B, and NIST 612 are given in Table S2.
To determine and visualize the crystalline phases present in the glass matrix, the polished and carbon coated samples were investigated at IRAMAT-CEB using a FEI Philips XL40 environmental scanning electron microscope (SEM) equipped with an energy dispersive spectrometer (EDS). Back-scattered images (BSE) were obtained and semi-quantitative analyses of opacifiers and colorants were performed with an acceleration voltage of 20 kV, a beam diameter of 1 μm, and a working distance of 10 mm for 300 s. A subset of samples (four red, four white, three yellow, two blue, two turquoise, and one orange sample) was furthermore analyzed by x-ray powder diffraction (XRPD). The samples were selected based on the LA-ICP-MS and SEM results to capture the different compositional and textural variants identified among the Noheda tesserae. For the XRPD analyses, about 15–20 mg of the tesserae was powdered by means of an agate pestle and mortar. Data were recorded on a Bragg−Brentano D8 Advance Bruker diffractometer (Cu Kα radiation) equipped with a LynxEye XE detector over a two theta angular range of 15° < 2θ < 70°, with a step of 0.021° and 1 s per step. The International Centre for Diffraction Data (ICDD) PDF-4 2019 database [41] was used for the identification of observed phases in the XRD patterns.
2.2. Data Analysis/Statistical Methods
The assemblage was divided into color groups determined by optical inspection, and as a second criterion, the magnesia and potash levels (Figure 2, Table 2). To statistically evaluate the different groups of tesserae in terms of their base glass composition, the TiO2/Al2O3 and Na2O/CaO ratios of the individual groups (Figure S1) were compared using a nonparametric two-tailed Mann–Whitney U-test (MW, for pairwise comparison) as well as a Kruskal–Wallis test (KW), followed by a post-hoc Dunn’s multiple comparison test, and Welch’s analysis of variance (ANOVA) with a Games–Howell post-hoc test (for multiple comparisons). The resulting P-values are reported in the main text (where relevant) and in the Supplementary Materials (Table S3).
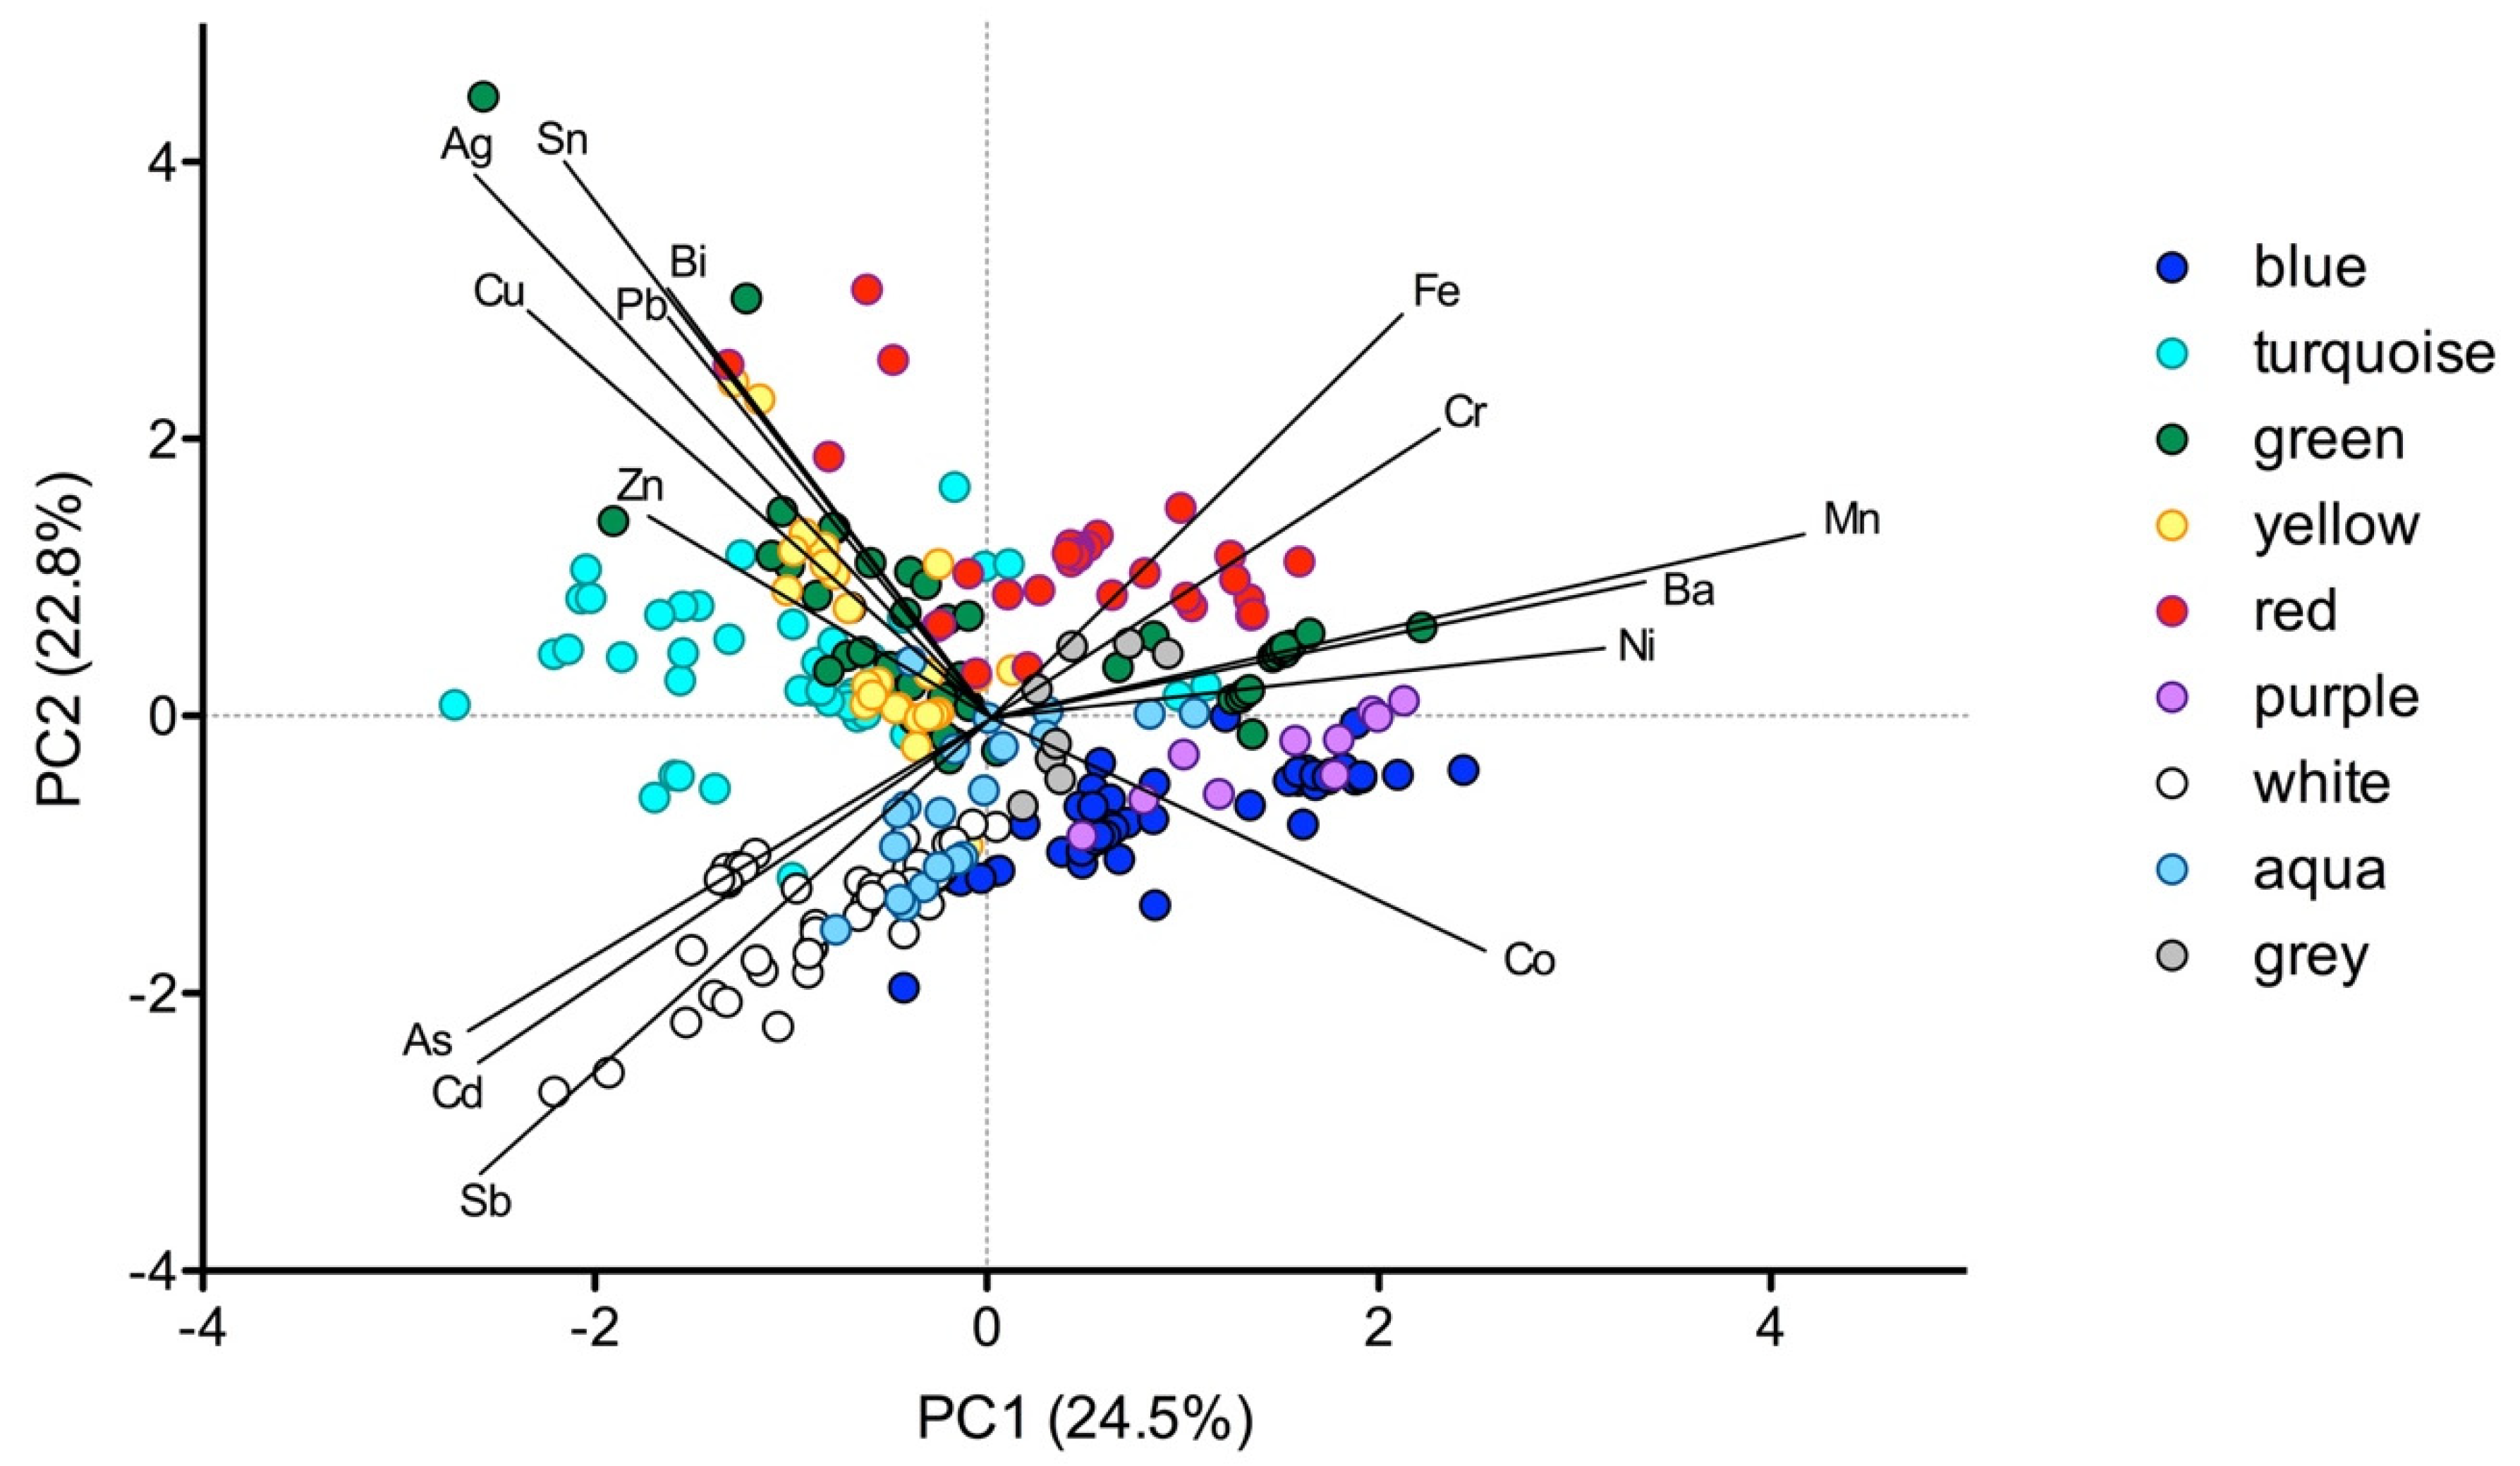
To visualize the color specificity of the different color groups and the co-variation of the colorants, opacifiers, and associated elements, principal component analysis (PCA) was performed on the LA-ICP-MS data of 15 of the identified coloring elements (Mn, Fe, Cu, Sb, Pb, Cr, Co, Ni, Zn, As, Ag, Cd, Sn, Ba, and Bi). Vanadium, gallium, indium, platinum, and gold that deviate in some of the colored samples from the colorless tesserae were excluded from the PCA because they were found to not offer additional distinguishing criteria. The PCA was run on the correlation matrix of the non-normalized data (all expressed in element ppm) using the open-source Response of Humans to Abrupt Environmental Transitions (RESET) database and statistical tools [42]. Principal components PC 1 and PC 2 with Eigenvalues of 3.7 and 3.4, respectively, account for approximately 47% and are represented in a bivariate graph (Figure 3).
3. Results
3.1. Base Glass
A comparison of the magnesium and potassium oxide concentrations (Figure 2a; Table 1) demonstrates differences in the fluxing agent. The vast majority of tesserae had low values of both oxides (<1.5 wt %), which is indicative of the use of natron, while a subset of the red, translucent green, and all of the orange samples has high magnesia and potash (>1.5 wt %) as well as high phosphorus oxide levels (>0.7 wt %), pointing to the addition of an ash component [43]. A group of white tesserae has notably elevated magnesia levels but is low in potassium. An excess in magnesia in antimony white glasses has already been observed elsewhere, but no conclusive explanation has been advanced [44,45,46,47]. The fact that the only other elements that are substantially increased in these white tesserae are antimony, and to a lesser degree arsenic, strongly suggests that the excess in magnesium may have been introduced as part of the opacifying procedure (Table 2).
Oxide ratios such as TiO2 to Al2O3 and Na2O to CaO enable further classification of the tesserae from Noheda. These elements reflect the feldspars, heavy minerals, and carbonates introduced as part of the silica source in relation to the fluxing agent (Figure 2b and Figure S1). Na2O/CaO ratios have proved efficacious in distinguishing Roman antimony de-colored glasses from Roman manganese de-colored as well as Roman mixed antimony and manganese containing samples [50,51]. Antimony or manganese oxides were added during the imperial period to neutralize the greenish-blue hues caused by the natural impurities of the raw materials, a process that appears to have occurred on a large scale at the primary production stage in Egypt (Roman Sb) and the Levant (Roman Mn) [52,53]. The presence of both manganese and antimony in the same glass has been shown to be the result of the mixing of both glass types during recycling [52,53]. The tesserae from Noheda have, with very few exceptions, low TiO2/Al2O3 ratios (<0.055), and moderate Na2O/CaO ratios (2 < Na2O/CaO < 3.5), exhibiting characteristics typical of Roman mixed and Roman Mn glasses [52]. A group of turquoise samples shows considerably higher Na2O/CaO ratios (Figure 2b and Figure S1) because of exceptionally low lime concentrations. Judging from their high Na2O/CaO ratios, low alumina values (Al2O3 < 2 wt %), somewhat elevated titanium oxide (>0.11%), and manganese contents at natural contamination levels (<250 ppm), some of the turquoise tesserae appear to have been made from a different base glass, possibly related to Roman antimony de-colored glass (Table S1). The majority of the high Mg white tesserae also has low alumina contents and manganese oxide at natural impurity levels (<250 ppm), suggesting that these samples may also be of a Roman antimony de-colored base glass (Table S1). Only three natron samples stand out for their very high TiO2/Al2O3 ratios (Figure 2b). Their compositional features include high iron, manganese, and titanium (Table S1), identifying them as so-called HIMT glass, produced most likely in Egypt during the fourth and fifth century CE [11]. The plant ash glasses appear well separated from the bulk of the assemblage on account of somewhat higher TiO2/Al2O3 and lower Na2O/CaO ratios.
For setting the Noheda tesserae in the broader context of Roman base glass compositions, the data were compared to published values obtained for glass cullet, transported by the Iulia Felix ship, sunk in the Grado Lagoon at the beginning of the third century CE. Analyses of the Iulia Felix glasses identified two main groups, corresponding to the two different decolorizing technologies: one utilizing antimony and the other using manganese. A third group represents recycled glasses, providing evidence of mixing of the two primary glass groups [14,49]. The Iulia Felix assemblage is given as a series of five contours of kernel density estimates [42] of the different Roman subgroups (Figure 2b). The Noheda tesserae overwhelmingly (approximately 90% of the natron glass tesserae) coincide with the Iulia Felix mixed group.
The preponderance of a recycled/mixed base glass is confirmed when isolating the gold-leaf tesserae, because their composition is not significantly affected by the addition of coloring agents or opacifiers. As demonstrated by Freestone [52], the ratio of manganese to the sum of manganese and antimony compared to the alumina levels reveal the proportional recycling and mixing of Roman antimony and Roman manganese de-colored glasses (Figure 2c). The majority of the gold leaf tesserae from Noheda indeed exhibit a mixed composition, with only seven of the 70 samples representing the manganese de-colored end member (Sb < 30 ppm) that may contain an element of the Foy 3.2 glass type [10]. Four samples (340, 342, 362, and 414) may be considered antimony de-colored glass in the strict sense (Mn < 250 ppm) (Figure 2c, Table S1). Furthermore, we did not observe any significant differences between the TiO2/Al2O3 and Na2O/CaO ratios of the colorless samples (n = 70) and those of all other natron-type glasses (all colors, n = 311), indicating that the colorless tesserae reflect the base glass composition of the Roman spectrum tesserae as a whole (MW test, TiO2/Al2O3: P = 0.7307; Na2O/CaO: P = 0.1376). We thus conclude that the mosaic assemblage from Noheda comprises mostly mixed Roman antimony and manganese glass with on average relatively high soda (18.5%), low magnesia (0.65%), potash (0.5%), titanium oxide (0.10%), and zirconium (56 ppm) as well as moderate alumina (2.18%) and lime (6.46%) levels, as judged by the gold leaf tesserae (Table 1). This mean composition can be used to estimate the coloring and opacifying additives that underlie the color palette of the Noheda tesserae (see below), even though individual tesserae may deviate from this average composition. For example, about half of the turquoise tesserae and most of the high Mg white tesserae have compositions closer to Roman Sb glasses with no manganese (Mn < 250 ppm) as well as lower than average alumina concentrations. The overall homogeneity of the base glass composition of the mosaic tesserae is reflected in the exceptionally low standard deviation across the major and minor base glass elements for all the natron type tesserae (n = 381; Table 1). The relatively uniform composition of the mosaic tesserae from Noheda is ultimately further proof that the glasses are the result of an efficient recycling system. Repeated and/or large-scale recycling would necessarily converge the glass toward a common composition.
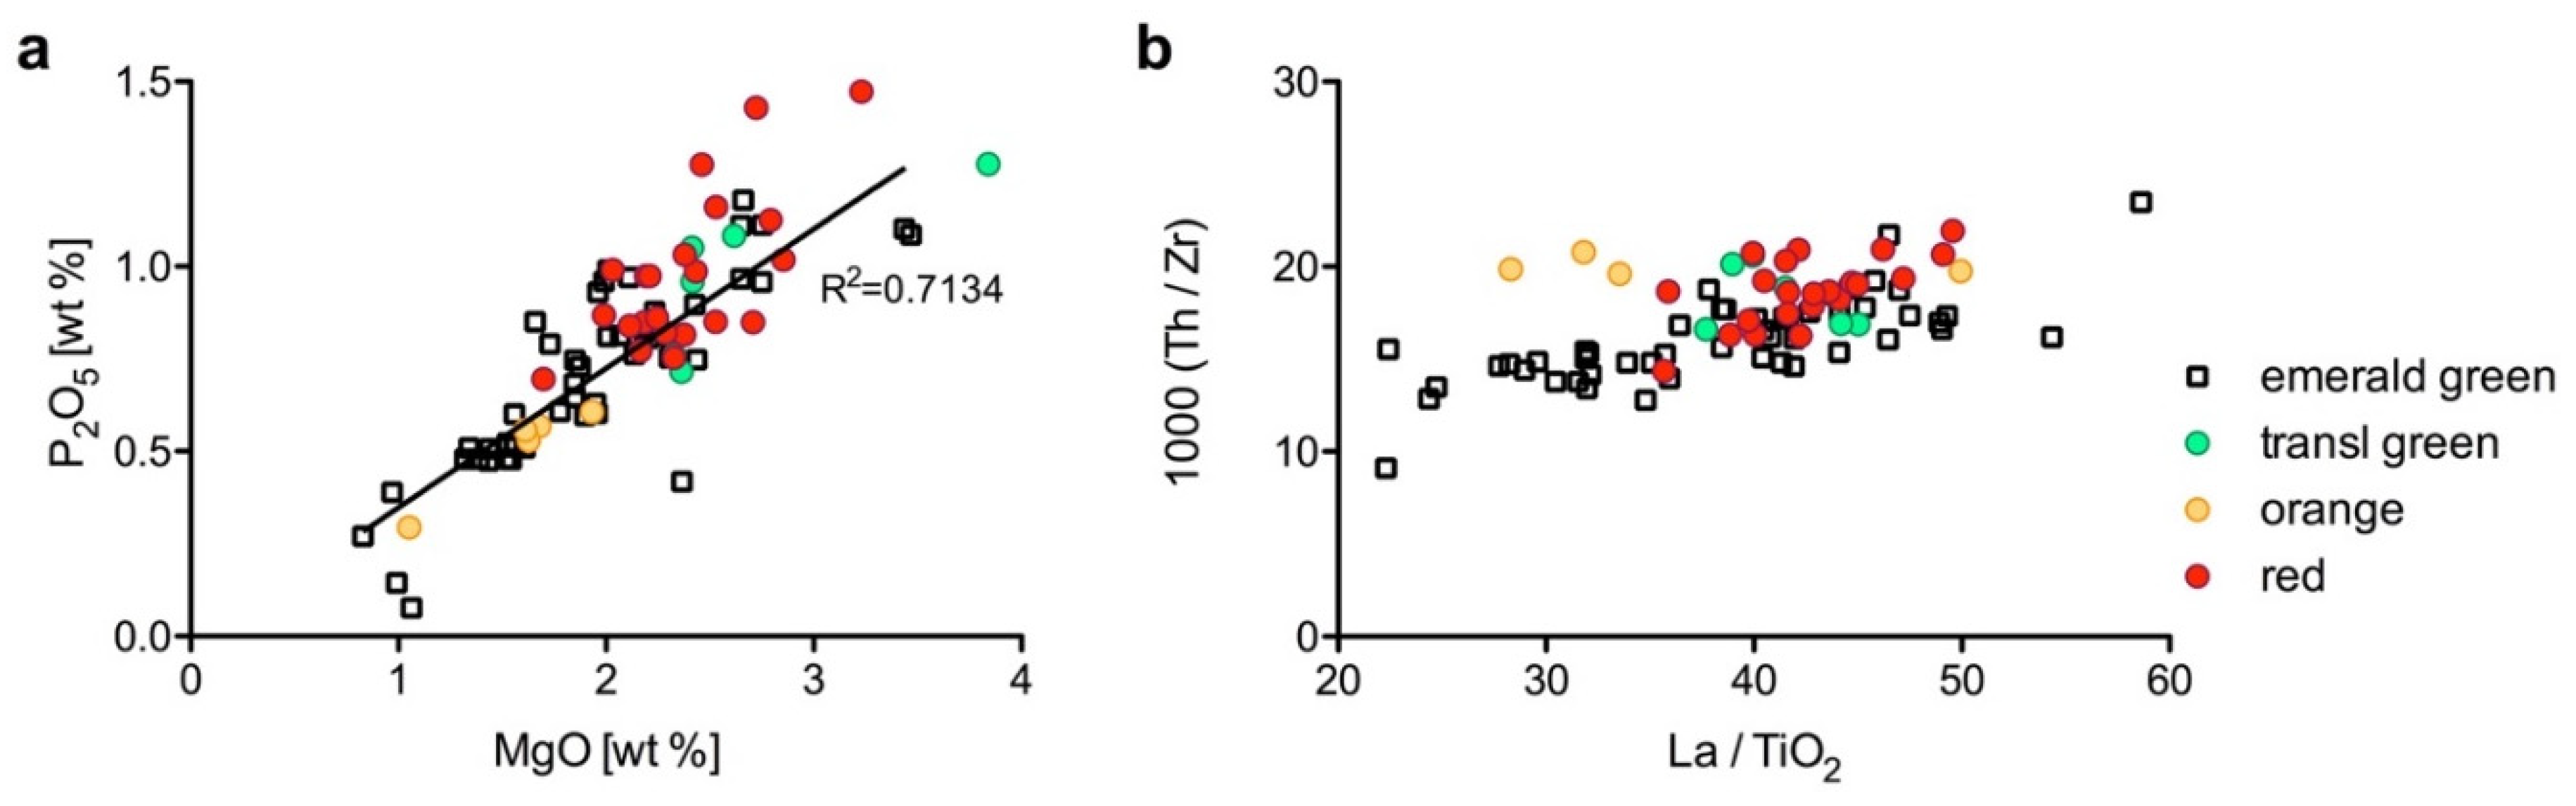
In contrast, the red, green, and orange plant ash samples have a distinct base glass composition. Apart from the elements associated with the ash component (MgO, P2O5, K2O, CaO, Sr) that are much higher than in the natron-type tesserae, they also differ in terms of silica related elements such as titanium and zirconium (Table 1). The compositional differences become particularly pronounced when comparing the natron red and green tesserae with their plant ash counterparts (Figure 2d). The higher titanium and zirconium contents relative to thorium and lanthanum clearly distinguish the red and green plant ash tesserae from the red and green natron samples, reflecting a different region of origin. More precisely, the plant ash red and green samples show features typically associated with an Egyptian provenance [11]. Since the orange samples cluster in the same field, they can tentatively be included in this group.
3.2. Coloring and Opacifying Technologies
Having shown that the glass tesserae from Noheda were produced from a similar base glass independent of the color, the additives introduced during the coloring and opacifying process can be mathematically estimated by subtracting the average composition of the gold leaf tesserae from the average composition of the individual colors. The elements that differ by two standard deviations from the average gold leaf tesserae composition were thus classified as potentially significant (highlighted in red in Table 2). For example, manganese is considerably elevated only in the purple tesserae in both the opaque as well as the translucent purple sub-groups. High levels of iron oxide distinguish the red as well as the translucent green samples, whereas copper in different oxidation states underlies the red, green, and turquoise glasses. Cupric oxide (CuO) is responsible for the opaque green and turquoise tesserae, and cuprous oxide (Cu2O) and/or particles of metallic copper for the red and orange hues, typically in combination with varying levels of lead. Copper is slightly elevated in the translucent green, opaque aqua, and grey tesserae. The presence of cobalt is associated with a deep blue color, even at low levels (≥100 ppm). The main coloring elements (Mn, Fe, Cu, Sb, Pb, and Co) are differentially associated with traces of tin, nickel, zinc, gallium, arsenic, cadmium, indium, barium, gold, and bismuth (Table 2).
To assess the co-variation between the different coloring and opacifying agents and the associated trace elements, a principal component analysis (PCA) was conducted and visualized in a simple binary plot (Figure 3). There is an intimate relationship between the turquoise and opaque green tesserae due to copper being the defining colorant associated with elevated tin and zinc. Green is also closely related to yellow, because of the use of lead oxide as a major additive that introduced traces of bismuth [54]. The distinguishing feature of the majority of the red tesserae appears to be high iron levels that caused an increase in chromium. The translucent green samples (green samples displaced to the right) and most of the purple tesserae are singled out on account of their elevated manganese to which barium is attached. Some of the cobalt blue tesserae have elevated nickel, while the white and aqua colored samples are defined by high antimony contents associated with arsenic and cadmium (Figure 3).
3.3. Antimony Compounds as Opacifier
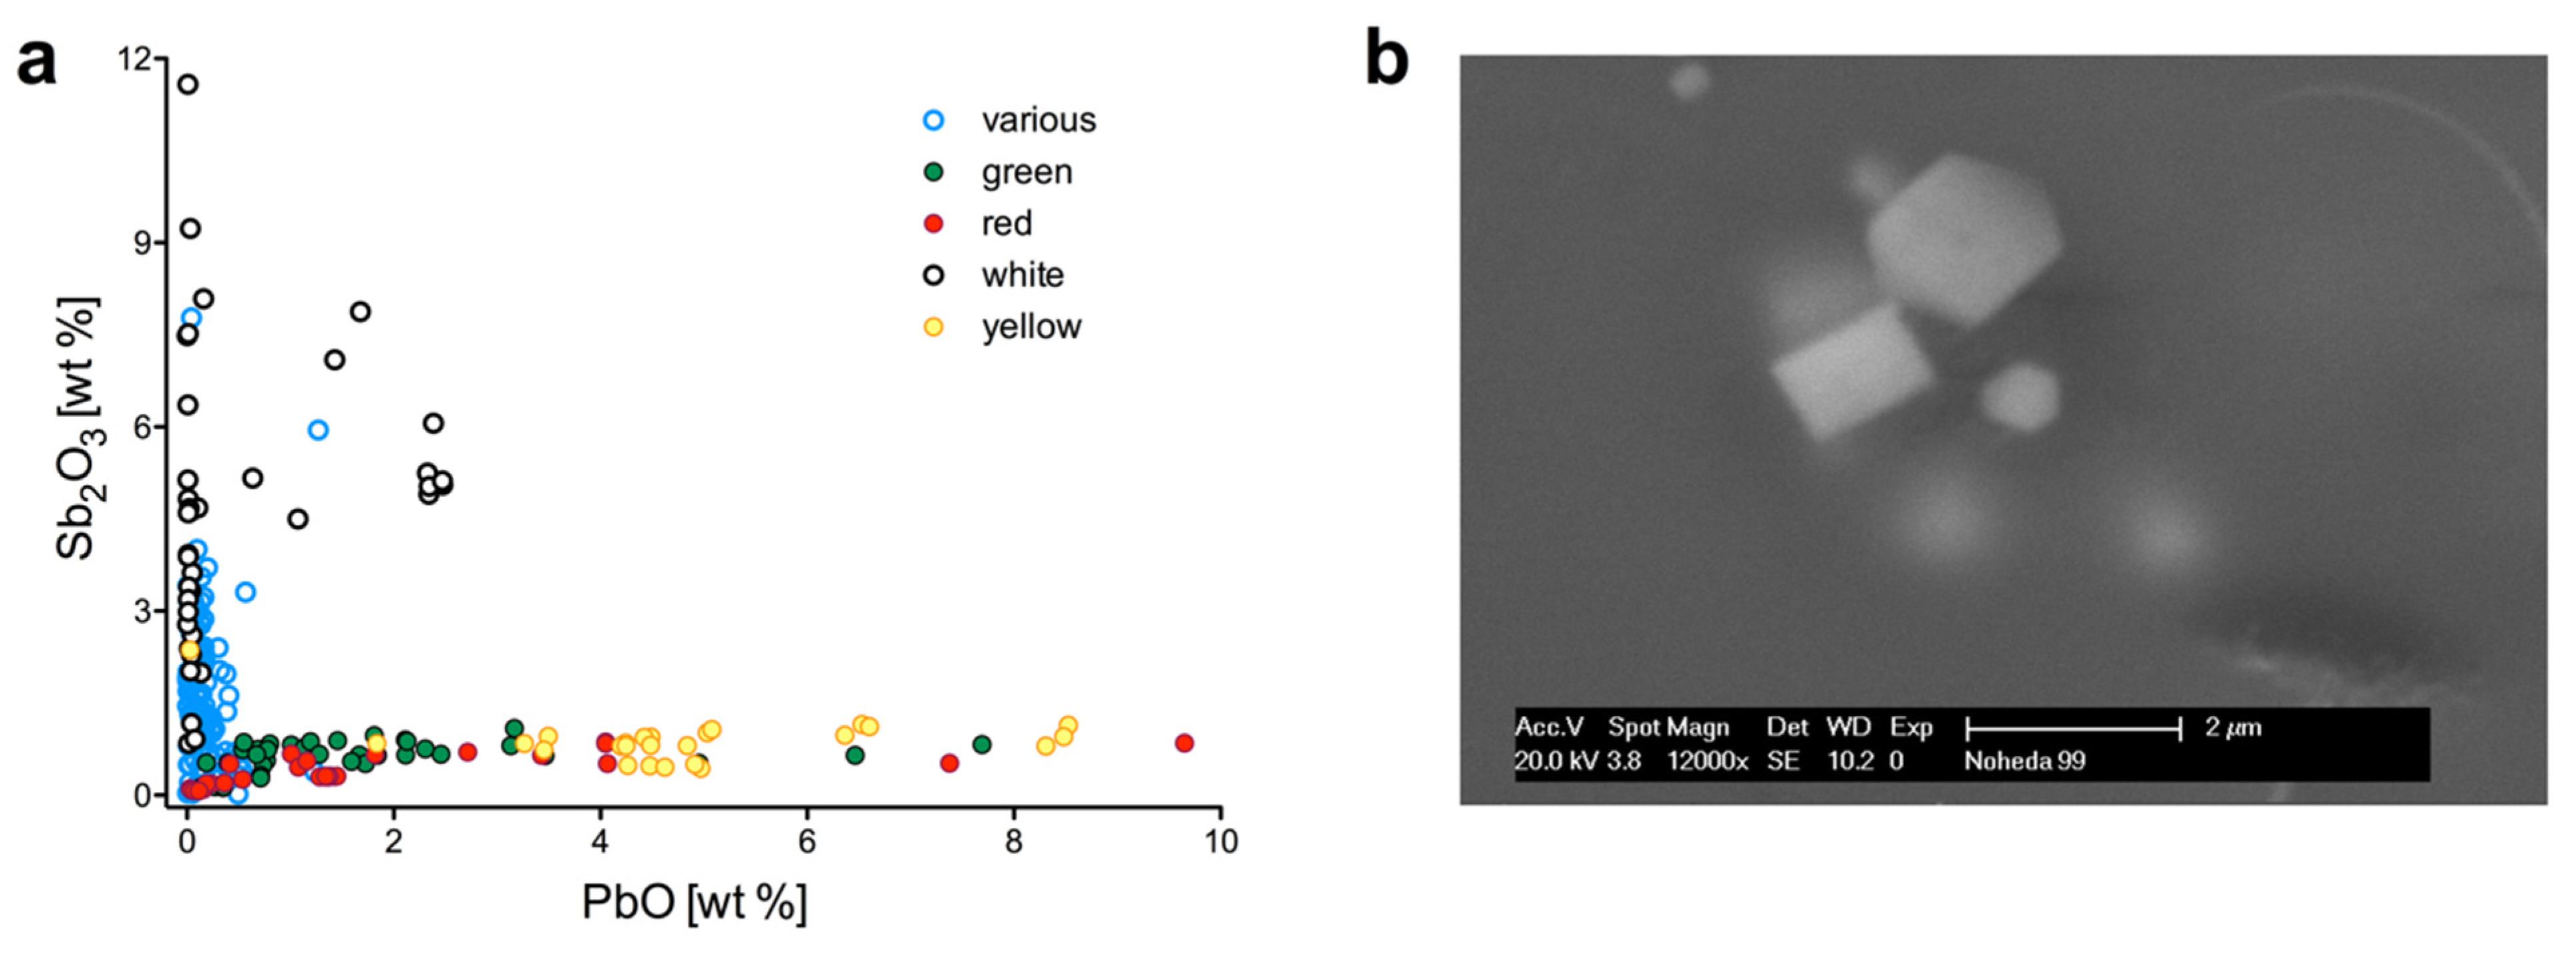
The main opacifying agents are antimony compounds either in the form of calcium antimonate or lead antimonate (Figure 4a). Microstructural observations at the electron microscope confirmed the absence of tin-based opacifiers as well as any opacification technologies popular during the medieval period such as the addition of crushed quartz and the intentional formation of air bubbles in the glass melt [55]. The aqua, white, blue, grey, turquoise, and light purple tesserae are all opacified by white crystals, distributed throughout the glass matrix. Microanalysis exclusively detected the presence of calcium antimonate as the main opacifier. As confirmed by both SEM and x-ray diffraction analyses, the crystals are present in both the orthorhombic (Ca2Sb2O7) and hexagonal (CaSb2O6) forms (Figure 4b and Figure 5). Interesting is the prevalence of the hexagonal form CaSb2O6 in some of the white and turquoise tesserae (Figure 5). In most opaque Roman glasses, the orthorhombic Ca2Sb2O7 is more frequently observed, and whenever CaSb2O6 is identified, it is typically in turquoise tesserae, combined with a sodium-rich base glass type (high Na2O/CaO ratios; [50] and references therein). The white and turquoise tesserae for which XRD patterns are available (except for Noheda 302) have relatively high antimony oxide levels (Sb2O3 > 3%) and no or very low manganese. These features suggest the use of a base glass with a high proportion of Roman antimony glass, implying a glass high in soda and relatively low in lime (Table S1). In contrast, only Ca2Sb2O7 was identified in high Mg white and blue tesserae (Figure 5). While the latter have on average higher lime concentrations and thus lower soda to lime ratios, the excess in magnesia in the whites may have impacted the formation of the calcium antimonate particles.
The lime contents of the opacified tesserae are essentially unchanged compared to the colorless tesserae, pointing to the addition of antimony oxide or sulfide rather than calcium antimonate to a base glass, and heating it to a temperature of close to 1100 °C [56,57,58,59,60]. This is confirmed by the microstructure of the white tesserae, which shows that opacification was obtained by in situ crystallization (Figure 4b). Some of the white tesserae that appear particularly bright and homogeneous, additionally contain lead oxide (1.08 < PbO < 2.47 wt %). White glasses with variable amounts of lead have been documented since the Hellenistic period, particularly in cameo and mosaic glass [58,61,62]. Even though it has been proposed that the lead may have been accidentally introduced with the antimony [58], recent experimental work has demonstrated that the presence of as little as 2% lead oxide modifies the viscosity and thus the workability of the glass, and facilitates the formation and dispersion of Ca2Sb2O7 crystals during the melting process [59,63]. Elevated concentrations of lead were also found in some of the blue, turquoise, and grey tesserae from Noheda (1.00% < PbO < 2.13%). This may be due to the use of a lead rich antimony ore [58], a calcination procedure that involved the use of lead to refine the antimony minerals [63], or simply the result of recycling processes such as the addition of lead-white glass to a translucent colored glass (Figure 4a, Table S1). This practice of adding an opacified glass to a strongly colored translucent glass has been documented in seventh-century mosaics from Rome [64].
Opaque yellow and green tesserae are colored and opacified by yellow lead antimonate crystals in the form of Pb2Sb2O7 (Figure 5). As is typical for ancient yellow glasses [65], the Noheda tesserae have a heterogeneous micro-structure as a result of the uneven distribution of the opacifier within the glass matrix. The crystals have roundish edges and are frequently surrounded by air bubbles, testifying to a chemical interaction between the crystals and the glass. As noted in the scientific literature, lead antimonate crystals disintegrate at relatively low temperatures, and in order to prevent the loss of the yellow color, the pigment needs to be added rapidly to the molten glass [60,66]. Experimental investigations demonstrated that the Venetian technique of adding the anime (lead–antimony–silicate pigment) to the base glass was a convenient practice, probably already adopted in antiquity [60,66,67,68].
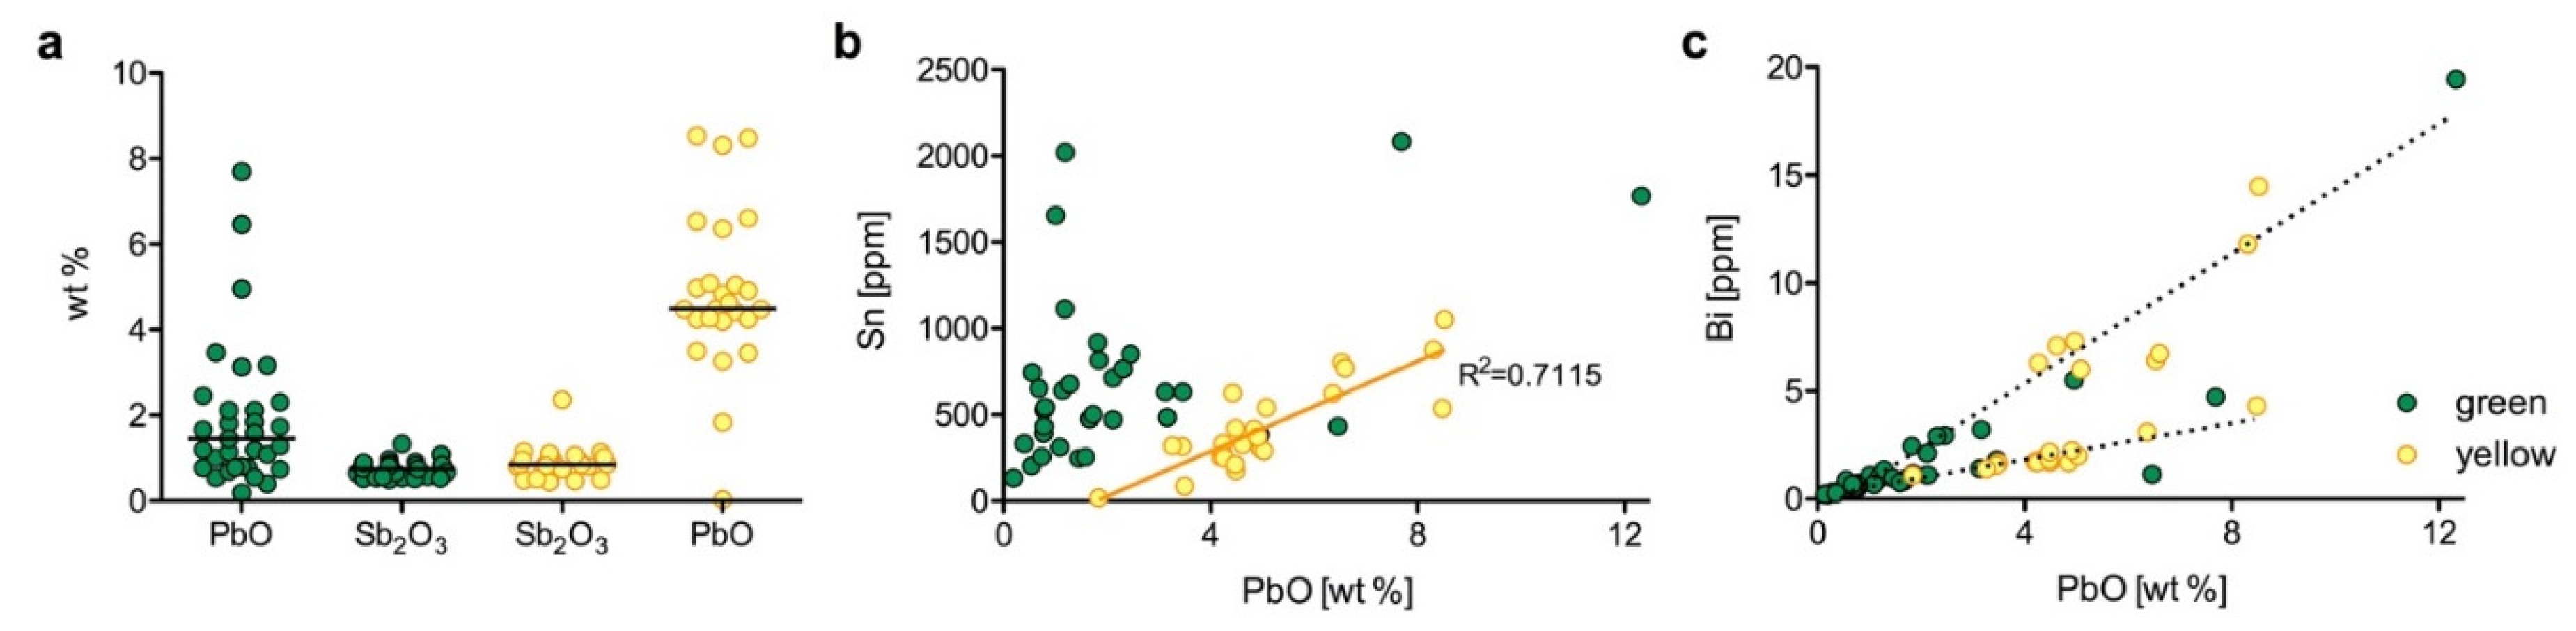
The LA-ICP-MS data of the yellow and opaque green samples revealed relatively constant levels of antimony oxide (median Sb2O3 approximately 0.85% and 0.74%, respectively), whereas the lead oxide in the yellow samples is significantly higher with a median of about 4.5% compared to 1.5% in the green samples (Figure 6a). These values represent an approximation of the excess of lead and antimony that have gone into solution in the glass matrix, rather than the absolute concentrations, because crystalline phases are generally avoided during analyses. The excessive lead would have reduced the melting temperature and thus helped preserve the yellow lead antimonate pigment [58]. The separate x-ray microanalysis of the crystalline aggregates showed that they are in fact a combination of crystals containing lead and antimony, and lead and tin. This combination of tin and antimony was observed in samples where the matrix contained as little as 0.1% tin oxide. Rather than reflecting a specific opacification technique [68,69], however, it is more likely that some tin entered the glass as a by-product of the lead raw material. In the yellow tesserae, tin shows a strong positive correlation with lead, supporting the interpretation of tin as an impurity of the lead source (Figure 6b). Different correlations between lead and bismuth (Figure 6c) illustrate instead that different lead-rich materials were exploited for the production of the yellow lead antimony pigment. This difference was independent of the final color, as both green and yellow samples display both correlations. The opaque green tesserae are additionally colored by copper oxide (CuO). The main coloring element of the translucent green samples instead appears to be high iron dissolved in the glass matrix (Table 2). This applies to both the natron-type as well as the plant ash translucent greens with the possible exception of one sample each, indicating two very different coloring technologies.
3.4. Cobalt and Copper as Colorants
The strong coloring power of cobalt ions causes an intense blue coloration, requiring only very small quantities as low as 100 ppm (Table S1). In some of the translucent cobalt blue tesserae from Noheda, we detected inclusions of the cobalt colorant, characterized by the association of cobalt with iron, alumina, and nickel. The nature of cobalt-bearing raw materials used in antiquity for coloring blue glasses is still unclear. A recent investigation distinguished two different cobalt sources according to the CoO/NiO ratios, which changed from higher to lower ratios sometime during the fourth century CE [70]. Interestingly, the cobalt blue samples from Noheda exhibit two distinct correlations of cobalt to nickel (Figure 7a), suggesting that two different cobalt sources were used, thereby confirming that the transition from the ancient cobalt source to the exploitation of a nickel-rich cobalt source occurred in the fourth century CE. The association of cobalt with nickel may point to the exploitation of the minerals erythrite or skutterudite as source material, while the earlier Roman pigments may have been made from cobalite, which is characterized by higher iron and arsenic [71,72] (Table S1).
As is well established by now, opaque red and orange colors were obtained by the precipitation of crystals of cuprous oxide (Cu2O) and/or nanometric particles of metallic copper during thermal treatment ([73] and references therein). Lead acts as a reducing agent that facilitates the precipitation of cuprous oxide, while iron seems to play a key-role in the precipitation of metallic copper. It has also been proposed that plant ash or wood ash was occasionally added to the molten glass in its capacity as a reducing agent. The red glasses from Noheda are quite variable in terms of iron, lead, and copper concentrations, and can be subdivided according to their lead and iron relative to copper contents (Figure 7b). All the red tesserae with a natron-type base glass are characterized by higher Fe2O3/CuO ratios and are, in most cases, either low in lead or lead free. Their composition is thus consistent with low-lead/low-copper red glasses colored by metallic copper rather than cuprous oxide, which was confirmed by x-ray diffraction analysis (Figure 5). The red tesserae containing a plant ash component are associated with variable concentrations of lead oxide (0.42 < PbO < 7.89) and generally low Fe2O3/CuO (<1.5). The mild reducing effect of plant ashes may have aided the formation of the crystalline phase. No dendritic cuprous oxide crystals were identified by SEM in any of the red samples, and nanometric particles responsible for the color and opacity of these tesserae are merely visible as bright dots. The XRD data of four red tesserae (two natron and plant ash samples each) exclusively revealed metallic copper (Figure 5).
The orange tesserae form a technologically distinct group with high lead (15.8 < PbO < 33.2 wt %) and high copper (5.69 < CuO < 9.98 wt %) concentrations, resulting in Fe2O3/CuO below 0.5 (Figure 7b). Data from the literature suggest that orange is usually generated by the presence of cuprite particles (Cu2O) [73,74,75]. Crystals with the typical dendritic structure of cuprous oxide (Cu2O) were clearly visible in the SEM, often accompanied by nanometric particles that could be either cuprous oxide or metallic copper (Figure 7c). The color ultimately depends on the crystal size and heat treatment. Small cuprous crystals (<5 μm) appear yellow, the red color becomes more intense the larger the particles grow [76,77]. In the tesserae that exhibit alternating deep red and orange bands, it is likely that the nanoparticles represent metallic copper, resulting from the reduction of cuprous oxide. XRD analysis of a truly orange sample identified only cuprous oxide (Figure 5). Inclusions, representing relics of the raw materials used for coloring are clearly visible in some of the samples (Figure 7d). These inclusions are characterized by grey zones, surrounded by light particles. The grey central part of the inclusions fit well with the composition of the glassy phase of copper or iron smelting slags [78]. The surrounding high-copper particles and air bubbles are indicative of a chemical reaction between the inclusion and the glass matrix. Inclusions of this kind are accompanied by calcium-silica crystals, probably wollastonite, one of the devitrification phases commonly precipitating inside the glass melt [79]. It has been widely assumed that Roman orange glasses were typically colored using either metallic copper or copper alloys, possibly in the form of scale, from metallurgical workshops [75,80,81]. The earliest use of metallic slag for coloring glass was attributed to fifth- to seventh-century northern Europe [78,82], but has since been identified in some fourth-century red tesserae from Aquileia [17]. Our data from Noheda support the hypothesis that this technological innovation originated in the Mediterranean in the fourth century, or possibly even earlier. Generally, the copper used for the green, red, orange, and turquoise tesserae is associated with elevated tin and zinc contents, but no clear pattern was identified either among the same color or between colors. This suggests the use of different copper alloys and/or different copper alloy waste products for the coloration of the tesserae.
4. Discussion
Our analytical data demonstrate that the tesserae from Noheda were almost exclusively made from mixed Roman antimony and manganese decolored glass. Whereas both Mn as well as Sb decolorized raw glass chunks have been found in the cargo of shipwrecks, supporting the addition of both decolorants at the primary production stage [52,83,84], the mixing of Mn and Sb was the result of recycling. Glass recycling appears to have been systematic and large-scale, in particular on the western fringes of the Roman Empire. This is reflected in the mixed composition of numerous glass assemblages and archaeological evidence from, for example, Roman Britain [63] and the seaborne trade of glass cullet [14,83]. Recycling and mixing of both end members of Roman glasses (Roman Sb & Mn) are less evident in areas close to the primary production sites in Egypt and the Levant. The higher incidence of recycling in the western regions of the empire has implications for our model of mosaic production during the later Roman period. The preponderance of mixed Roman Sb and Mn glass among the tesserae of Noheda and numerous other mosaic assemblages [48,50] strongly suggests that secondary workshops specializing in the production of strongly colored glasses for mosaic making were far removed from the primary production centers in Egypt and the Levant, and located perhaps somewhere in the western Mediterranean.
While the manufacture of mosaic tesserae during the later Roman period relied heavily on the use of recycled material possibly in the form of cullet, its transformation into new strongly colored tesserae involved numerous additives and a series of, at times, complex glass coloring technologies. The exceptional homogeneity of the base glass composition of the mosaics from Noheda allowed the identification of the different coloring agents and provides new insights into the organization of tesserae production and trade (Table 2). The variability of the colorants and their co-variation with accessory trace elements imply the use of different raw materials for coloring, and by extension, probably different secondary workshops. The remarkable compositional characteristics of some of the tesserae, most notably the group of samples with a plant ash component, and the compositional differences among the white tesserae point to distinct production sites and/or the use of different recipes for coloring the glass. Different types of white tesserae (Sb whites with and without Pb; high Mg), for example, imply the use of three different opacifying recipes. Lead-white glass is known from mosaic tesserae cut from glass rods, cameo, and millefiori vessels dating between the first century BCE and the first century CE [59,61], but has also been documented in medieval beads [85,86] and mosaic tesserae [69]. This means that either these tesserae were recycled and/or reused or that the selective addition of lead to modify the material properties of white glass was practiced as late as the fourth century CE.
The translucent green plant ash tesserae may represent a relic of a distinctive type of emerald green glass that was identified in vessels and occasionally in mosaic tesserae from the Hellenistic period through to the second century CE [5,50,87,88]. The production and circulation of first-century CE emerald green glass vessels has been studied in some detail, revealing a relatively homogeneous group, for which the authors proposed a provenance in the eastern Mediterranean, possibly Egypt [88]. The translucent green as well as the red and orange plant ash tesserae from Noheda have very similar compositions to the emerald green vessels. The atypically high phosphorus positively correlated with magnesia (Figure 8a) distinguishes these glasses from all other known Near Eastern or Mesopotamian plant ash glass types [88]. The tesserae and the emerald green vessels also form a uniform compositional group in terms of the elements associated with the silica source such as high titanium and zirconium levels relative to lanthanum and thorium (Figure 8b), suggesting a common Egyptian origin. Given the relatively coherent compositional grouping and clear geographical attribution, it is likely that the location of secondary working of these glasses may also have been in the same region, even though the coloring techniques differ. The emerald green vessels are unvaryingly colored by the presence of copper oxide (Cu(II)) and iron, and the translucent green tesserae (except Noheda 292) contain no copper, but an excess of iron oxide (Table S1). Hence, the vessels represent a very different glass coloring technology. The generation of a vibrant copper emerald green involves a complex combination and interaction of elements and heat treatments [88], whereas the production of iron oxide green can be considered comparatively simple.
Distinct glass-coloring recipes also underlay the red and orange tesserae. Metallic copper or cuprous oxide crystals responsible for red and orange, respectively, require reducing conditions. The techniques appear to be related even though metallic copper is bound to precipitate more easily than cuprite. The orange glasses contain a considerable amount of lead and much higher copper concentrations. Lead was most certainly intentionally added to aid the growth of dendritic crystals and possibly enhance its brilliance [75]. The evidence from Venetian glass recipe books offers a useful parallel. In Venice, orange glass was made in a three-step process, where lead oxide was introduced to a base glass, to which the coloring agent was subsequently added [69,89]. The Noheda oranges may have been made in a similar way, using a lead-rich base glass that was then colored by a copper compound. Given the strong corrosive nature of lead, it is likely that the base glass was contaminated by the ceramic crucibles, which could explain the higher alumina levels compared to the red tesserae. It is therefore impossible to tell at this stage whether or not the red and orange plant ash tesserae were produced in the same secondary workshop and/or from the same base glass.
5. Conclusions
The mosaics of Noheda represent the entire range of known primary colorants and opacifiers used in strongly colored Roman glasses. The comprehensive sample size revealed considerable variations in the use of coloring raw materials, and hence different secondary production technologies and workshops. The plant ash tesserae are most certainly of an Egyptian origin. Some of the low lime, low manganese turquoise samples are consistent with a Roman antimony decolored glass, and so are some of the white, especially the high Mg white tesserae. They presumably represent the reuse of older Roman material. The bulk of the mosaic tesserae recovered from Noheda (about 90%) have a relatively homogenous mixed base glass composition. There are a number of significant differences in the elements associated with the colors and opacity of the samples. At least two different lead sources were exploited for the opaque green and yellow samples, and the lead to antimony ratios differ between the two colors. The copper-rich raw materials responsible for the green, red, and turquoise tesserae exhibit different trace elements, and two different cobalt sources were used. These variations imply either small-scale productions or the output of different secondary workshops. It seems unlikely that a single workshop dedicated to the production of tesserae supplied all of the material for the floor decoration of the Roman villa at Noheda. Given the variability between samples of the same color, the mosaicists must have procured the material at different times and/or from different sources. Nevertheless, it seems likely that the material was acquired specifically for the decoration of the villa and not salvaged from building debris. The site of the villa of Noheda is in an isolated location, far from the urban dynamics that would have promoted efficient and large-scale recycling. The glass tesserae or cakes from which the tesserae were cut must have been brought to Noheda especially. The mosaics were evidently the results of an ambitious artistic campaign, reflected in the sophisticated iconography and technical execution as well as the use of newly procured materials.
This paper expands the corpus of analytical data of late antique mosaic tesserae and late antique colored glass more generally, providing a reference for the composition of fourth-century Roman glass tesserae. We demonstrate that colored glass circulating in Spain during the fourth century was made by coloring a mix of recycled Roman Sb and Mn base glass. The location of the secondary workshops remains elusive, but they must have been located in regions with a high availability of Roman antimony and Roman manganese glass for recycling purposes. Among the tesserae, we identified various coloring technologies, suggesting that they were the product of different specialized secondary glass-coloring workshops. For instance, plant ash green and lead-white tesserae are comparable to glasses of the first century CE and may represent the survival of these specialized productions or the reuse of older material. Two different types of cobalt colorants point to the transition from a Roman to a new late antique cobalt source in the fourth century. Similarly, the orange tesserae from Noheda provide some of the earliest evidence for the use of metallurgical slag in the production of colored glass. A complex picture is thus emerging for the relationships between mosaic workshops and glass suppliers. Workshops responsible for high-end mosaics like the floor mosaics in Noheda clearly had access to a wide range of glass tesserae (or glass cakes) of all the required colors. The variations in the coloring agents and technologies, however, imply that the material was gathered from more than one source.
Supplementary Materials
The following are available online at https://www.mdpi.com/2075-163X/10/3/272/s1, Figure S1: TiO2/Al2O3 and Na2O/CaO ratios of the different glass groups separated by color; Table S1: LA-ICP-MS data of the mosaic tesserae from Noheda; Table S2: Average LA-ICP-MS data of glass standards. Table S3: Statistical comparison of group data.
Author Contributions
Conceptualization, N.S. and C.B.; Methodology, N.S., C.B., and E.V.; Formal analysis, N.S., C.B., and E.V.; Resources, M.Á.V.T. and J.d.J.A.; Data curation, N.S., M.Á.V.T., and J.d.J.A.; Writing—original draft preparation, N.S. and C.B.; Writing—review and editing, N.S. and C.B.; Visualization, N.S., C.B., and E.V.; Funding acquisition, N.S. and M.Á.V.T. All authors have read and agreed to the published version of the manuscript.
Funding
This project received funding from the European Research Council (ERC) under the European Union’s Horizon 2020 research and innovation program (GlassRoutes, grant agreement No. 647315 to NS). Archaeological campaigns were funded by the Spanish Ministry of Economy and Competitiveness (Research Project No. HAR 2016-64386-C4-2-p to MAVT) and the Community Council of Castile-La Mancha (Research Project No SBPLY/17/180801/000019 to MAVT).
Acknowledgments
We wish to thank Maryse Blet-Lemarquand (CNRS-IRAMAT) for her assistance during the SEM-EDS analyses, and particular thanks are given to C.G. Specht for valuable comments on the manuscript.
Conflicts of Interest
The authors declare no conflicts of interest. The funding organizations had no influence in the study design, data collection and analysis, decision to publish, or preparation of the manuscript.
References
- Giacchero, M. Edictum Diocletiani et Collegarum de Pretiis Rerum Venalium: In Integrum fere Restitutum e Latinis Graecisque Fragmentis; Istituto di Storia Antica e Scienze Ausiliarie dell’ Università di Genova: Genoa, Italy, 1974; Volume 8. [Google Scholar]
- James, L. Mosaics in the Medieval World: From Late Antiquity to the Fifteenth Century; Cambridge University Press: Cambridge, UK, 2017. [Google Scholar]
- Wootton, W. Figuring out the facts: Calculating mosaic labour times in 4th-c. AD Britain. J. Rom. Archaeol. 2015, 28, 261–282. [Google Scholar] [CrossRef]
- Boschetti, C. Vitreous materials in early mosaics in Italy: Faience, Egyptian blue, and glass. J. Glass Stud. 2011, 53, 59–91. [Google Scholar]
- Stern, E.M. Roman glassblowing in a cultural context. Am. J. Archaeol. 1999, 103, 441–484. [Google Scholar] [CrossRef]
- Neal, D.; Cosh, S. Roman Mosaics of Britain, Volume I: Northern Britain, Incorporating the Midlands and East Anglia; Illuminata Publishers for The Society of Antiquaries of London: London, UK, 2002. [Google Scholar]
- Weisweiler, J. Domesticating the senatorial elite: Universal monarchy and transregional aristocracy in the fourth century AD. In Contested Monarchy: Integrating the Roman Empire in the Fourth Century AD; Wienand, J., Ed.; Oxford University Press: Oxford, UK, 2013; pp. 17–41. [Google Scholar]
- Brems, D.; Degryse, P. Trace element analysis in provenancing Roman glassmaking. Archaeometry 2014, 56, 116–136. [Google Scholar] [CrossRef] [Green Version]
- Brill, R.H. Scientific investigations of the Jalame glass and related finds. In Excavations at Jalame: Site of a Glass Factory in Late Roman Palestine; Weinberg, G.D., Ed.; University of Missouri: Columbia, MO, USA, 1988; pp. 257–291. [Google Scholar]
- Foy, D.; Picon, M.; Vichy, M.; Thirion-Merle, V. Caractérisation des verres de la fin de l’Antiquité en Méditerranée occidentale: l’émergence de nouveaux courants commerciaux. In Échanges et Commerce du Verre dans le Monde Antique (Actes du Colloque de l’AFAV, Aix-en-Provence et Marseille, 7–9 Juin 2001); Foy, D., Nenna, M.-D., Eds.; Éditions Monique Mergoil: Montagnac, France, 2003; pp. 41–85. [Google Scholar]
- Freestone, I.C.; Degryse, P.; Lankton, J.; Gratuze, B.; Schneider, J. HIMT, glass composition and commodity branding in the primary glass industry. In Things that Travelled: Mediterranean Glass in the First Millennium CE; Rosenow, D., Phelps, M., Meek, A., Freestone, I.C., Eds.; UCL Press: London, UK, 2018; pp. 159–190. [Google Scholar]
- Freestone, I.C.; Gorin-Rosen, Y.; Hughes, M.J. Primary glass from Israel and the production of glass in late antiquity and the Early Islamic period. In La Route du Verre. Ateliers Primaires et Secondaires du Second Millénaire av. J.-C. au Moyen Âge. Colloque Organisé en 1989 par l’Association Française pour l’Archéologie du Verre (AFAV); Nenna, M.-D., Ed.; Maison de l’Orient et de la Méditerranée: Lyon, France, 2000; pp. 65–83. [Google Scholar]
- Jackson, C.M.; Paynter, S. A great big melting pot: Exploring patterns of glass supply, consumption and recycling in Roman Coppergate, York. Archaeometry 2016, 58, 68–95. [Google Scholar] [CrossRef] [Green Version]
- Silvestri, A.; Molin, G.; Salviulo, G. The colourless glass of Iulia Felix. J. Archaeol. Sci. 2008, 35, 331–341. [Google Scholar] [CrossRef]
- Croveri, P.; Fragalà, I.; Ciliberto, E. Analysis of glass tesserae from the mosaics of the ‘Villa del Casale’near Piazza Armerina (Enna, Italy). Chemical composition, state of preservation and production technology. Appl. Phys. A 2010, 100, 927–935. [Google Scholar] [CrossRef]
- Gliozzo, E.; Santagostino Barbone, A.; Turchiano, M.; Memmi, I.; Volpe, G. The coloured tesserae decorating the vaults of the Faragola balneum (Ascoli Satriano, Foggia, Southern Italy). Archaeometry 2012, 54, 311–331. [Google Scholar] [CrossRef]
- Maltoni, S.; Silvestri, A. Innovation and tradition in the fourth century mosaic of the Casa delle Bestie Ferite in Aquileia, Italy: Archaeometric characterisation of the glass tesserae. Archaeol. Anthropol. Sci. 2018, 10, 415–429. [Google Scholar] [CrossRef]
- Vataj, E.; Hobdari, E.; Röhrs, S.; Vandenabele, P.; Civici, N. Analytical characterization of glass tesserae from mosaics of early Christian basilicas in Albania. Appl. Phys. A 2017, 123, 76. [Google Scholar] [CrossRef]
- Marii, F.; Rehren, T. Archaeological coloured glass cakes and tesserae from the Petra church. Annales du 17e Congrès de l’Association Internationale pour l’Histoire du Verre (Antwerp, 2006) 2009, 17, 295–300. [Google Scholar]
- Wypyski, M.T.; Becker, L. Glassmaking technology at Antioch: Evidence from the Atrium House Triclinium and later mosaics. In The Arts of Antioch—Art Historical and Scientific Approaches to Roman Mosaics; Becker, L., Kondoleon, C., Eds.; Worcester Art Museum: Worcester, MA, USA, 2005; pp. 115–175. [Google Scholar]
- Bonnerot, O.; Ceglia, A.; Michaelides, D. Technology and materials of early Christian Cypriot wall mosaics. J. Archaeol. Sci. Rep. 2016, 7, 649–661. [Google Scholar] [CrossRef]
- Neri, E.; Jackson, M.; O’Hea, M.; Gregory, T.; Blet-Lemarquand, M.; Schibille, N. Analyses of glass tesserae from Kilise Tepe: New insights into an early Byzantine production technology. J. Archaeol. Sci. Rep. 2017, 11, 600–612. [Google Scholar] [CrossRef]
- Blanchard-Lemée, M. Sols de l’Afrique Romaine: Mosaiques de Tunisie; Imprimerie Nationale Editions: Paris, France, 1995. [Google Scholar]
- Martínez, J.M.B.; Bellido, A.G.Y.; Monteagudo, G.L. Corpus de Mosaicos Romanos de España; CSIC: Madrid, Spain, 1978–2010. [Google Scholar]
- Valero Tévar, M.A. The late-antique villa at Noheda (Villar de Domingo García) near Cuenca and its mosaics. J. Rom. Archaeol. 2013, 26, 307–330. [Google Scholar] [CrossRef]
- Valero Tévar, M.A. La Villa Romana de Noheda: La Sala Triclinar y Sus Mosaicos; Universidad de Castilla-La Mancha: Ciudad Real, Spain, 2015. [Google Scholar]
- Valero Tévar, M.A. La iconografía del mito de Pélope e Hipodamía en la Musivaria Romana. Nuevas aportaciones a partir del mosaico de Noheda. Anales de Arquelogía Cordobesa 2016, 27, 125–160. [Google Scholar] [CrossRef]
- Chavarría Arnau, A. Villas en Hispania durante la Antigüedad tardía, Villas Tardoantiguas en el Mediterráneo Occidental; Consejo Superior de Investigaciones Científicas (CSIC): Madrid, Spain, 2006; pp. 17–36. [Google Scholar]
- Chavarría Arnau, A. El Final de las “Villae” en “Hispania” (Siglos IV–VIII); Brepols: Turnhout, Belgium, 2007. [Google Scholar]
- Pensabene, P. La villa del Casale tra Tardo Antico e Medioevo alla luce dei nuovi dati archeologici: Funzioni, decorazioni e trasformazioni. Rendiconti della Pontificia Accademia Romana di Archeologia 2010, 83, 141–226. [Google Scholar]
- Hidalgo Prieto, R. ¿ Fue Cercadilla una villa? El problema de la función del complejo de Cercadilla en Corduba. Archivo Español de Arqueología 2014, 87, 217–241. [Google Scholar] [CrossRef] [Green Version]
- Romizzi, L. Le Ville Tardo-Antiche in Italia, Villas Tardoantiguas en el Mediterráneo Occidental; Consejo Superior de Investigaciones Científicas (CSIC): Madrid, Spain, 2006; pp. 37–60. [Google Scholar]
- Sfameni, C. Ville Residenziali Nell’italia Tardoantica; Edipuglia srl: Bari, Italy, 2006; Volume 25. [Google Scholar]
- Vera, D. Schiavitù rurale e colonato nell’Italia imperiale. Scienze dell’Antichitá Storia Archeologia Antropologia 1992, 6–7, 292–339. [Google Scholar]
- Volpe, G. Contadini, Pastori e Mercanti Nell’apulia Tardoantica; Edipuglia: Bari, Italy, 1996; Volume 6. [Google Scholar]
- Valero Tévar, M.A. La escenografía del poder en los grandes complejos de la Antigüedad Tardía: Los triclinia triabsidados en la pars occidentalis del Imperio. Sci. Antiq. 2017, 1, 27–46. [Google Scholar]
- Valero Tévar, M.A. Estudio arqueométrico de las muestras procedentes del mosaico de la villa romana de Noheda (Cuenca): Primeros resultados. Actas del X Congreso Ibérico de Arqueometría 2014, X, 54–68. [Google Scholar]
- López-Vázquez, M.A. Apéndice B: Análisis espectrográfico de teselas de vidrio. In La Mosaïque Cosmologique de Mérida: Étude Technique et Stylistique (I); Lancha, J., Ed.; Mélanges de la Casa de Velázquez, 19: Madrid, Spain, 1983; pp. 58–59. [Google Scholar]
- Palomar, T.; Heras, M.G.; Jiménez, C.S.; Márquez, C.; Broncano, M.Á.V. Patologías y estudio analítico de materiales procedentes de mosaicos de Carmona e Itálica. Materiales de Construcción 2011, 61, 629–636. [Google Scholar] [CrossRef] [Green Version]
- Gratuze, B. Glass characterization using laser ablation-inductively coupled plasma-mass spectrometry methods. In Recent Advances in Laser Ablation ICP-MS for Archaeology; Series: Natural Science in Archaeology; Dussubieux, L., Golitko, M., Gratuze, B., Eds.; Springer: Berlin/Heidelberg, Germany, 2016; pp. 179–196. [Google Scholar]
- Gates-Rector, S.D.; Blanton, T.N. The powder diffraction file: A quality materials characterization database. Powder Diffr. 2019, 34, 352–360. [Google Scholar] [CrossRef] [Green Version]
- Ramsey, C.B.; Housley, R.A.; Lane, C.S.; Smith, V.C.; Pollard, A.M. The RESET tephra database and associated analytical tools. Quat. Sci. Rev. 2015, 118, 33–47. [Google Scholar] [CrossRef]
- Sayre, E.V.; Smith, R.W. Compositional categories of ancient glass. Science 1961, 133, 1824–1826. [Google Scholar] [CrossRef] [PubMed]
- Boschetti, C.; Henderson, J.; Evans, J.; Leonelli, C. Mosaic tesserae from Italy and the production of Mediterranean coloured glass (4rd century BCE–4th century CE). Part I: Chemical composition and technology. J. Archaeol. Sci. Rep. 2016, 7, 303–311. [Google Scholar] [CrossRef]
- Henderson, J. Chemical characterisation of Roman glass vessels, enamels and tesserae. In Materials Issues in Art and Archaeology II; Vandiver, P.B., Druzik, J.R., Wheeler, G.S., Eds.; Materials Research Society: Pittsburgh, PA, USA, 1991; Volume 185, pp. 601–607. [Google Scholar]
- Nenna, M.-D.; Gratuze, B. Étude diachronique des compositions de verres employés dans les vases mosaïqués antiques: Résultats préliminaires. In Proceedings of the Annales du 17e Congrès de l’Association Internationale pour l’Histoire du Verre, Antwerp, Belgium, 4–8 September 2006; AIHV: Antwerp, Belgium, 2009; Volume 17, pp. 8–14. [Google Scholar]
- Schibille, N.; Freestone, I.C. Composition, production and procurement of glass at San Vincenzo al Volturno: An early medieval monastic complex in southern Italy. PLoS ONE 2013, 8, e76479. [Google Scholar] [CrossRef]
- Schibille, N.; Neri, E.; Ebanista, C.; Ammar, M.R.; Bisconti, F. Something old, something new: The late antique mosaics from the catacomb of San Gennaro (Naples). J. Archaeol. Sci. Rep. 2018, 20, 411–422. [Google Scholar] [CrossRef]
- Silvestri, A. The coloured glass of Iulia Felix. J. Archaeol. Sci. 2008, 35, 1489–1501. [Google Scholar] [CrossRef]
- Paynter, S.; Kearns, T.; Cool, H.; Chenery, S. Roman coloured glass in the Western provinces: The glass cakes and tesserae from West Clacton in England. J. Archaeol. Sci. 2015, 62, 66–81. [Google Scholar] [CrossRef] [Green Version]
- Schibille, N.; Sterrett-Krause, A.; Freestone, I.C. Glass groups, glass supply and recycling in late Roman Carthage. Archaeol. Anthropol. Sci. 2017, 9, 1223–1241. [Google Scholar] [CrossRef] [Green Version]
- Freestone, I.C. The recycling and reuse of Roman glass: Analytical approaches. J. Glass Stud. 2015, 57, 29–40. [Google Scholar]
- Jackson, C.M. Making colourless glass in the Roman period. Archaeometry 2005, 47, 763–780. [Google Scholar] [CrossRef]
- L’Héritier, M.; Baron, S.; Cassayre, L.; Téreygeol, F. Bismuth behaviour during ancient processes of silver–lead production. J. Archaeol. Sci. 2015, 57, 56–68. [Google Scholar] [CrossRef] [Green Version]
- Verità, M. Tecniche di fabbricazione dei materiali musivi vitrei: Indagini chimiche e mineralogiche. In Medieval Mosaic: Light. Color. Materials; Silvana Editoriale: Milan, Italy, 2000; pp. 47–64. [Google Scholar]
- Bimson, M.; Freestone, I.C. An analytical study of the relationship between the Portland vase and other Roman cameo glasses. J. Glass Stud. 1983, 25, 55–64. [Google Scholar]
- Foster, H.E.; Jackson, C.M. ‘A whiter shade of pale’? Chemical and experimental investigation of opaque white Roman glass gaming counters. Glass Technol. 2005, 46, 327–333. [Google Scholar]
- Freestone, I.C.; Stapleton, C. Composition technology and production of coloured glasses from Roman mosaic vessels. In Glass of the Roman World; Bayley, J., Freestone, I.C., Jackson, C., Eds.; Oxbow: Oxford, UK, 2015; pp. 61–76. [Google Scholar]
- Lahlil, S.; Biron, I.; Cotte, M.; Susini, J. New insight on the in situ crystallization of calcium antimonate opacified glass during the Roman period. Appl. Phys. A Mater. Sci. Process. 2010, 100, 683–692. [Google Scholar] [CrossRef]
- Lahlil, S.; Biron, I.; Galoisy, L.; Morin, G. Rediscovering ancient glass technologies through the examination of opacifier crystals. Appl. Phys. A Mater. Sci. Process. 2008, 92, 109–116. [Google Scholar] [CrossRef]
- Freestone, I.C. Laboratory studies of the Portland Vase. J. Glass Stud. 1990, 32, 103–107. [Google Scholar]
- Gedzevičiūtė, V.; Welter, N.; Schüssler, U.; Weiss, C. Chemical composition and colouring agents of Roman mosaic and millefiori glass, studied by electron microprobe analysis and Raman microspectroscopy. Archaeol. Anthropol. Sci. 2009, 1, 15–29. [Google Scholar] [CrossRef] [Green Version]
- Paynter, S.; Jackson, C. Clarity and brilliance: Antimony in colourless natron glass explored using Roman glass found in Britain. Archaeol. Anthropol. Sci. 2018, 11, 1533–1551. [Google Scholar] [CrossRef] [Green Version]
- Verità, M.; Santopadre, P. Basilica di San Pietro in Vincoli. Il mosaico già sulla controfacciata (secolo VII, ultimo quarto). Analisi delle tessere vitree. In Mosaici Medievali a Roma Attraverso il Restauro dell’ICR 1991–2004; Andaloro, M., D’Angelo, C., Eds.; Gangemi Editore: Rome, Italy, 2017; pp. 179–182. [Google Scholar]
- Lahlil, S.; Cotte, M.; Biron, I.; Szlachetko, J.; Menguy, N.; Susini, J. Synthesizing lead antimonate in ancient and modern opaque glass. J. Anal. At. Spectrom. 2011, 26, 1040–1050. [Google Scholar] [CrossRef]
- Shortland, A.J. The use and origin of antimonate colorants in early Egyptian glass. Archaeometry 2002, 44, 517–530. [Google Scholar] [CrossRef]
- Moretti, C.; Hreglich, S. Opacification and coloring of glass by the use of anime. Glass Technol. 1984, 25, 277–282. [Google Scholar]
- Verità, M.; Maggetti, M.; Saguì, L.; Santopadre, P. Colors of Roman glass: An investigation of the yellow sectilia in the Gorga collection. J. Glass Stud. 2013, 55, 39–52. [Google Scholar]
- Verità, M. Le tessere vitree dei mosaici Medievali a Roma. Tecnologia e degrado. In Mosaici Medievali a Roma Attraverso il Restauro Dell’icr 1991–2004; Andaloro, M., D’Angelo, C., Eds.; Gangemi Editore: Rome, Italy, 2017; pp. 437–477. [Google Scholar]
- Gratuze, B.; Pactat, I.; Schibille, N. Changes in the signature of cobalt colorants in late antique and early Islamic glass production. Minerals 2018, 8, 225. [Google Scholar] [CrossRef] [Green Version]
- Giannini, R.; Freestone, I.C.; Shortland, A.J. European cobalt sources identified in the production of Chinese famille rose porcelain. J. Archaeol. Sci. 2017, 80, 27–36. [Google Scholar] [CrossRef] [Green Version]
- Matin, M.; Pollard, A. From ore to pigment: A description of the minerals and an experimental study of cobalt ore processing from the Kāshān Mine, Iran. Archaeometry 2017, 59, 731–746. [Google Scholar] [CrossRef]
- Barber, D.J.; Freestone, I.C.; Moulding, K.M. Ancient copper red glasses: Investigation and analysis by microbeam techniques. In From Mine to Microscope: Advances in the Study of Ancient Technology; Shortland, A.J., Freestone, I.C., Rehren, T., Eds.; Oxbow Books: Oxford, UK, 2009; pp. 115–127. [Google Scholar]
- Freestone, I.C. Composition and microstructure of early opaque red glass. In Early Vitreous Materials; Bimson, M., Freestone, I.C., Eds.; British Museum Occasional Paper 56: London, UK, 1987; pp. 173–191. [Google Scholar]
- Santagostino Barbone, A.; Gliozzo, E.; D’Acapito, F.; Turbanti, I.M.; Turchiano, M.; Volpe, G. The sectilia panels of Faragola (Ascoli Satriano, southern Italy): A multi-analytical study of the red, orange and yellow glass slabs. Archaeometry 2008, 50, 451–473. [Google Scholar] [CrossRef]
- Ahmed, A.; Ashour, G. Effect of heat treatment on the crystallization of cuprous oxide in glass. Glass Technol. 1981, 22, 24–33. [Google Scholar]
- Kunicki-Goldfinger, J.J.; Freestone, I.C.; McDonald, I.; Hobot, J.A.; Gilderdale-Scott, H.; Ayers, T. Technology, production and chronology of red window glass in the medieval period–rediscovery of a lost technology. J. Archaeol.Sci. 2014, 41, 89–105. [Google Scholar] [CrossRef]
- Peake, J.R.; Freestone, I.C. Cross-Craft Interactions between Metal and Glass Working: Slag Additions to Early Anglo-Saxon Red Glass. In Integrated Approaches to the Study of Historical Glass—IAS12; Meulebroeck, W., Nys, K., Vanclooster, D., Thienpont, H., Eds.; Proceedings of SPIE: Cergy, France, 2012; Volume 8422, p. 842204. [Google Scholar] [CrossRef]
- Messiga, B.; Riccardi, M.P.; Rebay, G.; Basso, E.; Lerma, S. Microtextures recording melting-history of a medieval glass cake. J. Non-Cryst. Solids 2004, 342, 116–124. [Google Scholar] [CrossRef]
- Basso, E.; Invernizzi, C.; Malagodi, M.; La Russa, M.; Bersani, D.; Lottici, P. Characterization of colorants and opacifiers in roman glass mosaic tesserae through spectroscopic and spectrometric techniques. J. Raman Spectrosc. 2014, 45, 238–245. [Google Scholar] [CrossRef]
- Brill, R.; Cahill, N.D. A red opaque glass from Sardis and some thoughts on red opaques in general. J. Glass Stud. 1988, 30, 16–27. [Google Scholar]
- Cholakova, A.; Rehren, T.; Scott, R.; Braekmans, D.; Carremans, M.; Degryse, P. Producing Black Glass during the Roman Period-Notes on a crucible fragment from Serdica, Bulgaria. In Proceedings of the 39th International Symposium for Archaeometry, Leuven, Belgium, 28 May–1 June 2012; pp. 261–267. [Google Scholar]
- Fontaine, S.; Foy, D. L’épave Ouest-Embiez 1, Var, le commerce maritime du verre brut et manufacturé en Méditerranée occidentale dans l’Antiquité. Revue Archéologique de Narbonnaise 2007, 40, 235–268. [Google Scholar] [CrossRef]
- Ganio, M.; Boyen, S.; Fenn, T.; Scott, R.; Vanhoutte, S.; Gimeno, D.; Degryse, P. Roman glass across the Empire: An elemental and isotopic characterization. J. Anal. At. Spectrom. 2012, 27, 743–753. [Google Scholar] [CrossRef] [Green Version]
- Neri, E.; Gratuze, B.; Schibille, N. The trade of glass beads in early medieval Illyricum: Towards an Islamic monopoly. Archaeol. Anthropol. Sci. 2018, 11, 1–16. [Google Scholar] [CrossRef] [Green Version]
- Sablerolles, Y.; Henderson, J.; Dijkman, W. Early medieval glass bead-making in Maastricht (Jodenstraat 30), The Netherlands. An archaeological and scientific investigation. In Perlen. Archäologie. Techniken. Analysen. Akten des Internationalen Perlensymposiums in Mannheim vom 11. bis 14. November 1994; Von Freedon, U., Wiczorek, A., Eds.; Habelt: Bonn, Germany, 1997; pp. 225–226. [Google Scholar]
- Boschetti, C. Working glass in Ptolemaic Egypt, a new evidence from Denderah. J. Archaeol. Sci. Rep. 2018, 22, 550–558. [Google Scholar] [CrossRef]
- Jackson, C.M.; Cottam, S. ‘A green thought in a green shade’; Compositional and typological observations concerning the production of emerald green glass vessels in the 1st century A.D. J. Archaeol. Sci. 2016, 61, 139–148. [Google Scholar] [CrossRef] [Green Version]
- Moretti, C.; Toninato, T. Ricette Vetrarie del Rinascimento. Trascrizione da un Manoscritto Anonimo Veneziano; Marsilio: Venice, Italy, 2001. [Google Scholar]
Figure 1.
The floor mosaic in the triconch hall of the villa of Noheda. (Top panel) lower register of the mosaic in the eastern part of the triclinium, showing the abduction of Helena by Paris and her arrival at the gates of Troy (to the right of the scene); (lower left) orthophoto superimposed on the ground plan of the triclinium; (lower right) detail of one of the sailors from the ship, containing a substantial number of glass tesserae.

Figure 2.
Base glass composition of the tesserae from Noheda. (a) Magnesium and potassium oxide concentrations discriminate the orange, and some of the green, red, and white tesserae from the bulk of the assemblage; (b) TiO2/Al2O3 and Na2O/CaO ratios illustrate the overall compositional homogeneity of the tesserae in terms of the silica source that is compatible with Roman spectrum tesserae [48]. The compositional ranges of the three base glasses (Roman Sb, Roman Mn, and Roman mixed shown in blue, red, and yellow, respectively) from the Iulia Felix (IF) shipwreck [14,49] are given as kernel density outlines generated by the open-access RESET statistical tools [42]; (c) differential proportions of manganese and antimony versus alumina concentrations in the gold leaf tesserae reveal the recycling and mixing of Roman Sb and Mn base glasses; (d) Th/Zr versus La/TiO2 ratios clearly distinguish the base glass characteristics of the red, green, and orange plant ash glasses from their natron-type counterparts. Asterisks (*) indicate reduced and normalized data.

Figure 3.
PC1 and PC2 of the main colorants, opacifiers, and their associated trace elements. Please note that the vectors were magnified by one order of magnitude (10-fold).
Figure 3.
PC1 and PC2 of the main colorants, opacifiers, and their associated trace elements. Please note that the vectors were magnified by one order of magnitude (10-fold).

Figure 4.
Antimony compounds as opacifiers. (a) Lead and antimony concentrations show the separation between calcium antimonate (blue, grey, turquoise, white) and lead antimonate (green, yellow) opacified tesserae. Some white and blue samples have elevated lead contents. (b) Back-scattered scanning electron microscope (SEM) image of newly formed hexagonal and cubic calcium antimonate crystals in a white tessera.

Figure 5.
X-ray diffraction (XRD) patterns of 16 opacified tesserae from Noheda. Blue and high Mg white tesserae exhibit the presence of only orthorhombic calcium antimonate particles (Ca2Sb2O7), some white and turquoise tesserae are opacified by hexagonal (CaSb2O6) crystal structures; lead stannate (Pb2Sb2O7) underlies the yellow samples; cuprous oxide (Cu2O) is present in the orange sample; and metallic copper is identified in the red tesserae.

Figure 6.
Lead antimony compounds responsible for the opaque green and yellow tesserae. (a) The concentration of lead and antimony differs between the green and yellow samples; (b) low concentrations of tin are positively correlated with lead in the yellow samples, indicating that tin entered the glass as an accessory element of the lead raw material; (c) two different correlations of lead and bismuth are apparent (indicated as dotted lines), suggesting the exploitation of different lead sources.

Figure 7.
Elements and oxides responsible for the colors of the tesserae. (a) Two different correlations of Co versus Ni in the cobalt blue tesserae indicat the use of two different cobalt-bearing minerals; (b) Fe2O3/CuO compared to PbO in the red (natron and plant ash) and orange glasses separate the three groups in terms of coloring recipes; (c) dendritic cuprous oxide crystals (Cu2O) in an orange tessera; (d) relic of metallurgical slag, showing copper particles separating from the slag (light grey) and partially dissolved in the glass matrix; black structures are air bubbles.

Figure 8.
Red, green, and orange plant ash glasses in comparison with first century emerald green vessel glass. (a) The tesserae have high phosphorus oxide levels that are positively correlated with magnesia, similar to the emerald green vessel glass; (b) the tesserae from Noheda and the emerald green vessels share the same Th/Zr versus La/TiO2 ratios that suggest a common, most likely Egyptian origin.


Table 1.
Means and standard deviations (SD) of the gold leaf tesserae and the reduced composition of all natron-type and plant ash tesserae from Noheda.
Table 1.
Means and standard deviations (SD) of the gold leaf tesserae and the reduced composition of all natron-type and plant ash tesserae from Noheda.
| Type | wt % | ppm | |||||||||||
|---|---|---|---|---|---|---|---|---|---|---|---|---|---|
| Na2O | MgO | Al2O3 | SiO2 | P2O5 | Cl | K2O | CaO | TiO2 | MnO | Fe2O3 | Sr | Zr | |
| gold leaf (n = 70) | 18.5 | 0.65 | 2.18 | 68.7 | 0.07 | 1.14 | 0.50 | 6.46 | 0.10 | 0.61 | 0.60 | 436 | 56.2 |
| SD | 0.8 | 0.20 | 0.26 | 1.7 | 0.06 | 0.11 | 0.13 | 0.79 | 0.03 | 0.47 | 0.24 | 96 | 18.8 |
| natron (n = 381) | 18.0 | 0.73 | 2.26 | 69.2 | 0.09 | 1.08 | 0.56 | 6.46 | 0.10 | 0.48 | 1.02 | 418 | 54.5 |
| SD | 1.2 | 0.48 | 0.27 | 1.8 | 0.06 | 0.15 | 0.13 | 0.81 | 0.02 | 0.44 | 0.79 | 63 | 12.1 |
| plant ash (n = 28) * | 14.4 | 2.64 | 2.15 | 64.4 | 1.05 | 1.01 | 2.49 | 9.27 | 0.16 | 0.50 | 1.81 | 652 | 71.1 |
| SD | 1.3 | 0.42 | 0.31 | 1.0 | 0.22 | 0.11 | 0.61 | 1.23 | 0.03 | 0.20 | 0.45 | 100 | 18.8 |
* only the red and green samples
Table 2.
Means and standard deviations (SD) of the tesserae from Noheda separated by color. Oxides and chlorine are given as (wt %), while trace elements are given as [ppm]. Elements that differ by two standard deviations from the average composition of the gold leaf tesserae are highlighted to indicate their association with the coloring and opacification process (red). Blue indicates differences in the base glass composition.
| Elements | Colorless (n = 70) | Blue (n = 61) | Turquoise (n = 49) | Green Opaque (n = 33) | Green Transl (n = 18) | Yellow (n = 25) | Red (n = 48) | Purple Opaque (n = 4) | Purple Transl (n = 6) | White (n = 25) | White High Mg (n = 14) | Aqua Opaque (n = 20) | Grey (n = 8) | |||||||||||||
|---|---|---|---|---|---|---|---|---|---|---|---|---|---|---|---|---|---|---|---|---|---|---|---|---|---|---|
| mean | SD | mean | SD | mean | SD | mean | SD | mean | SD | mean | SD | mean | SD | mean | SD | mean | SD | mean | SD | mean | SD | mean | SD | mean | SD | |
| Na2O | 18.5 | 0.8 | 17.7 | 1.3 | 17.9 | 0.6 | 17.6 | 1.5 | 17.9 | 0.5 | 16.3 | 1.3 | 16.7 | 0.7 | 17.2 | 0.5 | 18.8 | 0.6 | 16.1 | 1.9 | 15.7 | 0.8 | 17.6 | 0.9 | 18.0 | 0.6 |
| MgO | 0.65 | 0.20 | 0.62 | 0.07 | 0.54 | 0.10 | 0.54 | 0.09 | 0.75 | 0.06 | 0.48 | 0.09 | 0.83 | 0.16 | 0.86 | 0.26 | 0.76 | 0.01 | 0.50 | 0.17 | 2.76 | 0.75 | 0.61 | 0.17 | 0.68 | 0.06 |
| Al2O3 | 2.18 | 0.26 | 2.23 | 0.23 | 2.04 | 0.32 | 2.14 | 0.19 | 2.35 | 0.11 | 2.11 | 0.28 | 2.46 | 0.16 | 2.00 | 0.11 | 2.32 | 0.06 | 2.11 | 0.22 | 1.95 | 0.13 | 2.10 | 0.15 | 2.24 | 0.11 |
| SiO2 | 68.7 | 1.7 | 67.9 | 1.0 | 67.3 | 1.1 | 66.6 | 1.8 | 66.1 | 0.8 | 66.5 | 1.7 | 64.4 | 1.5 | 67.7 | 0.4 | 67.4 | 0.5 | 67.4 | 1.9 | 66.0 | 1.7 | 68.2 | 1.0 | 68.0 | 1.2 |
| P2O5 | 0.07 | 0.06 | 0.09 | 0.04 | 0.06 | 0.03 | 0.09 | 0.04 | 0.10 | 0.02 | 0.07 | 0.03 | 0.16 | 0.07 | 0.06 | 0.01 | 0.06 | 0.01 | 0.08 | 0.05 | 0.04 | 0.01 | 0.09 | 0.04 | 0.09 | 0.02 |
| Cl | 1.14 | 0.11 | 1.00 | 0.17 | 1.17 | 0.15 | 1.08 | 0.11 | 1.03 | 0.05 | 1.04 | 0.08 | 1.02 | 0.07 | 0.88 | 0.09 | 1.16 | 0.05 | 0.91 | 0.19 | 0.80 | 0.09 | 0.97 | 0.13 | 1.10 | 0.03 |
| K2O | 0.50 | 0.13 | 0.50 | 0.08 | 0.49 | 0.09 | 0.55 | 0.08 | 0.61 | 0.10 | 0.51 | 0.07 | 0.73 | 0.15 | 0.48 | 0.03 | 0.45 | 0.03 | 0.49 | 0.06 | 0.50 | 0.05 | 0.53 | 0.09 | 0.57 | 0.03 |
| CaO | 6.46 | 0.79 | 6.59 | 0.59 | 5.40 | 0.95 | 5.84 | 0.52 | 6.72 | 0.34 | 6.04 | 0.86 | 6.76 | 0.52 | 6.56 | 0.32 | 6.02 | 0.13 | 6.26 | 0.91 | 6.47 | 0.34 | 6.17 | 0.43 | 6.38 | 0.24 |
| TiO2 | 0.10 | 0.03 | 0.09 | 0.02 | 0.09 | 0.03 | 0.09 | 0.03 | 0.11 | 0.01 | 0.08 | 0.02 | 0.10 | 0.01 | 0.08 | 0.00 | 0.12 | 0.00 | 0.07 | 0.01 | 0.08 | 0.01 | 0.08 | 0.02 | 0.10 | 0.02 |
| MnO | 0.61 | 0.47 | 0.49 | 0.29 | 0.20 | 0.26 | 0.24 | 0.12 | 1.05 | 0.38 | 0.20 | 0.17 | 0.69 | 0.29 | 1.67 | 0.34 | 1.65 | 0.26 | 0.16 | 0.11 | 0.03 | 0.01 | 0.34 | 0.27 | 0.67 | 0.22 |
| Fe2O3 | 0.60 | 0.24 | 0.89 | 0.24 | 0.68 | 0.29 | 0.68 | 0.23 | 1.98 | 0.43 | 0.73 | 0.27 | 2.63 | 0.63 | 0.56 | 0.10 | 0.93 | 0.12 | 0.45 | 0.10 | 0.48 | 0.06 | 0.61 | 0.20 | 0.84 | 0.27 |
| CuO | 0.02 | 0.11 | 0.15 | 0.10 | 2.08 | 0.83 | 1.37 | 0.62 | 0.33 | 0.27 | 0.02 | 0.01 | 1.20 | 0.31 | 0.02 | 0.01 | 0.01 | 0.00 | 0.02 | 0.04 | 0.01 | 0.00 | 0.42 | 0.47 | 0.30 | 0.18 |
| Sb2O3 | 0.31 | 0.23 | 1.44 | 1.42 | 1.60 | 0.95 | 0.73 | 0.18 | 0.23 | 0.20 | 0.89 | 0.37 | 0.36 | 0.20 | 1.66 | 0.20 | 0.06 | 0.01 | 4.49 | 2.53 | 4.91 | 1.72 | 1.92 | 1.05 | 0.46 | 0.08 |
| PbO | 0.06 | 0.21 | 0.12 | 0.17 | 0.19 | 0.13 | 2.22 | 2.43 | 0.42 | 0.45 | 4.85 | 1.87 | 1.61 | 1.74 | 0.04 | 0.02 | 0.02 | 0.01 | 0.76 | 1.02 | 0.08 | 0.16 | 0.11 | 0.11 | 0.36 | 0.37 |
| Li | 4.89 | 1.83 | 4.42 | 1.67 | 5.59 | 1.37 | 4.50 | 1.15 | 5.42 | 0.55 | 4.28 | 0.85 | 5.58 | 0.45 | 4.51 | 0.88 | 3.99 | 0.37 | 4.06 | 1.26 | 6.43 | 1.08 | 4.77 | 0.86 | 6.22 | 1.12 |
| B | 178 | 27 | 174 | 28 | 208 | 49 | 180 | 33 | 159 | 10 | 165 | 42 | 166 | 12 | 191 | 27 | 165 | 5 | 175 | 28 | 205 | 28 | 192 | 19 | 180 | 9 |
| V | 16.8 | 6.8 | 15.2 | 3.2 | 11.5 | 3.5 | 12.7 | 2.7 | 20.6 | 3.3 | 12.1 | 4.2 | 18.9 | 2.8 | 32.4 | 6.6 | 22.5 | 0.8 | 9.7 | 2.1 | 8.5 | 0.7 | 13.4 | 5.1 | 17.8 | 2.4 |
| Cr | 11.9 | 5.0 | 12.2 | 2.5 | 10.5 | 4.4 | 11.0 | 1.7 | 14.3 | 2.4 | 11.5 | 1.7 | 14.4 | 1.6 | 7.60 | 1.15 | 12.8 | 1.9 | 9.8 | 2.3 | 10.1 | 1.2 | 10.2 | 2.6 | 11.5 | 3.1 |
| Co | 5.68 | 5.52 | 271 | 93 | 9.64 | 11.0 | 5.94 | 3.40 | 18.0 | 3.5 | 3.33 | 1.67 | 20.3 | 9.9 | 15.2 | 4.5 | 6.08 | 0.56 | 5.67 | 6.10 | 1.76 | 0.25 | 24.6 | 22.2 | 40.2 | 36.3 |
| Ni | 7.52 | 4.66 | 30.6 | 23.4 | 11.26 | 3.01 | 9.44 | 2.84 | 16.6 | 4.3 | 5.05 | 1.68 | 20.2 | 4.7 | 12.2 | 2.6 | 8.39 | 0.19 | 4.93 | 1.58 | 5.39 | 1.07 | 8.01 | 2.76 | 11.20 | 3.54 |
| Zn | 26.4 | 20.7 | 51.8 | 13.4 | 318 | 371 | 212 | 512 | 99.6 | 71.1 | 31.0 | 12.1 | 148 | 171 | 87.9 | 57.9 | 65.9 | 22.4 | 47.7 | 31.1 | 67.8 | 30.1 | 56.9 | 29.7 | 68.4 | 47.5 |
| Ga | 3.24 | 0.53 | 4.30 | 0.60 | 3.03 | 0.44 | 3.18 | 0.30 | 4.36 | 0.53 | 2.96 | 0.37 | 3.63 | 0.25 | 4.42 | 0.28 | 4.77 | 0.27 | 2.83 | 0.24 | 2.62 | 0.11 | 3.22 | 0.42 | 3.72 | 0.33 |
| As | 17.8 | 11.7 | 39.2 | 26.8 | 69.0 | 39.5 | 33.5 | 14.3 | 26.3 | 6.7 | 40.6 | 21.8 | 31.3 | 6.7 | 71.3 | 15.9 | 16.0 | 3.7 | 85.0 | 53.2 | 187 | 149 | 53.6 | 33.9 | 24.2 | 3.0 |
| Rb | 9.9 | 4.9 | 8.4 | 1.9 | 9.9 | 3.0 | 12.2 | 2.7 | 15.0 | 2.7 | 10.4 | 3.8 | 15.5 | 3.0 | 12.1 | 3.1 | 10.7 | 1.2 | 8.8 | 5.1 | 5.4 | 0.5 | 11.0 | 3.0 | 11.9 | 1.5 |
| Sr | 434 | 96 | 407 | 29 | 353 | 67 | 374 | 32 | 452 | 22 | 387 | 56 | 430 | 43 | 535 | 64 | 451 | 22 | 378 | 30 | 430 | 42 | 391 | 35 | 414 | 19 |
| Y | 6.17 | 0.71 | 6.29 | 0.42 | 5.68 | 0.50 | 5.77 | 0.26 | 6.58 | 0.33 | 5.85 | 0.47 | 6.07 | 0.40 | 6.50 | 0.55 | 6.63 | 0.19 | 5.83 | 0.51 | 5.07 | 0.25 | 5.88 | 0.39 | 6.25 | 0.26 |
| Zr | 55.9 | 18.6 | 53.6 | 8.9 | 52.3 | 10.8 | 55.1 | 12.5 | 58.7 | 3.8 | 48.2 | 12.3 | 52.7 | 3.9 | 43.8 | 1.5 | 60.6 | 2.2 | 46.1 | 8.9 | 46.9 | 3.8 | 49.7 | 8.1 | 56.7 | 7.2 |
| Nb | 1.79 | 0.55 | 1.74 | 0.30 | 1.85 | 0.41 | 1.87 | 0.52 | 2.03 | 0.13 | 1.70 | 0.42 | 1.94 | 0.14 | 1.56 | 0.12 | 2.01 | 0.05 | 1.43 | 0.25 | 1.50 | 0.13 | 1.61 | 0.27 | 1.87 | 0.26 |
| Mo | 1.53 | 1.19 | 2.90 | 1.73 | 0.61 | 0.62 | 0.75 | 0.33 | 2.81 | 0.90 | 0.54 | 0.44 | 2.00 | 0.82 | 1.94 | 0.75 | 3.18 | 0.25 | 0.43 | 0.25 | 0.46 | 0.29 | 0.91 | 0.64 | 1.89 | 0.52 |
| Ag | 1.31 | 8.18 | 0.63 | 0.66 | 6.95 | 3.12 | 6.63 | 3.81 | 1.53 | 0.97 | 5.15 | 3.02 | 5.00 | 2.06 | 0.82 | 0.29 | 0.16 | 0.03 | 1.29 | 0.92 | 0.88 | 0.46 | 2.00 | 1.64 | 4.93 | 2.72 |
| Cd | 0.09 | 0.07 | 0.28 | 0.22 | 0.48 | 0.45 | 0.16 | 0.10 | 0.22 | 0.09 | 0.22 | 0.16 | 0.16 | 0.15 | 0.43 | 0.09 | 0.39 | 0.15 | 0.64 | 0.33 | 0.97 | 0.57 | 0.31 | 0.23 | 0.16 | 0.05 |
| In | 0.01 | 0.01 | 0.24 | 0.17 | 0.20 | 0.15 | 0.25 | 0.21 | 0.10 | 0.07 | 0.02 | 0.04 | 0.00 | 0.01 | 0.01 | 0.01 | 0.02 | 0.01 | 0.01 | 0.01 | 0.01 | 0.01 | 0.17 | 0.42 | 0.04 | 0.04 |
| Sn | 20.0 | 79.0 | 54.2 | 64.3 | 715 | 419 | 699 | 493 | 313 | 191 | 408 | 259 | 748 | 544 | 11.6 | 3.2 | 5.9 | 2.3 | 111 | 155 | 13.8 | 24.1 | 182 | 261 | 148 | 100 |
| Cs | 0.19 | 0.24 | 0.15 | 0.11 | 0.20 | 0.12 | 0.39 | 0.27 | 0.36 | 0.07 | 0.37 | 0.36 | 0.39 | 0.10 | 0.23 | 0.08 | 0.24 | 0.08 | 0.15 | 0.14 | 0.17 | 0.11 | 0.23 | 0.08 | 0.30 | 0.11 |
| Ba | 214 | 104 | 207 | 37 | 166 | 47 | 170 | 15 | 471 | 182 | 174 | 40 | 280 | 90 | 586 | 349 | 720 | 223 | 157 | 25 | 129 | 6 | 202 | 93 | 281 | 87 |
| La | 6.77 | 0.93 | 7.00 | 0.65 | 6.92 | 0.55 | 7.12 | 0.64 | 7.96 | 0.45 | 7.33 | 0.80 | 7.46 | 0.55 | 7.36 | 0.69 | 7.24 | 0.10 | 6.64 | 0.59 | 5.98 | 0.30 | 6.76 | 0.62 | 7.28 | 0.65 |
| Ce | 11.6 | 1.6 | 11.9 | 1.2 | 11.5 | 1.2 | 12.1 | 1.3 | 13.6 | 0.6 | 12.9 | 1.5 | 13.1 | 0.9 | 11.5 | 1.0 | 12.5 | 0.2 | 10.8 | 1.2 | 9.7 | 0.6 | 11.3 | 1.1 | 12.6 | 1.2 |
| Pr | 1.44 | 0.19 | 1.46 | 0.12 | 1.42 | 0.11 | 1.48 | 0.13 | 1.63 | 0.07 | 1.50 | 0.16 | 1.56 | 0.09 | 1.49 | 0.13 | 1.55 | 0.03 | 1.33 | 0.13 | 1.19 | 0.06 | 1.40 | 0.10 | 1.51 | 0.12 |
| Nd | 6.01 | 0.71 | 6.05 | 0.45 | 5.83 | 0.46 | 6.06 | 0.43 | 6.64 | 0.31 | 6.07 | 0.61 | 6.40 | 0.38 | 6.26 | 0.51 | 6.49 | 0.20 | 5.59 | 0.49 | 5.01 | 0.25 | 5.81 | 0.46 | 6.22 | 0.45 |
| Sm | 1.20 | 0.15 | 1.21 | 0.11 | 1.16 | 0.09 | 1.19 | 0.08 | 1.32 | 0.07 | 1.17 | 0.12 | 1.28 | 0.08 | 1.28 | 0.16 | 1.34 | 0.09 | 1.13 | 0.08 | 0.99 | 0.07 | 1.18 | 0.08 | 1.23 | 0.09 |
| Eu | 0.32 | 0.03 | 0.32 | 0.03 | 0.29 | 0.03 | 0.31 | 0.02 | 0.36 | 0.02 | 0.30 | 0.03 | 0.33 | 0.02 | 0.33 | 0.04 | 0.34 | 0.02 | 0.29 | 0.03 | 0.25 | 0.01 | 0.30 | 0.03 | 0.34 | 0.02 |
| Gd | 1.04 | 0.13 | 0.99 | 0.15 | 0.94 | 0.13 | 1.02 | 0.07 | 1.13 | 0.08 | 0.90 | 0.14 | 1.06 | 0.08 | 1.02 | 0.06 | 1.03 | 0.04 | 0.90 | 0.11 | 0.81 | 0.05 | 1.01 | 0.10 | 1.07 | 0.08 |
| Tb | 0.17 | 0.02 | 0.18 | 0.01 | 0.16 | 0.01 | 0.17 | 0.01 | 0.19 | 0.01 | 0.16 | 0.02 | 0.18 | 0.01 | 0.18 | 0.02 | 0.19 | 0.01 | 0.16 | 0.01 | 0.14 | 0.01 | 0.17 | 0.01 | 0.18 | 0.01 |
| Dy | 1.01 | 0.12 | 1.04 | 0.08 | 0.96 | 0.08 | 0.97 | 0.05 | 1.09 | 0.06 | 0.96 | 0.08 | 0.99 | 0.07 | 1.10 | 0.11 | 1.09 | 0.05 | 0.97 | 0.08 | 0.86 | 0.06 | 0.99 | 0.07 | 1.05 | 0.06 |
| Ho | 0.21 | 0.02 | 0.22 | 0.02 | 0.21 | 0.02 | 0.21 | 0.01 | 0.23 | 0.01 | 0.20 | 0.02 | 0.20 | 0.01 | 0.23 | 0.02 | 0.24 | 0.01 | 0.20 | 0.02 | 0.17 | 0.01 | 0.21 | 0.02 | 0.22 | 0.01 |
| Er | 0.57 | 0.07 | 0.59 | 0.04 | 0.54 | 0.06 | 0.56 | 0.03 | 0.62 | 0.04 | 0.54 | 0.05 | 0.56 | 0.04 | 0.62 | 0.05 | 0.63 | 0.03 | 0.54 | 0.05 | 0.47 | 0.03 | 0.56 | 0.04 | 0.59 | 0.04 |
| Tm | 0.08 | 0.01 | 0.09 | 0.01 | 0.08 | 0.01 | 0.08 | 0.01 | 0.09 | 0.01 | 0.08 | 0.01 | 0.08 | 0.00 | 0.10 | 0.01 | 0.10 | 0.00 | 0.08 | 0.01 | 0.07 | 0.01 | 0.08 | 0.01 | 0.09 | 0.01 |
| Yb | 0.56 | 0.07 | 0.57 | 0.04 | 0.53 | 0.06 | 0.54 | 0.05 | 0.59 | 0.03 | 0.52 | 0.05 | 0.55 | 0.04 | 0.59 | 0.06 | 0.60 | 0.04 | 0.52 | 0.04 | 0.46 | 0.03 | 0.54 | 0.05 | 0.57 | 0.03 |
| Lu | 0.08 | 0.01 | 0.09 | 0.01 | 0.08 | 0.01 | 0.08 | 0.01 | 0.09 | 0.01 | 0.08 | 0.01 | 0.08 | 0.01 | 0.09 | 0.01 | 0.09 | 0.00 | 0.08 | 0.01 | 0.07 | 0.00 | 0.08 | 0.01 | 0.09 | 0.01 |
| Hf | 1.36 | 0.41 | 1.32 | 0.21 | 1.30 | 0.26 | 1.35 | 0.29 | 1.42 | 0.08 | 1.19 | 0.29 | 1.30 | 0.09 | 1.09 | 0.03 | 1.52 | 0.06 | 1.14 | 0.21 | 1.17 | 0.09 | 1.23 | 0.18 | 1.42 | 0.17 |
| Ta | 0.10 | 0.03 | 0.10 | 0.02 | 0.11 | 0.03 | 0.12 | 0.06 | 0.12 | 0.01 | 0.10 | 0.02 | 0.11 | 0.01 | 0.09 | 0.01 | 0.12 | 0.01 | 0.09 | 0.02 | 0.09 | 0.01 | 0.10 | 0.02 | 0.11 | 0.02 |
| W | 0.38 | 0.38 | 0.35 | 0.41 | 0.23 | 0.21 | 0.19 | 0.25 | 0.92 | 0.34 | 0.35 | 0.49 | 0.74 | 0.28 | 0.41 | 0.10 | 0.74 | 0.14 | 0.14 | 0.18 | 0.80 | 1.27 | 0.23 | 0.19 | 0.53 | 0.12 |
| Pt | 0.00 | 0.00 | 0.00 | 0.01 | 0.01 | 0.00 | 0.00 | 0.00 | 0.00 | 0.00 | 0.00 | 0.00 | 0.00 | 0.00 | 0.00 | 0.00 | 0.01 | 0.00 | 0.00 | 0.00 | 0.00 | 0.00 | 0.00 | 0.00 | ||
| Au | 0.06 | 0.05 | 0.16 | 0.24 | 0.41 | 0.41 | 0.24 | 0.19 | 0.07 | 0.07 | 0.35 | 1.33 | 0.13 | 0.09 | 0.55 | 0.53 | 0.02 | 0.01 | 0.18 | 0.16 | 0.15 | 0.13 | 0.42 | 1.12 | 0.24 | 0.12 |
| Bi | 0.08 | 0.16 | 0.16 | 0.18 | 0.75 | 0.33 | 1.97 | 3.31 | 0.37 | 0.22 | 3.93 | 3.47 | 1.42 | 0.90 | 0.30 | 0.16 | 0.03 | 0.01 | 0.64 | 0.63 | 0.25 | 0.16 | 0.28 | 0.23 | 0.34 | 0.28 |
| Th | 1.15 | 0.31 | 1.18 | 0.29 | 1.30 | 0.21 | 1.49 | 0.37 | 1.43 | 0.09 | 1.31 | 0.37 | 1.40 | 0.22 | 1.29 | 0.20 | 1.18 | 0.03 | 1.06 | 0.29 | 0.93 | 0.07 | 1.24 | 0.22 | 1.35 | 0.25 |
| U | 1.00 | 0.21 | 1.12 | 0.17 | 1.15 | 0.16 | 1.16 | 0.15 | 1.12 | 0.08 | 1.03 | 0.14 | 1.00 | 0.09 | 1.10 | 0.13 | 1.13 | 0.09 | 1.04 | 0.19 | 1.22 | 0.17 | 1.10 | 0.13 | 1.13 | 0.09 |
© 2020 by the authors. Licensee MDPI, Basel, Switzerland. This article is an open access article distributed under the terms and conditions of the Creative Commons Attribution (CC BY) license (http://creativecommons.org/licenses/by/4.0/).
Share and Cite
MDPI and ACS Style
Schibille, N.; Boschetti, C.; Valero Tévar, M.Á.; Veron, E.; de Juan Ares, J. The Color Palette of the Mosaics in the Roman Villa of Noheda (Spain). Minerals 2020, 10, 272. https://doi.org/10.3390/min10030272
AMA Style
Schibille N, Boschetti C, Valero Tévar MÁ, Veron E, de Juan Ares J. The Color Palette of the Mosaics in the Roman Villa of Noheda (Spain). Minerals. 2020; 10(3):272. https://doi.org/10.3390/min10030272
Chicago/Turabian StyleSchibille, Nadine, Cristina Boschetti, Miguel Ángel Valero Tévar, Emmanuel Veron, and Jorge de Juan Ares. 2020. "The Color Palette of the Mosaics in the Roman Villa of Noheda (Spain)" Minerals 10, no. 3: 272. https://doi.org/10.3390/min10030272
Note that from the first issue of 2016, this journal uses article numbers instead of page numbers. See further details here.