Article

May a Former Municipal Landfill Contaminate Groundwater in Microplastics? First Investigations from the “Prairie de Mauves Site” (Nantes, France)

1
Universitty Gustave Eiffel, GERS-LEE, Campus Nantes, all. des Ponts et Chaussées, 44344 Bouguenais, France
2
Institut de Recherche en Sciences et Techniques de la Ville IRSTV, CNRS, 1 rue de la Noë, 44321 Nantes, France
3
BRGM, Direction Régionale des Pays de la Loire, 1 rue des Saumonières, 44323 Nantes, France
*
Author to whom correspondence should be addressed.
Microplastics 2023, 2(1), 93-106; https://doi.org/10.3390/microplastics2010007
Submission received: 16 December 2022 / Revised: 13 January 2023 / Accepted: 2 February 2023 / Published: 6 February 2023
(This article belongs to the Collection Current Opinion in Microplastics)

Abstract

:
Municipal landfills receive a high amount of plastic waste and due to the occurring physical and biochemical degradation processes, could be significant sources of microplastics (MP). Evaluating the threat to groundwater through the transfer of MP via landfill leachates require more research. The former “Prairie de Mauves” landfill, operated from 1963 to 1987 by the municipality of Nantes (France), and located above the alluvial groundwater of the Loire River, represents a good candidate for such investigations. Leachates and groundwater were sampled along a transect line from upstream to downstream of the landfill, in March and June 2022. MP (>25 µm) were quantified and characterized using µFTIR imaging in transmission mode. MP were observed in every sample with concentrations ranging from 0.71 to 106.7 MP/L. Concentrations in the leachates and the alluvial groundwater illustrate a migration of MP. Twelve polymers were identified and polyethylene (PE) and polypropylene (PP) were predominant. After a conventional rainfall event (14.3 mm), higher concentrations, diversity, and size ranges of MP were observed. Water infiltration through the heterogeneous geological substratum therefore enhanced the migration of larger MP towards the alluvial groundwater of the Loire River.

1. Introduction

With population growth and an increasing consumer society, the amount of municipal solid waste generated has been enhanced since the half of the 20th century [1,2]. In France specifically, the production of municipal solid wastes has tripled in 70 years, passing from around 170 kg/cap/yr in 1960 [3] to around 582 kg/cap/yr in 2018 [4]. This increase mainly results from the development of the packaging industry at the beginning of the 90’s [5]. Municipal solid wastes are however not the only type of wastes that countries have to manage. To that must commercial and construction wastes be added. Different kinds of facilities were therefore implemented to manage these huge amounts of wastes: incinerators, recycling centers, and landfills.
The management of solid wastes is expensive [5] and landfill is the most convenient, common, and ancient management system for most countries [6,7]. Around 37% of the waste are landfilled at a global scale [5]. In France, as a result of the law n°92-646 of 1992 on the elimination of wastes and the Installations Classified for the Protection of the Environment (ICPE) reserving landfilling for ultimate wastes [8], the number of landfills decreased after 1993 [8]. Afterward, the decree of 9 September 1997 closely regulated landfills operating conditions [8]. Between 9000 and 12,000 uncontrolled landfills were therefore closed and remained on the territory [9]. A total of 205 landfills are nowadays active to store non-dangerous wastes [4] but the environmental regulations on their management were therefore improved [3]. Such landfills are classified as sanitary structures, i.e., that wastes are isolated from the environment. Nevertheless, there are still some uncontrolled landfills in France [10] and worldwide, only 8% of wastes are landfilled in sanitary structures [5]. Moreover, these figures do not include illegal disposal, estimated at 25,000 sites in France in 2002 [9].
Plastic wastes are predominant in municipal solid wastes. Among the 2.01 BT of waste annually generated at a global scale, 44% are plastics [5]. Until the middle of the 80’s, the absence of recycling centers and the throwaway mentality lead to billions of plastic waste landfilled [1]. In the early 80’s in France, the proportion of plastics in municipal solid wastes was around 7% [11] and landfilling was the major management system [3]. This proportion reached 15% in 2017 [4] and despite the start of recycling, 0.9 MT are still landfilled each year [12].
Landfills are complex and dynamic environments [13]. The occurring physical and biochemical degradation processes generate microplastics (MP) [6,14]. Ref. [15] still observed active decomposition processes of wastes in a landfill 35 years after its closure. Considering the resistance of most plastics to (bio)degradation [7,16] and the large occurrence of plastic wastes in landfills [14], their fragmentation implies a long-term generation of MP [17,18]. Several studies actually highlighted the presence of MP in landfill leachates [19,20,21,22]. Nevertheless, this source of MP was only first investigated in 2016 and as underlined by studies carried out over the last two years, remains understudied [13,18,23]. This is even more true for their transfer through porous media [24] and their role in groundwater resource deterioration [25]. MP generation and migration through environmental compartments, in particular groundwater, therefore need a better understanding [6,26].
The “Prairie de Mauves” landfill constitutes a good candidate for these evaluations. Closed for more than 30 years, the site is an ICPE. It is therefore monitored since 2009, as part of the Nantes Urban Environment Observatory (ONEVU) and the National Observation Service (SNO) Observil to evaluate its environmental impact. The occurrence of many contaminants such as trace metals and organic traces such as PAHs, BTEX, PCBs [27], pharmaceuticals and phytosanitary products [28] were already evaluated.
This study, therefore, aims at (i) providing new data on the contribution of landfill leachates to groundwater contamination in MP, (ii) evaluating the concentrations, polymer types and size ranges of MP potentially released from a former landfill and (iii) observing the impact of rainfall events on their migration.

2. Materials and Methods

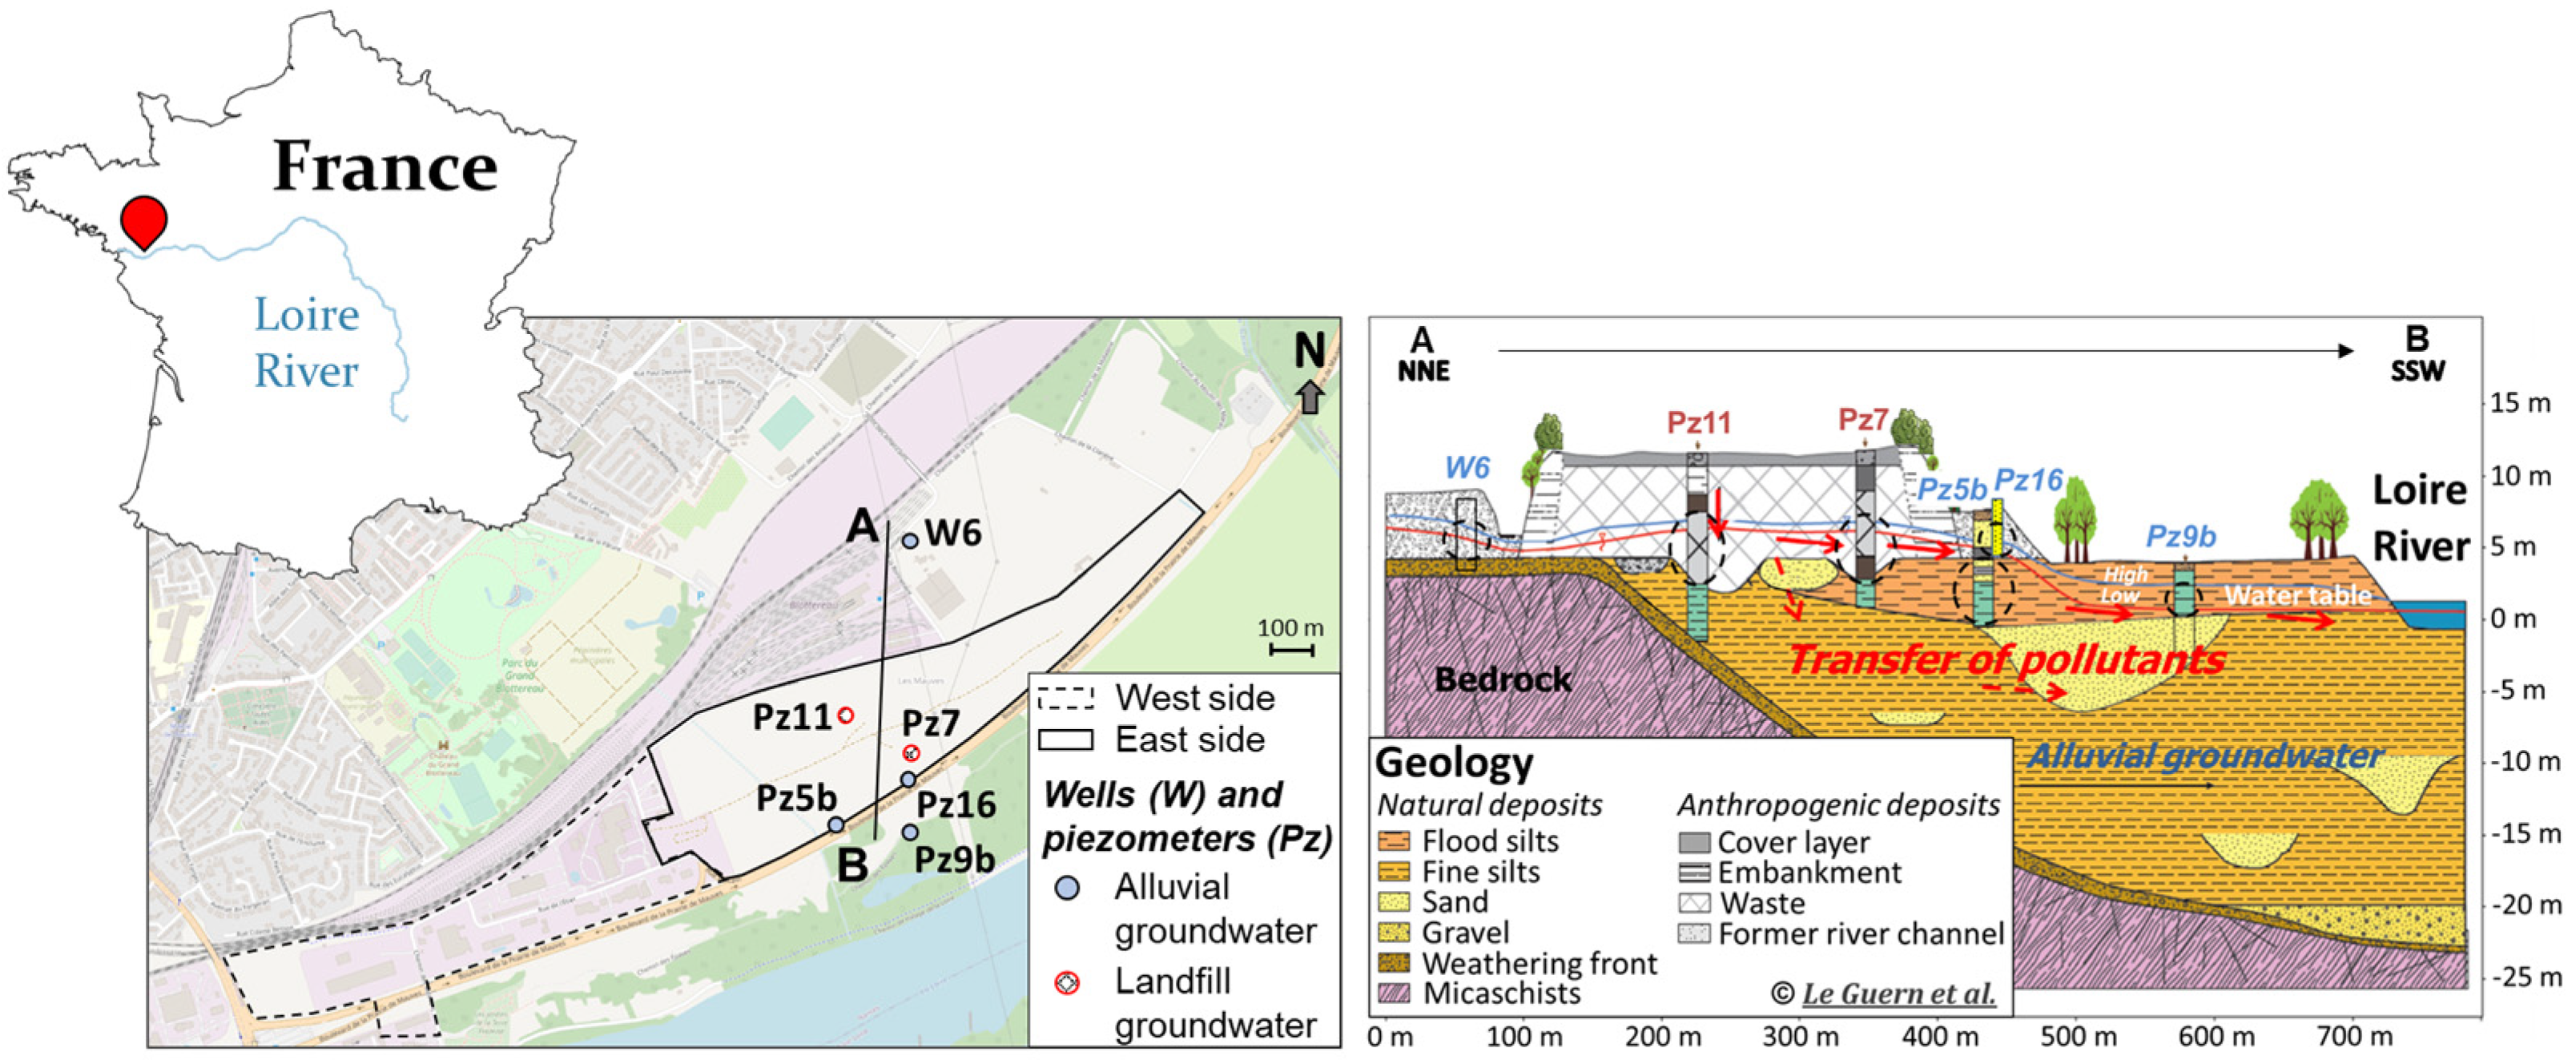
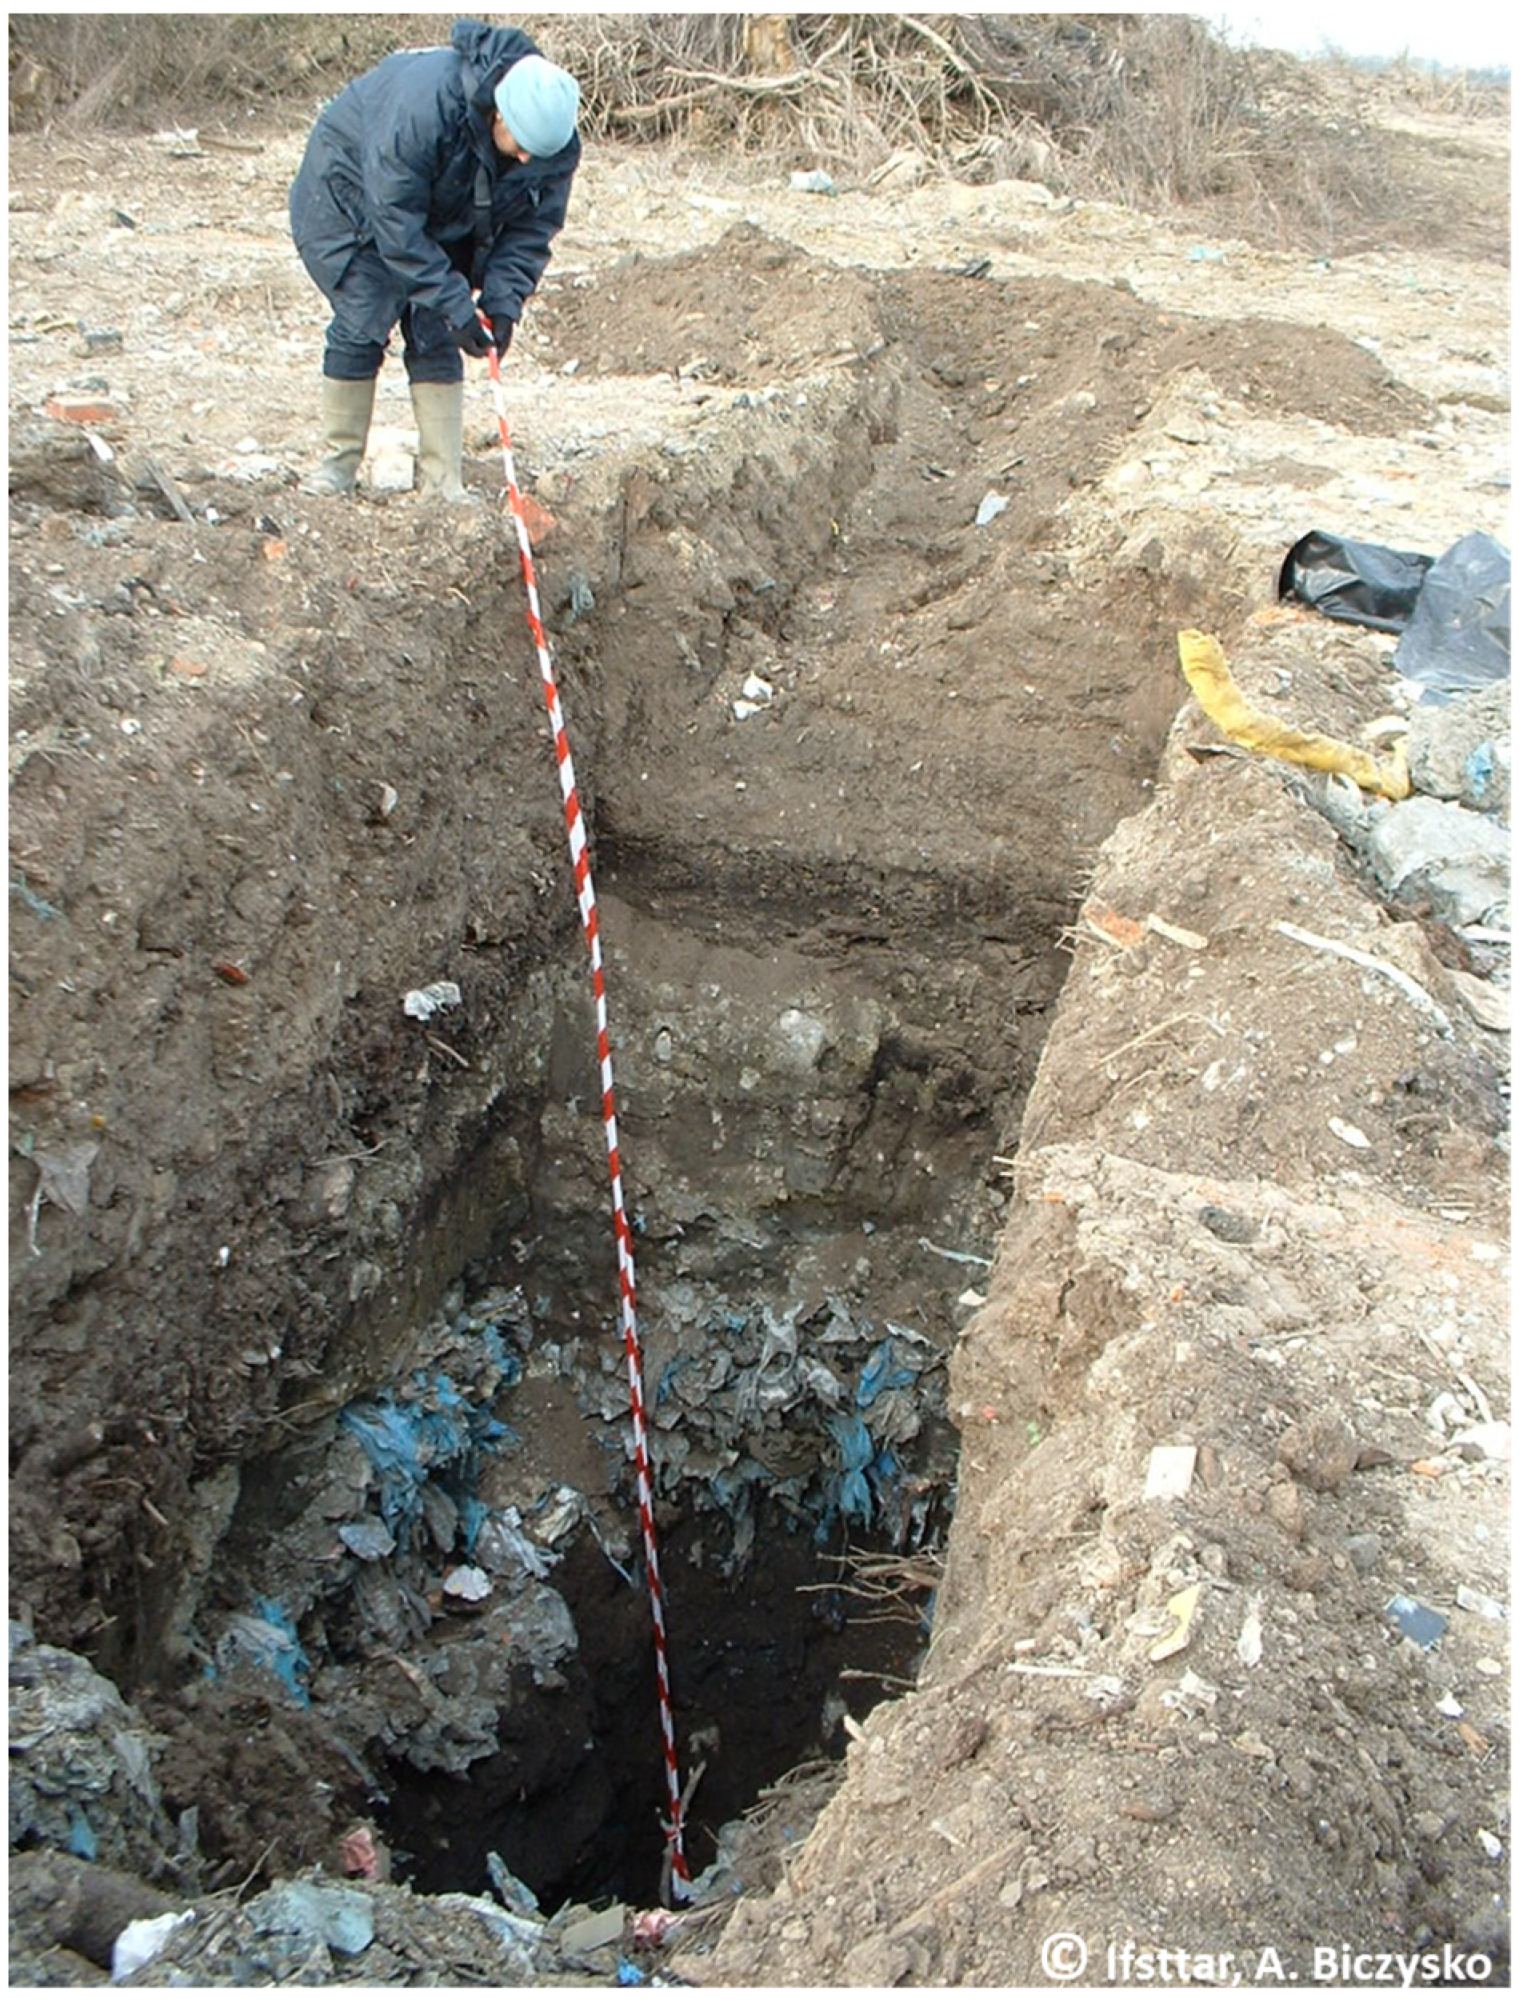
2.1. Experimental Site

The “Prairie de Mauves” experimental site is a former landfill located in Nantes (France). This landfill was created on meadows on the north side of the Loire River and operated from 1963 to 1987. It received domestic, organic, and potentially industrial solid wastes, totaling between 1.7 and 2.6 million m3 of waste [27]. After its closure, wastes were overlaid with inert backfills combined with clays to limit the water infiltration within the waste deposit. The western part of the landfill (22 ha) was transformed into an industrial zone and the eastern part (28 ha) stayed as it is, in the form of a plateau surrounded by embankments (Figure 1). Despite these accommodations, a water infiltration within the waste deposit is still observed [29].
No impervious layer isolated the landfill from the alluvial groundwater and leachates are not recovered for treatment. A former river channel acts as a drain at the bottom of the landfill (Figure 1) and the site is located in a flood risk area. Geologically, the landfill stands on muddy silts with sand lenses, lying on fractured micaschists (Figure 1). Two groundwater bodies coexist in this environment and are likely to communicate. The first one, named landfill groundwater, is perched in the waste deposit and corresponds to the landfill leachates. The second one is the alluvial groundwater of the Loire River [29]. Piezometric sensors (CTD Diver, Van Essen Instruments, Delft, the Netherlands) are used for monitoring the water levels in 14 piezometers and 6 wells: 5 upstream the landfill (of which W6), 6 in the landfill (of which Pz7 and Pz11) and 9 downstream (of which Pz16, Pz5b and Pz9b, Figure 1). The monitoring indicates that the alluvial groundwater flows from northeast to south-west [29].

2.2. Sampling Procedure

Leachates and groundwater samples were collected during two campaigns in March and June 2022 (Figure 2). To determine the impact of landfill leachates on the alluvial groundwater, samples were collected in one well upstream of the landfill (W6), in 2 piezometers within the waste deposit (Pz11 and Pz7) and in 2 piezometers downstream of the landfill (Pz16, Pz5b in March and Pz9b in June, Figure 1). The groundwater bodies corresponding to each sample are indicated in Figure 1.
For each sampling point, a purge of water was carried out until the stabilization of the physico-chemical parameters (pH, conductivity, temperature) before sampling. After stabilization (between 10 and 20 min of pumping depending on the point), between 8.8 and 10.2 L of water were collected with a submerged Supernova 21 pump (SDEC, France) fitted with a flexible tube Tubclair® (Tricoflex®, Vitry-le-François, France) and stored in glass bottles. At the laboratory, these bottles were stored at 4 °C until analysis.
During each campaign and at each sampling point, the groundwater level was measured with an electric contact gauge (Heron Instruments Inc., series #1700, Hamilton, Canada). At the same time, the electric conductivity (corrected at 25 °C) was measured using a WTW-IDS probe (TetraCon® 925, Weilheim, Germany).

2.3. Analytical Method

Subsamples (between 2.0 and 4.2 L) of the water samples collected were firstly filtered through a metallic filter (Ø = 47 mm, cut-off = 10 µm) to recover the particles. As MP are analyzed by imaging spectroscopy according to a 25 × 25 µm pixel resolution, finer particles cannot be measured and thus the fraction <10 µm was discarded. For all samples, the filtered particles were recovered with ethanol and filtered through alumina filters (Anodisc™, porosity = 0.1 µm) for analysis. To facilitate MP analysis, depending on the quantity of solid matter on the alumina filters, the organic matter of six samples was secondly oxidized using 100 mL of 30 wt% H2O2 during 48 to 72 h following the method used in [30]. After digestion, the metallic filter was placed in an ultrasonic bath and rinsed with H2O2. For 4 samples, the resulting solution was then filtered through Anodisc™ filters for analysis, and for the last two samples, a densimetric separation was thirdly conducted using a NaI solution (ρ = 1.65 g/cm3) and a JAMSS unit [31] during 24 h to improve the MP recovery. The supernatant was also filtered through Anodisc™ filters for analysis.
MP detection and quantification were performed over the entire filter with a µFTIR (Thermo Scientific Nicolet iN10, Waltham, MA, USA) using a transmission mode, a spectral range of 4000 to 1200 cm−1 and a pixel resolution of 25 × 25 µm. Maps were then analyzed using the SiMPle analysis free-to-use software developed by Aalborg University, Denmark, and the Alfred Wegener Institute, Germany (v.1.1.β, [32]). This software allows a comparison of IR spectra with the reference database based on 1st and 2nd derivatives. The provided information includes the number of MP, the polymer types, and the particle sizes (the major dimension corresponding to the longest distance between pixels of the particle and the minor dimension found by assuming the particle shape is an ellipse and knowing the area of the particle in the scan). In this study, 32 polymers were searched using the MP_Library_extended_grouped_1_5.txt [32]. Matching scores defined by default for each polymer were used but each identified particle was manually checked by an operator. SiMPle software, microplastic library as well as the table of matching scores retained are available and provided at https://simple-plastics.eu/ (accessed on 9 January 2022).

2.4. Quality Controls

At the laboratory, the glassware is cleaned and rinsed with ultrapure water before being covered with aluminum. All solvents (i.e., ethanol, H2O2 and NaI) are also filtered through glass fiber filters (Whatman GF/A) before use.
Protocol blanks were realized using ultrapure water and following the same analytical method as the samples, i.e., an oxidation of organic matter and a densimetric separation before a filtration through Anodisc™ filters. A total of 1 or 2 MP were found on the filters, corresponding to a mean concentration of 0.2 MP/L for a mean filtered volume of 4.5 L.
To limit a potential contamination during the sampling campaigns, the field equipment is cleaned and rinsed with ultrapure water before sampling. The glass bottle’s necks are covered with aluminium foil to avoid a contamination from the plastic caps during sample storage.
Field blanks were realized, notably because the pump and the tubing are made of PVC. These blanks were performed at the laboratory by pumping a large volume of water for 15 min to simulate the purge and by pumping 4.5 L of ultrapure water. MP in the ultrapure water pumped was analyzed and quantified following the same protocol as the field samples (i.e., filtered through a metallic filter, recovered with ethanol, filtered through Anodisc™ filters, and analyzed by µFTIR). Between 2 and 29 MP were found on the filters, mainly polyethylene (PE) and polyamide (PA). Regarding the protocol, i.e., the volume analyzed for MP, it corresponds to a mean concentration of 2.7 MP/L.

3. Results

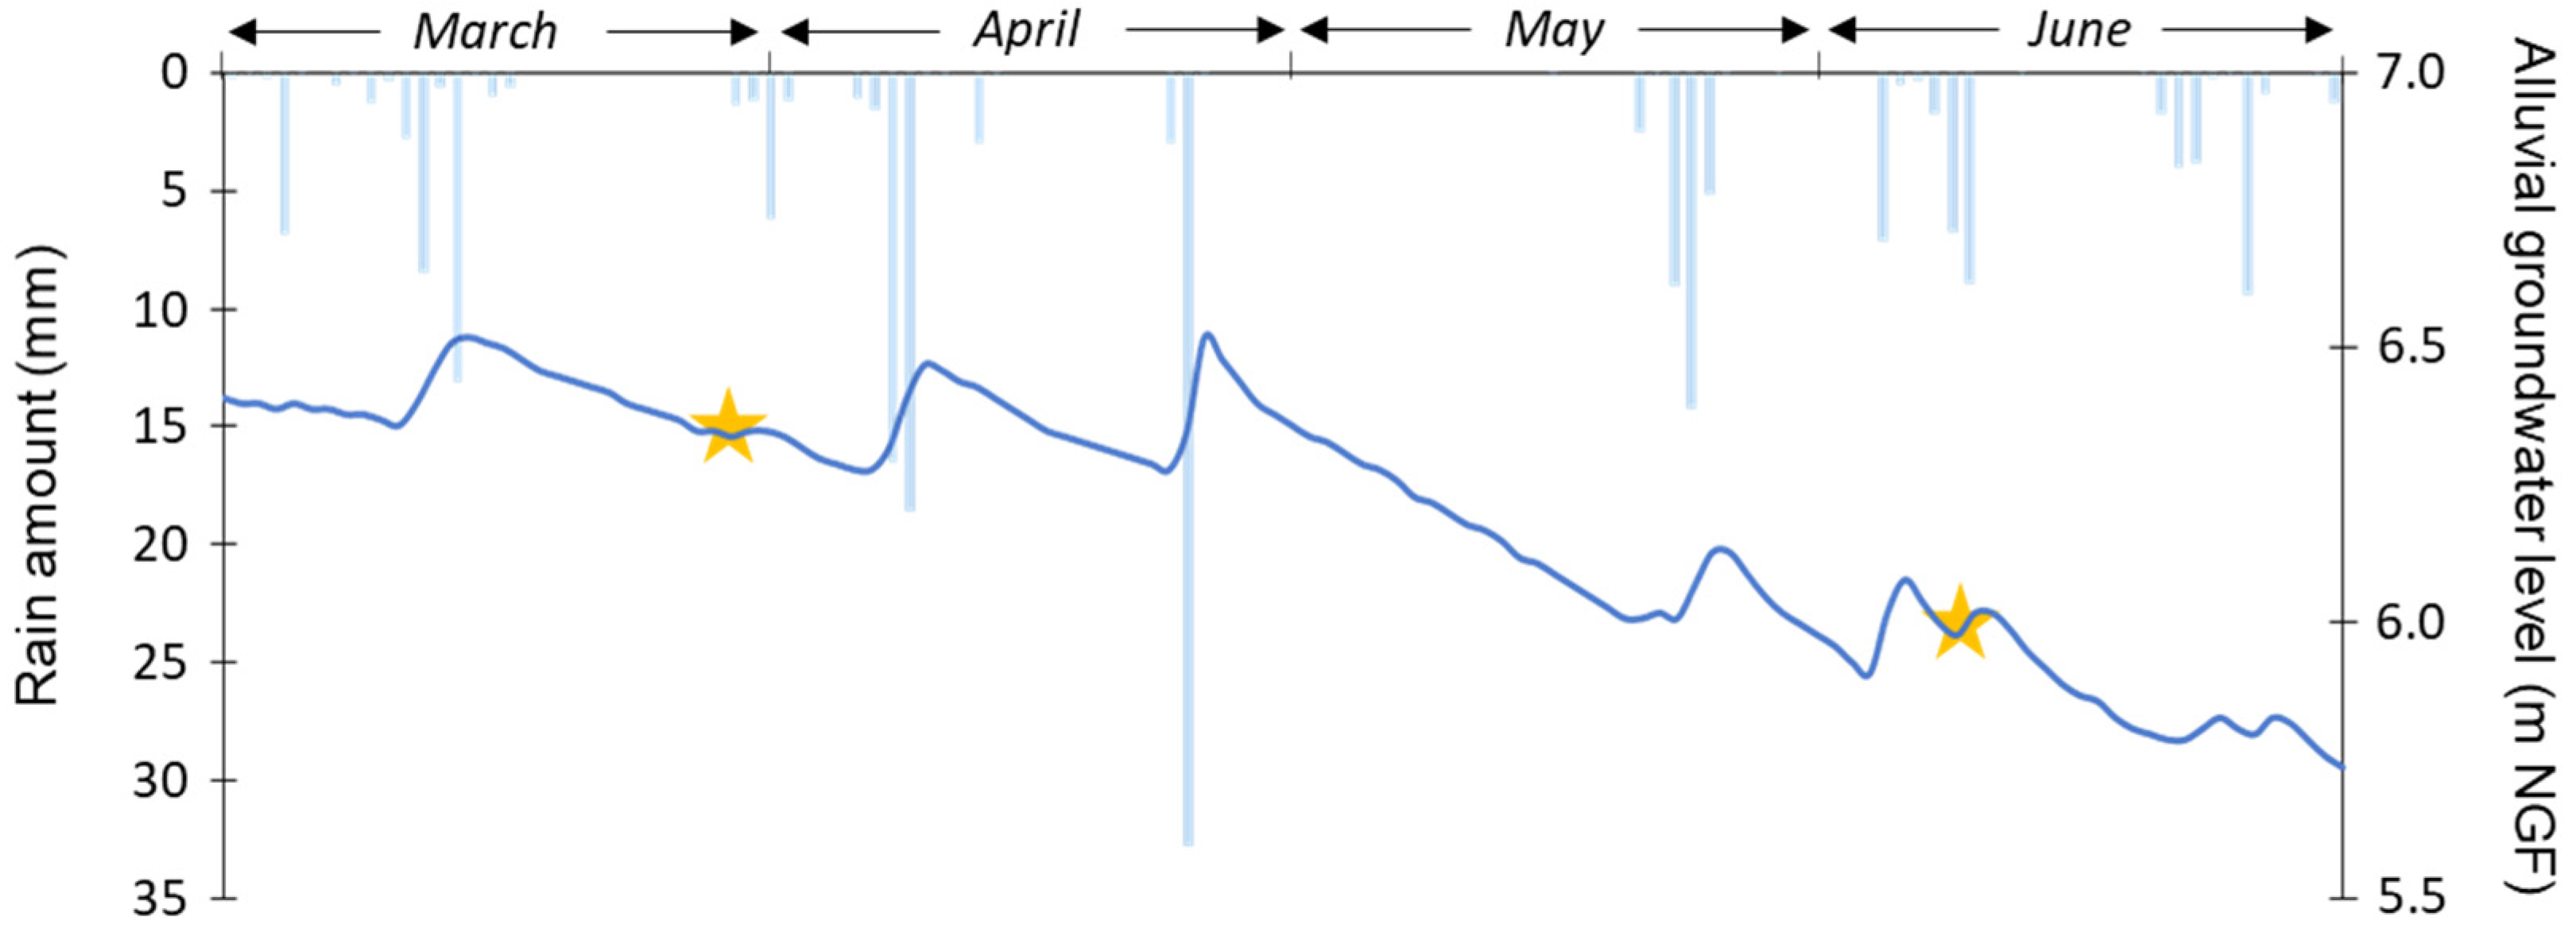
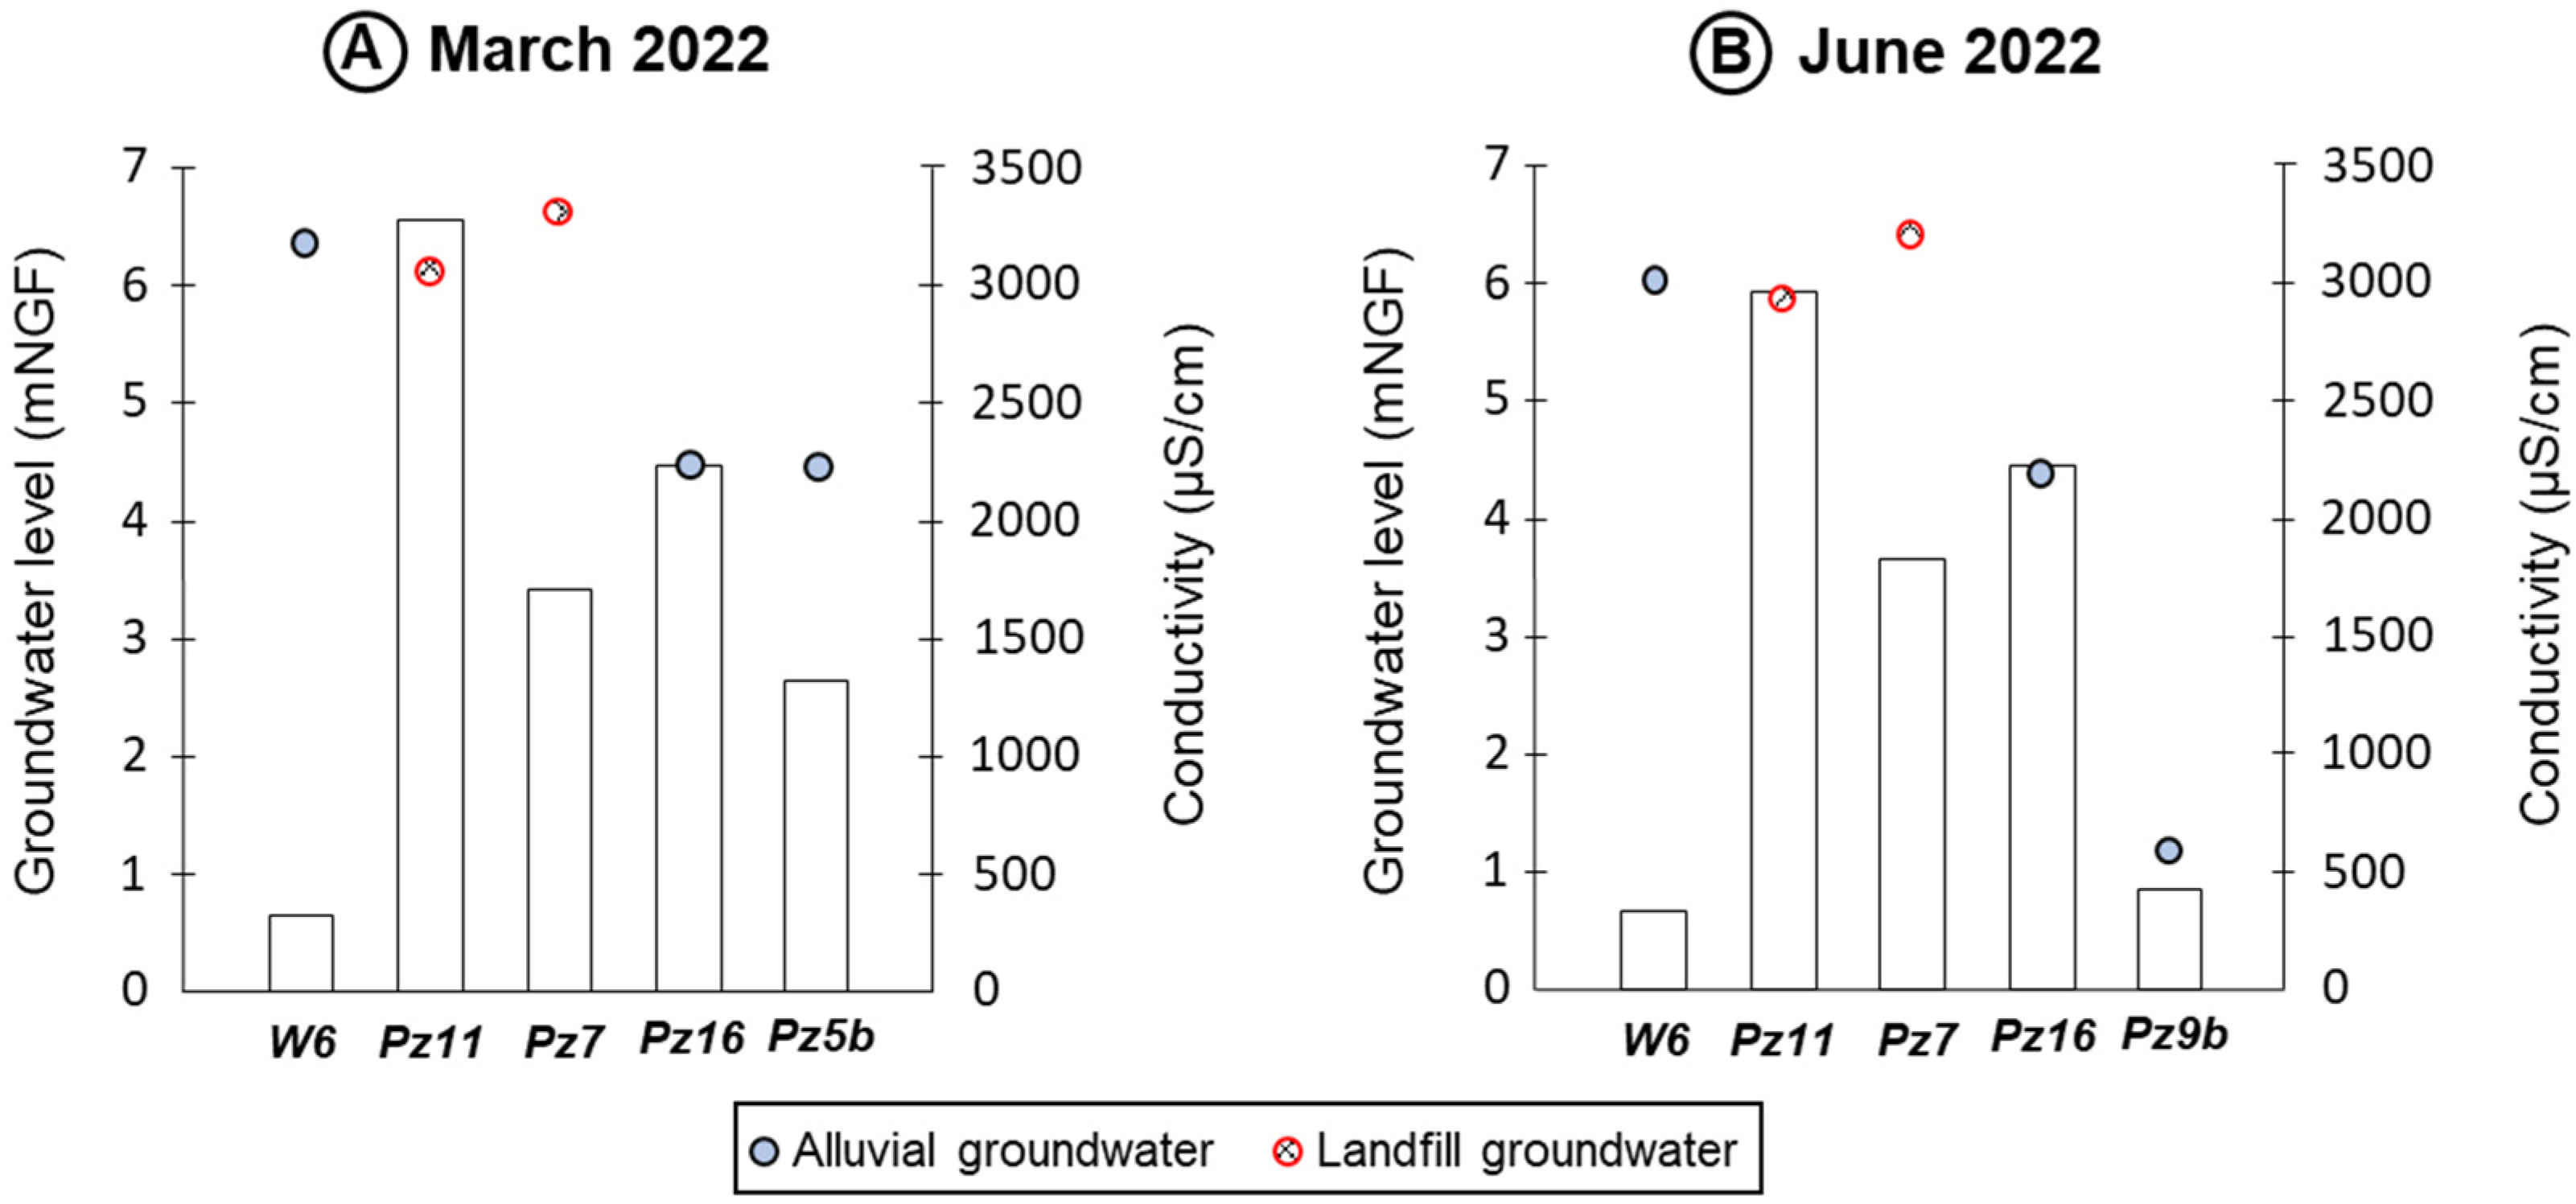
3.1. Groundwater Levels and Electric Conductivity

Landfill groundwater table levels ranged from 5.9 to 6.6 m NGF (Figure 3). With a hydraulic gradient of 50 cm between the two piezometers (Pz11 and Pz7), landfill groundwater levels appear variable at the waste deposit scale (Figure 3). The highest groundwater levels were measured at Pz7 (Figure 3), which actually corresponds to a piezometric dome. The groundwater levels slightly varied between both campaigns, decreasing from 20 cm in June compared to March 2022, but the hydraulic gradient stayed the same (Figure 3). The alluvial groundwater levels ranged from 1.2 to 6.4 m (Figure 3) and therefore showed high spatial variations. At the experimental site scale, the hydraulic gradient reached around 5 m (Figure 3). The highest groundwater levels were measured at W6 (Figure 3), consistent with the direction of the groundwater flow (from northeast to south-west, Figure 1). The groundwater levels slightly varied between both campaigns, decreasing from 10 to 30 cm in June compared to March 2022.
Values of electric conductivity ranged between 330 to 3290 µS/cm and showed high spatial variations. The lowest value was measured in the alluvial groundwater upstream of the landfill (W6) and the highest in the first piezometer within the waste deposit (Pz11, Figure 3). In the alluvial groundwater, the conductivity was the highest immediately downstream of the landfill and decreased further downstream (Figure 3). The conductivity shows low temporal variations and its spatial evolution appeared similar in March and in June (Figure 3).

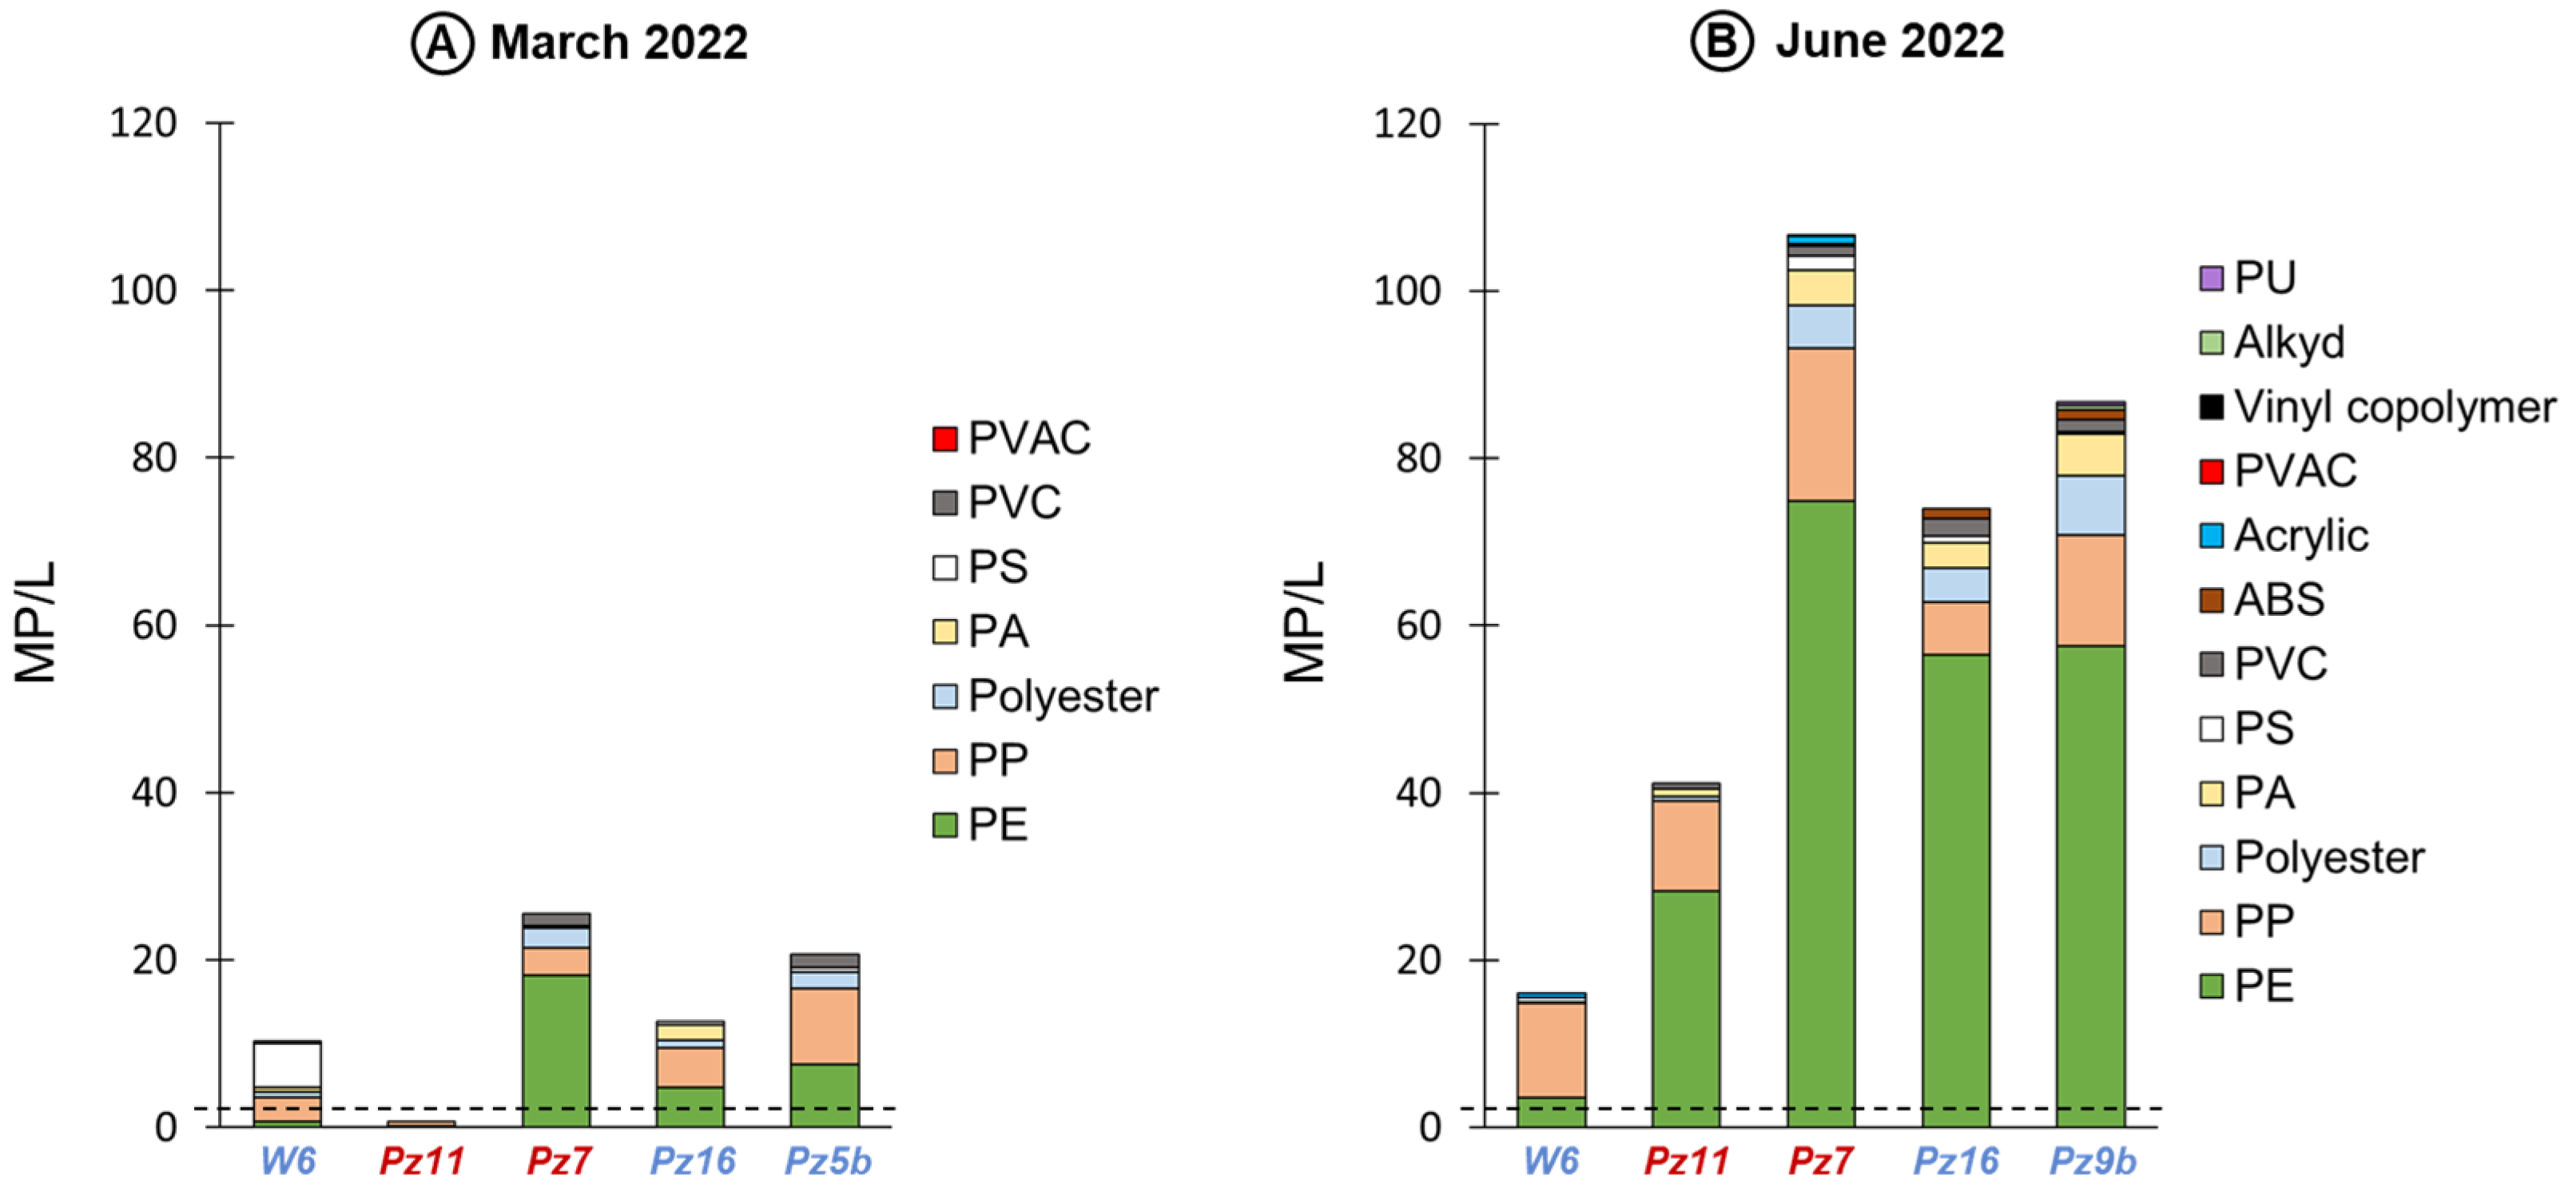
3.2. Microplastic Concentrations

MP were detected in each sample and excluding one sample exhibiting concentrations below the blank ones (Pz11 in March, 0.71 MP/L), concentrations ranged from 10.3 to 106.7 MP/L (Figure 4). The lowest concentration was measured in the alluvial groundwater upstream of the landfill in March (W6, 10.3 MP/L, Figure 5). The highest concentration was measured in the second piezometer within the waste deposit in June (Pz7, 106.7 MP/L, Figure 5). In both groundwater bodies, MP concentrations showed high spatial variations (Figure 5). Nevertheless, MP concentrations were on average higher in the landfill groundwater (mean concentration equals 43.5 MP/L) than in the alluvial one (mean concentration equals to 36.7 MP/L). MP concentrations also showed high temporal variations with higher concentrations in June (mean concentration equals 64.9 MP/L) than in March (mean concentration equals to 14.0 MP/L) at each sampling point (Figure 5).

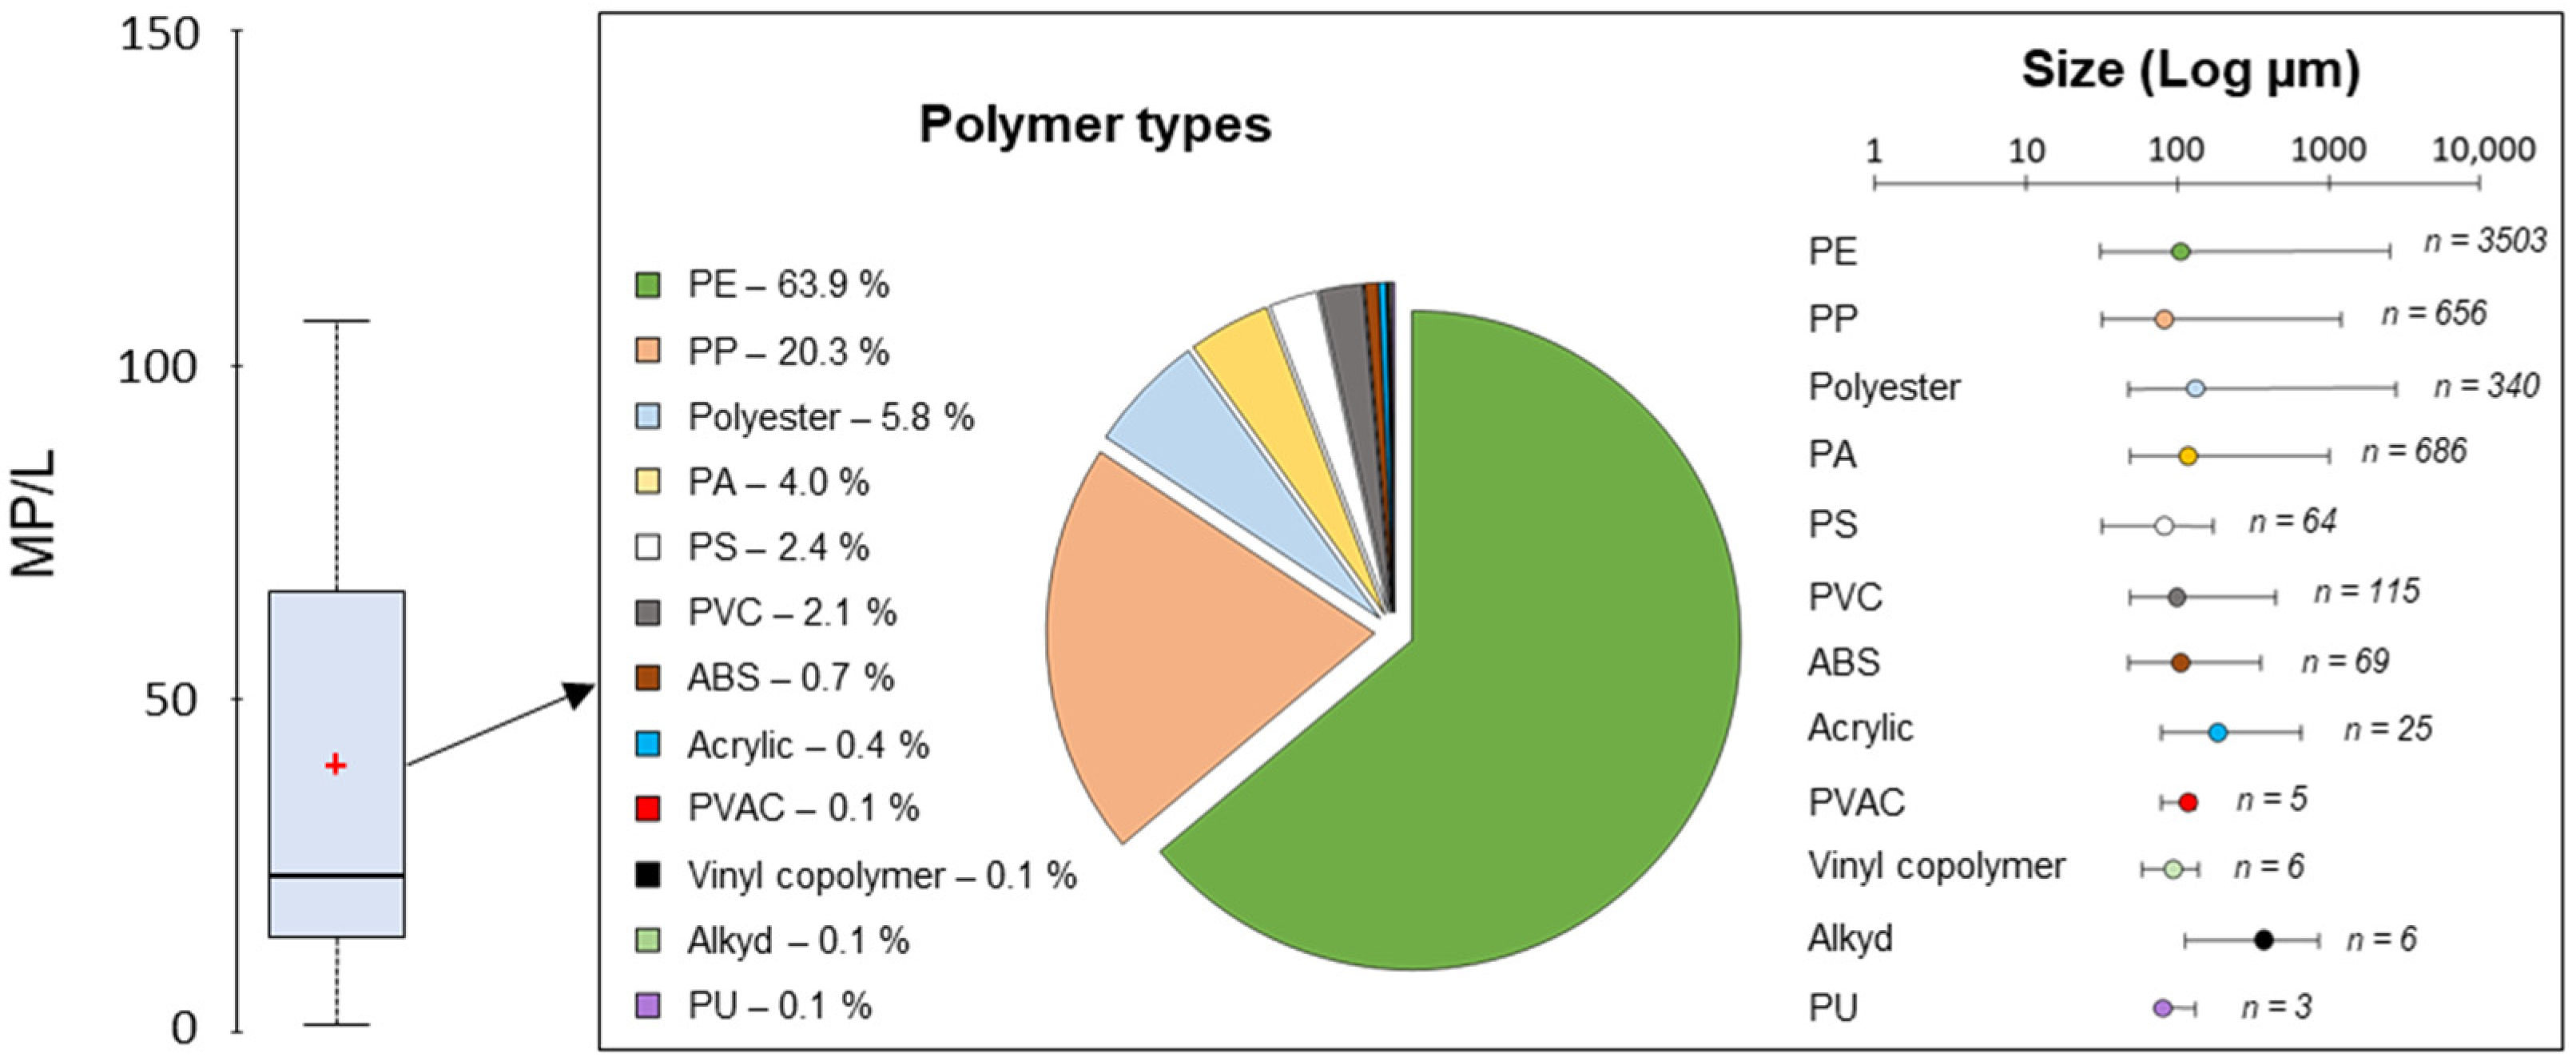
3.3. Microplastic Polymer Types

In total, 12 polymer types were identified: polyethylene (PE), polypropylene (PP), polyester (including poly(ethylene terephthalate) (PET)), polyamide (PA), polystyrene (PS), polyvinyl chloride (PVC), acrylonitrile-butadiene-styrene copolymer (ABS), acrylic, poly(vinyl acetate) (PVAc), vinyl copolymer, alkyd and polyurethane (PU). PE was the most abundant polymer (63.9%), followed by PP (20.3, Figure 4), and both polymers were identified in all samples (Figure 5). Polyester, PA, PS and PVC had considerable concentrations too (Figure 4) and were identified in most of the samples (60 to 80%). The other polymer types were less frequently identified (10 to 30% of the samples) and had only low concentrations, slightly contributing to the MP concentrations observed in this study (Figure 4). PE, PP, polyester, PA, PS and acrylic were detected in the landfill groundwater and in the alluvial one upstream and downstream of the waste deposit (Figure 5). In contrast, PVC, ABS and vinyl copolymer were only detected within or downstream of the landfill. Moreover, PVAC was only detected upstream of the landfill whereas alkyd and PU were only detected in the downstream part of the alluvial groundwater. A higher diversity of polymer types was observed in June compared to March (Figure 4). For the polymer types observed in both campaigns, all showed higher concentrations in June except PS (Figure 4).

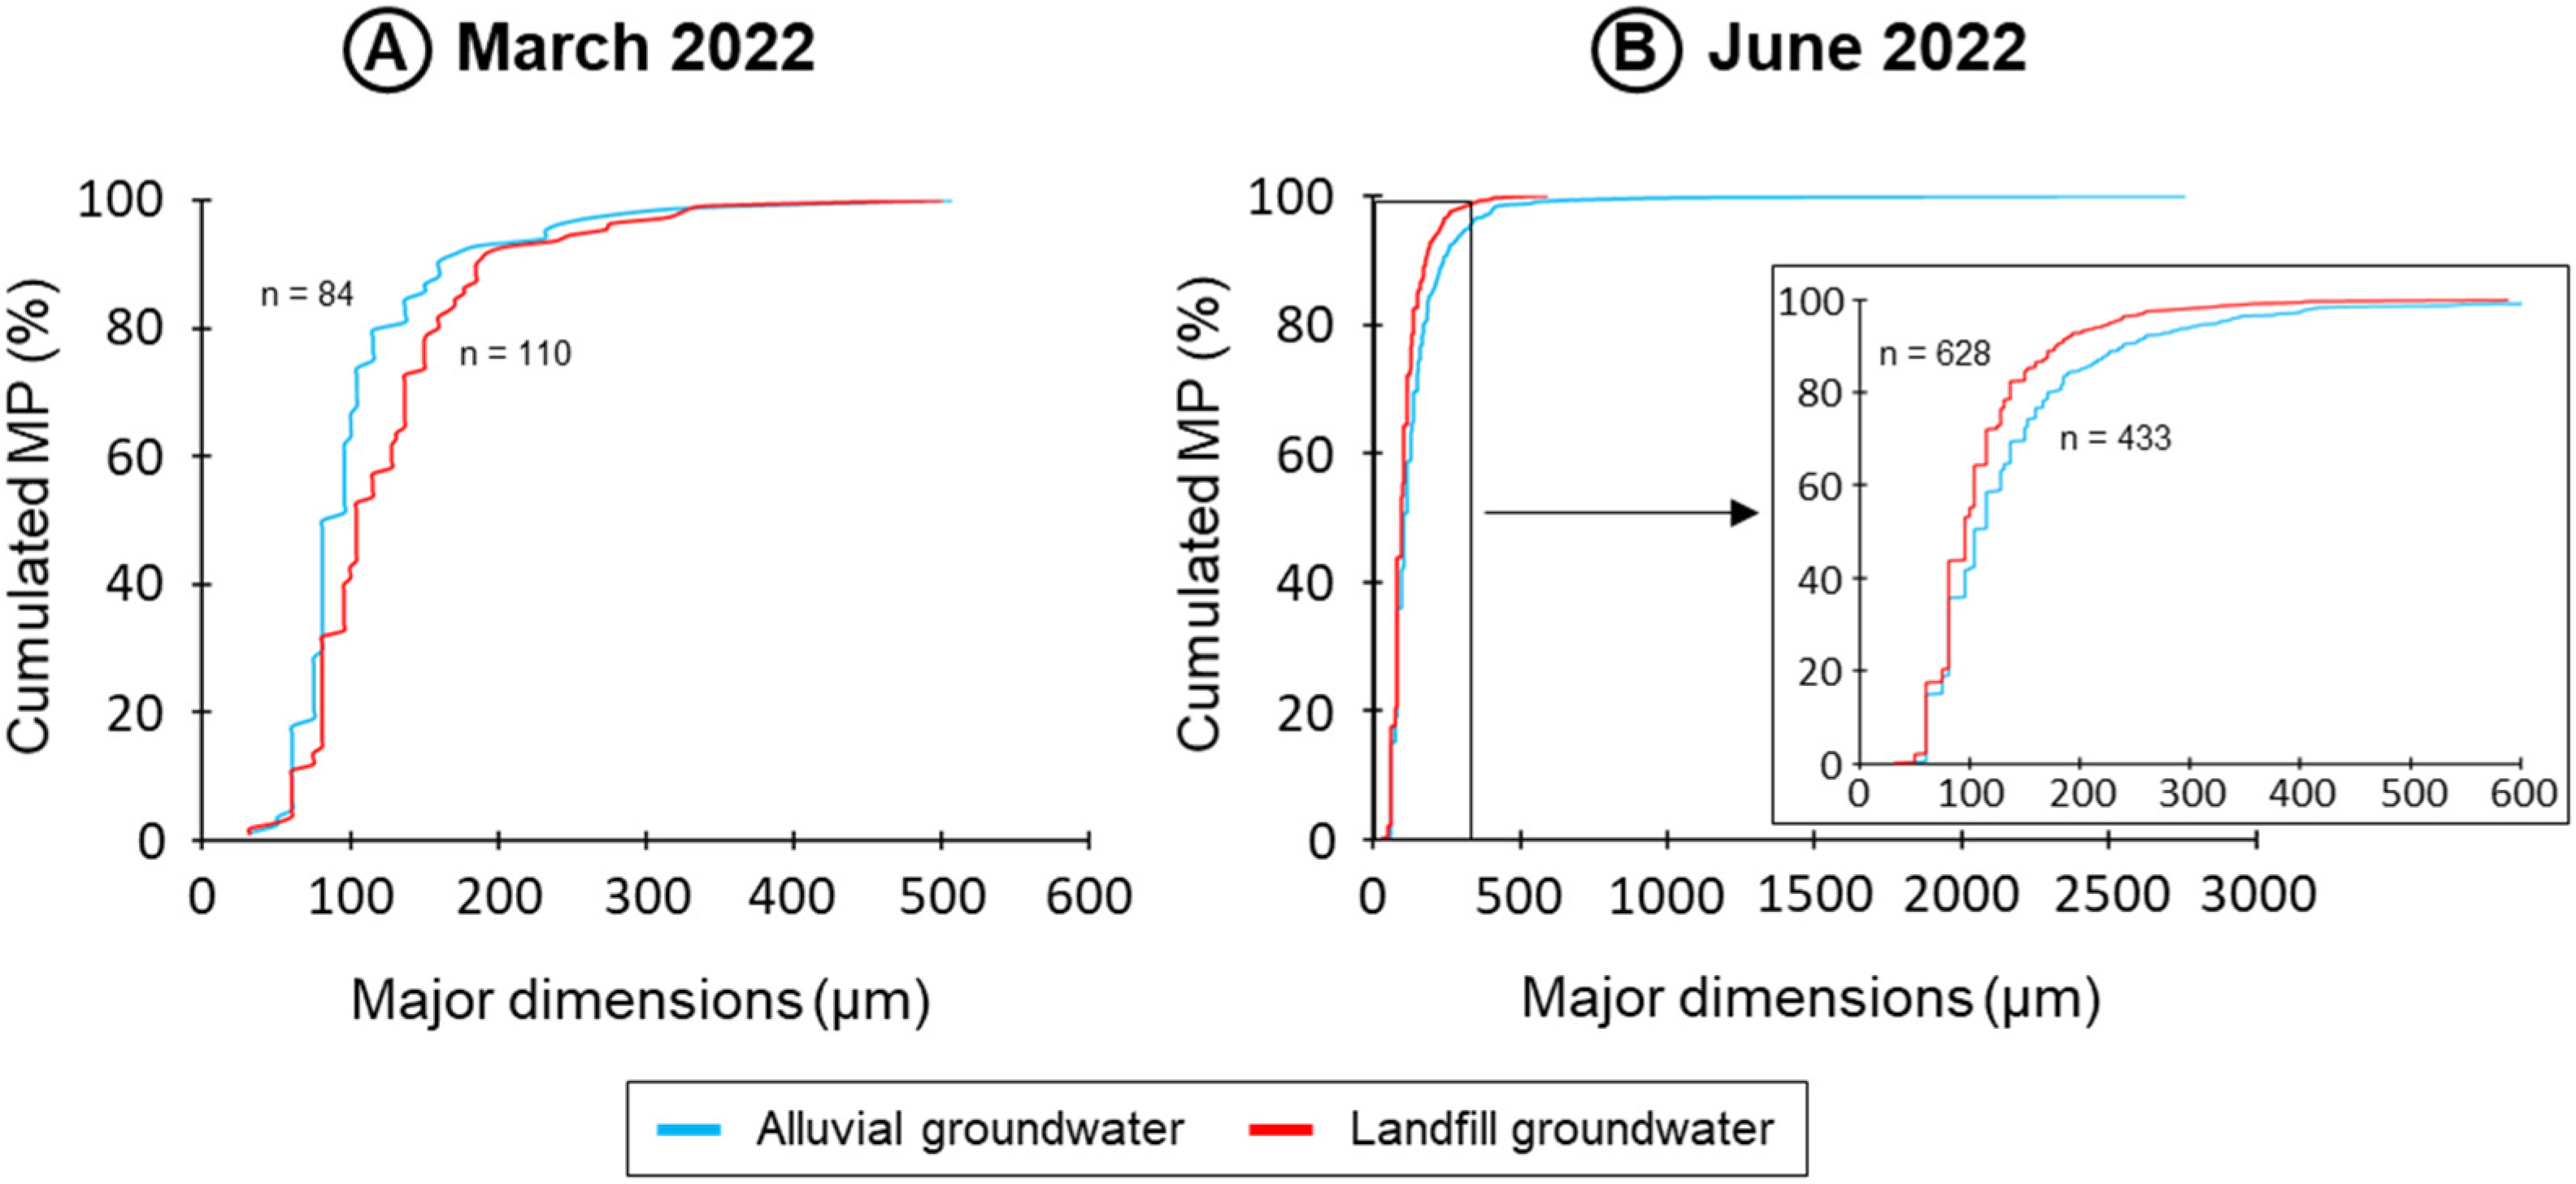
3.4. Microplastic Size Ranges

Considering all samples, MP major dimensions ranged from 32 to 2758 µm, with a median value equals to 104 µm (Figure 4). Acrylic and alkyd were the coarser polymer types having the highest median sizes (median values equal to 183 and 380 µm, respectively), while PS and PP had the lowest (both median sizes equal to 81 µm). PE and polyester exhibited the widest size ranges, varying from 32 to 2565 and from 50 to 2757 µm, respectively. On the contrary, particles of PVAC, vinyl copolymer and PU exhibited narrow size ranges, not exceeding 140 µm (Figure 4). MP major dimensions appeared different between both groundwater bodies but this difference varied between March and June. In March, MP size ranges were similar in both groundwater bodies and ranged from 32 to around 500 µm (Figure 6). Nevertheless, MP were slightly coarser in the landfill groundwater (90% of particles lower than 185 µm) than in the alluvial one (90% of particles lower than 160 µm). In June, the MP size ranges were wider in the alluvial groundwater (ranging from 32 to 2758 µm) than in the landfill one (ranging from 32 to 589 µm). As a result, MP were coarser in the alluvial groundwater (90% of particles lower than 240 µm) than in the landfill one (90% of particles lower than 178 µm, Figure 6).

4. Discussion

4.1. A Contamination of the Landfill Groundwater Body

The high values of electric conductivity in the landfill groundwater (Figure 3) clearly illustrate the contribution of the wastes to the chemical composition of pore water as a consequence of rain infiltration and a sufficient residence time of water in the waste deposit, before the transfer of leachates towards the underlying alluvial deposits. These leachates collect contaminants through the waste mass. An accumulation of trace metals, PAHs and pharmaceuticals in the landfill groundwater was already demonstrated by [28,29]. This study highlights that MP are no exception. Although MP concentrations appeared highly variable at the waste deposit scale, mostly because of the deposit heterogeneity, these were actually from three to seven times higher at Pz7 than in the alluvial groundwater upstream to the landfill (W6, Figure 5). Such differences suggest high contamination levels in the landfill groundwater. Nevertheless, these levels are difficult to compare. Firstly, few studies investigated MP in landfill leachates and this is even truer for closed and French landfills (Table 1). Secondly, because of the site properties and specificities. The only study conducted on a French landfill was in another context, by evaluating MP releases to the marine coastal environment from an abandoned coastal landfill whose collapse resulted in a waste distribution along the coast [33]. Among the studies conducted on landfill leachates, MP concentrations are highly variable and our results are in the upper range of values reported in the literature (Table 1).
Several factors can induce variations in MP concentrations. Firstly, variabilities can result from regional differences in solid waste composition [18], climate conditions, landfill technologies [13], and environmental regulations in their management [2]. Secondly, landfill age and status play a key role in MP composition and releasing rates (active/closed, [17]) as these dynamic systems vary with time [14]. Thirdly, the absence of standardized approaches for MP characterization [13,18,34] leads to various sampling and analytical methodologies (Table 1; [14]). Ref. [17] highlighted that the number of MP increases with the decrease of size. In this study, the minimal size of detection is lower than in other studies, therefore allowing for the identification of a higher number of particles. Our results are actually closer to studies having the smallest MP size ranges analyzed than those having the highest (Table 1). Besides, by focusing on smaller particles than this study (10–50 µm), Ref. [35] observed even higher MP concentrations (Table 1). In any way, the landfill represents a critical potential source of contamination for the alluvial groundwater.
While the presence of PE, PP, polyester, PA, PS, and acrylic at W6 (Figure 5) suggests other sources that the landfill for these polymers, the increase of their concentrations in the landfill groundwater illustrates that it still constitutes a source. In contrast, the “Prairie de Mauves” landfill appears to be the main source of PVC and ABS (Figure 5). A release of all these polymers is consistent considering their wide production in the 70’s [39] which suggests their large occurrence in solid wastes. At the beginning of the 90’s, plastics from household wastes alone accounted for more than two-thirds of all French plastic waste [40]. Household wastes contained about 11% of plastics in humid mass, with a predominance of packaging [40] which was already the prevailing sector generating plastics [39]. By being mainly used for the packaging industry, two third of household plastic wastes corresponded to PE and PP consistently with their predominance observed in this study. Among the remaining plastics in household wastes, 15% corresponded to PS and PSE, 10% to PVC and 5% to PET [40]. For these polymers, the differences observed in the “Prairie de Mauves” landfill leachates may be explained by the presence of another type of wastes (organic and potentially industrial solid wastes) and the evolution of the plastic market in the 70’s and the 80’s compared to the beginning of the 90’s [39]. There may also be a difference in the degradation and fragmentation kinetic among polymers [41]. Moreover, because of its use for building/industrial activities [42], PVC generally represents a significant fraction of wastes buried in landfills. [27] realized some excavations in the “Prairie de Mauves” waste deposit and actually observed many plastic packages (Figure 7) in the different drilling carried out, and construction/demolition wastes.
PE and PP predominance was also observed in plastic wastes excavated from English or Chinese landfills [23,43] as well as in Chinese [35,44] and Indonesian landfill leachates [34]. These were also the most common polymers found in French surface waters such as across the Garonne River catchment [45], in the Seine [30], the Oise and the Marne Rivers [38]. Considerable concentrations of polyester, PA, PS ad PVC were also measured in wastewater and landfill leachates worldwide [6,18]. The diversity and the polymer’s relative importance are therefore not specific neither to recent landfills or to former ones.

4.2. Leakages towards the Alluvial Groundwater Body

In the “Prairie de Mauves” landfill, [27] supposed a hydraulic continuity between the two groundwater bodies and episodic rises of the alluvial groundwater table in the waste deposit during flooding periods (Figure 2). Leakages from the landfill groundwater to the alluvial one through the embankments at the downstream part of the waste deposit are also suspected [28]. In this study, leakages from the landfill groundwater to the alluvial one through the embankments of the waste deposit are clearly illustrated by the increase of electric conductivity in the alluvial groundwater immediately downstream of the landfill (Figure 3). An increase in MP concentrations was also observed (Figure 5) demonstrating a migration of these contaminants. The leakages may occur both through hydraulic continuity at the bottom of the landfill and through lateral leakages. Road runoff infiltration could also induce an input of MP, mostly in Pz16 and Pz5b (Figure 1). Among the detected polymer types, the mainly used in the automotive industry are PP, ABS, PA, and PUR [42] but no evidence of such a contribution was observed.
MP concentrations decreased between the landfill groundwater (Pz7) and the alluvial groundwater immediately downstream (Pz16, Figure 5) suggesting a natural attenuation of this contamination. Multiple factors can affect MP vertical migration such as the size, hydrophobicity, density, and shape of the particles as well as the texture and physico-chemical characteristics of the porous media [46,47,48]. For trace metals, PAHs, and pharmaceuticals, Refs. [27,28] actually observed a natural attenuation downstream of the “Prairie de Mauves” landfill. An attenuation by filtration in the alluvial materials was supposed because particle-bound contaminants appeared more affected than dissolved ones, and because the contamination decrease was even higher further downstream [27,28]. Regarding MP, Ref. [6] speculated a retention of large particles in landfills, and using experimental columns, some authors actually demonstrated a higher mobility of small-sized MP more likely to be transported through the soil pores and transferred on long distances [47,49]. Nevertheless, buried, wastes under anaerobic conditions undergo enhanced degradation processes over time [6,43] and as a result, MP sizes decrease with increasing landfill age [21]. The age of the wastes buried in the “Prairie de Mauves” landfill can therefore explain the small size of the particles detected (median size equals 104 µm) which may enhance their migration towards and through the alluvial groundwater body. Wide size ranges of MP were however observed in this study (Figure 4) and their transfer distances could not be related to their sizes. Similarly, while [47] observed different transfer capacities according to polymer types, no such difference was observed in this study. The heterogeneity of the geological substratum, therefore, allows a migration of MP from all size ranges and all polymer types toward the alluvial groundwater body. Besides, efficient transport of MP in alluvial aquifers was already demonstrated [37,50] putting the assumption that filtration will cause a decrease in MP in question. This observation also underscores that the geological substratum of a landfill takes a key role in the contaminants’ transfer capacity and has to be taken into consideration [25].
In the alluvial groundwater downstream to the landfill (Pz16, Pz5b and Pz9b), MP concentrations were in the same orders of magnitude as concentrations measured in groundwater near an active Chinese landfill [7] and Indian ones [36]. Such orders of magnitude are however not specific to landfill sources as similar concentrations were observed in an alluvial Australian aquifer [37]. Nevertheless, these orders of magnitude were also comparable to the findings of [38] who analyzed MP concentrations in surface water (i.e., the Marne, the Oise, and the Seine Rivers) with the same analytical method as in this study (Table 1). On the one hand, these similarities confirm that former landfills generate high MP levels in long-term. On the other hand, considering that plastic degradation in landfill environments takes at least 20 years [19], it suggests that actual uncontrolled landfills represent a worrying stock of MP.

4.3. Temporal Variations of Microplastic Concentrations

The conductivity profile does not vary between both campaigns and values were quite similar (Figure 3), illustrating that (i) the hydrogeochemical composition of the groundwater bodies is quite stable and controlled by the water-waste and water-alluvial material interactions, and (ii) the hydraulic continuity between the two groundwater bodies is also established over time water whatever the rainfall recharge. In contrast, MP concentrations exhibited temporal variations in quality and quantity with higher releasing rates of a larger diversity of polymers in June (Figure 4). Even if landfills continuously release MP to the environment [14] and in long-term, MP releasing rates can therefore be highly variable in time.
Climatic factors can induce temporal variations in MP generation and migration, such as higher temperatures favoring plastic degradation [20] or the weather and local hydrology [51], as rainfall influence the quantity of leachates generated in soils [14]. In this study, the sampling campaign carried out in March was after a dry period (11 days without rain), contributing to the progressive lowering of the alluvial groundwater levels (Figure 2). In contrast in June, the sampling campaign was carried out during a period of rising groundwater levels because of a succession of small and frequent rainfall events, especially one event occurring 24 h earlier (for a total amount of 14.3 mm, Figure 2). The increase of MP concentrations and diversity in both groundwater bodies therefore demonstrates that an increase of rain infiltration, and consequently increase of water flow rate, enhanced the remobilization of MP in the landfill groundwater as well as their migration towards the alluvial one. As previously suggested, other studies observed an increase in MP concentrations in groundwater after rainfall events or during wet seasons [48,52]. Different assumptions may explain such increases. Firstly, infiltration accelerates contaminant dispersion [26]. Secondly, some authors observed an increase in MP infiltration capacity in sandy porous media with the number of wetting-drying cycles [47,49]. In the case of the “Prairie de Mauves” landfill, the alluvial groundwater level fluctuations (e.g., at W6, Figure 2) may promote MP migration through the sand lenses and the former river channel (Figure 1) constituting preferential pathways for the water flows. This could explain why the widest MP size ranges were observed in the alluvial groundwater in June and why particles were therefore coarser than in March (Figure 6). This also supposes that rainfall events enhanced the remobilization and the percolation of larger particles. These statements are of great importance considering that such rainfall events occur frequently. It also supposes that MP migration will be worse in case of intense rainfall events and variability of the recharge. During these last, MP migration may actually be exacerbated by a decrease in the attraction force between the MP and the air-water interface [53].

5. Conclusions

To the best of our knowledge, this study is the first to investigate MP releasing rates from landfill leachates to surrounding groundwater in France. It shows that rainfall infiltration concentrates MP in the landfill groundwater and that the diversity of polymers was not specific to former landfills. PE and PP were actually predominant such as in most studies and environmental compartments while the wastes were buried over 30 years ago. Concentrations of this study appear high because resulting from the landfill age, MP are mainly small sized. Due to the absence of standardized methodologies, such size ranges are not the most investigated. The hydraulic continuity between both groundwater bodies allows the migration of MP from all sizes and polymer types, whatever the period. Moreover, the transfer capacity of MP appears enhanced in the case of aged landfills and alluvial groundwater bodies through heterogeneous geological substratum. MP sizes, diversity and release rates can however be highly variable in time. In the case of the “Prairie de Mauves” landfill, rainfall events increase the migration of MP. It also allows the migration of larger particles through preferential pathways of the heterogeneous geological substratum.
A better assessment of the role of landfill leachates on MP contamination in groundwater needs further research to (i) evaluate MP production in anaerobic conditions and (ii) evaluate the factors that condition their migration. Landfills leachates and receiving groundwater demonstrate high variabilities in MP concentrations but results are difficult to compare. Better comparability would require a standardization of methodologies and a better consideration of the geological substratum. Moreover, considering the high temporal variabilities of MP concentrations observed in this study, one sampling campaign appears not sufficient to monitor the impact of landfill leachates on groundwater. As little is known about the role of rainfall events, the achievement of sampling campaigns during different periods would therefore assess a better comprehension of MP migration in case of uncontrolled landfills which are still abundant. A better comprehension of the processes affecting MP migration in natural porous media is actually crucial for better management of actual landfills.

Author Contributions

Data Curation, Formal analysis, Writing—Original Draft, Visualization, L.L.; Investigation, Data Curation, Methodology, Validation, N.-N.P.; Investigation, Resources, Validation, B.F. and P.R.; Investigation, Data Curation, J.P.; Investigation, Conceptualization, Writing—Review and Editing, Supervision, Funding acquisition, C.L.G. and B.B.; Resources, Conceptualization, Writing—Review and Editing, Supervision, Project administration, Funding acquisition, J.G. All authors have read and agreed to the published version of the manuscript.

Funding

Being part of the Plasti-nium Research Project, this work was funded by the Région Pays de la Loire and Nantes Métropole.

Institutional Review Board Statement

Not applicable.

Informed Consent Statement

Not applicable.

Data Availability Statement

All data are provided in this article.

Acknowledgments

Authors gratefully thank the Nantes Urban Environment Observatory (ONEVU-IRSTV) for the technical support, the access to instrumentation and acquired data.

Conflicts of Interest

The authors declare no conflict of interest. The funders had no role in the design of the study; in the collection, analyses, or interpretation of data; in the writing of the manuscript; or in the decision to publish the results.

References

  1. Heinrich Böll Stiftung, La Fabrique Ecologique, Break Free From Plastic. Plastic Atlas—Facts and Figures about the World of Synthetic Polymers 2020. Available online: https://www.boell.de/en/plasticatlas (accessed on 9 January 2022).
  2. Monkul, M.M.; Özhan, H.O. Microplastic Contamination in Soils: A Review from Geotechnical Engineering View. Polymers 2021, 13, 4129. [Google Scholar] [CrossRef]
  3. ADEME. Les Déchets En Chiffres; Agence de l’Environnement et de la Maîtrise de l’Energie: Paris, France, 2006; p. 12. [Google Scholar]
  4. ADEME. Déchets—Chiffres Clés. L’essentiel 2021; Agence de l’Environnement et de la Maîtrise de l’Energie: Angers, France, 2021; p. 36. [Google Scholar]
  5. Kaza, S.; Yao, L.; Bhada-Tata, P.; Van Woerden, F. What a Waste 2.0: A Global Snapshot of Solid Waste Management to 2050; World Bank Publications: Washington, DC, USA, 2018; p. 295. [Google Scholar]
  6. Golwala, H.; Zhang, X.; Iskander, S.M.; Smith, A.L. Solid Waste: An Overlooked Source of Microplastics to the Environment. Sci. Total Environ. 2021, 769, 144581. [Google Scholar] [CrossRef]
  7. Wan, Y.; Chen, X.; Liu, Q.; Hu, H.; Wu, C.; Xue, Q. Informal Landfill Contributes to the Pollution of Microplastics in the Surrounding Environment. Environ. Pollut. 2022, 293, 118586. [Google Scholar] [CrossRef]
  8. OPECST. Les Nouvelles Techniques de Recyclage et de Valorisation des Déchets Ménagers et des Déchets Industriels Banals; Office Parlementaire D’évaluation des Choix Scientifiques et Technologiques: Paris, France, 1999. [Google Scholar]
  9. OPECST. Le Guide de L’ademe sur L’incidence des Décharges sur la Qualité de L’eau; Office Parlementaire D’évaluation des Choix Scientifiques et Technologiques: Paris, France, 2002. [Google Scholar]
  10. WWF. Stoppons le Torrent de Plastique ! Guide à Destination des Décideurs Français Pour Sauver la Méditerranée; WWF Mediterranean Marine Initiative: Rome, Italy, 2019; p. 19. [Google Scholar]
  11. Mallavan, A.-M.; Mimoun, N.; Rotman, G. La croissance des déchets ménagers. Econ. Stat. 1986, 185, 57–64. [Google Scholar] [CrossRef]
  12. OPECST. Pollution Plastique: Une Bombe À Retardement? Office Parlementaire D’évaluation des Choix Scientifiques et Technologiques: Paris, France, 2020; p. 15. [Google Scholar]
  13. Silva, A.L.P.; Prata, J.C.; Duarte, A.C.; Soares, A.M.V.M.; Barceló, D.; Rocha-Santos, T. Microplastics in Landfill Leachates: The Need for Reconnaissance Studies and Remediation Technologies. Case Stud. Chem. Environ. Eng. 2021, 3, 100072. [Google Scholar] [CrossRef]
  14. Upadhyay, K.; Bajpai, S. Microplastics in Landfills: A Comprehensive Review on Occurrence, Characteristics and Pathways to the Aquatic Environment. Nat. Environ. Pollut. Technol. 2021, 20, 1935–1945. [Google Scholar] [CrossRef]
  15. Al-Yaqout, A.; Hamoda, M.F. Long-Term Temporal Variations in Characteristics of Leachates from a Closed Landfill in an Arid Region. Water Air Soil Pollut. 2020, 231, 319. [Google Scholar] [CrossRef]
  16. Wagner, M.; Lambert, S. Freshwater Microplastics: Emerging Environmental Contaminants? In The Handbook of Environmental Chemistry; Springer International Publishing: Cham, Switzerland, 2018; Volume 58, ISBN 978-3-319-61614-8. [Google Scholar]
  17. He, P.; Chen, L.; Shao, L.; Zhang, H.; Lü, F. Municipal Solid Waste (MSW) Landfill: A Source of Microplastics? Evidence of Microplastics in Landfill Leachate. Water Res. 2019, 159, 38–45. [Google Scholar] [CrossRef]
  18. Kabir, M.S.; Wang, H.; Luster-Teasley, S.; Zhang, L.; Zhao, R. Sources, Occurrence, and Removal of Microplastic/Nanoplastic in Landfill Leachate: A Comprehensive Review. Intend. Water Res. 2022. [Google Scholar] [CrossRef]
  19. Kilponen, J. Microplastics and Harmful Substances in Urban Runoffs and Landfill Leachates—Possible Emission Sources to Marine Environment; Lahti University of Applied Sciences: Lahti, Finland, 2016. [Google Scholar]
  20. Mohammadi, A.; Malakootian, M.; Dobaradaran, S.; Hashemi, M.; Jaafarzadeh, N. Occurrence, Seasonal Distribution, and Ecological Risk Assessment of Microplastics and Phthalate Esters in Leachates of a Landfill Site Located near the Marine Environment: Bushehr Port, Iran as a Case. Sci. Total Environ. 2022, 842, 156838. [Google Scholar] [CrossRef] [PubMed]
  21. Su, Y.; Zhang, Z.; Wu, D.; Zhan, L.; Shi, H.; Xie, B. Occurrence of Microplastics in Landfill Systems and Their Fate with Landfill Age. Water Res. 2019, 164, 114968. [Google Scholar] [CrossRef] [PubMed]
  22. van Praagh, M.; Hartman, C.; Brandmyr, E. Microplastics in Landfill Leachates in the Nordic Countries; Nordic Council of Ministers: Copenhagen, Denmark, 2019; ISBN 978-92-893-5914-6. [Google Scholar]
  23. Yu, F.; Wu, Z.; Wang, J.; Li, Y.; Chu, R.; Pei, Y.; Ma, J. Effect of Landfill Age on the Physical and Chemical Characteristics of Waste Plastics/Microplastics in a Waste Landfill Sites. Environ. Pollut. 2022, 306, 119366. [Google Scholar] [CrossRef] [PubMed]
  24. Bordoloi, S.; Gupt, C.B.; Sarmah, A.K. Exploring the Theoretical Effects of Landfill Based Microplastic Accumulation on the Hydro-Mechanical Properties of Porous Soil Media. Curr. Opin. Environ. Sci. Health 2022, 26, 100332. [Google Scholar] [CrossRef]
  25. Viaroli, S.; Lancia, M.; Re, V. Microplastics Contamination of Groundwater: Current Evidence and Future Perspectives. A Review. Sci. Total Environ. 2022, 824, 153851. [Google Scholar] [CrossRef]
  26. Alemayehu, T.; Mebrahtu, G.; Hadera, A.; Bekele, D.N. Assessment of the Impact of Landfill Leachate on Groundwater and Surrounding Surface Water: A Case Study of Mekelle City, Northern Ethiopia. Sustain. Water Resour. Manag. 2019, 5, 1641–1649. [Google Scholar] [CrossRef]
  27. Lotram, Y. Méthodologie D’étude Multi-Échelle Du Transport de Polluants Dans les Sols Urbains—Application à Une Ancienne Décharge de Déchets Municipaux sur Nantes; Ecole Centrale de Nantes: Nantes, France, 2012. [Google Scholar]
  28. Le Guern, C.; Bechet, B.; Minet, L.; Lepinay, A. Transfert de substances émergentes dans les eaux souterraines depuis une ancienne décharge (Nantes, France). In Proceedings of the SHF: ”Les Polluants Émergents: De Nouveaux défis Pour la Gestion des Eaux Souterraines?”, Orléans, France, 19–20 May 2016. [Google Scholar]
  29. Lotram, Y.; Le Guern, C.; Béchet, B.; Lassabatère, L.; Andrieu, H. Transfert de polluants depuis une ancienne décharge urbaine: Apports de la caractérisation physico-chimique des déchets. Tech. Sci. Méthodes 2011, 10, 62–71. [Google Scholar] [CrossRef]
  30. Treilles, R.; Gasperi, J.; Tramoy, R.; Dris, R.; Gallard, A.; Partibane, C.; Tassin, B. Microplastic and Microfiber Fluxes in the Seine River: Flood Events versus Dry Periods. Sci. Total Environ. 2022, 805, 150123. [Google Scholar] [CrossRef]
  31. Nakajima, R.; Tsuchiya, M.; Lindsay, D.J.; Kitahashi, T.; Fujikura, K.; Fukushima, T. A New Small Device Made of Glass for Separating Microplastics from Marine and Freshwater Sediments. PeerJ 2019, 12, e7915. [Google Scholar] [CrossRef]
  32. Primpke, S.; Wirth, M.; Lorenz, C.; Gerdts, G. Reference Database Design for the Automated Analysis of Microplastic Samples Based on Fourier Transform Infrared (FTIR) Spectroscopy. Anal. Bioanal. Chem. 2018, 410, 5131–5141. [Google Scholar] [CrossRef]
  33. Kazour, M.; Terki, S.; Rabhi, K.; Jemaa, S.; Khalaf, G.; Amara, R. Sources of Microplastics Pollution in the Marine Environment: Importance of Wastewater Treatment Plant and Coastal Landfill. Mar. Pollut. Bull. 2019, 146, 608–618. [Google Scholar] [CrossRef]
  34. Nurhasanah; Cordova, M.R.; Riani, E. Micro- and Mesoplastics Release from the Indonesian Municipal Solid Waste Landfill Leachate to the Aquatic Environment: Case Study in Galuga Landfill Area, Indonesia. Mar. Pollut. Bull. 2021, 163, 111986. [Google Scholar] [CrossRef] [PubMed]
  35. Sun, J.; Zhu, Z.-R.; Li, W.-H.; Yan, X.; Wang, L.-K.; Zhang, L.; Jin, J.; Dai, X.; Ni, B.-J. Revisiting Microplastics in Landfill Leachate: Unnoticed Tiny Microplastics and Their Fate in Treatment Works. Water Res. 2021, 190, 116784. [Google Scholar] [CrossRef]
  36. Bharath K, M.; Natesan, U.; Vaikunth, R.; Kumar, P.; Ruthra, R.; Srinivasalu, S. Spatial Distribution of Microplastic Concentration around Landfill Sites and Its Potential Risk on Groundwater. Chemosphere 2021, 277, 130263. [Google Scholar] [CrossRef]
  37. Samandra, S.; Johnston, J.M.; Jaeger, J.E.; Symons, B.; Xie, S.; Currell, M.; Ellis, A.V.; Clarke, B.O. Microplastic Contamination of an Unconfined Groundwater Aquifer in Victoria, Australia. Sci. Total Environ. 2022, 802, 149727. [Google Scholar] [CrossRef]
  38. Barbier, J.-S.; Dris, R.; Lecarpentier, C.; Raymond, V.; Delabre, K.; Thibert, S.; Tassin, B.; Gasperi, J. Microplastic Occurrence after Conventional and Nanofiltration Processes at Drinking Water Treatment Plants: Preliminary Results. Front. Water 2022, 4, 886703. [Google Scholar] [CrossRef]
  39. Geyer, R.; Jambeck, J.R.; Law, K.L. Production, Use, and Fate of All Plastics Ever Made. Sci. Adv. 2017, 3, e1700782. [Google Scholar] [CrossRef]
  40. Le Guern, C. Séparation de Déchets de Plastiques par Voie Physico-Chimique (Flottation-Moussage) en Vue de Leur Recyclage—Application au Mélange PVC/PET Bouteilles; Institut National Polytechnique de Lorraine: Vandoeuvre-lès-Nancy, France, 1997. [Google Scholar]
  41. Chamas, A.; Moon, H.; Zheng, J.; Qiu, Y.; Tabassum, T.; Jang, J.H.; Abu-Omar, M.; Scott, S.L.; Suh, S. Degradation Rates of Plastics in the Environment. ACS Sustain. Chem. Eng. 2020, 8, 3494–3511. [Google Scholar] [CrossRef]
  42. PlasticsEurope. Plastics—The Facts 2020, an Analysis of European Plastics Production, Demand and Waste Data; Association of Plastics Manufacturer: Brussels, Belgium, 2020; p. 61. [Google Scholar]
  43. Canopoli, L.; Coulon, F.; Wagland, S.T. Degradation of Excavated Polyethylene and Polypropylene Waste from Landfill. Sci. Total Environ. 2020, 698, 134125. [Google Scholar] [CrossRef]
  44. He, B.; Smith, M.; Egodawatta, P.; Ayoko, G.A.; Rintoul, L.; Goonetilleke, A. Dispersal and Transport of Microplastics in River Sediments. Environ. Pollut. 2021, 279, 116884. [Google Scholar] [CrossRef]
  45. de Carvalho, A.R.; Garcia, F.; Riem-Galliano, L.; Tudesque, L.; Albignac, M.; ter Halle, A.; Cucherousset, J. Urbanization and Hydrological Conditions Drive the Spatial and Temporal Variability of Microplastic Pollution in the Garonne River. Sci. Total Environ. 2021, 769, 144479. [Google Scholar] [CrossRef] [PubMed]
  46. Belkhiri, A.H.; Carre, F.; Quiot, F. State of Knowledge and Future Research Needs on Microplastics in Groundwater. J. Water Health 2022, 20, 1479–1496. [Google Scholar] [CrossRef] [PubMed]
  47. Gao, J.; Pan, S.; Li, P.; Wang, L.; Hou, R.; Wu, W.-M.; Luo, J.; Hou, D. Vertical Migration of Microplastics in Porous Media: Multiple Controlling Factors under Wet-Dry Cycling. J. Hazard. Mater. 2021, 419, 126413. [Google Scholar] [CrossRef] [PubMed]
  48. Severini, E.; Ducci, L.; Sutti, A.; Robottom, S.; Sutti, S.; Celico, F. River–Groundwater Interaction and Recharge Effects on Microplastics Contamination of Groundwater in Confined Alluvial Aquifers. Water 2022, 14, 1913. [Google Scholar] [CrossRef]
  49. O’Connor, D.; Pan, S.; Shen, Z.; Song, Y.; Jin, Y.; Wu, W.-M.; Hou, D. Microplastics Undergo Accelerated Vertical Migration in Sand Soil Due to Small Size and Wet-Dry Cycles. Environ. Pollut. 2019, 249, 527–534. [Google Scholar] [CrossRef]
  50. Goeppert, N.; Goldscheider, N. Experimental Field Evidence for Transport of Microplastic Tracers over Large Distances in an Alluvial Aquifer. J. Hazard. Mater. 2021, 408, 124844. [Google Scholar] [CrossRef]
  51. Zhang, X.; Chen, Y.; Li, X.; Zhang, Y.; Gao, W.; Jiang, J.; Mo, A.; He, D. Size/Shape-Dependent Migration of Microplastics in Agricultural Soil under Simulative and Natural Rainfall. Sci. Total Environ. 2022, 815, 152507. [Google Scholar] [CrossRef]
  52. An, X.; Li, W.; Lan, J.; Adnan, M. Preliminary Study on the Distribution, Source, and Ecological Risk of Typical Microplastics in Karst Groundwater in Guizhou Province, China. Int. J. Environ. Res. Public. Health 2022, 19, 14751. [Google Scholar] [CrossRef]
  53. Park, S.; Kim, I.; Jeon, W.H.; Moon, H.S. Exploring the Vertical Transport of Microplastics in Subsurface Environments: Lab-Scale Experiments and Field Evidence for Their Presence. SSRN Electron. J. 2022, 4265532. [Google Scholar] [CrossRef]
Figure 1. Location, map and geological cross-section from north-east (A) to south-west (B) of the “Prairie de Mauves” landfill in Nantes (modified from [29]; Lat. 47.227003, Lon. −1.499305). Well and piezometers are indicated and represented according to the groundwater that they drain (red for the landfill groundwater, blue for the alluvial groundwater). Depth of groundwater tapped by the well and piezometers are indicated by black dotted circles. Arrows indicate the groundwater (in black) and therefore the pollutants (in red) flow direction.
Microplastics 02 00007 g001
Figure 2. Precipitation (in mm) and alluvial groundwater level (in m NGF, measured at W6) from March to June 2022. The sampling campaigns are indicated by yellow stars.
Microplastics 02 00007 g002
Figure 3. Water level (in m, dots) and conductivity (in µS/cm) at the different sampling points from upstream to downstream in (A) March and (B) June 2022. Water levels are represented according to their groundwater bodies (in blue for alluvial groundwater, in red for landfill groundwater).
Microplastics 02 00007 g003
Figure 4. Boxplot representing the variability (first quartile, third quartile and median; red cross: mean value; vertical bars: 1.5 times the interquartile range) of MP concentrations (in MP/L, MP > 25 µm) in all samples. Percentages and major dimensions (minimum, maximum and median values) of the 12 polymer types identified are indicated.
Microplastics 02 00007 g004
Figure 5. MP concentrations (in MP/L, MP > 25 µm, the dotted black lines indicate field blank concentrations) and polymer types at the different sampling points in (A) March and (B) June 2022. Wells and piezometers catching the alluvial groundwater from upstream to downstream are represented in blue, piezometers catching the landfill groundwater are represented in red.
Microplastics 02 00007 g005
Figure 6. Cumulated size distributions of MP between the alluvial (considering W6, Pz16, Pz5b and Pz9b) and landfill groundwater bodies (considering Pz11 and Pz7) in (A) March and (B) June 2022.
Microplastics 02 00007 g006
Figure 7. Picture of the excavations in the “Prairie de Mauves” waste deposit.
Microplastics 02 00007 g007
Table 1. MP concentrations and size ranges in different geographical locations and environmental compartments. * Median size range.
CountryLocality/NameActive/Closed LandfillCompartmentConcentration (MP/L)Predominant Size Range (µm)Analyzed Size Cut-off (µm)Analytical MethodReferences
ChinaShanghaiClosedLeachates0.96–1.38100–100025FTIR, µFTIR[17]
Active0.79–18.38
Wuxi/Suzhou/
Changzhou
0.42–3.58
IranBushehr63.00–92.001000–500025Microscope, µRaman[20]
IndonesiaGaluga0.06300–500<80Microscope, FTIR and µFTIR[34]
FinlandKorvenmäkiActive1.1050–50050ATR-FTIR[22]
TopinojaClosed0.16
Kujala0.00
NorwayAnonymous 21.40
GjerdrumActive1.00
IcelandFiflhotl old cellClosed0.00
AlfsnesActive4.51
ChinaLaogang4.00–13.00500–1000<70ATR-µFTIR[21]
Suzhou218.30–252.5010–5010µRaman[35]
ChinaShenzhen Shantou3.00–25.0030–15030Microscope, micrograph, Raman and µFTIR[7]
Groundwater (near a landfill)11.00–17.00
IndiaPerugundi7.00–80.0010–50010ATR-FTIR[36]
IndiaKodungaiyur3.00–23.00
AustraliaBacchus Marsh/Groundwater16.00–97.0018–49120LDIR[37]
FranceSeine, Marne and Oise Rivers/Surface waters7.80–45.00128 *25ATR-FTIR[38]
Disclaimer/Publisher’s Note: The statements, opinions and data contained in all publications are solely those of the individual author(s) and contributor(s) and not of MDPI and/or the editor(s). MDPI and/or the editor(s) disclaim responsibility for any injury to people or property resulting from any ideas, methods, instructions or products referred to in the content.

