
NetCom: A Network-Based Tool for Predicting Metabolic Activities of Microbial Communities Based on Interpretation of Metagenomics Data


Abstract
:1. Introduction
2. Materials and Methods
2.1. Description of User’s Input
2.2. Description of the NetCom Algorithm
2.3. Web Implementation and User Interface
3. Results
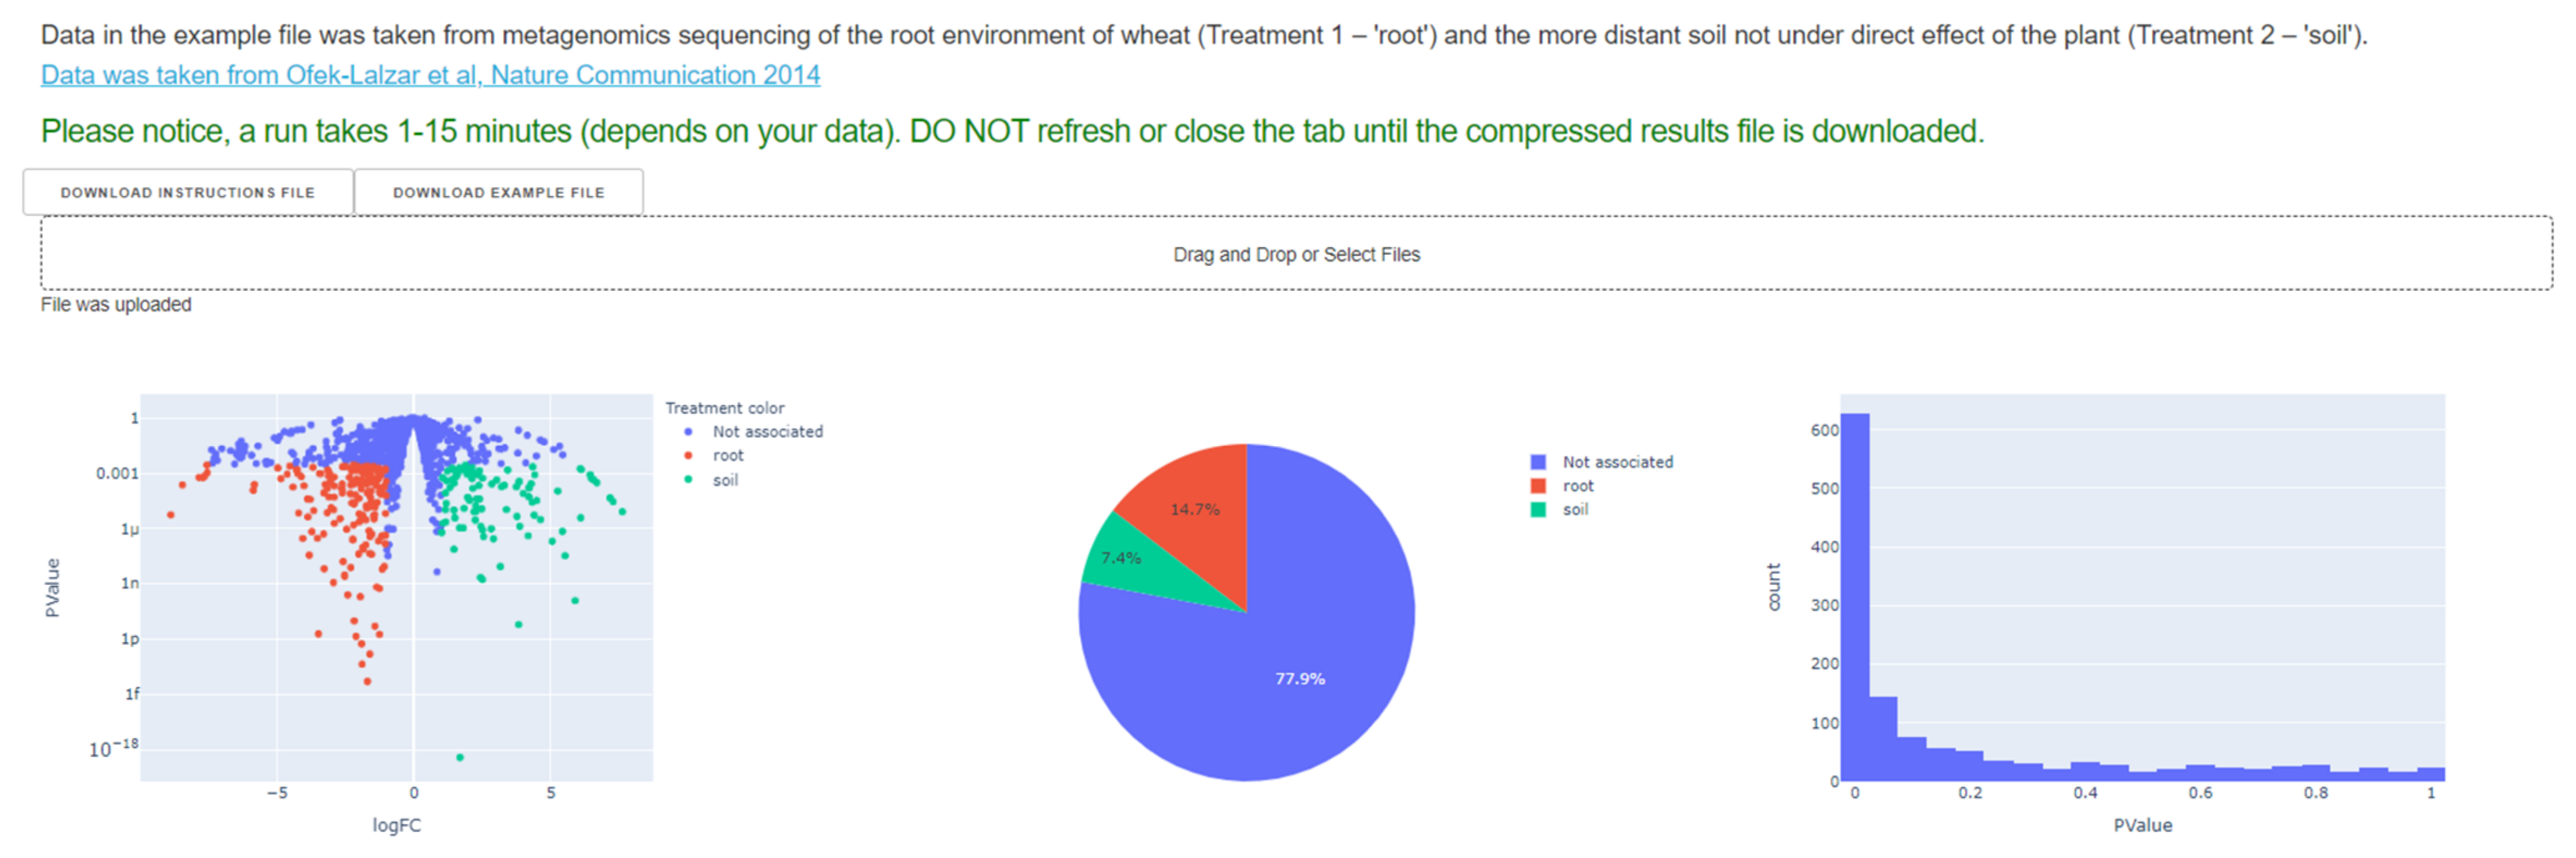
3.1. Users’ Input
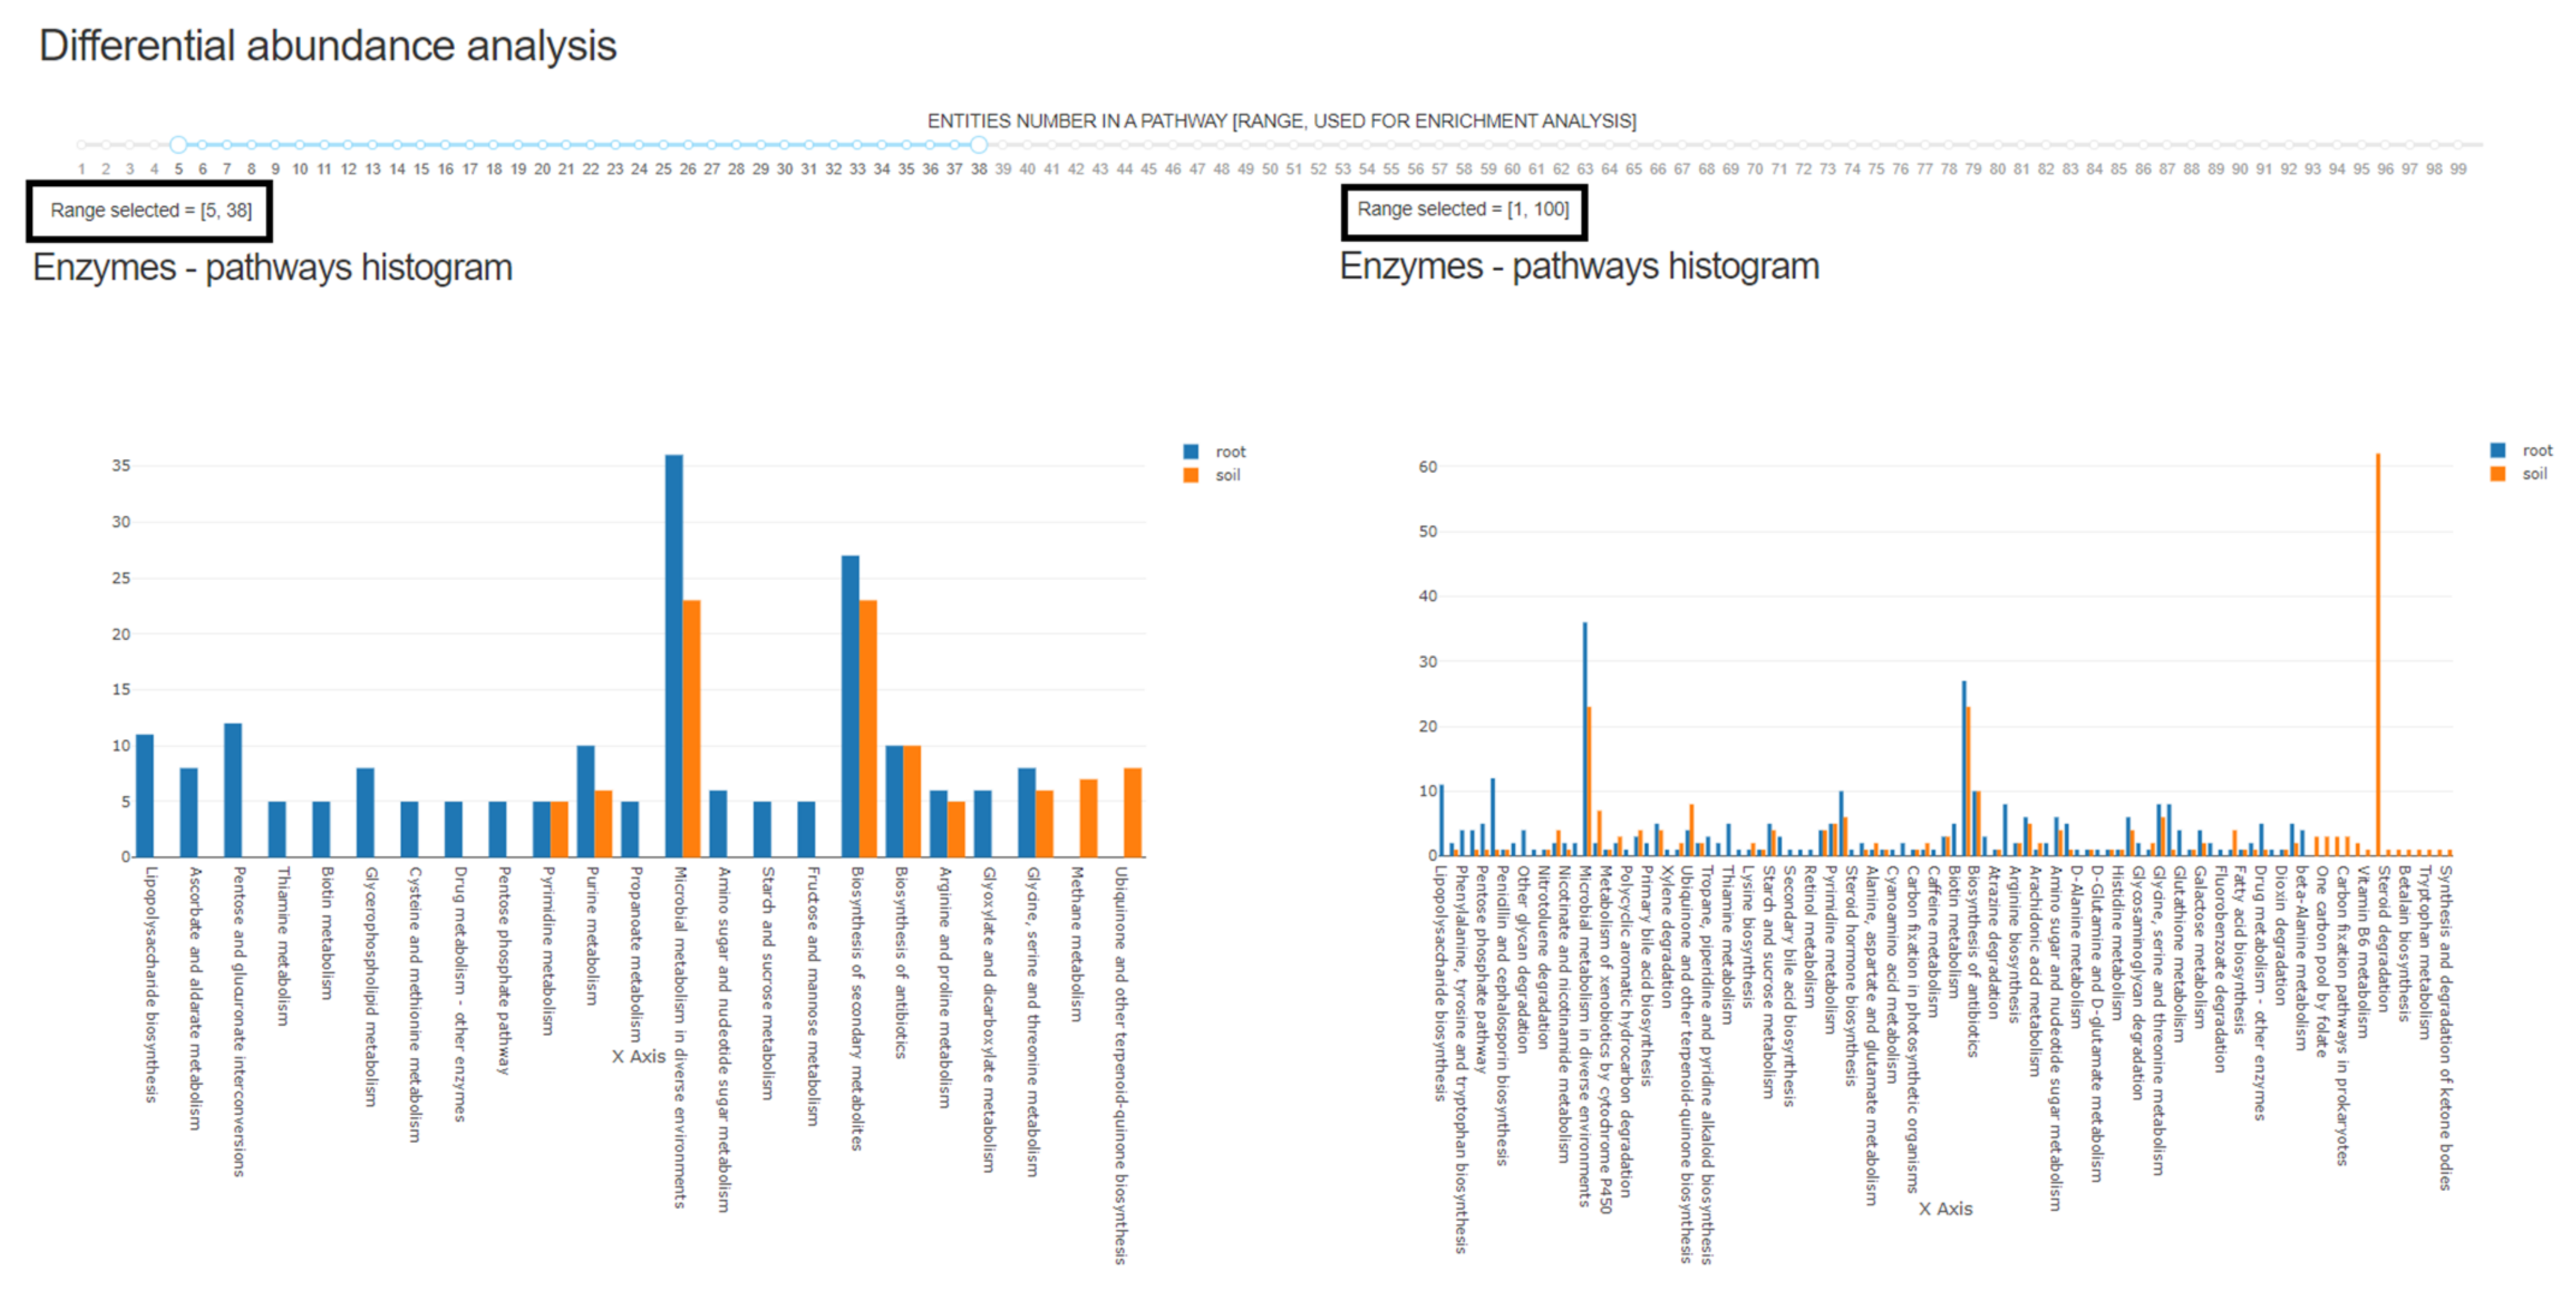
3.2. Differential Abundance Analysis: Characaterization of Differentially Abundant Enzymes and Respective Treatment Specific Environmental Resources and Metabolic Processes
3.3. Network Parameters
4. Discussion
Supplementary Materials
Author Contributions
Funding
Institutional Review Board Statement
Informed Consent Statement
Data Availability Statement
Acknowledgments
Conflicts of Interest
References
- Brown, J.H.; Gillooly, J.F.; Allen, A.P.; Savage, V.M.; West, G.B. Toward a metabolic theory of ecology. Ecology 2004, 85, 1771–1789. [Google Scholar] [CrossRef]
- Zomorrodi, A.R.; Segre, D. Synthetic Ecology of Microbes: Mathematical Models and Applications. J. Mol. Biol. 2016, 428, 837–861. [Google Scholar] [CrossRef] [Green Version]
- Perez-Garcia, O.; Lear, G.; Singhal, N. Metabolic Network Modeling of Microbial Interactions in Natural and Engineered Environmental Systems. Front. Microbiol. 2016, 7, 673. [Google Scholar] [CrossRef]
- Grosskopf, T.; Soyer, O.S. Synthetic microbial communities. Curr. Opin. Microbiol. 2014, 18, 72–77. [Google Scholar] [CrossRef] [PubMed] [Green Version]
- Fuhrman, J.A. Microbial community structure and its functional implications. Nature 2009, 459, 193–199. [Google Scholar] [CrossRef] [PubMed]
- Marx, C.J. Getting in touch with your friends. Science 2009, 324, 1150–1151. [Google Scholar] [CrossRef] [PubMed]
- Schink, B. Synergistic interactions in the microbial world. Antonie Leeuwenhoek 2002, 81, 257–261. [Google Scholar] [CrossRef] [PubMed] [Green Version]
- Koropatkin, N.M.; Cameron, E.A.; Martens, E.C. How glycan metabolism shapes the human gut microbiota. Nat. Rev. Microbiol. 2012, 10, 323–335. [Google Scholar] [CrossRef] [Green Version]
- Mazzola, M.; Freilich, S. Prospects for Biological Soilborne Disease Control: Application of Indigenous Versus Synthetic Microbiomes. Phytopathology 2017, 107, 256–263. [Google Scholar] [CrossRef] [Green Version]
- Toju, H.; Peay, K.G.; Yamamichi, M.; Narisawa, K.; Hiruma, K.; Naito, K.; Fukuda, S.; Ushio, M.; Nakaoka, S.; Onoda, Y.; et al. Core microbiomes for sustainable agroecosystems. Nature Plants 2018, 4, 247–257. [Google Scholar] [CrossRef]
- Faust, K. Towards a Better Understanding of Microbial Community Dynamics through High-Throughput Cultivation and Data Integration. mSystems 2019, 4, e00101–e00119. [Google Scholar] [CrossRef] [Green Version]
- Zomorrodi, A.R.; Islam, M.M.; Maranas, C.D. d-OptCom: Dynamic multi-level and multi-objective metabolic modeling of microbial communities. ACS Synth. Biol. 2014, 3, 247–257. [Google Scholar] [CrossRef] [PubMed]
- Zelezniak, A.; Andrejev, S.; Ponomarova, O.; Mende, D.R.; Bork, P.; Patil, K.R. Metabolic dependencies drive species co-occurrence in diverse microbial communities. Proc. Natl. Acad. Sci. USA 2015, 112, 6449–6454. [Google Scholar] [CrossRef] [PubMed] [Green Version]
- Stolyar, S.; Van Dien, S.; Hillesland, K.L.; Pinel, N.; Lie, T.J.; Leigh, J.A.; Stahl, D.A. Metabolic modeling of a mutualistic microbial community. Mol. Syst. Biol. 2007, 3, 92. [Google Scholar] [CrossRef] [PubMed]
- Segata, N.; Boernigen, D.; Tickle, T.L.; Morgan, X.C.; Garrett, W.S.; Huttenhower, C. Computational meta’omics for microbial community studies. Mol. Syst. Biol. 2013, 9, 666. [Google Scholar] [CrossRef] [PubMed]
- Roume, H.; Heintz-Buschart, A.; Muller, E.E.L.; May, P.; Satagopam, V.P.; Laczny, C.C.; Narayanasamy, S.; Lebrun, L.A.; Hoopmann, M.R.; Schupp, J.M.; et al. Comparative integrated omics: Identification of key functionalities in microbial community-wide metabolic networks. NPJ Biofilms Microbiomes 2015, 1, 15007. [Google Scholar] [CrossRef]
- Roling, W.F.; van Bodegom, P.M. Toward quantitative understanding on microbial community structure and functioning: A modeling-centered approach using degradation of marine oil spills as example. Front. Microbiol. 2014, 5, 125. [Google Scholar] [CrossRef]
- O’Dwyer, J.P.; Kembel, S.W.; Green, J.L. Phylogenetic diversity theory sheds light on the structure of microbial communities. PLoS Comput. Biol. 2012, 8, e1002832. [Google Scholar] [CrossRef]
- Hanemaaijer, M.; Roling, W.F.; Olivier, B.G.; Khandelwal, R.A.; Teusink, B.; Bruggeman, F.J. Systems modeling approaches for microbial community studies: From metagenomics to inference of the community structure. Front. Microbiol. 2015, 6, 213. [Google Scholar] [CrossRef] [Green Version]
- Guo, J.; Cole, J.R.; Zhang, Q.; Brown, C.T.; Tiedje, J.M. Microbial Community Analysis with Ribosomal Gene Fragments from Shotgun Metagenomes. Appl. Environ. Microbiol. 2015, 82, 157–166. [Google Scholar] [CrossRef] [Green Version]
- Granger, B.R.; Chang, Y.C.; Wang, Y.; DeLisi, C.; Segre, D.; Hu, Z. Visualization of Metabolic Interaction Networks in Microbial Communities Using VisANT 5.0. PLoS Comput. Biol. 2016, 12, e1004875. [Google Scholar] [CrossRef]
- Bowman, J.S.; Ducklow, H.W. Microbial Communities Can Be Described by Metabolic Structure: A General Framework and Application to a Seasonally Variable, Depth-Stratified Microbial Community from the Coastal West Antarctic Peninsula. PLoS ONE 2015, 10, e0135868. [Google Scholar] [CrossRef] [Green Version]
- Noecker, C.; Eng, A.; Srinivasan, S.; Theriot, C.M.; Young, V.B.; Jansson, J.K.; Fredricks, D.N.; Borenstein, E. Metabolic Model-Based Integration of Microbiome Taxonomic and Metabolomic Profiles Elucidates Mechanistic Links between Ecological and Metabolic Variation. mSystems 2016, 1, e00013–e00015. [Google Scholar] [CrossRef] [PubMed] [Green Version]
- Widder, S.; Allen, R.J.; Pfeiffer, T.; Curtis, T.P.; Wiuf, C.; Sloan, W.T.; Cordero, O.X.; Brown, S.P.; Momeni, B.; Shou, W.; et al. Challenges in microbial ecology: Building predictive understanding of community function and dynamics. ISME J. 2016, 10, 2557–2568. [Google Scholar] [CrossRef] [PubMed] [Green Version]
- Ponomarova, O.; Patil, K.R. Metabolic interactions in microbial communities: Untangling the Gordian knot. Curr. Opin. Microbiol. 2015, 27, 37–44. [Google Scholar] [CrossRef] [PubMed] [Green Version]
- Tal, O.; Selvaraj, G.; Medina, S.; Ofaim, S.; Freilich, S. NetMet: A Network-Based Tool for Predicting Metabolic Capacities of Microbial Species and their Interactions. Microorganisms 2020, 8, 840. [Google Scholar] [CrossRef] [PubMed]
- Ofaim, S.; Ofek-Lalzar, M.; Sela, N.; Jinag, J.; Kashi, Y.; Minz, D.; Freilich, S. Analysis of Microbial Functions in the Rhizosphere Using a Metabolic-Network Based Framework for Metagenomics Interpretation. Front. Microbiol. 2017, 8, 1606. [Google Scholar] [CrossRef]
- Ebenhoh, O.; Handorf, T.; Heinrich, R. Structural analysis of expanding metabolic networks. Genome Inf. 2004, 15, 35–45. [Google Scholar]
- Ofek, M.; Voronov-Goldman, M.; Hadar, Y.; Minz, D. Host signature effect on plant root-associated microbiomes revealed through analyses of resident vs. active communities. Environ. Microbiol. 2014, 16, 2157–2167. [Google Scholar] [CrossRef] [PubMed]
- Ofek-Lalzar, M.; Sela, N.; Goldman-Voronov, M.; Green, S.J.; Hadar, Y.; Minz, D. Niche and host-associated functional signatures of the root surface microbiome. Nat. Commun. 2014, 5, 4950. [Google Scholar] [CrossRef] [PubMed]
- Mazzola, M. Assessment and management of soil microbial community structure for disease suppression. Annu. Rev. Phytopathol. 2004, 42, 35–59. [Google Scholar] [CrossRef]
- Smith, K.P.; Handelsman, J.; Goodman, R.M. Genetic basis in plants for interactions with disease-suppressive bacteria. Proc. Natl. Acad. Sci. USA 1999, 96, 4786–4790. [Google Scholar] [CrossRef] [Green Version]
- Larkin, R.P.; Hopkins, D.L.; Martin, F.N. Effect of Successive Watermelon Plantings on Fusarium-Oxysporum and Other Microorganisms in Soils Suppressive and Conducive to Fusarium-Wilt of Watermelon. Phytopathology 1993, 83, 1097–1105. [Google Scholar] [CrossRef]
- Cook, R.J. Toward cropping systems that enhance productivity and sustainability. Proc. Natl. Acad. Sci. USA 2006, 103, 18389–18394. [Google Scholar] [CrossRef] [PubMed] [Green Version]
- Berg, G.; Roskot, N.; Steidle, A.; Eberl, L.; Zock, A.; Smalla, K. Plant-dependent genotypic and phenotypic diversity of antagonistic rhizobacteria isolated from different Verticillium host plants. Appl. Environ. Microbiol. 2002, 68, 3328–3338. [Google Scholar] [CrossRef] [PubMed] [Green Version]
- Ikeda, S.; Omura, T.; Ytow, N.; Komaki, H.; Minamisawa, K.; Ezura, H.; Fujimura, T. Microbial community analysis in the rhizosphere of a transgenic tomato that overexpresses 3-hydroxy-3-methylglutaryl coenzyme A reductase. Microbes Environ. 2006, 21, 261–271. [Google Scholar] [CrossRef] [Green Version]
- Micallef, S.A.; Channer, S.; Shiaris, M.P.; Colon-Carmona, A. Plant age and genotype impact the progression of bacterial community succession in the Arabidopsis rhizosphere. Plant Signal. Behav. 2009, 4, 777–780. [Google Scholar] [CrossRef] [Green Version]
- Haldar, S.; Sengupta, S. Plant-microbe Cross-talk in the Rhizosphere: Insight and Biotechnological Potential. Open Microbiol. J. 2015, 9, 1–7. [Google Scholar] [CrossRef] [PubMed]
- Smith, K.P.; Handelsman, J.; Goodman, R.M. Modeling dose-response relationships in biological control: Partitioning host responses to the pathogen and biocontrol agent. Phytopathology 1997, 87, 720–729. [Google Scholar] [CrossRef] [PubMed] [Green Version]
- Robinson, M.D.; McCarthy, D.J.; Smyth, G.K. edgeR: A Bioconductor package for differential expression analysis of digital gene expression data. Bioinformatics 2010, 26, 139–140. [Google Scholar] [CrossRef] [Green Version]
- Kanehisa, M.; Araki, M.; Goto, S.; Hattori, M.; Hirakawa, M.; Itoh, M.; Katayama, T.; Kawashima, S.; Okuda, S.; Tokimatsu, T.; et al. KEGG for linking genomes to life and the environment. Nucleic Acids Res. 2008, 36, D480–D484. [Google Scholar] [CrossRef]
- Kreimer, A.; Doron-Faigenboim, A.; Borenstein, E.; Freilich, S. NetCmpt: A network-based tool for calculating the metabolic competition between bacterial species. Bioinformatics 2012, 28, 2195–2197. [Google Scholar] [CrossRef] [Green Version]
- Greenblum, S.; Chiu, H.-C.; Levy, R.; Carr, R.; Borenstein, E. Towards a predictive systems-level model of the human microbiome: Progress, challenges, and opportunities. Curr. Opin. Biotechnol. 2013, 24, 810–820. [Google Scholar] [CrossRef] [Green Version]
- Borenstein, E.; Kupiec, M.; Feldman, M.W.; Ruppin, E. Large-scale reconstruction and phylogenetic analysis of metabolic environments. Proc. Natl. Acad. Sci. USA 2008, 105, 14482–14487. [Google Scholar] [CrossRef] [PubMed] [Green Version]
- Carr, R.; Borenstein, E. NetSeed: A network-based reverse-ecology tool for calculating the metabolic interface of an organism with its environment. Bioinformatics 2012, 28, 734–735. [Google Scholar] [CrossRef]
- Tarjan, R. Depth-First Search and Linear Graph Algorithms. SIAM J. Comput. 1972, 1, 146–160. [Google Scholar] [CrossRef]
- Pavlopoulos, G.A.; Secrier, M.; Moschopoulos, C.N.; Soldatos, T.G.; Kossida, S.; Aerts, J.; Schneider, R.; Bagos, P.G. Using graph theory to analyze biological networks. BioData Min. 2011, 4, 10. [Google Scholar] [CrossRef] [Green Version]
- Freilich, S.; Kreimer, A.; Borenstein, E.; Gophna, U.; Sharan, R.; Ruppin, E. Decoupling Environment-Dependent and Independent Genetic Robustness across Bacterial Species. PLoS Comput. Biol. 2010, 6, e1000690. [Google Scholar] [CrossRef] [Green Version]
- Kanehisa, M. Toward understanding the origin and evolution of cellular organisms. Protein Sci. 2019, 28, 1947–1951. [Google Scholar] [CrossRef] [PubMed]
- Kanehisa, M.; Goto, S. KEGG: Kyoto Encyclopedia of Genes and Genomes. Nucleic Acids Res. 2000, 28, 27–30. [Google Scholar] [CrossRef] [PubMed]
- Kanehisa, M.; Sato, Y.; Furumichi, M.; Morishima, K.; Tanabe, M. New approach for understanding genome variations in KEGG. Nucleic Acids Res. 2019, 47, D590–D595. [Google Scholar] [CrossRef] [PubMed] [Green Version]
- Jeon, C.O.; Madsen, E.L. In situ microbial metabolism of aromatic-hydrocarbon environmental pollutants. Curr. Opin. Biotechnol. 2013, 24, 474–481. [Google Scholar] [CrossRef]
- Megharaj, M.; Ramakrishnan, B.; Venkateswarlu, K.; Sethunathan, N.; Naidu, R. Bioremediation approaches for organic pollutants: A critical perspective. Environ. Int. 2011, 37, 1362–1375. [Google Scholar] [CrossRef]
- Owen, S.M.; Clark, S.; Pompe, M.; Semple, K.T. Biogenic volatile organic compounds as potential carbon sources for microbial communities in soil from the rhizosphere of Populus tremula. FEMS Microbiol. Lett. 2007, 268, 34–39. [Google Scholar] [CrossRef] [Green Version]
- Jha, P.; Panwar, J.; Jha, P.N. Secondary plant metabolites and root exudates: Guiding tools for polychlorinated biphenyl biodegradation. Int. J. Environ. Sci. Technol. 2015, 12, 789–802. [Google Scholar] [CrossRef]
- Taş, N.; de Jong, A.E.E.; Li, Y.; Trubl, G.; Xue, Y.; Dove, N.C. Metagenomic tools in microbial ecology research. Curr. Opin. Biotechnol. 2021, 67, 184–191. [Google Scholar] [CrossRef] [PubMed]
- Opatovsky, I.; Santos-Garcia, D.; Ruan, Z.; Lahav, T.; Ofaim, S.; Mouton, L.; Barbe, V.; Jiang, J.; Zchori-Fein, E.; Freilich, S. Modeling trophic dependencies and exchanges among insects’ bacterial symbionts in a host-simulated environment. BMC Genom. 2018, 19, 402. [Google Scholar] [CrossRef] [Green Version]
- Freilich, S.; Zarecki, R.; Eilam, O.; Segal, E.S.; Henry, C.S.; Kupiec, M.; Gophna, U.; Sharan, R.; Ruppin, E. Competitive and cooperative metabolic interactions in bacterial communities. Nat. Commun. 2011, 2, 589. [Google Scholar] [CrossRef] [PubMed] [Green Version]
- Borenstein, E. Computational systems biology and in silico modeling of the human microbiome. Brief. Bioinform. 2012, 13, 769–780. [Google Scholar] [CrossRef] [Green Version]
- Magnusdottir, S.; Heinken, A.; Kutt, L.; Ravcheev, D.A.; Bauer, E.; Noronha, A.; Greenhalgh, K.; Jager, C.; Baginska, J.; Wilmes, P.; et al. Generation of genome-scale metabolic reconstructions for 773 members of the human gut microbiota. Nat. Biotechnol. 2017, 35, 81–89. [Google Scholar] [CrossRef]


Publisher’s Note: MDPI stays neutral with regard to jurisdictional claims in published maps and institutional affiliations. |
© 2021 by the authors. Licensee MDPI, Basel, Switzerland. This article is an open access article distributed under the terms and conditions of the Creative Commons Attribution (CC BY) license (https://creativecommons.org/licenses/by/4.0/).
Share and Cite
Tal, O.; Bartuv, R.; Vetcos, M.; Medina, S.; Jiang, J.; Freilich, S. NetCom: A Network-Based Tool for Predicting Metabolic Activities of Microbial Communities Based on Interpretation of Metagenomics Data. Microorganisms 2021, 9, 1838. https://doi.org/10.3390/microorganisms9091838
Tal O, Bartuv R, Vetcos M, Medina S, Jiang J, Freilich S. NetCom: A Network-Based Tool for Predicting Metabolic Activities of Microbial Communities Based on Interpretation of Metagenomics Data. Microorganisms. 2021; 9(9):1838. https://doi.org/10.3390/microorganisms9091838
Chicago/Turabian StyleTal, Ofir, Rotem Bartuv, Maria Vetcos, Shlomit Medina, Jiandong Jiang, and Shiri Freilich. 2021. "NetCom: A Network-Based Tool for Predicting Metabolic Activities of Microbial Communities Based on Interpretation of Metagenomics Data" Microorganisms 9, no. 9: 1838. https://doi.org/10.3390/microorganisms9091838