Article

Infection Heterogeneity and Microbiota Differences in Chicks Infected by Salmonella enteritidis

1
College of Animal Science and Technology, Hunan Agricultural University, Changsha 410128, China
2
Department of Feed and Nutrition, Poultry Institute, Chinese Academy of Agricultural Sciences, Yangzhou 225125, China
3
Institute of Effective Evaluation of Feed and Feed Additive (Poultry Institute), Ministry of Agriculture, Yangzhou 225125, China
4
Jiangsu Co-Innovation Center for the Prevention and Control of Important Animal Infectious Disease and Zoonose, Yangzhou University, Yangzhou 225009, China
*
Authors to whom correspondence should be addressed.
Microorganisms 2021, 9(8), 1705; https://doi.org/10.3390/microorganisms9081705
Submission received: 1 July 2021 / Revised: 31 July 2021 / Accepted: 5 August 2021 / Published: 11 August 2021
(This article belongs to the Topic Veterinary Infectious Diseases)

Abstract

:
This study was conducted to compare the infection heterogeneity and cecal microbiota in chicks infected by S. enteritidis. Forty-eight 8-d-old female Arbor Acres chicks were challenged with S. enteritidis and euthanized 24 h later. The eight chicks with the highest Salmonella tissue loads were assigned to group S (S. enteritidis-susceptible), and the eight chicks with the lowest Salmonella tissue loads were assigned to group R (S. enteritidis-resistant). Chicks in group S showed a higher liver index (p < 0.05), obvious liver lesions, and an decreasing trend for the villus height-to-crypt depth ratio (p < 0.10), compared with those in group R. Gene expression of occludin, MUC2, and IL10 was higher, whereas that of iNOS and IL6 was lower (p < 0.05), in chicks of group R relative to those in group S. Separation of the cecal microbial community structure has been found between the two groups. The S. enteritidis-susceptible chicks showed higher abundance of pathogenic bacteria (Fusobacterium and Helicobacter) in their cecal, while Desulfovibrio_piger was enriched in the cecal of S. enteritidis-resistant chicks. In summary, chicks showed heterogeneous responses to S. enteritidis infection. Enhanced intestinal barrier function and cecal microbiota structure, especially a higher abundance of Desulfovibrio_piger, may help chicks resist S. enteritidis invasion.

1. Introduction

Salmonella is a major foodborne pathogen of global importance, which has led to large numbers of deaths in humans and caused economic losses in animal husbandry [1]. Among the more than 2500 identified Salmonella enterica serotypes, Salmonella enteritidis (S. enteritidis) is the most frequently spread from animals to humans globally [2]. S. enteritidis has caused occasional epidemic outbreaks around the world, such as in China [3], South Africa [4] and the United States [5]. Poultry are the primary S. enteritidis host, and the percent prevalence of S. enteritidis in chicken meat is strongly positively correlated (r = 0.804, p ≤ 0.01) with the incidence of human illnesses caused by this serotype [6]. These observations highlight the importance of studying S. enteritidis infection in poultry for reasons associated with both public health and poultry production.
Host susceptibility to pathogen infection is frequently heterogeneous [7], as demonstrated by the phenomenon of the median lethal dose (lethal dose 50 [LD50]), which describes the microbe dose that will kill only 50% of a test population [8]. Poultry infected with S. enteritidis may suffer systemic infection that can potentially lead to death, or may evolve into a long-term asymptomatic carrier-state [9]. Several studies have confirmed that heterogeneous responses to Salmonella infection can be partly explained by the genetic background and immune function status of the host [10,11]. However, numerous studies have also reported the phenomenon of heterogeneous bacterial shedding (super-shedders and low-shedders) in genetically homogeneous host populations [12,13], suggestive of the existence of additional factors that can influence the susceptibility and resistance of individuals to Salmonella colonization. Over recent years, the composition of the intestinal microbiota has been increasingly associated with heterogeneous host responses to pathogen infection [14,15,16].
The intestinal microbiota comprises a complex bacterial community and maintaining a mutually beneficial balance between the host and the gut microflora is very important for human health [17,18]. Intestinal dysbiosis can promote or even directly lead to a variety of conditions, including inflammatory diseases, colon cancer, and autoimmune disorders [19]. Pathogen infection is also closely related to the intestinal microbiota. Pathogen infection can lead to an imbalance in the intestinal environment, where pathogen growth is favored over that of probiotics [20,21,22]. Conversely, the gut microbiota can help inhibit pathogen colonization [23,24]. Although various mechanisms through which gut microbiota can protect the host against intestinal infection have been described, it remains unclear whether the heterogeneous responses of poultry to S. enteritidis infection are related to subtle changes in gut microbiota composition. In this study, we investigated the infection of S. enteritidis-susceptible and -resistant chicks from the aspects of tissue lesions, intestinal health and inflammatory response, and analyzed their cecal microbiota differences.

2. Materials and Methods

2.1. Ethical Statement

The study was conducted according to the Regulations of the Experimental Animal Administration issued by the State Committee of Science and Technology of the People’s Republic of China. The animal use protocol was approved by the Animal Care and Use Committee of the Poultry Institute, Chinese Academy of Agriculture Science (No. CNP20201030).

2.2. Animal Management

Forty-eight 1-d-old Arbor Acres (AA) broiler chicks were obtained from Jiangsu Jinghai Poultry Industry Group Co., Ltd. (Nantong, Jiangsu, China). Cloacal swab tests [25] were carried out immediately after hatching to exclude Salmonella infection. The chicks were reared in cages with a wire screen floor. Water and feed were provided ad libitum, with the photoperiod set at 24 L throughout the study. The temperature in the broiler house during the first week ranged from 32 to 35 °C, and was then decreased by 1 °C d−1 until reaching the final temperature of 30 °C on d 9. The diet of the chicks, without antibiotics or anticoccidial drugs and negative for Salmonella, was formulated to meet or slightly exceed all nutrient requirements (NRC, 1994) and was prepared at the Poultry Institute, Chinese Academy of Agriculture Science. The nutrient composition is shown in Table 1.

2.3. Challenge with S. enteritidis

Forty-eight chicks were orally gavaged with 1 × 10⁹ colony forming unit (CFU) of S. enteritidis at d 8 as previously described [1,26,27]. Briefly, the S. enteritidis strain CMCC(B)50041 (Bei Na Chuanglian Biotechnology Co., Ltd., Suzhou, Jiangsu, China) were grown in modified Martin medium (Qingdao-Hope Biotechnology Co., Ltd., Qingdao, China) overnight at 37 °C with constant shaking. Before inoculation, the bacteria were washed with PBS, and serially diluted to a concentration of 1 × 10⁹ CFU/mL based on the optical density at 600 nm measured by a microplate reader (Infinite M200 Pro, Tecan, Switzerland). The bacterial stock was kept on ice before infection. After infection, the same bacterial stock was plated on xylose lysine desoxycholate (XLD) agar (Qingdao-Hope Biotechnology Co., Ltd., Qingdao, China) to verify the CFU accuracy.

2.4. Sample Collection

At 24 h post infection (hpi) (age = 9 d), all the chicks were euthanized by severing the jugular vein. The body weight, liver weight and spleen weight were measured, and index of liver and spleen were calculated. About 0.2~0.4 g of liver and a half of the spleen were collected aseptically from each chick and stored at 4 °C for Salmonella load quantification. The cecal content was collected, frozen in liquid nitrogen, and stored at −80 °C for 16S rRNA sequencing analysis. Small segments of the rest liver, spleen, and jejunum were collected and immediately fixed in a 10% formaldehyde solution for histopathological examination. In addition, cecal tonsil and segments of jejunum were collected, frozen in liquid nitrogen, and stored at −80 °C for quantification of target gene mRNA levels.

2.5. Salmonella Load Measurement and Sample Grouping

To determine the Salmonella loads in the liver and spleen, the samples were weighed and diluted in 3 mL of sterile PBS. Then, the samples were homogenized for 120 s at 60 Hz using a SCIENTZ-48 homogenizer (Ningbo Xingzhi Biotechnology Co., Ltd., Ningbo, China). A total of 50 μL of the homogenate liquid from the samples was plated on XLD agar and incubated for 24 h at 37 °C. According to the result of spleen Salmonella loads (log10CFU/g), we select log10CFU/g > 4.400 as the cut-off value for S. Enteritidis-resistant chicks, and log10CFU/g < 2.700 as the cut-off value for S. enteritidis-susceptible chicks. According to the cut-off values, eight chicks were assigned to group S, and eight chicks were assigned to group R (Table S1).

2.6. Liver and Spleen Histopathology and Intestinal Morphology Determination

Tissue histopathology and intestinal morphology of chicks from both groups were determined as previously described [28,29]. Briefly, small segments of liver, spleen, and middle jejunum were fixed in 10% buffered formaldehyde (pH 7.2) and dehydrated via an ascending ethanol gradient. After xylene clearing, the samples were embedded in paraffin and processed into 5-µm-thick slices followed by mounting and hematoxylin-eosin (HE) staining. Inflammatory infiltration and general damage in the liver and spleen, as well as the villus height (VH) and crypt depth (CD) of the jejunum, were observed and measured under a fluorescence microscope (DM4000B, Leica Microsystems, Wetzlar, Germany). The ratio of the villus height-to-crypt depth (VCR) was also calculated. Histopathological images of liver or spleen were scored by a pathology professional who did not know the experimental group according to the number of inflammatory cell nodules and the degree of cell degeneration and necrosis. The score from normal to severe lesions was 0~4.

2.7. RNA Isolation and Quantitative Real-Time PCR

Total RNA was extracted from the cecal tonsil or middle jejunum of birds from both groups using an RNAsimple Total RNA Kit (Tiangen Biotech Co., Ltd., Beijing, China) following the manufacturer’s instructions. RNA concentration and purity were determined by measuring the absorbance at 260 and 280 nm using a NanoDrop 2000 spectrophotometer (Thermo Fisher Scientific, Rockford, IL, USA), and RNA quality was assessed by agarose gel electrophoresis. Total RNA was reverse-transcribed using the FastKing gDNA Dispelling RT SuperMix Kit (Tiangen Biotech Co., Ltd.) in accordance with the manufacturer’s instructions. Reverse transcription was performed at 42 °C for 15 min followed by heat inactivation for 3 min at 95 °C. The cDNA was stored at −20 °C until further use. Real-time quantitative PCR was performed in a StepOnePlusTM Real-Time PCR System (Applied Biosystems, Foster City, CA, USA) following optimized PCR protocols using a SuperReal PreMix Plus (SYBR Green) Kit (Tiangen Biotech Co., Ltd.). The protocol consisted of an initial denaturation step at 95 °C for 15 min, followed by 40 cycles of 10 s denaturation at 95 °C and 30 s annealing/extension at 60 °C, with a final step at 95 °C for 15 s. The primers for inducible nitric oxide synthase (iNOS), interferon-gamma (IFNG), tumor necrosis factor-alpha (TNFA), interleukin 1 beta (IL1B), IL6, IL8, IL10, occludin, claudin, zonula occluden 1 (ZO-1), mucin 2 (MUC2), and glyceraldehyde-3-phosphate dehydrogenase (GAPDH) are listed in Table 2. The ΔΔCt method was used to estimate mRNA abundance. GAPDH was used as the internal reference gene, and the mRNA expression of target genes was normalized to that of GAPDH.

2.8. DNA Extraction and Sequencing Library Construction

Genomic DNA was extracted from homogenized cecal content using CTAB method [30] and stored at −20 °C. DNA concentration and purity were assessed by 2% agarose gel electrophoresis and diluted to 1 ng/μL using sterile water. The V4 region of the bacterial 16S rRNA gene was PCR amplified using the barcoded 515F/806R primer pair [31]. Amplicons consisting of around 400–450 bp were extracted and used for further analysis [32,33]. PCR products were purified using the QIAquick Gel Extraction Kit (Qiagen Inc., Santa Clara, CA, USA). Sequencing libraries were generated using the Illumina TruSeq® DNA PCR-Free Sample Preparation Kit (Illumina, San Diego, CA, USA) following the manufacturer’s recommendations. After Qubit-based quantification and library qualification, the library was subjected to sequencing at Novogene Co., Ltd. (Beijing, China) using the Illumina NovaSeq6000 platform.

2.9. Quality Filtering and Sequence Analysis

Raw Illumina paired-end reads were trimmed of barcodes and primers and combined using Flash software (V1.2.7, http://ccb.jhu.edu/software/FLASH/, accessed on 1 February 2021) with default parameters [34]. The obtained raw sequence data were quality-filtered using QIIME V1.9.1 (http://qiime.org/scripts/split_libraries_fastq.html, accessed on 1 February 2021) to obtain effective tags [35]. OTU were assigned at 97% identity using Uparse V7.0.1001 (http://www.drive5.com/uparse/, accessed on 1 February 2021) based on the effective tags [36]. OTU taxonomic information was annotated by RDP Classifier using a 0.8~1 confidence threshold for taxonomic assignment [37,38]. Alpha and beta diversity and the significance of taxonomic differences between samples were estimated by QIIME (V1.9.1) and linear discriminant analysis effect size (LEfSe) as previously described [38,39,40].

2.10. Statistical Analysis

Statistical analyses were carried out with SPSS for Windows V22.0 (SPSS Inc., Chicago, IL, USA). Differences between two groups were tested by independent samples t-tests and the Wilcoxon rank-sum test. Data are expressed as means ± SEM. A p-value < 0.05 was considered statistically significant [26].

3. Results

3.1. Body Weight, Tissue Index, and Salmonella Loads of S. enteritidis-Susceptible and -Resistant Chicks

The differences in body weight, tissue indices, and Salmonella loads between S. enteritidis-susceptible and -resistant chicks are summarized in Table 3. The liver index, liver Salmonella load, and spleen Salmonella load of S. enteritidis-susceptible chicks (group S) were higher than those of S. enteritidis-resistant chicks (group R) (p < 0.05) at 24 hpi; however, there was no significant difference in body weight or spleen index between the two groups.

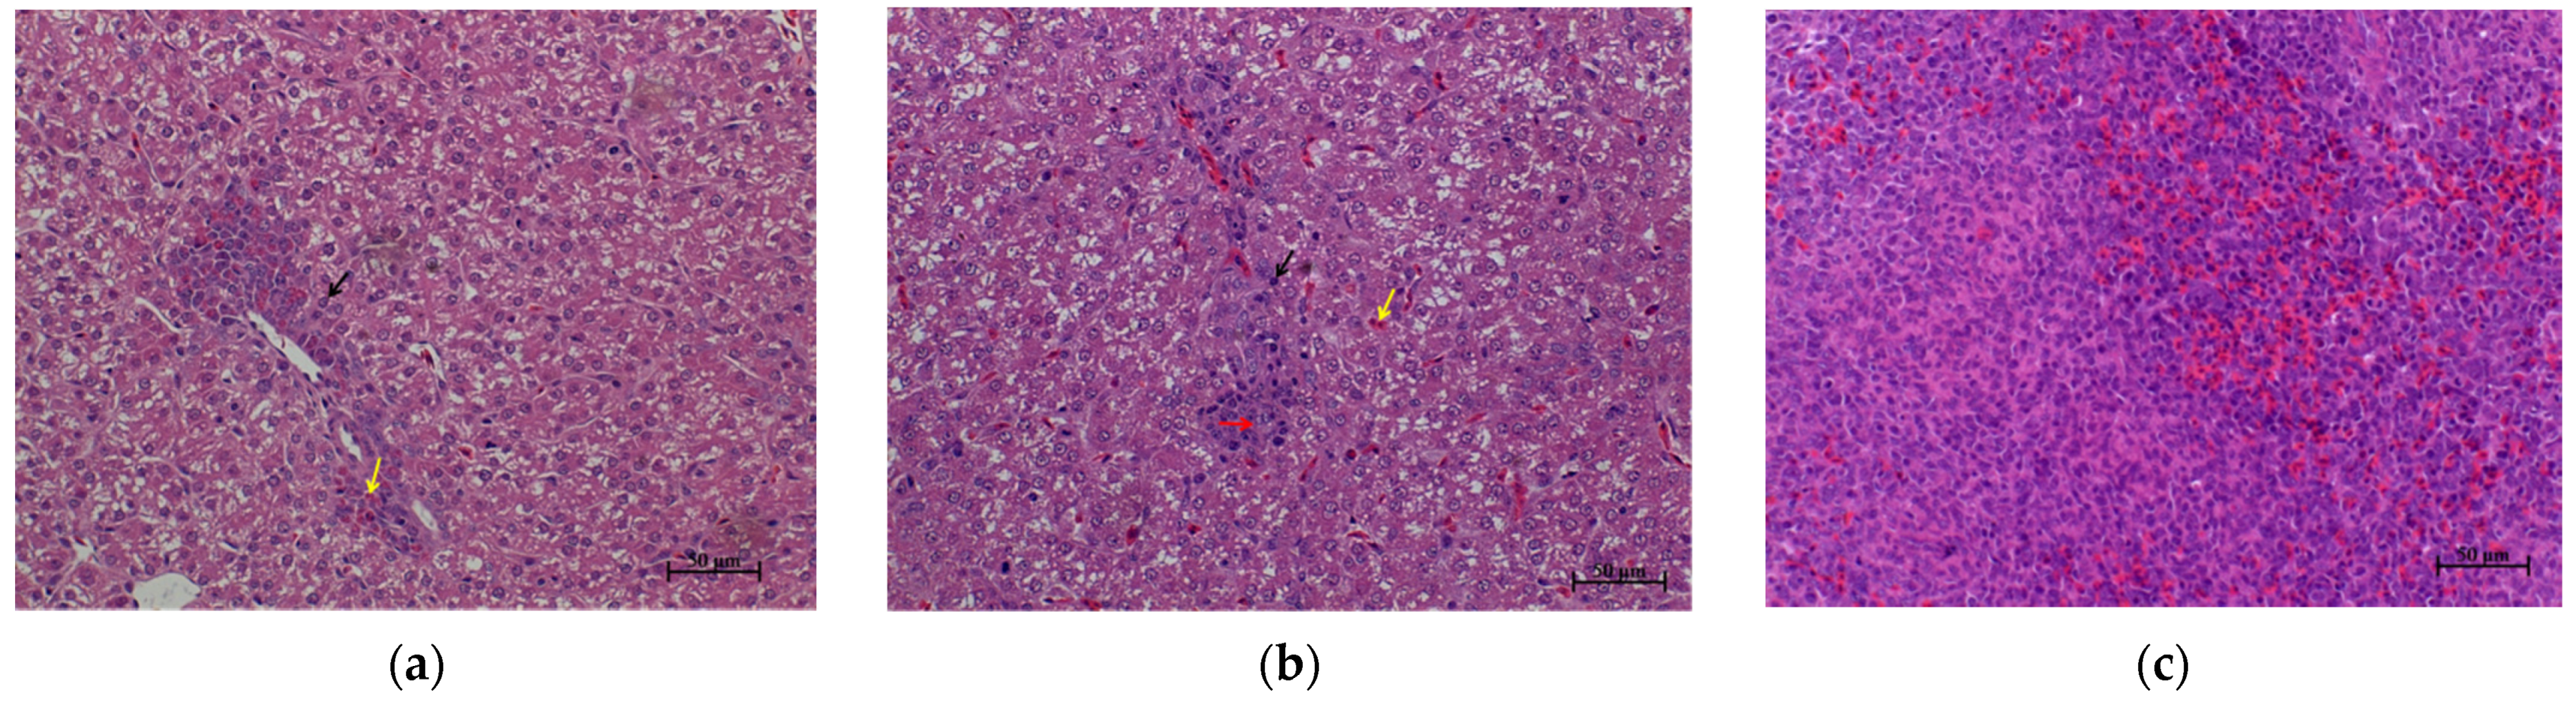
3.2. Liver and Spleen Histopathology of S. enteritidis-Susceptible and -Resistant Chicks

The differences in liver and spleen histopathology between S. enteritidis-susceptible and -resistant chicks are shown in Figure 1. There were only slight pathological changes in the livers of the birds in group R, with only limited infiltration of heterophilic cells and lymphocytes being observed around some of the blood vessels (Figure 1a,e). In contrast, chicks in group S showed obvious lesions in their livers, including numerous lymphocyte nodules and infiltrated heterophilic cells, as well as pyknosis of liver nuclei (Figure 1b,e). No obvious pathological changes were found in the spleens of chicks in the two groups (Figure 1c,d).

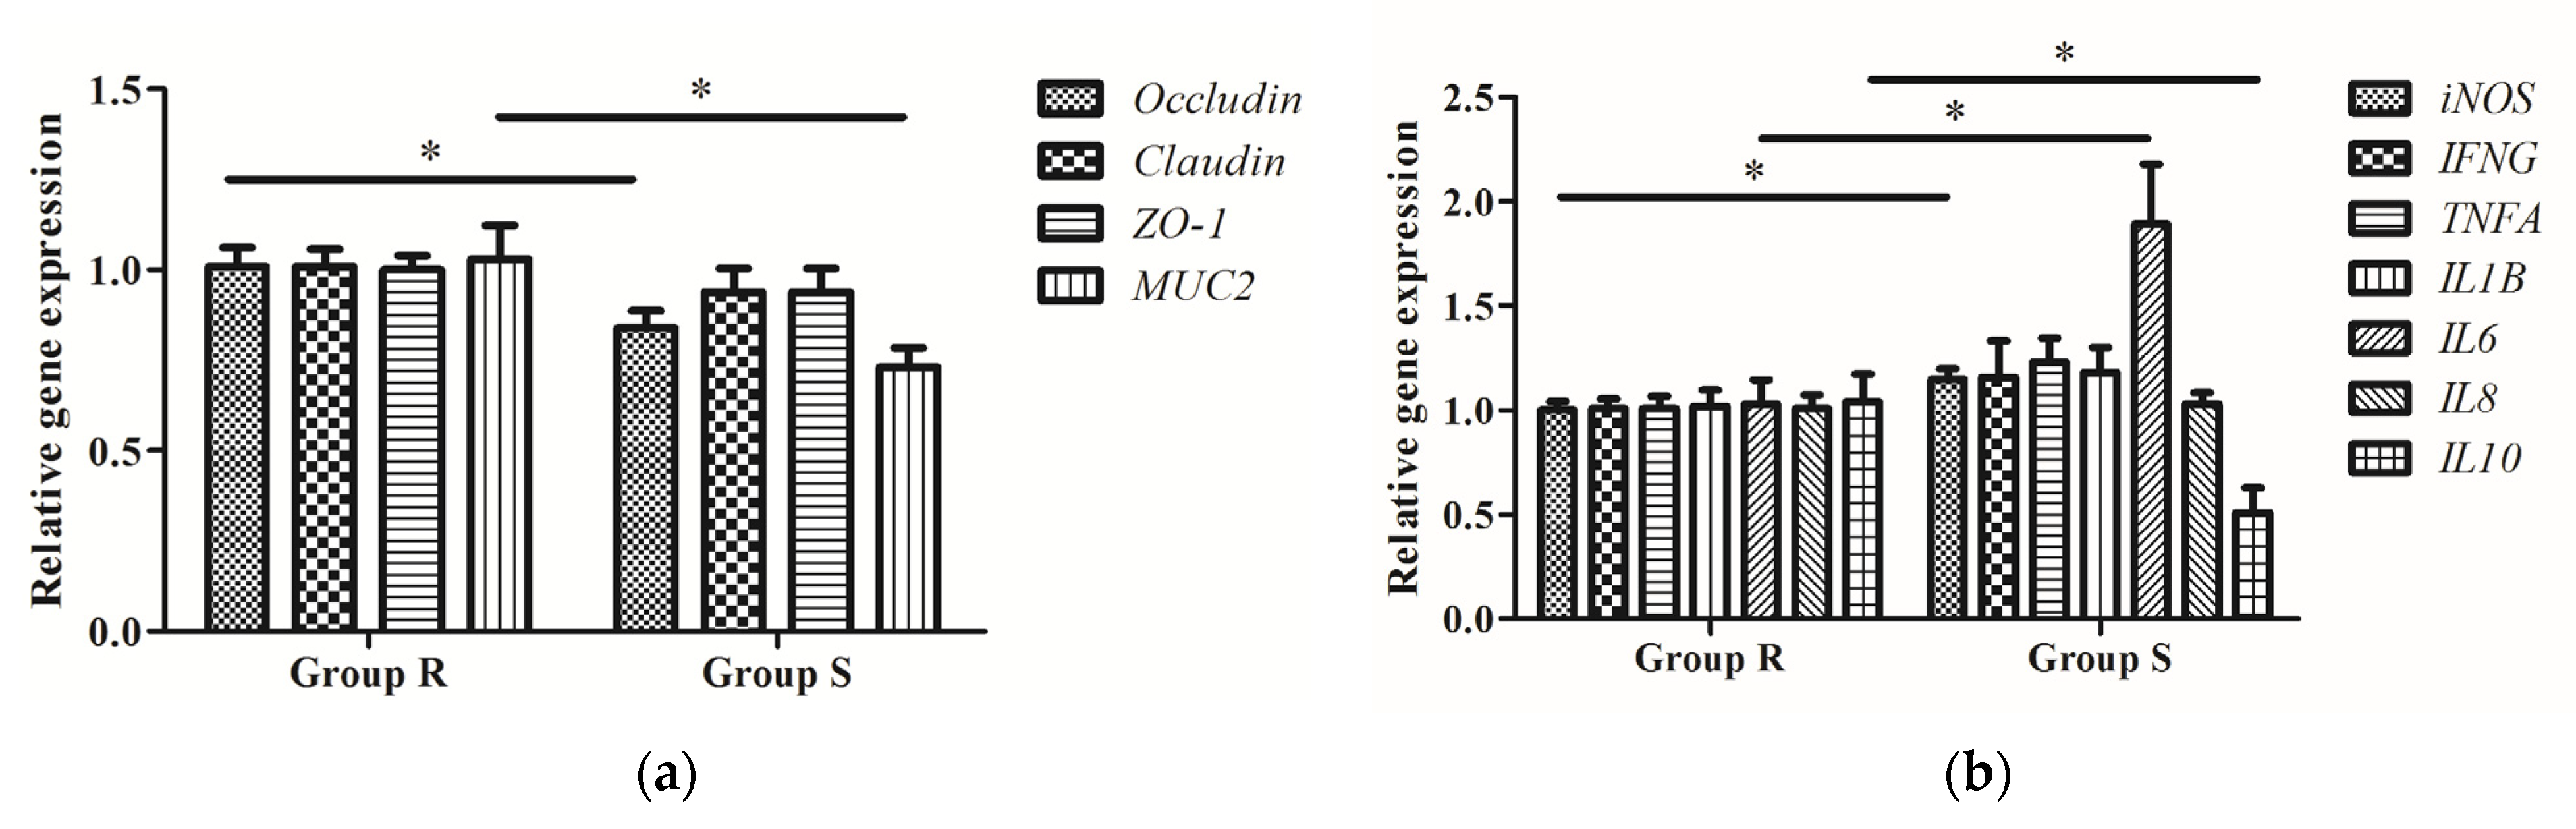
3.3. Intestinal Morphology and Barrier Function of S. enteritidis-Susceptible and -Resistant Chicks

The differences in jejunum morphology between the S. enteritidis-susceptible and -resistant chicks are summarized in Table 4. Although the chicks in group R showed lower CD, higher VH, VCR, and muscle thickness (MT), the differences between the two groups were not statistically significant. Only the VCR showed a higher trend in group R (p < 0.10).
We further investigated the differences in barrier function between S. enteritidis-susceptible and -resistant chicks by comparing their expression of the claudin, occludin, ZO-1, and MUC2 genes in the jejunum. As shown in Figure 2a, the expression of occludin and MUC2 was lower in the jejunum of S. enteritidis-susceptible chicks than in that of S. enteritidis-resistant chicks (p < 0.05). No statistically significant differences in claudin or ZO-1 expression were found between the two groups.

3.4. Expression of Inflammatory Cytokine-Related Genes in S. enteritidis-Susceptible and -Resistant Chicks

The gene expression of iNOS, IFNG, TNFA, IL1B, IL6, IL8, and IL10 in the cecal tonsil of both groups of chicks are shown in Figure 2b. Compared with group R, the expression of the genes encoding the proinflammatory factors iNOS and IL6 were markedly higher in the chicks of group S, whereas that of IL10, encoding an anti-inflammatory factor, was significantly lower (p < 0.05).

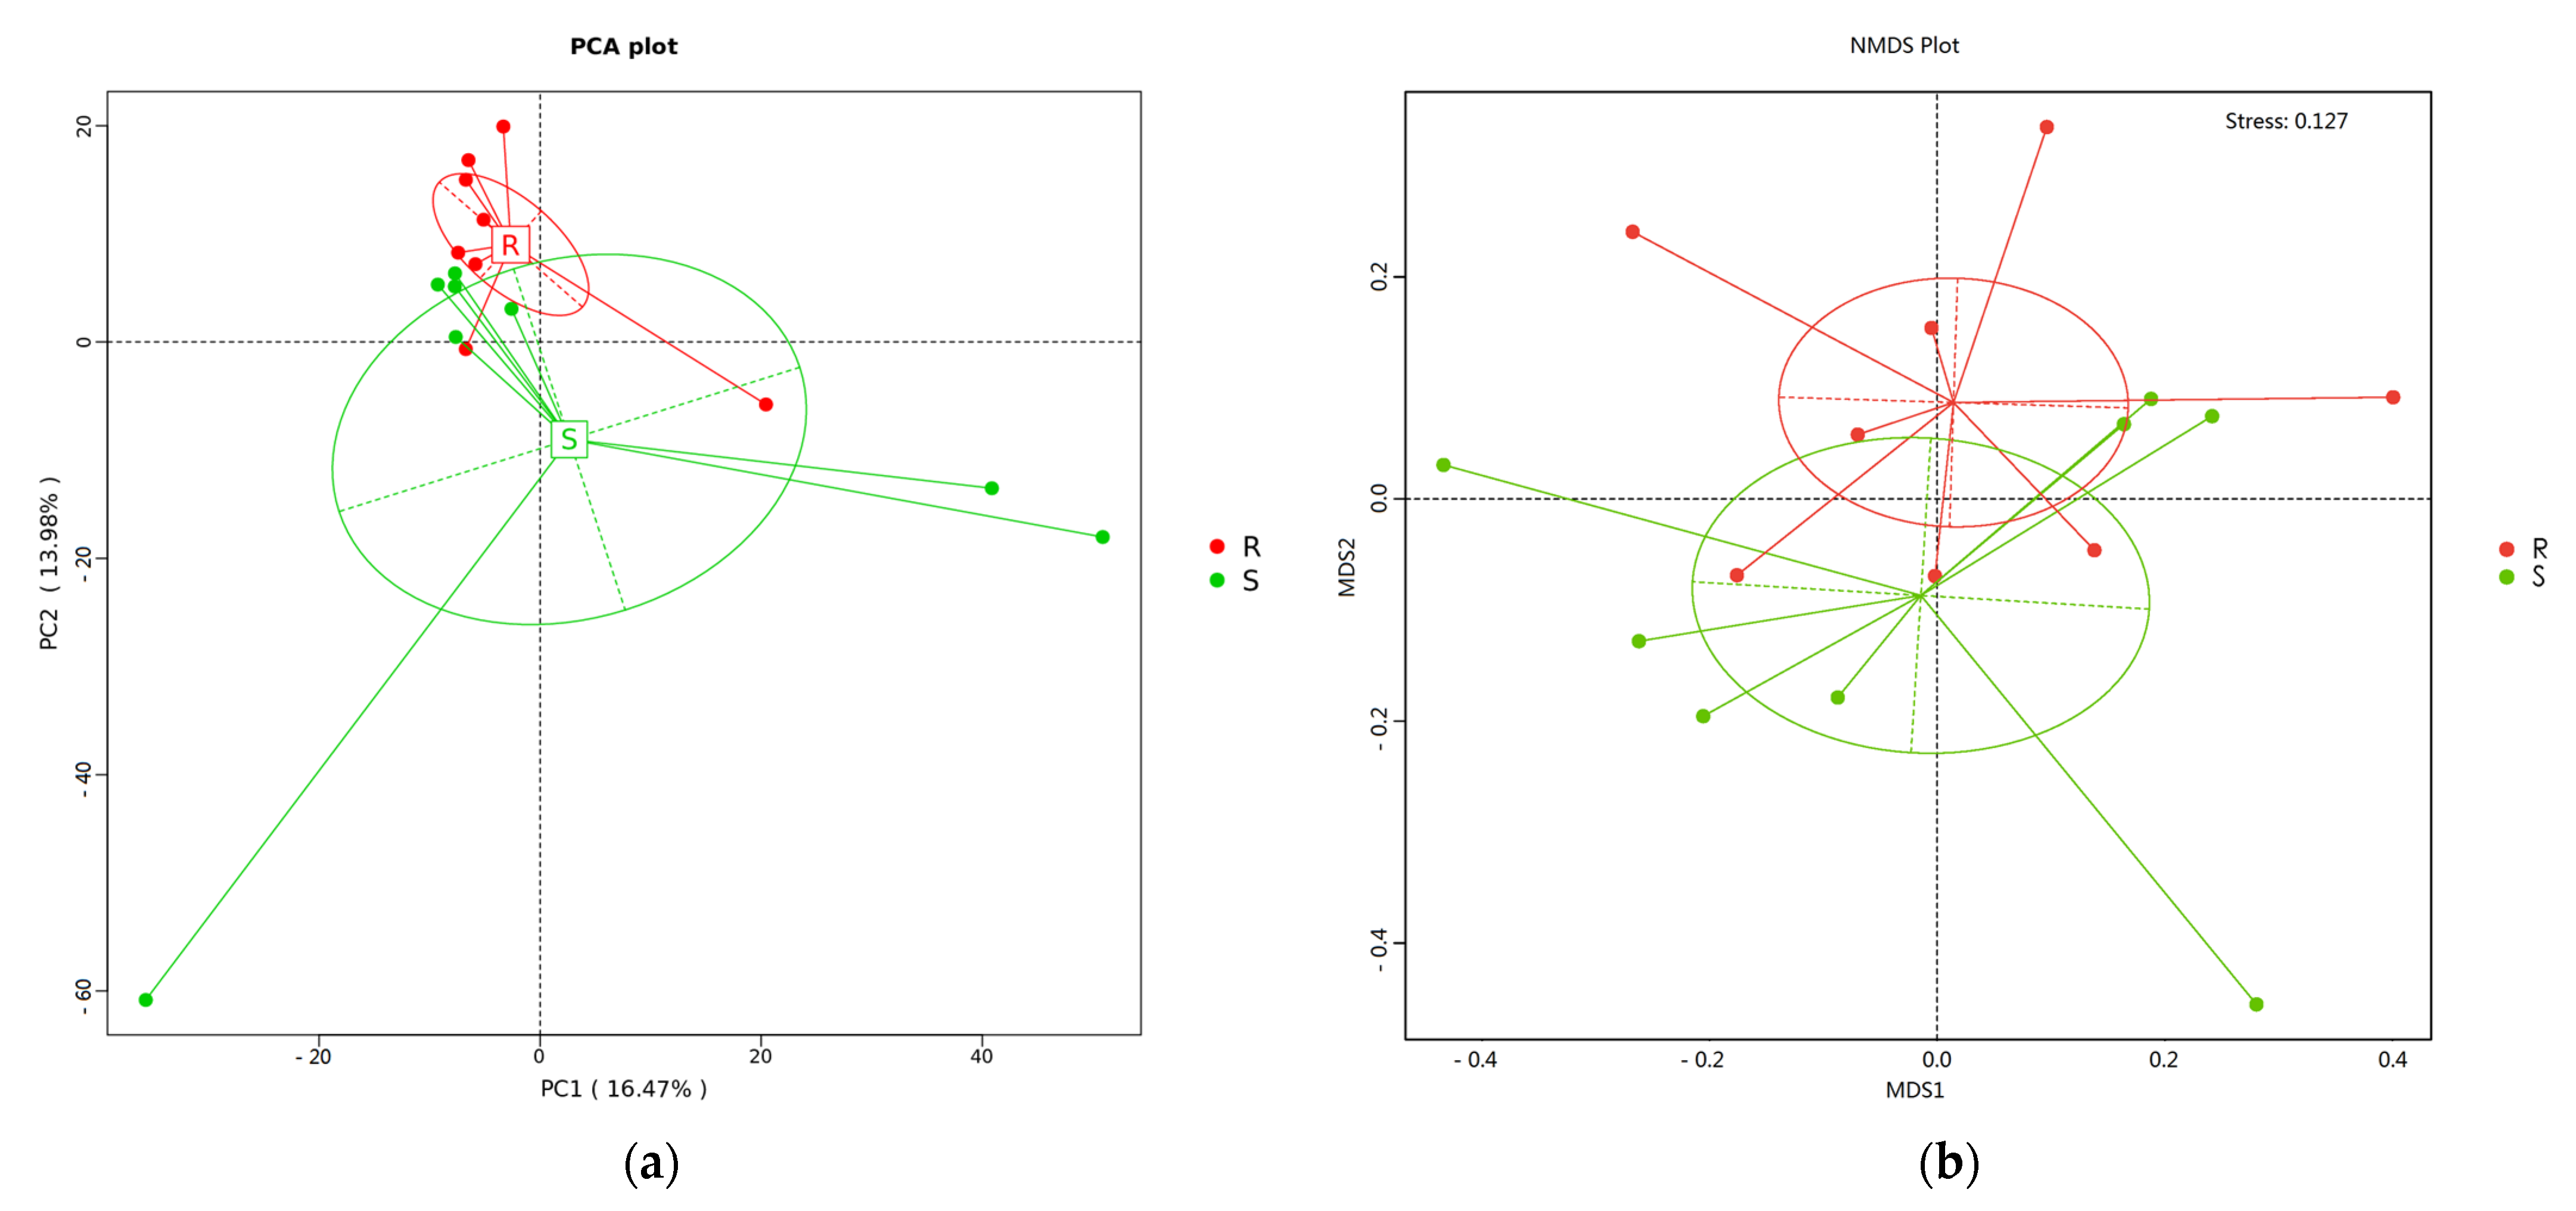
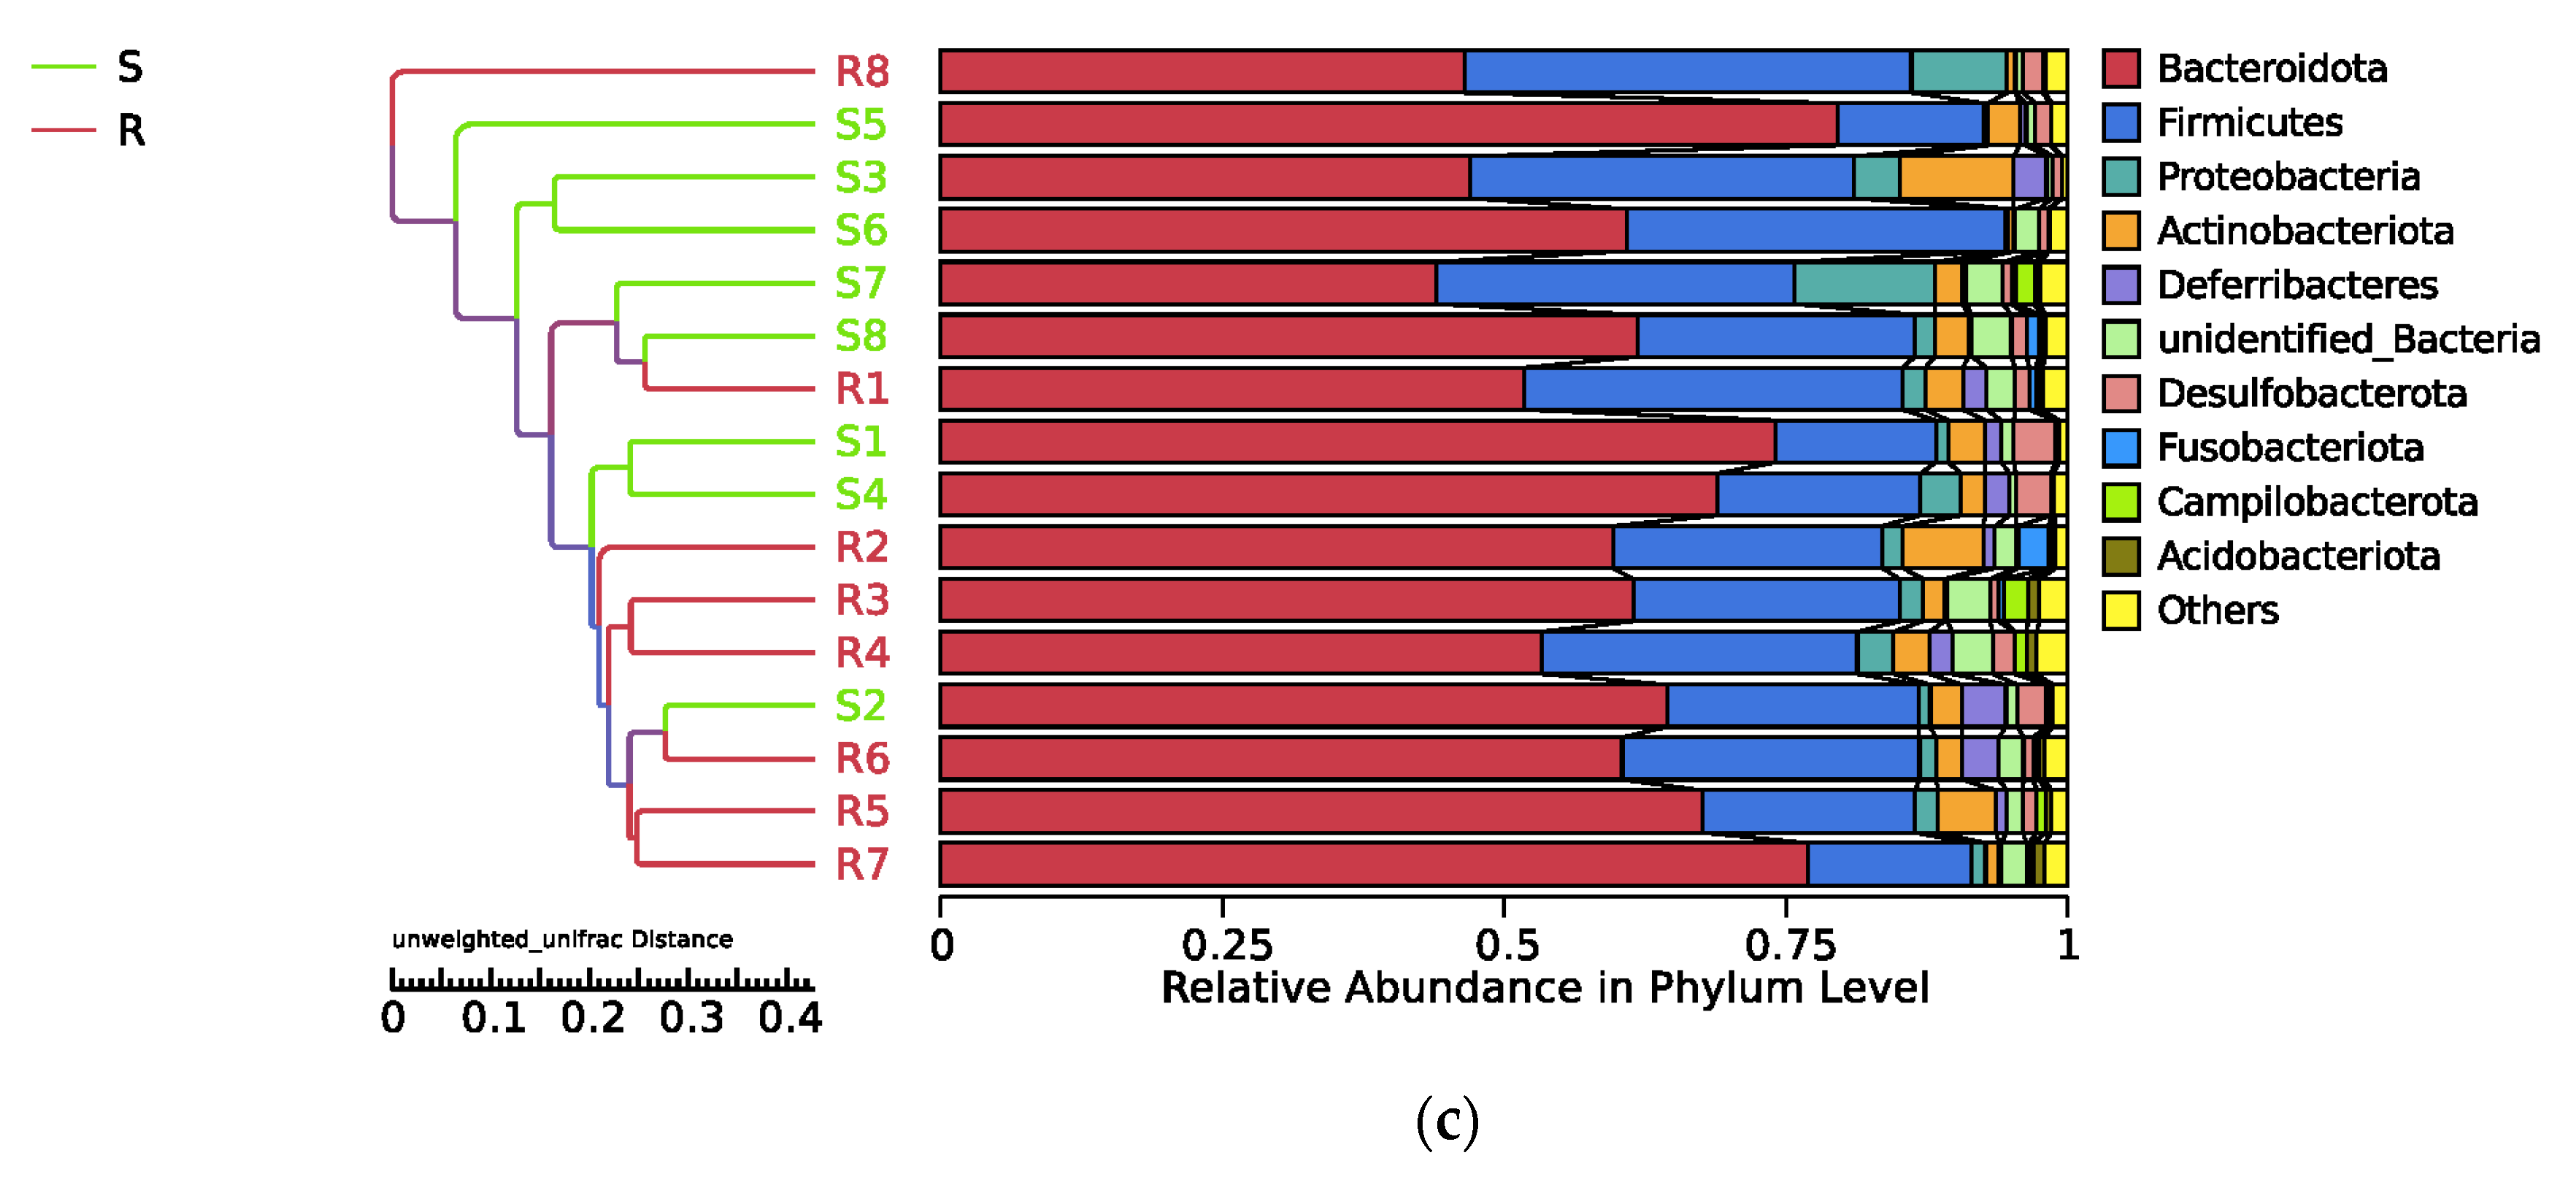
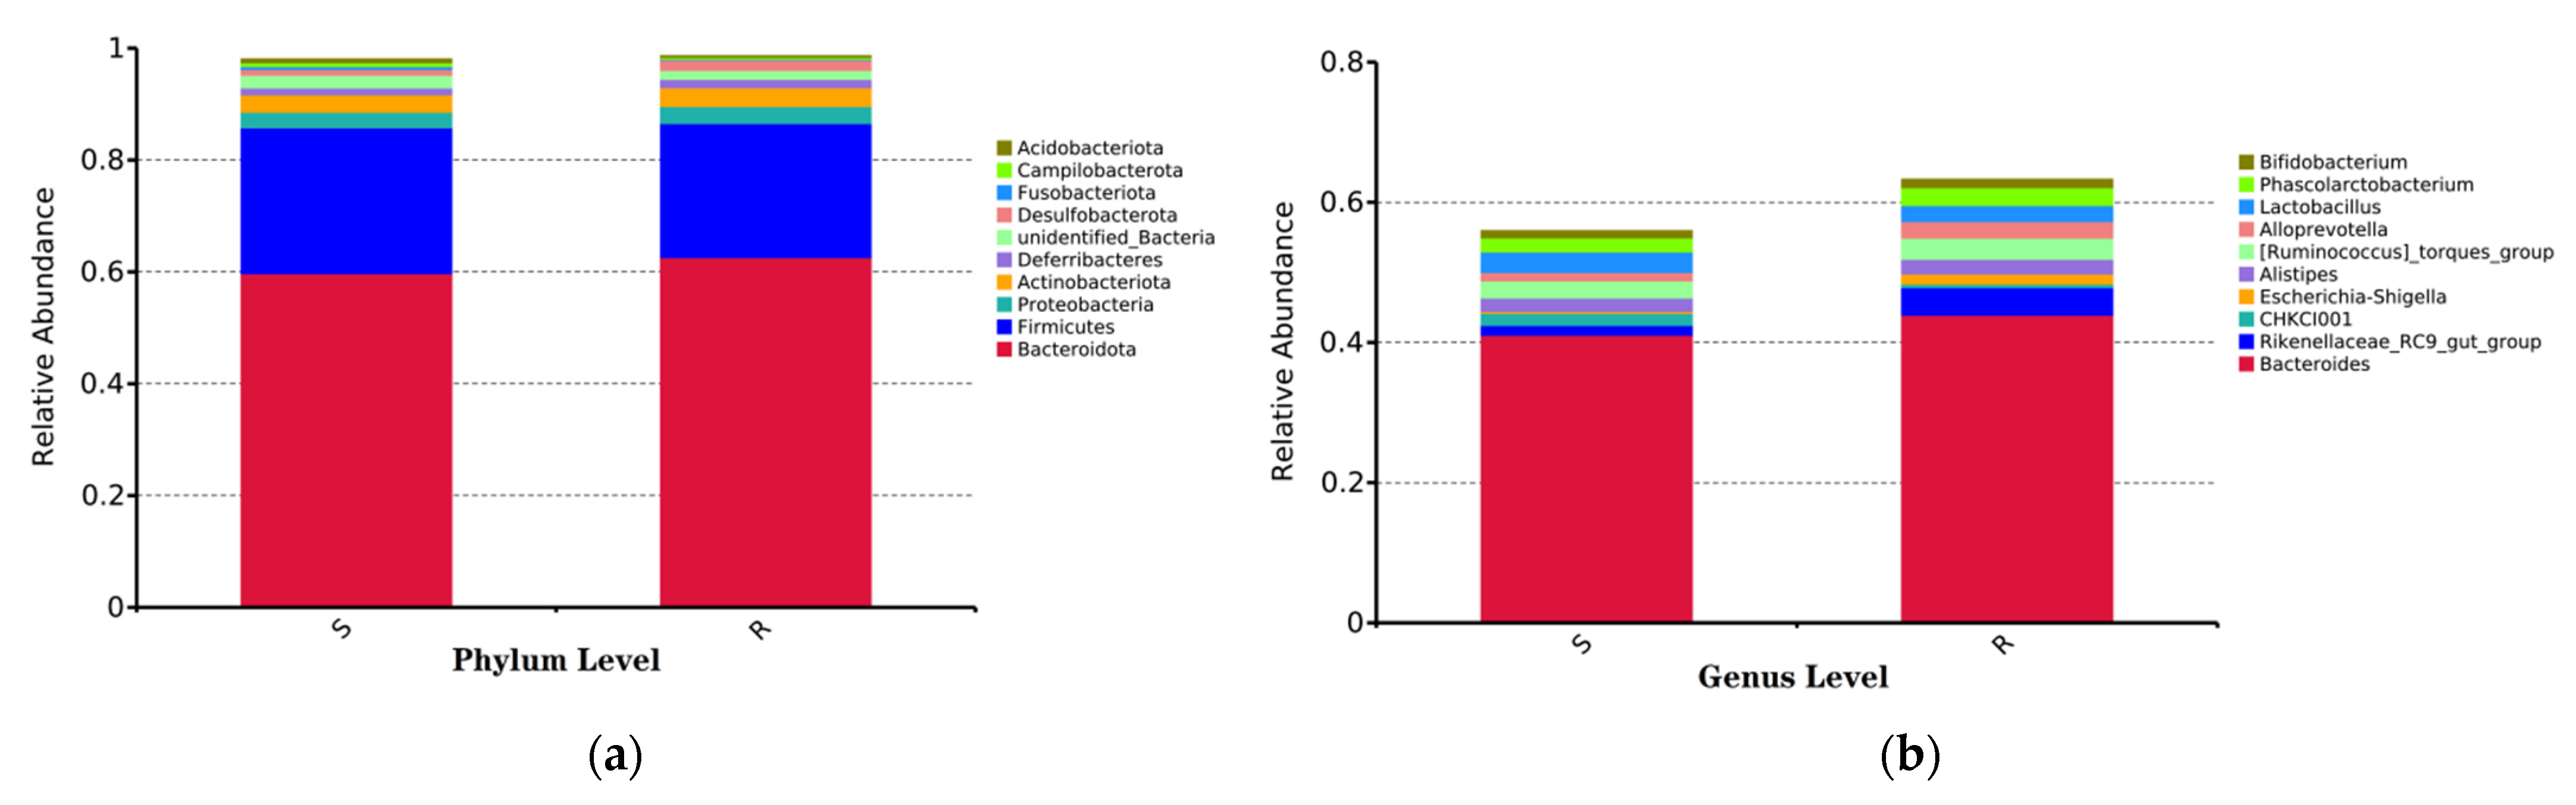
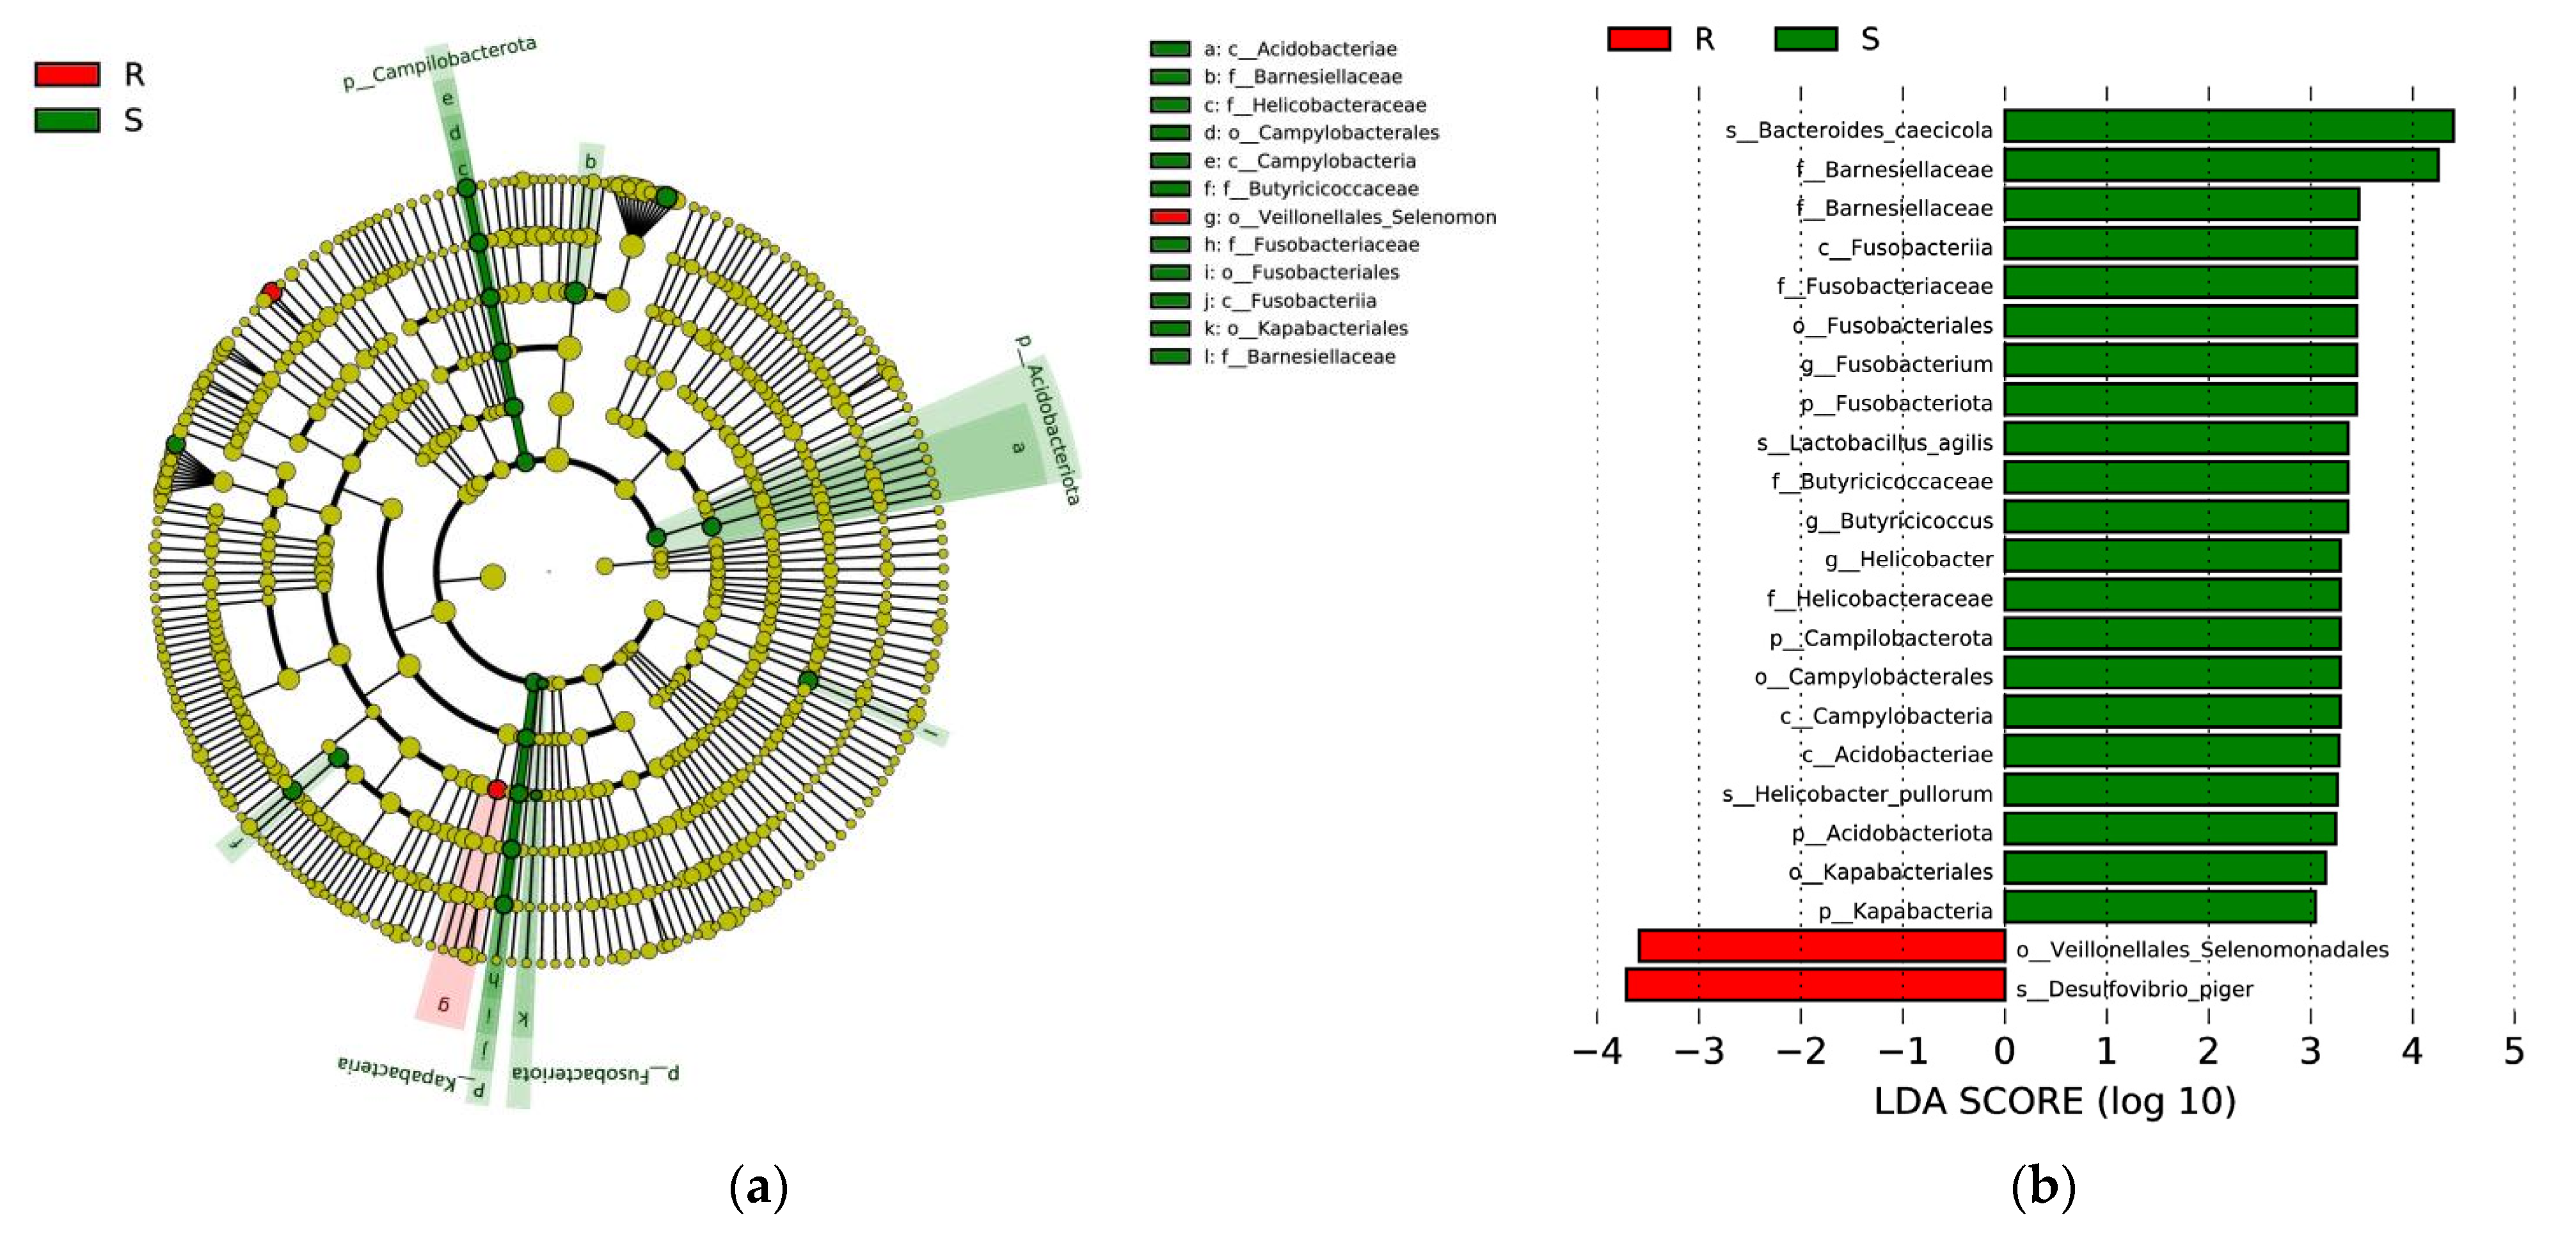
3.5. Composition and Diversity of Cecal Microorganisms in S. enteritidis-Susceptible and -Resistant Chicks

A total of 857,129 effective reads were obtained from 16 cecal digesta samples (8 samples per group), and these reads were assigned to 2458 operational taxonomic units (OTU) (Table S2). Each sample contained 53,571 ± 1632 (mean ± SEM) effective reads and 694 ± 46 (mean ± SEM) OTU on average. Good’s coverage indices were greater than 99.5% for all the cecal digesta samples (Table S2) and rarefaction curves based on the observed OTU reached a plateau (Figure S1), both indicating that sequencing coverage was sufficient to represent all OTU present in the samples.
No significant difference was found in microbial community richness and diversity between the S. enteritidis-susceptible and -resistant chicks by alpha diversity analysis, including ACE, Chao1, PD_whole_tree, Shannon, and Simpson indices (Table S3). However, beta diversity analysis indicated there was a separation of the cecal microbial community structure between the S. enteritidis-susceptible and -resistant chicks, as illustrated by principal component analysis (PCA), non-metric multidimensional scaling (NMDS), and unweighted pair-group method with arithmetic mean (Figure 3). The beta diversity of group R was lower than that of group S as calculated by binary_jaccard and unweighted_unifrac (Table S4).
Data for the top 10 microbial populations of the cecal bacterial community were analyzed at the phylum level. As shown in Figure 4a, Bacteroidota, Firmicutes, Proteobacteria, and Actinobacteriota (59.73% vs. 62.60%, 26.07 vs. 23.97%%, 2.81% vs. 3.08%, and 3.10% vs. 3.36%, for group S vs. group R, respectively) constituted the four dominant phyla in both groups of chicks. Among the top 10 microbial populations, the relative abundance of Acidobacteriata, Campilobacterota, and Fusobacteriota in group R was lower than that in group S (Wilcoxon test, p < 0.05) (Figure 4b).
At the genus level, the top 10 genera of the cecal bacterial community (Figure 4c) did not differ significantly between the two groups. Differentiation analysis was also conducted on other identified low-abundance genera. As shown in Table 5, a total of 18 genera showed significantly different abundance between group S and group R. Among them, Fusobacterium, Helicobacter, Butyricicoccus, Bryobacter, Acidothermus, unidentified_Chloroplast, NK4A214_group, Marvinbryantia, Burkholderia-Caballeronia-Paraburkholderia, Granulicella, Puia, unidentified_IMCC26256, Actinospica, Dyella, and Nocardia had higher abundance in group S than those in group R; while Oribacterium, Herbinix, and Papillibacter had lower abundance in group S than that of group R (Wilcoxon test, p < 0.05).
To identify differentially abundant biomarkers in S. enteritidis-susceptible and -resistant chicks, we employed LEfSe (Figure 5). A cladogram representative of the structure of the microbial communities and their predominant bacteria is shown in Figure 5a. Only taxa with linear discriminant analysis (LDA) values greater than 3 are shown for clarity (Figure 5b). At the phylum level, Acidobacteriota, Campilobacteriota, Fusobacteriota, and Kapabacteria were enriched in group S (green circles). At the class level, Acidobacteria, Campilobacteria, and Fusobacteriia were enriched in group S. At the order level, Campylobacterales, Fusobacteriales and Kapabacteriales were enriched in group S and Veillonellales-Selenomonadales were prevalent in group R (red circle). At the family level, Barnesiellaceae, Helicobacteraceae, Butyricicoccaceae, and Fusobacteriaceae were enriched in group S. Three genera (Fusobacterium, Helicobacter, and Butycicoccus) had higher LDA scores in group S. Two species (Helicobacter_pullorum and Bacteroides_caecicola) had higher LDA scores in group S; one specie (Desulfovibrio_piger) had a higher LDA score in group R.

4. Discussion

Salmonella can be transmitted horizontally to chickens from contaminated environmental vectors and vertically from infected hens to offspring. In this study, 1-d-old female AA female chicks, with Salmonella infection excluded by cloacal swab testing, were reared and challenged under the same conditions, therefore eliminating the influence of genetic background and environment on the experimental results to the greatest extent, and ensured that all the phenotypic results obtained in this study were due to individual differences. S. enteritidis mainly colonizes the liver, spleen, and intestine of poultry after infection [41,42], leading to intestinal damage, a decline in growth performance, and even death. Growth performance, pathological changes in organs, Salmonella loads, and intestinal morphology are important indicators of the severity of S. enteritidis infection. In this study, compared with S. enteritidis-resistant chicks, the livers of S. enteritidis-susceptible chicks became swollen (Table 3) and displayed salient lesions (Figure 1b). In addition, Salmonella loads in the liver and spleen of S. enteritidis-susceptible chicks were significantly higher than those of S. enteritidis-resistant chicks (Table 3). The VCR showed an increasing trend in chicks of group R than in chicks of group S (Table 4). These results indicated that our grouping scheme, i.e., selecting chicks with differential S. enteritidis susceptibility, was appropriate, and confirmed the heterogeneous nature of the response of the birds to S. enteritidis infection.
The intestinal mucosal barrier serves as the first line of defense between the host and the luminal environment. Composed of epithelial cells and tight junctions, this barrier can prevent the entry of harmful substances, such as pathogens and toxins, into host tissues, organs, and circulating blood [43]. The intestinal epithelium is involved in the formation of the intestinal mucosal barrier by continuously secreting MUC2 to renew the intestinal mucosal layer. Impaired intestinal mucosal barrier function is a key determinant of the pathogenicity of some intestinal bacteria. Studies have shown that Salmonella infection can disrupt the intestinal barrier of broilers, and promoting the expression of tight junction proteins through L-arginine supplementation can alleviate Salmonella infection, indicating that there is a negative correlation between intestinal barrier function and the severity of Salmonella infection [40]. In this study, we compared the expression of genes encoding tight junction proteins and MUC2 in S. enteritidis-susceptible and S. enteritidis-resistant chicks. The results showed that the mRNA expression of occludin and MUC2 in the jejunum of S. enteritidis-resistant chicks was significantly higher than that of S. enteritidis-susceptible chicks, further supporting that a negative correlation exists between intestinal mucosal barrier function and S. enteritidis susceptibility.
Because proinflammatory cytokines are essential for initiating immune responses and eliminating pathogens in the host, we hypothesized that chicks in group R would exhibit higher levels of inflammation than those of group S, therefore explaining the greater resistance of the birds in group R to S. enteritidis infection at the same dose of S. enteritidis challenge. However, our results showed that there was no significant difference in the expression of most proinflammatory factor-related genes between the two groups. Furthermore, the gene expression of iNOS and IL6 showed the opposite trend to what would be expected, i.e., the expression of both genes was significantly higher in group S than in group R, whereas that of IL10, coding for an anti-inflammatory factor, was significantly lower. These results suggested that inflammatory cytokines may play a role in the heterogeneous responses in an unexpected way. Or the higher expression levels of proinflammatory cytokine-related genes may also be considered to be a phenotype of S. enteritidis-susceptible chicks, which is consistent with the results of the histopathological analysis of liver tissue. In addition, although iNOS is believed to help cells resist bacterial invasion through the production of a large amount of NO, which serves as an antibacterial [44], it is notable that the relationship between NO and Salmonella in the host may not be merely antagonistic. It has been reported that Salmonella needs NO as a nitrogen source for nitrate respiration, and a low NO concentration is indispensable for promoting Salmonella growth [45]. This may also explain why the invasion of S. enteritidis in birds of group S was more severe, but their expression of the iNOS gene were higher in our research.
In the chicken, the intestinal microbiota is composed of complex microbial communities that are involved in digestion and metabolism, the regulation of intestinal cells, vitamin synthesis, and the development and regulation of the host immune system [46]. There is also accumulating evidence indicating that the intestinal microbiota profoundly influences the pathogenicity of S. enteritidis [24]. Because the cecum is the most densely colonized microbial habitat in the chicken [47], we systematically compared the cecal microbial composition of chicks from the different S. enteritidis susceptibility groups. Alpha diversity refers to the richness and diversity within a microbial community in individual samples [48], whereas beta diversity is a comparative analysis of microbial community composition in different samples. Although no significant difference was recorded for alpha diversity, significant differences in beta diversity were observed between the cecal samples of the two groups, which agreed with previous results showing that Salmonella infection can lead to changes in cecal microbiota [21].
The cecal microbial composition of the two groups at both the phylum and genus levels was analyzed using the Wilcoxon test. The results showed that at the phylum level, the relative abundance of Acidobacteria, Campilobacterota, and Fusobacteriota were enriched in group S. The same results were obtained using LEfSe. At the genus level, 18 genera were identified as significantly differential microorganisms by the Wilcoxon test. Among them, Fusobacterium, Helicobacter, and Butycicoccus were identified as marker microorganisms in group S using LEfSe. As we know, Fusobacterium has been associated with gastric ulcers in pigs [49] and colon carcinoma in humans [50,51], and may represent a kind of new opportunistic pathogens of chickens worthy of further investigation [52]. In addition, in the species level, Helicobacter_pullorum has also been identified as a marker microorganism of group S, which is member of Campilobacterota and a well-known zoonotic pathogen [53]. These results revealed that chicks showing higher S. enteritidis resistance has lower abundance of pathogenic bacteria in their cecal.
Furthermore, we identified a marker microorganism, Desulfovibrio_piger, which was enriched in chicks of group R. Desulfovibrio_piger, belonging to Desulfovibrio spp., is a kind of sulfate reducing bacteria, which can functional reducing sulfate to hydrogen sulfide (H2S) and plays an important role in intestinal hydrogen and sulfur metabolism. Although H2S has been found to have dichotomous effects (stimulatory and inhibitory) on several gastrointestinal processes, it seems to be hazardous at high concentrations but favorable at low concentrations, and the overarching effect of H2S appears to be beneficial. For example, H2S can attenuate DSS-induced colitis, lessen the shortening of the colon lengths and colonic pathological damages, showing an overall protective effect in colitis via its anti-inflammatory properties [54]. In addition, ATB-429, an H2S releasing derivative of mesalamine, exhibits a marked increase in anti-inflammatory activity and potency in a murine model of colitis, as compared to mesalamine, seems promising in the treatment of inflammatory bowel disease [55]. Our results were consistent with these above reports, as our chicks in group R showed higher abundance of Desulfovibrio_piger and lower inflammation response at the same time. However, whether Desulfovibrio_piger can really help chicks to resist the infection of S. enteritidis by producing H2S still need to be verified.

5. Conclusions

In conclusion, our results confirmed that chicks showed heterogeneous responses to S. enteritidis infection, including different degrees of Salmonella loads in tissues, different tissue lesion severity, and distinct inflammatory responses. Our findings suggested that enhanced intestinal barrier function and cecal microbiota structure, especially a higher abundance of Desulfovibrio_piger, may help chicks resist S. enteritidis invasion.

Supplementary Materials

The following are available online at https://www.mdpi.com/article/10.3390/microorganisms9081705/s1, Table S1: Tissue Salmonella loads of all slaughtered chicks (n = 48), Table S2: Details of sequencing data, Table S3: Alpha diversity analysis of cecal microbiota (n = 8), Table S4: Beta diversity analysis of cecal microbiota (n = 8), Figure S1: Rarefaction curves of the observed OTUs.

Author Contributions

S.W., X.H. and S.S. designed the experiment, analyzed the data and wrote the manuscript; G.C., Q.Z., H.Y., Z.W. and K.K. participated the animal feeding and laboratory testing. All authors have read and agreed to the published version of the manuscript.

Funding

This research was funded by The National Natural Science Foundation of China (No. 31972587), the Natural Science Foundation of Jiangsu Province (No. BK20201482), the Jiangsu Provincial Key Laboratory of Poultry Genetics & Breeding (JQLAB-ZZ-201903), and the Support Project for Scientific and Technical Talents in Hunan Province (2020TJ-Q02).

Institutional Review Board Statement

The study was conducted according to the Regulations of the Experimental Animal Administration issued by the State Committee of Science and Technology of the People’s Republic of China, and approved by the Animal Care and Use Committee of the Poultry Institute, Chinese Academy of Agriculture Science (CNP20201030; 30 October 2020).

Informed Consent Statement

Not applicable.

Data Availability Statement

These sequence data have been submitted to the Biotechnology Information (NCBI) Sequence Read Archive databases under accession number PRJNA742372.

Acknowledgments

The authors acknowledge the support of the National Natural Science Foundation of China (No. 31972587), the Natural Science Foundation of Jiangsu Province (No. BK20201482), the Jiangsu Provincial Key Laboratory of Poultry Genetics & Breeding (JQLAB-ZZ-201903), and the Support Project for Scientific and Technical Talents in Hunan Province (2020TJ-Q02).

Conflicts of Interest

The authors declare no conflict of interest.

References

  1. Shi, S.; Wu, S.; Shen, Y.; Zhang, S.; Xiao, Y.; He, X.; Gong, J.; Farnell, Y.; Tang, Y.; Huang, Y.; et al. Iron oxide nanozyme suppresses intracellular Salmonella enteritidis growth and alleviates infection in vivo. Theranostics 2018, 8, 6149–6162. [Google Scholar] [CrossRef]
  2. WHO. Salmonella (Non-Typhoidal). 2018. Available online: http://www.who.int/mediacentre/factsheets/fs139/en/ (accessed on 20 February 2018).
  3. Jiang, M.; Zhu, F.; Yang, C.; Deng, Y.; Kwan, P.S.L.; Li, Y.; Lin, Y.; Qiu, Y.; Shi, X.; Chen, H.; et al. Whole-genome analysis of Salmonella enterica serovar enteritidis isolates in outbreak linked to online food delivery, Shenzhen, China, 2018. Emerg. Infect. Dis. 2020, 26, 789–792. [Google Scholar] [CrossRef] [PubMed] [Green Version]
  4. Smith, A.M.; Tau, N.P.; Ngomane, H.M.; Sekwadi, P.; Ramalwa, N.; Moodley, K.; Govind, C.; Khan, S.; Archary, M.; Thomas, J. Whole-genome sequencing to investigate two concurrent outbreaks of Salmonella enteritidis in South Africa, 2018. J. Med. Microbiol. 2020, 69, 1303–1307. [Google Scholar] [CrossRef]
  5. Sher, A.A.; Mustafa, B.E.; Grady, S.C.; Gardiner, J.C.; Saeed, A.M. Outbreaks of foodborne Salmonella enteritidis in the United States between 1990 and 2015: An analysis of epidemiological and spatial-temporal trends. Int. J. Infect. Dis. 2021, 105, 54–61. [Google Scholar] [CrossRef]
  6. Shah, D.H.; Paul, N.C.; Sischo, W.C.; Crespo, R.; Guard, J. Population dynamics and antimicrobial resistance of the most prevalent poultry-associated Salmonella serotypes. Poult. Sci. 2017, 96, 687–702. [Google Scholar] [CrossRef]
  7. Steed, A.L.; Christophi, G.P.; Kaiko, G.E.; Sun, L.; Goodwin, V.M.; Jain, U.; Esaulova, E.; Artyomov, M.N.; Morales, D.J.; Holtzman, M.J.; et al. The microbial metabolite desaminotyrosine protects from influenza through type I interferon. Science 2017, 357, 498–502. [Google Scholar] [CrossRef] [Green Version]
  8. Sanchez, K.K.; Chen, G.Y.; Schieber, A.M.P.; Redford, S.E.; Shokhirev, M.N.; Leblanc, M.; Lee, Y.M.; Ayres, J.S. Cooperative metabolic adaptations in the host can favor asymptomatic infection and select for attenuated virulence in an enteric pathogen. Cell 2018, 175, 146–158. [Google Scholar] [CrossRef] [Green Version]
  9. Velge, P.; Cloeckaert, A.; Barrow, P. Emergence of Salmonella epidemics: The problems related to Salmonella enterica serotype enteritidis and multiple antibiotic resistance in other major serotypes. Vet. Res. 2005, 36, 267–288. [Google Scholar] [CrossRef] [Green Version]
  10. Calenge, F.; Kaiser, P.; Vignal, A.; Beaumont, C. Genetic control of resistance to salmonellosis and to Salmonella carrier-state in fowl: A review. Genet. Sel. Evol. 2010, 42, 11. [Google Scholar] [CrossRef] [Green Version]
  11. Chaussé, A.M.; Grépinet, O.; Bottreau, E.; Vern, L.Y.; Menanteau, P.; Trotereau, J.; Robert, V.; Wu, Z.; Kerboeuf, D.; Beaumont, C.; et al. Expression of Toll-like receptor 4 and downstream effectors in selected cecal cell subpopulations of chicks resistant or susceptible to Salmonella carrier state. Infect. Immun. 2011, 79, 3445–3454. [Google Scholar] [CrossRef] [Green Version]
  12. Lawley, T.D.; Bouley, D.M.; Hoy, Y.E.; Gerke, C.; Relman, D.A.; Monack, D.M. Host transmission of Salmonella enterica serovar Typhimurium is controlled by virulence factors and indigenous intestinal microbiota. Infect. Immun. 2008, 76, 403–416. [Google Scholar] [CrossRef] [Green Version]
  13. Menanteau, P.; Kempf, F.; Trotereau, J.; Virlogeux-Payant, I.; Gitton, E.; Dalifard, J.; Gabriel, I.; Rychlik, I.; Velge, P. Role of systemic infection, cross contaminations and super-shedders in Salmonella carrier state in chicken. Environ. Microbiol. 2018, 20, 3246–3260. [Google Scholar] [CrossRef]
  14. Brown, R.L.; Clarke, T.B. The regulation of host defences to infection by the microbiota. Immunology 2017, 150, 1–6. [Google Scholar] [CrossRef] [Green Version]
  15. Flemer, B.; Warren, R.D.; Barrett, M.P.; Cisek, K.; Das, A.; Jeffery, I.B.; Hurley, E.; O’Riordain, M.; Shanahan, F.; O’Toole, P.W. The oral microbiota in colorectal cancer is distinctive and predictive. Gut 2018, 67, 1454–1463. [Google Scholar] [CrossRef] [Green Version]
  16. Masetti, G.; Moshkelgosha, S.; Köhling, H.L.; Covelli, D.; Banga, J.P.; Berchner-Pfannschmidt, U.; Horstmann, M.; Diaz-Cano, S.; Goertz, G.E.; Plummer, S.; et al. Gut microbiota in experimental murine model of Graves’ orbitopathy established in different environments may modulate clinical presentation of disease. Microbiome 2018, 6, 97. [Google Scholar] [CrossRef] [Green Version]
  17. Jie, Z.; Xia, H.; Zhong, S.L.; Feng, Q.; Li, S.; Liang, S.; Zhong, H.; Liu, Z.; Gao, Y.; Zhao, H.; et al. The gut microbiome in atherosclerotic cardiovascular disease. Nat. Commun. 2017, 8, 845. [Google Scholar] [CrossRef] [Green Version]
  18. Zhao, L.; Zhang, F.; Ding, X.; Wu, G.; Lam, Y.Y.; Wang, X.; Fu, H.; Xue, X.; Lu, C.; Ma, J.; et al. Gut bacteria selectively promoted by dietary fibers alleviate type 2 diabetes. Science 2018, 359, 1151–1156. [Google Scholar] [CrossRef] [Green Version]
  19. Cho, I.; Blaser, M.J. The human microbiome: At the interface of health and disease. Nat. Rev. Genet. 2012, 13, 260–270. [Google Scholar] [CrossRef] [Green Version]
  20. Juricova, H.; Videnska, P.; Lukac, M.; Faldynova, M.; Babak, V.; Havlickova, H.; Sisak, F.; Rychlik, I. Influence of Salmonella enterica serovar enteritidis infection on the development of the cecum microbiota in newly hatched chicks. Appl. Environ. Microbiol. 2013, 79, 745–747. [Google Scholar] [CrossRef] [Green Version]
  21. Borewicz, K.A.; Kim, H.B.; Singer, R.S.; Gebhart, C.J.; Sreevatsan, S.; Johnson, T.; Isaacson, R.E. Changes in the porcine intestinal microbiome in response to infection with Salmonella enterica and Lawsonia intracellularis. PLoS ONE 2015, 10, e0139106. [Google Scholar] [CrossRef]
  22. Pollock, J.; Hutchings, M.R.; Hutchings, K.E.K.; Gally, D.L.; Houdijk, J.G.M. Changes in the ileal, but not fecal, microbiome in response to increased dietary protein level and enterotoxigenic Escherichia coli exposure in pigs. Appl. Environ. Microbiol. 2019, 85, e01252-19. [Google Scholar] [CrossRef] [Green Version]
  23. Pickard, J.M.; Zeng, M.Y.; Caruso, R.; Núñez, G. Gut microbiota: Role in pathogen colonization, immune responses, and inflammatory disease. Immunol. Rev. 2017, 279, 70–89. [Google Scholar] [CrossRef]
  24. Litvak, Y.; Mon, K.K.Z.; Nguyen, H.; Chanthavixay, G.; Liou, M.; Velazquez, E.M.; Kutter, L.; Alcantara, M.A.; Byndloss, M.X.; Tiffany, C.R.; et al. Commensal Enterobacteriaceae protect against Salmonella colonization through oxygen competition. Cell Host. Microbe 2019, 25, 128–139. [Google Scholar] [CrossRef] [PubMed] [Green Version]
  25. Sabry, M.A.; Abdel-Moein, K.A.; Abdel-Kader, F.; Hamza, E. Extended-spectrum β-lactamase-producing Salmonella serovars among healthy and diseased chickens and their public health implication. J. Glob. Antimicrob. Resist. 2020, 22, 742–748. [Google Scholar] [CrossRef] [PubMed]
  26. Zhang, S.; Shen, Y.; Wu, S.; Xiao, Y.; He, Q.; Shi, S. The dietary combination of essential oils and organic acids reduces Salmonella enteritidis in challenged chicks. Poult. Sci. 2019, 98, 6349–6355. [Google Scholar] [CrossRef] [PubMed]
  27. Shen, Y.; Xiao, Y.; Zhang, S.; Wu, S.; Gao, L.; Shi, S. Fe3O4 nanoparticles attenuated Salmonella infection in chicken liver through reactive oxygen and autophagy via PI3K/Akt/mTOR signaling. Front. Physiol. 2020, 10, 1580. [Google Scholar] [CrossRef] [PubMed] [Green Version]
  28. Hu, Y.; Wang, L.; Shao, D.; Wang, Q.; Wu, Y.; Han, Y.; Shi, S. Selectived and reshaped early dominant microbial community in the cecum with similar proportions and better homogenization and species diversity due to organic acids as AGP alternatives mediate their effects on broilers growth. Front. Microbiol. 2020, 10, 2948. [Google Scholar] [CrossRef] [Green Version]
  29. Sousa, B.F.; Silva, A.F.B.D.; Lima-Filho, J.V.; Agostinho, A.G.; Oliveira, D.N.; De Alencar, N.M.N.; De Freitas, C.D.T.; Ramos, M.V. Latex proteins downregulate inflammation and restores blood-coagulation homeostasis in acute Salmonella infection. Mem. Inst. Oswaldo Cruz 2020, 115, e200458. [Google Scholar] [CrossRef]
  30. Guo, L.D.; Hyde, K.D.; Liew, E.C.Y. Identification of endophytic fungi from Livistona chinensis based on morphology and rDNA sequences. New Phytol. 2000, 147, 617–630. [Google Scholar] [CrossRef]
  31. Yu, X.; Wu, X.; Qiu, L.; Wang, D.; Gan, M.; Chen, X.; Wei, H.; Xu, F. Analysis of the intestinal microbial community structure of healthy and long-living elderly residents in Gaotian Village of Liuyang City. Appl. Microbiol. Biotechnol. 2015, 99, 9085–9095. [Google Scholar] [CrossRef]
  32. Caporaso, J.G.; Lauber, C.L.; Walters, W.A.; Berg-Lyons, D.; Lozupone, C.A.; Turnbaugh, P.J.; Fierer, N.; Knight, R. Global patterns of 16S rRNA diversity at a depth of millions of sequences per sample. Proc. Natl. Acad. Sci. USA 2011, 108 (Suppl. 1), 4516–4522. [Google Scholar] [CrossRef] [PubMed] [Green Version]
  33. Gao, Y.; Wang, C.; Zhang, W.; Di, P.; Yi, N.; Chen, C. Vertical and horizontal assemblage patterns of bacterial communities in a eutrophic river receiving domestic wastewater in southeast China. Environ. Pollut. 2017, 230, 469–478. [Google Scholar] [CrossRef] [PubMed]
  34. Magoč, T.; Salzberg, S.L. FLASH: Fast length adjustment of short reads to improve genome assemblies. Bioinformatics 2011, 27, 2957–2963. [Google Scholar] [CrossRef] [PubMed]
  35. Caporaso, J.G.; Kuczynski, J.; Stombaugh, J.; Bittinger, K.; Bushman, F.D.; Costello, E.K.; Fierer, N.; Peña, A.G.; Goodrich, J.K.; Gordon, J.I.; et al. QIIME allows analysis of high-throughput community sequencing data. Nat. Methods 2010, 7, 335–336. [Google Scholar] [CrossRef] [Green Version]
  36. Haas, B.J.; Gevers, D.; Earl, A.M.; Feldgarden, M.; Ward, D.V.; Giannoukos, G.; Ciulla, D.; Tabbaa, D.; Highlander, S.K.; Sodergren, E.; et al. Chimeric 16S rRNA sequence formation and detection in Sanger and 454-pyrosequenced PCR amplicons. Genome Res. 2011, 21, 494–504. [Google Scholar] [CrossRef] [Green Version]
  37. Wang, Q.; Garrity, G.M.; Tiedje, J.M.; Cole, J.R. Naive Bayesian classifier for rapid assignment of rRNA sequences into the new bacterial taxonomy. Appl. Environ. Microbiol. 2007, 73, 5261–5267. [Google Scholar] [CrossRef] [Green Version]
  38. Zhang, L.; Wu, W.; Lee, Y.K.; Xie, J.; Zhang, H. Spatial heterogeneity and co-occurrence of mucosal and luminal microbiome across swine intestinal tract. Front. Microbiol. 2018, 9, 48. [Google Scholar] [CrossRef] [PubMed] [Green Version]
  39. Lozupone, C.; Knight, R. UniFrac: A new phylogenetic method for comparing microbial communities. Appl. Environ. Microbiol. 2005, 71, 8228–8235. [Google Scholar] [CrossRef] [Green Version]
  40. Zhang, B.; Li, G.; Shahid, M.S.; Gan, L.; Fan, H.; Lv, Z.; Yan, S.; Guo, Y. Dietary l-arginine supplementation ameliorates inflammatory response and alters gut microbiota composition in broiler chickens infected with Salmonella enterica serovar Typhimurium. Poult. Sci. 2020, 99, 1862–1874. [Google Scholar] [CrossRef]
  41. Shah, D.H.; Zhou, X.; Kim, H.Y.; Call, D.R.; Guard, J. Transposon mutagenesis of Salmonella enterica serovar enteritidis identifies genes that contribute to invasiveness in human and chicken cells and survival in egg albumen. Infect. Immun. 2012, 80, 4203–4215. [Google Scholar] [CrossRef] [Green Version]
  42. Wang, C.L.; Fan, Y.C.; Wang, C.; Tsai, H.J.; Chou, C.H. The impact of Salmonella enteritidis on lipid accumulation in chicken hepatocytes. Avian. Pathol. 2016, 45, 450–457. [Google Scholar] [CrossRef] [Green Version]
  43. König, J.; Wells, J.; Cani, P.D.; García-Ródenas, C.L.; MacDonald, T.; Mercenier, A.; Whyte, J.; Troost, F.; Brummer, R.J. Human intestinal barrier function in health and disease. Clin. Transl. Gastroenterol. 2016, 7, e196. [Google Scholar] [CrossRef] [PubMed]
  44. Nathan, C.; Shiloh, M.U. Reactive oxygen and nitrogen intermediates in the relationship between mammalian hosts and microbial pathogens. Proc. Natl. Acad. Sci. USA 2000, 97, 8841–8848. [Google Scholar] [CrossRef] [Green Version]
  45. Fu, Y.; Galán, J.E. A Salmonella protein antagonizes Rac-1 and Cdc42 to mediate host-cell recovery after bacterial invasion. Nature 1999, 401, 293–297. [Google Scholar] [CrossRef] [PubMed]
  46. Khan, S.; Chousalkar, K.K. Salmonella Typhimurium infection disrupts but continuous feeding of Bacillus based probiotic restores gut microbiota in infected hens. J. Anim. Sci. Biotechnol. 2020, 11, 29. [Google Scholar] [CrossRef] [Green Version]
  47. Pourabedin, M.; Zhao, X. Prebiotics and gut microbiota in chickens. FEMS. Microbiol. Lett. 2015, 362, fnv122. [Google Scholar] [CrossRef] [PubMed] [Green Version]
  48. Li, B.; Zhang, X.; Guo, F.; Wu, W.; Zhang, T. Characterization of tetracycline resistant bacterial community in saline activated sludge using batch stress incubation with high-throughput sequencing analysis. Water. Res. 2013, 47, 4207–4216. [Google Scholar] [CrossRef]
  49. De Witte, C.; Demeyere, K.; De Bruyckere, S.; Taminiau, B.; Daube, G.; Ducatelle, R.; Meyer, E.; Haesebrouck, F. Characterization of the non-glandular gastric region microbiota in Helicobacter suis-infected versus non-infected pigs identifies a potential role for Fusobacterium gastrosuis in gastric ulceration. Vet. Res. 2019, 50, 39. [Google Scholar] [CrossRef] [Green Version]
  50. Mármol, I.; Sánchez-de-Diego, C.; Pradilla Dieste, A.; Cerrada, E.; Rodriguez Yoldi, M.J. Colorectal carcinoma: A general overview and future perspectives in colorectal cancer. Int. J. Mol. Sci. 2017, 18, 197. [Google Scholar] [CrossRef] [Green Version]
  51. Rubinstein, M.R.; Baik, J.E.; Lagana, S.M.; Han, R.P.; Raab, W.J.; Sahoo, D.; Dalerba, P.; Wang, T.C.; Han, Y.W. Fusobacterium nucleatum promotes colorectal cancer by inducing Wnt/β-catenin modulator Annexin A1. EMBO Rep. 2019, 20, e47638. [Google Scholar] [CrossRef]
  52. Kollarcikova, M.; Kubasova, T.; Karasova, D.; Crhanova, M.; Cejkova, D.; Sisak, F.; Rychlik, I. Use of 16S rRNA gene sequencing for prediction of new opportunistic pathogens in chicken ileal and cecal microbiota. Poult. Sci. 2019, 98, 2347–2353. [Google Scholar] [CrossRef] [PubMed]
  53. Javed, S.; Gul, F.; Javed, K.; Bokhari, H. Helicobacter pullorum: An emerging zoonotic pathogen. Front. Microbiol. 2017, 8, 604. [Google Scholar] [CrossRef] [PubMed] [Green Version]
  54. Qin, M.; Long, F.; Wu, W.; Yang, D.; Huang, M.; Xiao, C.; Chen, X.; Liu, X.; Zhu, Y.Z. Hydrogen sulfide protects against DSS-induced colitis by inhibiting NLRP3 inflammasome. Free Radic. Biol. Med. 2019, 137, 99–109. [Google Scholar] [CrossRef] [PubMed]
  55. Fiorucci, S.; Orlandi, S.; Mencarelli, A.; Caliendo, G.; Santagada, V.; Distrutti, E.; Santucci, L.; Cirino, G.; Wallace, J.L. Enhanced activity of a hydrogen sulphide-releasing derivative of mesalamine (ATB-429) in a mouse model of colitis. Br. J. Pharmacol. 2007, 150, 996–1002. [Google Scholar] [CrossRef] [PubMed] [Green Version]
Figure 1. Histopathology of S. enteritidis-resistant and S. enteritidis-susceptible chicks. (a) Representative liver histopathology of S. enteritidis-resistant chicks (HE staining); (b) Representative liver histopathology of S. enteritidis-susceptible chicks (HE staining); (c) Representative spleen histopathology of S. enteritidis-resistant chicks (HE staining); (d) Representative spleen histopathology of S. enteritidis-susceptible chicks (HE staining). Original magnification, ×200. Black arrows indicate the lymphocytes, yellow arrows indicate the heterophilic cells, and red arrows indicate the lymphocyte nodules in liver tissue. Scale bar = 50 μm. (e) Liver histopathology score of S. enteritidis-resistant and -susceptible chicks, n = 8 per group, Result of significance test was p < 0.05 when marked *.
Microorganisms 09 01705 g001aMicroorganisms 09 01705 g001b
Figure 2. Relative expression of genes coding for tight junction proteins in the jejunum and inflammatory cytokines in cecal tonsil. (a) Gene expression levels of occludin, claudin, ZO-1, and MUC2 in the jejunum of chicks in group R and group S; (b) Gene expression levels of iNOS, IFNG, TNFA, IL1B, IL6, IL8, and IL10 in the cecal tonsil of chicks in group R and group S. Data are presented as means ± SEM (n = 8). The asterisk (*) indicates a significant difference between two groups (p < 0.05).
Microorganisms 09 01705 g002
Figure 3. Beta diversity analysis of cecal microbiota (n = 8). (a) Principal component analysis (PCA). (b) Non-metric multidimensional scaling (NMDS). (c) Unweighted pair-group method with arithmetic means (UPGMA) clustering tree structure. R = S. enteritidis-resistant chicks; S = S. enteritidis-susceptible chicks.
Microorganisms 09 01705 g003aMicroorganisms 09 01705 g003b
Figure 4. Changes in microbial composition and structure at the phylum and genus levels (n = 8). (a) Top 10 microbial populations at the phylum level. (b) Top 10 microbial populations at the genus level. S = selected S. enteritidis-susceptible chicks; R = selected S. enteritidis-resistant chicks. (c) Complex heatmap of the top 10 microbial populations at the phylum level.
Microorganisms 09 01705 g004aMicroorganisms 09 01705 g004b
Figure 5. Linear discriminant analysis effect size (LEfSe) identified the most differentially abundant taxa between group S (green bars) and group R (red bars). (a) Taxonomic cladogram obtained from LEfSe analysis of 16S rRNA gene sequences. Small circles and shading with different colors in the diagram represent the abundance of those taxa in the respective group. Green circles represent taxa enriched in group S (green legend); Red circles represent taxa enriched in group R (red legend); Yellow circles represent non-significant differences in abundance between two groups. The brightness of each circle is proportional to its effect size. (b) Taxa enriched in group S are indicated with a positive LDA score (green), and taxa enriched in group R have a negative LDA score (red). Only those taxa with an LDA value greater than 3 are shown.
Microorganisms 09 01705 g005
Table 1. Diet composition and nutrient levels (as-fed basis) from 1 to 9 d of age.
Ingredient%
Corn55.24
Soybean meal (46%)36.92
Soybean oil3.50
Limestone1.12
Calcium hydrogen phosphate2.10
Methionine0.28
Lysine (98%)0.22
NaCl0.30
Vitamin premix 10.03
Mineral premix 20.20
Choline chloride (70%)0.09
Total100.00
Nutrient levels (%) 3
ME (kcal/kg)2950
CP21.00
Ca1.00
Total phosphorus0.67
Nonphytate phosphorous0.45
Digestible Lys1.20
Digestible sulfur-containing amino acid0.85
Digestible Thr0.66
Digestible Trp0.22
1 Premix vitamin provided per kilogram of diet: Vitamin A (retinyl palmitate), 8000 IU; vitamin D3 (cholecalciferol), 1000 IU; vitamin E (D, L-α-tocopheryl acetate), 20 IU; vitamin K3 (menadione sodium bisulfate complex), 0.50 mg; vitamin B1, 2.00 mg; vitamin B2, 8.00 mg; vitamin B6, 3.50 mg; vitamin B12 (cobalamin), 10.00 μg; niacin, 35.00 mg; calcium pantothenic, 10.00 mg; folic acid, 0.55 mg; biotin, 0.18 mg. 2 Premix mineral provided per kilogram of diet: Fe, 80.00 mg; Mn, 100.00 mg; Zn, 80.00 mg; I, 0.70 mg; Se, 0.30 mg; Cu, 8.00 mg. 3 ME was a calculated value, whereas the other nutrient levels were measured values.
Table 2. Gene-specific primers for related genes.
GeneGenBank Accession No.Primer OrientationPrimer Sequence (5′→3′)Product Size (bp)
GAPDHNM_204305.1ForwardGCCCAGAACATCATCCCA137
ReverseCGGCAGGTCAGGTCAACA
iNOSNM_204961.1ForwardCCTGGAGGTCCTGGAAGAGT82
ReverseCCTGGGTTTCAGAAGTGGC
IFNGNM_205149.1ForwardCAAGCTCCCGATGAACGACTT162
ReverseAGTTGAGCACAGGAGGTCAT
TNFANM_204267.1ForwardCAGGACAGCCTATGCCAACAAG114
ReverseGGTTACAGGAAGGGCAACTCATC
IL1BNM_204524.1ForwardCCGAGGAGCAGGGACTTT133
ReverseAGGACTGTGAGCGGGTGT
IL6NM_204628.1ForwardTTTATGGAGAAGACCGTGAGG106
ReverseTGTGGCAGATTGGTAACAGAG
IL8NM_205498.1ForwardATGAACGGCAAGCTTGGAGCTG233
ReverseTCCAAGCACACCTCTCTTCCATCC
IL10NM_001004414.2ForwardGCTGAGGGTGAAGTTTGAG272
ReverseCAGGTGAAGAAGCGGTGA
occludinNM_205128.1ForwardTCATCGCCTCCATCGTCTAC141
ReverseTCTTACTGCGCGTCTTCTGG
claudinNM_001013611ForwardCTGATTGCTTCCAACCAG140
ReverseCAGGTCAAACAGAGGTACAAG
ZO-1XM_413773ForwardCTTCAGGTGTTTCTCTTCCTCCTC131
ReverseCTGTGGTTTCATGGCTGGATC
MUC2NM_001318434.1ForwardGTGAAGACCCTGATGAAA219
ReverseGTGAACACTGGCGAGAAT
Table 3. Body weight, tissue index 1, and Salmonella loads of S. enteritidis-susceptible and -resistant chicks 2.
ItemsGroup S 3Group R 3p-Value
BW (g)229.40 ± 7.47230.88 ± 5.470.875
Liver Index (%)0.043 ± 0.001 a0.038 ± 0.001 b0.006
Spleen Index (%)0.024 ± 0.0020.020 ± 0.0010.158
Liver Salmonella loads (log10CFU/g)2.750 ± 0.405 a1.152 ± 0.435 b0.018
Spleen Salmonella loads (log10CFU/g)4.784 ± 0.100 a2.491 ± 0.055 b<0.001
1 Tissue index: Percent of tissue weight relative to body weight. 2 Results are expressed as means ± SEM, with n = 8 per group.3 Group S = selected S. enteritidis-susceptible chicks; Group R = selected S. enteritidis-resistant chicks. a,b In the same row, values with different letters are significantly different between two groups (p < 0.05).
Table 4. Jejunum morphology of S. enteritidis-susceptible and -resistant chicks 1.
ItemsGroup S 2Group R 2p-Value
Villus height (μm)1084.62 ± 35.201125.93 ± 90.230.683
Crypt depth (μm)149.56 ± 7.48131.55 ± 16.280.348
Ratio of villus height-to-crypt depth7.32 ± 0.348.94 ± 0.750.090
Muscle thickness (μm)117.86 ± 7.09118.02 ± 14.370.992
1 Results are expressed as means ± SEM, with n = 8 per group. 2 Group S = selected S. enteritidis-susceptible chicks; Group R = selected S. enteritidis-resistant chicks.
Table 5. Genera with significant differences between S. enteritidis-susceptible and -resistant chicks 1.
TaxaGroup S (%) 2Group R (%) 2p-Value
Fusobacterium0.5168 ± 0.9028 a0.1782 ± 0.3837 b0.043
Helicobacter0.6998 ± 0.6460 a0.3238 ± 0.5453 b0.028
Butyricicoccus0.8835 ± 0.5888 a0.3974 ± 0.4655 b0.050
Bryobacter0.1440 ± 0.1037 a0.0426 ± 0.0371 b0.034
Acidothermus0.1222 ± 0.0886 a0.0224 ± 0.0251 b0.026
unidentified_Chloroplast0.0637 ± 0.0814 a0.0256 ± 0.0469 b0.039
NK4A214_group0.0560 ± 0.0504 a0.0214 ± 0.0243 b0.040
Marvinbryantia0.0685 ± 0.0414 a0.0278 ± 0.0272 b0.046
Burkholderia-Caballeronia-Paraburkholderia0.0525 ± 0.0394 a0.0112 ± 0.0166 b0.024
Granulicella0.0458 ± 0.0352 a0.0096 ± 0.0130 b0.035
Puia0.0218 ± 0.0228 a0.0035 ± 0.0056 b0.048
Oribacterium0.0013 ± 0.0036 b0.0102 ± 0.0162 a0.028
unidentified_IMCC262560.0182 ± 0.0134 a0.0042 ± 0.0067 b0.037
Actinospica0.0102 ± 0.0092 a0.0013 ± 0.0024 b0.021
Herbinix0 b0.0064 ± 0.0079 a0.013
Dyella0.0074 ± 0.0079 a0.0010 ± 0.0019 b0.037
Nocardia0.0061 ± 0.0056 a0.0006 ± 0.0018 b0.017
Papillibacter0.0003 ± 0.0009 b0.0041 ± 0.0034 a0.034
1 Results are expressed as means ± SEM, with n = 8 per group. 2 Group S = selected S. enteritidis-susceptible chicks; Group R = selected S. enteritidis-resistant chicks. a,b In the same row, values with different letters are significantly different between 2 groups (p < 0.05).
Publisher’s Note: MDPI stays neutral with regard to jurisdictional claims in published maps and institutional affiliations.

