
Studying Plant–Insect Interactions through the Analyses of the Diversity, Composition, and Functional Inference of Their Bacteriomes
 , and
, and 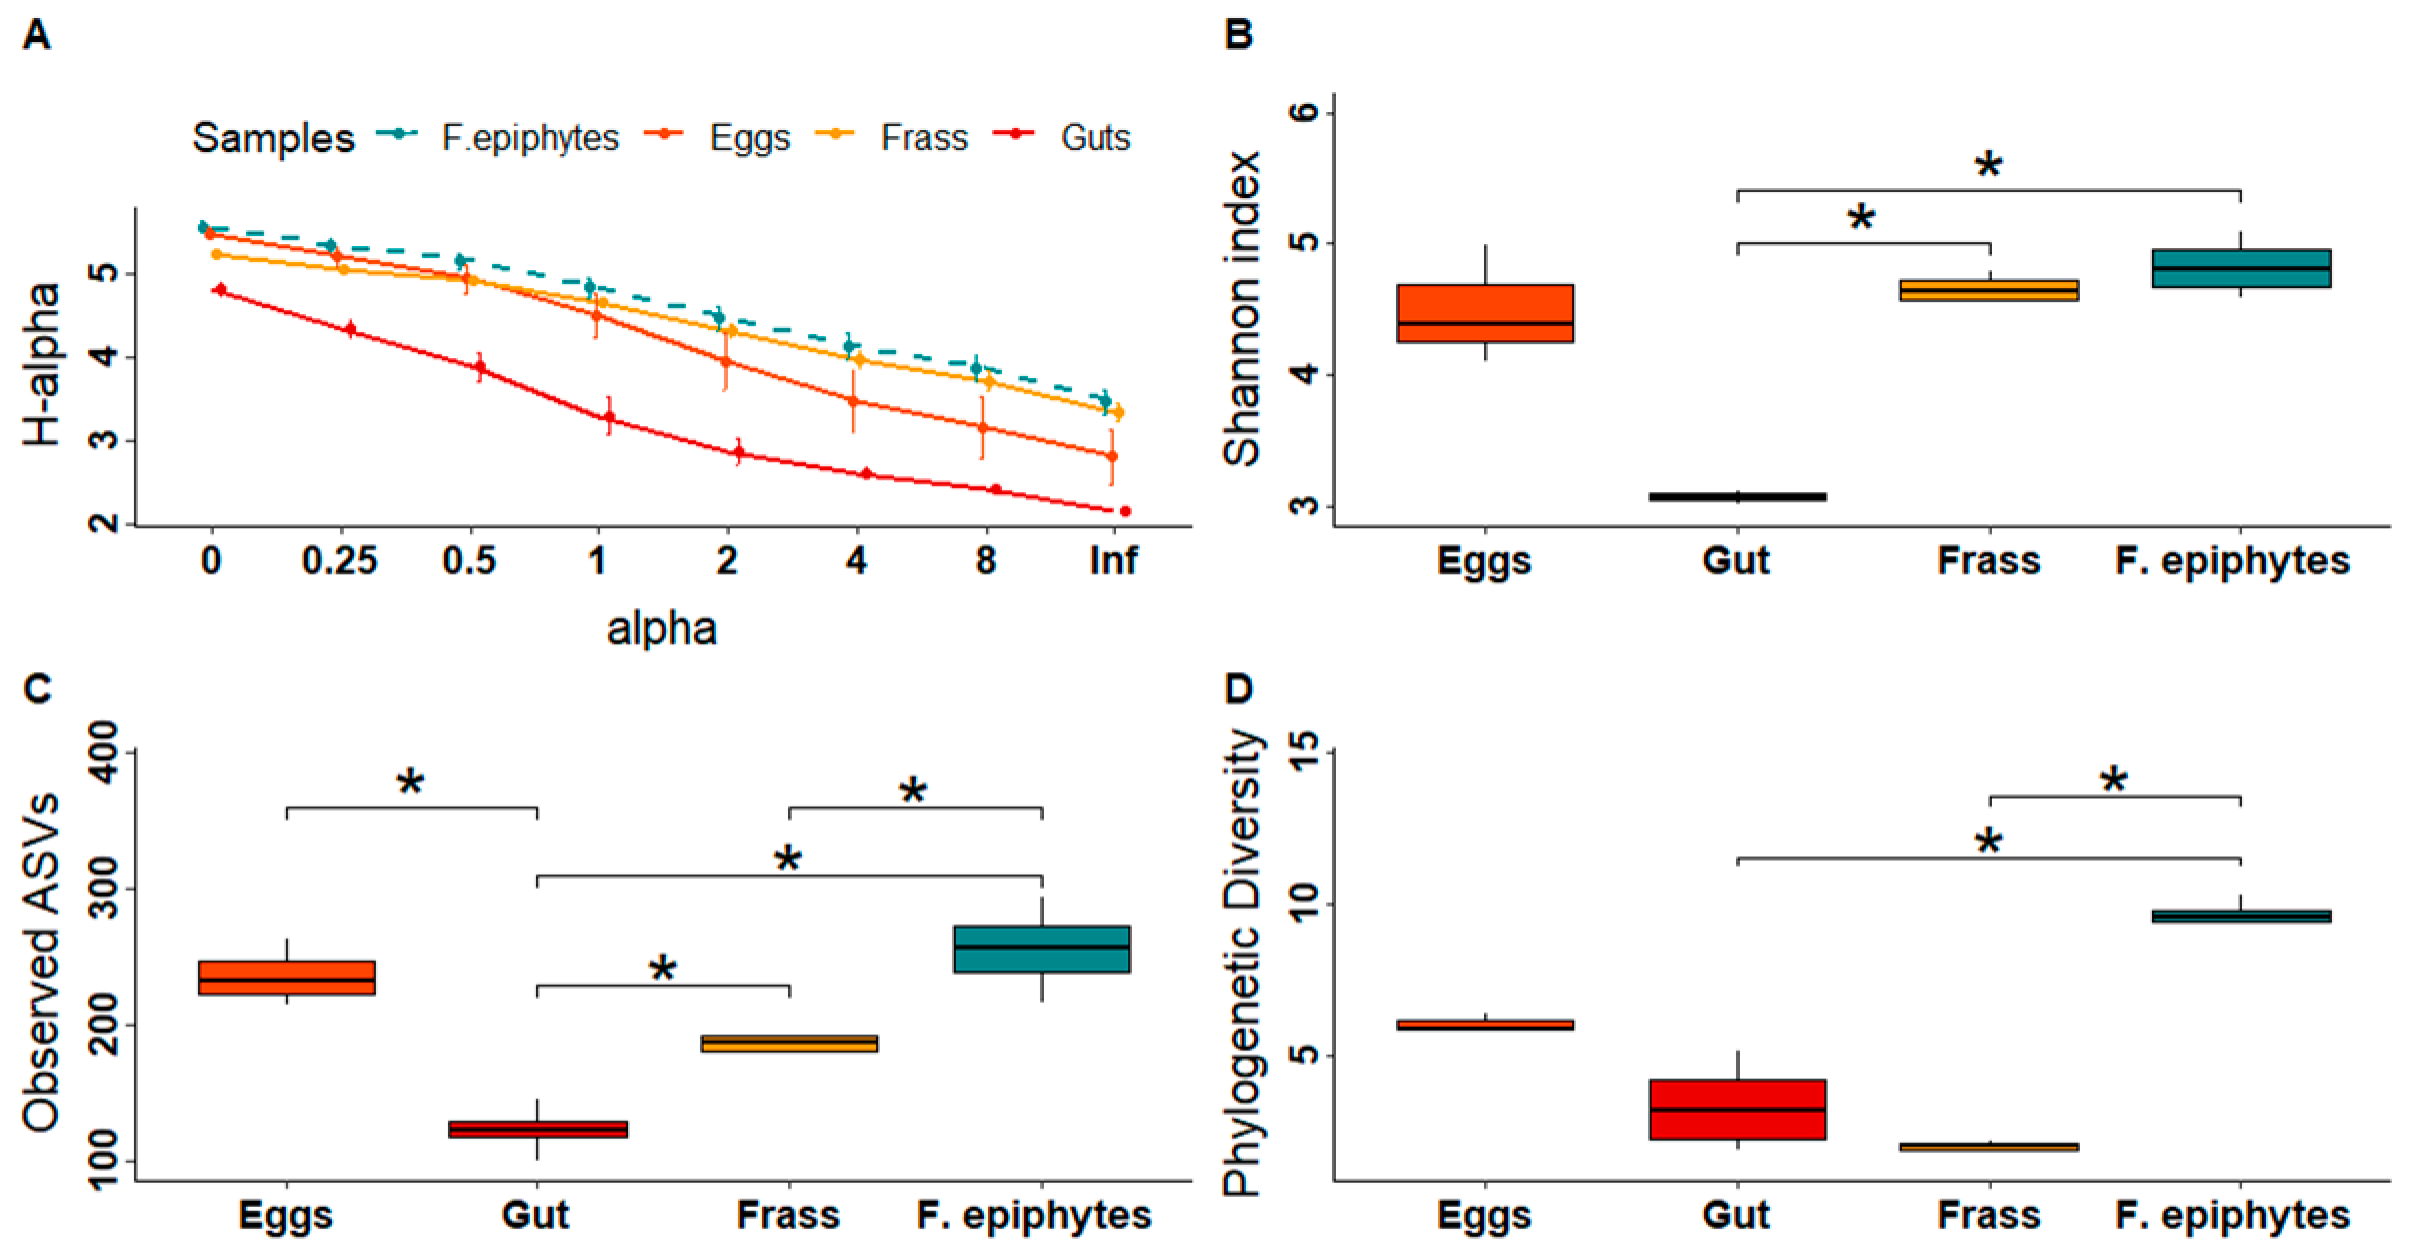
Abstract
:1. Introduction
2. Materials and Methods
2.1. Study System and Sample Collection
2.2. DNA Extraction and Generation of 16S rRNA Amplicons
2.3. Data Analyses
3. Results
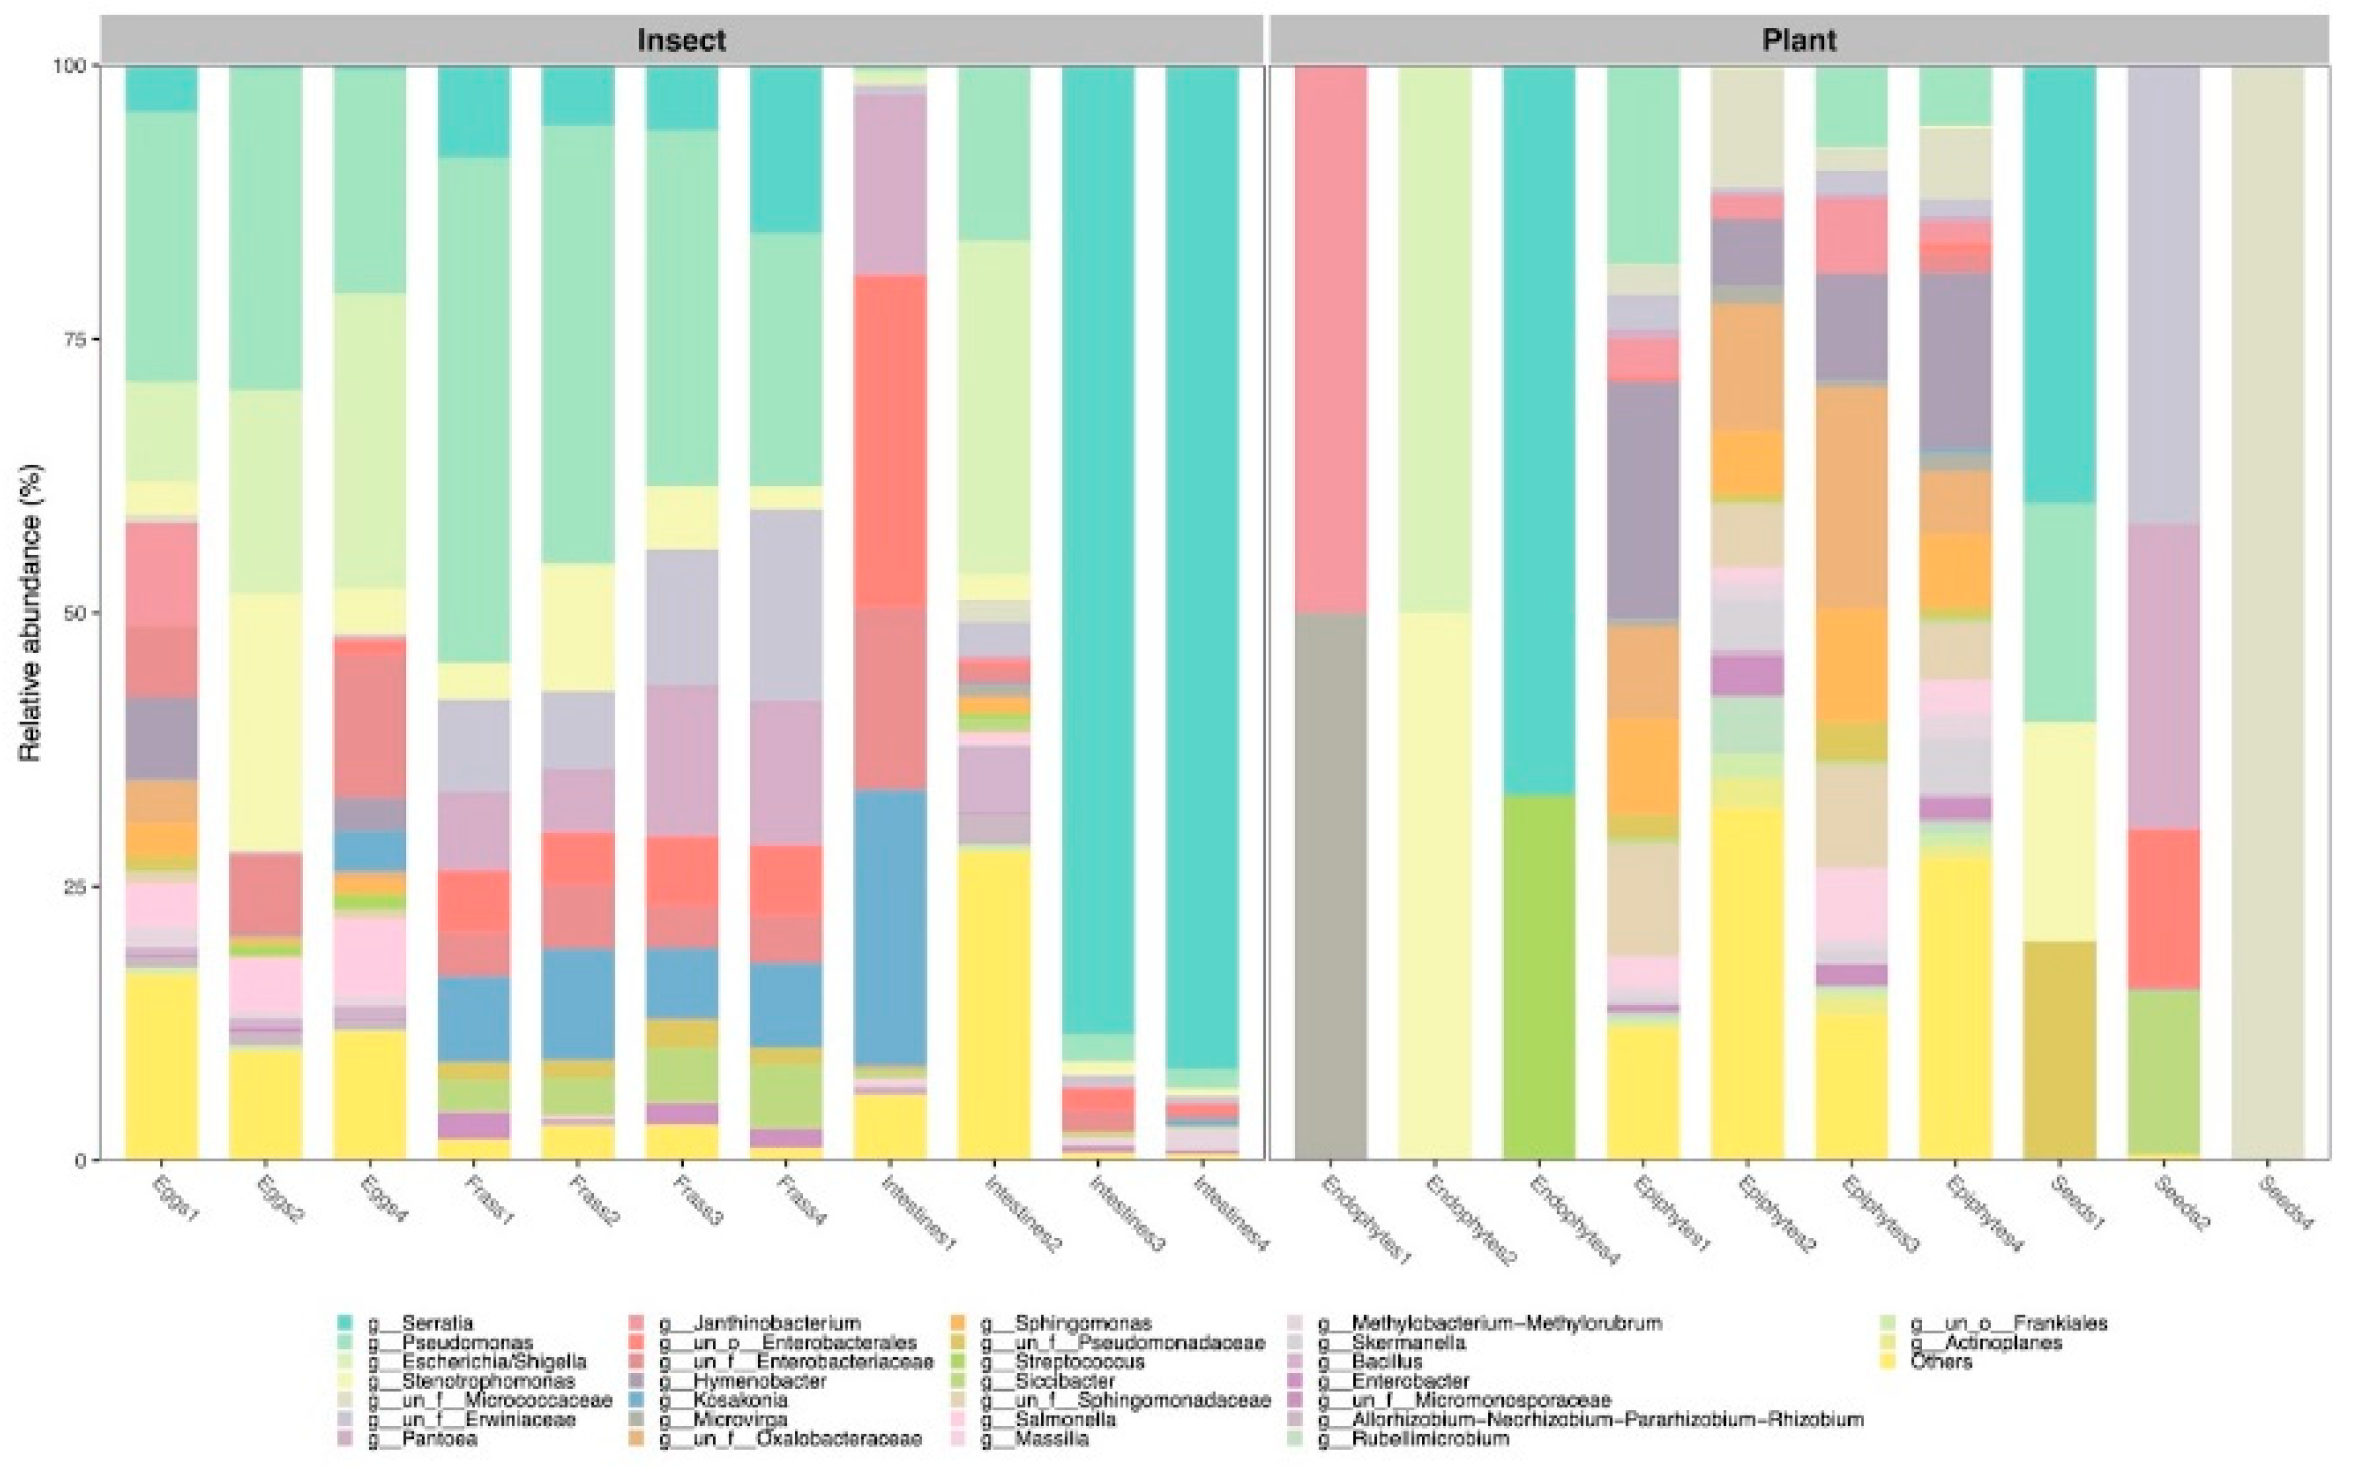
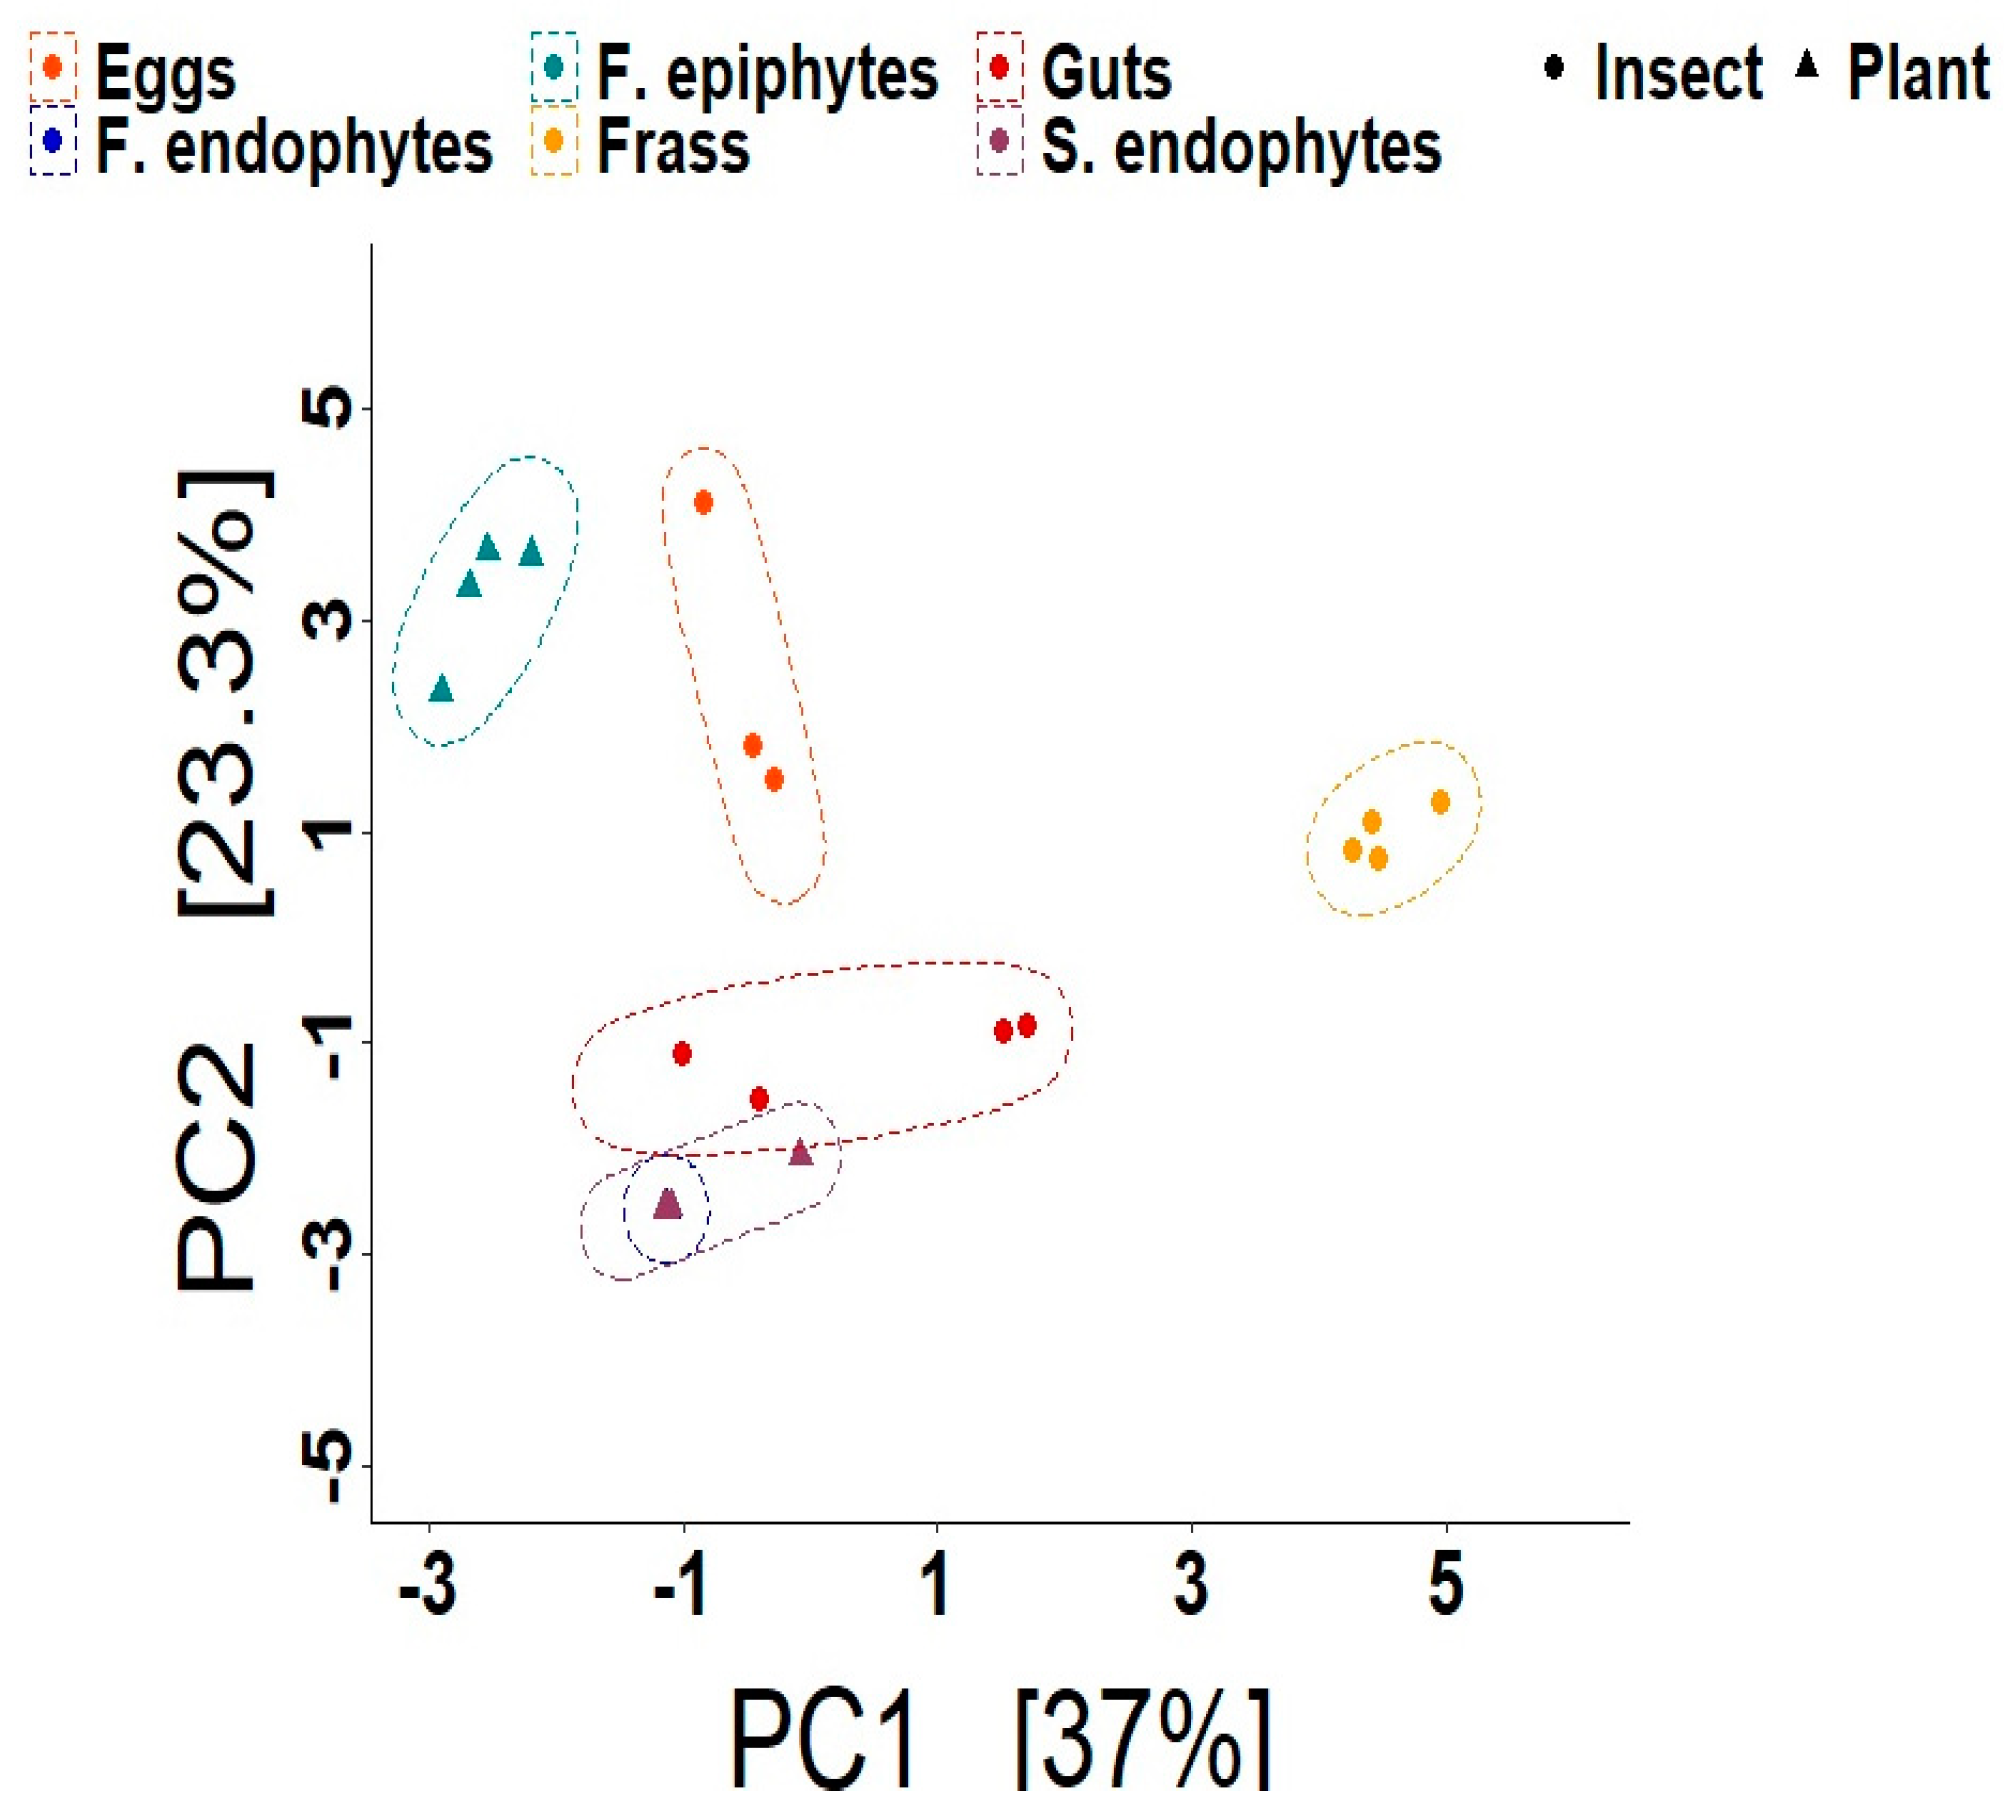
3.1. Composition and Diversity of the Bacteriomes
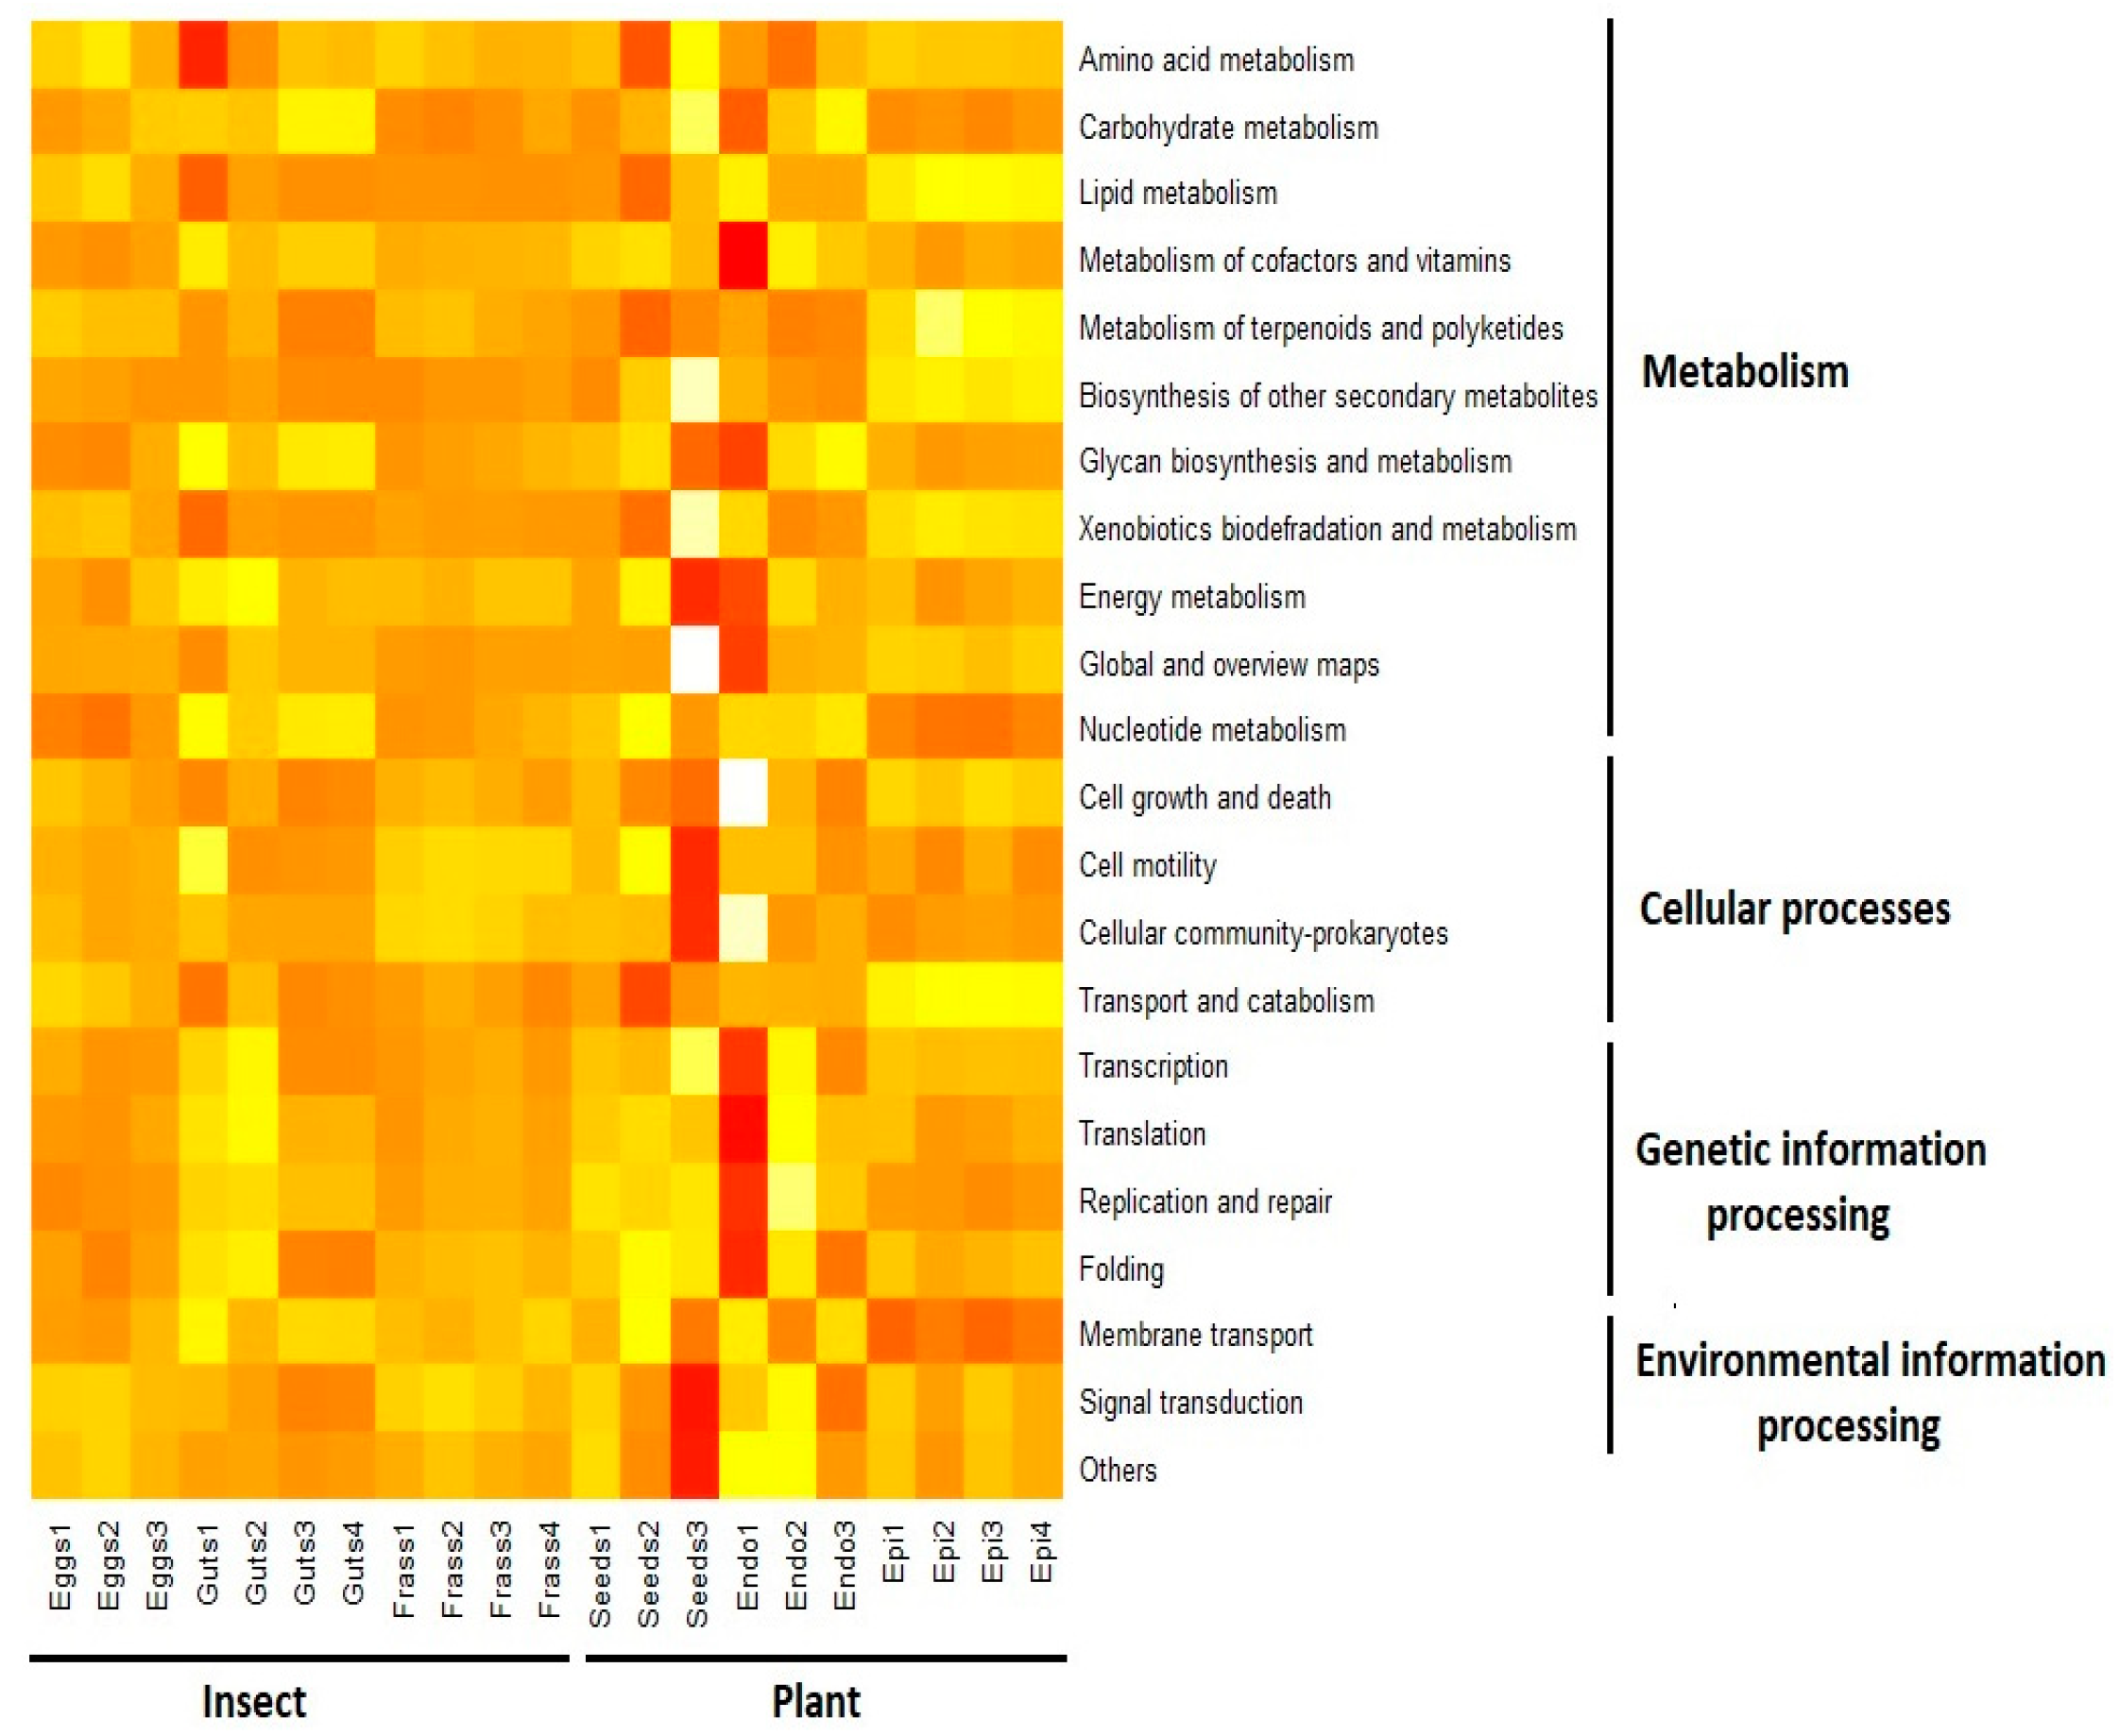
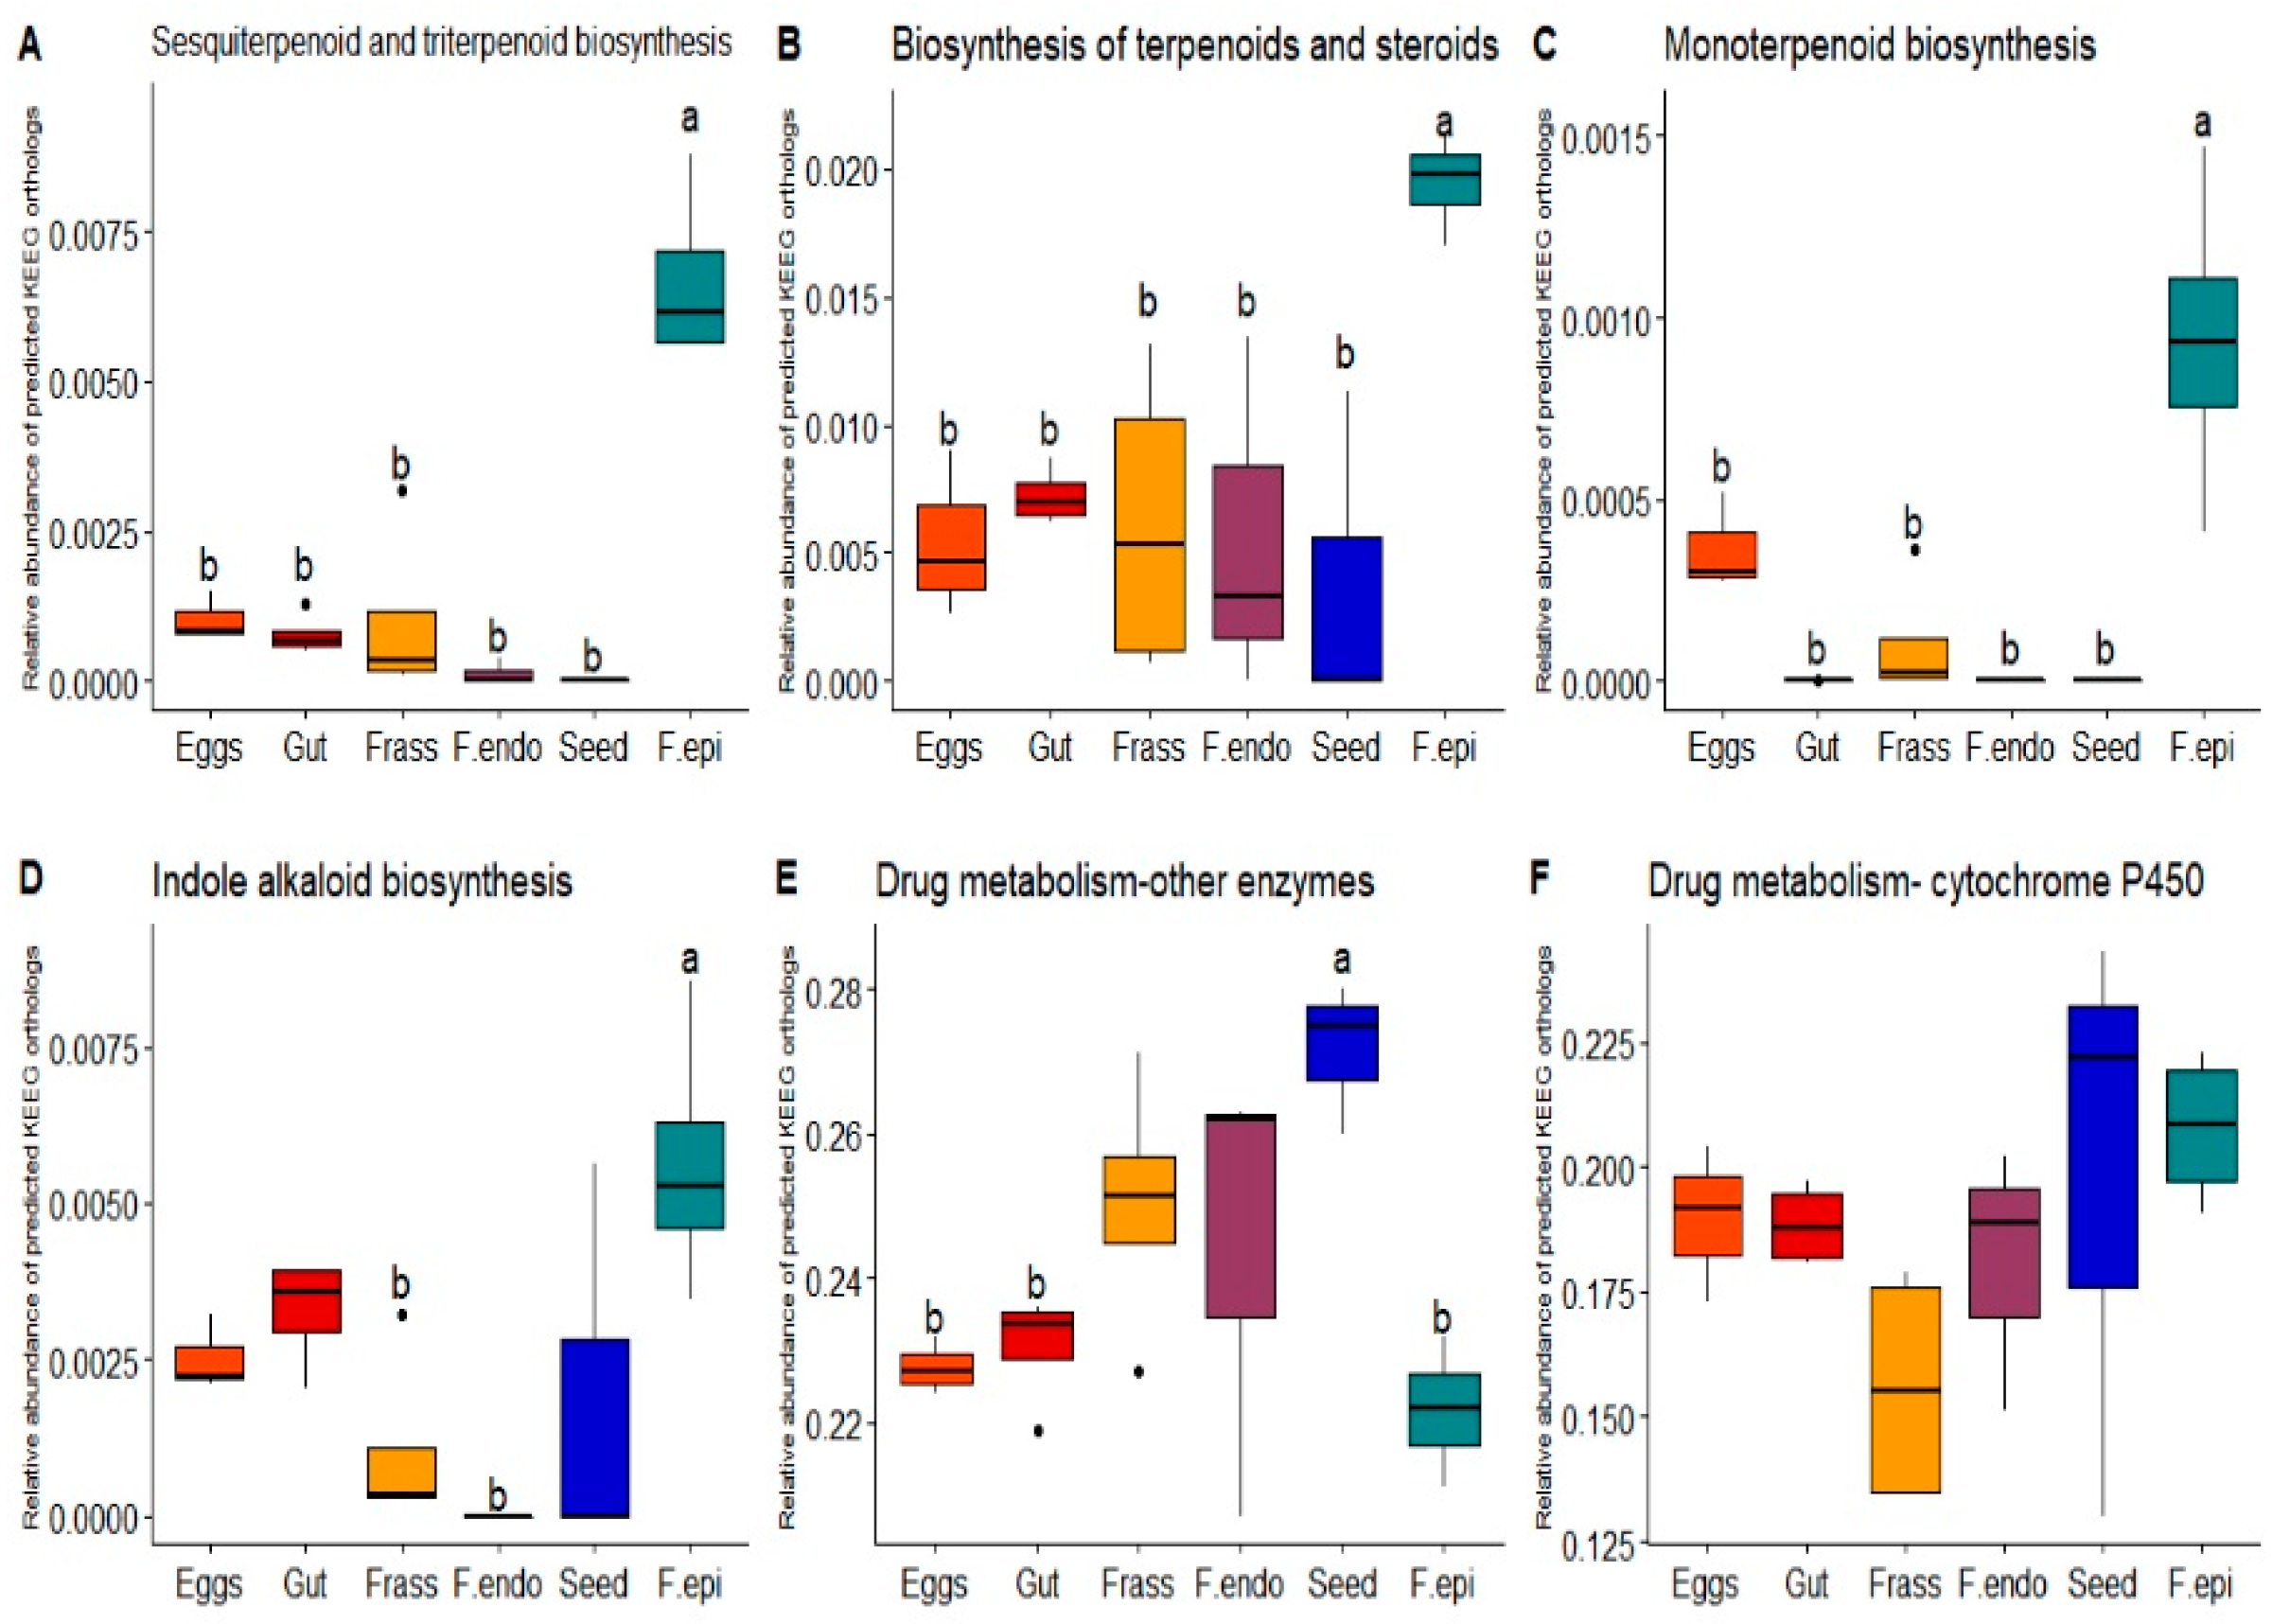
3.2. Functional Inference of the ASVs Found in the Samples
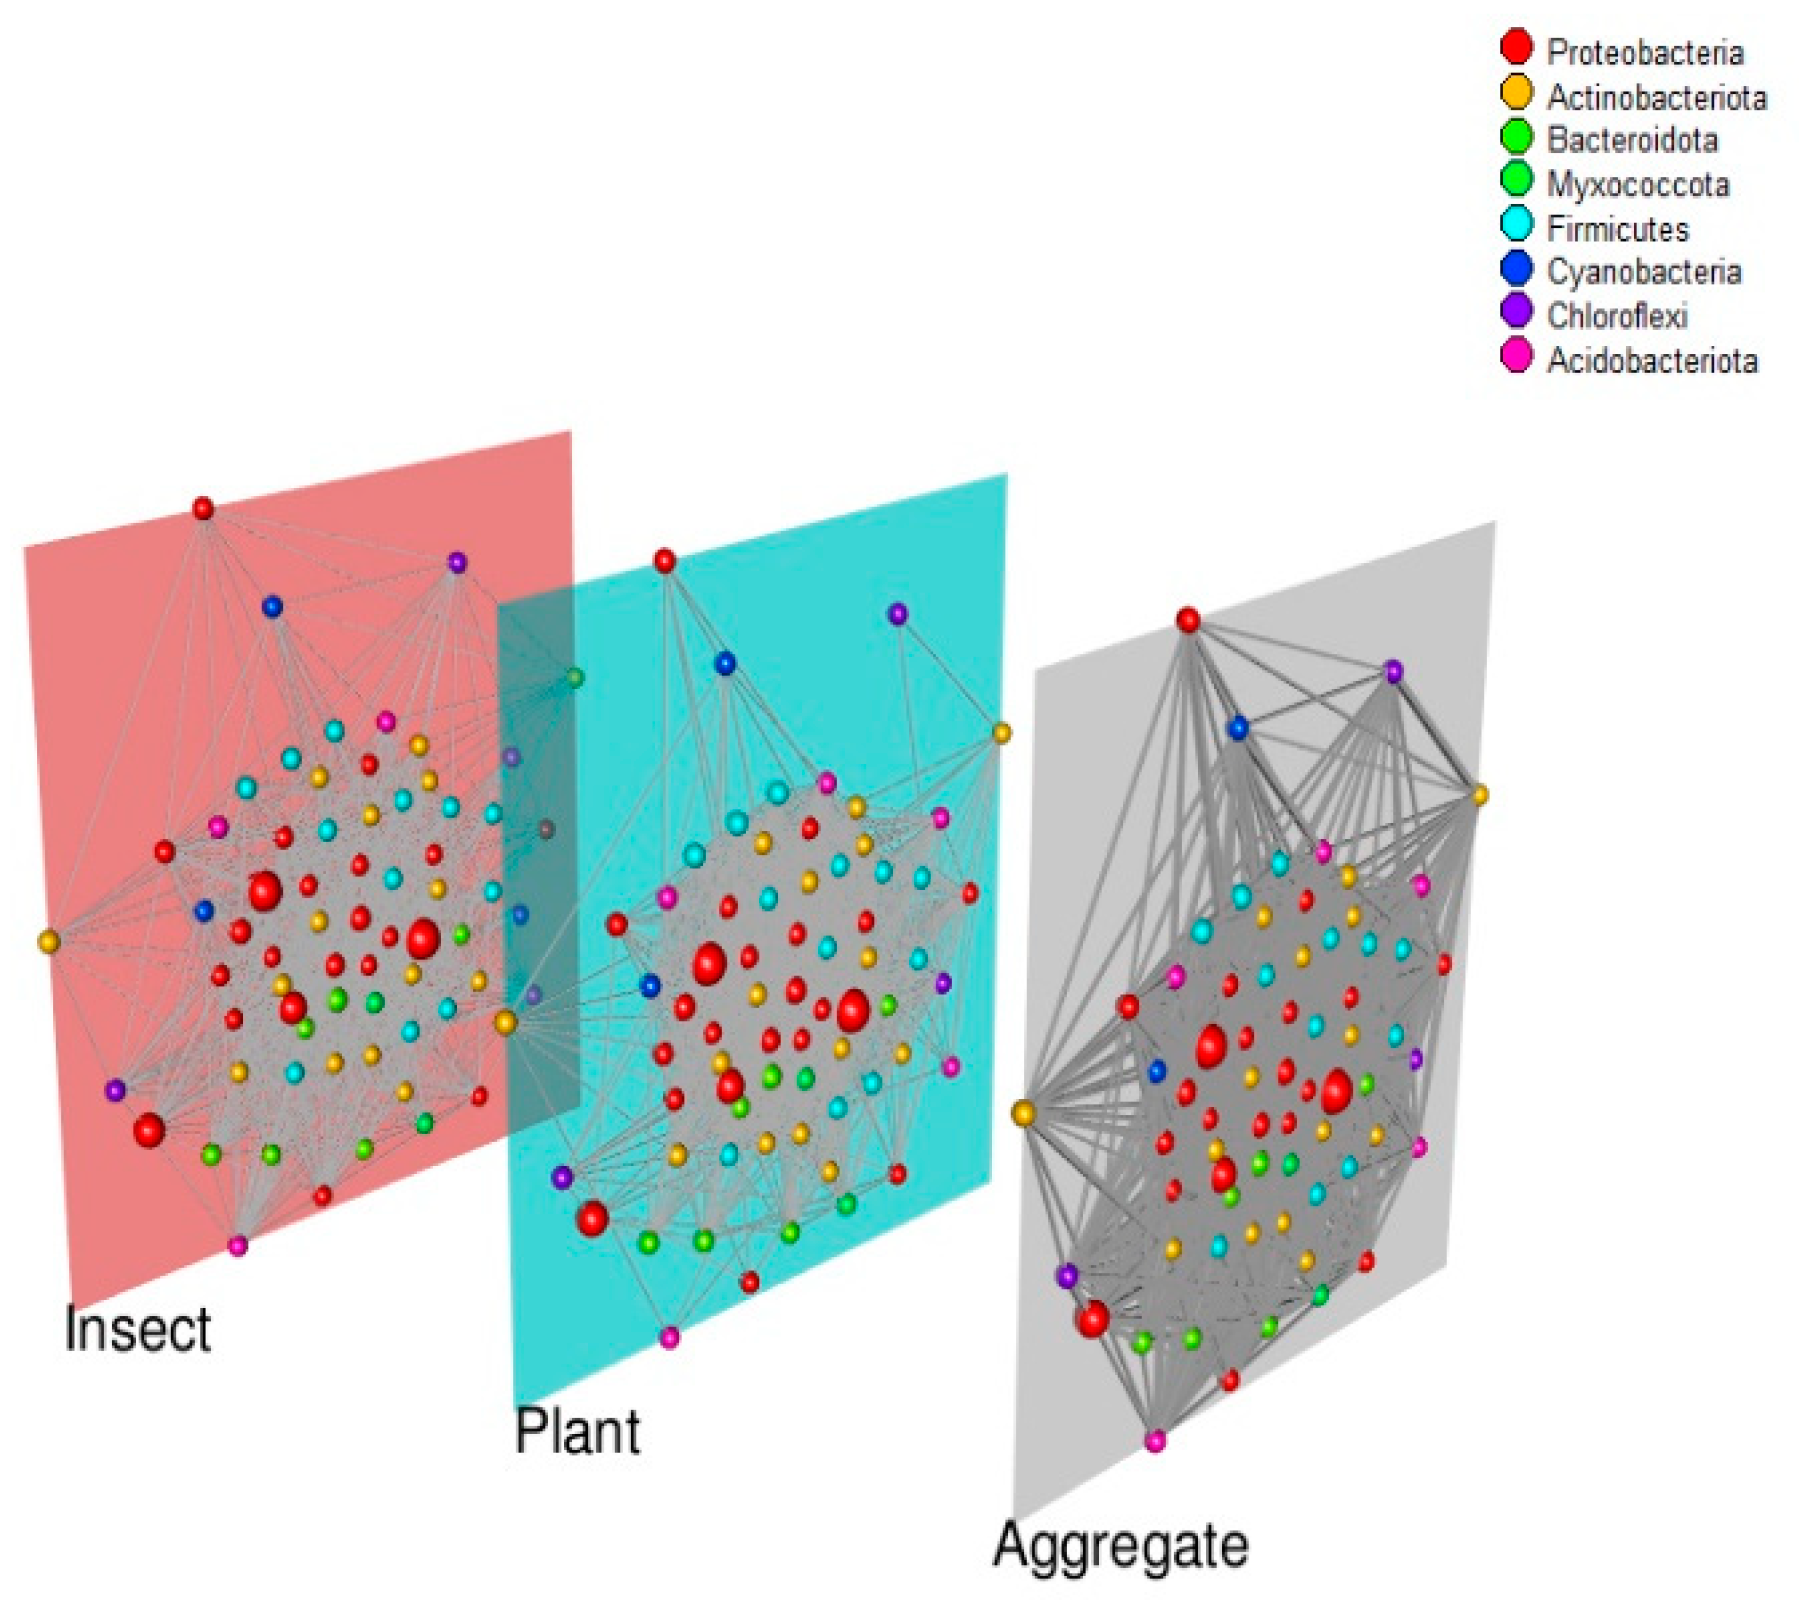
3.3. Co-Abundance Networks
4. Discussion
4.1. The Composition and Diversity of the Plant and Insect Bacteriomes
4.2. Functional Inferences of the ASVs Found in the Samples
4.3. Co-Abundance Networks
5. Conclusions
Supplementary Materials
Author Contributions
Funding
Data Availability Statement
Acknowledgments
Conflicts of Interest
References
- Felton, G.W.; Tumlinson, J.H. Plant-insect dialogs: Complex interactions at the plant-insect interface. Curr. Opin. Plant Biol. 2008, 11, 457–463. [Google Scholar] [CrossRef] [PubMed]
- Sugio, A.; Dubreuil, G.; Giron, D.; Simon, J.C. Plant-insect interactions under bacterial influence: Ecological implications and underlying mechanisms. J. Exp. Bot. 2015, 66, 467–478. [Google Scholar] [CrossRef] [PubMed] [Green Version]
- Mason, C.J. Complex Relationships at the Intersection of Insect Gut Microbiomes and Plant Defenses. J. Chem. Ecol. 2020, 46, 793–807. [Google Scholar] [CrossRef] [PubMed]
- Mayoral-Peña, Z.; Álvarez-Martínez, R.; Fornoni, J.; Garrido, E. The Extended Microbiota: How Microbes Shape Plant-Insect Interactions; Springer: Berlin/Heidelberg, Germany, 2020; pp. 135–146. [Google Scholar] [CrossRef]
- Biere, A.; Tack, A.J.M. Evolutionary adaptation in three-way interactions between plants, microbes and arthropods. Func. Ecol. 2013, 27, 646–660. [Google Scholar] [CrossRef] [Green Version]
- Wielkopolan, B.; Obrępalska-Stęplowska, A. Three-way interaction among plants, bacteria, and coleopteran insects. Planta 2016, 244, 313–332. [Google Scholar] [CrossRef] [Green Version]
- Grunseich, J.M.; Thompson, M.N.; Aguirre, N.M.; Helms, A.M. The role of plant-associated microbes in mediating host-plant selection by insect herbivores. Plants 2020, 9, 6. [Google Scholar] [CrossRef] [Green Version]
- Mason, C.J.; Jones, A.G.; Felton, G.W. Co-option of microbial associates by insects and their impact on plant-folivore interactions. Plant Cell Environ. 2019, 42, 1078–1086. [Google Scholar] [CrossRef]
- Lindow, S.E.; Brandl, M.T. Microbiology of the Phyllosphere MINIREVIEW Microbiology of the Phyllosphere. App. Environ. Microbiol. 2003, 69, 1875–1883. [Google Scholar] [CrossRef] [Green Version]
- Engel, P.; Moran, N.A. The gut microbiota of insects—Diversity in structure and function. FEMS Microbiol. Rev. 2013, 37, 699–735. [Google Scholar] [CrossRef] [Green Version]
- Dastogeer, K.M.G.; Tumpa, F.H.; Sultana, A.; Akter, M.A.; Chakraborty, A. Plant microbiome—An account of the factors that shape community composition and diversity. Curr. Plant Biol. 2020, 23, 100161. [Google Scholar] [CrossRef]
- Hopson, L.M.; Singleton, S.S.; David, J.A.; Basuchoudhary, A.; Prast-Nielsen, S.; Klein, P.; Sen, S.; Mazumder, R. Bioinformatics and machine learning in gastrointestinal microbiome research and clinical application. In Progress in Molecular Biology and Translational Science; Elsevier Inc.: Amsterdam, The Netherlands, 2020; Volume 176, pp. 141–178. [Google Scholar]
- Newton, A.C.; Gravouil, C.; Fountaine, J.M. Managing the ecology of foliar pathogens: Ecological tolerance in crops. Ann. Appl. Biol. 2010, 157, 343–359. [Google Scholar] [CrossRef]
- Carvalho, S.D.; Castillo, J.A. Influence of Light on Plant–Phyllosphere Interaction. Front. Plant Sci. 2018, 9, 1482. [Google Scholar] [CrossRef] [PubMed] [Green Version]
- Rosenberg, E.; Zilber-Rosenberg, I. Microbes Drive Evolution of Animals and Plants: The Hologenome Concept. ASM 2016, 7, e01395-15. [Google Scholar] [CrossRef] [PubMed] [Green Version]
- Hannula, S.E.; Zhu, F.; Heinen, R.; Bezemer, T.M. Foliar-feeding insects acquire microbiomes from the soil rather than the host plant. Nat. Commun. 2019, 10, 1254. [Google Scholar] [CrossRef] [Green Version]
- Višňovska, D.; Pyszko, P.; Šigut, M.; Kostovčik, M.; Kolařik, M.; Kotaskova, N.; Drozd, P. Caterpillar gut and host plant phylloplane mycobiomes differ: A new perspective on fungal involvement in insect guts. FEMS Microbiol. Ecol. 2020, 96, fiaa116. [Google Scholar] [CrossRef]
- Mogouong, J.; Constant, P.; Legendre, P.; Guertin, C. The phyllosphere microbiome of host trees contributes more than leaf phytochemicals to variation in the Agrilus planipennis Fairmaire gut microbiome structure. Sci. Rep. 2021, 11, 1–15. [Google Scholar] [CrossRef]
- Zhang, S.; Shu, J.; Xue, H.; Zhang, W.; Zhang, Y.; Liu, Y.; Fang, L.; Wang, Y.; Wang, H. The gut microbiota in camellia weevils are influenced by plant secondary metabolites and contribute to saponin degradation. MSystems 2020, 5, e00692-19. [Google Scholar] [CrossRef] [Green Version]
- Santos-García, D.; Mestre-Rincón, N.; Zchori-Fein, E.; Morin, S. Inside out: Microbiota dynamics during host-plant adaptation of whiteflies. ISME J. 2020, 14, 847–856. [Google Scholar] [CrossRef] [Green Version]
- Tsuchida, T.; Koga, R.; Fukatsu, T. Host plant specialization governed by facultative symbiont. Science 2004, 303, 1989. [Google Scholar] [CrossRef]
- Salem, H.; Kirsch, R.; Pauchet, Y.; Berasategui, A.; Fukumori, K.; Moriyama, M.; Cripps, M.; Windsor, D.; Fakatsu, T.; Gerardo, N.M. Symbiont digestive range reflects host plant breadth in herbivorous beetles. Curr. Biol. 2020, 30, 2875–2886. [Google Scholar] [CrossRef]
- Broderick, N.A.; Raffa, K.F.; Goodman, R.M.; Handelsman, J. Census of the bacterial community of the gypsy moth larval midgut by using culturing and culture-independent methods. Appl. Environ. Microbiol. 2004, 70, 293–300. [Google Scholar] [CrossRef] [PubMed] [Green Version]
- Priya, N.G.; Ojha, A.; Kajla, M.K.; Raj, A.; Rajagopal, R. Host plant induced variation in gut bacteria of Helicoverpa armigera. PLoS ONE 2012, 7, e30768. [Google Scholar] [CrossRef] [Green Version]
- Mason, C.J.; Raffa, K.F. Acquisition and structuring of midgut bacterial communities in gypsy moth (Lepidoptera: Erebidae) larvae. Environ. Entomol. 2014, 43, 595–604. [Google Scholar] [CrossRef] [PubMed]
- Jones, A.G.; Mason, C.J.; Felton, G.W.; Hoover, K. Host plant and population source drive diversity of microbial gut communities in two polyphagous insects. Sci. Rep. 2019, 9, 2792. [Google Scholar] [CrossRef] [PubMed] [Green Version]
- Dillon, R.J.; Dillon, V.M. The gut bacteria of insects: Nonpathogenic interactions. Annu. Rev. Entomol. 2004, 49, 71–92. [Google Scholar] [CrossRef] [PubMed]
- Mason, C.J.; Couture, J.J.; Raffa, K.F. Plant-associated bacteria degrade defense chemicals and reduce their adverse effects on an insect defoliator. Oecologia 2014, 175, 901–910. [Google Scholar] [CrossRef]
- Shikano, I.; Olson, G.L.; Cory, J.S. Impact of non-pathogenic bacteria on insect disease resistance: Importance of ecological context. Ecol. Entomol. 2015, 40, 620–628. [Google Scholar] [CrossRef]
- Yoon, S.A.; Harrison, J.G.; Philbin, C.S.; Dodson, C.D.; Jones, D.M.; Wallace, I.S.; Forister, M.L.; Smilanich, A.M. Host plant-dependent effects of microbes and phytochemistry on the insect immune response. Oecologia 2019, 191, 141–152. [Google Scholar] [CrossRef]
- Itoh, H.; Tago, K.; Hayatsu, M.; Kikuchi, Y. Detoxifying symbiosis: Microbe-mediated detoxification of phytotoxins and pesticides in insects. Nat. Prod. Rep. 2018, 35, 434–454. [Google Scholar] [CrossRef]
- Gupta, A.; Nair, S. Dynamics of insect-microbiome interaction influence host and microbial symbiont. Front. Microbiol. 2020, 11, 1357. [Google Scholar] [CrossRef]
- Lü, J.; Guo, W.; Chen, S.; Guo, M.; Qiu, B.; Yang, C.; Lian, T.; Pan, H. Host plants influence the composition of the gut bacteria in Henosepilachna vigintioctopunctata. PLoS ONE 2019, 14, e0224213. [Google Scholar] [CrossRef] [PubMed] [Green Version]
- Robinson, C.J.; Schloss, P.; Ramos, Y.; Raffa, K.; Handelsman, J. Robustness of the bacterial community in the cabbage white butterfly larval midgut. Microb. Ecol. 2010, 59, 199–211. [Google Scholar] [CrossRef] [PubMed] [Green Version]
- Blankenchip, C.L.; Michels, D.E.; Braker, H.E.; Goffredi, S.K. Diet breadth and exploitation of exotic plants shift the core microbiome of Cephaloleia, a group of tropical herbivorous beetles. PeerJ 2018, 5. [Google Scholar] [CrossRef] [Green Version]
- Leite-Mondin, M.; DiLegge, M.J.; Manter, D.K.; Weir, T.L.; Silva-Filho, M.C.; Vivanco, J.M. The gut microbiota composition of Trichoplusia ni is altered by diet and may influence its polyphagous behavior. Sci. Rep. 2022, 11, 1–16. [Google Scholar] [CrossRef]
- Garcia, J.; Escanuela, M.; Bhat, S.; Lampert, E. The Trichoplusia ni gut microbiome and its derivation from the Phyllosphere of Its food plants. Ga. J. Sci. 2020, 78, 9. [Google Scholar]
- Frago, E.; Dicke, M.; Godfray, H.C.J. Insect symbionts as hidden players in insect-plant interactions. TREE 2012, 27, 705–711. [Google Scholar] [CrossRef]
- Humphrey, P.T.; Nguyen, T.T.; Villalobos, M.M.; Whiteman, N.K. Diversity and abundance of phyllosphere bacteria are linked to insect herbivory. Mol. Ecol. 2014, 23, 1497–1515. [Google Scholar] [CrossRef]
- Humphrey, P.T.; Whiteman, N.K. Insect herbivory reshapes a native leaf microbiome. Nat. Ecol. Evol. 2020, 26, 221–229. [Google Scholar] [CrossRef]
- Caspi-Fluger, A.; Inbar, M.; Mozes-Daube, N.; Katzir, N.; Portnoy, V.; Belausov, E.; Hunter, M.S.; Zchori-Fein, E. Horizontal transmission of the insect symbiont Rickettsia is plant-mediated. Proc. Biol. Sci. 2012, 279, 1791–1796. [Google Scholar] [CrossRef] [Green Version]
- Pons, I.; Renoz, F.; Noël, C.; Hance, T. Circulation of the cultivable symbiont Serratia symbiotica in aphids is mediated by plants. Front. Microbiol. 2019, 10, 764. [Google Scholar] [CrossRef]
- Kaiser, W.; Huguet, E.; Casas, J.; Commin, C.; Giron, D. Plant green-island phenotype induced by leaf-miners is mediated by bacterial symbionts. Proc. R. Soc. B 2010, 277, 2311–2319. [Google Scholar] [CrossRef] [PubMed] [Green Version]
- Wang, J.; Chung, S.H.; Peiffer, M.; Rosa, C.; Hoover, K.; Zeng, R. Herbivore oral secreted bacteria trigger distinct defense responses in preferred and non-preferred host plants. J. Chem. Ecol. 2016, 42, 463–474. [Google Scholar] [CrossRef] [PubMed]
- Chung, S.H.; Scully, E.D.; Peiffer, M.; Geib, S.M.; Rosa, C.; Hoover, K.; Felton, G.W. Host plant species determine symbiotic bacterial communities mediating suppression of plant defenses. Sci. Rep. 2017, 7, 39690. [Google Scholar] [CrossRef] [PubMed] [Green Version]
- Lilley, A.K.; Hails, R.S.; Cory, J.S.; Bailey, M.J. The dispersal and establishment of pseudomonas populations in the phyllosphere of sugar beet by phytophagous caterpillars. FEMS Microbiol. Ecol. 1997, 24, 151–157. [Google Scholar] [CrossRef]
- Chrostek, E.; Pelz-Stelinski, K.; Hurst, G.D.D.; Hughes, G.L. Horizontal transmission of intracellular insect symbionts via plants. Front. Microbiol. 2017, 8, 2237. [Google Scholar] [CrossRef] [PubMed] [Green Version]
- Bustos-Segura, C.E. Estudio de los cambios evolutivos en la resistencia contra la herbivoría en una población natural de la planta anual Datura stramonium, y sus consecuencias para el herbívoro. Master’s Thesis, Universidad Autónoma de México, Mexico City, México, 2011. [Google Scholar]
- Hernández-Cumplido, J. Ecología de la interacción tritrófica de Datura stramoniu-Trichobaris sp.-parasitoides. Master’s Thesis, Universidad Autónoma de México, Mexico City, México, 2009. [Google Scholar]
- Desgarennes, D.; Garrido, E.; Torres-Gomez, M.J.; Peña-Cabriales, J.J.; Partida-Martinez, L.P. Diazotrophic potential among bacterial communities associated with wild and cultivated Agave species. FEMS Microbiol. Ecol. 2014, 90, 844–857. [Google Scholar] [CrossRef] [Green Version]
- Karpen, G.H. Preparation of high-molecular-weight DNA from Drosophila embryos. Cold Spring Harb. Protoc. 2009, 7, pdb.prot5254. [Google Scholar] [CrossRef]
- Fiedorová, K.; Radvanský, M.; Němcová, E.; Grombiříková, H.; Bosák, J.; Černochová, J.M.; Lexa, S.; Smajs, D.; Freiberger, T. The impact of DNA extraction methods on stool bacterial and fungal microbiota community recovery. Front. Microbiol. 2019, 10, 821. [Google Scholar] [CrossRef] [Green Version]
- R Core Team. R: A Language and Environment for Statistical Computing; R Foundation for Statistical Computing: Vienna, Austria, 2020; Available online: https://www.R-project.org/ (accessed on 11 November 2022).
- Callahan, B.J.; McMurdie, P.J.; Rosen, M.J.; Han, A.W.; Johnson, A.J.A.; Holmes, S.P. DADA2: High-resolution sample inference from Illumina amplicon data. Nat. Methods 2016, 13, 581–583. [Google Scholar] [CrossRef] [Green Version]
- Quast, C.; Pruesse, E.; Yilmaz, P.; Gerken, J.; Schweer, T.; Yarza, P.; Glöckner, F.O. The SILVA ribosomal RNA gene database project: Improved data processing and web-based tools. Nucl. Acids Res. 2013, 41, D590–D596. [Google Scholar] [CrossRef]
- Yilmaz, P.; Parfrey, L.W.; Yarza, P.; Gerken, J.; Pruesse, E.; Quast, C.; Glöckner, F.O. The SILVA and "All-species Living Tree Project (LTP)" taxonomic frameworks. Nucl. Acids Res. 2014, 42, D643–D648. [Google Scholar] [CrossRef] [PubMed] [Green Version]
- Oksanen, J.; Blanchet, F.G.; Friendly, M.; Kindt, R.; Legendre, P.; McGlinn, D. Vegan: Community Ecology Package. R package Version 2.5-5. 2020. Available online: https://cran.r-project.org/web/packages/vegan/index.html (accessed on 11 November 2022).
- Wickham, H. ggplot2: Elegant Graphics for Data Analysis; Springer: New York, NY, USA, 2016; pp. 1–260. [Google Scholar]
- Masisi, L.; Nelwamondo, V.; Marwala, T. The use of entropy to measure structural diversity. In Proceedings of the IEEE International Conference on Computational Cybernetics, Stara Lesna, Slovakia, 27–29 November 2008; pp. 41–45. [Google Scholar] [CrossRef]
- Kembel, S.W.; Cowan, P.D.; Helmus, M.R.; Cornwell, W.K.; Morlon, H.; Ackerly, D.D.; Blomberg, S.P.; Webb, C.O. Picante: R tools for integrating phylogenies and ecology. Bioinformatics 2010, 26, 1463–1464. [Google Scholar] [CrossRef] [PubMed] [Green Version]
- Bray, J.R.; Curtis, J.T. An ordination of the upland forest communities of southern Wisconsin. Ecol. Monogr. 1957, 27, 325–349. [Google Scholar] [CrossRef]
- McMurdie, P.J.; Holmes, S. phyloseq: An R package for reproducible interactive analysis and graphics of microbiome census data. PLoS ONE 2013, 8, e61217. [Google Scholar] [CrossRef] [Green Version]
- Wemheuer, F.; Taylor, J.A.; Daniel, R.; Johnston, E.; Meinicke, P.; Thomas, T. Tax4Fun2: Prediction of habitat-specific functional profiles and functional redundancy based on 16S rRNA gene sequences. Environ. Microbiome 2020, 15, 1–12. [Google Scholar] [CrossRef]
- Csardi, G.; Nepusz, T. The igraph software package for complex network research. J. Complex Syst. 2006, 1695, 1–9. Available online: http://www.necsi.edu/events/iccs6/papers/c1602a3c126ba822d0bc4293371c.pdf (accessed on 11 November 2022).
- De Domenico, M.; Porter, M.A.; Arenas, A. MuxViz: A tool for multilayer analysis and visualization of networks. J. Complex Networks 2015, 3, 159–176. [Google Scholar] [CrossRef]
- Kurtz, Z.D.; Müller, C.L.; Miraldi, E.R.; Littman, D.R.; Blaser, M.J.; Bonneau, R.A. Sparse and compositionally robust inference of microbial ecological networks. PLoS Comput. Biol. 2015, 11, e1004226. [Google Scholar] [CrossRef] [Green Version]
- Friedman, J.; Alm, E.J. Inferring correlation networks from genomic survey data. PLoS Comput. Biol. 2012, 8, e1002687. [Google Scholar] [CrossRef] [Green Version]
- Andreote, F.D.; Gumiere, T.; Durrer, A. Exploring interactions of plant microbiomes. Sci. Agric. 2014, 71, 528–539. [Google Scholar] [CrossRef]
- Smets, W.; Wuyts, K.; Oerlemans, E.; Wuyts, S.; Denys, S.; Samson, R.; Leeber, S. Impact of urban land use on the bacterial phyllosphere of ivy (Hedera sp.). Atmos. Environ. 2016, 147, 376–383. [Google Scholar] [CrossRef]
- Enya, J.; Koitabashi, M.; Shinohara, H.; Yoshida, S.; Tsukiboshi, T.; Negishi, H.; Suyama, K.; Tsushima, S. Phylogenetic diversities of dominant culturable Bacillus, Pseudomonas and Pantoea species on tomato leaves and their possibility as biological control agents. J. Phytopathol. 2007, 155, 446–453. [Google Scholar] [CrossRef]
- Taghavi, S.; Garafola, C.; Monchy, S.; Newman, L.; Hoffman, A.; Weyens, N.; Barac, T.; Vangronsveld, J.; van der Leile, D. Genome survey and characterization of endophytic bacteria exhibiting a beneficial effect on growth and development of poplar trees. Appl. Environ. Microbiol. 2009, 75, 748–757. [Google Scholar] [CrossRef] [PubMed] [Green Version]
- Chen, X.; Wicaksono, W.A.; Berg, G.; Cernava, T. Bacterial communities in the plant phyllosphere harbour distinct responders to a broad-spectrum pesticide. Sci. Total Environ. 2021, 751, 141799. [Google Scholar] [CrossRef]
- Vorholt, J.A. Microbial life in the phyllosphere. Nat. Rev. Microbiol. 2012, 10, 828–840. [Google Scholar] [CrossRef] [PubMed]
- Douglas, A.E. Multiorganismal insects: Diversity and function of resident microorganisms. Annu. Rev. Entomol. 2014, 60, 17–34. [Google Scholar] [CrossRef] [PubMed] [Green Version]
- Chen, B.; Teh, B.S.; Sun, C.; Hu, S.; Lu, X.; Boland, W.; Shao, Y. Biodiversity and activity of the gut microbiota across the life history of the insect herbivore Spodoptera littoralis. Sci. Rep. 2016, 6, 29505. [Google Scholar] [CrossRef] [Green Version]
- González-Serrano, F.; Pérez-Cobas, A.E.; Rosas, T.; Baixeras, J.; Latorre, A.; Moya, A. The gut microbiota composition of the moth Brithys crini reflects insect metamorphosis. Microb. Ecol. 2020, 79, 960–970. [Google Scholar] [CrossRef]
- Suárez-Moo, P.; Cruz-Rosales, M.; Ibarra-Laclette, E.; Desgarennes, D.; Huerta, C.; Lamelas, A. Diversity and composition of the gut microbiota in the developmental stages of the dung beetle Copris incertus Say (Coleoptera, Scarabaeidae). Front. Microbiol. 2020, 11, 1698. [Google Scholar] [CrossRef]
- Gomes, S.I.F.; Kielak, A.M.; Hannula, S.E.; Heinen, R.; Jongen, R.; Keesmaat, I.; De Long, J.R.; Bezemer, M. Microbiomes of a specialist caterpillar are consistent across different habitats but also resemble the local soil microbial communities. Animal Microbiome 2020, 2, 37. [Google Scholar] [CrossRef]
- Hammer, T.J.; Janzen, D.H.; Hallwachs, W.; Jaffe, S.P.; Fierer, N. Caterpillars lack a resident gut microbiome. Proc. Natl. Acad. Sci. USA 2017, 114, 9641–9646. [Google Scholar] [CrossRef] [PubMed] [Green Version]
- Martinez, A.J.; Ogao, T.; Chantal, O.; Ingham, S.; Sandoval-Calderón, M.; Salem, H.; Deckert, J.; Kaltenpoth, M. Angiosperm to Gymnosperm host-plant switch entails shifts in microbiota of the Welwitschia bug, Probergrothius angolensis (Distant, 1902). Mol. Ecol. 2019, 28, 5172–5187. [Google Scholar] [CrossRef] [PubMed]
- Yang, F.Y.; Saqib, H.S.A.; Chen, J.H.; Ruan, Q.Q.; Vasseur, L.; He, W.Y.; You, M.S. Differential profiles of gut microbiota and metabolites associated with host shift of Plutella xylostella. Int. J. Mol. Sci. 2020, 21, 6283. [Google Scholar] [CrossRef] [PubMed]
- Zhu, Y.; Song, Z.; Song, Y.; Zhao, D.; Hong, X. The microbiota in spider mite feces potentially reflects intestinal bacterial communities in the host. Insect Sci. 2020, 27, 859–868. [Google Scholar] [CrossRef] [PubMed]
- Ruiu, L. Plant-growth-promoting bacteria (PGPB) against insects and other agricultural pests. Agronomy 2020, 10, 861. [Google Scholar] [CrossRef]
- Hurst, M.R.H.; Beard, S.S.; Jackson, T.A.; Jones, S.M. Isolation and characterization of the Serratia entomophila antifeeding prophage. FEMS Microbiol. Lett. 2007, 270, 42–48. [Google Scholar] [CrossRef] [Green Version]
- Nehme, N.T.; Liégeois, S.; Kele, B.; Giammarinaro, P.; Pradel, E.; Hoffman, J.A. A model of bacterial intestinal infections in Drosophila melanogaster. PLoS Pathog. 2007, 3, e173. [Google Scholar] [CrossRef] [Green Version]
- Renoz, F.; Pons, I.; Vanderpoorten, A.; Bataille, G.; Noël, C.; Foray, V.; Pierson, V.; Hance, T. Evidence for gut-associated Serratia symbiotica in wild aphids and ants provides new perspectives on the evolution of bacterial mutualism in insects. Microb. Ecol. 2019, 78, 159–169. [Google Scholar] [CrossRef]
- Kozlova, E.V.; Hegde, S.; Roundy, C.M.; Golovko, G.; Saldaña, M.A.; Hart, C.E.; Anderson, E.R.; Hornett, E.A.; Khanipov, K.; Popov, V.L.; et al. Microbial interactions in the mosquito gut determine Serratia colonization and blood-feeding propensity. ISME J. 2021, 15, 93–108. [Google Scholar] [CrossRef]
- Arias-Cordero, E.; Ping, L.; Reichwald, K.; Delb, H.; Platzer, M.; Boland, W. Comparative evaluation of the gut microbiota associated with the below- and above-ground life stages (larvae and beetles) of the forest cockchafer, Melolontha hippocastani. PLoS ONE 2012, 7, e51557. [Google Scholar] [CrossRef]
- Stone, B.W.G.; Weingarten, E.W.; Jackson, C.R. The role of the phyllosphere microbiome in plant health and function. Annu. Plant Rev. 2018, 1, 1,533–556. [Google Scholar] [CrossRef]
- Lajoie, G.; Maglione, R.; Kembel, S.W. Adaptive matching between phyllosphere bacteria and their tree hosts in a neotropical forest. Microbiome 2020, 8, 70. [Google Scholar] [CrossRef] [PubMed]
- Jing, T.Z.; Qi, F.H.; Wang, Z.Y. Most dominant roles of insect gut bacteria: Digestion, detoxification, or essential nutrient provision? Microbiome 2020, 8, 38. [Google Scholar] [CrossRef] [PubMed] [Green Version]
- Giron, D.; Dedeine, F.; Dubreuil, G.; Huguet, E.; Mouton, L.; Outreman, Y.; Simon, J.C. Influence of Microbial Symbionts on Plant–Insect Interactions. In Advances in Botanical Research; Elsevier: Amsterdam, The Netherlands, 2017; pp. 225–257. [Google Scholar] [CrossRef]
- Schmidt, K.; Engel, P. Review: Mechanisms underlying gut microbiota-host interactions in insects. J. Exp. Biol. 2021, 224, jeb.207696. [Google Scholar] [CrossRef] [PubMed]
- Kochhar, S.L.; Gujral, S.K. Carbohydrate metabolism. In Plant Physiology: Theory and Application; Cambridge University Press: Cambridge, UK, 2022; pp. 253–266. [Google Scholar] [CrossRef]
- Zang, X.; Liu, M.; Fan, Y.; Xu, J.; Xu, X.; Li, H. The structural and functional contributions of β-glucosidase-producing microbial communities to cellulose degradation in composting. Biotechnol. Biofuels 2018, 11, 51. [Google Scholar] [CrossRef] [PubMed]
- Vassão, D.G.; Wielsch, N.; Moreira, A.M.; Gebauer-Jung, S.; Hupfer, Y.; Svatoš, A.; Gershenzon, J. Plant defensive β-Glucosidases resist digestion and sustain activity in the gut of a lepidopteran herbivore. Front. Plant Sci. 2018, 9, 1389. [Google Scholar] [CrossRef]
- Smith, C.M.; Boyko, E.V. The molecular bases of plant resistance and defense responses to aphid feeding. Entomol. Exp. Appl. 2006, 122, 1–16. [Google Scholar] [CrossRef]
- Hosokawa, T.; Kikuchi, Y.; Nikoh, N.; Shimada, M.; Fukatsu, T. Strict host-symbiont cospeciation and reductive genome evolution in insect gut bacteria. PLoS Biol. 2006, 4, e337. [Google Scholar] [CrossRef]
- Wu, J.; Hettenhausen, C.; Meldau, S.; Baldwin, I.T. Herbivory rapidly activates MAPK signaling in attacked and unattacked leaf regions but not between leaves of Nicotiana attenuata. Plant Cell 2007, 19, 1096–1122. [Google Scholar] [CrossRef] [Green Version]
- Bringel, F.; Couée, I. Pivotal roles of phyllosphere microorganisms at the interface between plant functioning and atmospheric trace gas dynamics. Front. Microbiol. 2015, 6, 486. [Google Scholar] [CrossRef] [Green Version]
- Ruiz-Pérez, C.A.; Restrepo, S.; Zambrano, M.M. Microbial and functional diversity within the phyllosphere of Espeletia species in an Andean high-mountain ecosystem. Appl. Environ. Microbiol. 2016, 82, 1807–1817. [Google Scholar] [CrossRef] [PubMed] [Green Version]
- El Bazaoui, A.; Bellimam, M.A.; Soulaymani, A. Tropane alkaloids of Datura innoxia from Morocco. Z. Fur Nat. 2012, 67, 8–14. [Google Scholar] [CrossRef]
- Miranda-Pérez, A.; Castillo, G.; Hernández-Cumplido, J.; Valverde, P.L.; Borbolla, M.; Cruz, L.L.; Tapia-López, R.; Fornoni, J.; Flores-Ortiz, C.M.; Núñez-Farfán, J. Natural selection drives chemical resistance of Datura stramonium. PeerJ 2016, 4, e1898. [Google Scholar] [CrossRef] [PubMed] [Green Version]
- De-la-Cruz, I.M.; Cruz, L.L.; Martínez-García, L.; Valverde, P.L.; Flores-Ortiz, C.M.; Hernández-Portilla, L.B.; Núñez-Farfán, J. Evolutionary response to herbivory: Population differentiation in microsatellite loci, tropane alkaloids and leaf trichome density in Datura stramonium. Arthropod Plant Interact. 2020, 14, 21–30. [Google Scholar] [CrossRef]
- Habib, H.; Fazili, K.M. Plant protease inhibitors: A defense strategy in plants. Biotechnol. Mol. Biol. Rev. 2007, 2, 68–85. [Google Scholar] [CrossRef]
- Kikuchi, Y.; Hayatsu, M.; Hosokawa, T.; Nagayama, A.; Tago, K.; Fukatsu, T. Symbiont-mediated insecticide resistance. Proc. Natl. Acad. Sci. USA 2012, 109, 8618–8622. [Google Scholar] [CrossRef] [Green Version]
- Feyereisen, R. Insect P450 Enzymes. Ann. Rev. Entomol. 1999, 44, 507–533. [Google Scholar] [CrossRef]
- Scott, J.G.; Wen, Z. Cytochromes P450 of insects: The tip of the iceberg. Pest Manag. Sci. 2001, 57, 958–967. [Google Scholar] [CrossRef]
- Adams, A.S.; Aylward, F.O.; Adams, S.M.; Erbilgin, N.; Aukema, B.H.; Currie, C.R.; Suen, G.; Raffa, K.F. Mountain pine beetles colonizing historical and naïve host trees are associated with a bacterial community highly enriched in genes contributing to terpene metabolism. Appl. Environ. Microbiol. 2013, 79, 3468–3475. [Google Scholar] [CrossRef] [Green Version]
- Schuler, M.A. The role of cytochrome P450 monooxygenases in plant-insect interactions. Plant Physiol. 1996, 112, 1411–1419. [Google Scholar] [CrossRef] [Green Version]
- Gullner, G.; Komives, T.; Király, L.; Schröder, P. Glutathione S-Transferase enzymes in plant-pathogen Interactions. Front. Plant Sci. 2018, 9, 1836. [Google Scholar] [CrossRef] [PubMed] [Green Version]
- Francis, F.; Vanhaelen, N.; Haubruge, E. Glutathione S-transferases in the adaptation to plant secondary metabolites in the Myzus persicae aphid. Arch. Insect Biochem. Physiol. 2005, 58, 166–174. [Google Scholar] [CrossRef] [PubMed]
- Behmer, S.T. Insect herbivore nutrient regulation. Annu. Rev. Entomol 2009, 54, 165–187. [Google Scholar] [CrossRef] [PubMed]
- Honda, K.; Hori, M.; Ômura, H.; Kainoh, Y. Allelochemicals in Plant–Insect Interactions. In Elsevier Reference Module in Chemistry, Molecular Sciences and Chemical Engineering; Reedjik, J., Ed.; Elsevier: Waltham, MA, USA, 2013; pp. 563–594. [Google Scholar] [CrossRef]
- Shi, H.; Pei, L.; Gu, S.; Zhu, S.; Wang, Y.; Zhang, Y.; Li, B. Glutathione S-transferase (GST) genes in the red flour beetle, Tribolium castaneum, and comparative analysis with five additional insects. Genomics 2012, 100, 327–335. [Google Scholar] [CrossRef] [PubMed] [Green Version]
- Jaffar, S.; Ahmad, S.; Lu, Y. Contribution of insect gut microbiota and their associated enzymes in insect physiology and biodegradation of pesticides. Front. Microbiol. 2022, 13, 979383. [Google Scholar] [CrossRef]
- Pilosof, S.; Porter, M.A.; Pascual, M.; Kéfi, S. The multilayer nature of ecological networks. Nat. Ecol. Evol. 2017, 1, 0101. [Google Scholar] [CrossRef] [Green Version]
- Soumare, A.; Diedhiou, A.G.; Thuita, M.; Hafidi, M.; Ouhdouch, Y.; Gopalakrishnan, S.; Kouisni, L. Exploiting biological nitrogen fixation: A route towards a sustainable agriculture. Plants 2020, 9, 1011. [Google Scholar] [CrossRef]
- Shang, L.; Yan, Y.; Zhan, Y.; Ke, X.; Shao, Y.; Liu, Y.; Yang, H.; Wang, S.; Dai, S.; Lu, J.; et al. A regulatory network involving Rpo, Gac and Rsm for nitrogen-fixing biofilm formation by Pseudomonas stutzeri. NPJ Biofilms Microbiomes 2021, 7, 54. [Google Scholar] [CrossRef]
- Lv, L.; Luo, J.; Ahmed, T.; Zaki, H.E.; Tian, Y.; Shahid, M.S.; Chen, J.; Li, B. Beneficial effect and potential risk of Pantoea on rice production. Plants 2022, 11, 2608. [Google Scholar] [CrossRef]
- Mamarasulov, B.; Davranov, K.; Shah, J.M.; Jabborova, D.; Nasif, O.; Javed, M.A.; Danish, S.; Datta, R. Characterization, enzymatic and biochemical properties of endophytic bacterial strains of the medicinal plant Ajuga turkestanica (Rgl.) Brig (Lamiacceae). J. King Saud Univ. Sci. 2022, 34, 102183. [Google Scholar] [CrossRef]
- Holochová, P.; Mašlaňová, I.; Sedláček, I.; Švec, P.; Králová, S.; Kovařovic, V.; Busse, H.-J.; Staňková, E.; Barták, M.; Pantůček, R. Description of Massilia rubra sp. nov., Massilia aquatica sp. nov., Massilia mucilaginosa sp. nov., Massilia frigida sp. nov., and one Massilia genomospecies isolated from Antarctic streams, lakes and regoliths. Syst Appl Microbiol 2020, 43, 126112. [Google Scholar] [CrossRef] [PubMed]
- Cappellari, L.D.; Chiappero, J.; Palermo, T.B.; Giordano, W.; Banchio, E. Impact of soil rhizobacteria inoculation and leaf-chewing insect herbivory on Mentha piperita leaf secondary metabolites. J. Chem. Ecol. 2020, 46, 619–630. [Google Scholar] [CrossRef] [PubMed]
- Preston, G.M.; Studholme, D.J.; Caldelari, I. Profiling the secretomes of plant pathogenic Proteobacteria. FEMS Microbiol. Rev. 2005, 29, 331–360. [Google Scholar] [CrossRef] [PubMed]
- Haney, C.H.; Wiesmann, C.L.; Shapiro, L.R.; Melnyk, R.A.; O’Sullivan, L.R.; Khorasani, S.; Xiao, L.; Han, J.; Bush, J.; Carrillo, J.; et al. Rhizosphere-Associated Pseudomonas induce systemic resistance to herbivores at the cost of susceptibility to bacterial pathogens. Mol. Ecol. 2018, 27, 1833–1847. [Google Scholar] [CrossRef] [PubMed]


Disclaimer/Publisher’s Note: The statements, opinions and data contained in all publications are solely those of the individual author(s) and contributor(s) and not of MDPI and/or the editor(s). MDPI and/or the editor(s) disclaim responsibility for any injury to people or property resulting from any ideas, methods, instructions or products referred to in the content. |
© 2022 by the authors. Licensee MDPI, Basel, Switzerland. This article is an open access article distributed under the terms and conditions of the Creative Commons Attribution (CC BY) license (https://creativecommons.org/licenses/by/4.0/).
Share and Cite
Mayoral-Peña, Z.; Lázaro-Vidal, V.; Fornoni, J.; Álvarez-Martínez, R.; Garrido, E. Studying Plant–Insect Interactions through the Analyses of the Diversity, Composition, and Functional Inference of Their Bacteriomes. Microorganisms 2023, 11, 40. https://doi.org/10.3390/microorganisms11010040
Mayoral-Peña Z, Lázaro-Vidal V, Fornoni J, Álvarez-Martínez R, Garrido E. Studying Plant–Insect Interactions through the Analyses of the Diversity, Composition, and Functional Inference of Their Bacteriomes. Microorganisms. 2023; 11(1):40. https://doi.org/10.3390/microorganisms11010040
Chicago/Turabian StyleMayoral-Peña, Zyanya, Víctor Lázaro-Vidal, Juan Fornoni, Roberto Álvarez-Martínez, and Etzel Garrido. 2023. "Studying Plant–Insect Interactions through the Analyses of the Diversity, Composition, and Functional Inference of Their Bacteriomes" Microorganisms 11, no. 1: 40. https://doi.org/10.3390/microorganisms11010040