Electrochemical Voltammogram Recording for Identifying Varieties of Ornamental Plants
by

Rutong Yang
1,†, 
Boyuan Fan
2,†,
Shu’an Wang
1,
Linfang Li
1,
Ya Li
1,*,
Sumei Li
1,
Yuhong Zheng
1,
Li Fu
2,* and
Cheng-Te Lin
3,4 1
Jiangsu Key Laboratory for the Research and Utilization of Plant Resources, Institute of Botany, Jiangsu Province and Chinese Academy of Sciences, Nanjing 210014, China
2
College of Materials and Environmental Engineering, Hangzhou Dianzi University, Hangzhou 310018, China
3
Key Laboratory of Marine Materials and Related Technologies, Zhejiang Key Laboratory of Marine Materials and Protective Technologies, Ningbo Institute of Materials Technology and Engineering (NIMTE), Chinese Academy of Sciences, Ningbo 315201, China
4
Center of Materials Science and Optoelectronics Engineering, University of Chinese Academy of Sciences, Beijing 100049, China
*
Authors to whom correspondence should be addressed.
†
The authors contributed equally to this work.
Micromachines 2020, 11(11), 967; https://doi.org/10.3390/mi11110967
Submission received: 7 October 2020
/
Revised: 24 October 2020
/
Accepted: 25 October 2020
/
Published: 29 October 2020
(This article belongs to the Special Issue Nanomaterials Modified Electrochemical Sensors)
Abstract
:An electrochemical voltammogram recording method for plant variety identification is proposed. Electrochemical voltammograms of Vistula, Andromeda, Danuta, Armandii ‘Apple Blossom,’ Proteus, Hagley Hybrid, Violet Elizabeth, Kiri Te Kanawa, Regina, and Veronica’s Choice were recorded using leaf extracts with two solvents under buffer solutions. The voltametric data recorded under different conditions were derived as scatter plots, 2D density patterns, and hot maps for variety identification. In addition, the voltametric data were further used for genetic relationship studies. The dendrogram deduced from the voltammograms was used as evidence for relationship study. The dendrogram deduced from voltametric data suggested the Andromeda, Danuta, Proteus, Regina, and Hagley Hybrid were closely related, while Violet Elizabeth and Veronica’s Choice were closely related. In addition, Vistula and Armandii ‘Apple Blossom’ could be considered outliers among the varieties.
1. Introduction
The typical morphological features of ornamental plants are specific, visually visible external features. They can directly reflect the evolutionary course and genetic relationship of plants. Therefore, they can be used as the main bases for variety identification and classification. Though comparative morphological methods are relatively simple and intuitive [1,2], plant morphology is affected not only by environmental conditions but also by gene expression [3,4]. Therefore, the accurate definition of stable, inherited morphological traits is a prerequisite for comparative morphological identification and classification. The cytological method has the characteristics of strong stability, but it can only can provide limited information [5,6,7]. It is difficult to obtain a clear classification result with this method when performing karyotype analysis between varieties [8,9,10,11]. Therefore, a large sample size is a prerequisite for cytological identification and classification. The morphological characteristics of pollen are mainly controlled by genes and have strong genetic stability. However, at present, most researchers only use scanning electron microscopy to observe the external form of pollen, and they cannot observe important classification information [12,13,14], which makes identification and classification results deviate from the results obtained by other methods. Quantitative classification methods can comprehensively analyze a large number of biological traits [15,16]. However, in the process of quantitative classification, many steps such as selected trait types, coding rules, data standardization methods, and cluster analysis methods are very subjective, which makes it difficult to compare the results with other methods [17]. Isozymes are the direct products of gene expression. The amount of enzyme bands and changes in mobility are largely determined by structural genes [18,19,20]. Therefore, the existence and expression of genes can be represented according to the isozyme phenotype. However, the polymorphism of plant isozymes is low, resulting in a poor stability. At the same time, this polymorphism is susceptible to environmental factors, sampling locations, and plant development stages [21,22]. Molecular markers have the advantages of a high stability, good repeatability, and wide distribution in the genome [23,24]. However, they are affected by factors such as sample size, the number of markers, and polymorphism. It can be seen that any classification method has its limitations. It is difficult to ensure the reliability of results when using a particular method for variety identification.
In this work, we propose an electrochemical approach for variety identification. Electrochemical methods have been widely used for analytical purpose for sensing [25,26,27,28,29,30,31,32,33,34]. The voltametric scanning of an extract of plant leaves was performed using a glassy carbon electrode. Ten varieties of Clematis were deliberately selected as investigation targets [35,36,37]. We recorded the voltammograms of Clematis under different conditions and found that different extraction solvents and buffer solutions presented different profiles. Integrating these voltammograms can be used to quickly identify varieties of Clematis. In addition, we further propose a new pattern recognition method in this work. The dendrogram deduced from the voltammograms of 10 varieties of Clematis gave a persuasive genetic relationship result with breeding records.
2. Materials and Methods
Leaves of Vistula, Andromeda, Danuta, Armandii ‘Apple Blossom,’ Proteus, Hagley Hybrid, Violet Elizabeth, Kiri Te Kanawa, Regina, and Veronica’s Choice were collected from Nanjing Botanical Garden Memorial Sun Yat-Sen (Nanjing, China) in April 2020. Table 1 shows all the important information for these varieties. Healthy leaves of each variety were carefully collected and stored at −20 °C before analysis. KH2PO4, Na2HPO4, sodium acetate, and acetic acid were purchased from Macklin Co., Ltd. All other chemicals were analytical-grade reagents and were used without further purification. The reference electrode (Ag/AgCl), counter electrode (Pt wire), and working electrode (glassy carbon electrode (GCE), 3 mm in diameter) were all purchased from Gaoshi Ruilian Co. Ltd. (Wuhan, China). Milli-Q water (18.2 MΩ/cm) was used throughout the experiments.
Water and ethanol were directly used as solvents for plant leaf extract preparation. As is typical, 10 mL of water or ethanol were added into 2 g of chopped plant leaf with 1 min of grinding, and then a 0.1 M acetate buffer (ABS, pH 4.5) or a 0.1 M phosphate buffer (PBS, pH 7) was added for 3 min of sonication. For electrochemical fingerprint recording, a GCE was polished with an alumina–water slurry and rinsed with ethanol and water. Then, a three-electrode system was inserted into the beaker for electrochemical fingerprint recording. All electrochemical fingerprints were recorded using a CHI760E working station. Differential pulse voltammetry was used to record the electrochemical fingerprints of all plant tissue between −0.1 and 1.5 V with a pulse amplitude of 50 mV, a pulse width of 0.05 s, and a pulse period of 0.5 s.
For scatter plot, 2D density plot, and hot map generation, the normalized current values recorded after two solvent extractions were used as the x and y axes. All figures were constructed using Origin2020.
3. Results
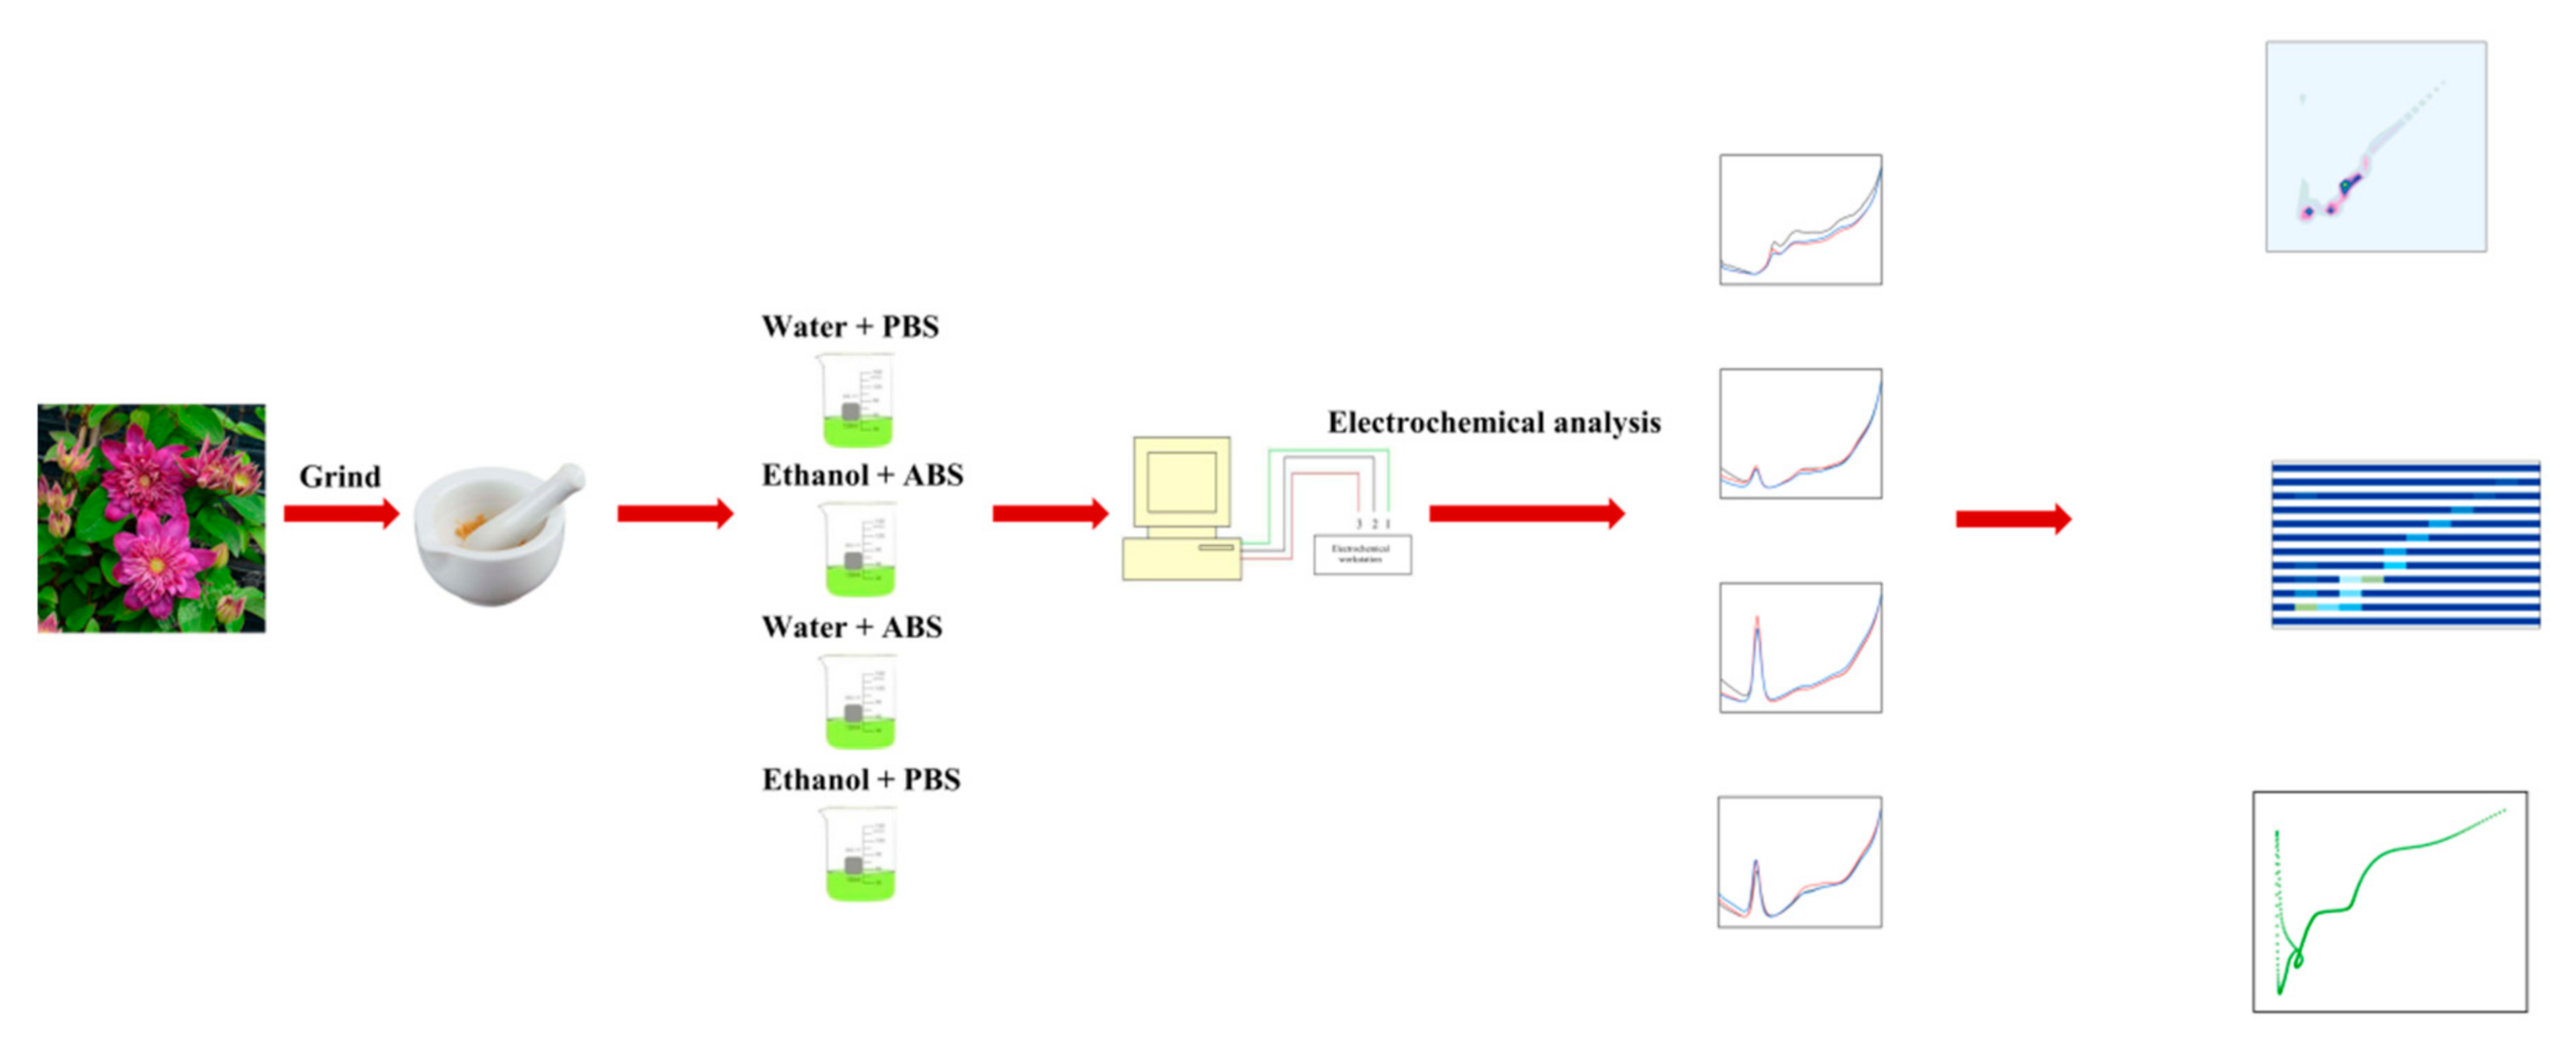
Figure 1 shows a schematic diagram of the voltametric recording of Clematis. The leaf extraction process was conducted before voltametric recording. Water and ethanol were used as solvents for extracting the electro-active molecules from the Clematis leaf. Then, either the ABS or the PBS was added as electrolyte to provide sufficient ions for an electrochemical reaction. The electrochemical reaction was taken at the surface of the GCE using a differential pulse voltammetry (DPV) scan. The recorded voltammograms of Clematis were then submitted for pattern generation. Scatter plots and 2D density patterns have previously been used for plant identification [38,39,40,41,42,43,44,45]. In this work, we further proposed a hot map pattern for variety identification.
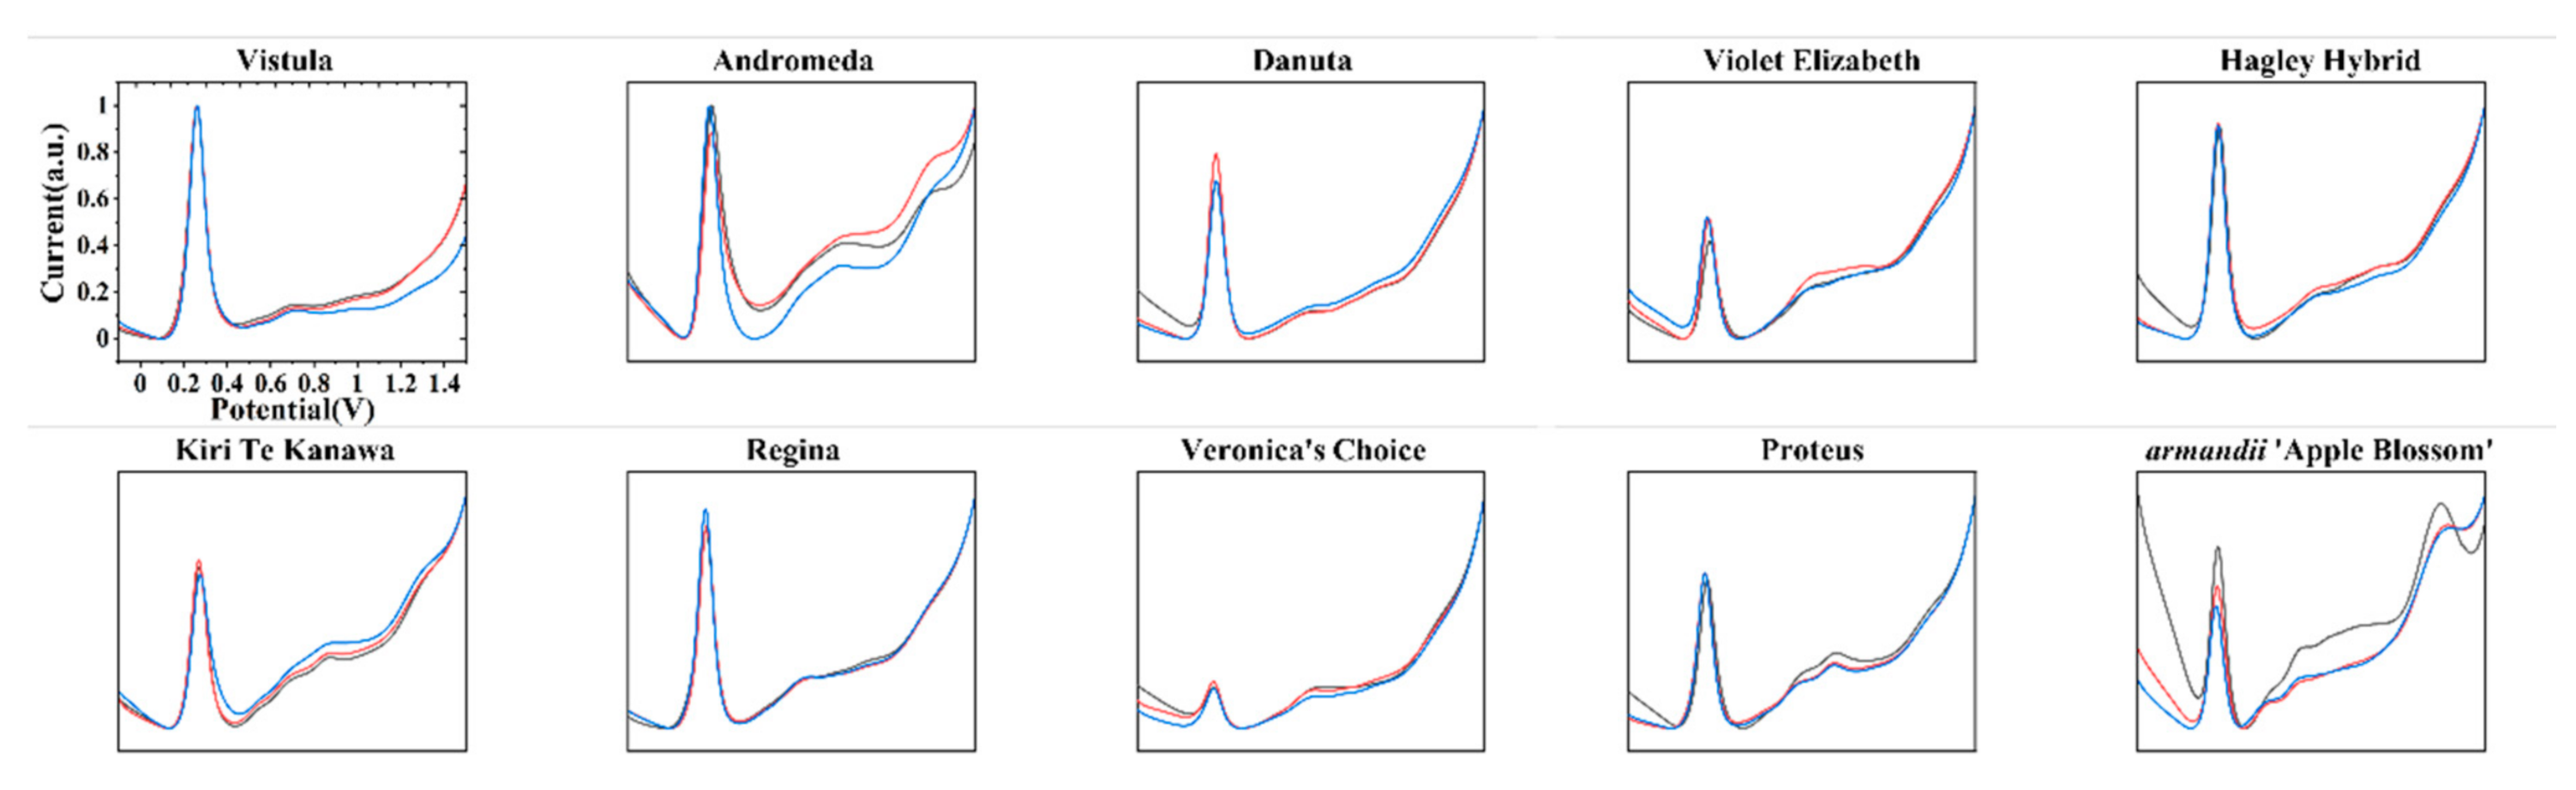
Figure 2 shows the DPV curves of samples obtained under the 0.1 M PBS after the water extraction process. It can be seen that each variety exhibited several peaks between −0.1 and 1.5 V. In addition, three scans showed an acceptable reproducibility, suggesting that the used method is feasible. These oxidation peaks can be ascribed to molecules in plant tissue such as flavanols [46,47,48,49], phenolic acids [50,51,52,53], procyanidins [54,55,56], alkaloids [57,58,59], and pigments [60,61,62]. In plant extraction, ethanol is more suitable for the extraction of volatile oil, organic acids, resins, alkaloids, polyphenols, and flavonoids. The identification of these compounds is a big challenge because no separation process was able to be used for the sample. However, the total electrochemical profile could be considered to show the overall information of the electro-active compounds in the plant tissue. Therefore, it shows potential for the quick identification of plants.
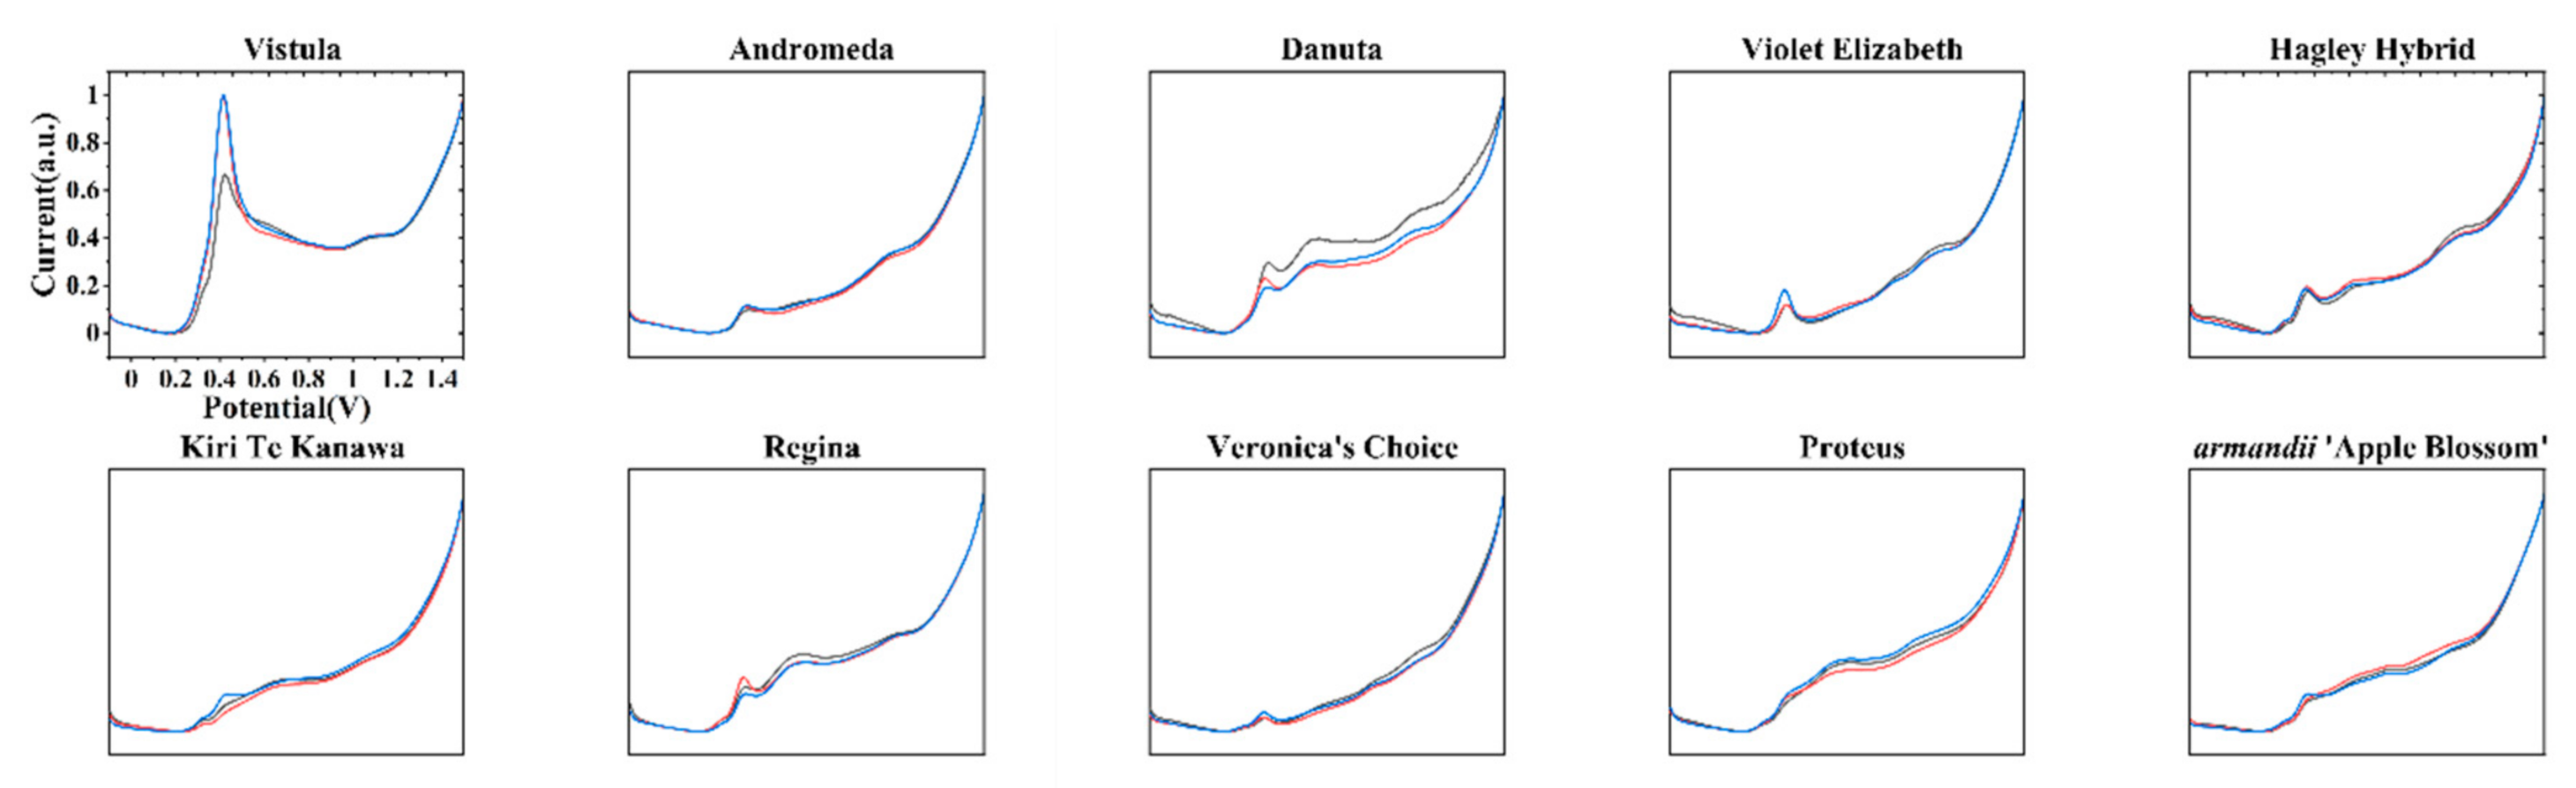
Figure 3 shows the DPV curves of samples obtained under the 0.1 M ABS after ethanol extraction. Each variety of Clematis also showed oxidation peaks during the scan. Differences between these curves and the curves obtained in Figure 2 can be observed due to the different electro-active compounds that participated in the electrochemical reaction.
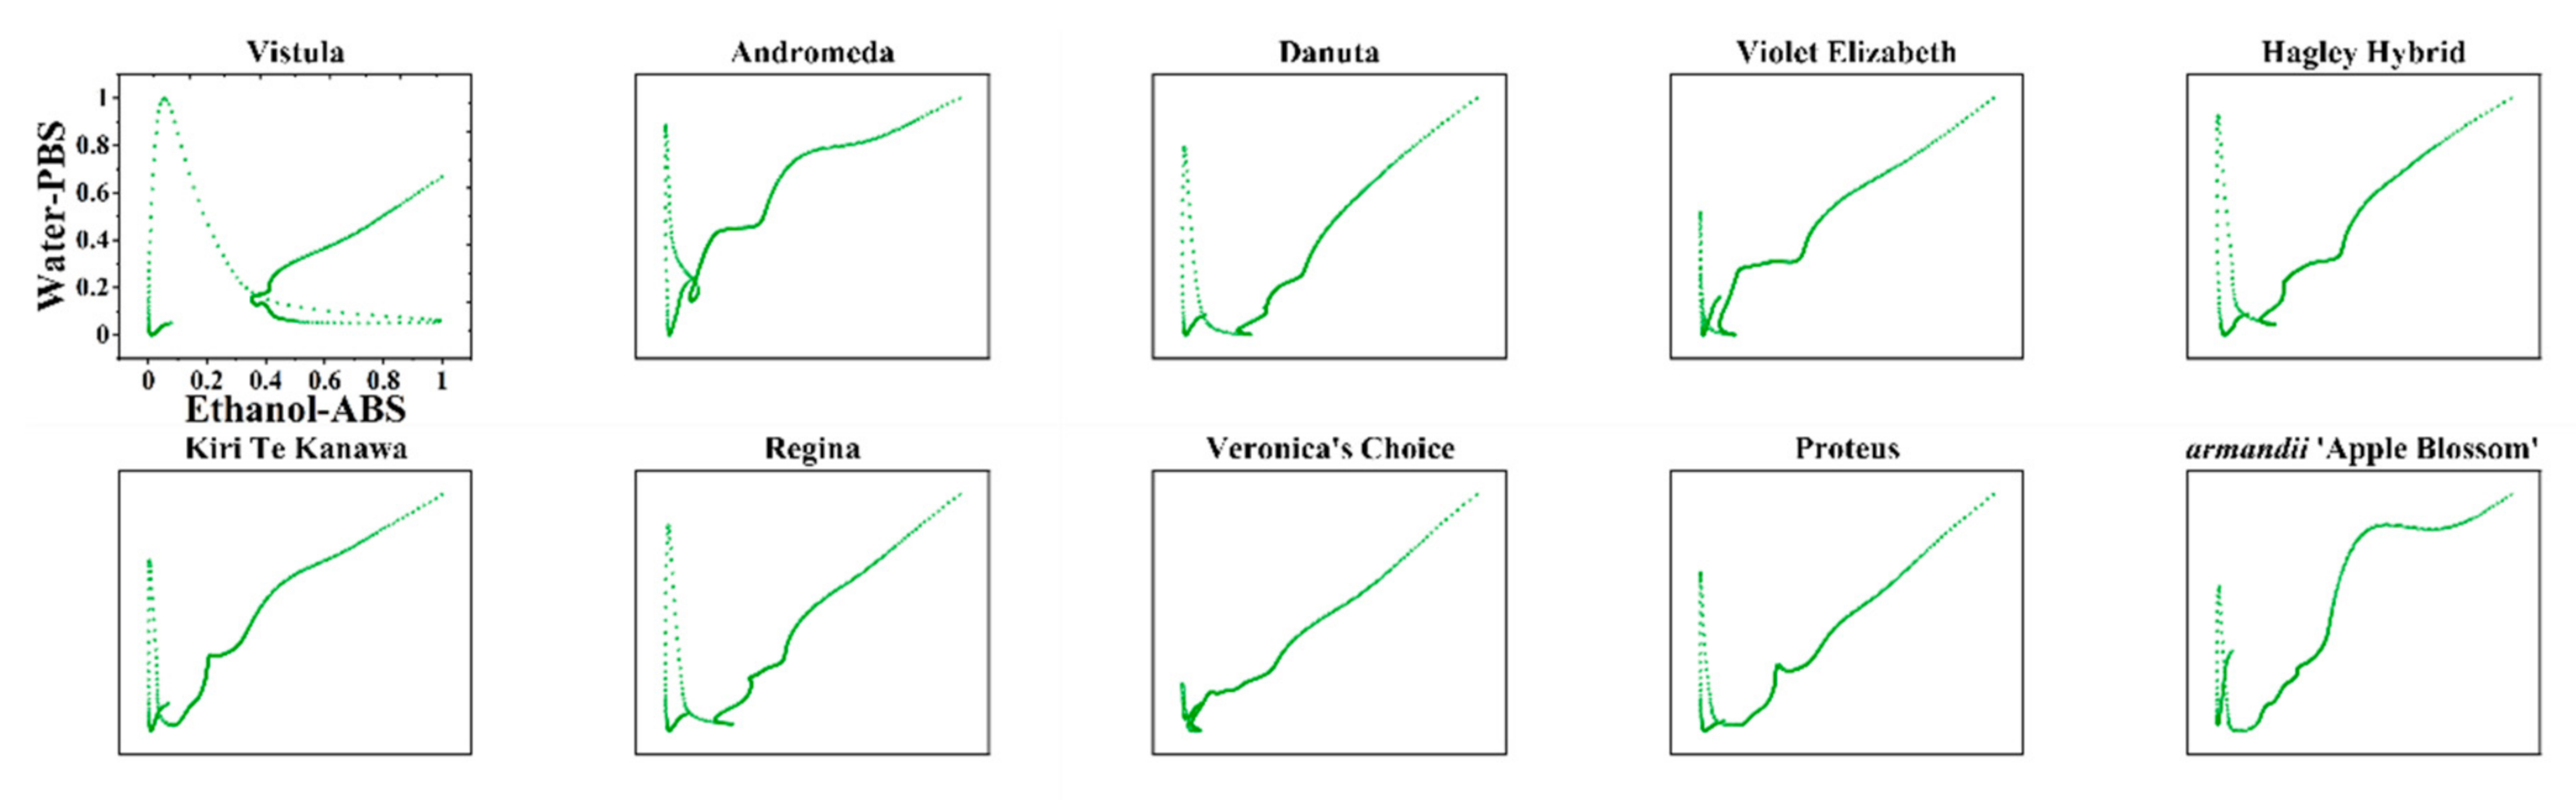
The direct recognition of varieties using DPV curves is quite hard because the DPV curves of some varieties showed similar features, like with the voltammograms of Danuta and Regina. In addition, the DPV curves of Kiri Te Kanawa and Proteus also exhibited very similar profiles. In order to quickly identify these varieties of Clematis, the DPV curves recorded under different conditions could be used for generating different patterns. Figure 4 shows the scatter plots of all 10 varieties using data recorded from the 0.1 M PBS after water extraction against the 0.1 M ABS after ethanol extraction. The increasing the dimension of data obviously improved the difference between samples. For example, the difference between Kiri Te Kanawa and Proteus was more obvious in the scatter plots than the difference observed between the DPV curves.
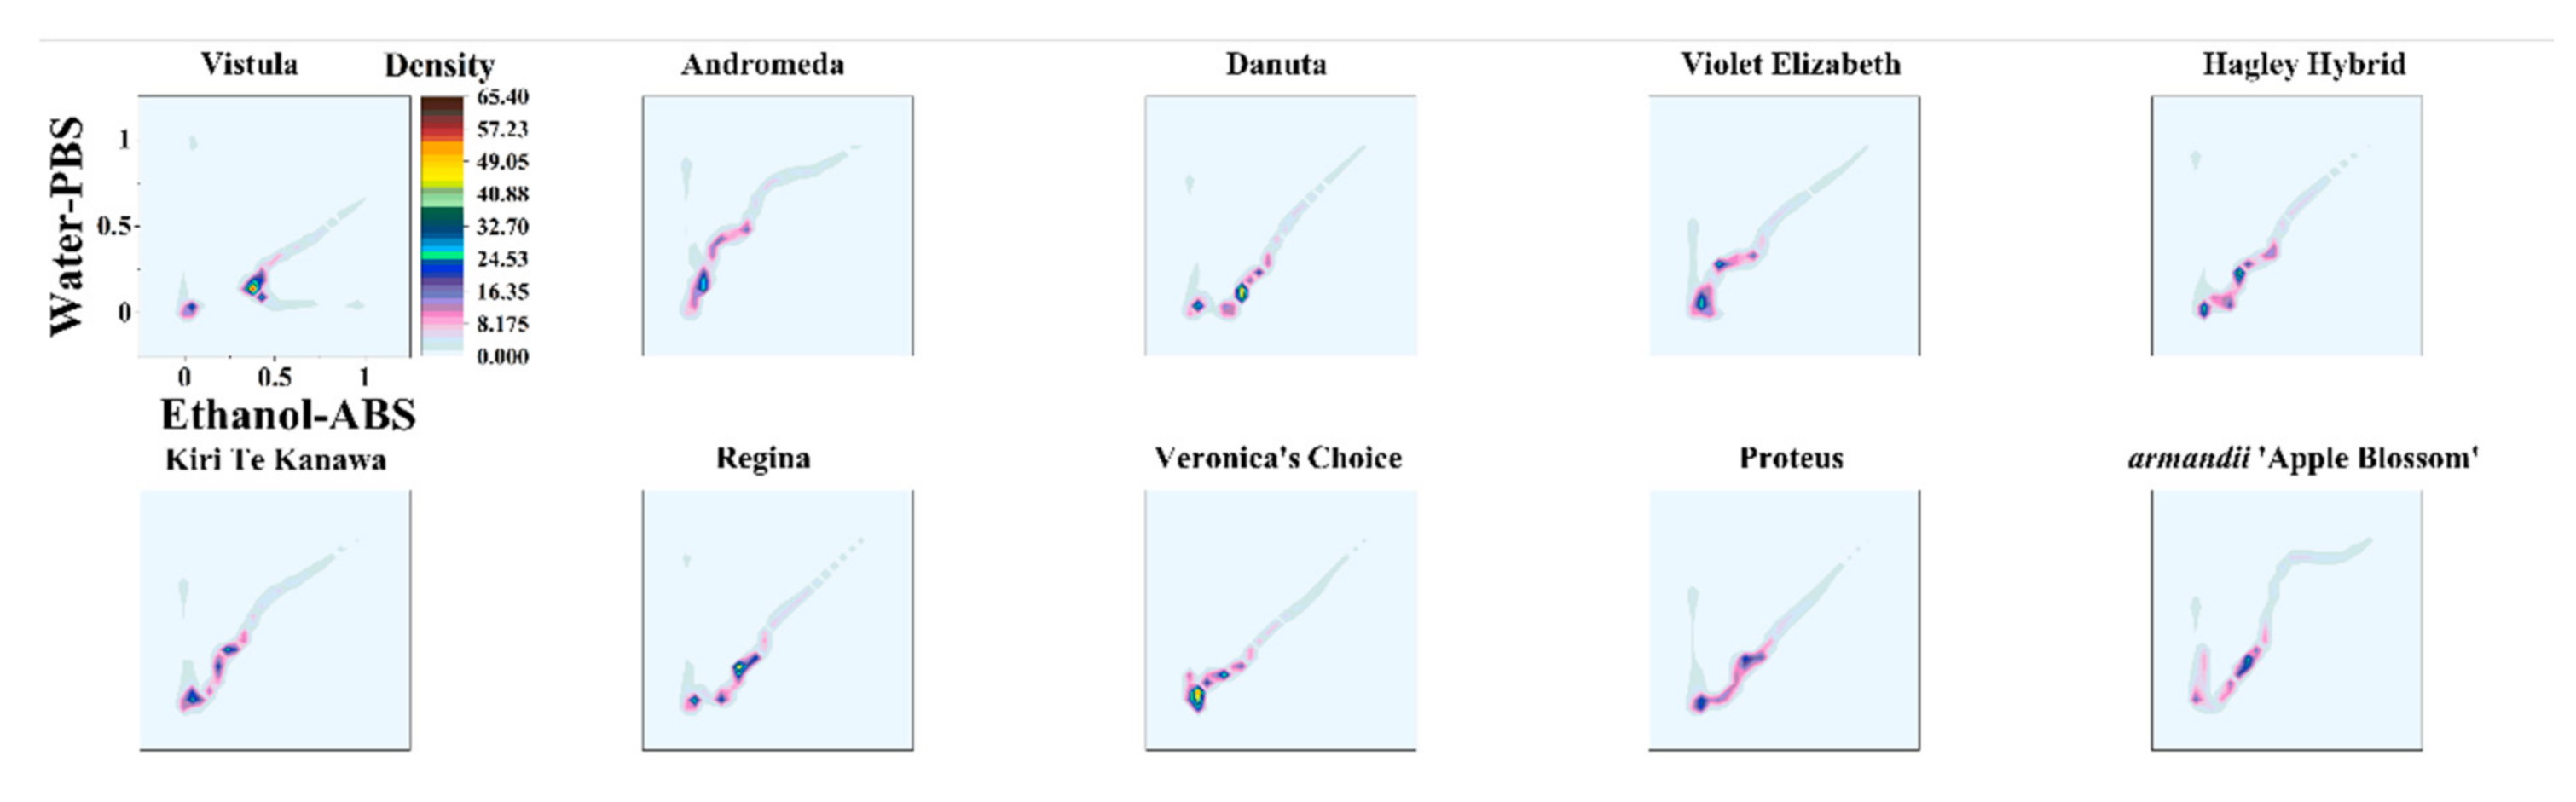
The use of scatter plots for variety identification still has certain limitations. Since each data point has the same weight, it is difficult to intuitively find differences between varieties from scatter plots. In order to highlight the key points of data, we used the data recorded from the 0.1 M PBS after water extraction and the 0.1 M ABS after ethanol extraction to make a 2D density plot.
In the 2D density plot, the area with more data points is highlighted. We can distinguish different varieties by simply locating the highlighted area. Figure 5 shows the 2D density plots of Vistula, Andromeda, Danuta, Armandii ‘Apple Blossom,’ Proteus, Hagley Hybrid, Violet Elizabeth, Kiri Te Kanawa, Regina, and Veronica’s Choice. Most varieties can be identified by locating their highlighted area, but there are still some varieties that have similar patterns.
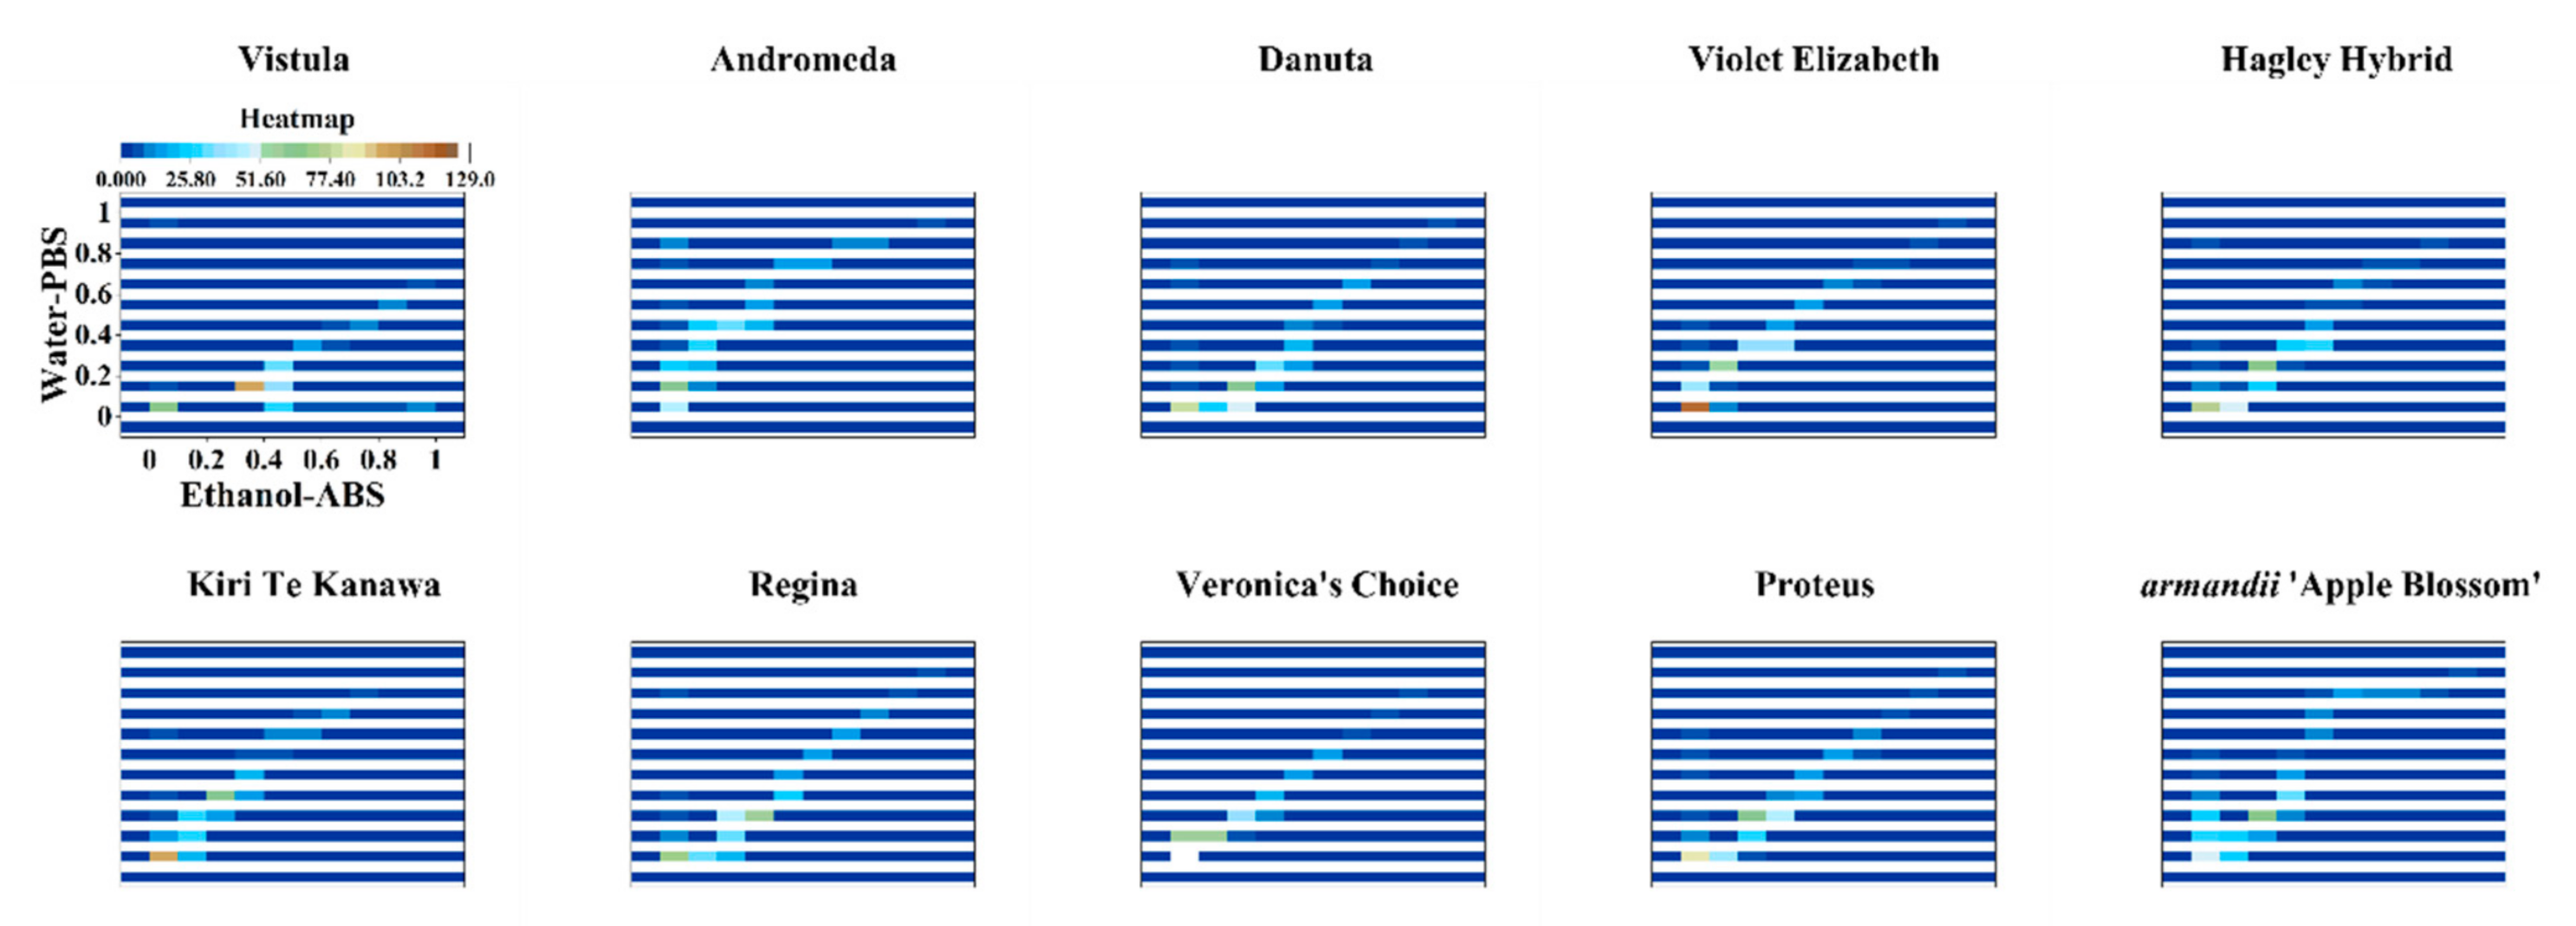
Therefore, we further proposed a new pattern identification approach. The data points of the DPV curves recorded from the 0.1 M PBS after water extraction and the 0.1 M ABS after ethanol extraction were used to construct a hot map. Figure 6 shows the hot maps of Vistula, Andromeda, Danuta, Armandii ‘Apple Blossom,’ Proteus, Hagley Hybrid, Violet Elizabeth, Kiri Te Kanawa, Regina, and Veronica’s Choice. It can be seen that the hot map divided all data into many small cubes. Each cube represents the hot degree of the data compared with all of the data. This identification method makes it much easier to locate hot zones and perform quantitative analysis than a 2D density plot. For example, Proteus and Regina had very similar 2D density plots, as seen in Figure 5. However, we could easily recognize them by the six yellow and red-purple cubes that appear at the beginning of their hot maps.
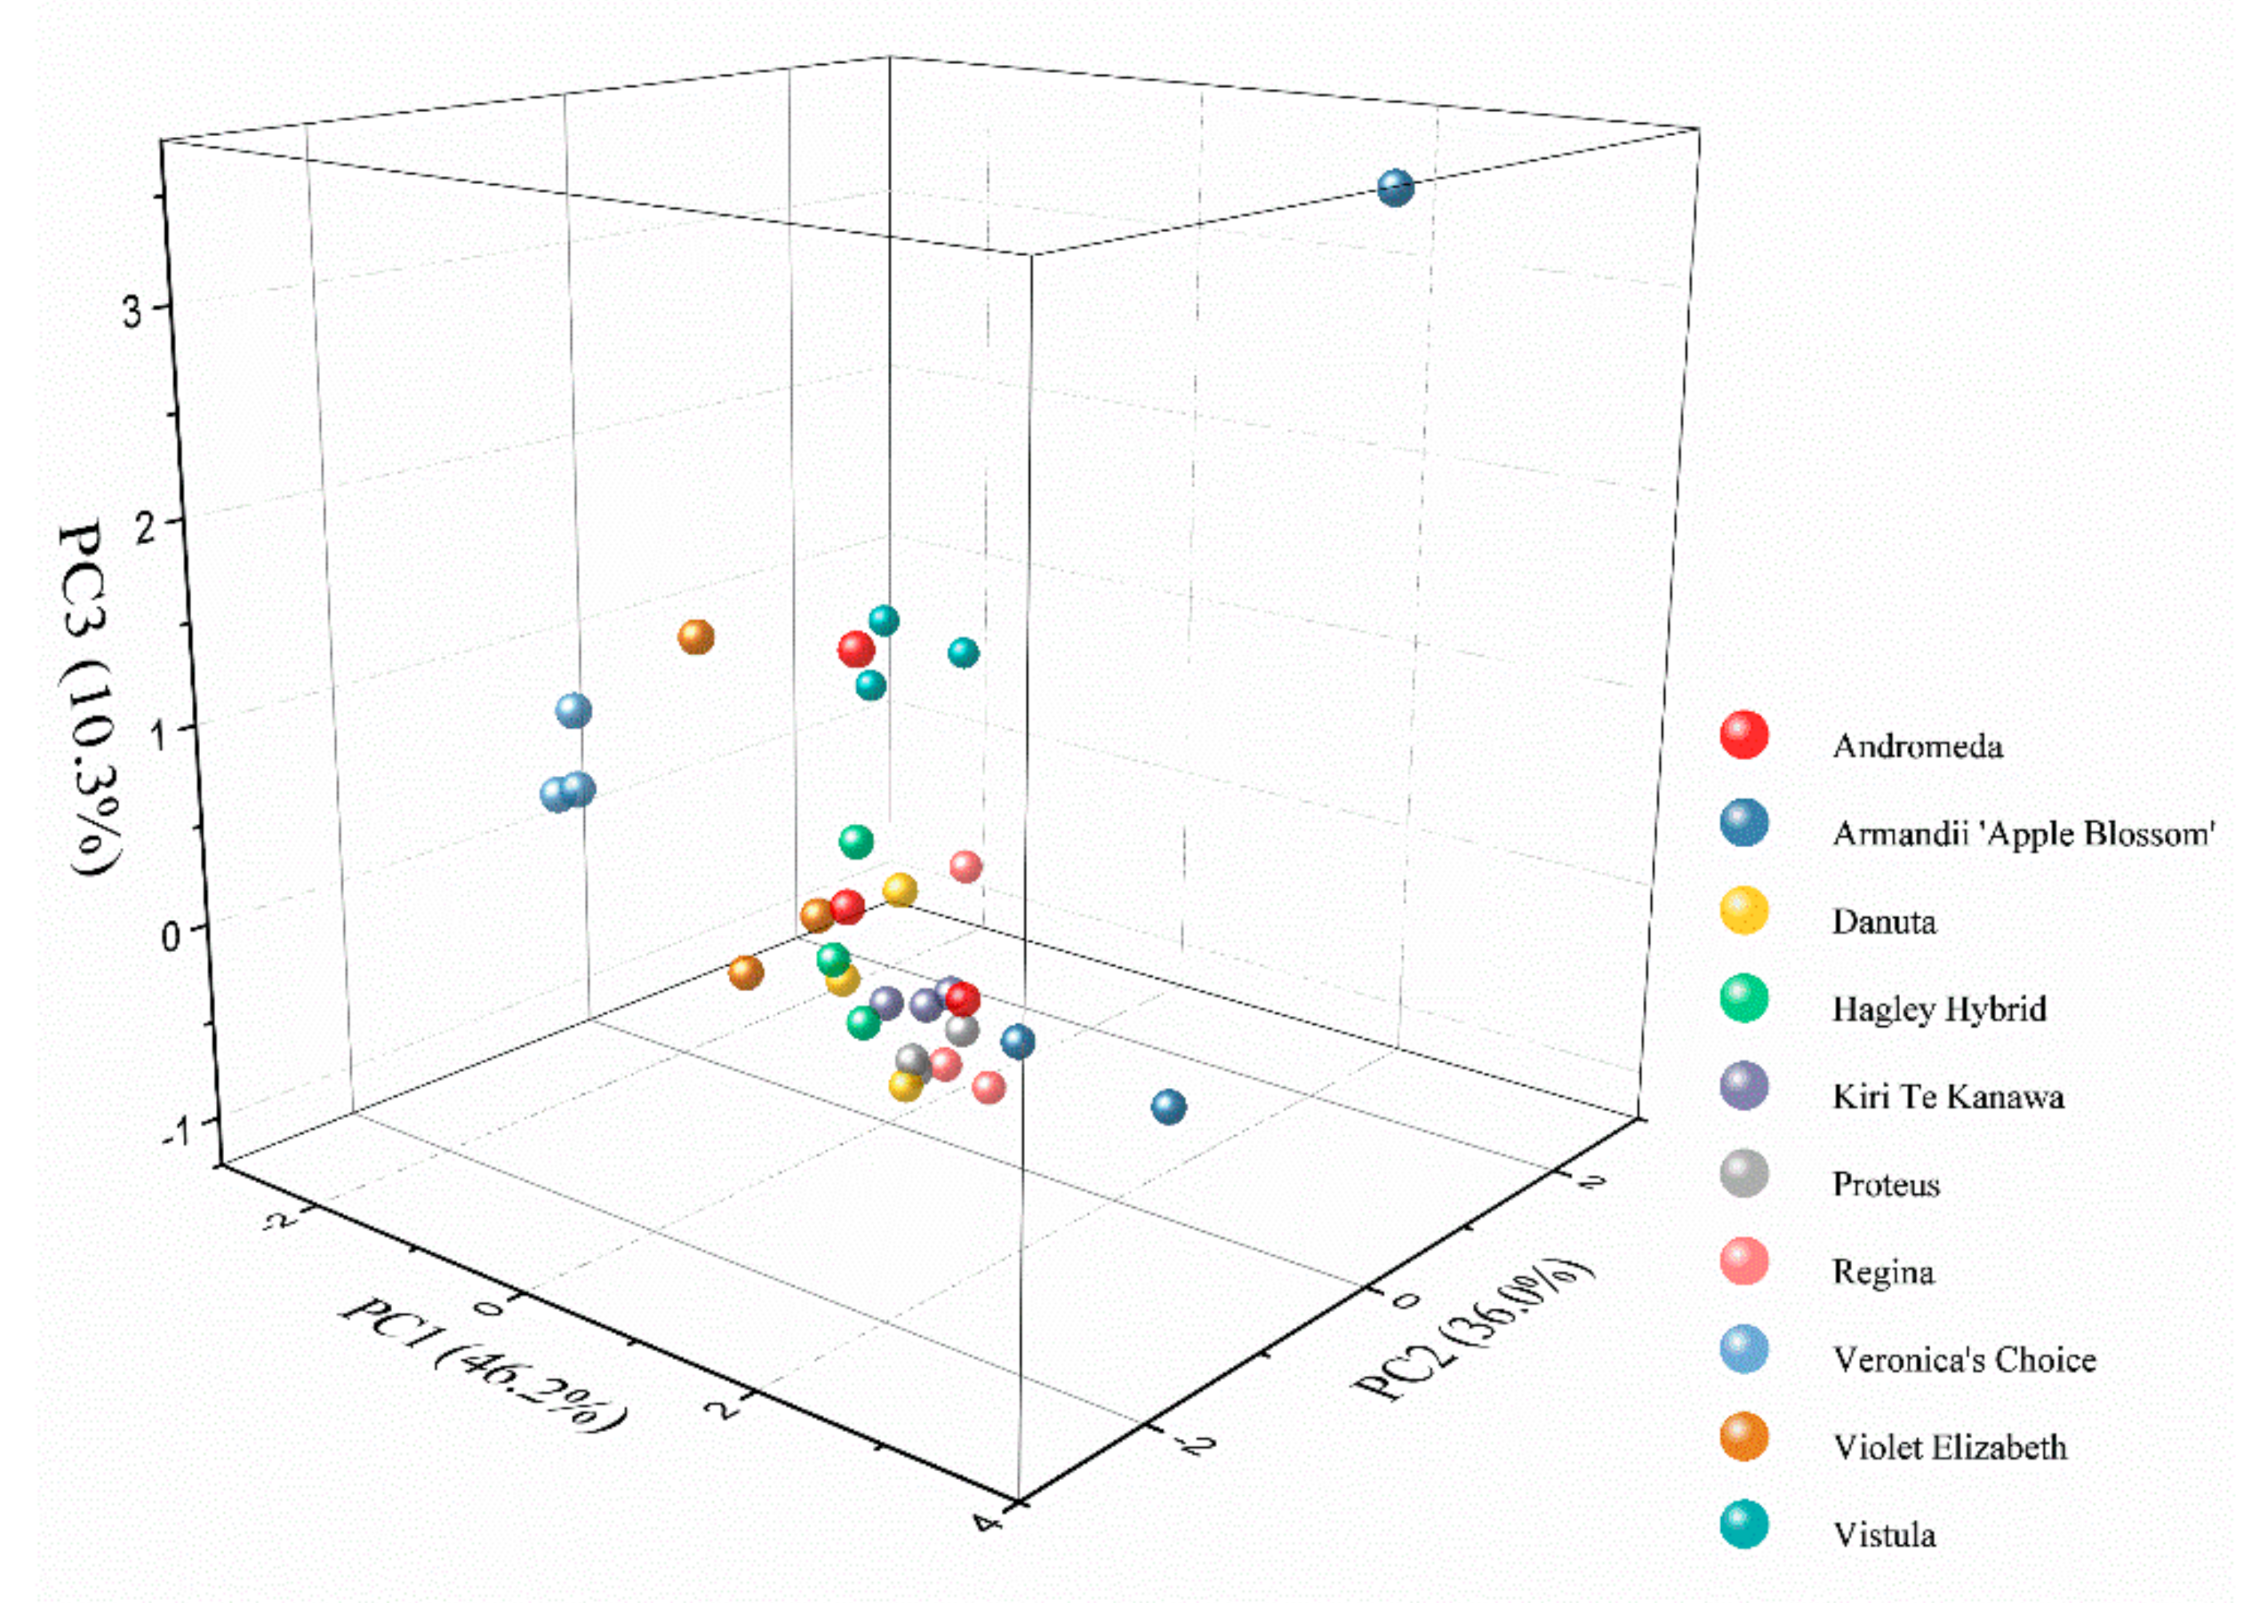
In order to further testing the difference of electrochemical profile between the species, a principal component analysis (PCA) analysis was carried out. All four sets of data (0.1 M PBS after water extraction, 0.1 M PBS after ethanol extraction, 0.1 M ABS after ethanol extraction, and 0.1 M ABS after water extraction) were submitted for the PCA analysis. As shown in Figure 7, three samples of each variety showed very close locations, suggesting the good reproducibility of the proposed method. On the other hand, the three factors extracted within the voltametric data could reach more than 90% of interpretative capability, suggesting that there were significant differences in the electrochemical profiles of the varieties. The 3D PCA grouping result showed that Danuta, Violet Elizabeth, Hagley Hybrid, and Kiri Te Kanawa were grouped in a close spatial position. In addition, Armandii ‘Apple Blossom’ and Vistula could be considered outliers among the varieties. The results suggest the obvious differences in electro-active compounds among varieties, reflecting that there may also be significant differences at the gene level.
Since the voltammograms of the varieties were positively correlated with the distribution and amount of electro-active compounds, we attempted to use the electrochemical data for dendrogram analysis. Figure 8 shows the dendrogram of Vistula, Andromeda, Danuta, Armandii ‘Apple Blossom,’ Proteus, Hagley Hybrid, Violet Elizabeth, Kiri Te Kanawa, Regina, and Veronica’s Choice deduced from the voltammograms recorded after two solvent extractions under two buffer solution conditions. The phylogenetic tree was divided into two main principal clades. The first clade consisted of the varieties of Andromeda, Danuta, Proteus, Regina, and Hagley Hybrid. The second clade consisted of the varieties of Violet Elizabeth and Veronica’s Choice. In addition, Vistula and Armandii ‘Apple Blossom’ could be considered outliers among the varieties. Based on the information in Table 1, Vistula is the only variety in late large-flowered group among them, while the Armandii ‘Apple Blossom’ is the only variety in the Armandii group. These results suggested that the difference observed in the voltammograms may be linked to the distance between the genetics.
4. Conclusions
In conclusion, the voltammograms of Vistula, Andromeda, Danuta, Armandii ‘Apple Blossom,’ Proteus, Hagley Hybrid, Violet Elizabeth, Kiri Te Kanawa, Regina, and Veronica’s Choice were recorded by a GCE using plant leaf extracts. Based on the recorded voltammograms, these varieties could be effectively identified using pattern recognition. A hot map was used for the first time for plant identification based on voltametric data. In addition, voltammograms were used for phylogenetic analysis. The dendrogram deduced from voltammograms suggests that Andromeda, Danuta, Proteus, Regina, and Hagley Hybrid are closely related, while Violet Elizabeth and Veronica’s Choice are closely related. In addition, Vistula and Armandii ‘Apple Blossom’ can be considered outliers among the varieties.
Author Contributions
Conceptualization, L.F. and Y.L.; methodology, L.F. and C.-T.L.; software, R.Y.; validation, B.F., R.Y. and S.W.; formal analysis, R.Y. and L.L.; investigation, R.Y. and B.F.; resources, S.L.; data curation, Y.Z.; writing—original draft preparation, R.Y.; writing—review and editing, Y.Z. and L.F.; visualization, B.F.; supervision, Y.L. and L.F.; project administration, L.F.; All authors have read and agreed to the published version of the manuscript.
Funding
This research was funded by National Natural Science Foundation of China (31800603) and Agriculture Science and Technology Independent Innovation Fund of Jiangsu Province (CX(20)3027).
Conflicts of Interest
The authors declare no conflict of interest.
References
- Anandan, S.; Rudolph, A.; Speck, T.; Speck, O. Comparative morphological and anatomical study of self-repair in succulent cylindrical plant organs. Flora 2018, 241, 1–7. [Google Scholar] [CrossRef]
- Sil, S.; Mallick, T.; De, K.K.; Pramanik, A.; Ghosh, A. Comparative morphological study of three species of Saraca L. (Fabaceae) by the statistical approach to find out the logic of potent morphological markers. Beni-Suef Univ. J. Basic Appl. Sci. 2018, 7, 612–619. [Google Scholar] [CrossRef]
- Yao, R.; Heinrich, M.; Zou, Y.; Reich, E.; Zhang, X.; Chen, Y.; Weckerle, C.S. Quality variation of Goji (fruits of Lycium spp.) in China: A comparative morphological and metabolomic analysis. Front. Pharmacol. 2018, 9, 151. [Google Scholar] [CrossRef] [PubMed] [Green Version]
- Pimenov, M.; Degtjareva, G.; Ostroumova, T.; Samigullin, T.; Zakharova, E. What is Seseli diffusum? A comparative morphological and molecular appraisal of a critical species of the Umbelliferae. Plant Syst. Evol. 2019, 305, 49–59. [Google Scholar] [CrossRef]
- Meng, Z.; Zhang, Z.; Yan, T.; Lin, Q.; Wang, Y.; Huang, W.; Huang, Y.; Li, Z.; Yu, Q.; Wang, J. Comprehensively characterizing the cytological features of Saccharum spontaneum by the development of a complete set of chromosome-specific oligo probes. Front. Plant Sci. 2018, 9, 1624. [Google Scholar] [CrossRef] [PubMed]
- Suzuki, A.; Hirokawa, M.; Ito, A.; Takada, N.; Higuchi, M.; Hayashi, T.; Kuma, S.; Miyauchi, A. Identification of cytological features distinguishing mucosa-associated lymphoid tissue lymphoma from reactive lymphoid proliferation using thyroid liquid-based cytology. Acta Cytol. 2018, 62, 93–98. [Google Scholar] [CrossRef]
- Song, F.; Meng, Z.; Luo, T.; Xin, J.; Xian, M.; Rao, N.; Chen, Q.; Wang, Y.; Khan, M.N.; Hu, L. Cytological identification of new-type Brassica napus materials and their physiological response to drought. Crop Pasture Sci. 2019, 70, 876–889. [Google Scholar] [CrossRef]
- Lan, Y.; Lianwei, Q.; Xin, H.; Gong, H.; Lei, J.; Xi, M. Physical mapping of rDNA and karyotype analysis in Tulipa sinkiangensis and T. schrenkii. Sci. Hortic. 2018, 240, 638–644. [Google Scholar] [CrossRef]
- Bracewell, R.; Chatla, K.; Nalley, M.J.; Bachtrog, D. Dynamic turnover of centromeres drives karyotype evolution in Drosophila. eLife 2019, 8, e49002. [Google Scholar] [CrossRef]
- Deng, H.; Cai, Z.; Xiang, S.; Guo, Q.; Huang, W.; Liang, G. Karyotype Analysis of Diploid and Spontaneously Occurring Tetraploid Blood Orange [Citrus sinensis (L.) Osbeck] Using Multicolor FISH With Repetitive DNA Sequences as Probes. Front. Plant Sci. 2019, 10, 331. [Google Scholar] [CrossRef]
- Xin, H.; Zhang, T.; Wu, Y.; Zhang, W.; Zhang, P.; Xi, M.; Jiang, J. An extraordinarily stable karyotype of the woody Populus species revealed by chromosome painting. Plant J. 2020, 101, 253–264. [Google Scholar] [CrossRef] [PubMed]
- Leontidou, K.; Vernesi, C.; De Groeve, J.; Cristofolini, F.; Vokou, D.; Cristofori, A. DNA metabarcoding of airborne pollen: New protocols for improved taxonomic identification of environmental samples. Aerobiologia 2018, 34, 63–74. [Google Scholar] [CrossRef]
- Zhang, X.; Huang, K.-Y.; Zheng, Z.; Zhang, Y.-Z.; Wan, Q.-C.; Tian, L.-P. Pollen morphology of Quercus sect. Ilex and its relevance for fossil pollen identification in southwest China. Grana 2018, 57, 401–414. [Google Scholar] [CrossRef]
- Zimmermann, B. Chemical characterization and identification of Pinaceae pollen by infrared microspectroscopy. Planta 2018, 247, 171–180. [Google Scholar] [CrossRef]
- Geisen, S.; Snoek, L.B.; ten Hooven, F.C.; Duyts, H.; Kostenko, O.; Bloem, J.; Martens, H.; Quist, C.W.; Helder, J.A.; van der Putten, W.H. Integrating quantitative morphological and qualitative molecular methods to analyse soil nematode community responses to plant range expansion. Methods Ecol. Evol. 2018, 9, 1366–1378. [Google Scholar] [CrossRef] [Green Version]
- Mi, J.; Jia, K.-P.; Wang, J.Y.; Al-Babili, S. A rapid LC-MS method for qualitative and quantitative profiling of plant apocarotenoids. Anal. Chim. Acta 2018, 1035, 87–95. [Google Scholar] [CrossRef]
- He, K.; Chang, L.; Dong, Y.; Cui, T.; Qu, J.; Liu, X.; Xu, S.; Xue, J.; Liu, J. Identification of quantitative trait loci for agronomic and physiological traits in maize (Zea mays L.) under high-nitrogen and low-nitrogen conditions. Euphytica 2018, 214, 15. [Google Scholar] [CrossRef]
- Nomura, T.; Kuchida, R.; Kitaoka, N.; Kato, Y. Molecular diversity of tuliposide B-converting enzyme in tulip (Tulipa gesneriana): Identification of the third isozyme with a distinct expression profile. Biosci. Biotechnol. Biochem. 2018, 82, 810–820. [Google Scholar] [CrossRef]
- Mano, J.; Kanameda, S.; Kuramitsu, R.; Matsuura, N.; Yamauchi, Y. Detoxification of reactive carbonyl species by glutathione transferase Tau isozymes. Front. Plant Sci. 2019, 10, 487. [Google Scholar] [CrossRef] [Green Version]
- Chaichompoo, W.; Chokchaisiri, R.; Sangkaew, A.; Pabuprapap, W.; Yompakdee, C.; Suksamrarn, A. Alkaloids with anti-human carbonic anhydrase isozyme II activity from the bulbs of Crinum asiaticum L. var. asiaticum. Phytochem. Lett. 2020, 37, 101–105. [Google Scholar] [CrossRef]
- Hussein, E.; Aly, A.; El-Awamri, A.; Habeb, M. Use of Electrophoretic Patterns of Proteins and Isozymes to Characterize Trichoderma Isolates from Cotton Roots. J. Agric. Chem. Biotechnol. 2018, 9, 219–222. [Google Scholar] [CrossRef] [Green Version]
- Caburatan, L.; Kim, J.; Park, J. Expression Profiles and Post-Translational Modifications of Phosphoenolpyruvate Carboxylase Isozymes of Bienertia sinuspersici during Leaf Development. Russ. J. Plant Physiol. 2019, 66, 738–747. [Google Scholar] [CrossRef]
- Garrido-Cardenas, J.A.; Mesa-Valle, C.; Manzano-Agugliaro, F. Trends in plant research using molecular markers. Planta 2018, 247, 543–557. [Google Scholar] [CrossRef]
- Nadeem, M.A.; Nawaz, M.A.; Shahid, M.Q.; Doğan, Y.; Comertpay, G.; Yıldız, M.; Hatipoğlu, R.; Ahmad, F.; Alsaleh, A.; Labhane, N.; et al. DNA molecular markers in plant breeding: Current status and recent advancements in genomic selection and genome editing. Biotechnol. Biotechnol. Equip. 2018, 32, 261–285. [Google Scholar] [CrossRef] [Green Version]
- Afshar, S.; Zamani, H.A.; Karimi-Maleh, H. NiO/SWCNTs coupled with an ionic liquid composite for amplified carbon paste electrode; A feasible approach for improving sensing ability of adrenalone and folic acid in dosage form. J. Pharm. Biomed. Anal. 2020, 188, 113393. [Google Scholar] [CrossRef]
- Alamgholiloo, H.; Rostamnia, S.; Hassankhani, A.; Liu, X.; Eftekhari, A.; Hasanzadeh, A.; Zhang, K.; Karimi-Maleh, H.; Khaksar, S.; Varma, R.S.; et al. Formation and stabilization of colloidal ultra-small palladium nanoparticles on diamine-modified Cr-MIL-101: Synergic boost to hydrogen production from formic acid. J. Colloid Interface Sci. 2020, 567, 126–135. [Google Scholar] [CrossRef]
- Fouladgar, M.; Karimi-Maleh, H.; Opoku, F.; Govender, P.P. Electrochemical anticancer drug sensor for determination of raloxifene in the presence of tamoxifen using graphene-CuO-polypyrrole nanocomposite structure modified pencil graphite electrode: Theoretical and experimental investigation. J. Mol. Liq. 2020, 311, 113314. [Google Scholar] [CrossRef]
- Fu, L.; Zheng, Y.; Zhang, P.; Zhang, H.; Xu, Y.; Zhou, J.; Zhang, H.; Karimi-Maleh, H.; Lai, G.; Zhao, S.; et al. Development of an electrochemical biosensor for phylogenetic analysis of Amaryllidaceae based on the enhanced electrochemical fingerprint recorded from plant tissue. Biosens. Bioelectron. 2020, 159, 112212. [Google Scholar] [CrossRef]
- Karimi-Maleh, H.; Karimi, F.; Malekmohammadi, S.; Zakariae, N.; Esmaeili, R.; Rostamnia, S.; Yola, M.L.; Atar, N.; Movaghgharnezhad, S.; Rajendran, S.; et al. An amplified voltametric sensor based on platinum nanoparticle/polyoxometalate/two-dimensional hexagonal boron nitride nanosheets composite and ionic liquid for determination of N-hydroxysuccinimide in water samples. J. Mol. Liq. 2020, 310, 113185. [Google Scholar] [CrossRef]
- Karimi-Maleh, H.; Cellat, K.; Arıkan, K.; Savk, A.; Karimi, F.; Şen, F. Palladium–Nickel nanoparticles decorated on Functionalized-MWCNT for high precision non-enzymatic glucose sensing. Mater. Chem. Phys. 2020, 250, 123042. [Google Scholar] [CrossRef]
- Karimi-Maleh, H.; Kumar, B.G.; Rajendran, S.; Qin, J.; Vadivel, S.; Durgalakshmi, D.; Gracia, F.; Soto-Moscoso, M.; Orooji, Y.; Karimi, F. Tuning of metal oxides photocatalytic performance using Ag nanoparticles integration. J. Mol. Liq. 2020, 314, 113588. [Google Scholar] [CrossRef]
- Mohanraj, J.; Durgalakshmi, D.; Rakkesh, R.A.; Balakumar, S.; Rajendran, S.; Karimi-Maleh, H. Facile synthesis of paper based graphene electrodes for point of care devices: A double stranded DNA (dsDNA) biosensor. J. Colloid Interface Sci. 2020, 566, 463–472. [Google Scholar] [CrossRef] [PubMed]
- Tavana, T.; Rezvani, A.R.; Karimi-Maleh, H. Pt-Pd-doped NiO nanoparticle decorated at single-wall carbon nanotubes: An excellent, powerful electrocatalyst for the fabrication of An electrochemical sensor to determine nalbuphine in the presence of tramadol as two opioid analgesic drugs. J. Pharm. Biomed. Anal. 2020, 189, 113397. [Google Scholar] [CrossRef] [PubMed]
- Zabihpour, T.; Shahidi, S.-A.; Karimi-Maleh, H.; Ghorbani-HasanSaraei, A. An ultrasensitive electroanalytical sensor based on MgO/SWCNTs- 1-Butyl-3-methylimidazolium bis(trifluoromethylsulfonyl)imide paste electrode for the determination of ferulic acid in the presence sulfite in food samples. Microchem. J. 2020, 154, 104572. [Google Scholar] [CrossRef]
- Jiang, M.; Wang, J.; Zhang, H. The complete plastome sequence of Clematis guniuensis (Ranunculaceae), a new plant species endemic to China. Mitochondrial DNA Part B 2020, 5, 408–409. [Google Scholar] [CrossRef] [Green Version]
- Mao, C.; Zhang, X.; Shi, J.; Chen, S. The complete chloroplast genome sequence of Clematis Montana Buch.-Ham. (Ranunculaceae) and its phylogenetic analysis. Mitochondrial DNA Part B 2020, 5, 2246–2247. [Google Scholar] [CrossRef]
- Yang, Y.-C.; Wang, N.; Zhang, W.; Zhou, T. The complete chloroplast genome of Clematis fruticosa Turcz. (Ranunculaceae). Mitochondrial DNA Part B 2020, 5, 1908–1909. [Google Scholar] [CrossRef]
- Zhou, J.; Wu, M.; Xu, Y.; Li, Z.; Yao, Y.; Fu, L. 2D Pattern Recognition of White Spirit Based on the Electrochemical Profile Recorded by Screen-Printed Electrode. Int. J. Electrochem. Sci. 2020, 15, 5793–5802. [Google Scholar] [CrossRef]
- Fu, L.; Zhang, H.; Zheng, Y.; Zhang, H.; Liu, Q. An electroanalytical method for brewing vinegar authentic identification. Rev. Mex. Ing. Química 2020, 19, 803–812. [Google Scholar]
- Fu, L.; Zheng, Y.; Zhang, P.; Zhang, H.; Wu, M.; Zhang, H.; Wang, A.; Su, W.; Chen, F.; Yu, J.; et al. An electrochemical method for plant species determination and classification based on fingerprinting petal tissue. Bioelectrochemistry 2019, 129, 199–205. [Google Scholar] [CrossRef]
- Fu, L.; Wang, Q.; Zhang, M.; Zheng, Y.; Wu, M.; Lan, Z.; Pu, J.; Zhang, H.; Chen, F.; Su, W. Electrochemical sex determination of dioecious plants using polydopamine-functionalized graphene sheets. Front. Chem. 2020, 8, 92. [Google Scholar] [CrossRef]
- Fu, L.; Wang, A.; Xie, K.; Zhu, J.; Chen, F.; Wang, H.; Zhang, H.; Su, W.; Wang, Z.; Zhou, C.; et al. Electrochemical detection of silver ions by using sulfur quantum dots modified gold electrode. Sens. Actuators B Chem. 2020, 304, 127390. [Google Scholar] [CrossRef]
- Xu, Y.; Lu, Y.; Zhang, P.; Wang, Y.; Zheng, Y.; Fu, L.; Zhang, H.; Lin, C.-T.; Yu, A. Infrageneric phylogenetics investigation of Chimonanthus based on electroactive compound profiles. Bioelectrochemistry 2020, 133, 107455. [Google Scholar] [CrossRef] [PubMed]
- Fu, L.; Wu, M.; Zheng, Y.; Zhang, P.; Ye, C.; Zhang, H.; Wang, K.; Su, W.; Chen, F.; Yu, J.; et al. Lycoris species identification and infrageneric relationship investigation via graphene enhanced electrochemical fingerprinting of pollen. Sens. Actuators B Chem. 2019, 298, 126836. [Google Scholar] [CrossRef]
- Zhang, M.; Pan, B.; Wang, Y.; Du, X.; Fu, L.; Zheng, Y.; Chen, F.; Wu, W.; Zhou, Q.; Ding, S. Recording the Electrochemical Profile of Pueraria Leaves for Polyphyly Analysis. ChemistrySelect 2020, 5, 5035–5040. [Google Scholar] [CrossRef]
- Liu, Z.; Bruins, M.E.; de Bruijn, W.J.C.; Vincken, J.-P. A comparison of the phenolic composition of old and young tea leaves reveals a decrease in flavanols and phenolic acids and an increase in flavonols upon tea leaf maturation. J. Food Compos. Anal. 2020, 86, 103385. [Google Scholar] [CrossRef]
- Arvand, M.; Farahpour, M.; Ardaki, M.S. Electrochemical characterization of in situ functionalized gold organosulfur self-assembled monolayer with conducting polymer and carbon nanotubes for determination of rutin. Talanta 2018, 176, 92–101. [Google Scholar] [CrossRef]
- Lu, Y.; Xu, Y.; Shi, H.; Zhang, P.Z.H.; Fu, L. Feasibility of electrochemical fingerprinting for plant phylogeography study: A case of Chimonanthus praecox. Int. J. Electrochem. Sci. 2020, 15, 758–764. [Google Scholar] [CrossRef]
- Xing, R.; Tong, L.; Zhao, X.; Liu, H.; Ma, P.; Zhao, J.; Liu, X.; Liu, S. Rapid and sensitive electrochemical detection of myricetin based on polyoxometalates/SnO2/gold nanoparticles ternary nanocomposite film electrode. Sens. Actuators B Chem. 2019, 283, 35–41. [Google Scholar] [CrossRef]
- Irakli, M.; Chatzopoulou, P.; Ekateriniadou, L. Optimization of ultrasound-assisted extraction of phenolic compounds: Oleuropein, phenolic acids, phenolic alcohols and flavonoids from olive leaves and evaluation of its antioxidant activities. Ind. Crop. Prod. 2018, 124, 382–388. [Google Scholar] [CrossRef]
- Di Marino, D.; Jestel, T.; Marks, C.; Viell, J.; Blindert, M.; Kriescher, S.M.; Spiess, A.C.; Wessling, M. Carboxylic acids production via electrochemical depolymerization of lignin. ChemElectroChem 2019, 6, 1434–1442. [Google Scholar] [CrossRef]
- García-Carmona, L.; González, M.C.; Escarpa, A. Nanomaterial-based electrochemical (bio)-sensing: One step ahead in diagnostic and monitoring of metabolic rare diseases. TrAC Trends Anal. Chem. 2019, 118, 29–42. [Google Scholar] [CrossRef]
- Suprun, E.V. Protein post-translational modifications–A challenge for bioelectrochemistry. TrAC Trends Anal. Chem. 2019, 116, 44–60. [Google Scholar] [CrossRef]
- Švorc, Ľ.; Haššo, M.; Sarakhman, O.; Kianičková, K.; Stanković, D.M.; Otřísal, P. A progressive electrochemical sensor for food quality control: Reliable determination of theobromine in chocolate products using a miniaturized boron-doped diamond electrode. Microchem. J. 2018, 142, 297–304. [Google Scholar] [CrossRef]
- Serrano, N.; Cetó, X.; Núñez, O.; Aragó, M.; Gámez, A.; Ariño, C.; Díaz-Cruz, J.M. Characterization and classification of Spanish paprika (Capsicum annuum L.) by liquid chromatography coupled to electrochemical detection with screen-printed carbon-based nanomaterials electrodes. Talanta 2018, 189, 296–301. [Google Scholar] [CrossRef]
- Kramer, K.; Yeboah-Awudzi, M.; Magazine, N.; King, J.M.; Xu, Z.; Losso, J.N. Procyanidin B2 rich cocoa extracts inhibit inflammation in Caco-2 cell model of in vitro celiac disease by down-regulating interferon-gamma- or gliadin peptide 31-43-induced transglutaminase-2 and interleukin-15. J. Funct. Foods 2019, 57, 112–120. [Google Scholar] [CrossRef]
- Marín-Sáez, J.; Romero-González, R.; Garrido Frenich, A. Effect of tea making and boiling processes on the degradation of tropane alkaloids in tea and pasta samples contaminated with Solanaceae seeds and coca leaf. Food Chem. 2019, 287, 265–272. [Google Scholar] [CrossRef]
- Volochanskyi, O.; Švecová, M.; Prokopec, V. Detection and identification of medically important alkaloids using the surface-enhanced Raman scattering spectroscopy. Spectrochim. Acta Part A Mol. Biomol. Spectrosc. 2019, 207, 143–149. [Google Scholar] [CrossRef]
- Baran, E.; Cakir, A.; Yazici, B. Inhibitory effect of Gentiana olivieri extracts on the corrosion of mild steel in 0.5M HCl: Electrochemical and phytochemical evaluation. Arab. J. Chem. 2019, 12, 4303–4319. [Google Scholar] [CrossRef] [Green Version]
- Chou, S.; Chen, B.; Chen, J.; Wang, M.; Wang, S.; Croft, H.; Shi, Q. Estimation of leaf photosynthetic capacity from the photochemical reflectance index and leaf pigments. Ecol. Indic. 2020, 110, 105867. [Google Scholar] [CrossRef]
- Çakal, D.; Ertan, S.; Cihaner, A.; Önal, A.M. Electrochemical and optical properties of substituted phthalimide based monomers and electrochemical polymerization of 3, 4-ethylenedioxythiophene-polyhedral oligomeric silsesquioxane (POSS) analogue. Dye. Pigment. 2019, 161, 411–418. [Google Scholar] [CrossRef]
- Xue, Y.-N.; Xue, X.-Z.; Miao, M.; Liu, J.-K. Mass preparation and anticorrosion mechanism of highly triple-effective corrosion inhibition performance for co-modified zinc phosphate-based pigments. Dye. Pigment. 2019, 161, 489–499. [Google Scholar] [CrossRef]
Figure 1.
Schematic diagram of the steps involved in the electrochemical approach applied to the of Clematis variety identification.
Figure 1.
Schematic diagram of the steps involved in the electrochemical approach applied to the of Clematis variety identification.

Figure 2.
Differential pulse voltammetry (DPV) curves of Vistula, Andromeda, Danuta, Armandii ‘Apple Blossom,’ Proteus, Hagley Hybrid, Violet Elizabeth, Kiri Te Kanawa, Regina, and Veronica’s Choice recorded in a 0.1 M phosphate buffer (PBS) after water extraction.
Figure 2.
Differential pulse voltammetry (DPV) curves of Vistula, Andromeda, Danuta, Armandii ‘Apple Blossom,’ Proteus, Hagley Hybrid, Violet Elizabeth, Kiri Te Kanawa, Regina, and Veronica’s Choice recorded in a 0.1 M phosphate buffer (PBS) after water extraction.

Figure 3.
DPV curves of Vistula, Andromeda, Danuta, Armandii ‘Apple Blossom,’ Proteus, Hagley Hybrid, Violet Elizabeth, Kiri Te Kanawa, Regina, and Veronica’s Choice recorded in a 0.1 M acetate buffer (ABS) after ethanol extraction.
Figure 3.
DPV curves of Vistula, Andromeda, Danuta, Armandii ‘Apple Blossom,’ Proteus, Hagley Hybrid, Violet Elizabeth, Kiri Te Kanawa, Regina, and Veronica’s Choice recorded in a 0.1 M acetate buffer (ABS) after ethanol extraction.

Figure 4.
Scatter plots of Vistula, Andromeda, Danuta, Armandii ‘Apple Blossom,’ Proteus, Hagley Hybrid, Violet Elizabeth, Kiri Te Kanawa, Regina, and Veronica’s Choice using data recorded from the 0.1 M PBS after water extraction vs. the 0.1 M ABS after ethanol extraction.
Figure 4.
Scatter plots of Vistula, Andromeda, Danuta, Armandii ‘Apple Blossom,’ Proteus, Hagley Hybrid, Violet Elizabeth, Kiri Te Kanawa, Regina, and Veronica’s Choice using data recorded from the 0.1 M PBS after water extraction vs. the 0.1 M ABS after ethanol extraction.

Figure 5.
2D density plots of Vistula, Andromeda, Danuta, Armandii ‘Apple Blossom,’ Proteus, Hagley Hybrid, Violet Elizabeth, Kiri Te Kanawa, Regina, and Veronica’s Choice using data recorded from the 0.1 M PBS after water extraction vs. the 0.1 M ABS after ethanol extraction.
Figure 5.
2D density plots of Vistula, Andromeda, Danuta, Armandii ‘Apple Blossom,’ Proteus, Hagley Hybrid, Violet Elizabeth, Kiri Te Kanawa, Regina, and Veronica’s Choice using data recorded from the 0.1 M PBS after water extraction vs. the 0.1 M ABS after ethanol extraction.

Figure 6.
Hot maps of Vistula, Andromeda, Danuta, Armandii ‘Apple Blossom,’ Proteus, Hagley Hybrid, Violet Elizabeth, Kiri Te Kanawa, Regina, and Veronica’s Choice using data recorded from the 0.1 M PBS after water extraction vs. the 0.1 M ABS after ethanol extraction.
Figure 6.
Hot maps of Vistula, Andromeda, Danuta, Armandii ‘Apple Blossom,’ Proteus, Hagley Hybrid, Violet Elizabeth, Kiri Te Kanawa, Regina, and Veronica’s Choice using data recorded from the 0.1 M PBS after water extraction vs. the 0.1 M ABS after ethanol extraction.

Figure 7.
3D principal component analysis (PCA) analysis of Vistula, Andromeda, Danuta, Armandii ‘Apple Blossom,’ Proteus, Hagley Hybrid, Violet Elizabeth, Kiri Te Kanawa, Regina, and Veronica’s Choice using normalized current recorded after two solvent extractions under two buffer solution conditions.

Figure 8.
Dendrogram of Vistula, Andromeda, Danuta, Armandii ‘Apple Blossom,’ Proteus, Hagley Hybrid, Violet Elizabeth, Kiri Te Kanawa, Regina, and Veronica’s Choice based on the voltammograms recorded after two solvent extractions under two buffer solution conditions.
Figure 8.
Dendrogram of Vistula, Andromeda, Danuta, Armandii ‘Apple Blossom,’ Proteus, Hagley Hybrid, Violet Elizabeth, Kiri Te Kanawa, Regina, and Veronica’s Choice based on the voltammograms recorded after two solvent extractions under two buffer solution conditions.


Table 1.
Information of Vistula, Andromeda, Danuta, Armandii ‘Apple Blossom,’ Proteus, Hagley Hybrid, Violet Elizabeth, Kiri Te Kanawa, Regina, and Veronica’s Choice.
Table 1.
Information of Vistula, Andromeda, Danuta, Armandii ‘Apple Blossom,’ Proteus, Hagley Hybrid, Violet Elizabeth, Kiri Te Kanawa, Regina, and Veronica’s Choice.
| Variety Name | Group | Approximate Height | Country of Origin | Parentage |
|---|---|---|---|---|
| Vistula | Early large-flowered group | 2.0–3.0 m | Poland | Unknown |
| Andromeda | Early large-flowered group | 2.0–4.0 m | United Kingdom | Seedling of ‘General Sikorski’ |
| Danuta | - | 2.0–2.5 m | Poland | Unknown |
| Armandii ‘Apple Blossom’ | Armandii group | 5.0–7.0 m | China | Unknown |
| Proteus | Early large-flowered group | 2.5–3.0 m | United Kingdom | C. viticella ‘Grandiflora’ x ‘Fortunei |
| Hagley Hybrid | Late large-flowered group | 2.0–3.0 m | United Kingdom | Unknown |
| Violet Elizabeth | Early large-flowered group | 2.0–3.5 m | United Kingdom | ‘Vyvyan Pennell’ x ‘Mrs. Spencer |
| Kiri Te Kanawa | Early large-flowered group | 2.0–3.0 m | United Kingdom | ‘Beauty of Worcester’ x ‘Chalcedony’ |
| Regina | Early large-flowered group | 1.5–2.0 m | Poland | Unknown |
| Veronica’s Choice | Early large-flowered group | 2.5–3.0 m | United Kingdom | ‘Vyvyan Pennell’ x ‘Percy Lake’ |
Publisher’s Note: MDPI stays neutral with regard to jurisdictional claims in published maps and institutional affiliations. |
© 2020 by the authors. Licensee MDPI, Basel, Switzerland. This article is an open access article distributed under the terms and conditions of the Creative Commons Attribution (CC BY) license (http://creativecommons.org/licenses/by/4.0/).
Share and Cite
MDPI and ACS Style
Yang, R.; Fan, B.; Wang, S.; Li, L.; Li, Y.; Li, S.; Zheng, Y.; Fu, L.; Lin, C.-T. Electrochemical Voltammogram Recording for Identifying Varieties of Ornamental Plants. Micromachines 2020, 11, 967. https://doi.org/10.3390/mi11110967
AMA Style
Yang R, Fan B, Wang S, Li L, Li Y, Li S, Zheng Y, Fu L, Lin C-T. Electrochemical Voltammogram Recording for Identifying Varieties of Ornamental Plants. Micromachines. 2020; 11(11):967. https://doi.org/10.3390/mi11110967
Chicago/Turabian StyleYang, Rutong, Boyuan Fan, Shu’an Wang, Linfang Li, Ya Li, Sumei Li, Yuhong Zheng, Li Fu, and Cheng-Te Lin. 2020. "Electrochemical Voltammogram Recording for Identifying Varieties of Ornamental Plants" Micromachines 11, no. 11: 967. https://doi.org/10.3390/mi11110967
Note that from the first issue of 2016, this journal uses article numbers instead of page numbers. See further details here.