Chemotactic Responses of Jurkat Cells in Microfluidic Flow-Free Gradient Chambers

 , , , ,
Abstract
:
1. Introduction
2. Materials and Methods
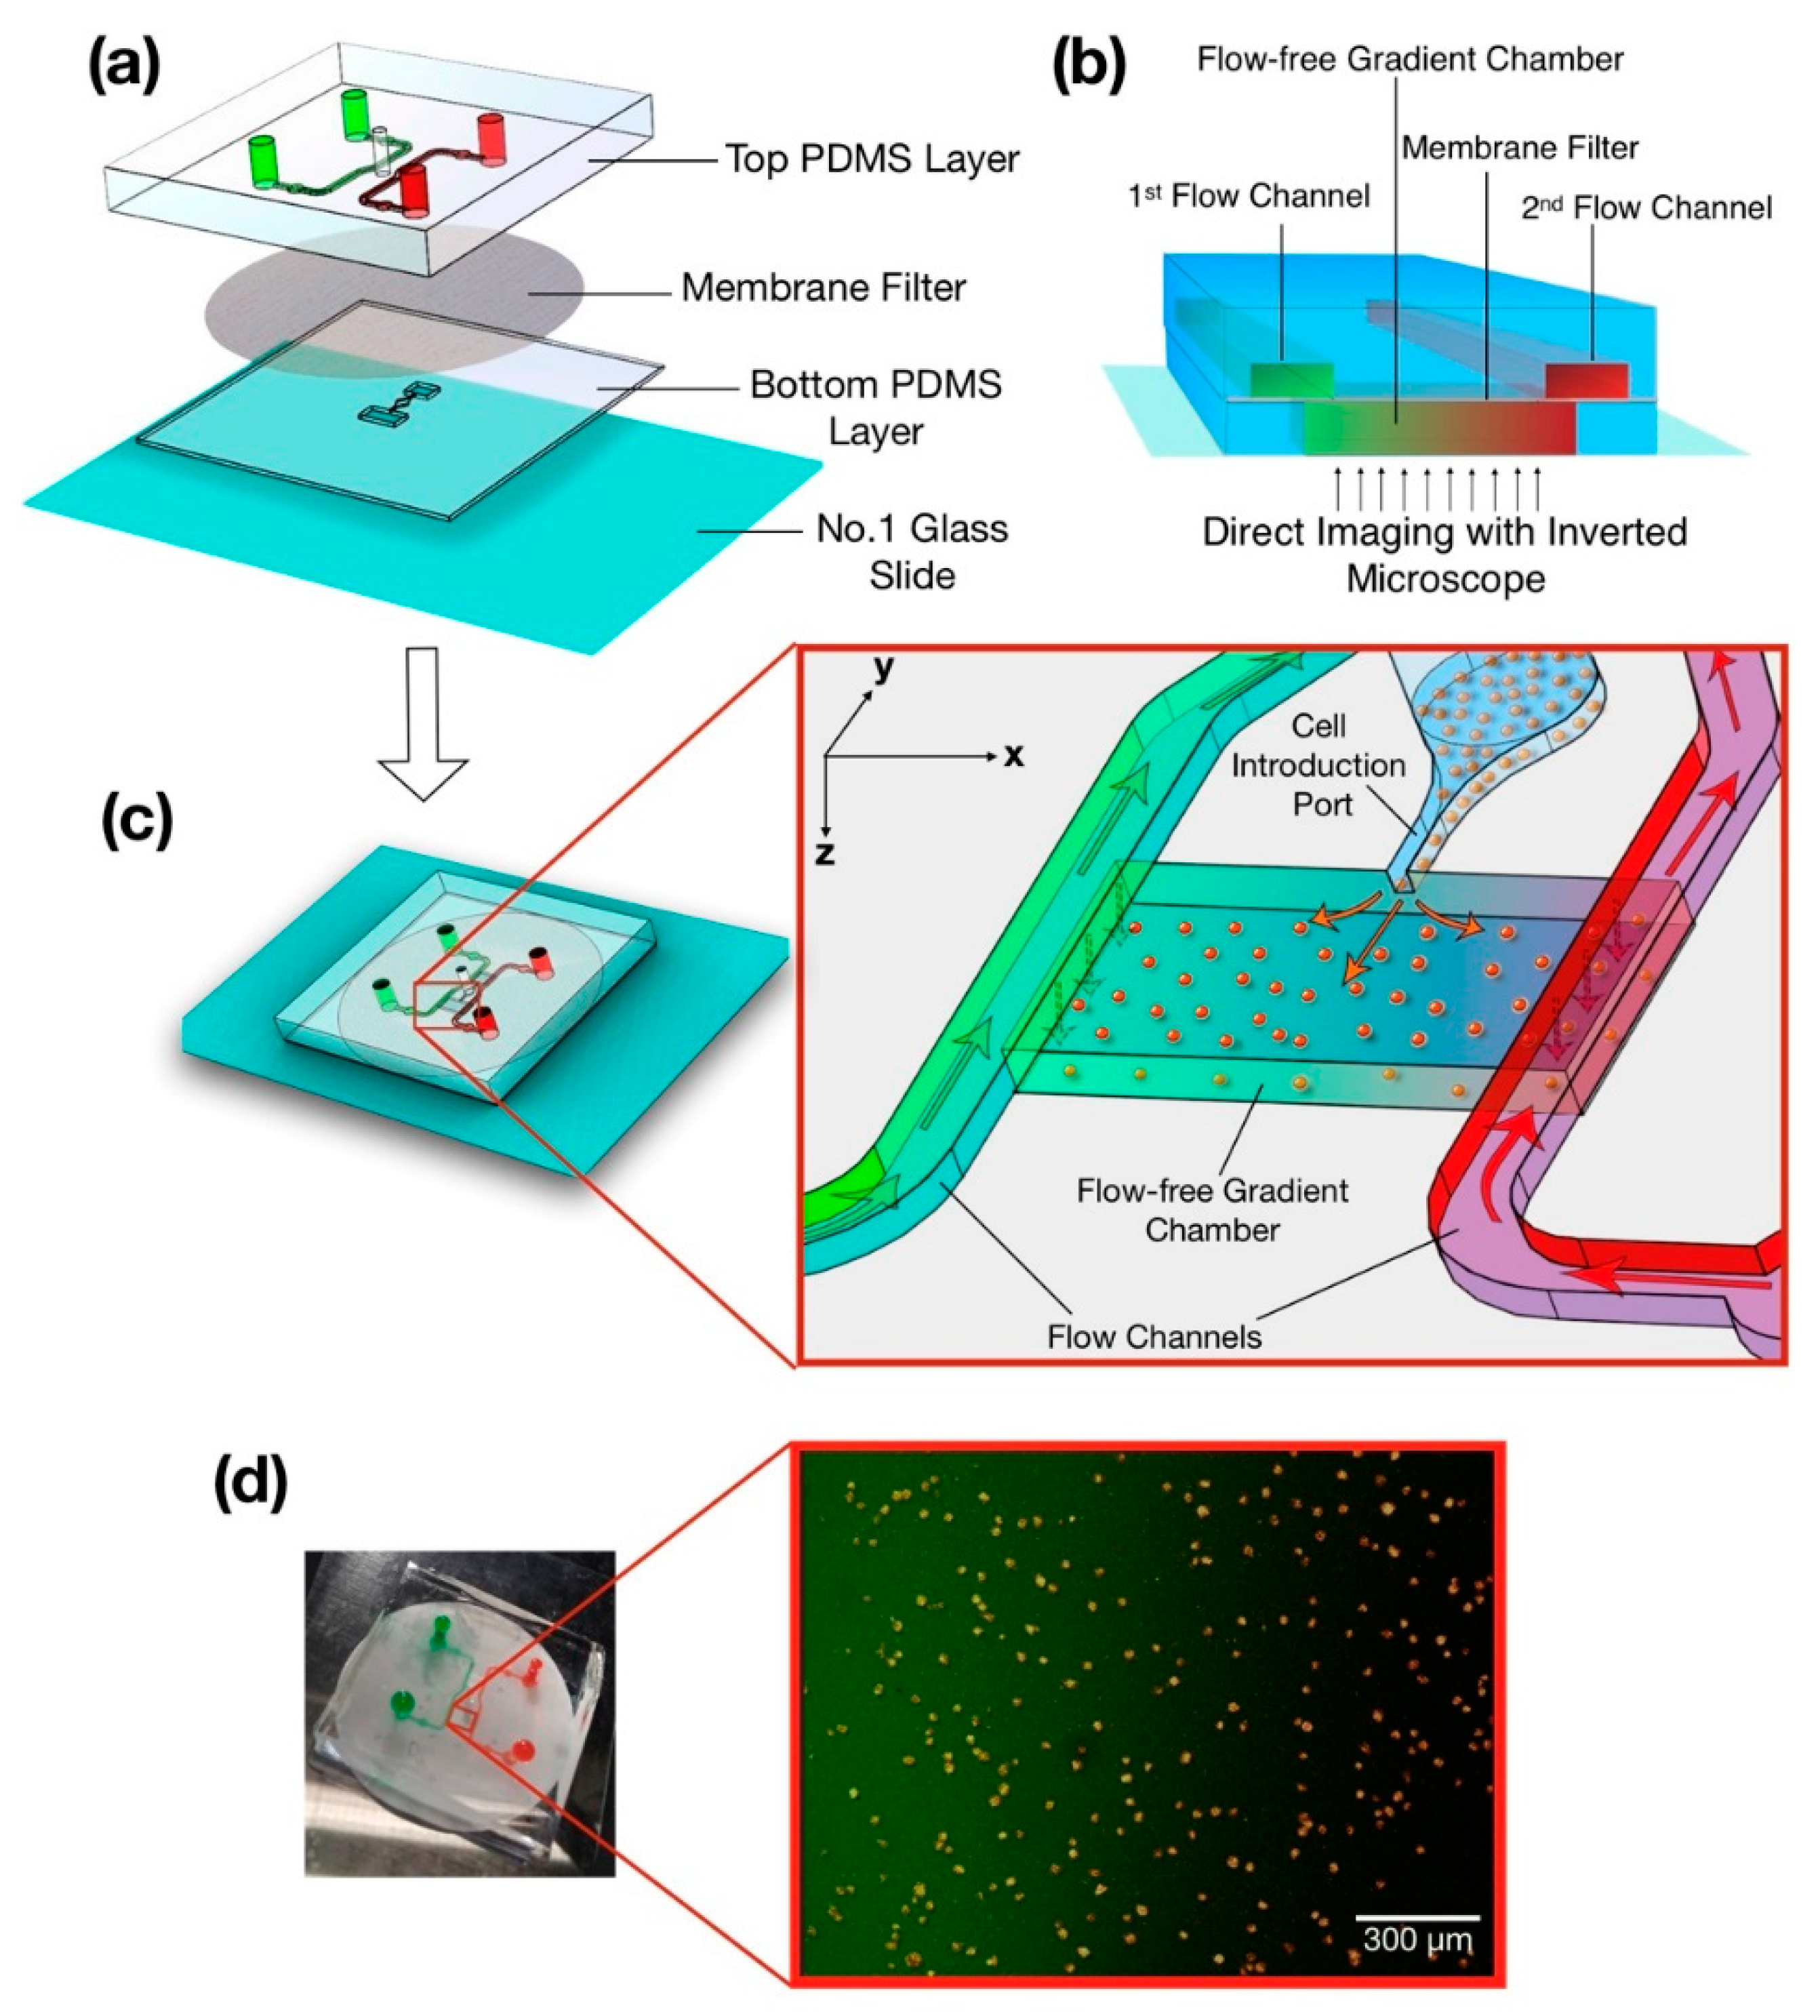
2.1. System Design
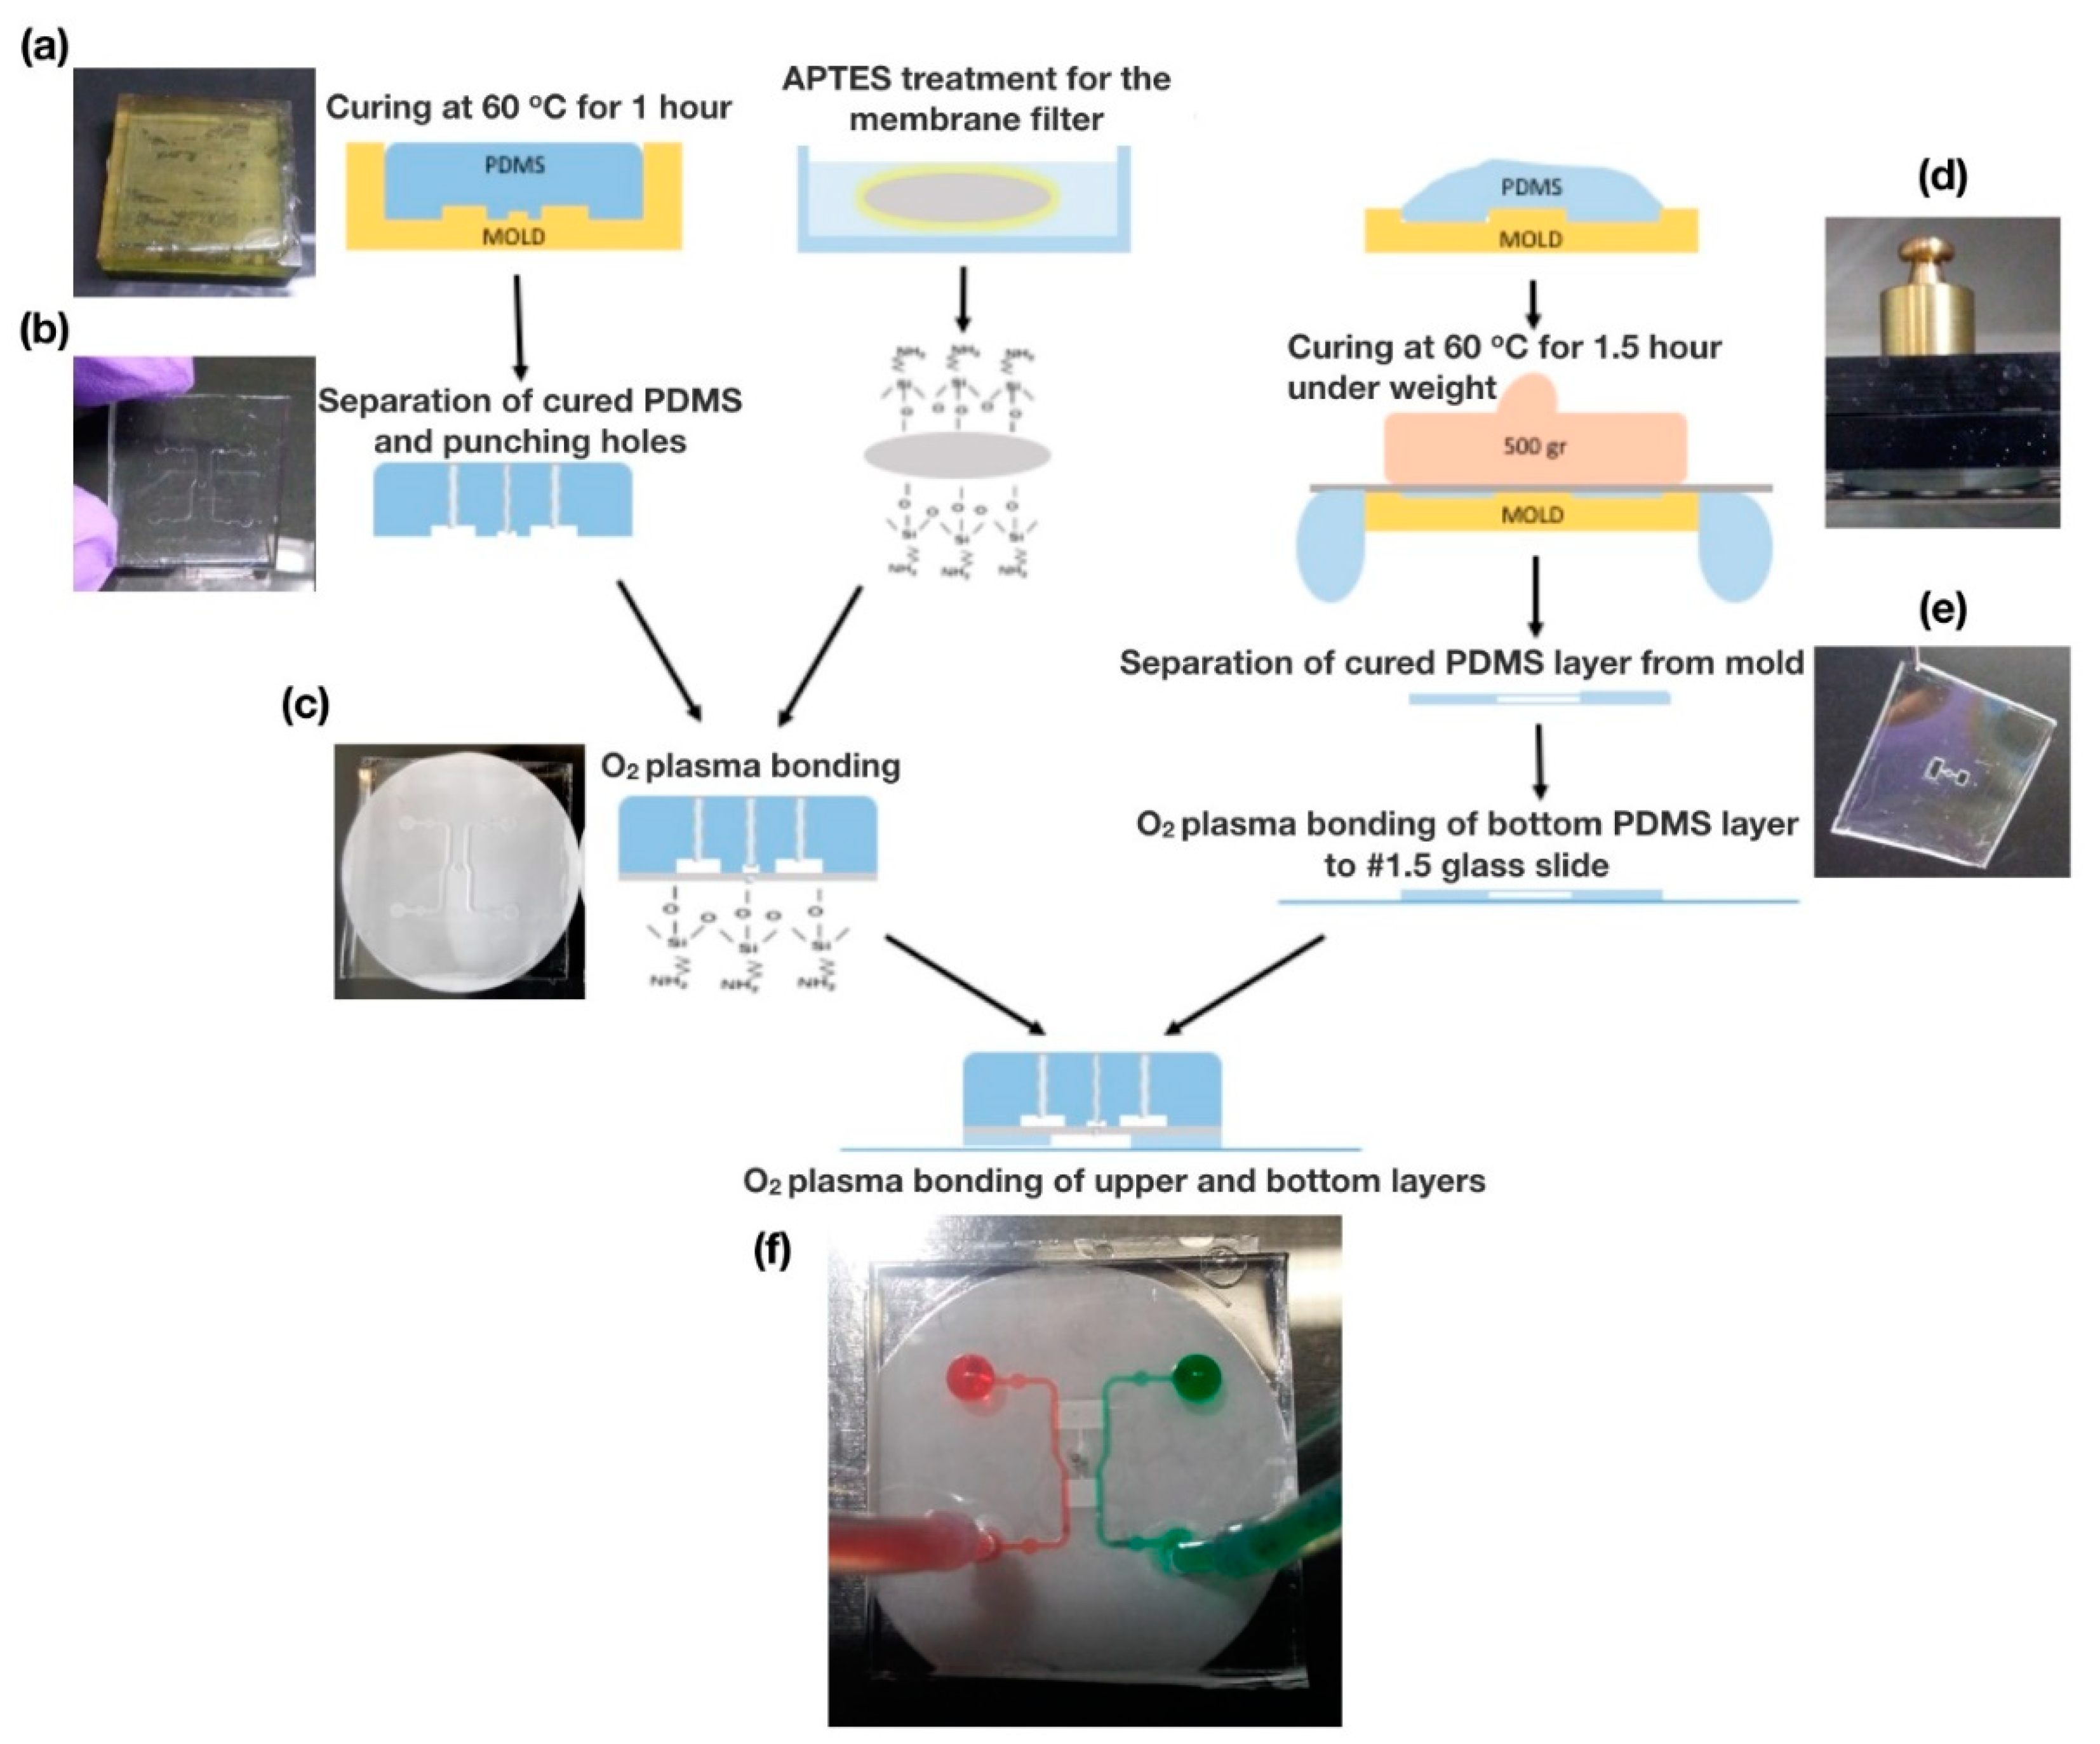
2.2. Fabrication
2.3. Experimental Setup
2.4. Cell Culture
2.5. Image Acquisition and Cell Tracking
2.6. Finite Element Modeling
2.7. Data Availability
3. Results
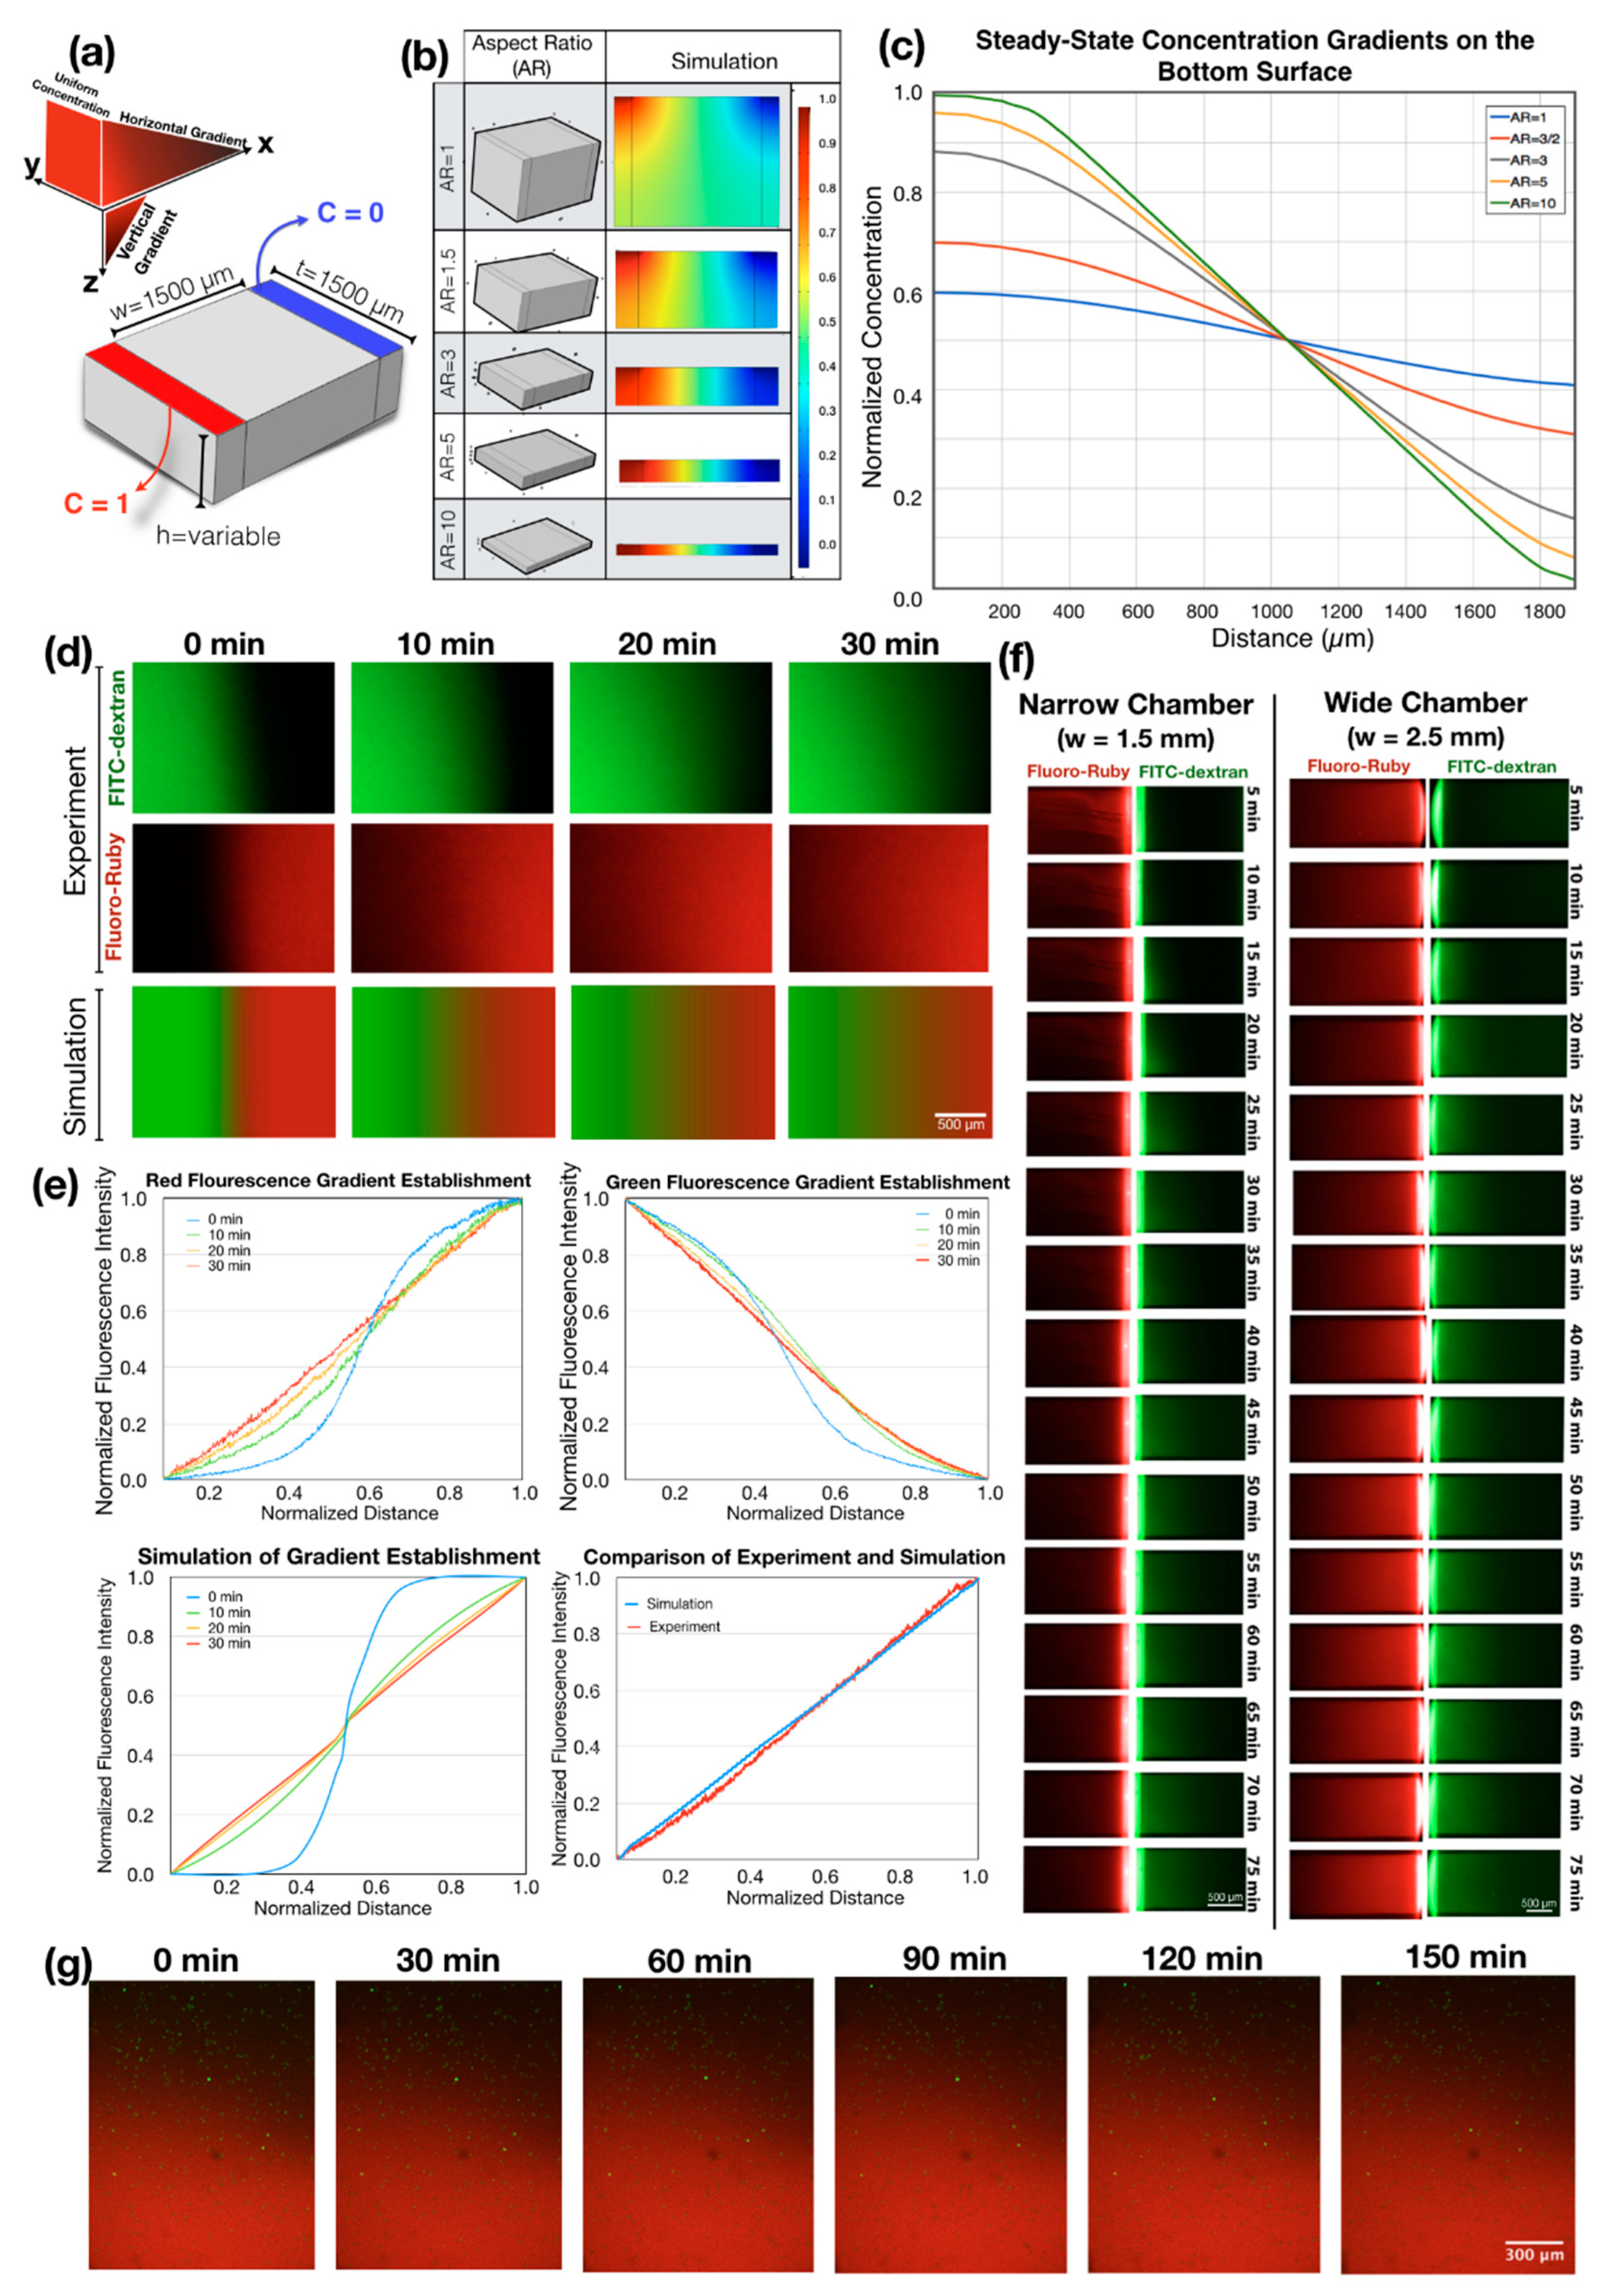
3.1. Understanding Gradient Generation in a Flow-Free Microfluidic System through Numerical Simulation
3.2. Experimental Concentration Gradient Generation
3.3. Jurkat Cell Chemotaxis
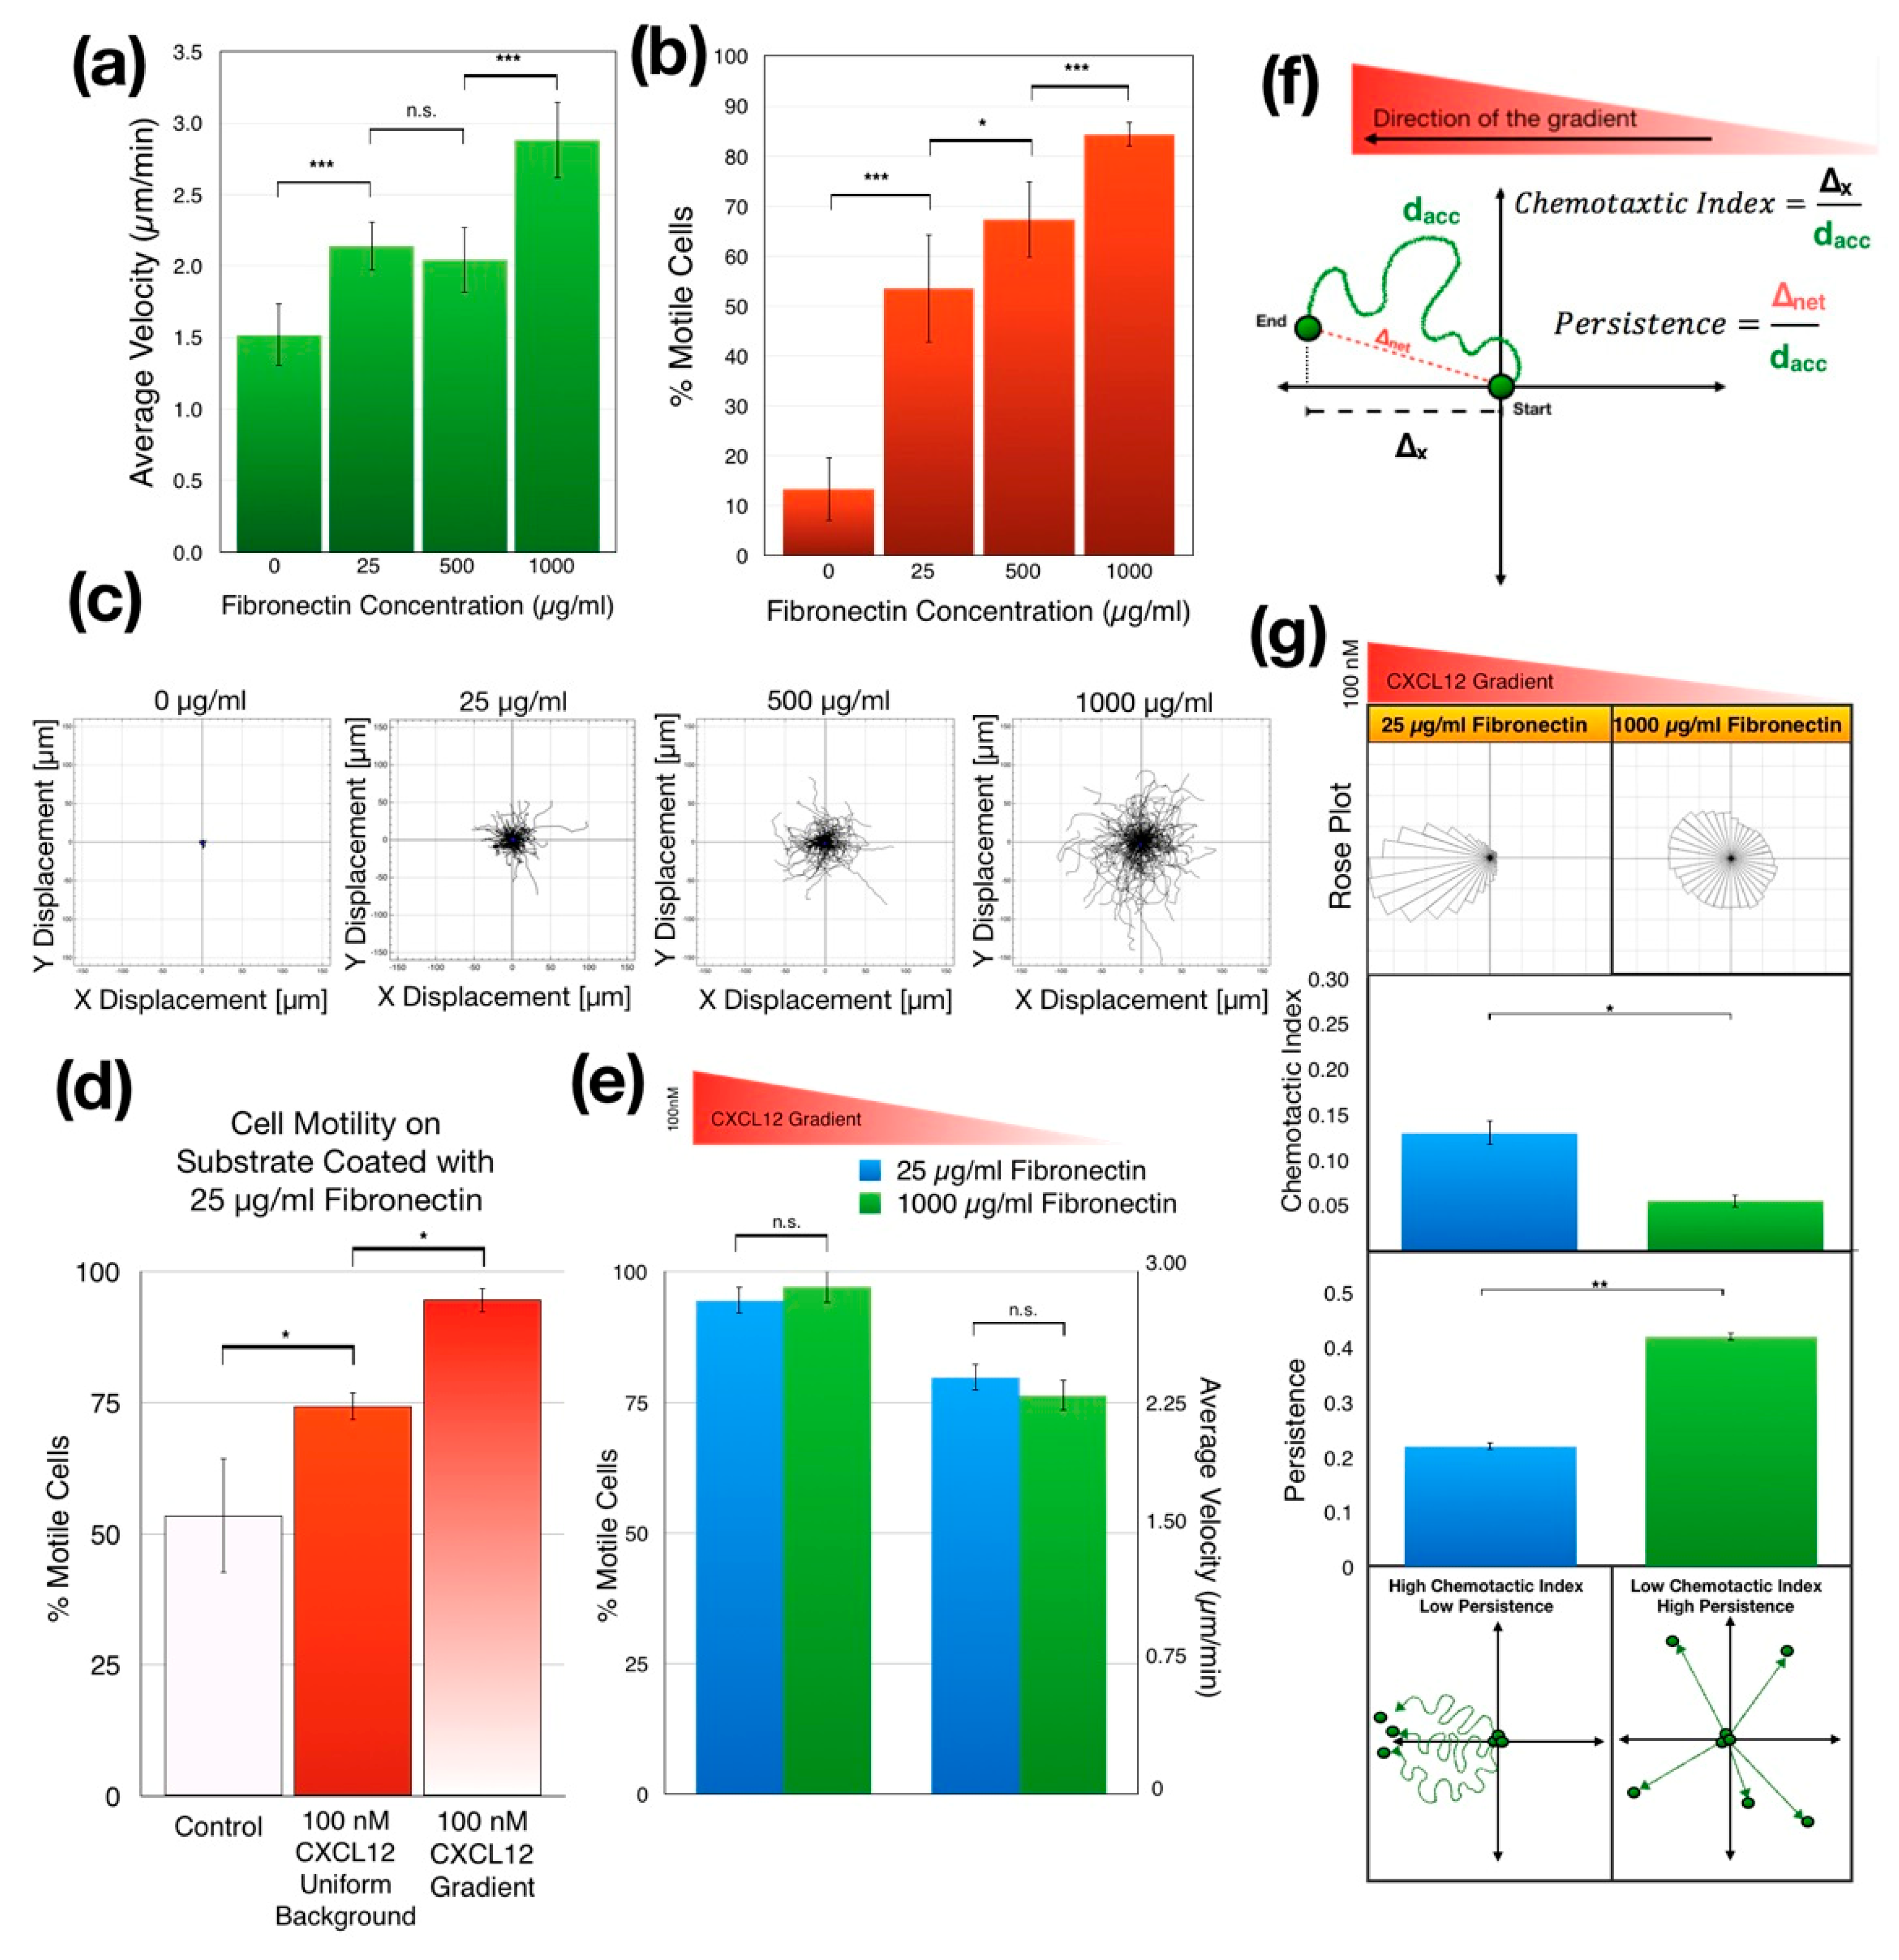
3.3.1. Increasing Substrate Fibronectin Concentrations Promote Random Cell Motility but Not Chemotaxis
3.3.2. Increasing Substrate Fibronectin Concentration Creates Random Cell Migration Background during Chemotaxis
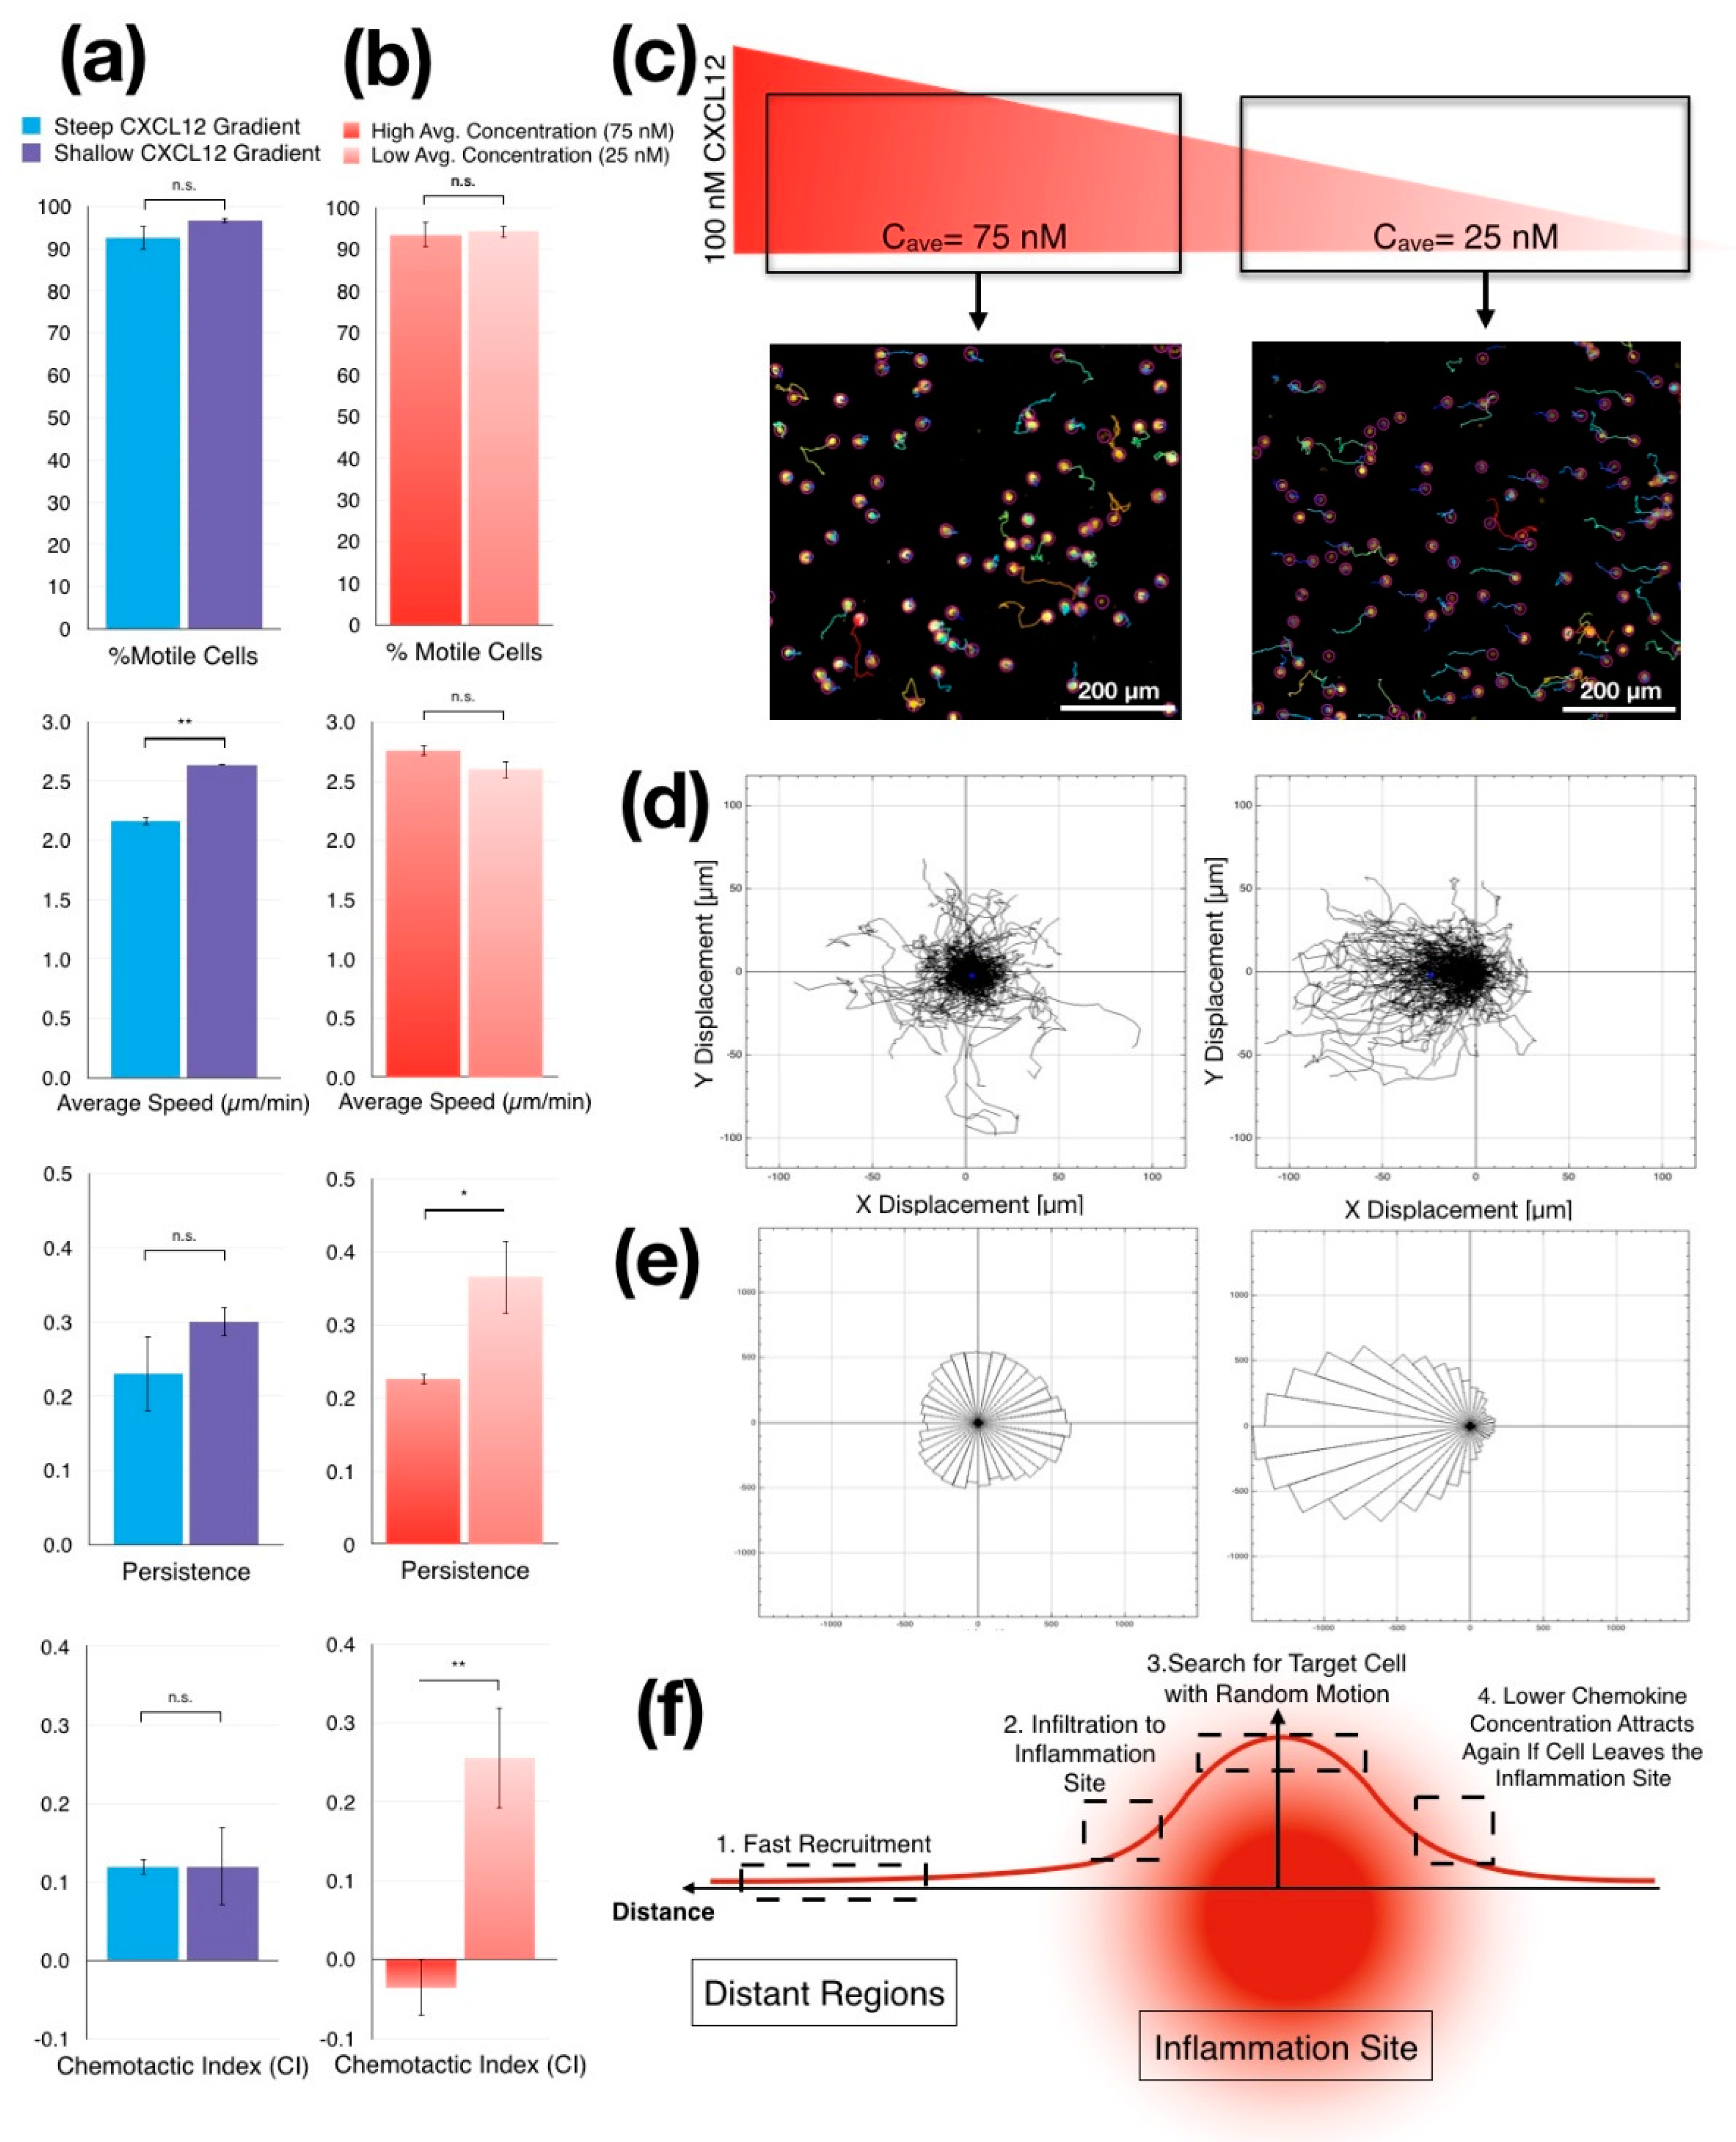
3.3.3. Jurkat Cells Migrate Faster in Shallower CXCL12 Gradient
3.3.4. Jurkat Cells Migrate Randomly in CXCL12 Gradients with High Average Concentration
4. Discussion
5. Conclusions
Supplementary Materials
Author Contributions
Funding
Acknowledgments
Conflicts of Interest
References
- Scarpa, E.; Mayor, R. Collective cell migration in development. J. Cell Biol. 2016, 212, 143–155. [Google Scholar] [CrossRef] [PubMed] [Green Version]
- Forbes, S.J.; Rosenthal, N. Preparing the ground for tissue regeneration: From mechanism to therapy. Nat. Med. 2014, 20, 857. [Google Scholar] [CrossRef] [PubMed]
- Ayala, R.; Shu, T.; Tsai, L.-H. Trekking across the brain: The journey of neuronal migration. Cell 2007, 128, 29–43. [Google Scholar] [CrossRef] [PubMed] [Green Version]
- Kunkel, E.J.; Butcher, E.C. Chemokines and the tissue-specific migration of lymphocytes. Immunity 2002, 16, 1–4. [Google Scholar] [CrossRef] [Green Version]
- Godessart, N.; Kunkel, S.L. Chemokines in autoimmune disease. Curr. Opin. Immunol. 2001, 13, 670–675. [Google Scholar] [CrossRef]
- White, G.E.; Iqbal, A.J.; Greaves, D.R. CC chemokine receptors and chronic inflammation—therapeutic opportunities and pharmacological challenges. Pharmacol. Rev. 2013, 65, 47–89. [Google Scholar] [CrossRef] [Green Version]
- Roussos, E.T.; Condeelis, J.S.; Patsialou, A. Chemotaxis in cancer. Nat. Rev. Cancer 2011, 11, 573. [Google Scholar] [CrossRef]
- Muller, A.; Homey, B.; Soto, H.; Ge, N.; Catron, D.; Buchanan, M.E.; McClanahan, T.; Murphy, E.; Yuan, W.; Wagner, S.N.; et al. Involvement of chemokine receptors in breast cancer metastasis. Nature 2001, 410, 50–56. [Google Scholar] [CrossRef]
- Gerard, C.; Rollins, B.J. Chemokines and disease. Nat. Immunol. 2001, 2, 108. [Google Scholar] [CrossRef]
- Korkmaz, E.; Friedrich, E.E.; Ramadan, M.H.; Erdos, G.; Mathers, A.R.; Ozdoganlar, O.B.; Washburn, N.R.; Falo, L.D., Jr. Therapeutic intradermal delivery of tumor necrosis factor-alpha antibodies using tip-loaded dissolvable microneedle arrays. Acta Biomater. 2015, 24, 96–105. [Google Scholar] [CrossRef]
- Restifo, N.P.; Dudley, M.E.; Rosenberg, S.A. Adoptive immunotherapy for cancer: Harnessing the T cell response. Nat. Rev. Immunol. 2012, 12, 269. [Google Scholar] [CrossRef] [PubMed]
- Boyden, S. The chemotactic effect of mixtures of antibody and antigen on polymorphonuclear leucocytes. J. Exp. Med. 1962, 115, 453–466. [Google Scholar] [CrossRef] [PubMed] [Green Version]
- Kim, Y.; Hazar, M.; Vijayraghavan, D.S.; Song, J.; Jackson, T.R.; Joshi, S.D.; Messner, W.C.; Davidson, L.A.; LeDuc, P.R. Mechanochemical actuators of embryonic epithelial contractility. Proc. Natl. Acad. Sci. USA 2014, 111, 14366–14371. [Google Scholar] [CrossRef] [PubMed] [Green Version]
- Hazar, M.; Kim, Y.; Song, J.; LeDuc, P.; Davidson, L.A.; Messner, W.C. 3D Bio-etching of a Complex Composite-like Embryonic Tissue. Lab Chip 2015, 15, 3293–3299. [Google Scholar] [CrossRef] [Green Version]
- Chung, H.H.; Chan, C.K.; Khire, T.S.; Marsh, G.A.; Clark, A., Jr.; Waugh, R.E.; McGrath, J.L. Highly permeable silicon membranes for shear free chemotaxis and rapid cell labeling. Lab. Chip 2014, 14, 2456–2468. [Google Scholar] [CrossRef] [Green Version]
- Chiu, D.T.; Di Carlo, D.; Doyle, P.S.; Hansen, C.; Maceiczyk, R.M.; Wootton, R.C. Small but perfectly formed? Successes, challenges, and opportunities for microfluidics in the chemical and biological sciences. Chem 2017, 2, 201–223. [Google Scholar] [CrossRef] [Green Version]
- Dertinger, S.K.; Chiu, D.T.; Jeon, N.L.; Whitesides, G.M. Generation of gradients having complex shapes using microfluidic networks. Anal. Chem. 2001, 73, 1240–1246. [Google Scholar] [CrossRef]
- Jeon, N.L.; Dertinger, S.K.; Chiu, D.T.; Choi, I.S.; Stroock, A.D.; Whitesides, G.M. Generation of solution and surface gradients using microfluidic systems. Langmuir 2000, 16, 8311–8316. [Google Scholar] [CrossRef]
- Beta, C.; Fröhlich, T.; Bödeker, H.U.; Bodenschatz, E. Chemotaxis in microfluidic devices—A study of flow effects. Lab Chip 2008, 8, 1087–1096. [Google Scholar] [CrossRef]
- Warren, K.; Mpagazehe, J.; LeDuc, P.; Higgs, C., III. Geometric effects in microfluidics on heterogeneous cell stress using an Eulerian–Lagrangian approach. Lab Chip 2016, 16, 593–598. [Google Scholar] [CrossRef]
- Walker, G.M.; Sai, J.; Richmond, A.; Stremler, M.; Chung, C.Y.; Wikswo, J.P. Effects of flow and diffusion on chemotaxis studies in a microfabricated gradient generator. Lab Chip 2005, 5, 611–618. [Google Scholar] [CrossRef] [PubMed] [Green Version]
- Walker, G.M.; Zeringue, H.C.; Beebe, D.J. Microenvironment design considerations for cellular scale studies. Lab Chip 2004, 4, 91–97. [Google Scholar] [CrossRef] [PubMed]
- Melchionna, R.; Porcelli, D.; Mangoni, A.; Carlini, D.; Liuzzo, G.; Spinetti, G.; Antonini, A.; Capogrossi, M.C.; Napolitano, M. Laminar shear stress inhibits CXCR4 expression on endothelial cells: Functional consequences for atherogenesis. FASEB J. 2005, 19, 629–631. [Google Scholar] [CrossRef] [PubMed]
- Cheng, S.-Y.; Heilman, S.; Wasserman, M.; Archer, S.; Shuler, M.L.; Wu, M. A hydrogel-based microfluidic device for the studies of directed cell migration. Lab Chip 2007, 7, 763–769. [Google Scholar] [CrossRef]
- Abhyankar, V.V.; Toepke, M.W.; Cortesio, C.L.; Lokuta, M.A.; Huttenlocher, A.; Beebe, D.J. A platform for assessing chemotactic migration within a spatiotemporally defined 3D microenvironment. Lab Chip 2008, 8, 1507–1515. [Google Scholar] [CrossRef] [Green Version]
- Wu, H.; Huang, B.; Zare, R.N. Generation of complex, static solution gradients in microfluidic channels. J. Am. Chem. Soc. 2006, 128, 4194–4195. [Google Scholar] [CrossRef]
- Mosadegh, B.; Huang, C.; Park, J.W.; Shin, H.S.; Chung, B.G.; Hwang, S.-K.; Lee, K.-H.; Kim, H.J.; Brody, J.; Jeon, N.L. Generation of stable complex gradients across two-dimensional surfaces and three-dimensional gels. Langmuir 2007, 23, 10910–10912. [Google Scholar] [CrossRef]
- Haring, A.P.; Thompson, E.G.; Hernandez, R.D.; Laheri, S.; Harrigan, M.E.; Lear, T.; Sontheimer, H.; Johnson, B.N. 3D Printed Multiplexed Competitive Migration Assays with Spatially Programmable Release Sources. Adv. Biosyst. 2019. [Google Scholar] [CrossRef]
- Petrie Aronin, C.E.; Zhao, Y.M.; Yoon, J.S.; Morgan, N.Y.; Prustel, T.; Germain, R.N.; Meier-Schellersheim, M. Migrating Myeloid Cells Sense Temporal Dynamics of Chemoattractant Concentrations. Immunity 2017, 47, 862–874.e3. [Google Scholar] [CrossRef]
- Toh, A.G.; Wang, Z.; Yang, C.; Nguyen, N.-T. Engineering microfluidic concentration gradient generators for biological applications. Microfluid. Nanofluidics 2014, 16, 1–18. [Google Scholar] [CrossRef] [Green Version]
- Saadi, W.; Rhee, S.W.; Lin, F.; Vahidi, B.; Chung, B.G.; Jeon, N.L. Generation of stable concentration gradients in 2D and 3D environments using a microfluidic ladder chamber. Biomed. Microdevices 2007, 9, 627–635. [Google Scholar] [CrossRef] [PubMed]
- Irimia, D.; Charras, G.; Agrawal, N.; Mitchison, T.; Toner, M. Polar stimulation and constrained cell migration in microfluidic channels. Lab Chip 2007, 7, 1783–1790. [Google Scholar] [CrossRef] [PubMed]
- Keenan, T.M.; Frevert, C.W.; Wu, A.; Wong, V.; Folch, A. A new method for studying gradient-induced neutrophil desensitization based on an open microfluidic chamber. Lab Chip 2010, 10, 116–122. [Google Scholar] [CrossRef] [Green Version]
- Mishra, S.; Pena, J.S.; Redenti, S.; Vazquez, M. A novel electro-chemotactic approach to impact the directional migration of transplantable retinal progenitor cells. Exp. Eye Res. 2019, 185, 107688. [Google Scholar] [CrossRef] [PubMed]
- Biswenger, V.; Baumann, N.; Jurschick, J.; Hackl, M.; Battle, C.; Schwarz, J.; Horn, E.; Zantl, R. Characterization of EGF-guided MDA-MB-231 cell chemotaxis in vitro using a physiological and highly sensitive assay system. PLoS ONE 2018, 13, e0203040. [Google Scholar] [CrossRef]
- Frank, T.; Tay, S. Flow-switching allows independently programmable, extremely stable, high-throughput diffusion-based gradients. Lab. Chip 2013, 13, 1273–1281. [Google Scholar] [CrossRef]
- Schwarz, J.; Bierbaum, V.; Merrin, J.; Frank, T.; Hauschild, R.; Bollenbach, T.; Tay, S.; Sixt, M.; Mehling, M. A microfluidic device for measuring cell migration towards substrate-bound and soluble chemokine gradients. Sci Rep. 2016, 6, 36440. [Google Scholar] [CrossRef]
- Wu, J.; Wu, X.; Lin, F. Recent developments in microfluidics-based chemotaxis studies. Lab Chip 2013, 13, 2484–2499. [Google Scholar] [CrossRef]
- Kothapalli, C.R.; Van Veen, E.; De Valence, S.; Chung, S.; Zervantonakis, I.K.; Gertler, F.B.; Kamm, R.D. A high-throughput microfluidic assay to study neurite response to growth factor gradients. Lab Chip 2011, 11, 497–507. [Google Scholar] [CrossRef] [Green Version]
- Atencia, J.; Morrow, J.; Locascio, L.E. The microfluidic palette: A diffusive gradient generator with spatio-temporal control. Lab Chip 2009, 9, 2707–2714. [Google Scholar] [CrossRef]
- Uzel, S.G.; Amadi, O.C.; Pearl, T.M.; Lee, R.T.; So, P.T.; Kamm, R.D. Simultaneous or Sequential Orthogonal Gradient Formation in a 3D Cell Culture Microfluidic Platform. Small 2016, 12, 612–622. [Google Scholar] [CrossRef] [PubMed] [Green Version]
- Atencia, J.; Cooksey, G.A.; Locascio, L.E. A robust diffusion-based gradient generator for dynamic cell assays. Lab Chip 2012, 12, 309–316. [Google Scholar] [CrossRef] [PubMed]
- Muinonen-Martin, A.J.; Veltman, D.M.; Kalna, G.; Insall, R.H. An improved chamber for direct visualisation of chemotaxis. PLoS ONE 2010, 5, e15309. [Google Scholar] [CrossRef] [PubMed]
- Xia, Y.; Whitesides, G.M. Soft lithography. Angew. Chem. Int. Ed. 1998, 37, 550–575. [Google Scholar] [CrossRef]
- Yazdi, A.A.; Popma, A.; Wong, W.; Nguyen, T.; Pan, Y.; Xu, J. 3D printing: An emerging tool for novel microfluidics and lab-on-a-chip applications. Microfluid. Nanofluidics 2016, 20, 50. [Google Scholar] [CrossRef]
- Ho, C.M.B.; Ng, S.H.; Li, K.H.H.; Yoon, Y.-J. 3D printed microfluidics for biological applications. Lab Chip 2015, 15, 3627–3637. [Google Scholar] [CrossRef]
- Ghosh, S.; Preet, A.; Groopman, J.E.; Ganju, R.K. Cannabinoid receptor CB2 modulates the CXCL12/CXCR4-mediated chemotaxis of T lymphocytes. Mol. Immunol. 2006, 43, 2169–2179. [Google Scholar] [CrossRef]
- Zaman, S.N.; Resek, M.E.; Robbins, S.M. Dual acylation and lipid raft association of Src-family protein tyrosine kinases are required for SDF-1/CXCL12-mediated chemotaxis in the Jurkat human T cell lymphoma cell line. J. Leukoc. Biol. 2008, 84, 1082–1091. [Google Scholar] [CrossRef] [Green Version]
- Zhou, Y.; Lin, Q. Microfluidic flow-free generation of chemical concentration gradients. Sens. Actuat B Chem. 2014, 190, 334–341. [Google Scholar] [CrossRef]
- Halldorsson, S.; Lucumi, E.; Gómez-Sjöberg, R.; Fleming, R.M.T. Advantages and challenges of microfluidic cell culture in polydimethylsiloxane devices. Biosens. Bioelectron. 2015, 63, 218–231. [Google Scholar] [CrossRef] [Green Version]
- Jóźwik, A.; Soroczyńska, M.; Witkowski, J.M.; Bryl, E. CD3 receptor modulation in Jurkat leukemic cell line. Folia Histochemica et Cytobiologica 2004, 42, 41–43. [Google Scholar] [PubMed]
- Jaqaman, K.; Loerke, D.; Mettlen, M.; Kuwata, H.; Grinstein, S.; Schmid, S.L.; Danuser, G. Robust single-particle tracking in live-cell time-lapse sequences. Nat. Methods 2008, 5, 695. [Google Scholar] [CrossRef] [PubMed] [Green Version]
- Tinevez, J.-Y.; Perry, N.; Schindelin, J.; Hoopes, G.M.; Reynolds, G.D.; Laplantine, E.; Bednarek, S.Y.; Shorte, S.L.; Eliceiri, K.W. TrackMate: An open and extensible platform for single-particle tracking. Methods 2017, 115, 80–90. [Google Scholar] [CrossRef] [PubMed]
- Maheshwari, G.; Lauffenburger, D.A. Deconstructing (and reconstructing) cell migration. Microsc. Res. Tech. 1998, 43, 358–368. [Google Scholar] [CrossRef] [Green Version]
- Tanford, C. Physical Chemistry of Macromolecules; Wiley: Hoboken, NJ, USA, 1961. [Google Scholar]
- Aran, K.; Sasso, L.A.; Kamdar, N.; Zahn, J.D. Irreversible, direct bonding of nanoporous polymer membranes to PDMS or glass microdevices. Lab Chip 2010, 10, 548–552. [Google Scholar] [CrossRef] [Green Version]
- Chueh, B.-H.; Huh, D.; Kyrtsos, C.R.; Houssin, T.; Futai, N.; Takayama, S. Leakage-free bonding of porous membranes into layered microfluidic array systems. Anal. Chem. 2007, 79, 3504–3508. [Google Scholar] [CrossRef] [Green Version]
- Wu, H.; Huang, B.; Zare, R.N. Construction of microfluidic chips using polydimethylsiloxane for adhesive bonding. Lab Chip 2005, 5, 1393–1398. [Google Scholar] [CrossRef]
- Weninger, W.; von Andrian, U.H. Chemokine regulation of naıve T cell traffic in health and disease. In Proceedings of Seminars in Immunology; Academic Press: Cambridge, MA, USA, 2003; pp. 257–270. [Google Scholar]
- Debes, G.F.; Arnold, C.N.; Young, A.J.; Krautwald, S.; Lipp, M.; Hay, J.B.; Butcher, E.C. Chemokine receptor CCR7 required for T lymphocyte exit from peripheral tissues. Nat. Immunol. 2005, 6, 889. [Google Scholar] [CrossRef] [Green Version]
- Wu, X.; Wu, J.; Li, H.; Legler, D.F.; Marshall, A.J.; Lin, F. Analysis of CCR7 mediated T cell transfectant migration using a microfluidic gradient generator. J. Immunol. Methods 2015, 419, 9–17. [Google Scholar] [CrossRef] [Green Version]
- Nagy, K.; Sipos, O.; Valkai, S.; Gombai, É.; Hodula, O.; Kerényi, Á.; Ormos, P.; Galajda, P. Microfluidic study of the chemotactic response of Escherichia coli to amino acids, signaling molecules and secondary metabolites. Biomicrofluidics 2015, 9, 044105. [Google Scholar] [CrossRef] [Green Version]
- Butler, J.T.; Samantaray, S.; Beeson, C.C.; Ray, S.K.; Banik, N.L. Involvement of calpain in the process of Jurkat T cell chemotaxis. J. Neurosci. Res. 2009, 87, 626–635. [Google Scholar] [CrossRef] [PubMed] [Green Version]
- Berthier, E.; Surfus, J.; Verbsky, J.; Huttenlocher, A.; Beebe, D. An arrayed high-content chemotaxis assay for patient diagnosis. Integr. Biol. 2010, 2, 630–638. [Google Scholar] [CrossRef] [PubMed] [Green Version]
- Nandagopal, S.; Wu, D.; Lin, F. Combinatorial guidance by CCR7 ligands for T lymphocytes migration in co-existing chemokine fields. PLoS ONE 2011, 6, e18183. [Google Scholar] [CrossRef] [PubMed] [Green Version]
- Mehling, M.; Frank, T.; Albayrak, C.; Tay, S. Real-time tracking, retrieval and gene expression analysis of migrating human T cells. Lab Chip 2015, 15, 1276–1283. [Google Scholar] [CrossRef] [PubMed]
- Håkansson, L.; Venge, P. The combined action of hyaluronic acid and fibronectin stimulates neutrophil migration. J. Immunol. 1985, 135, 2735–2739. [Google Scholar]
- Lacalle, R.A.; Gómez-Moutón, C.; Barber, D.F.; Jiménez-Baranda, S.; Mira, E.; Martínez, A.C.; Carrera, A.C.; Mañes, S. PTEN regulates motility but not directionality during leukocyte chemotaxis. J. Cell Sci. 2004, 117, 6207–6215. [Google Scholar] [CrossRef] [Green Version]
- Griffith, J.W.; Sokol, C.L.; Luster, A.D. Chemokines and chemokine receptors: Positioning cells for host defense and immunity. Annu. Rev. Immunol. 2014, 32, 659–702. [Google Scholar] [CrossRef] [Green Version]
- Crank, J. The Mathematics of Diffusion; Oxford University Press: Oxford, UK, 1979. [Google Scholar]
- Skoge, M.; Adler, M.; Groisman, A.; Levine, H.; Loomis, W.F.; Rappel, W.-J. Gradient sensing in defined chemotactic fields. Integr. Biol. 2010, 2, 659–668. [Google Scholar] [CrossRef]
- Kolaczkowska, E.; Kubes, P. Neutrophil recruitment and function in health and inflammation. Nat. Rev. Immunol. 2013, 13, 159. [Google Scholar] [CrossRef]
- Parent, C.A.; Blacklock, B.J.; Froehlich, W.M.; Murphy, D.B.; Devreotes, P.N. G protein signaling events are activated at the leading edge of chemotactic cells. Cell 1998, 95, 81–91. [Google Scholar] [CrossRef] [Green Version]
- Andrew, N.; Insall, R.H. Chemotaxis in shallow gradients is mediated independently of PtdIns 3-kinase by biased choices between random protrusions. Nat. Cell Biol 2007, 9, 193–200. [Google Scholar] [CrossRef] [PubMed]
- Summers, C.; Rankin, S.M.; Condliffe, A.M.; Singh, N.; Peters, A.M.; Chilvers, E.R. Neutrophil kinetics in health and disease. Trends Immunol. 2010, 31, 318–324. [Google Scholar] [CrossRef] [PubMed] [Green Version]
- Owen, J.A.; Punt, J.; Stranford, S.A. Kuby Immunology; WH Freeman: New York, NY, USA, 2013. [Google Scholar]


© 2020 by the authors. Licensee MDPI, Basel, Switzerland. This article is an open access article distributed under the terms and conditions of the Creative Commons Attribution (CC BY) license (http://creativecommons.org/licenses/by/4.0/).
Share and Cite
Sonmez, U.M.; Wood, A.; Justus, K.; Jiang, W.; Syed-Picard, F.; LeDuc, P.R.; Kalinski, P.; Davidson, L.A. Chemotactic Responses of Jurkat Cells in Microfluidic Flow-Free Gradient Chambers. Micromachines 2020, 11, 384. https://doi.org/10.3390/mi11040384
Sonmez UM, Wood A, Justus K, Jiang W, Syed-Picard F, LeDuc PR, Kalinski P, Davidson LA. Chemotactic Responses of Jurkat Cells in Microfluidic Flow-Free Gradient Chambers. Micromachines. 2020; 11(4):384. https://doi.org/10.3390/mi11040384
Chicago/Turabian StyleSonmez, Utku M., Adam Wood, Kyle Justus, Weijian Jiang, Fatima Syed-Picard, Philip R. LeDuc, Pawel Kalinski, and Lance A. Davidson. 2020. "Chemotactic Responses of Jurkat Cells in Microfluidic Flow-Free Gradient Chambers" Micromachines 11, no. 4: 384. https://doi.org/10.3390/mi11040384