Characterization of Single-Nucleus Electrical Properties by Microfluidic Constriction Channel
by

Hongyan Liang
1,2,†, 
Yi Zhang
1,2,†,
Deyong Chen
1,2,
Huiwen Tan
1,2,
Yu Zheng
3,
Junbo Wang
1,2,* and 
Jian Chen
1,2,* 1
State Key Laboratory of Transducer Technology, Aerospace Information Research Institute, Chinese Academy of Sciences, Beijing 100094, China
2
School of Electronic, Electrical and Communication Engineering, University of Chinese Academy of Sciences, Beijing 101408, China
3
Shandong University, Jinan 250100, China
*
Authors to whom correspondence should be addressed.
†
Co-first authors.
Micromachines 2019, 10(11), 740; https://doi.org/10.3390/mi10110740
Submission received: 27 September 2019
/
Revised: 26 October 2019
/
Accepted: 29 October 2019
/
Published: 31 October 2019
(This article belongs to the Special Issue Micro/Nanofluidic Devices for Single Cell Analysis, Volume II)
Abstract
:As key bioelectrical markers, equivalent capacitance (Cne, i.e., capacitance per unit area) and resistance (Rne, i.e., resistivity multiply thickness) of nuclear envelopes have emerged as promising electrical indicators, which cannot be effectively measured by conventional approaches. In this study, single nuclei were isolated from whole cells and trapped at the entrances of microfluidic constriction channels, and then corresponding impedance profiles were sampled and translated into single-nucleus Cne and Rne based on a home-developed equivalent electrical model. Cne and Rne of A549 nuclei were first quantified as 3.43 ± 1.81 μF/cm2 and 2.03 ± 1.40 Ω·cm2 (Nn = 35), which were shown not to be affected by variations of key parameters in nuclear isolation and measurement. The developed approach in this study was also used to measure a second type of nuclei, producing Cne and Rne of 3.75 ± 3.17 μF/cm2 and 1.01 ± 0.70 Ω·cm2 for SW620 (Nn = 17). This study may provide a new perspective in single-cell electrical characterization, enabling cell type classification and cell status evaluation based on bioelectrical markers of nuclei.
1. Introduction
Nuclear envelope defines a bilayer membrane that encloses the genome from the rest of the cell and regulates the movements of molecules across the nuclear-cytoplasmic boundary. As key bioelectrical markers, equivalent capacitance (Cne, i.e., capacitance per unit area) and resistance (Rne, i.e., resistivity multiply thickness) of the nuclear envelope have emerged as promising electrical indicators related to salivary gland cells with changes in developments [1,2,3,4,5,6], oocytes isolated from different species [7,8,9,10,11,12,13], normal and malignant white blood cells [14,15,16,17,18,19,20], yeasts with changes in extracellular solutions [21,22], epithelia cell lines from multiple sources [23,24,25,26,27,28,29,30,31,32,33,34,35,36] and differentiation of stem cells [37]. A summary of previously reported electrical parameters of single nuclei could be found in Table S1.
Patch clamping was initially adopted to characterize electrical properties of nuclear envelopes, where two glass pipettes were deployed within the nuclear and cytoplasmic domains, respectively, enabling the quantitation of Cne and Rne [1,2,3,4,5,6,7,8,9,23,38,39,40]. Based on this approach, Cne and Rne of single nuclei were characterized as 412 ± 62 μF/cm2 and 1.5 ± 0.4 Ω·cm2 [1], ~100 μF/cm2 and 3.9 ± 1.4 Ω·cm2 [2], 0.72 ± 0.09 Ω·cm2 [4] and 2 Ω·cm2 [6] of salivary gland cells of Drosophila flavorepleta. Although powerful, patch clamping was mostly used to measure ultra large cells with diameters of nearly 100 μm and it is full of challenges to accurately penetrate nuclear domains of conventional eukaryotic cells with diameters around 10 μm.
In a second approach, two electrodes were inserted into cell suspensions and the corresponding impedance data were interpreted into both electrical parameters of cell membranes and nucleus [15,17,18,21,24,25,28,29,31,34,36,41,42,43,44,45]. Based on this approach, Cne and Rne of nuclei derived from mouse spleen lymphocytes, human Jurkat cells and rat H9C2 cells were quantified as 0.62 μF/cm2 and 0.07 Ω·cm2 [15], 1.19 ± 0.14 μF/cm2 and 0.21 ± 0.02 Ω·cm2 [36], 0.22 ± 0.05 μF/cm2 and 7.25 ± 0.68 Ω·cm2 [34], respectively. However, this is an approach based on cell populations rather than single cells where potential concerns of interactions among neighboring cells during measurements cannot be properly addressed.
In order to address this issue, electrorotation was adopted for the characterization of single-nucleus electrical properties where single cells were forced to rotate by four electrodes and the rotating speeds as a function of the applied electrical signals were used to estimate electrical properties of nuclear envelopes [14,16,19,25,46]. However, in this approach, a double shell electrical model representing cell and nuclear membranes was used. Thus, capacitive properties of cell membranes may mask electrical properties of nuclear membranes at the low-frequency domain, while at the high-frequency domain, both cell membranes and nuclear membranes are short circuited.
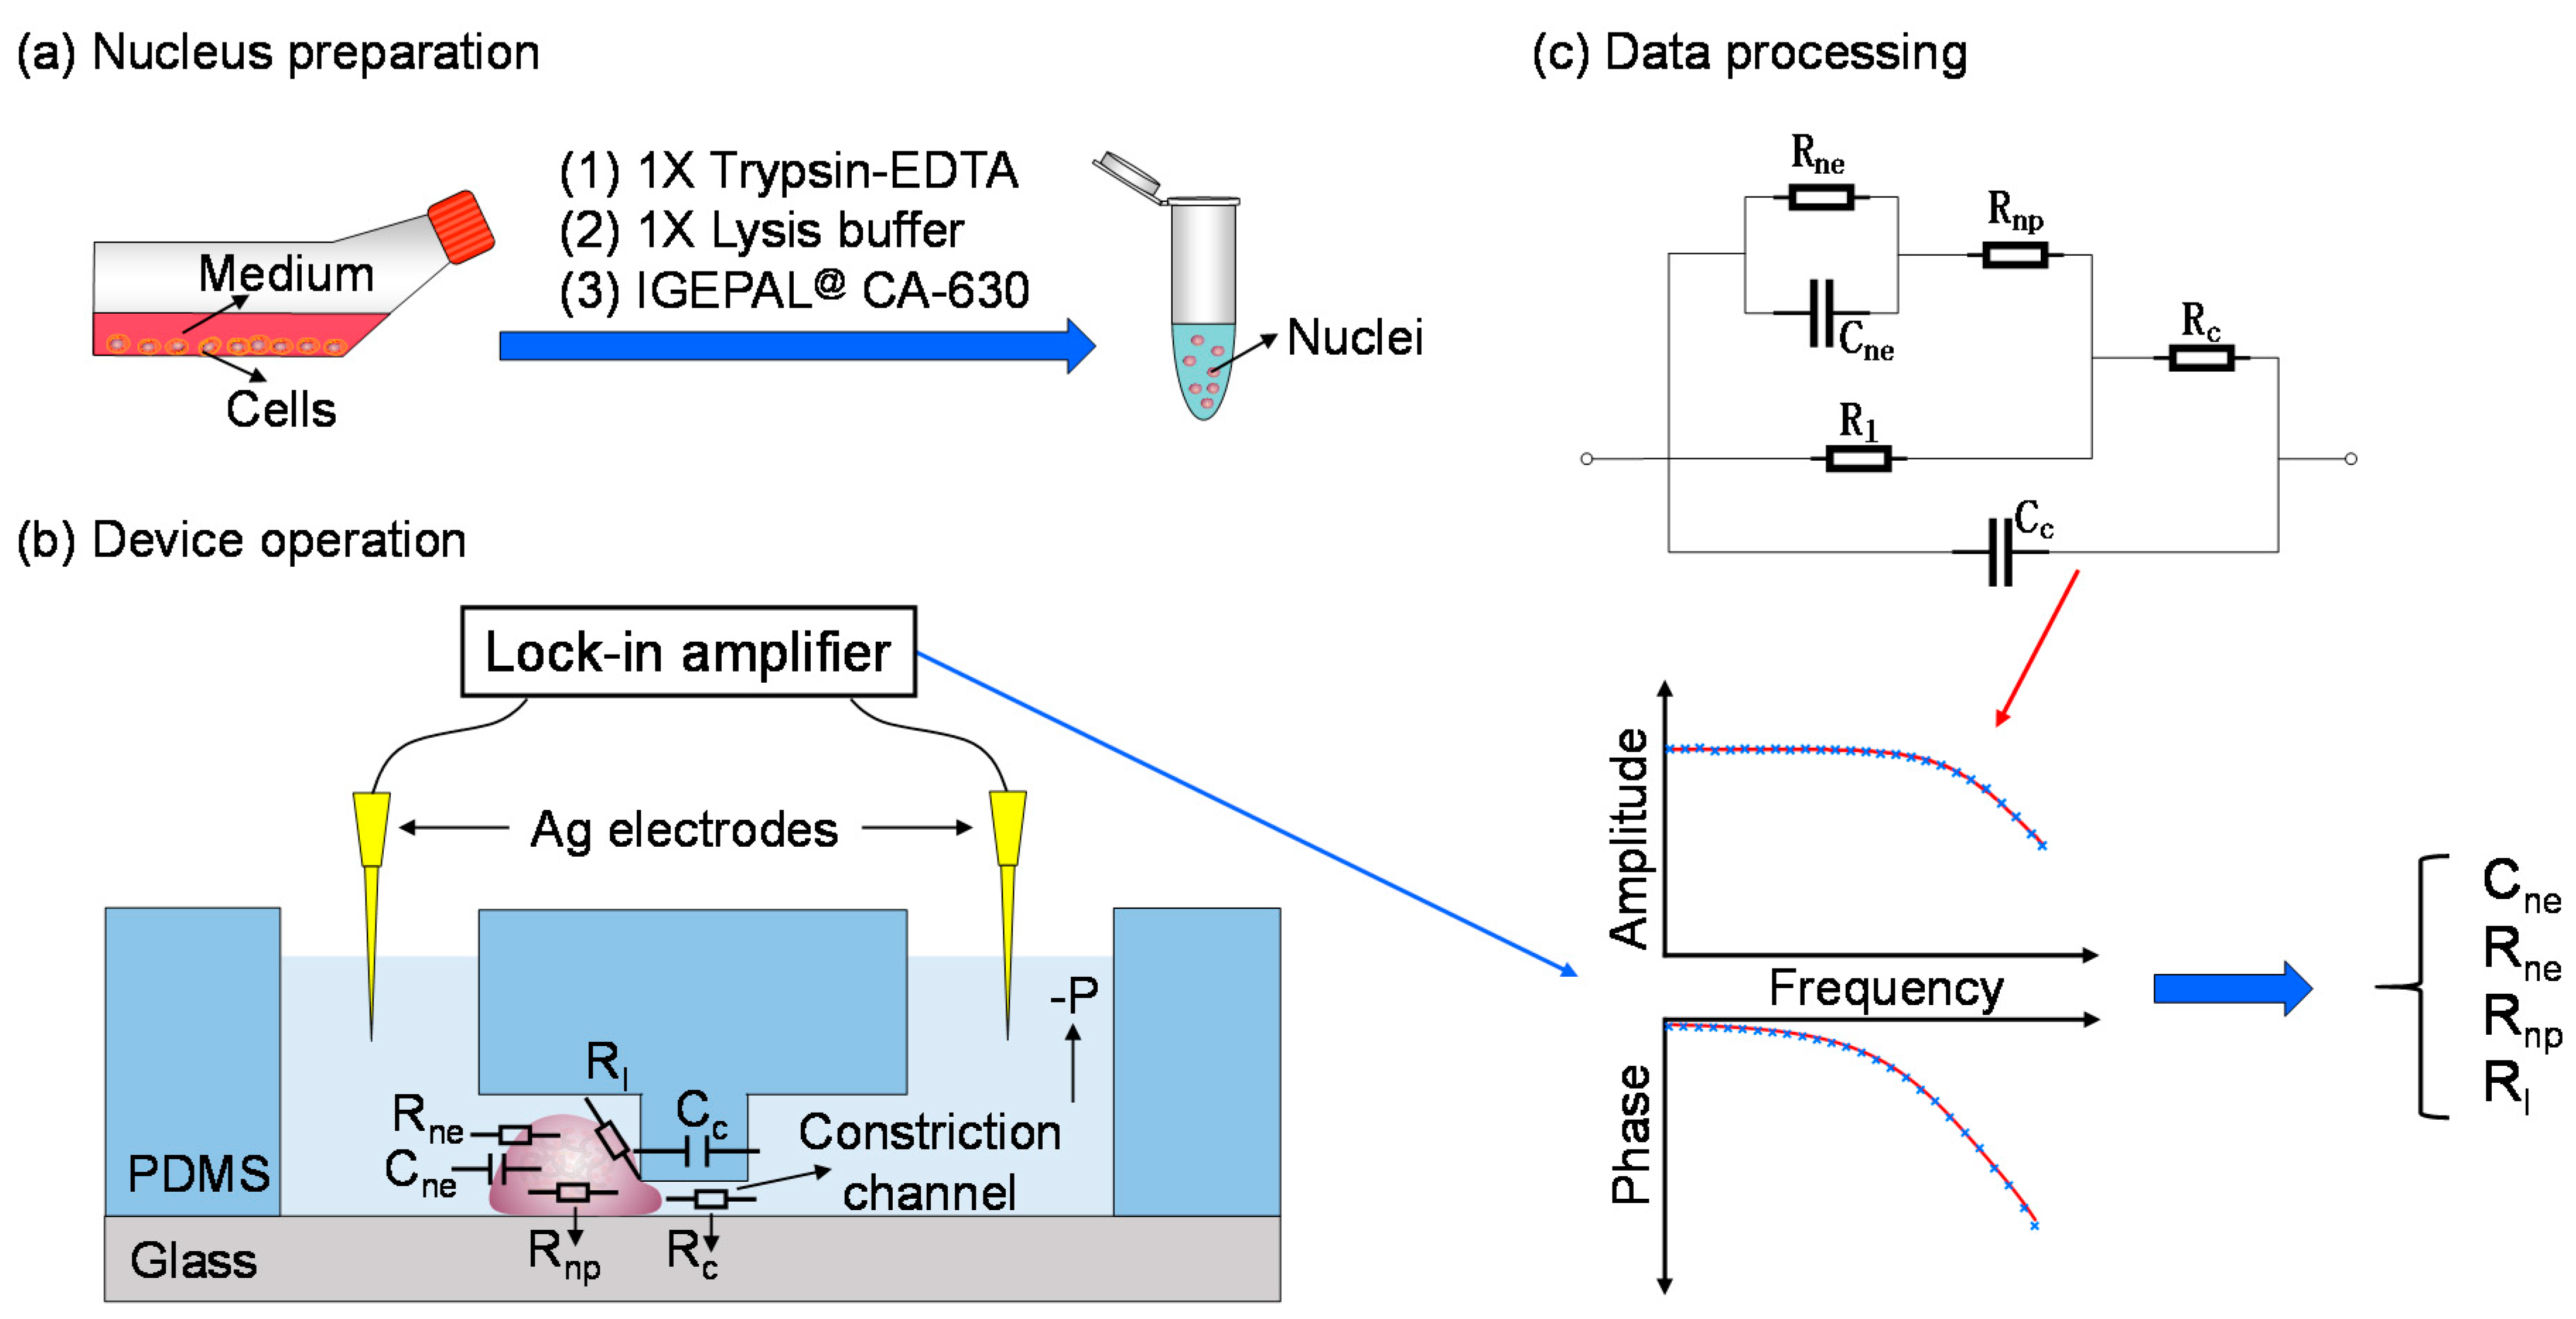
To address this issue, in this study, cell lysis and nucleus isolation were first conducted and the obtained single nuclei were trapped at the entrance of the constriction channel for electrical property characterization (see Figure 1). In operation, trypsin-EDTA, the lysis buffer and IGEPAL@ CA-630 were used to acquire nuclei of cells (see Figure 1a). Then individual nucleus was trapped at the entrance of the constriction channel with corresponding impedance values measured by a lock-in amplifier (see Figure 1b). Based on an equivalent electrical model where nuclear electrical components were represented as Cne, Rne and Rnp (equivalent resistance of nucleoplasm), raw impedance data were translated into Cne and Rne (see Figure 1c).
In comparison to the aforementioned population approach for nuclear electrical property characterization, this constriction channel based approach enables the electrical property characterization at single nucleus level. In comparison to electrorotation, in this study, side effects of membrane capacitance on the estimation of nuclear electrical properties are addressed. In comparison to patch clamping, this device can easily trap single nuclei at the entrance of the constriction channel without the requirements of accurate manipulations of pipette tips.
2. Materials and Methods
2.1. Materials
All cell lines were purchased from China Infrastructure of Cell Line Resources. All reagents for cell culture (e.g., culture medium, fetal bovine serum and trypsin) were purchased from Life Technologies Corporation (Van Allen Way Carlsbad, CA, USA). All reagents for cell treatments (e.g., isotonic lysis buffer, dithiothreitol, protease inhibitor cocktail and IGEPAL@ CA-630) were purchased from Sigma Aldrich Corporation (St. Louis, MO, USA). The materials required for device fabrication included SU-8 photoresist (MicroChem Corporation, Newton, MA, USA) and 184 silicone elastomer (Dow Corning Corporation, Midland, MI, USA).
2.2. Nucleus Preparation
A549 and SW620 cancer cell lines were cultured in RPMI 1640 supplemented with 10% fetal bovine serum, 1% penicillin and streptomycin, under the conditions of 37 °C and 5% CO2. For nucleus preparation, it was adopted from a previous study [47] where the cultured cancer cells were trypsinized using 1x trypsin-EDTA from culture flasks, which were then incubated with an isotonic lysis buffer supplemented with 1 mM dithiothreitol and protease inhibitor cocktail on ice for 15 min. After that IGEPAL@ CA-630 was added into the cell suspension, followed by a vortex for 10 s, and then a centrifugation of 400× g for 5 min. In the end, isolated nuclei were resuspended in 1x phosphate buffer saline containing 1% bovine serum albumin (see Figure 1a). Note that in nuclear isolation, variations of IGEPAL@ CA-630 were used for comparison where 0.01%, 0.02% and 0.03% of IGEPAL@ CA-630 were used for A549 cells while 0.01% of IGEPAL@ CA-630 was used for SW620 cells.
2.3. Device Fabrication
The device mainly consists of constriction channels (cross-sectional dimensions of 7 μm × 8 μm for A549 nuclei or 5 μm × 5 μm for SW620 nuclei) in polydimethylsiloxane (PDMS) elastomers, which were replicated from SU-8 mold masters using conventional soft lithography. Briefly, SU-8 5 was spin-coated, exposed without development to form the layer of the constriction channel with a height of 7 μm or 5 μm. Then, SU-8 25 was spin coated, exposed with alignment and developed to form the nucleus-loading channel with a height of 25 μm. After fabricating SU-8 mold masters, PDMS precursor and curing agents (ratio 10:1 by weight) were thoroughly mixed, degassed and poured onto the SU-8 channel masters for crosslinking (4 hours at 80 °C). Fully cured PDMS channels were then peeled away, punched with through holes as inlets and outlets, and bonded to glass slides after plasma treatment.
2.4. Device Operation
In experiments, the microfabricated channels were first filled with 1× phosphate buffer saline containing 1% bovine serum albumin and then loaded with nuclei at a concentration of 1 × 10⁶ nuclei/mL. A pressure controller (Pace 5000, Druck, Billerica, MA, USA) was used to generate negative pressures to trap single nuclei at the entrance of the constriction channels (0.2, 0.5 and 1.0 kPa for A549 nuclei at 7 μm × 8 μm constriction channels; 0.5, 1.0 and 2.0 kPa for SW620 nuclei at 5 μm × 5 μm constriction channels). Then, impedance profiles from 1 kHz to 250 kHz (excitation voltage: 200 mV) were recorded by a lock-in amplifier (7270, Signal Recovery, Oak Ridge, TN, USA). Meanwhile, an inverted microscope (IX83, Olympus, Tokyo, Japan) was used to capture the images of trapped single nuclei. After characterization, high negative pressures were used to aspirate the nuclei through the constriction channels and then the device was ready for the next measurements (see Figure 1b).
2.5. Data Processing
To interpret the measured impedance data, an electrical model was proposed (see Figure 1c). The electrical model of the constriction channel was represented by an equivalent resistor (Rc) and a capacitor (Cc) in parallel. Nuclear electrical components were represented as a capacitor (Cne) in parallel with a resistor (Rne) for the portion of the nuclear envelope in series with a resistor (Rnp) for the nucleoplasm portion. Furthermore, an equivalent leakage resistor (Rl) was defined to estimate sealing status between the aspirated membrane portion of the nucleus under the measurement and inner walls of the constriction channel.
Impedance profiles without nucleus trapping were first fitted with the equivalent electrical components of the constriction channel to obtain values of equivalent resistor (Rc) and capacitor (Cc). Then impedance profiles with nucleus trapping were fitted with the aforementioned electrical model, based on the nonlinear least-square principle, where a loop function was used to enumerate key parameters of Cne, Rne, Rnp and Rl. Note that in the step of curve fitting of impedance profiles with nucleus trapping, Rc and Cc were treated as known variables without looping and thus the potential concern of parasitic capacitors of constriction channels on the extraction of electrical parameters of nuclear envelopes can be properly addressed.
2.6. Statistics
The measurements of multiple samples were conducted with results expressed by averages and standard deviations. The student’s t-test was used, where the values of p < 0.001 (*) were considered as statistically significant.
3. Results and Discussion
Microfluidics refer to the manipulation of microscale fluids in microfabricated channels [48]. Due to dimensional comparison with cells, microfluidics has functioned as an enabling tool for single-cell isolation [49,50,51,52], and then impedance measurements [53]. Recently, single cells were trapped by a microfluidic device with corresponding impedance values measured, enabling the quantification of single-nucleus electrical properties [37]. However, in this approach, the electrical parameters of cell membranes can have side effects on the characterization of nuclear electrical properties. In this study, nuclei were isolated from cells and then trapped at the entrance of the constriction channel for electrical property characterization and thus the potential concern on the cell membranes can be properly addressed.
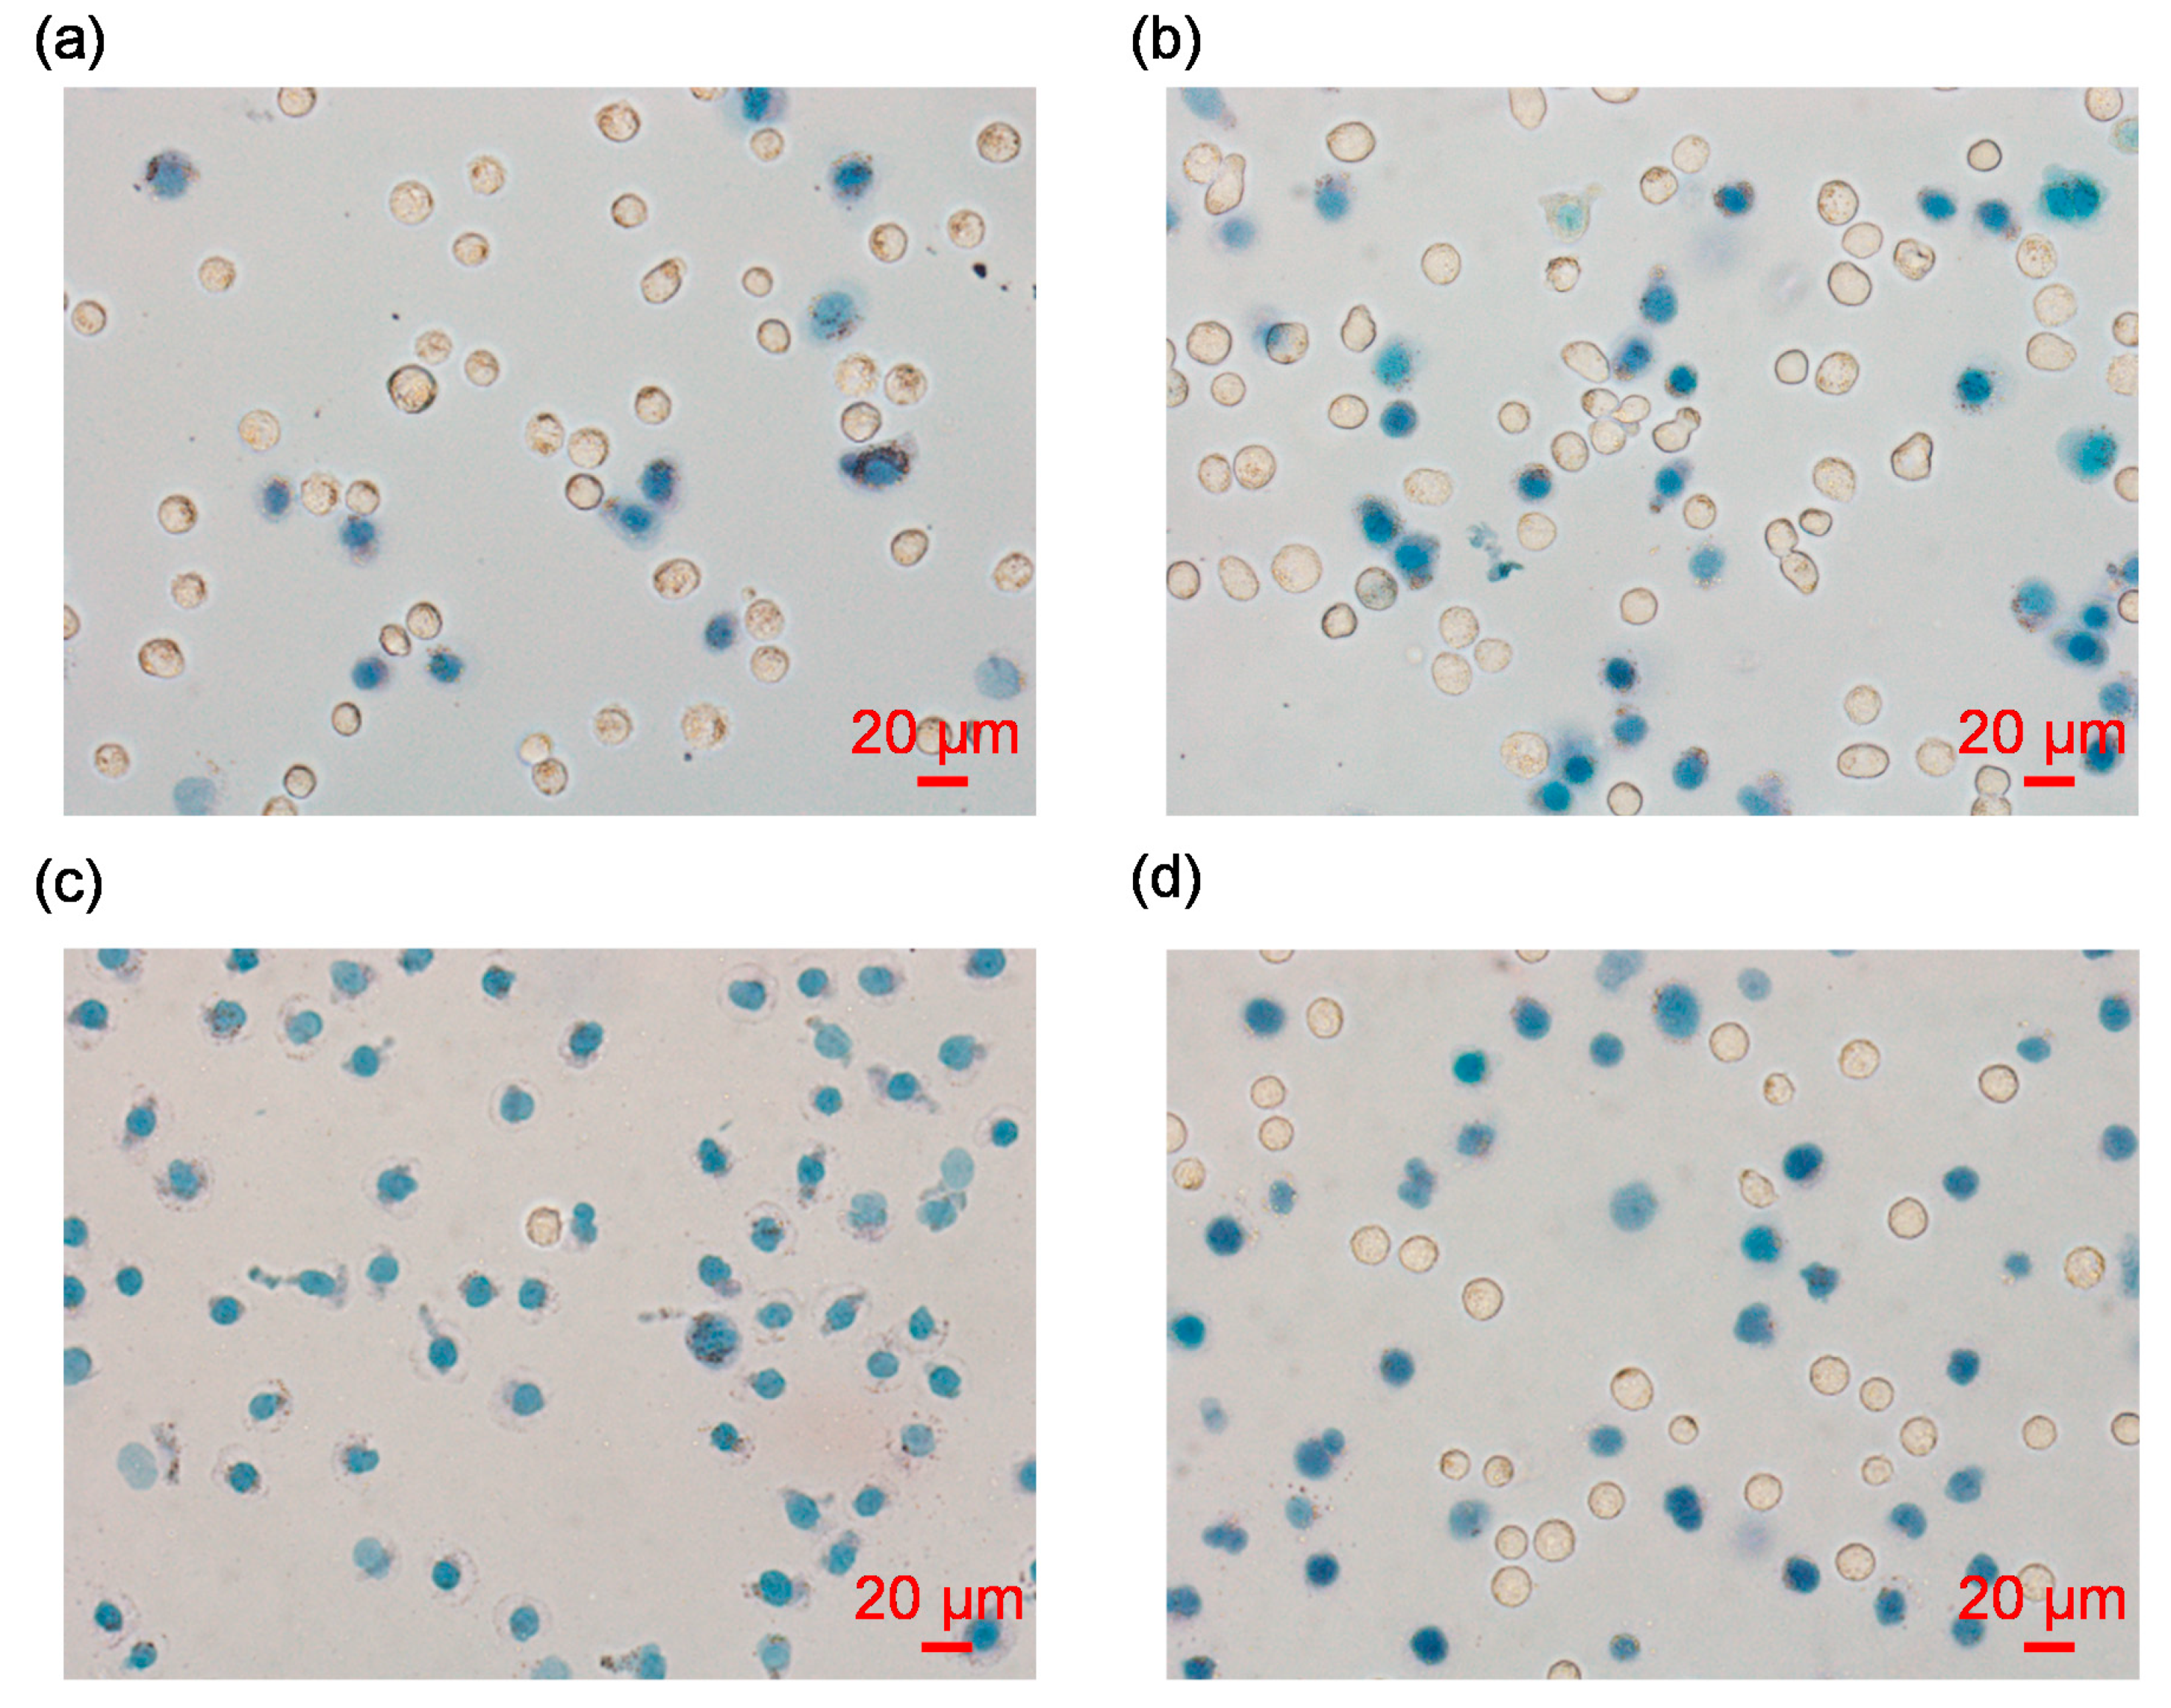
Figure 2 shows the microscopic images of isolated single nuclei stained with trypan blue, where stained blue dots and non-stained counterparts in the images represent isolated nuclei and intact cells, respectively. Under the conditions of 0.01%, 0.02% and 0.03% IGEPAL@ CA-630 for the treatments of A549 cells, it was observed that the increase of the percentage of IGEPAL@ CA-630 enhanced the ratio of cell lysis and percentage of nuclear isolation (see Figure 2a–c). As to SW620 cells, 0.01% IGEPAL@ CA-630 can produce comparable results with A549 cells under the treatment of 0.02% IGEPAL@ CA-630 (see Figure 2d).
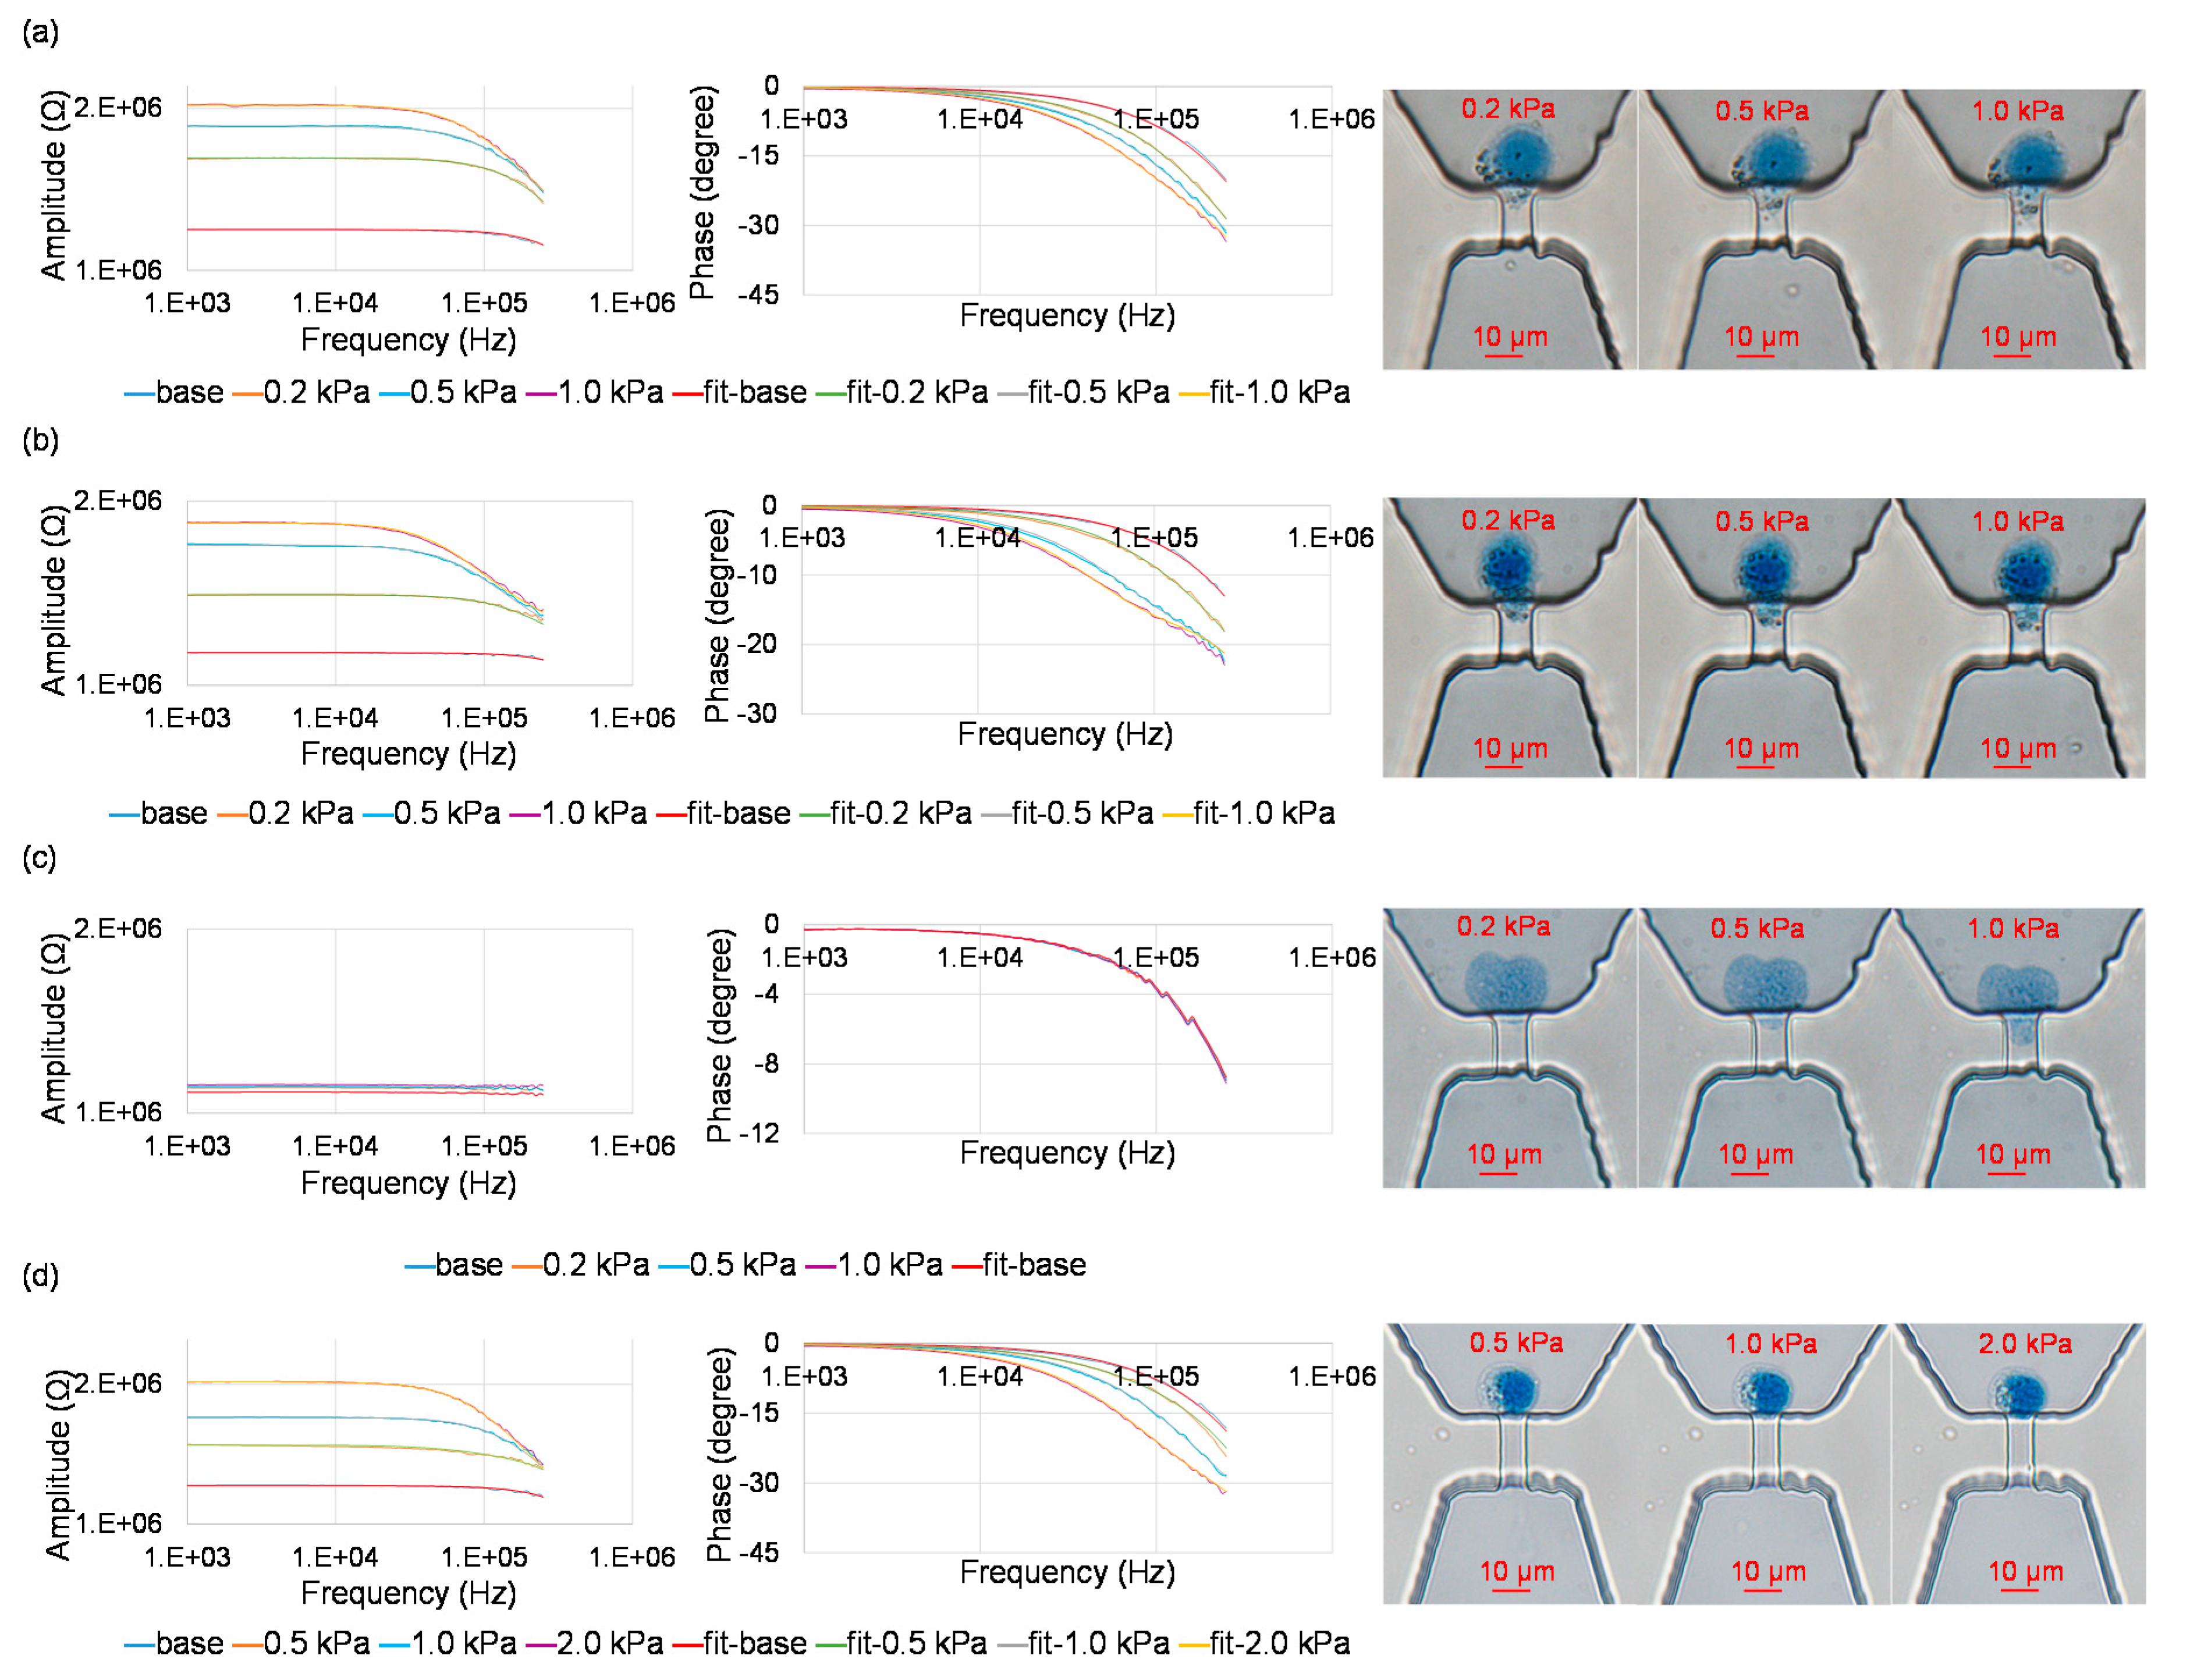
Figure 3 shows measured impedance values with curve fitting and correspond microscopic images for trapped single nuclei at the entrance of the constriction channels. As shown in Figure 3a, for A549 nuclei, under the conditions of 0.01% IGEPAL@ CA-630 and a constriction-channel of 7 μm × 8 μm, with the increase of aspiration pressure (Pa), impedance amplitude and phase values were noticed to increase and decrease, respectively. Meanwhile, the length of the nucleus aspirated into constriction channel extended.
Curve fitting (fit-base line) of measured impedance data without trapped single nuclei at the entrance of the constriction channel was conducted where Cc and Rc were quantified as 0.20 pF and 1.19 MΩ, respectively. Curve fitting (fit-0.2 kPa line, fit-0.5 kPa line and fit-1.0 kPa line) of measured impedance data with trapped single nuclei at the entrance of the constriction channel was conducted where Cne, Rne, Rnp and Rl were quantified as 1.34 μF/cm2, 4.48 Ω·cm2, 0.50 MΩ and 0.45 MΩ (Pa = 0.2 kPa), 1.88 μF/cm2, 1.85 Ω·cm2, 0.60 MΩ and 0.80 MΩ (Pa = 0.5 kPa), 1.88 μF/cm2, 3.72 Ω·cm2, 0.60 MΩ and 0.95 MΩ (Pa = 1.0 kPa; see Figure 3a)
As shown in Figure 3b, a similar trend was obtained for A549 nuclei under the conditions of 0.02% IGEPAL@ CA-630 and the constriction-channel of 7 μm × 8 μm. As to A549 nuclei under the condition of 0.03% IGEPAL@ CA-630, no significant differences of impedance with and without the trapping of single nucleus at the entrance of the constriction channel was noticed, indicating that the use of high concentration of IGEPAL@ CA-630 can damage nuclear envelopes, which then cannot effectively block the electric lines in impedance measurements (see Figure 3c).
As shown in Figure 3d, a similar trend was obtained for SW620 nucleus under the conditions 0.01% IGEPAL@ CA-630 and the constriction-channel of 5 μm × 5 μm. Curve fitting of measured impedance data for single nucleus was conducted where Cne, Rne, Rnp and Rl were quantified to be 3.33 μF/cm2, 1.83 Ω·cm2, 0.20 MΩ and 0.65 MΩ (Pa = 0.5 kPa), 4.00 μF/cm2, 0.62 Ω·cm2, 0.20 MΩ and 1.75 MΩ (Pa = 1.0 kPa), 3.50 μF/cm2, 2.64 Ω·cm2, 0.40 MΩ and 1.80 MΩ (Pa = 2.0 kPa).
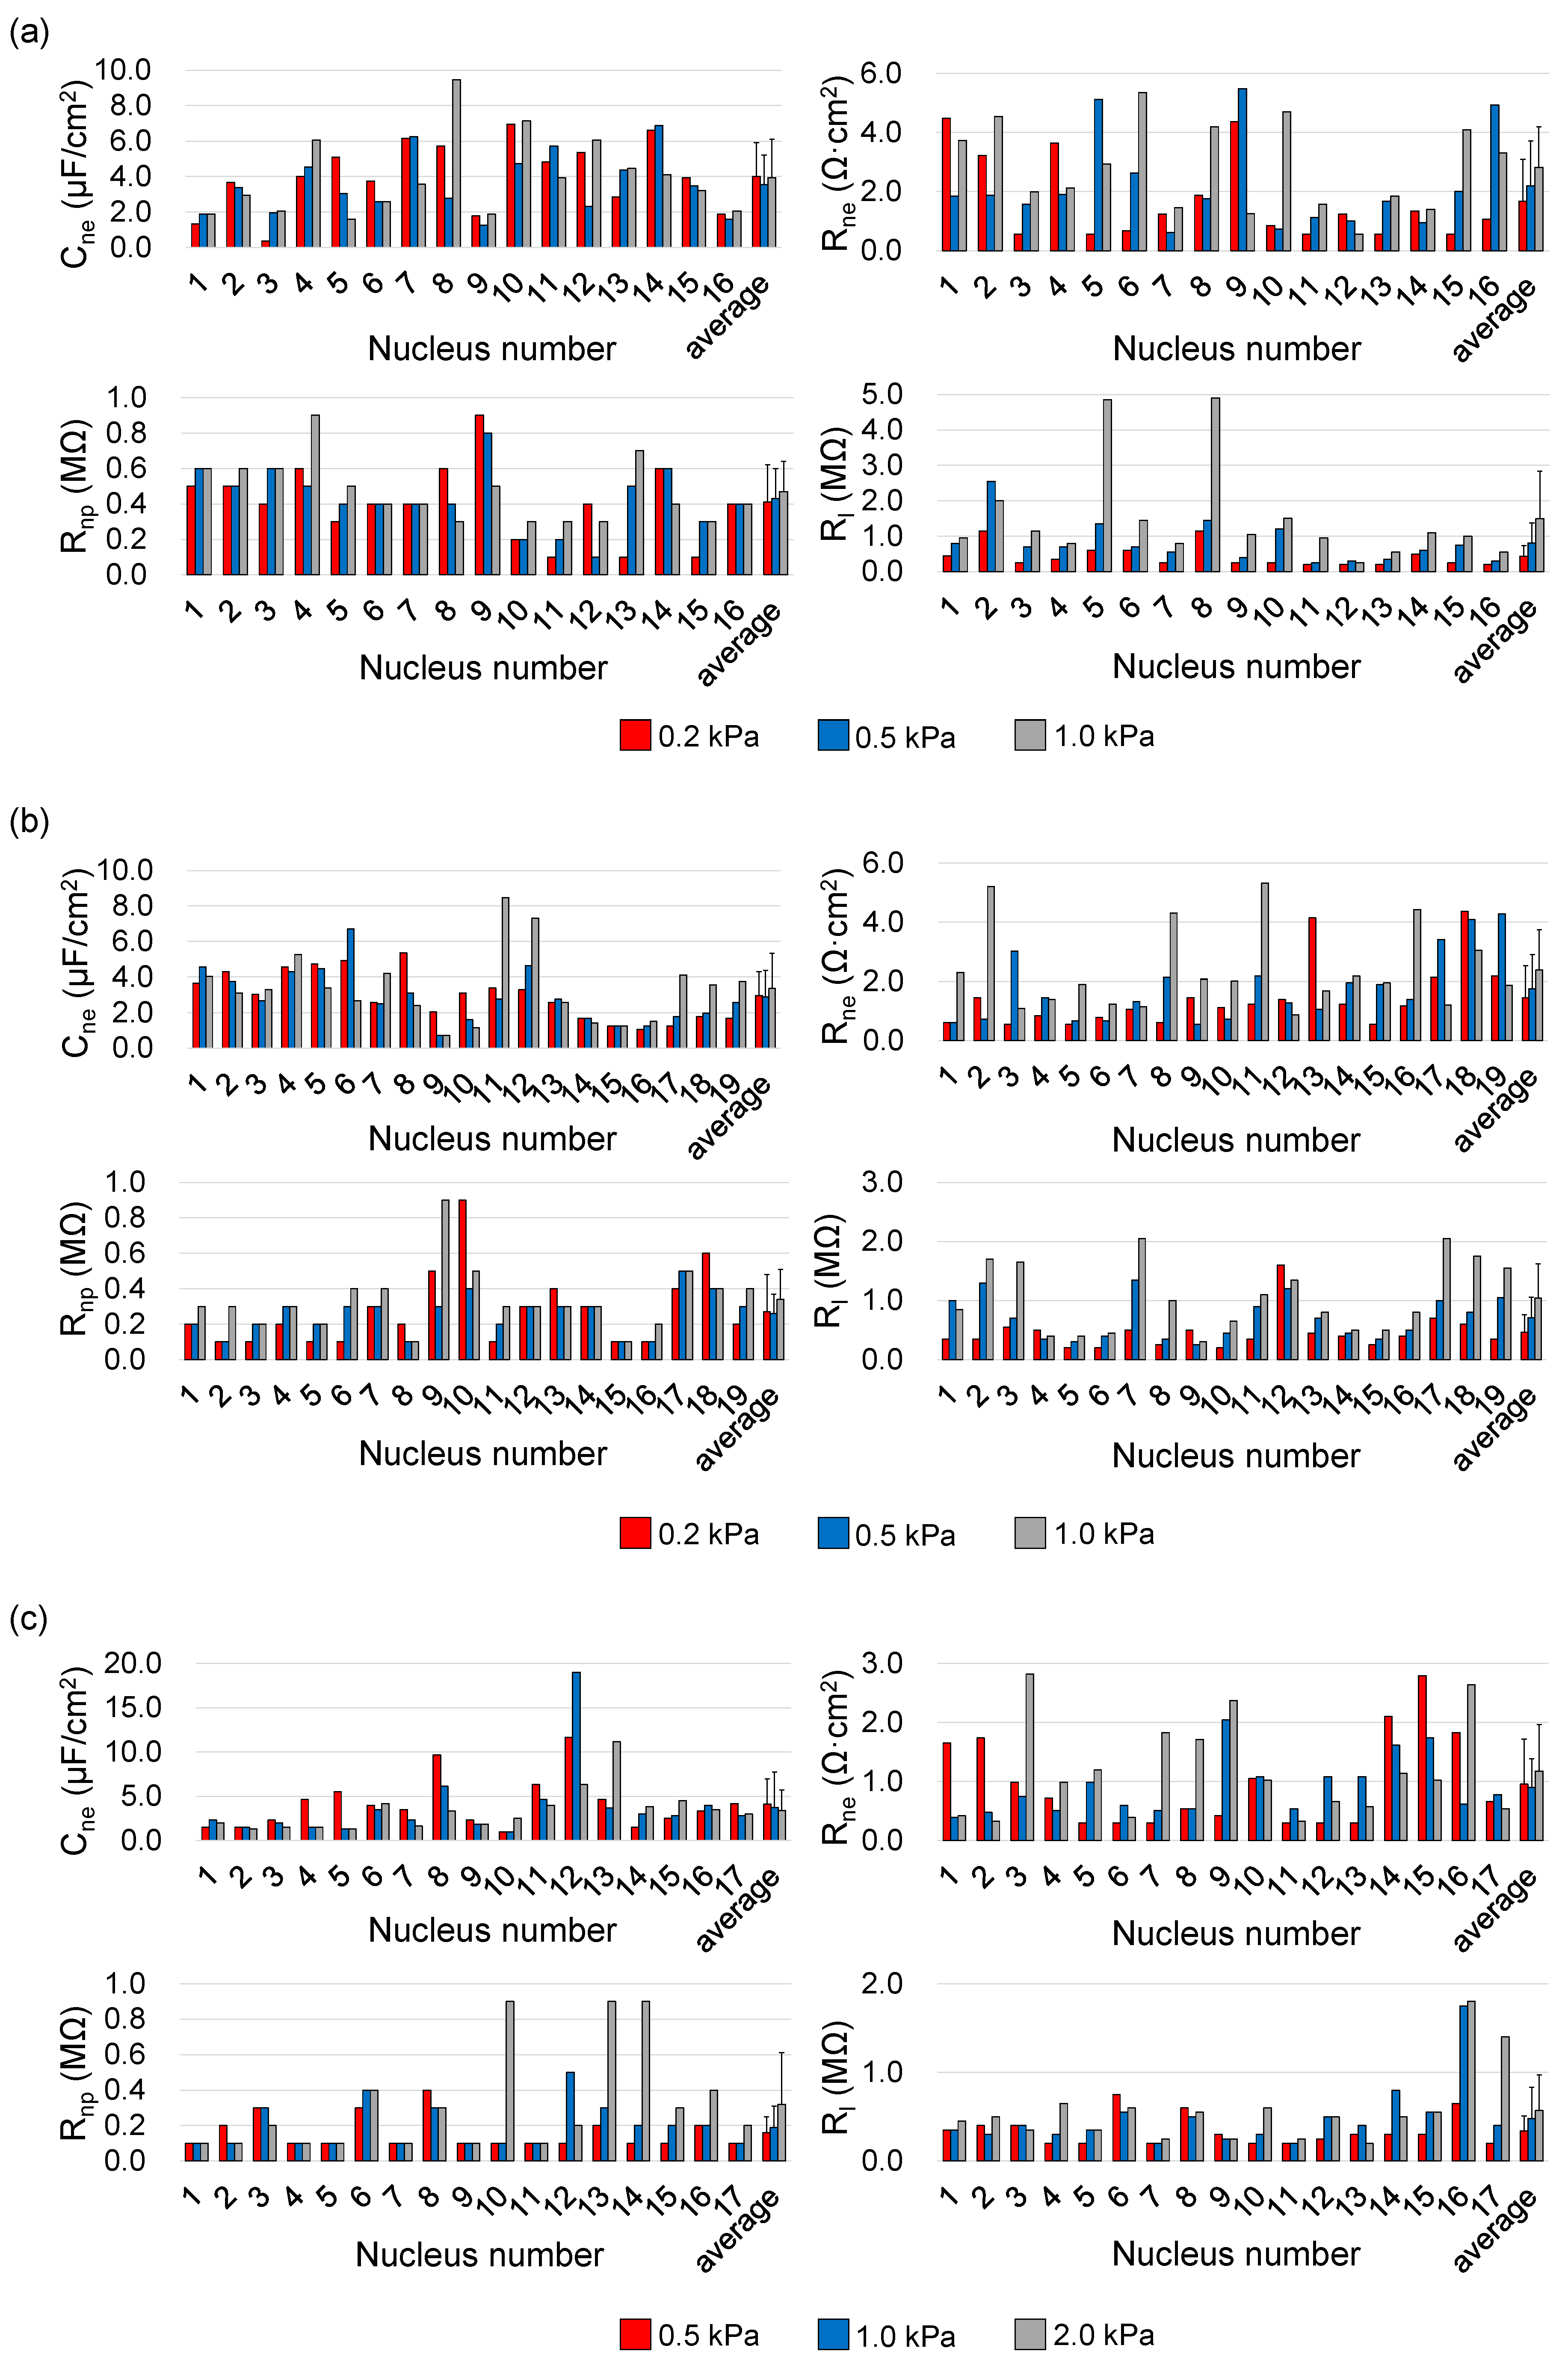
Figure 4 shows quantified single-nucleus electrical parameters of Cne, Rne and Rnp as well as Rl. Under the conditions of 0.01% IGEPAL@ CA-630 and the constriction-channel of 7 μm × 8 μm, Cne, Rne, Rnp and Rl of the A549 nuclei were determined to be 4.02 ± 1.91 μF/cm2, 1.67 ± 1.37 Ω·cm2, 0.41 ± 0.21 MΩ and 0.43 ± 0.30 MΩ (Nn = 16, Pa = 0.2 kPa), 3.55 ± 1.66 μF/cm2, 2.20 ± 1.52 Ω·cm2, 0.43 ± 0.17 MΩ and 0.81 ± 0.57 MΩ (Nn = 16, Pa = 0.5 kPa), 3.94 ± 2.16 μF/cm2, 2.82 ± 1.43 Ω·cm2, 0.47 ± 0.17 MΩ and 1.49 ± 1.34 MΩ (Nn = 16, Pa = 1.0 kPa; see Figure 4a and Table 1).
Under an arbitrary aspiration pressure, the obtained Cne and Rne were around 1 μF/cm2 and 1 Ω·cm2, which were consistent with previous studies [17,18,26,34,36,41]. With the increase of the aspiration pressure, Rl was observed to increase, suggesting the improvement in the sealing status between nuclear envelopes and inner walls of the constriction channel. Though the values of Rne were noticed to increase when the aspiration pressure was increased from 0.2 kPa to 0.5 kPa and then 1.0 kPa, no differences with statistical significances for both Cne and Rne were located neighboring pressure values, indicating that the variations of aspiration pressure have no significantly side effects on the measurements of single-nucleus electrical properties.
Figure 4b shows quantified single-nucleus electrical parameters of Cne, Rne and Rnp as well as Rl under the conditions of 0.02% IGEPAL@ CA-630 and the constriction-channel of 7 μm × 8 μm. Cne and Rne of the A549 nuclei derived from 0.01% vs. 0.02% IGEPAL@ CA-630 were compared as follows: 4.02 ± 1.91 μF/cm2 vs. 2.97 ± 1.32 μF/cm2 and 1.67 ± 1.37 Ω·cm2 vs. 1.45 ± 1.07 Ω·cm2 (Pa = 0.2 kPa), 3.55 ± 1.66 μF/cm2 vs. 2.90 ± 1.47 μF/cm2 and 2.20 ± 1.52 Ω·cm2 vs. 1.76 ± 1.14 Ω·cm2 (Pa = 0.5 kPa) and 3.94 ± 2.16 μF/cm2 vs. 3.38 ± 1.96 μF/cm2 and 2.82 ± 1.43 Ω·cm2 vs. 2.38 ± 1.37 Ω·cm2 (Pa = 1.0 kPa; see Figure 4b and Table 1). Though the values of Cne and Rne were observed to decrease when the percentage of IGEPAL@ CA-630 was increased from 0.01% to 0.02%, no differences with statistical significances were located between these two groups, indicating that the use of IGEPAL@ CA-630 for cell lysis at low concentrations has no significantly side effects on the measurements of single-nucleus electrical properties.
Figure 4c shows quantified single-nucleus electrical parameters of Cne, Rne and Rnp as well as Rl under the conditions of 0.01% IGEPAL@ CA-630 and the constriction-channel of 5 μm × 5 μm for SW620 nuclei. Under an arbitrary aspiration pressure, the obtained Cne and Rne were around 1 μF/cm2 and 1 Ω·cm2, which were consistent with previous studies [17,18,26,34,36,41]. Again, no differences with statistical significances were located among values of Cne and Rne under three different aspiration pressures, confirming that the variations of aspiration pressure have no significantly side effects on electrical properties of nuclear envelopes. Compared with the values of Cne and Rne obtained from A549 nuclei, the obtained values of SW620 nuclei were lower in both Cne (4.00 ± 3.03 μF/cm2 vs. 3.75 ± 3.17 μF/cm2) and Rne (1.69 ± 1.29 Ω·cm2 vs. 1.01 ± 0.70 Ω·cm2). Furthermore, significant differences with statistics were only located in Rne, suggesting that nuclei of A549 and SW620 are different in equivalent resistance of nuclear envelopes while they have comparable capacitive properties.
4. Conclusions and Future Developments
This study demonstrated the feasibility of the microfluidic device by quantifying electrical properties of A549 nuclei, and reporting electrical properties of single nuclei independent from key parameters in nuclear isolation and measurement. Then this device was also used to characterize electrical properties of SW620 nuclei, which indicated that this approach could be used to test multiple nucleus types.
Future technical developments may aspirate single nuclei rapidly through the microfluidic constriction channel, enabling high-throughput quantification of single-nucleus electrical properties. Then the approach can be further expanded to high-throughput quantify multiple electrical parameters of cell membrane and nuclear portions, enabling cell type classification and cell status evaluation in a label-free manner.
Supplementary Materials
The following are available online at https://www.mdpi.com/2072-666X/10/11/740/s1. Table S1: A summary of previously reported electrical parameters of single.
Author Contributions
H.L., J.W. and J.C. designed experiments; H.L., Y.Z. and H.T. contributed to cell treatments, device fabrication and device operation; H.L., Y.Z. and J.C. contributed to data processing; Y.Z., D.C. and J.C. contributed to modeling development; and H.L., J.W. and J.C. drafted the manuscript.
Funding
This research was funded by the National Natural Science Foundation of China (Grant No. 61431019, 61825107, 61671430, 61922079); Key Project (QYZDB-SSW-JSC011), Instrument Development Program, Youth Innovation Promotion Association and Interdisciplinary Innovation Team of Chinese Academy of Sciences; Instrument Development of Beijing Municipal Science & Technology Commission (Z181100009518001).
Acknowledgments
The authors would like to acknowledge helpful discussions with Ke Wang (Beijing University of Posts and Telecommunications) about the extraction of single nuclei.
Conflicts of Interest
The authors declare no conflicts of interest.
References
- Loewenstein, W.R.; Kanno, Y. Some electrical properties of the membrane of a cell nucleus. Nature 1962, 195, 462–464. [Google Scholar] [CrossRef]
- Loewenstein, W.R.; Kanno, Y. Some electrical properties of a nuclear membrane examined with a microelectrode. J. Gen Physiol. 1963, 46, 1123–1140. [Google Scholar] [CrossRef] [PubMed]
- Loewenstein, W.R.; Kanno, Y. The electrical conductance and potential across the membrane of some cell nuclei. J. Cell Biol. 1963, 16, 421–425. [Google Scholar] [CrossRef] [PubMed]
- Loewenstein, W.R. Permeability of a nuclear membrane: changes during normal development and changes induced by growth hormone. Science 1965, 150, 909–910. [Google Scholar] [PubMed]
- Loewenstein, W.R.; Kanno, Y.; Ito, S. Permeability of nuclear membranes. Ann. N. Y. Acad. Sci. 1966, 137, 708–716. [Google Scholar] [CrossRef]
- Palmer, L.G.; Civan, M.M. Distribution of Na +, K + and C1- between nucleus and cytoplasm in chironomus salivary gland cells. J. Membr. Biol. 1977, 33, 41–61. [Google Scholar] [CrossRef]
- Kanno, Y.; Loewenstein, W.R. A study of the nucleus and cell membranes of oocytes with an intra-cellular electrode. Exp. Cell Res. 1963, 31, 149–166. [Google Scholar] [CrossRef]
- Kanno, Y.; Ashman, R.F.; Loewenstein, W.R. Nucleus and cell membrane conductance in marine oocytes. Exp. Cell Res. 1965, 39, 184–189. [Google Scholar] [CrossRef]
- Dale, B. Voltage clamp of the nuclear envelope. Proc. R. Soc. B 1994, 255, 119–124. [Google Scholar]
- Danker, T. Using atomic force microscopy to investigate patch-clamped nuclear membrane. Cell Biol. Int. 1997, 21, 747–757. [Google Scholar] [CrossRef]
- Mazzanti, M. Ion permeability of the nuclear envelope. News Physiol. Sci. 1998, 13, 44–50. [Google Scholar] [CrossRef] [PubMed]
- Danker, T. Nuclear hourglass technique: An approach that detects electrically open nuclear pores in xenopus laevis oocyte. Proc. Natl. Acad. Sci. USA 1999, 96, 13530–13535. [Google Scholar] [CrossRef] [PubMed]
- Danker, T. Electrophoretic plugging of nuclear pores by using the nuclear hourglass technique. J. Membr. Biol. 2001, 184, 91–99. [Google Scholar] [CrossRef] [PubMed]
- Ziervogel, H. Electrorotation of lymphocytes--the influence of membrane events and nucleus. Biosci. Rep. 1986, 6, 973–982. [Google Scholar] [CrossRef] [PubMed]
- Asami, K.; Takahashi, Y.; Takashima, S. Dielectric properties of mouse lymphocytes and erythrocytes. Biochim. Biophys. Acta 1989, 1010, 49–55. [Google Scholar] [CrossRef]
- Griffith, A.W.; Cooper, J.M. Single-cell measurements of human neutrophil activation using electrorotation. Anal. Chem. 1998, 70, 2607–2612. [Google Scholar] [CrossRef]
- Polevaya, Y. Time domain dielectric spectroscopy study of human cells. II. normal and malignant white blood cells. Biochim. Biophys. Acta 1999, 1419, 257–271. [Google Scholar] [CrossRef]
- Ermolina, I.; Polevaya, Y.; Feldman, Y. Study of normal and malignant white blood cells by time domain dielectric spectroscopy. IEEE Trans. Dielectr. Electr. Insul. 2001, 8, 253–261. [Google Scholar] [CrossRef]
- Egger, M.; Donath, E. Electrorotation measurements of diamide-induced platelet activation changes. Biophys. J. 1995, 68, 364. [Google Scholar] [CrossRef]
- Feldman, Y.; Ermolina, I.; Hayashi, Y. Time domain dielectric spectroscopy study of biological systems. IEEE Trans. Dielectr. Electr. Insul. 2003, 10, 728–753. [Google Scholar] [CrossRef]
- Raicu, V.; Raicu, G.; Turcu, G. Dielectric properties of yeast cells as simulated by the two-shell model. Biochim. Biophys. Acta 1996, 1274, 143–148. [Google Scholar] [CrossRef] [Green Version]
- Matzke, A.J.; Weiger, T.M.; Matzke, M. Ion channels at the nucleus: electrophysiology meets the genome. Mol. Plant 2010, 3, 642–652. [Google Scholar] [CrossRef] [PubMed]
- Giulian, D.; Diacumakos, E.G. Electrophysiological mapping of compartments within a mammalian-cell. J. Cell Biol. 1977, 72, 86–103. [Google Scholar] [CrossRef] [PubMed]
- Irimajiri, A. Passive electrical properties of cultured murine lymphoblast (L 5178 Y) with reference to its cytoplasmic membrane, nuclear envelope, and intracellular phases. J. Membr. Biol. 1978, 38, 209–232. [Google Scholar] [CrossRef] [PubMed]
- Gimsa, J. Dielectrophoresis and electrorotation of neurospora slime and murine myeloma cells. Biophys. J. 1991, 60, 749–760. [Google Scholar] [CrossRef] [Green Version]
- Oberleithner, H. Imaging nuclear pores of aldosterone-sensitive kidney cells by atomic force microscopy. Proc. Natl. Acad. Sci. USA 1994, 91, 9784–9788. [Google Scholar] [CrossRef]
- Garner, A.L. Time domain dielectric spectroscopy measurements of HL-60 cell suspensions after microsecond and nanosecond electrical pulses. IEEE Trans. Plasma Sci. 2004, 32, 2073–2084. [Google Scholar] [CrossRef]
- Garner, A.L. Ultrashort electric pulse induced changes in cellular dielectric properties. Biochem. Biophys. Res. Commun. 2007, 362, 139–144. [Google Scholar] [CrossRef] [Green Version]
- Massimi, M. Dielectric Characterization of hepatocytes in suspension and embedded into two different polymeric scaffolds. Colloids Surf. B Biointerfaces 2013, 102, 700–707. [Google Scholar] [CrossRef]
- Moisescu, M.G. Changes of cell electrical parameters induced by electroporation. A dielectrophoresis study. Biochim. Biophys. Acta 2013, 1828, 365–372. [Google Scholar] [CrossRef]
- Zhuang, J. Pulsed electric field induced dielectric evolution of mammalian cells. In Proceedings of the IEEE International Power Modulator and High Voltage Conference, San Diego, CA, USA, 3–7 June 2013. [Google Scholar]
- Anderson, S.E.; Bau, H.H. Electrical detection of cellular penetration during microinjection with carbon nanopipettes. Nanotechnology 2014, 25, 245102. [Google Scholar] [CrossRef]
- Sano, M.B. In-vitro bipolar nano- and microsecond electro-pulse bursts for irreversible electroporation therapies. Bioelectrochemistry 2014, 100, 69–79. [Google Scholar] [CrossRef] [PubMed]
- Stacey, M.W.; Sabuncu, A.C.; Beskok, A. Dielectric characterization of costal cartilage chondrocytes. Biochim. Biophys. Acta 2014, 1840, 146–152. [Google Scholar] [CrossRef] [PubMed]
- Murovec, T. Modeling of transmembrane potential in realistic multicellular structures before electroporation. Bioelectrochem. Bioenerg. 2016, 111, 2286–2295. [Google Scholar] [CrossRef] [PubMed]
- Sabuncu, A.C. Microfluidic impedance spectroscopy as a tool for quantitative biology and biotechnology. Biomicrofluidics 2012, 6, 137–152. [Google Scholar] [CrossRef]
- Zhou, Y. Single cell studies of mouse embryonic stem cell (mESC) differentiation by electrical impedance measurements in a microfluidic device. Biosens. Bioelectron. 2016, 81, 249–258. [Google Scholar] [CrossRef] [Green Version]
- Reynolds, C.R.; Tedeschi, H. Permeability properties of mammalian cell nuclei in living cells and in vitro. J. Cell Sci. 1984, 70, 197–207. [Google Scholar]
- Mazzanti, M.; DeFeliceI, L.J. Ion channel in the nuclear envelope. Nature 1990, 343, 764–767. [Google Scholar] [CrossRef]
- Matzke, A.J.M. A large conductance ion channel in the nuclear envelope of higher plant cell. FEBS Lett. 1992, 302, 81–85. [Google Scholar] [CrossRef]
- Raicu, V. Dielectric properties of rat liver in vivo: Analysis by modeling hepatocytes in the tissue architecture. Bioelectrochem. Bioenerg. 1998, 47, 333–342. [Google Scholar] [CrossRef]
- Vanderstraeten, J.; Vander Vorst, A. Theoretical evaluation of dielectric absorption of microwave energy at the scale of nucleic acids. Bioelectromagnetics 2004, 25, 380–389. [Google Scholar] [CrossRef] [PubMed]
- Bai, W.; Zhao, K.S.; Asami, K. Dielectric properties of E. coli cell as simulated by the three-shell spheroidal model. Bioelectrochem. Bioenerg. 2006, 122, 136–142. [Google Scholar] [CrossRef] [PubMed]
- Gerber, H.L.; Bassi, A.; Tseng, C.C. Determining a pulse coupling to subcellular components with a frequency-domain transfer function. IEEE Trans. Plasma Sci. 2006, 34, 1425–1430. [Google Scholar] [CrossRef]
- Kotnik, T.; Miklavc, D. Theoretical evaluation of voltage inducement on internal membranes of biological cells exposed to electric fields. Biophys. J. 2006, 90, 480–491. [Google Scholar] [CrossRef] [PubMed]
- Shibatani, S. Electrorotation of vacuoles isolated from barley mesophyll cells. Bioelectrochem. Bioenerg. 1993, 29, 327–335. [Google Scholar] [CrossRef]
- Chun-Chieh, C.; Ke, W.; Yi, Z.; Deyong, C.; Beiyuan, F.; Chia-Hsun, H. Mechanical property characterization of hundreds of single nuclei based on microfluidic constriction channel. Cytom. A 2018, 93, 1–7. [Google Scholar]
- Gravesen, P.; Branebjerg, J.; Jensen, O.S. Microfluidics-a review. J. Micromech. Microeng. 1993, 3, 168. [Google Scholar] [CrossRef]
- Gross, A.; Schoendube, J.; Zimmermann, S.; Steeb, M.; Zengerle, R.; Koltay, P. Technologies for single-cell isolation. Int. J. Mol. Sci. 2015, 16, 16897–16919. [Google Scholar] [CrossRef]
- Shields, C.W., IV; Reyes, C.D.; López, G.P. Microfluidic cell sorting: a review of the advances in the separation of cells from debulking to rare cell isolation. Lab Chip 2015, 15, 1230–1249. [Google Scholar] [Green Version]
- Warkiani, M.E.; Wu, L.; Tay, A.K.P.; Han, J. Large-volume microfluidic cell sorting for biomedical applications. Annu. Rev. Biomed. Eng. 2015, 17, 1. [Google Scholar] [CrossRef]
- Mu, X.; Zheng, W.; Sun, J.; Zhang, W.; Jiang, X. Microfluidics for manipulating cells. Small 2013, 9, 9–21. [Google Scholar] [CrossRef] [PubMed]
- Ayliffe, H.E.; Frazier, A.B.; Rabbitt, R.D. Electric impedance spectroscopy using microchannels with integrated metal electrodes. IEEE J. Microelectromech. Syst. 1999, 8, 50–57. [Google Scholar] [CrossRef]
Figure 1.
Working flowchart for characterizing single-nucleus electrical properties (e.g., Cne and Rne, two key parameters of nuclear envelope) based on microfluidic constriction channel. Key steps include nucleus preparation (a), device operation (b) and data processing (c). In operation, trypsin-EDTA (Ethylenediaminetetraacetic acid), lysis buffer and IGEPAL@ CA-630 were used to acquire nuclei of cells. Then single nuclei were trapped at the entrance of the constriction channel with corresponding impedance values measured by a lock-in amplifier. Based on an equivalent electrical model where nuclear electrical components were represented as Cne in parallel with Rne, and then in series with Rnp, raw impedance data were translated into Cne and Rne.

Figure 2.
Microscopic images of isolated single nuclei stained with trypan blue, under the conditions of 0.01% IGEPAL@ CA-630 for A549 cells (a), 0.02% IGEPAL@ CA-630 for A549 cells (b), 0.03% IGEPAL@ CA-630 for A549 cells (c) and 0.01% IGEPAL@ CA-630 for SW620 cells (d). Note that stained blue dots and non-stained counterparts in the images represent isolated nuclei and intact cells, respectively.

Figure 3.
Measured impedance values with curve fitting and corresponding microscopic images for trapped single nuclei at the entrances of the constriction channels, under the conditions of IGEPAL@ CA-630: 0.01%, constriction channel: 7 μm × 8 μm, aspiration pressure: 0.2 kPa, 0.5 kPa and 1.0 kPa, nucleus type: A549 (a), IGEPAL@ CA-630: 0.02%, constriction channel: 7 μm × 8 μm, aspiration pressure: 0.2 kPa, 0.5 kPa and 1.0 kPa, nucleus type: A549 (b), IGEPAL@ CA-630: 0.03%, constriction channel: 7 μm × 8 μm, aspiration pressure: 0.2 kPa, 0.5 kPa and 1.0 kPa, nucleus type: A549 (c), IGEPAL@ CA-630: 0.01%, constriction channel: 5 μm × 5 μm, aspiration pressure: 0.5 kPa, 1.0 kPa and 2.0 kPa, nucleus type: SW620 (d).

Figure 4.
Quantified single-nucleus electrical parameters of Cne, Rne and Rnp as well as Rl under the conditions of IGEPAL@ CA-630: 0.01%, constriction channel: 7 μm × 8 μm, aspiration pressure: 0.2 kPa, 0.5 kPa and 1.0 kPa, nucleus type: A549, nucleus number: 16 (a), IGEPAL@ CA-630: 0.02%, constriction channel: 7 μm × 8 μm, aspiration pressure: 0.2 kPa, 0.5 kPa and 1.0 kPa, nucleus type: A549, nucleus number: 19 (b), IGEPAL@ CA-630: 0.01%, constriction channel: 5 μm × 5 μm, aspiration pressure: 0.5 kPa, 1.0 kPa and 2.0 kPa, nucleus type: SW620, nucleus number: 17 (c).


Table 1.
A summary of quantified single-nucleus electrical parameters (e.g., Cne, Rne and Rnp) using constriction channels under a variety of operation conditions.
Table 1.
A summary of quantified single-nucleus electrical parameters (e.g., Cne, Rne and Rnp) using constriction channels under a variety of operation conditions.
| Nucleus Type | Constriction Channel Dimensions | IGEPAL@ CA-630 | Aspiration Pressure (kPa) | Cne (μF/cm2) | Rne (Ω·cm2) | Rnp (MΩ) | Nucleus Number |
|---|---|---|---|---|---|---|---|
| A549 | 7 μm × 8 μm | 0.01% | 0.2 | 4.02 ± 1.91 | 1.67 ± 1.37 | 0.41 ± 0.21 | N = 16 |
| 0.5 | 3.55 ± 1.66 | 2.20 ± 1.52 | 0.43 ± 0.17 | ||||
| 1.0 | 3.94 ± 2.16 | 2.82 ± 1.43 | 0.47 ± 0.17 | ||||
| 0.02% | 0.2 | 2.97 ± 1.32 | 1.45 ± 1.07 | 0.27 ± 0.21 | N = 19 | ||
| 0.5 | 2.90 ± 1.47 | 1.76 ± 1.14 | 0.26 ± 0.11 | ||||
| 1.0 | 3.38 ± 1.96 | 2.38 ± 1.37 | 0.34 ± 0.17 | ||||
| SW620 | 5 μm × 5 μm | 0.01% | 0.5 | 4.13 ± 2.82 | 0.96 ± 0.76 | 0.16 ± 0.09 | N = 17 |
| 1.0 | 3.74 ± 4.03 | 0.90 ± 0.48 | 0.19 ± 0.12 | ||||
| 2.0 | 3.38 ± 2.37 | 1.18 ± 0.79 | 0.32 ± 0.29 |
© 2019 by the authors. Licensee MDPI, Basel, Switzerland. This article is an open access article distributed under the terms and conditions of the Creative Commons Attribution (CC BY) license (http://creativecommons.org/licenses/by/4.0/).
Share and Cite
MDPI and ACS Style
Liang, H.; Zhang, Y.; Chen, D.; Tan, H.; Zheng, Y.; Wang, J.; Chen, J. Characterization of Single-Nucleus Electrical Properties by Microfluidic Constriction Channel. Micromachines 2019, 10, 740. https://doi.org/10.3390/mi10110740
AMA Style
Liang H, Zhang Y, Chen D, Tan H, Zheng Y, Wang J, Chen J. Characterization of Single-Nucleus Electrical Properties by Microfluidic Constriction Channel. Micromachines. 2019; 10(11):740. https://doi.org/10.3390/mi10110740
Chicago/Turabian StyleLiang, Hongyan, Yi Zhang, Deyong Chen, Huiwen Tan, Yu Zheng, Junbo Wang, and Jian Chen. 2019. "Characterization of Single-Nucleus Electrical Properties by Microfluidic Constriction Channel" Micromachines 10, no. 11: 740. https://doi.org/10.3390/mi10110740
Note that from the first issue of 2016, this journal uses article numbers instead of page numbers. See further details here.