Current Applications of Metabolomics in Cirrhosis

1
Margaret M. and Albert B. Alkek Department of Medicine, Section of Gastroenterology and Hepatology, Baylor College of Medicine, Houston, TX 77030, USA
2
Department of Molecular and Cellular Biology, Baylor College of Medicine, Houston, TX 77030, USA
3
Michael E. DeBakey Department of Surgery, Division of Abdominal Transplantation, Baylor College of Medicine, Houston, TX 77030, USA
*
Author to whom correspondence should be addressed.
Metabolites 2018, 8(4), 67; https://doi.org/10.3390/metabo8040067
Submission received: 4 September 2018
/
Revised: 30 September 2018
/
Accepted: 8 October 2018
/
Published: 22 October 2018
Abstract
:Metabolomics is the identification and quantification of all or specified metabolites in a living system under a specific condition or disease. Metabolomics in cirrhosis can be used in diagnosing complications, determining prognosis and assessment of response to therapy. In this review, we summarized representative applications of metabolomics in cirrhosis and significant metabolites associated with cirrhosis and its complications.
1. Introduction
1.1. Metabolomics, Metabolome, Metabolite
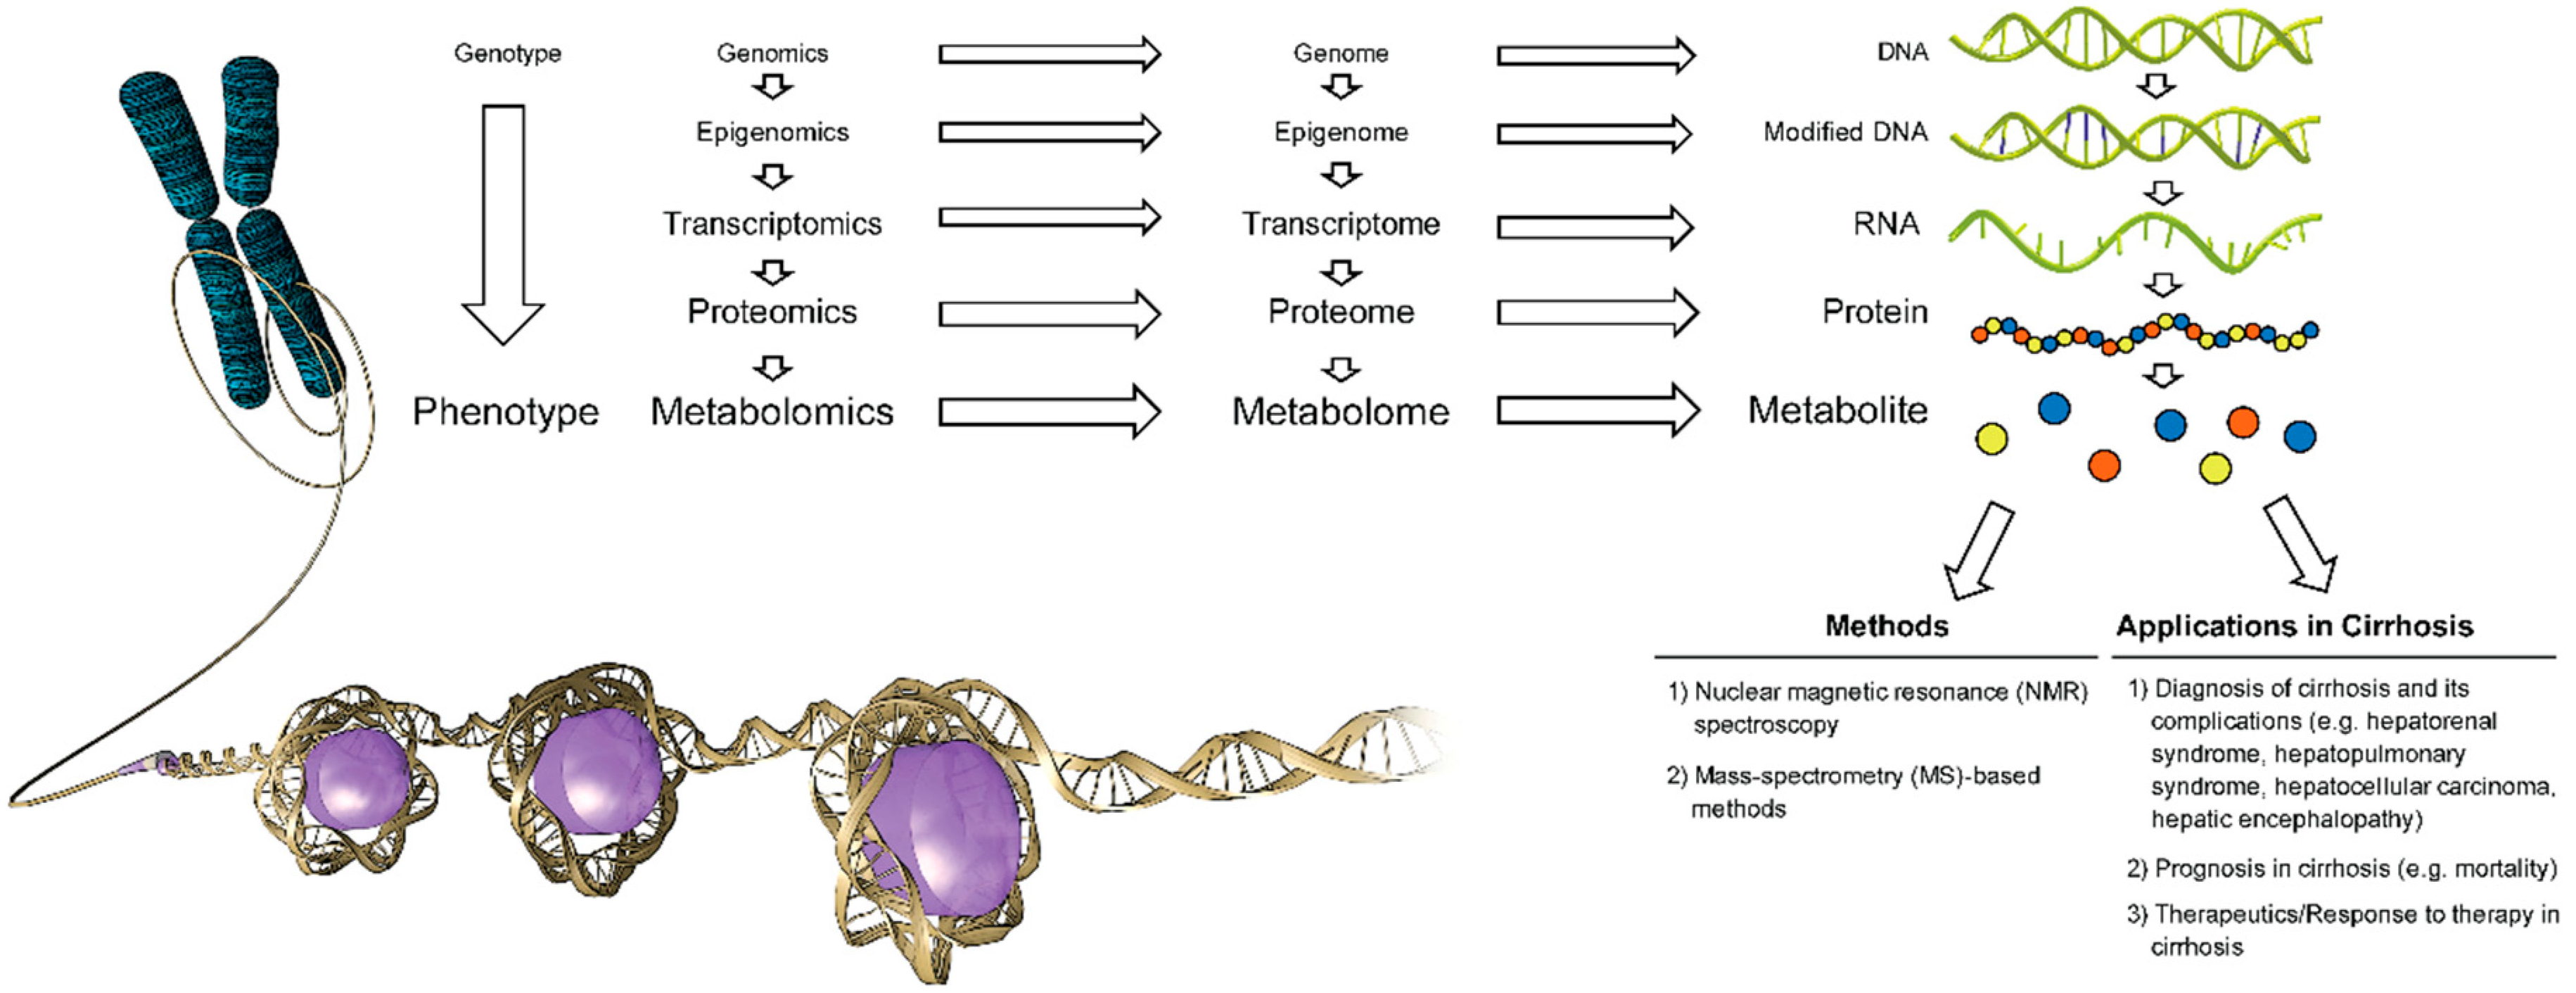
Metabolites are endogenous or exogenous small low-molecular weight downstream intermediate or end-products of genes and proteins in a living organism. The composition of all metabolites generated by a system in a living organism (e.g., cell, organ, tissue) constitute a metabolome [1,2]. Metabolomics is the identification and quantification of all (non-targeted metabolomics profiling) or specified metabolites (targeted metabolomics profiling) in a biological sample (e.g., blood, urine) under a specified condition or disease and identification of metabolic pathways and genes associated with the measured metabolites [1,2] (Figure 1).
1.2. Major Analytical Techniques in Metabolite Detection, Quantitation and Data Analysis
Identification of metabolites in biological samples requires two major analytical consecutive steps including separation of metabolites using gas chromatography, high-performance liquid chromatography or capillary electrophoresis followed by identification and quantification of metabolites using mass spectrometry (MS) or nuclear magnetic resonance (NMR) spectroscopy [1,2,3,4]. Both techniques have strengths and limitations in metabolomic profiling (Table 1) [1,2,3,4]. MS is more sensitive and specific for metabolite detection and more affordable compared to NMR spectroscopy, however it requires separation of analytes for detection and identification [1,2,3,4]. In contrast, NMR spectroscopy is less sensitive for metabolite detection, generally limited to less than 100 analytes in biological fluids, less affordable compared to MS, however it does not require separation of analytes by chromatography or capillary electrophoresis for detection [1,2,3,4].
Detection and quantitation of the analytes using MS is dependent on separation of analytes prior to MS analysis [1,2,3,4]. There are different separation techniques based on metabolite that can be coupled with MS [1,2,3,4]. Liquid chromatography (LC), gas chromatography (GC) and capillary electrophoresis (CE) are among the most widely used techniques [1,2,3,4]. Prior to MS analysis, metabolic extraction using sequential application of ice-cold organic and aqueous solvents, deproteinization and drying of the extract are performed [1,2,3,4]. Metabolite separation using liquid chromatography requires application of different mobile phases specific to different metabolites. Therefore, samples from the same experiments (e.g., plasma sample collected from a study participant) are aliquoted into multiple fractions to be analyzed in different chromatographic conditions [1,2,3,4]. These different chromatographic methods are applied to measure various classes of metabolites using MS (platform) [1,2,3,4].
After chromatographic separation, the MS step starts with ionization of the analytes [1,2,3,4,5]. Several ionization techniques have been described based on the chromatographic method used (e.g., electron or chemical ionization used in gas chromatography; electrospray ionization (ESI), atmospheric pressure chemical ionization used in liquid chromatography) [1,2,3,4]. ESI is among the most commonly used technique in metabolomics [1,2,3,4].
For data analysis, the platform displaying the best characteristics is chosen. Raw data consist of integrated peak areas quantified by the area under the receiver operating characteristic curve, where the units are ion counts [1,2,3,4]. Metabolites are identified based on their retention time on liquid chromatography and mass-to-charge ratio (m/z) obtained on MS [1,2,3,4]. Prior to statistical analysis, different normalization and transformation techniques are applied to transform data into normal scaled data [1,2,3,4]. Metabolite datasets may contain missing values due to low metabolite concentrations requiring imputation with the lowest detected metabolite value in the sample cohort [1,2,3,4].
After the metabolomic data are pre-treated (i.e., normalization, transformation), univariate and multivariate analysis can be performed by different techniques. The primary goal of metabolomics data analysis is metabolite biomarker discovery for disease diagnosis and treatment. Univariate analysis techniques such as t-tests, analysis of variance (ANOVA), volcano plots (plots log of fold change in metabolite(s) value(s) versus negative log of p value) examine a single variable of interest (metabolite) [5]. In contrast to univariate analysis, multivariate analysis examines relationships among multiple variables of interest (several metabolites). Commonly applied multivariate analysis techniques include principle component analysis (PCA), partial least-squares regression (PLS) and discriminant analysis (PLS-DA), and orthogonal partial least-squares regression (OPLS) and discriminant analysis (OPLS-DA) [5]. PCA is a data reduction technique that recognizes meaningful metabolite patterns, and plots them in a 2-D graph [5]. PLS and OPLS are regression methods to develop a predictive model [5,6]. Metrics used for interpretation of a model include R2X, R2Y, and Q2Y that range between 0 and 1 [5,6]. R2X and R2Y are percentages of the variance in the independent and dependent variables, respectively explained by the model [5,6]. Q2Y is the estimated predictive accuracy of the model [5,6]. High accuracy models would have values of R2X, R2Y, and Q2Y close to 1 [5,6].
1.3. Metabolomics in Cirrhosis
Several metabolomic studies were conducted in patients with cirrhosis to identify metabolomic signatures related to the cause and complications of cirrhosis including decompensation, acute-on-chronic liver failure, hepatorenal dysfunction, hepatic encephalopathy, hepatocellular carcinoma, prognosis and response to treatment (Table 2). Herein, we summarized methods and findings of several metabolomic studies conducted in patients with cirrhosis.
2. Current Applications of Metabolomics in Cirrhosis
2.1. Differentiation between Patients with Cirrhosis and Healthy Controls
Studies showed that a set of metabolites is capable of differentiating patients with cirrhosis from healthy controls. Qi et al. [9] conducted a metabolomic pilot study among 60 hepatitis B surface antigen positive patients with compensated and decompensated cirrhosis, and 30 healthy controls using 1H NMR-spectroscopy and performed PCA and OPLS-DA for data analysis. Their results showed that there was a distinct metabolomic signature that differentiated patients with cirrhosis from healthy controls (R2Y = 0.941, Q2Y = 0.836) [9]. This metabolomic signature included several metabolites (e.g., alpha- and beta-glucose, glutamine, glutamate, isobutyrate, lipid, low density lipoprotein (LDL), succinate, tyrosine, valine, very low-density lipoprotein (VLDL)) [9].
In another study conducted among 41 patients with hepatitis B and alcoholic cirrhosis and 20 healthy controls, Qi et al. [10] reported that similar metabolomic signatures detected using 1H NMR-spectroscopy differentiated patients with cirrhosis with hepatitis B (R2Y = 0.915, Q2Y = 0.887) and alcoholic cirrhosis (R2Y = 0.926, Q2Y = 0.903) from healthy controls.
Similarly, Gao et al. [11] using 1H NMR-spectroscopy reported significantly decreased acetoacetate, choline, isoleucine, LDL, leucine, unsaturated lipid, valine, and VLDL, and increased acetate, α-ketoglutarate, glycerol, glutamine, 1-methylhistidine, N-acetylglycoproteins, phenylalanine, pyruvate, taurine, and tyrosine, in 36 patients with cirrhosis compared to 63 healthy controls (R2Y = 0.512, Q2Y = 0.881).
Using quantitative hepatic phosphorus-31 magnetic resonance spectroscopy, Corbin et al. [12] reported significantly lower hepatic beta-ATP and higher phosphomonoester/phosphodiester ratio in 6 patients with decompensated cirrhosis compared with 8 healthy controls. Results of this study suggested reduction in energy stores and pathological changes in phospholipid metabolism in subjects with decompensated cirrhosis [12].
2.2. Differentiation between Decompensated Cirrhosis and Compensated Cirrhosis
Qi et al. [9] showed that there was a distinct serum metabolomic signature that differentiated decompensated from compensated cirrhosis (R2Y = 0.784, Q2Y = 0.598, validation with an accuracy of 85%) [9]. Significant metabolome differences were obtained when patients with compensated cirrhosis were compared to those with decompensated cirrhosis; the latter showed higher levels of alanine, creatine, glutamate, glutamine, histidine, lysine, phenylalanine, pyruvate, succinate, and reduced levels of acetone, LDL, and VLDL [9]. Limited generalizability due to inclusion of patients only with hepatitis B cirrhosis is the major weakness of this study [9]. Elevated levels of creatine might be related to reduced metabolic and urinary clearance of creatine in patients with decompensated cirrhosis (e.g., presence of acute or chronic kidney disease) [9,13].
Using quantitative hepatic phosphorus-31 magnetic resonance spectrometry, Corbin et al. [12] reported that hepatic beta-ATP levels were significantly reduced in decompensated cirrhosis compared to compensated cirrhosis.
2.3. Differentiation between Severe Acute Alcoholic Hepatitis and Alcoholic Cirrhosis
Rachakonda et al. [15] conducted a prospective, case-control study of 25 patients with severe acute alcoholic hepatitis and 25 patients with alcoholic cirrhosis. Results of unbiased global serum metabolomic profiling showed a significant increase in the levels of 152 metabolites and decrease in the levels of 82 metabolites when patients with severe acute alcoholic hepatitis were compared with those with alcoholic cirrhosis [15]. These metabolites identified significantly dysregulated metabolic pathways including increased lipolysis, increased catabolism of branched chain amino acids by skeletal muscle, increased protein and peptide catabolism, decreased glucose utilization by glycolysis, altered fatty acid beta oxidation, intestinal dysbiosis, impaired glucuronidation and methylation when patients with severe acute alcoholic hepatitis were compared with those with alcoholic cirrhosis [15].
2.4. Differentiation between Cirrhosis Secondary to Alcoholic Hepatitis and Acute Decompensated Cirrhosis Secondary to Non-Alcohol Related Etiologies
Ascha et al. [16] conducted a prospective study among 25 patients with cirrhosis secondary to alcoholic hepatitis and 23 patients with acute decompensated cirrhosis secondary to non-alcohol related etiologies. They found that betaine and citrulline, when used in combination, accurately differentiated patients with cirrhosis secondary to cirrhosis secondary to alcoholic hepatitis from the other group (area under the receiver operating characteristics curve = 0.835, 95% confidence interval: 0.747 to 0.978) [16].
2.5. Differentiation between Hepatitis B Cirrhosis and Alcoholic Cirrhosis
Using 1H NMR-spectroscopy, Qi et al. [10] differentiated 21 patients with hepatitis B cirrhosis from 20 patients with alcoholic cirrhosis (R2Y = 0.873, Q2Y = 0.826). Increased isobutyrate and creatine and decreased glutamate, glutamine and acetoacetate levels were observed in patients with hepatitis B compared with those with alcoholic cirrhosis [10].
2.6. Differentiation between Acute on Chronic Liver Failure and Chronic Liver Failure
A study conducted among 30 acute on chronic liver failure and 93 chronic liver failure (compensated or decompensated cirrhosis) patients using 1H NMR spectroscopy showed that an OPLS model was capable of differentiating patients with acute on chronic liver failure from those with chronic liver failure (R2Y = 0.63, Q2Y = 0.73) [17]. This model was correlated with a total of nine metabolites among which creatinine, glutamate, glutamine, ketone bodies including hydroxybutyrate and acetoacetate, pyruvate, lactate, phenylalanine and tyrosine showed an increased signal intensity, and HDL showed a decreased signal intensity [17]. Authors attributed the increased levels of ketone bodies and lactate to anaerobic glycolysis as the major energy source in hypoxia and hepatic necrosis, and the increased levels of glutamine and glutamate to dysfunction of hepatic urea metabolism [17].
2.7. Metabolomic Signature of Hepatorenal Dysfunction and Glomerular Filtration Rate in Patients with Cirrhosis
A unique metabolomic signature consisting of 34 metabolites that significantly increased in patients with high liver and kidney disease severity has recently been described in patients with cirrhosis [18]. Among these metabolites, 4-acetamidobutanoate, trans-aconitate, 1-methylhistidine, glucuronate, N4-acetylcytidine, 3-ureidopropionate, 3-methoxytyramine sulfate, cytidine, S-adenosylhomocysteine (SAH) and myo-inositol were the 10 most significantly increased ones when patients with high liver and kidney liver disease severity were compared with those with low liver and kidney disease severity [18]. This study that used ultrahigh performance liquid chromatography/tandem mass spectrometry to detect plasma metabolites, also showed that all signature metabolites were independent predictors of glomerular filtration rate measured by non-radiolabeled iothalamate plasma clearance in patients with cirrhosis; and erythronate had the highest significant association with measured glomerular filtration rate [18].
2.8. Metabolomic Profile in Patients with Cirrhosis and Minimal (Covert) Hepatic Encephalopathy
An 1H NMR-spectroscopy analysis conducted by Jimenez et al. [19] showed increased glucose, glycerol, lactate, methionine, trimethylamine-N-oxide and decreased acetoacetate, alanine, alpha-acid glycoproteins, branched chain amino acids, choline, glycine, and LDL levels in patients with cirrhosis and minimal hepatic encephalopathy (n = 39) compared with patients with cirrhosis without minimal hepatic encephalopathy (n = 62) (R2Y = 0.68, Q2Y = 0.63). A study conducted among 24 outpatients with cirrhosis and minimal hepatic encephalopathy by Saito et al. [20] identified the pre-treatment serum taurine as an independent predictor of response to treatment with l-carnitine (area under the receiver operating characteristics curve = 0.748, 95% confidence interval: 0.531 to 0.901).
2.9. Metabolomic Profile in Overt Hepatic Encephalopathy
A study conducted by Weiss et al. [21] among 14 patients with hepatic encephalopathy and 27 controls, identified several metabolites in the cerebrospinal fluid associated with altered brain energy metabolism pathways in patients with hepatic encephalopathy. The same study also identified plasma metabolites that differentiated patients with cirrhosis and hepatic encephalopathy from those without hepatic encephalopathy [21]. The key finding of this study was that metabolites associated with altered brain energy metabolism pathways that were detected in the cerebrospinal fluid of patients with hepatic encephalopathy were not detected in the plasma [21]. Small sample size and absence of cirrhosis in two patients with hepatic encephalopathy in the group whose CSF was examined were the major limitations of this study [21].
2.10. Impact of Lactobacillus GG and Rifaximin on Metabolome in Patients with Minimal Hepatic Encephalopathy
Bajaj et al. [22] conducted 8 weeks of a phase 1, randomized, placebo-controlled trial of lactobacillus GG administered twice daily. This study showed increased serum levels of hydroxylamine and benzoic acid and decreased serum levels of isoleucine, threonine and methionine and urine glycodeoxycholic acid, phophatidylcholines, vitamin C and riboflavin metabolites [22]. Despite these changes in the metabolome, there was no improvement in cognitive function [22].
In another study, Bajaj et al. [23] conducted an open label randomized clinical trial among 20 patients with cirrhosis and minimal hepatic encephalopathy to determine the mechanism of 8 weeks of rifaximin administered as 550 mg orally twice a day. Authors showed that rifaximin improved cognitive function and significantly changed serum metabolome, particularly with an increase in serum fatty acid levels, and a modest change in stool microbiome [23]. They also showed that patients who were treated with rifaximin had significantly increased levels of serum long chain fatty acids and reduced levels of lipopolysaccharides compared with controls [23]. They concluded that their findings were in line with those of previous studies that described the impact of fatty acids on brain function [24,25].
2.11. Metabolomic Profile in Hepatopulmonary Syndrome
Results of a prospective study of 24 patients with hepatopulmonary syndrome and 27 controls showed increased plasma levels of several primary and secondary bile acids, bilirubin, biliverdin, endothelin, fatty acids, nitric oxide synthase signaling regulators, sphingosine metabolites, urobilinogen and decreased plasma levels of monoglycerol [26].
2.12. Metabolomic Profile in Hepatocellular Carcinoma (HCC)
Several studies reported diagnostic and prognostic metabolites associated with HCC. Yang et al. [27], using 1H NMR-spectroscopy, showed that there were increased hepatic alanine, choline, glutamate, glutamine, glycine, lactate, leucine, and phosphorylethanolamine and decreased hepatic glucose, glycogen, and triglyceride levels in hepatic tissues involved with HCC compared to tissues free of HCC. Similarly, they showed increased hepatic alanine, choline, glutamate, glutamine, glycine, lactate, leucine, and phosphorylethanolamine and decreased glucose, glycerophophocholine, glycogen, phosphocholine, and triglycerides in high-grade HCC compared to low-grade HCC [27]. Gao et al. [11], using NMR-spectroscopy, showed significantly decreased levels of serum acetoacetate, choline, certain lipids (LDL, VDLD, unsaturated lipid), and valine along with increased levels of several metabolites including acetate, α-ketoglutarate, glycerol, 1-methylhistidine, glutamine, n-acetylglycoproteins, phenylalanine, pyruvate, and tyrosine in 39 patients with hepatocellular carcinoma compared to 63 healthy controls (R2Y = 0.515, Q2Y = 0.805). Collectively, these findings suggest an increase in glycolysis, alterations in tricarboxylic acid cycle, and impaired lipid synthesis [11,27].
Patterson et al. [28], using ultra performance liquid chromatography-electrospray ionization-quadrupole time-of-flight MS, showed decreased plasma lysophosphocholines (14:0; 20:3; and 22:6) and increased bilirubin and biliverdin levels in patients with cirrhosis and HCC compared with those without HCC. They also showed that plasma levels of several lysophosphocholines were decreased and levels of glycodeoxycholic acid and deoxycholic acid 3-sulfate were increased in patients with HCC compared with healthy controls [28]. In this study, the down-regulation of lysophosphocholines might be related to decompensation of liver disease rather than HCC per se, as similar findings were reported in patients with cirrhosis with increased mortality [29].
Lu et al. [30], using liquid and gas chromatography/MS, demonstrated that reduced acetylcarnitine levels accurately differentiated HCC-positive hepatic tissue from tumor-free hepatic tissues and predicted tumor grade and stage progression in HCC. Similarly, they found significantly reduced serum acetylcarnitine levels in patients with HCC compared to healthy subjects and those with HCC-free cirrhosis [30]. They suggested that acetylcarnitine can be considered a metabolomic biomarker complementary to alpha-fetoprotein levels in patients with HCC [30] and attributed reduced levels of acetylcarnitine in HCC patients to the reduced levels of carnitine observed in cancer cachexia [30,31,32].
Grammatikos et al. [33] reported that serum levels of long chain (C16–C20) and very long chain (≥C24) ceramides, sphingosine, sphinganine-1-phosphate and sphingosine-1-phosphate were significantly upregulated in 122 patients with cirrhosis and HCC when compared to 127 patients with cirrhosis without HCC. Results of this study suggest that ceramides play a major regulator role in hepatocarcinogenesis [33].
Soga et al. [34] performed metabolomic profiling of 248 serum samples by capillary electrophoresis/liquid chromatography/MS and reported that several γ-glutamyl dipeptides had large-fold increases in several liver diseases compared to healthy controls. The multivariate model that included γ-Glu-Ala, γ-Glu-Citrulline, γ-Glu-Thr, and γ-Glu-Phe accurately differentiated HCC from the cohort that included controls and patients with drug-induced liver injury, hepatitis B, hepatitis C and cirrhosis (for training cohort: Area under the receiver operating characteristics curve = 0.762, p = 0.00025; for validation cohort: Area under the receiver operating characteristics curve = 0.803) [34]. Authors attributed the increased levels of γ-glutamyl dipeptides to the increased production and consumption of reduced glutathione to overcome increased oxidative stress in hepatic injury [34].
2.13. Mortality without Liver Transplantation
Metabolomic analysis has also been used to predict mortality in patients with cirrhosis. In a study that included 103 patients with cirrhosis, the multivariate Cox regression analysis controlled for measured glomerular filtration rate and demographics showed that metabolites including S-adenosylhomocysteine, glucuronate, trans-aconitate, 3-ureidopropionate, 3-(4-hydroxyphenyl)lactate, 3-methoxytyramine sulfate, arabitol/xylitol, N-formylmethionine, phenyllactate and 7-methylguanine significantly predicted mortality in patients with cirrhosis [18].
McPhail et al. [29] identified several metabolites using 1H NMR spectroscopy and reversed-phase ultra-performance liquid chromatography coupled to time-of-flight MS in 80 patients with decompensated cirrhosis and validated them in an independent cohort of 101 patients with decompensated cirrhosis, 20 patients with stable cirrhosis and 47 healthy subjects. They reported that lysophophatidylcholines and phosphatidylcholines that play a key role in regulation of cell senescence, hepatic repair, immunomodulation and lipolysis were significantly decreased in non-survivors compared to survivors and were inversely correlated with cell death marker levels including M30 and M65 [29]. A prospective study that included 244 patients with cirrhosis showed that reduced levels of long and very long chain ceramides (e.g., C24-ceramide) were significantly associated with higher mortality without liver transplantation [35]. Similarly, another study showed several significantly reduced sphingomyelins, glycerophosphocholines and glycerophosphoethanolamines levels in patients with cirrhosis who had high Model for End-Stage Liver Disease-Sodium (MELD-Na) scores and diuretic-refractory ascites compared with those with less severe liver disease [18]. Collectively, the results of these studies suggest increased endoplasmic reticulum stress, membrane instability and impaired ceramide utilization and lipid signaling in worsening liver disease [18,36,37].
In a study conducted among 48 patients with cirrhosis, tyrosine itself and in combination with MELD score predicted 3-month and 6-month survival without liver transplantation with a greater accuracy compared with the MELD score alone [16].
3. Conclusions and Future Directions
Application of metabolomics in cirrhosis is broad and rapidly evolving. In this review, we presented several metabolomic studies conducted in patients with cirrhosis. Although these studies have identified multiple promising metabolites and/or metabolomic signatures to diagnose, differentiate and determine prognosis; only few of them interpreted data by performing pathway and network analyses to provide mechanistic and therapeutic insights in disease phenotypes. We recommend that following important steps should be considered when conducting metabolomics studies in patients with cirrhosis: (1) Clinical phenotypes related to etiology and complications of cirrhosis should be as distinctive as possible; (2) pathway and network analysis should be performed to identify the most altered pathways to discriminate among clinical phenotypes rather than simply providing a list of metabolites; (3) multi-omics, which is an integrative data analysis of metabolomics with proteomics, genomics, epigenomics, transcriptomics and microbiomics should be taken into consideration as it has recently gained ground to provide better mechanistic understanding of complex disease phenotypes in cirrhosis and its complications [38,39,40,41]; (4) metabolomic signatures should be validated in an independent cohort of patients with cirrhosis that has the same clinical phenotype as the training cohort.
Funding
The project described was supported in part by NIH Public Health Service grant P30DK056338, which funds the Texas Medical Center Digestive Diseases Center, NIH R01CA220297 (N.P), NIH R01CA216426 (N.P)., U01CA179674-01A1 (A.S.), and P30CA125123 Metabolomics Shared Resources (A.S.). and its contents are solely the responsibility of the authors and do not necessarily represent the official views of the National Institute of Diabetes and Digestive and Kidney Diseases or the NIH. The project described was also supported in part by CPRIT Proteomics and Metabolomics Core Facility (A.S, N.P.), American Cancer Society (ACS) Award 127430-RSG-15-105-01-CNE (N.P.)., RP170005 (N.P.), Agilent Foundation (A.S.) and Prostate Cancer Foundation (A.S.).
Acknowledgments
The authors also thank Scott C. Holmes, a member of the Michael E. DeBakey Department of Surgery Research Core at Baylor College of Medicine, for his assistance during the preparation of Figure 1.
Conflicts of Interest
The authors declare no conflict of interest.
Disclosures
Ayse L. Mindikoglu: A provisional patent application (serial No. 62/586,966) is filed with the U.S. Patent and Trademark Office on 16 November 2017, entitled “Metabolomic Biomarkers of Hepatorenal Dysfunction and Mortality in Patients with Cirrhosis”. Nagireddy Putluri, and Arun Sreekumar: Their laboratory receives grant funding from Agilent Technologies to develop mass spectrometry-based biomarkers in cancer (Grant Number 0300016016).
References
- Kalim, S.; Rhee, E.P. An overview of renal metabolomics. Kidney Int. 2017, 91, 61–69. [Google Scholar] [CrossRef] [PubMed] [Green Version]
- Weiss, R.H.; Kim, K. Metabolomics in the study of kidney diseases. Nat. Rev. Nephrol. 2011, 8, 22–33. [Google Scholar] [CrossRef] [PubMed]
- Emwas, A.H. The strengths and weaknesses of NMR spectroscopy and mass spectrometry with particular focus on metabolomics research. Methods Mol. Biol. 2015, 1277, 161–193. [Google Scholar] [PubMed]
- Lei, Z.; Huhman, D.V.; Sumner, L.W. Mass spectrometry strategies in metabolomics. J. Biol. Chem. 2011, 286, 25435–25442. [Google Scholar] [CrossRef] [PubMed]
- Bartel, J.; Krumsiek, J.; Theis, F.J. Statistical methods for the analysis of high-throughput metabolomics data. Comput. Struct. Biotechnol. J. 2013, 4, e201301009. [Google Scholar] [CrossRef] [PubMed]
- Duan, L.X.; Chen, T.L.; Li, M.; Chen, M.; Zhou, Y.Q.; Cui, G.H.; Zhao, A.H.; Jia, W.; Huang, L.Q.; Qi, X.Q. Use of the metabolomics approach to characterize Chinese medicinal material Huangqi. Mol. Plant 2012, 5, 376–386. [Google Scholar] [CrossRef] [PubMed]
- Liu, Y.; Chance, M.R. Pathway analyses and understanding disease associations. Curr. Genet. Med. Rep. 2013, 1. [Google Scholar] [CrossRef] [PubMed]
- Shannon, P.; Markiel, A.; Ozier, O.; Baliga, N.S.; Wang, J.T.; Ramage, D.; Amin, N.; Schwikowski, B.; Ideker, T. Cytoscape: A software environment for integrated models of biomolecular interaction networks. Genome Res. 2003, 13, 2498–2504. [Google Scholar] [CrossRef] [PubMed]
- Qi, S.W.; Tu, Z.G.; Peng, W.J.; Wang, L.X.; Ou-Yang, X.; Cai, A.J.; Dai, Y. 1H NMR-based serum metabolic profiling in compensated and decompensated cirrhosis. World J. Gastroenterol. 2012, 18, 285–290. [Google Scholar] [CrossRef] [PubMed]
- Qi, S.; Tu, Z.; Ouyang, X.; Wang, L.; Peng, W.; Cai, A.; Dai, Y. Comparison of the metabolic profiling of hepatitis B virus-infected cirrhosis and alcoholic cirrhosis patients by using 1H NMR-based metabonomics. Hepatol. Res. 2012, 42, 677–685. [Google Scholar] [CrossRef] [PubMed]
- Gao, H.; Lu, Q.; Liu, X.; Cong, H.; Zhao, L.; Wang, H.; Lin, D. Application of 1H NMR-based metabonomics in the study of metabolic profiling of human hepatocellular carcinoma and liver cirrhosis. Cancer Sci. 2009, 100, 782–785. [Google Scholar] [CrossRef] [PubMed]
- Corbin, I.R.; Ryner, L.N.; Singh, H.; Minuk, G.Y. Quantitative hepatic phosphorus-31 magnetic resonance spectroscopy in compensated and decompensated cirrhosis. Am. J. Physiol. Gastrointest. Liver Physiol. 2004, 287, G379–G384. [Google Scholar] [CrossRef] [PubMed] [Green Version]
- Cocchetto, D.M.; Tschanz, C.; Bjornsson, T.D. Decreased rate of creatinine production in patients with hepatic disease: Implications for estimation of creatinine clearance. Ther. Drug Monit. 1983, 5, 161–168. [Google Scholar] [CrossRef] [PubMed]
- Ishii, T.; Furube, M.; Hirano, S.; Takatori, K.; Iida, K.; Kajiwara, M. Evaluation of 13C-phenylalanine and 13C-tyrosine breath tests for the measurement of hepatocyte functional capacity in patients with liver cirrhosis. Chem. Pharm. Bull. 2001, 49, 1507–1511. [Google Scholar] [CrossRef] [PubMed]
- Rachakonda, V.; Gabbert, C.; Raina, A.; Bell, L.N.; Cooper, S.; Malik, S.; Behari, J. Serum metabolomic profiling in acute alcoholic hepatitis identifies multiple dysregulated pathways. PLoS ONE 2014, 9, e113860. [Google Scholar] [CrossRef] [PubMed] [Green Version]
- Ascha, M.; Wang, Z.; Ascha, M.S.; Dweik, R.; Zein, N.N.; Grove, D.; Brown, J.M.; Marshall, S.; Lopez, R.; Hanouneh, I.A. Metabolomics studies identify novel diagnostic and prognostic indicators in patients with alcoholic hepatitis. World J. Hepatol. 2016, 8, 499–508. [Google Scholar] [CrossRef] [PubMed]
- Amathieu, R.; Triba, M.N.; Nahon, P.; Bouchemal, N.; Kamoun, W.; Haouache, H.; Trinchet, J.C.; Savarin, P.; Le Moyec, L.; Dhonneur, G. Serum 1H-NMR metabolomic fingerprints of acute-on-chronic liver failure in intensive care unit patients with alcoholic cirrhosis. PLoS ONE 2014, 9, e89230. [Google Scholar] [CrossRef] [PubMed]
- Mindikoglu, A.L.; Opekun, A.R.; Putluri, N.; Devaraj, S.; Sheikh-Hamad, D.; Vierling, J.M.; Goss, J.A.; Rana, A.; Sood, G.K.; Jalal, P.K.; et al. Unique metabolomic signature associated with hepatorenal dysfunction and mortality in cirrhosis. Transl. Res. 2018, 195, 25–47. [Google Scholar] [CrossRef] [PubMed]
- Jimenez, B.; Montoliu, C.; MacIntyre, D.A.; Serra, M.A.; Wassel, A.; Jover, M.; Romero-Gomez, M.; Rodrigo, J.M.; Pineda-Lucena, A.; Felipo, V. Serum metabolic signature of minimal hepatic encephalopathy by 1H-nuclear magnetic resonance. J. Proteome Res. 2010, 9, 5180–5187. [Google Scholar] [CrossRef] [PubMed]
- Saito, M.; Hirano, H.; Yano, Y.; Momose, K.; Yoshida, M.; Azuma, T. Serum level of taurine would be associated with the amelioration of minimal hepatic encephalopathy in cirrhotic patients. Hepatol. Res. 2016, 46, 215–224. [Google Scholar] [CrossRef] [PubMed]
- Weiss, N.; Barbier Saint Hilaire, P.; Colsch, B.; Isnard, F.; Attala, S.; Schaefer, A.; Amador, M.D.; Rudler, M.; Lamari, F.; Sedel, F.; et al. Cerebrospinal fluid metabolomics highlights dysregulation of energy metabolism in overt hepatic encephalopathy. J. Hepatol. 2016, 65, 1120–1130. [Google Scholar] [CrossRef] [PubMed]
- Bajaj, J.S.; Heuman, D.M.; Hylemon, P.B.; Sanyal, A.J.; Puri, P.; Sterling, R.K.; Luketic, V.; Stravitz, R.T.; Siddiqui, M.S.; Fuchs, M.; et al. Randomised clinical trial: Lactobacillus GG modulates gut microbiome, metabolome and endotoxemia in patients with cirrhosis. Aliment. Pharmacol. Ther. 2014, 39, 1113–1125. [Google Scholar] [CrossRef] [PubMed] [Green Version]
- Bajaj, J.S.; Heuman, D.M.; Sanyal, A.J.; Hylemon, P.B.; Sterling, R.K.; Stravitz, R.T.; Fuchs, M.; Ridlon, J.M.; Daita, K.; Monteith, P.; et al. Modulation of the metabiome by rifaximin in patients with cirrhosis and minimal hepatic encephalopathy. PLoS ONE 2013, 8, e60042. [Google Scholar] [CrossRef] [PubMed]
- Ronnemaa, E.; Zethelius, B.; Vessby, B.; Lannfelt, L.; Byberg, L.; Kilander, L. Serum fatty-acid composition and the risk of Alzheimer’s disease: A longitudinal population-based study. Eur. J. Clin. Nutr. 2012, 66, 885–890. [Google Scholar] [CrossRef] [PubMed]
- Youdim, K.A.; Martin, A.; Joseph, J.A. Essential fatty acids and the brain: Possible health implications. Int. J. Dev. Neurosci. 2000, 18, 383–399. [Google Scholar] [CrossRef]
- Fallon, K.M.; Forde, K.A.; Krok, K.; Patel, M.; Lin, G.; Oh, J.K.; Mottram, C.; Scanlon, P.D.; Batra, S.; Goldberg, D.S.; et al. Plasma Metabolomic Profiling in Hepatopulmonary Syndrome. Hepatology 2015, 62, 927A–928A. [Google Scholar]
- Yang, Y.; Li, C.; Nie, X.; Feng, X.; Chen, W.; Yue, Y.; Tang, H.; Deng, F. Metabonomic studies of human hepatocellular carcinoma using high-resolution magic-angle spinning 1H NMR spectroscopy in conjunction with multivariate data analysis. J. Proteome Res. 2007, 6, 2605–2614. [Google Scholar] [CrossRef] [PubMed]
- Patterson, A.D.; Maurhofer, O.; Beyoglu, D.; Lanz, C.; Krausz, K.W.; Pabst, T.; Gonzalez, F.J.; Dufour, J.F.; Idle, J.R. Aberrant lipid metabolism in hepatocellular carcinoma revealed by plasma metabolomics and lipid profiling. Cancer Res. 2011, 71, 6590–6600. [Google Scholar] [CrossRef] [PubMed]
- McPhail, M.J.; Shawcross, D.L.; Lewis, M.R.; Coltart, I.; Want, E.J.; Antoniades, C.G.; Veselkov, K.; Triantafyllou, E.; Patel, V.; Pop, O.; et al. Multivariate metabotyping of plasma predicts survival in patients with decompensated cirrhosis. J. Hepatol. 2016, 64, 1058–1067. [Google Scholar] [CrossRef] [PubMed] [Green Version]
- Lu, Y.; Li, N.; Gao, L.; Xu, Y.J.; Huang, C.; Yu, K.; Ling, Q.; Cheng, Q.; Chen, S.; Zhu, M.; et al. Acetylcarnitine Is a Candidate Diagnostic and Prognostic Biomarker of Hepatocellular Carcinoma. Cancer Res. 2016, 76, 2912–2920. [Google Scholar] [CrossRef] [PubMed]
- Malaguarnera, M.; Risino, C.; Gargante, M.P.; Oreste, G.; Barone, G.; Tomasello, A.V.; Costanzo, M.; Cannizzaro, M.A. Decrease of serum carnitine levels in patients with or without gastrointestinal cancer cachexia. World J. Gastroenterol. 2006, 12, 4541–4545. [Google Scholar] [CrossRef] [PubMed]
- Vinci, E.; Rampello, E.; Zanoli, L.; Oreste, G.; Pistone, G.; Malaguarnera, M. Serum carnitine levels in patients with tumoral cachexia. Eur. J. Intern. Med. 2005, 16, 419–423. [Google Scholar] [CrossRef] [PubMed]
- Grammatikos, G.; Schoell, N.; Ferreiros, N.; Bon, D.; Herrmann, E.; Farnik, H.; Koberle, V.; Piiper, A.; Zeuzem, S.; Kronenberger, B.; et al. Serum sphingolipidomic analyses reveal an upregulation of C16-ceramide and sphingosine-1-phosphate in hepatocellular carcinoma. Oncotarget 2016, 7, 18095–18105. [Google Scholar] [CrossRef] [PubMed]
- Soga, T.; Sugimoto, M.; Honma, M.; Mori, M.; Igarashi, K.; Kashikura, K.; Ikeda, S.; Hirayama, A.; Yamamoto, T.; Yoshida, H.; et al. Serum metabolomics reveals gamma-glutamyl dipeptides as biomarkers for discrimination among different forms of liver disease. J. Hepatol. 2011, 55, 896–905. [Google Scholar] [CrossRef] [PubMed]
- Grammatikos, G.; Ferreiros, N.; Waidmann, O.; Bon, D.; Schroeter, S.; Koch, A.; Herrmann, E.; Zeuzem, S.; Kronenberger, B.; Pfeilschifter, J. Serum Sphingolipid Variations Associate with Hepatic Decompensation and Survival in Patients with Cirrhosis. PLoS ONE 2015, 10, e0138130. [Google Scholar] [CrossRef] [PubMed]
- Hannun, Y.A.; Obeid, L.M. Principles of bioactive lipid signalling: Lessons from sphingolipids. Nat. Rev. Mol. Cell Biol. 2008, 9, 139–150. [Google Scholar] [CrossRef] [PubMed]
- Slotte, J.P. Biological functions of sphingomyelins. Prog. Lipid Res. 2013, 52, 424–437. [Google Scholar] [CrossRef] [PubMed]
- Bajaj, J.S.; Gillevet, P.M.; Patel, N.R.; Ahluwalia, V.; Ridlon, J.M.; Kettenmann, B.; Schubert, C.M.; Sikaroodi, M.; Heuman, D.M.; Crossey, M.M.; et al. A longitudinal systems biology analysis of lactulose withdrawal in hepatic encephalopathy. Metab. Brain Dis. 2012, 27, 205–215. [Google Scholar] [CrossRef] [PubMed]
- Song, Y.N.; Dong, S.; Wei, B.; Liu, P.; Zhang, Y.Y.; Su, S.B. Metabolomic mechanisms of gypenoside against liver fibrosis in rats: An integrative analysis of proteomics and metabolomics data. PLoS ONE 2017, 12, e0173598. [Google Scholar] [CrossRef] [PubMed]
- Iebba, V.; Guerrieri, F.; Di Gregorio, V.; Levrero, M.; Gagliardi, A.; Santangelo, F.; Sobolev, A.P.; Circi, S.; Giannelli, V.; Mannina, L.; et al. Combining amplicon sequencing and metabolomics in cirrhotic patients highlights distinctive microbiota features involved in bacterial translocation, systemic inflammation and hepatic encephalopathy. Sci. Rep. 2018, 8, 8210. [Google Scholar] [CrossRef] [PubMed]
- Ressom, H.W.; Di Poto, C.; Ferrarini, A.; Yunli, H.; Nezami Ranjbar, M.R.; Ehwang, S.; Varghese, R.S.; Minkun, W.; Shiyue, Z.; Rui, Z.; et al. Multi-omic approaches for characterization of hepatocellular carcinoma. Conf. Proc. IEEE Eng. Med. Biol. Soc. 2016, 2016, 3437–3440. [Google Scholar] [PubMed]
Figure 1.
Current methods and applications of metabolomics in cirrhosis (Used with permission of Baylor College of Medicine).
Figure 1.
Current methods and applications of metabolomics in cirrhosis (Used with permission of Baylor College of Medicine).


Table 1.
Major advantages and disadvantages of the mass spectrometry (MS) and NMR Spectroscopy.
| Mass Spectrometry | NMR Spectroscopy |
|---|---|
| More sensitivity | Less sensitivity |
| Requires a smaller amount of sample | Requires more samples |
| Destructive to the sample | Non-destructive to the sample |
| Various ionization techniques applied to detect a greater number of metabolites | Single method applied |
| All elemental composition | Proton, carbon, phosphorus |
| Less expensive | More expensive |
| Difficult to measure polymers | Great advantage for polymer analysis |
| Less reproducible | More reproducible |
| Equipment requires smaller space | Equipment requires larger space |
Table 2.
Current applications of metabolomics in patients with cirrhosis.
| Applications | Representative Metabolites * | Representative Studies | Technique Used | |
|---|---|---|---|---|
| Increased ** | Decreased ** | |||
| Differentiation Between Patients with Cirrhosis ** and Healthy Controls | Blood acetate, α-ketoglutarate, glycerol, glutamine, 1-methylhistidine, N-acetylglycoproteins, phenylalanine, pyruvate, taurine, tyrosine, hepatic phosphomonoester/phosphodiester ratio | Blood acetoacetate, choline, isoleucine, LDL, leucine, unsaturated lipid, valine, VLDL, hepatic tissue beta-ATP | Gao et al. (2009) [11], Corbin et al. (2004) [12] | 1H NMR-spectroscopy, quantitative hepatic phosphorus-31 magnetic resonance spectroscopy |
| Differentiation Between Decompensated Cirrhosis ** and Compensated Cirrhosis | Blood alanine, creatine, glutamate, glutamine, histidine, lysine, phenylalanine, pyruvate, succinate | Blood acetone, LDL, VLDL, hepatic tissue beta-ATP | Qi et al. (2012) [9], Corbin et al. (2004) [12] | 1H NMR-spectroscopy, quantitative hepatic phosphorus-31 magnetic resonance spectroscopy |
| Differentiation Between Severe Acute Alcoholic Hepatitis ** and Alcoholic Cirrhosis | Blood glucuronate, biliverdin, erythronate, methionine, lactate, cortisol, N-acetyltryptophan, symmetric dimethylarginine | Blood choline, glycerophosphocholine (GPC), glycerol-3-phosphate, ascorbate, serotonin, isoleucine, leucine, valine, deoxycholate, glycodeoxycholate | Rachakonda et al. (2014) [15] | MS |
| Differentiation Between Hepatitis B Cirrhosis ** and Alcoholic Cirrhosis | Blood creatine, isobutyrate | Blood acetoacetate, glutamate, glutamine | Qi et al. (2012) [10] | 1H NMR-spectroscopy |
| Differentiation Between Cirrhosis Secondary to Alcoholic Hepatitis ** and Acute Decompensated Cirrhosis Secondary to Non-Alcohol Related Etiologies | Blood betaine, citrulline, creatinine, phenylalanine, homocitrulline, tyrosine, octenoyl-carnitine, symmetric dimethylarginine | Ascha et al. (2016) [16] | MS | |
| Differentiation Between Acute on Chronic Liver Failure ** and Chronic Liver Failure | Blood creatinine, glutamate, glutamine, ketone bodies (hydroxybutyrate and acetoacetate), pyruvate, lactate, phenylalanine and tyrosine | Blood HDL | Amathieu et al. (2014) [17] | 1H NMR-spectroscopy |
| Metabolomic Signature of Hepatorenal Dysfunction in Cirrhosis (Differentiation Between High Liver and Kidney Disease Severity ** and Low Liver and Kidney Disease Severity) | The top 10 among 34 blood metabolites based on fold increase included 4-acetamidobutanoate, trans-aconitate, 1-methylhistidine, glucuronate, N4-acetylcytidine, 3-ureidopropionate, 3-methoxytyramine sulfate, cytidine, S-adenosylhomocysteine, myo-inositol | Mindikoglu et al. (2017) [18] | MS | |
| Metabolomic Signature of Reduced Glomerular Filtration Rate | The top 10 among 34 blood metabolites based on R-square included erythronate, N6-carbamoylthreonyladenosine, 1-methylhistidine, pseudouridine, N-acetylserine, creatinine, 7-methylguanine, N2–N2-dimethylguanosine, C-glycosyltryptophan, myo-inositol | Mindikoglu et al. (2018) [18] | MS | |
| Minimal (Covert) Hepatic Encephalopathy | Blood glucose, glycerol, lactate, methionine, trimethylamine-N-oxide | Acetoacetate, alanine, alpha-acid glycoproteins, branched chain amino acids, choline, glycine, and lipid moiety, taurine | Jimenez et al. (2010) [19], Saito et al. (2016) [20] | 1H NMR-spectroscopy, MS |
| Differentiation Between Subjects with Hepatic Encephalopathy ** and Controls without Neurological Disease | Cerebrospinal fluid glutamine, glutamate, phenylalanine, tryptophan, methionine, formyl-methionine, N4-acetylcytidine | Cerebrospinal fluid taurine | Weiss et al. [21] | MS |
| Impact of Lactobacillus GG on Metabolome in Patients with Minimal Hepatic Encephalopathy | Blood hydroxylamine and benzoic acid | Blood isoleucine, threonine, methionine, urine metabolites including glycodeoxycholic acid, phophatidylcholines, vitamin C, riboflavin metabolites | Bajaj et al. (2014) [22] | MS |
| Impact of Rifaximin on Metabolome in Patients with Minimal Hepatic Encephalopathy | Blood myristic acid, caprylic acid, palmitic acid, succinic acid, fructose | Blood lipopolysaccharides | Bajaj et al. (2013) [23] | MS |
| Hepatopulmonary Syndrome | Blood primary and secondary bile acids, bilirubin, biliverdin, endothelin, fatty acids, nitric oxide synthase signaling regulators, sphingosine metabolites, urobilinogen | Blood monoglycerol | Fallon et al. (2015) [26] | MS |
| Differentiation Between Hepatocellular Carcinoma (HCC) ** and HCC-Free Hepatic Tissue | Hepatic alanine, choline, glutamate, glutamine, glycine, lactate, leucine, and phosphorylethanolamine | Hepatic glucose, glycogen, and triglyceride, acetylcarnitine | Yang et al. (2007) [27], Lu et al. (2016) | 1H NMR-spectroscopy, MS |
| Differentiation Between High-Grade HCC ** and Low-Grade HCC | Hepatic alanine, choline, glutamate, glutamine, glycine, lactate, leucine, and phosphorylethanolamine | Hepatic glucose, glycerophophocholine, glycogen, phosphocholine, and triglycerides | Yang et al. (2007) [27] | 1H NMR-spectroscopy |
| Differentiation Between Cirrhosis with HCC ** and Cirrhosis without HCC | Blood bilirubin, biliverdin, γ-glutamyl dipeptides (γ-Glu-Ala, γ-Glu-Citrulline, γ-Glu-Thr, and γ-Glu-Phe), long chain (C16–C20) and very long chain (≥C24) ceramides, sphingosine, sphinganine-1-phosphate and sphingosine-1-phosphate | Several blood lysophosphocholines | Patterson et al. (2011) [28], Soga et al. (2011) [34], Grammatikos et al. (2016) [33] | MS |
| Differentiation Between Subjects with HCC ** and Healthy Subjects | Blood glycodeoxycholic acid, deoxycholic acid 3-sulfate, acetate, α-ketoglutarate, glycerol, 1-methylhistidine, n-acetylglycoproteins, phenylalanine, pyruvate, tyrosine | Several blood lysophosphocholines, acetoacetate, choline, certain lipids (LDL, VLDL, unsaturated lipid), and valine | Patterson et al. (2011) [28], Gao et al. (2009) [11] | 1H NMR-spectroscopy, MS |
| Increased Mortality without Liver Transplantation | Blood S-adenosylhomocysteine, glucuronate, trans-aconitate, 3-ureidopropionate, 3-(4-hydroxyphenyl)lactate, 3-methoxytyramine sulfate, arabitol/xylitol, N-formylmethionine, phenyllactate and 7-methylguanine, tyrosine | Several blood sphingomyelins, glycerophosphocholines, glycerophosphoethanolamines, lysophophatidylcholines, phosphatidylcholines, long and very long chain ceramides (e.g., C24-ceramide) | Mindikoglu et al. (2018) [18], McPhail et al. (2016) [29], Grammatikos et al. (2015) [35], Ascha et al. (2016) [16] | MS, 1H NMR-spectroscopy |
* Metabolites included in this table do not contain the full list of metabolites reported in the representative studies cited. ** Increased and decreased levels of metabolites occurred in the condition indicated.
© 2018 by the authors. Licensee MDPI, Basel, Switzerland. This article is an open access article distributed under the terms and conditions of the Creative Commons Attribution (CC BY) license (http://creativecommons.org/licenses/by/4.0/).
Share and Cite
MDPI and ACS Style
Khan, V.; Putluri, N.; Sreekumar, A.; Mindikoglu, A.L. Current Applications of Metabolomics in Cirrhosis. Metabolites 2018, 8, 67. https://doi.org/10.3390/metabo8040067
AMA Style
Khan V, Putluri N, Sreekumar A, Mindikoglu AL. Current Applications of Metabolomics in Cirrhosis. Metabolites. 2018; 8(4):67. https://doi.org/10.3390/metabo8040067
Chicago/Turabian StyleKhan, Vinshi, Nagireddy Putluri, Arun Sreekumar, and Ayse L. Mindikoglu. 2018. "Current Applications of Metabolomics in Cirrhosis" Metabolites 8, no. 4: 67. https://doi.org/10.3390/metabo8040067
Note that from the first issue of 2016, this journal uses article numbers instead of page numbers. See further details here.