Article

Plasma Prostaglandin E2 Metabolite Levels Predict Type 2 Diabetes Status and One-Year Therapeutic Response Independent of Clinical Markers of Inflammation

1
Research Service, William S. Middleton Memorial VA Hospital, Madison, WI 53705, USA
2
Department of Nutritional Sciences, University of Wisconsin-Madison, Madison, WI 53706, USA
3
Department of Clinical Nutrition, UW Health University Hospital, Madison, WI 53705, USA
4
Department of Medicine, Division of Endocrinology, Diabetes, and Metabolism, University of Wisconsin-Madison, Madison, WI 53706, USA
5
Department of Pediatrics, University of Wisconsin-Madison, Madison, WI 53792, USA
6
Department of Cell and Regenerative Biology, University of Wisconsin-Madison, Madison, WI 53792, USA
*
Authors to whom correspondence should be addressed.
These authors contributed equally to this work.
Metabolites 2022, 12(12), 1234; https://doi.org/10.3390/metabo12121234
Submission received: 10 October 2022 / Revised: 1 December 2022 / Accepted: 2 December 2022 / Published: 8 December 2022
(This article belongs to the Section Endocrinology and Clinical Metabolic Research)

Abstract

:
Over half of patients with type 2 diabetes (T2D) are unable to achieve blood glucose targets despite therapeutic compliance, significantly increasing their risk of long-term complications. Discovering ways to identify and properly treat these individuals is a critical problem in the field. The arachidonic acid metabolite, prostaglandin E2 (PGE2), has shown great promise as a biomarker of β-cell dysfunction in T2D. PGE2 synthesis, secretion, and downstream signaling are all upregulated in pancreatic islets isolated from T2D mice and human organ donors. In these islets, preventing β-cell PGE2 signaling via a prostaglandin EP3 receptor antagonist significantly improves their glucose-stimulated and hormone-potentiated insulin secretion response. In this clinical cohort study, 167 participants, 35 non-diabetic, and 132 with T2D, were recruited from the University of Wisconsin Hospital and Clinics. At enrollment, a standard set of demographic, biometric, and clinical measurements were performed to quantify obesity status and glucose control. C reactive protein was measured to exclude acute inflammation/illness, and white cell count (WBC), erythrocyte sedimentation rate (ESR), and fasting triglycerides were used as markers of systemic inflammation. Finally, a plasma sample for research was used to determine circulating PGE2 metabolite (PGEM) levels. At baseline, PGEM levels were not correlated with WBC and triglycerides, only weakly correlated with ESR, and were the strongest predictor of T2D disease status. One year after enrollment, blood glucose management was assessed by chart review, with a clinically-relevant change in hemoglobin A1c (HbA1c) defined as ≥0.5%. PGEM levels were strongly predictive of therapeutic response, independent of age, obesity, glucose control, and systemic inflammation at enrollment. Our results provide strong support for future research in this area.

1. Introduction

Pre-diabetes and diabetes directly affect over 100 million people in the United States. Type 2 diabetes (T2D), which is strongly associated with obesity and inflammation, accounts for 95% of these diagnoses [1]. Current standards of care include diet and lifestyle modifications, oral and injectable anti-diabetic drugs, and insulin. Yet, despite therapeutic compliance, over 50% of T2D patients are unable to achieve blood glucose targets, as defined by a hemoglobin A1C (HbA1c) value of less than 7% [2]. Being able to determine which patients are at risk for therapeutic failure remains a significant problem in the field. A precision (i.e., personalized) medicine approach that recognizes and incorporates the many individual differences noted in practice is a significant focus of current research in the field [3,4,5,6,7,8].
PGE2 is an arachidonic acid metabolite, and its formation is catalyzed by a series of enzymes, with cyclooxygenase (COX) 1 or 2 catalyzing the rate-limiting step. COX-2 expression is inducible and its activity and/or expression is significantly elevated in the hyperglycemic, dyslipidemic, and/or inflammatory conditions associated with T2D [9,10,11,12,13,14,15,16,17]. In preclinical work using mouse models of T2D and/or pancreatic islets obtained from human organ donors with T2D, prostaglandin E2 (PGE2) limits expected insulin secretion in response to both glucose and incretin hormones such as glucagon-like peptide 1 (GLP-1), actively contributing to β-cell dysfunction [9,10,11]. Furthermore, arachidonic acid, its precursors, and/or its metabolites have been shown to be elevated in biofluids (e.g., plasma, serum, urine) from both animals and human subjects with T2D [18,19,20,21,22]. Taken together, these preclinical data provide strong support for pursuing PGE2 as a potential biomarker for T2D status and, potentially, therapeutic response.
In this work, we conducted a cross-sectional analysis of adults with T2D to determine if plasma levels of PGE2 metabolite (PGEM) correlated with T2D status, comparing PGEM to other established markers of glucose control and inflammation. Finally, baseline PGEM levels were compared to longitudinal glycemic control (as measured by percent change in HbA1c over 1 year), thus providing insight into the relevance of PGE2 to T2D therapeutic response.

2. Materials and Methods

2.1. Study Design, Intake Appointment, and Plasma Sample Collection

Study design and participant recruitment have been previously described [21]. In brief, 132 individuals with T2D and 35 non-diabetic individuals were enrolled between June 2014 and August 2015 at UW Health Hospitals and Clinics (UWHC). Inclusion criteria were ages 18–74, not pregnant or lactating, no anemia or grossly abnormal kidney or liver function tests, no known autoimmune diseases or inflammatory disorders, and no diagnosis of diabetes besides T2D. Exclusion criteria included the history of transplant, chronic steroid use, or the use of COX inhibitors other than low-dose aspirin for cardiovascular health more than twice per week during the past 90 days. Subjects were instructed to fast for 10 h prior to an upcoming diabetes standard-of-care care appointment, where biometric measurements and clinical laboratory tests were performed. Height and weight (to calculate BMI), blood pressure, and pulse were measured, and daily prophylactic low-dose aspirin and omega-3/fish oil supplement use were noted. Current T2D medications were confirmed and recorded. Diabetes standard-of-care laboratory tests, including HgA1c, complete metabolic panel (CMP), and fasting lipid panel, were coordinated with the patient’s provider. Additional clinical laboratory tests performed for research included white blood cell count (WBC), C reactive protein (CRP), and erythrocyte sedimentation rate (ESR). A plasma sample for research was collected in an 8.5 mL BD P800 blood collection tube coated with potassium EDTA and a proprietary mix of protease and esterase inhibitors (BD Biosciences, Franklin Lakes, NJ, USA, cat. No. 366421) for downstream analysis of PGEM levels.

2.2. Prostaglandin E Metabolite (PGEM) Assay

Plasma PGE2 levels were quantified using a Prostaglandin E Metabolite (PGEM) enzyme-linked immunosorbent assay (ELISA) kit (Cayman Chemical Company, Ann Arbor, MI, USA, cat. No. 514531), which converts 13,14-dihydro-15-keto PGE2 and 13,14-dihydro-15-keto PGE2 to a single, stable derivative. The assay was conducted according to the manufacturer’s protocol, as previously described [21]. Briefly, after samples were purified by acetone precipitation, they were dried under a nitrogen stream. Samples were then resuspended in ELISA buffer and derivatized overnight. A 1:5 sample dilution was assayed in duplicate.

2.3. Statistical Analysis

Logistic regression analysis was used to determine the relationship between plasma PGEM levels and T2D status. SAS software was used with a Probit procedure for this analysis (SAS/STAT, Cary, NC, USA). All other statistical analyses were performed using GraphPad Prism version 9 (GraphPad Software, San Diego, CA, USA), and data were compared by one- or two-way analysis of variance or Student t-test as appropriate, as described in the figure legends. A p-value < 0.05 was considered statistically significant.

3. Results

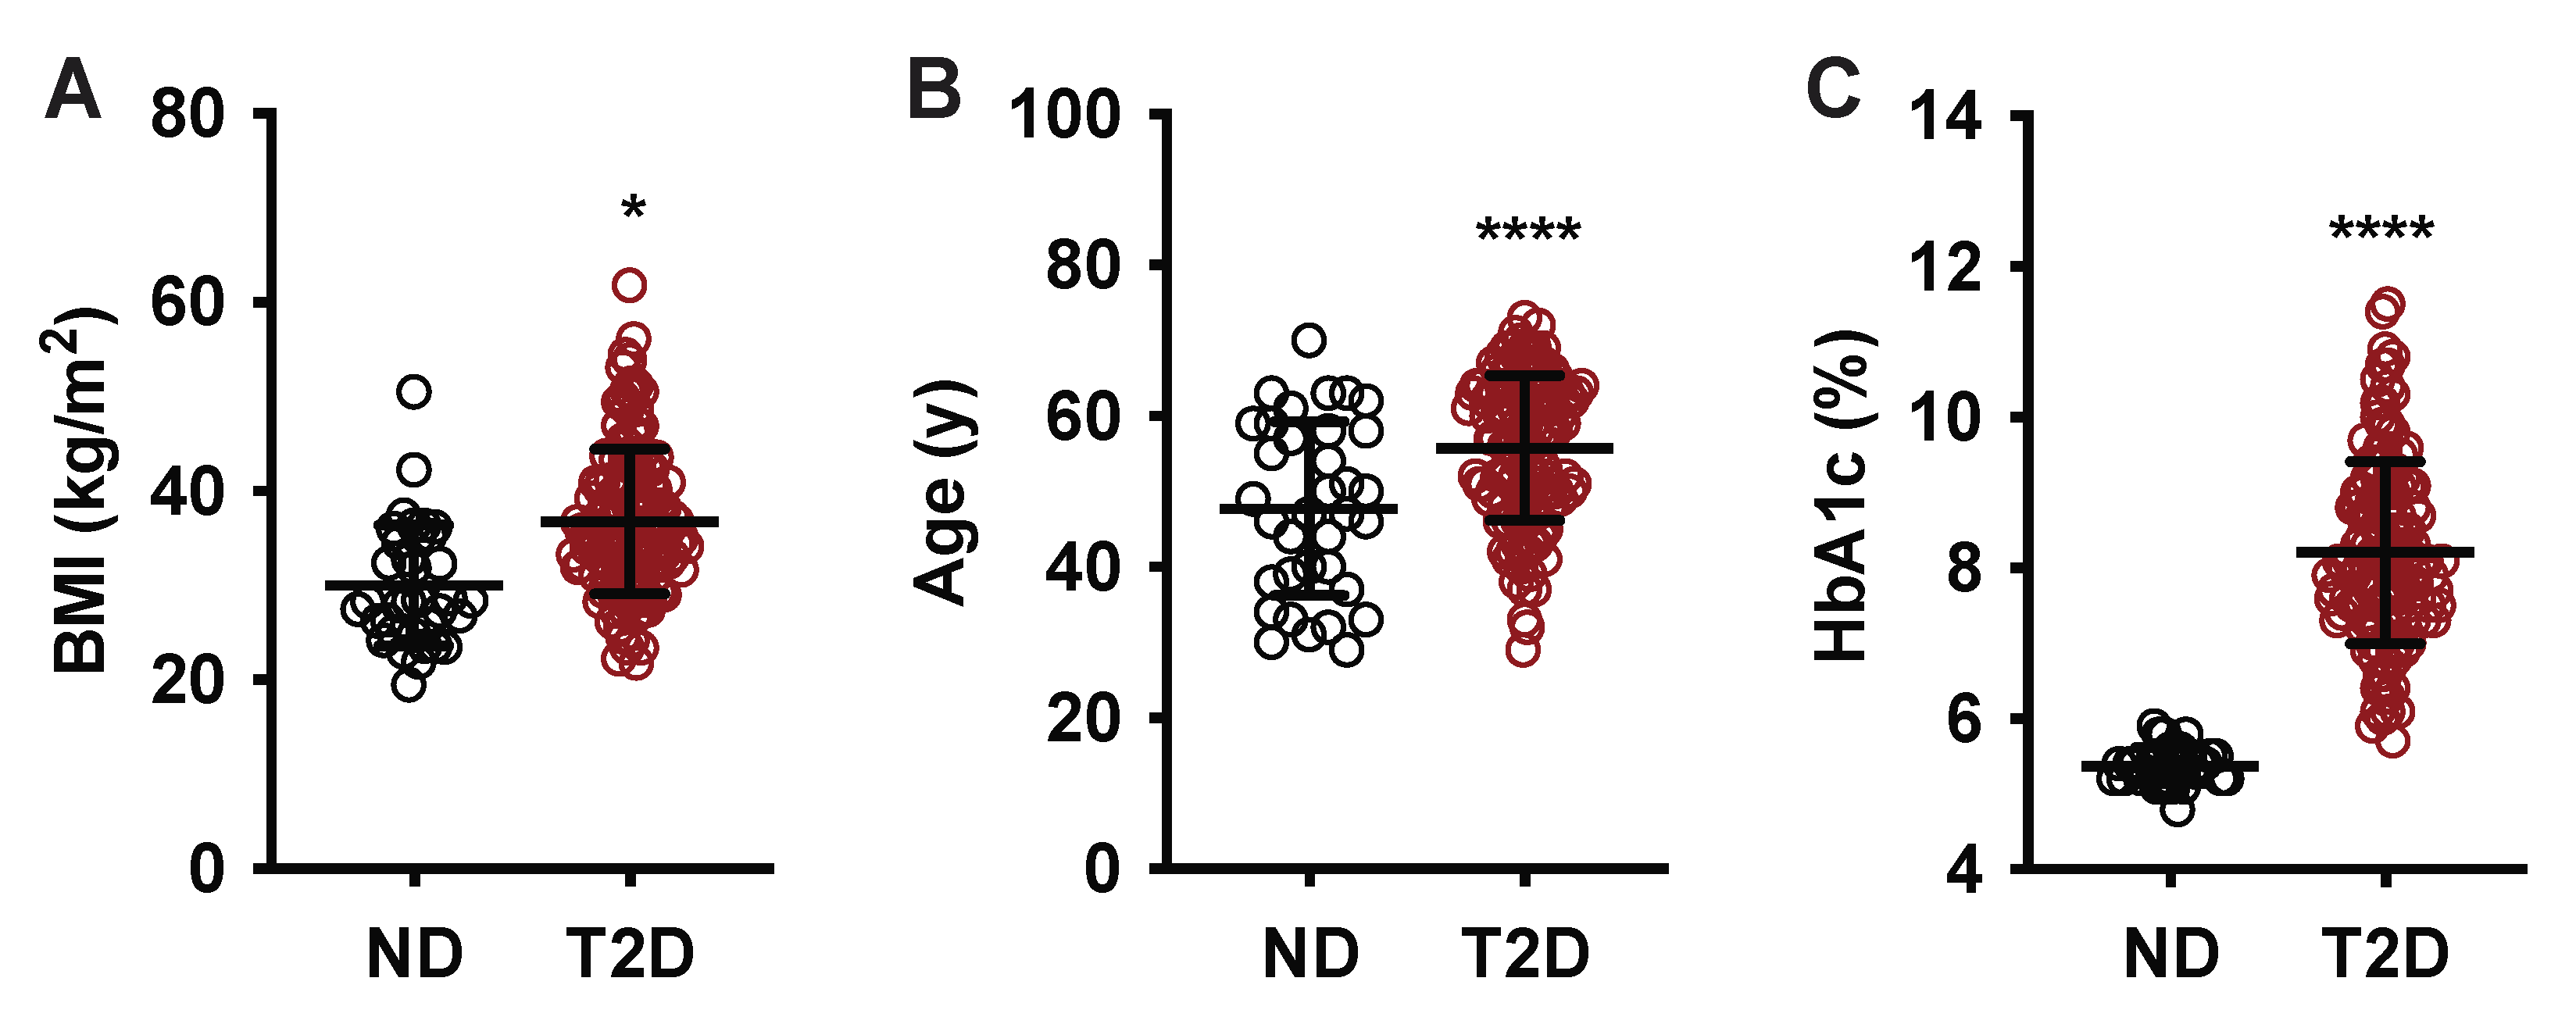
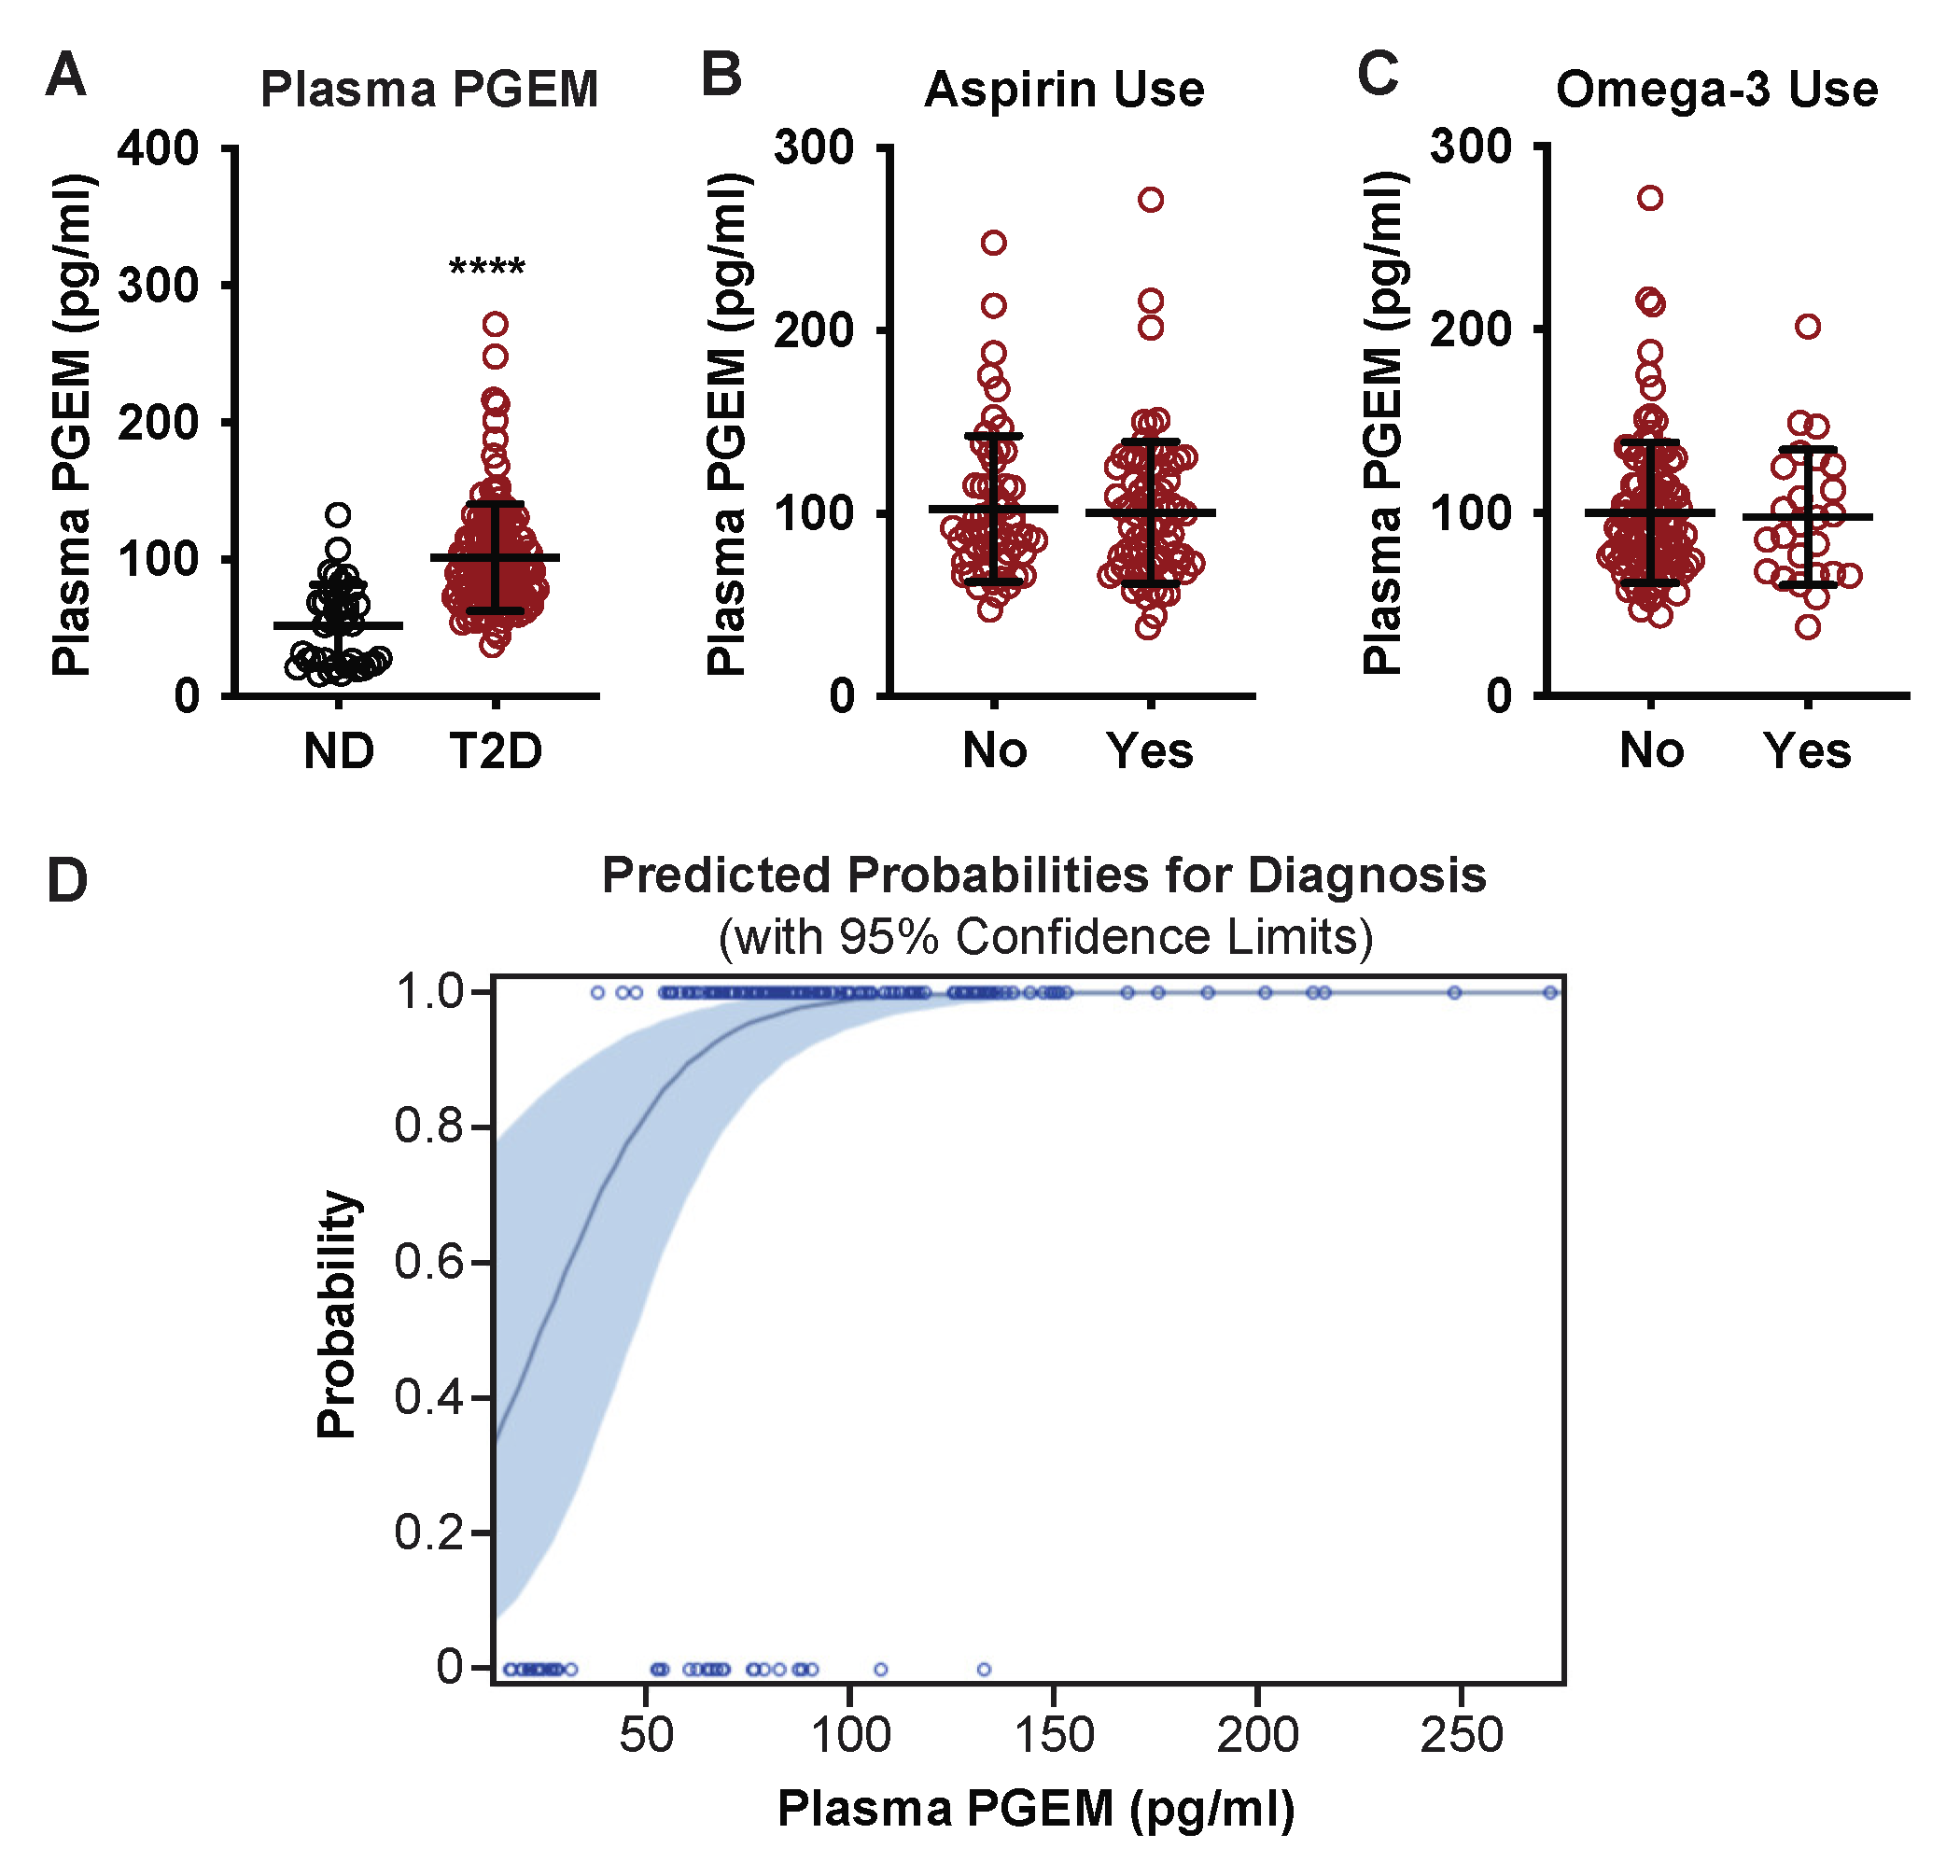
3.1. Plasma PGEM Is Increased Specifically in Subjects with T2D

Demographic information for the non-diabetic (ND) control group (n = 35) and T2D group (n = 132) are listed in Table 1. Most subjects were white/non-Hispanic, and approximately equal numbers of male and female subjects were represented (Table 1).
Subject age range was similar for both groups (29–70 years, ND vs. 29–73 years, T2D), although the means were statistically different (47.8 ± 11.5, ND vs. 55.8 ± 9.6 T2D; p < 0.0001) (Table 1 and Figure 1A). Like age, the BMI range was similar between groups (19.48–50.51, ND vs. 21.79–61.85), although the difference in mean BMI was statistically significant (29.89 ± 6.52, ND vs. 36.79 ± 7.72, T2D; p < 0.0001) (Table 1 and Figure 1B). The mean HbA1c for the T2D group was significantly higher than that of the ND group, as expected (5.4 ± 0.2, ND vs. 8.2 ± 1.2, T2D; p < 0.0001) (Table 1 and Figure 1C).

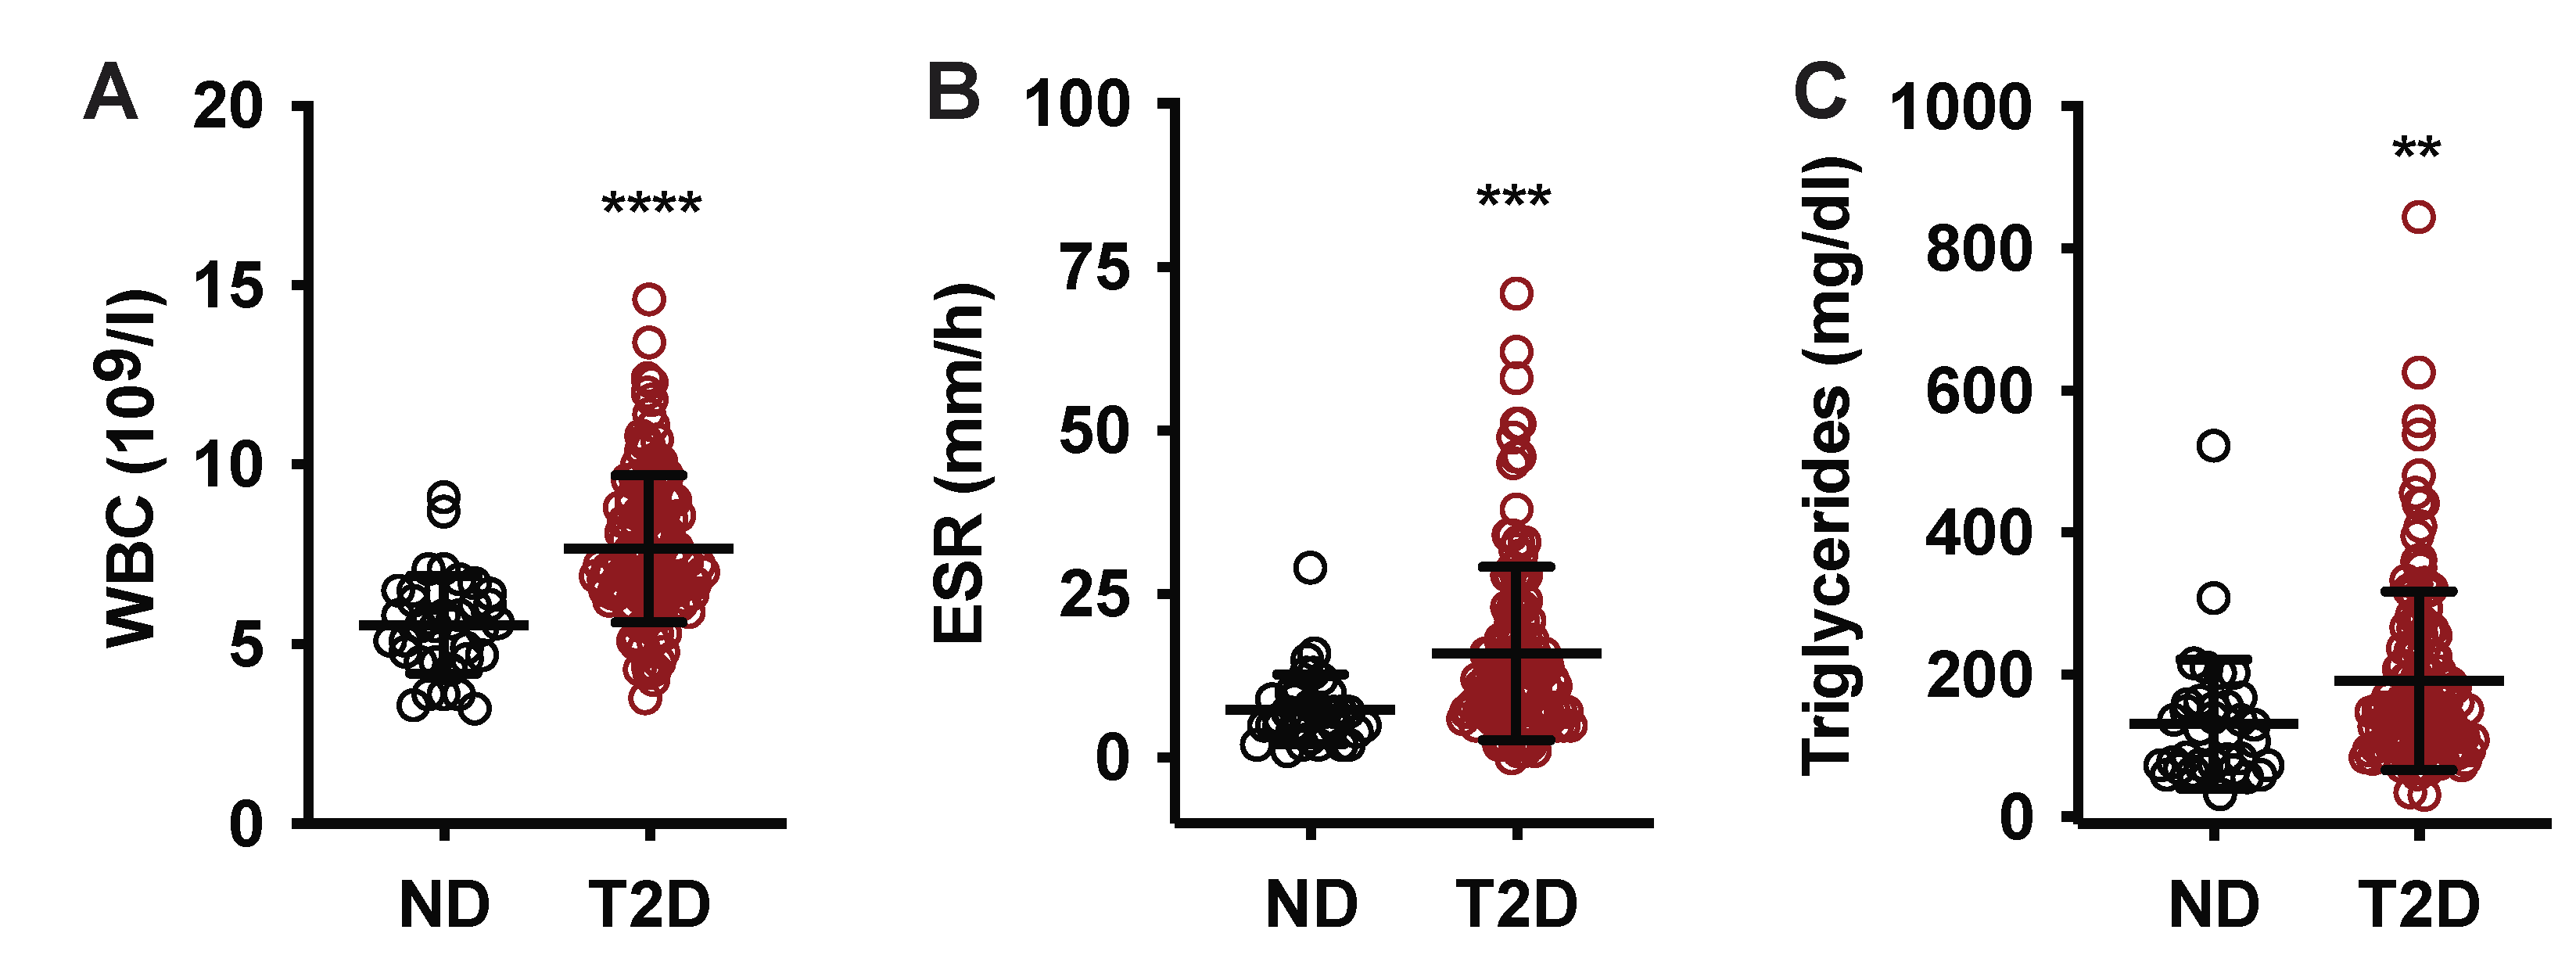
3.2. In T2D Subjects, Plasma PGEM Is Only Weakly Correlated with Systemic Inflammation

WBC and ESR are clinical tests for systemic inflammation that have both been validated as markers of disease risk and progression in pre-diabetic and T2D populations [23,24,25,26,27,28,29,30,31,32,33,34,35]. No T2D subjects (0%) and 8 T2D subjects (6.1%) had elevated WBC (Table 1), and mean WBC was statistically higher in T2D subjects as compared to ND (Table 1 and Figure 2A). One ND subject (2.9%) and 27 T2D subjects (20.5%) had elevated ESR for age and sex (Table 1), and the mean ESR was also significantly higher in T2D subjects (16 mm/h vs. 7.5 mm/h, respectively) (Table 1 and Figure 2B). Elevated triglycerides are known to be associated with inflammation, metabolic syndrome, and T2D status and risk [36,37,38], and triglyceride levels were elevated in T2D subjects as compared to ND (Table 1 and Figure 2C). No subjects had CRP levels over 10, the baseline for moderate inflammation, confirming the absence of acute infection or injury (data not shown).

3.3. Plasma PGEM Is a Strong Predictor of T2D Disease Status

Plasma PGEM levels were, on average, two-fold higher in the T2D group as compared to ND controls (51.6 ± 30.4, ND vs. 101.5 ± 39.1, T2D; p < 0.0001) (Table 1 and Figure 3A). There were no statistically significant correlations between plasma PGEM and BMI, HbA1c, WBC, and triglycerides, and only a weak correlation with ESR (Table 1). The rate-limiting step in PGE2 production is catalyzed by cyclooxygenase (COX) enzymes, and aspirin is a COX-1 inhibitor [39]. We found no difference in mean PGEM levels between those in the T2D group who reported low-dose daily aspirin use (n = 54) and those who did not (n = 71) (Figure 3B). Eicosapentaenoic acid (EPA) is an omega-3 polyunsaturated fatty acid that competes with arachidonic acid for the same site in plasma membrane phospholipids [10]. We found no difference in mean PGEM between those in the T2D group who reported omega-3/fish oil supplement use (n = 37) and those who did not (n = 95) (Figure 3C). A logistic regression analysis including age, sex, BMI, WBC, triglycerides, aspirin use, and PGEM revealed PGEM as the strongest predictor of T2D diagnosis (p < 0.0001) (Figure 3D and Table 2) (ESR was not included in this analysis as it was strongly associated with WBC (p < 0.0001; R2 = 0.12).

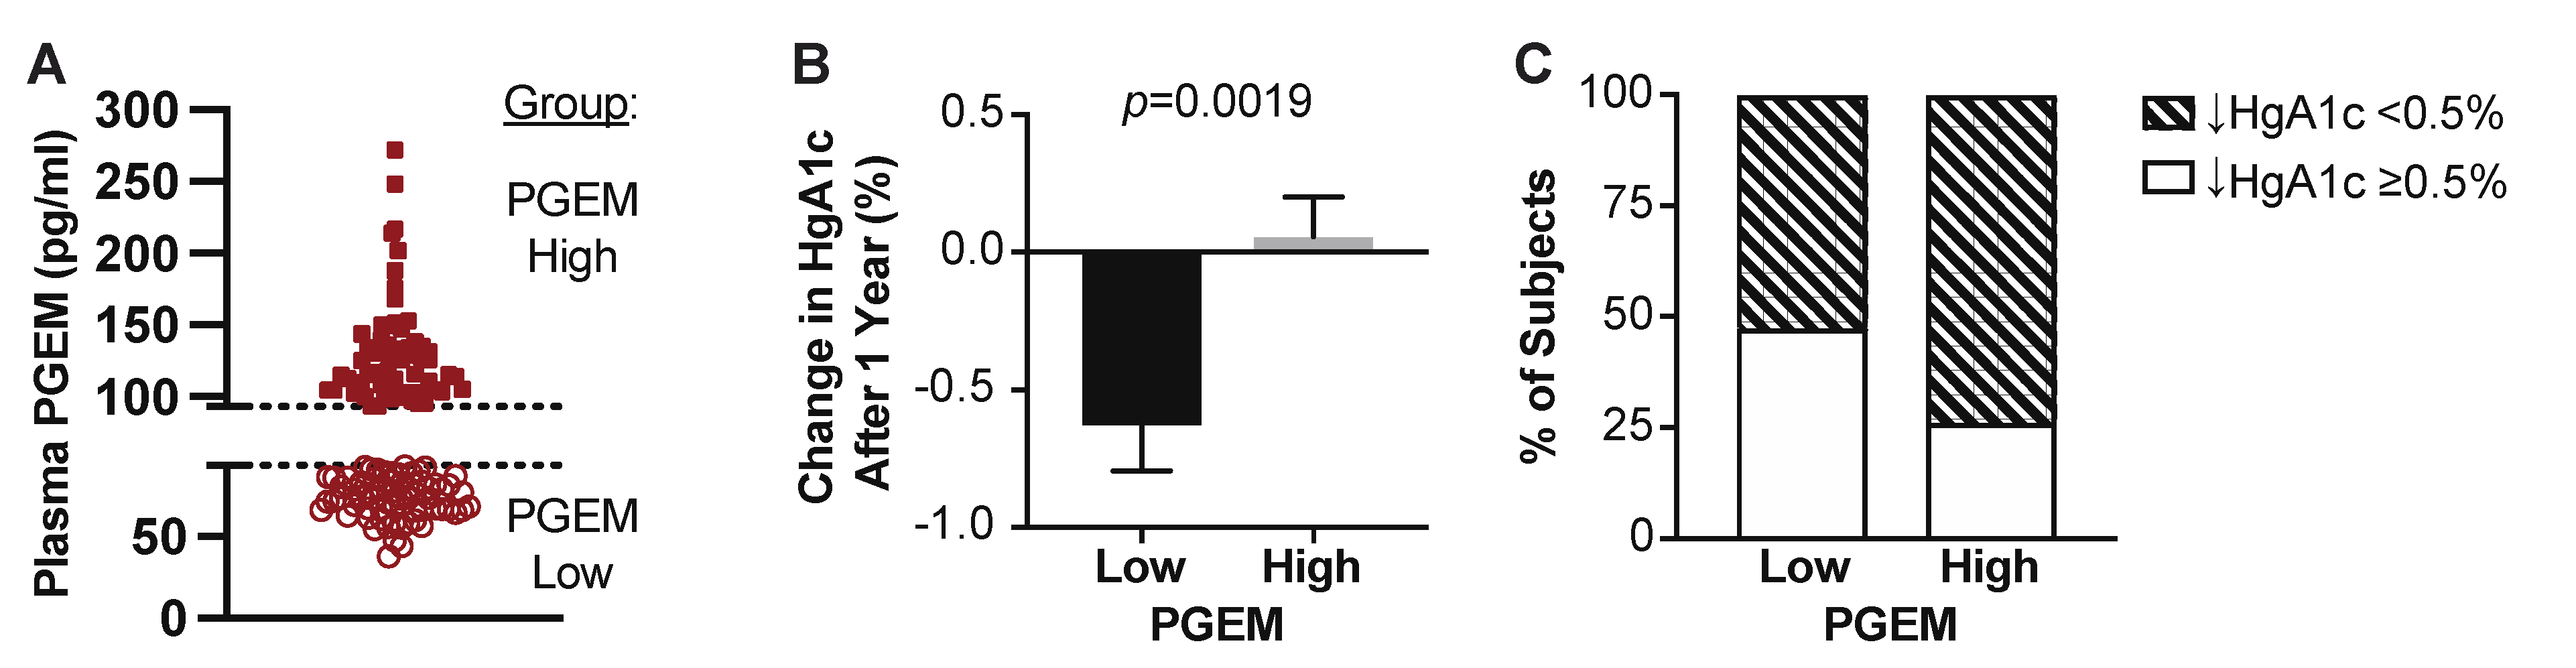
3.4. T2D Patients with High Plasma PGEM Levels Have Significantly Worse Blood Glucose Control One-Year Post-Enrollment

T2D subjects were assessed by chart review one year following the study enrollment, and their percent change in HbA1c was calculated. Seven subjects were lost to follow-up, and three additional subjects whose HbA1c increased more than 4% were excluded due to non-compliance. The final analysis included 45 subjects with a clinically significant reduction in HbA1c (≥0.5%) one-year post-enrollment and 77 without (n = 122).
As there is no clinical threshold for plasma PGEM, the median PGEM level from all 132 T2D patients (92.96 pg/mL) was used to classify T2D subjects in either a “low” or “high” PGEM group for follow-up analyses (Figure 4A). On average, T2D subjects with low plasma PGEM exhibited a 0.6% decrease in HbA1c: a statistically significant difference from those in the high PGEM group, where no change in mean HbA1c was observed (p = 0.0019) (Figure 4B). In total, 47.5% of T2D patients with low plasma PGEM levels achieved a clinically significant reduction in HbA1c (≥0.5%) over 1 year (Figure 4C). Conversely, only 25.8% of T2D patients with high plasma PGEM were able to achieve a clinically significant reduction in HbA1c over 1 year (Figure 4C).

4. Discussion

In this study, we demonstrate that plasma PGEM shows promise as a circulating biomarker to assess the risk of T2D diagnosis and the efficacy of blood glucose management in individuals with T2D. Plasma levels of a stable metabolite of PGE2 were significantly higher in individuals living with T2D when compared to a control group. This finding is consistent with recent work from our group and others using small numbers of biosamples from obese, ND, and T2D subjects [18,20,21,22]. These results with a larger clinical cohort both validate the previous findings, as well as reveal PGEM as a strong predictor of T2D disease status: even more so than validated clinical tests of systemic inflammation. Finally, for the first time, we discovered plasma PGEM was a strong predictor of T2D therapeutic response over the following year. Our findings provide strong evidence for further investigations into the role of PGE2 metabolites in diabetes pathogenesis and treatment response.
The expression and/or activity of COX enzymes, which catalyze the rate-limiting step in PGE2 production, are significantly upregulated by pro-inflammatory cytokines [9,10,11,12,13,14,15,16,17,18,40,41,42,43,44,45]. T2D is a pathophysiological state strongly associated with adipose meta-inflammation and insulin resistance [46,47,48,49], with a number of validated clinical tests of systemic inflammation correlating with T2D disease risk and status [23,24,25,26,27,28,29,30,31,32,33,34,35]. Outside of its canonical role as an inflammatory signaling molecule, though, PGE2 has been shown to play an important role in the β-cell’s function and survival [9,10,15,16,17,21,50,51]. These findings suggest PGE2 signaling may contribute to all three of the primary underlying defects in the progression to and development of T2D—insulin resistance, elevated fasting glucose, and glucose intolerance—and is worthy of future study.
The gut microbiome is well-known to be associated with obesity and T2D [52,53,54]. The composition of the gut microbiome strongly influences circulating metabolites and has also been shown to influence incretin sensitivity in pre-diabetes and T2D [55,56,57]. In previous work using a mouse model of T2D, we found the composition of the gut microbiome was associated with systemic metabolomic changes, including elevated arachidonic acid, that correlated with islet-level PGE2 production and responsiveness to a PGE2 receptor agonist [14]. While outside of the scope of this study, future work studying the relationship between the gut microbiome and plasma PGEM levels with T2D outcomes is warranted.
While obesity is a driver of T2D pathology, and changes in plasma PGEM could indicate glucolipotoxic metabolic and inflammatory dysfunction, we demonstrated no biologically relevant correlations to other biomarkers of obesity, inflammation, or insulin resistance, including BMI, WBC, ESR, and triglyceride levels (Table 1, Figure 1 and Figure 2). Logistic regression analysis of the data set, including age, sex, BMI, WBC, triglycerides, and aspirin use indicated the most significant predictor of T2D status was plasma PGEM, and subjects having plasma PGEM levels greater than 101.5 pg/mL had a 99% probability of a T2D diagnosis (Figure 3D and Table 2).
Currently, recommendations by the American Diabetes Association (ADA) suggest that testing to assess risk for future diabetes in asymptomatic people should be considered in adults of any age who are overweight or obese and have one or more additional risk factors, including physical inactivity, first-degree relative with diabetes, women with gestational diabetes mellitus, hypertension, women with polycystic ovary syndrome, history of cardiovascular disease, and others [58]. However, current diagnostic tests are imperfect and prone to misclassification errors. HbA1c has not been validated for all populations [59] and can be confounded by structural variants in the hemoglobin molecule or alterations in red blood cell turnover. The use of plasma PGEM as an additional measure of T2D status could act as a secondary means of quantifying T2D risk assessment. The inclusion of plasma PGEM in this list of risk factors may capture high-risk individuals who may be otherwise go undiagnosed.
Historically, clinical values including HbA1c, intact proinsulin, adiponectin, and high sensitivity C-reactive protein have been suggested as biomarkers of β-cell failure and insulin resistance, although their overall useability is limited, as both specificity and context need to be considered [60]. Individualized treatments based on the precision understanding of an individual’s disease process have garnered much enthusiasm. Ahlqvist et al., used cluster analysis to define five subgroups of individuals based on their diabetes characteristics and risk for developing diabetic kidney disease using six parameters (BMI, HbA1c, glutamic acid decarboxylase antibodies, and homeostatic model assessment of insulin resistance (HOMA-IR) and insulin secretion (HOMA-B) [61]. The results of this study suggested the need to identify additional biomarkers to improve sensitivity and precision in stratifying individuals with pre-diabetes and T2D. Recently, dihydroceramides have been shown to act as a potential biomarker for T2D [7]. In addition to predicting T2D disease status, PGEM is one of a few putative biomarkers that may also provide functional insight into β-cell health relevant to the present therapeutic landscape. Specifically, the expression of PGE2 synthetic and signaling enzymes is higher in pancreatic islets isolated from T2D mice and human organ donors than in non-diabetic controls [9,10,14,21,41,51,62,63,64], resulting in significantly elevated PGE2 release [9,10]. In the β-cell, PGE2 binds to the Gz-coupled prostaglandin E2 EP3 receptor (EP3) [13,40,65,66,67], which, when activated, limits insulin secretion in response to glucose and glucagon-like peptide 1 receptor (GLP1R) agonists: a mechanism that actively contributes to the β-cell dysfunction of the disease [9,67]. GLP1-RAs are currently in wide use as first- or second-line T2D therapeutics, yet, despite the popularity of these drugs in the clinic, they do not have the same efficacy in all patients. With the known inhibitory effect of PGE2 receptor antagonists on the efficacy of GLP1-RAs in preclinical models, this finding may be of great importance in clinical decision-making. One limitation is that we did not directly measure β-cell function by methods such as quantifying stimulated C-peptide levels; therefore, this possibility remains only theoretical. Another limitation of the current observational study is it was neither adequately powered nor designed to assess the specific impact of PGEM levels on GLP1-RA efficacy. Future work must include trials of drug-naïve patients with T2D randomized to different classes based on plasma PGEM levels to determine if these could be used to help providers choose the drug that will work best for each patient.
We acknowledge several other limitations of this study. The population in the UWHC catchment area is primarily white/non-Hispanic; therefore, our results may not be representative of more diverse populations. This is an important limitation, as recent studies have found the appropriateness of common biomarkers of T2D risks differ, based on an individual’s racial and ethnic background [68]. Second, as this was an observational study with the primary outcome being plasma PGEM, we did not control for time since T2D diagnosis or current T2D therapeutics. The ongoing management of the subjects’ T2D during the 1 year follow-up period was not influenced in any way by this research study and, therefore, was based on “real-world” standard clinical care. Third, diet quantity/composition and physical activity can impact diabetes control, and in the current study, we did not have participants keep diet or exercise logs to quantify this potential confounder. Finally, as plasma PGEM in a T2D clinical cohort has not previously been studied, it will be necessary to identify and validate an appropriate clinical threshold if it is to be used as a biomarker for T2D therapeutic response. These additional considerations are important to note but fall outside the scope of this study.

5. Conclusions

In this clinical cohort study, we find plasma PGEM levels are an excellent predictor of T2D status and one-year therapeutic response, independent of known markers of inflammation, obesity, and T2D disease control. These findings were surprising, as hyperglycemia, dyslipidemia, and pro-inflammatory cytokines have all been shown to upregulate enzymes in the PGE2 production pathway. Our results provide strong support for future research into plasma PGEM as an independent biomarker for T2D status and long-term disease control.

Author Contributions

Conceptualization, D.B.D. and M.E.K.; data curation, R.J.F., A.M.W., M.D., R.N., S.P., M.P. and M.E.K.; formal analysis, R.J.F., D.B.D. and M.E.K.; funding acquisition, R.J.F., A.M.W., S.P., E.D.C., D.B.D. and M.E.K.; investigation, R.J.F., A.M.W., M.D., R.N., S.P., A.L.B., D.C.P., M.P. and M.E.K.; methodology, R.J.F., D.B.D. and M.E.K.; project administration, D.B.D. and M.E.K.; supervision, D.B.D. and M.E.K.; visualization, R.J.F. and M.E.K.; writing—original draft, R.J.F.; writing—review and editing, R.J.F., E.D.C., D.B.D. and M.E.K. All authors have read and agreed to the published version of the manuscript.

Funding

This work was funded in part by Merit Review Awards I01 BX003700 (to M.E.K.), I01 BX001880 (to DBD), and I01 BX004715 (to DBD) from the United States (U.S.) Department of Veterans Affairs Biomedical Laboratory Research and Development (BLR&D) Service; a UW2020 WARF Discovery Initiative grant from the UW-Madison Office of the Vice Chancellor for Research and Graduate Education and the Wisconsin Alumni Research Foundation (to E.D.C., D.B.D., and M.E.K), National Institutes of Health Grants R01 DK102598 (to MEK), R01 DK110324 (to DBD), and F31 DK109698 (to RJF); UW Institute for Clinical and Translational Research grant ICTR-UWHC-20120919 (to MEK), and a Research Starter Grant in Translational Medicine and Therapeutics from the PhRMA Foundation (to MEK). Alicia Weeks was supported by a VA Advanced Fellowship in Women’s Health. Samantha Pabich was supported by a Pearl Stetler Research Fund for Women Physicians Fellowship. Allison Brill was supported in part by an American Society for Pharmacology and Experimental Therapeutics Zannoni Summer Undergraduate Research Fellowship. The content is solely the responsibility of the authors and does not necessarily represent the official views of the National Institutes of Health, the U.S. Department of Veterans Affairs, or the United States Government.

Institutional Review Board Statement

All human subject research was conducted in accordance with the standards set out by the World Medical Association (WMA) Declaration of Helsinki “Ethical Principles for Medical Research Involving Human Subjects” as approved by the University of Wisconsin (UW) Health Sciences Institutional Review Board (IRB) protocol number UW 2013-1082.

Informed Consent Statement

Informed consent was obtained from all subjects involved in the study.

Data Availability Statement

Not applicable.

Acknowledgments

We would like to thank Stephanie Blaha for her assistance with patient recruitment and sample collection. We would also like to thank Peter Crump for his statistical expertise and assistance with logistic regression.

Conflicts of Interest

The authors declare no conflict of interest. The study sponsors had no role in the study design; collection, analysis, or interpretation of data; the writing of the report; or the decision to submit the paper for publication.

References

  1. Center for Diseease Control and Prevention, National Diabetes Statistics Report Website. Available online: https://www.cdc.gov/diabetes/data/statistics-report/index.html (accessed on 1 October 2022).
  2. Juarez, D.T.; Ma, C.; Kumasaka, A.; Shimada, R.; Davis, J. Failure to reach target glycated a1c levels among patients with diabetes who are adherent to their antidiabetic medication. Popul. Health Manag. 2014, 17, 218–223. [Google Scholar] [CrossRef] [PubMed]
  3. Bacos, K.; Gillberg, L.; Volkov, P.; Olsson, A.H.; Hansen, T.; Pedersen, O.; Gjesing, A.P.; Eiberg, H.; Tuomi, T.; Almgren, P.; et al. Blood-based biomarkers of age-associated epigenetic changes in human islets associate with insulin secretion and diabetes. Nat. Commun. 2016, 7, 11089. [Google Scholar] [CrossRef] [PubMed] [Green Version]
  4. Mirmira, R.G.; Sims, E.K.; Syed, F.; Evans-Molina, C. Biomarkers of beta-Cell Stress and Death in Type 1 Diabetes. Curr. Diabetes Rep. 2016, 16, 95. [Google Scholar] [CrossRef] [PubMed] [Green Version]
  5. Scheen, A.J. Precision medicine: The future in diabetes care? Diabetes Res. Clin. Pract. 2016, 117, 12–21. [Google Scholar] [CrossRef] [PubMed]
  6. Sims, E.K.; Evans-Molina, C.; Tersey, S.A.; Eizirik, D.L.; Mirmira, R.G. Biomarkers of islet beta cell stress and death in type 1 diabetes. Diabetologia 2018, 61, 2259–2265. [Google Scholar] [CrossRef] [Green Version]
  7. Thorens, B.; Rodriguez, A.; Cruciani-Guglielmacci, C.; Wigger, L.; Ibberson, M.; Magnan, C. Use of preclinical models to identify markers of type 2 diabetes susceptibility and novel regulators of insulin secretion—A step towards precision medicine. Mol. Metab. 2019, 27, S147–S154. [Google Scholar] [CrossRef]
  8. Wang, C.; Pan, Y.J.; Song, J.; Sun, Y.; Li, H.K.; Chen, L.; Hou, X.G. Serum Metrnl Level is Correlated with Insulin Resistance, But Not with beta-Cell Function in Type 2 Diabetics. Med. Sci. Monit. 2019, 25, 8968–8974. [Google Scholar] [CrossRef]
  9. Kimple, M.E.; Keller, M.P.; Rabaglia, M.R.; Pasker, R.L.; Neuman, J.C.; Truchan, N.A.; Brar, H.K.; Attie, A.D. Prostaglandin E2 receptor, EP3, is induced in diabetic islets and negatively regulates glucose- and hormone-stimulated insulin secretion. Diabetes 2013, 62, 1904–1912. [Google Scholar] [CrossRef] [Green Version]
  10. Neuman, J.C.; Schaid, M.D.; Brill, A.L.; Fenske, R.J.; Kibbe, C.R.; Fontaine, D.A.; Sdao, S.M.; Brar, H.K.; Connors, K.M.; Wienkes, H.N.; et al. Enriching Islet Phospholipids With Eicosapentaenoic Acid Reduces Prostaglandin E2 Signaling and Enhances Diabetic beta-Cell Function. Diabetes 2017, 66, 1572–1585. [Google Scholar] [CrossRef] [Green Version]
  11. Parazzoli, S.; Harmon, J.S.; Vallerie, S.N.; Zhang, T.; Zhou, H.; Robertson, R.P. Cyclooxygenase-2, not microsomal prostaglandin E synthase-1, is the mechanism for interleukin-1beta-induced prostaglandin E2 production and inhibition of insulin secretion in pancreatic islets. J. Biol. Chem. 2012, 287, 32246–32253. [Google Scholar] [CrossRef]
  12. Robertson, R.P. Dominance of cyclooxygenase-2 in the regulation of pancreatic islet prostaglandin synthesis. Diabetes 1998, 47, 1379–1383. [Google Scholar] [CrossRef]
  13. Sandhu, H.K.; Neuman, J.C.; Schaid, M.D.; Davis, S.E.; Connors, K.M.; Challa, R.; Guthery, E.; Fenske, R.J.; Patibandla, C.; Breyer, R.M.; et al. Rat prostaglandin EP3 receptor is highly promiscuous and is the sole prostanoid receptor family member that regulates INS-1 (832/3) cell glucose-stimulated insulin secretion. Pharm. Res. Perspect. 2021, 9, e00736. [Google Scholar] [CrossRef]
  14. Schaid, M.D.; Zhu, Y.; Richardson, N.E.; Patibandla, C.; Ong, I.M.; Fenske, R.J.; Neuman, J.C.; Guthery, E.; Reuter, A.; Sandhu, H.K.; et al. Systemic Metabolic Alterations Correlate with Islet-Level Prostaglandin E2 Production and Signaling Mechanisms That Predict beta-Cell Dysfunction in a Mouse Model of Type 2 Diabetes. Metabolites 2021, 11, 58. [Google Scholar] [CrossRef]
  15. Sjoholm, A. Prostaglandins inhibit pancreatic beta-cell replication and long-term insulin secretion by pertussis toxin-insensitive mechanisms but do not mediate the actions of interleukin-1 beta. Biochim. Biophys. Acta 1996, 1313, 106–110. [Google Scholar] [CrossRef] [Green Version]
  16. Tran, P.O.; Gleason, C.E.; Poitout, V.; Robertson, R.P. Prostaglandin E(2) mediates inhibition of insulin secretion by interleukin-1beta. J. Biol. Chem. 1999, 274, 31245–31248. [Google Scholar] [CrossRef] [Green Version]
  17. Tran, P.O.; Gleason, C.E.; Robertson, R.P. Inhibition of interleukin-1beta-induced COX-2 and EP3 gene expression by sodium salicylate enhances pancreatic islet beta-cell function. Diabetes 2002, 51, 1772–1778. [Google Scholar] [CrossRef] [Green Version]
  18. Pawelzik, S.C.; Avignon, A.; Idborg, H.; Boegner, C.; Stanke-Labesque, F.; Jakobsson, P.J.; Sultan, A.; Back, M. Urinary prostaglandin D2 and E2 metabolites associate with abdominal obesity, glucose metabolism, and triglycerides in obese subjects. Prostaglandins Other Lipid Mediat. 2019, 145, 106361. [Google Scholar] [CrossRef]
  19. Poreba, M.; Rostoff, P.; Siniarski, A.; Mostowik, M.; Golebiowska-Wiatrak, R.; Nessler, J.; Undas, A.; Gajos, G. Relationship between polyunsaturated fatty acid composition in serum phospholipids, systemic low-grade inflammation, and glycemic control in patients with type 2 diabetes and atherosclerotic cardiovascular disease. Cardiovasc. Diabetol. 2018, 17, 29. [Google Scholar] [CrossRef] [Green Version]
  20. Tans, R.; Bande, R.; van Rooij, A.; Molloy, B.J.; Stienstra, R.; Tack, C.J.; Wevers, R.A.; Wessels, H.; Gloerich, J.; van Gool, A.J. Evaluation of cyclooxygenase oxylipins as potential biomarker for obesity-associated adipose tissue inflammation and type 2 diabetes using targeted multiple reaction monitoring mass spectrometry. Prostaglandins Leukot. Essent. Fat. Acids 2020, 160, 102157. [Google Scholar] [CrossRef]
  21. Truchan, N.A.; Fenske, R.J.; Sandhu, H.K.; Weeks, A.M.; Patibandla, C.; Wancewicz, B.; Pabich, S.; Reuter, A.; Harrington, J.M.; Brill, A.L.; et al. Human Islet Expression Levels of Prostaglandin E2 Synthetic Enzymes, But Not Prostaglandin EP3 Receptor, Are Positively Correlated with Markers of beta-Cell Function and Mass in Nondiabetic Obesity. ACS Pharmacol. Transl. Sci. 2021, 4, 1338–1348. [Google Scholar] [CrossRef]
  22. Xia, F.; He, C.; Ren, M.; Xu, F.G.; Wan, J.B. Quantitative profiling of eicosanoids derived from n-6 and n-3 polyunsaturated fatty acids by twin derivatization strategy combined with LC-MS/MS in patients with type 2 diabetes mellitus. Anal. Chim. Acta 2020, 1120, 24–35. [Google Scholar] [CrossRef] [PubMed]
  23. Vozarova, B.; Weyer, C.; Lindsay, R.S.; Pratley, R.E.; Bogardus, C.; Tataranni, P.A. High white blood cell count is associated with a worsening of insulin sensitivity and predicts the development of type 2 diabetes. Diabetes 2002, 51, 455–461. [Google Scholar] [CrossRef] [PubMed] [Green Version]
  24. Marz, W.; Scharnagl, H.; Winkler, K.; Tiran, A.; Nauck, M.; Boehm, B.O.; Winkelmann, B.R. Low-density lipoprotein triglycerides associated with low-grade systemic inflammation, adhesion molecules, and angiographic coronary artery disease: The Ludwigshafen Risk and Cardiovascular Health study. Circulation 2004, 110, 3068–3074. [Google Scholar] [CrossRef] [PubMed] [Green Version]
  25. Tong, P.C.; Lee, K.F.; So, W.Y.; Ng, M.H.; Chan, W.B.; Lo, M.K.; Chan, N.N.; Chan, J.C. White blood cell count is associated with macro- and microvascular complications in chinese patients with type 2 diabetes. Diabetes Care 2004, 27, 216–222. [Google Scholar] [CrossRef] [PubMed] [Green Version]
  26. Syrenicz, A.; Garanty-Bogacka, B.; Syrenicz, M.; Gebala, A.; Walczak, M. Low-grade systemic inflammation and the risk of type 2 diabetes in obese children and adolescents. Neuro Endocrinol. Lett. 2006, 27, 453–458. [Google Scholar]
  27. Gkrania-Klotsas, E.; Ye, Z.; Cooper, A.J.; Sharp, S.J.; Luben, R.; Biggs, M.L.; Chen, L.K.; Gokulakrishnan, K.; Hanefeld, M.; Ingelsson, E.; et al. Differential white blood cell count and type 2 diabetes: Systematic review and meta-analysis of cross-sectional and prospective studies. PLoS ONE 2010, 5, e13405. [Google Scholar] [CrossRef] [Green Version]
  28. Placzkowska, S.; Pawlik-Sobecka, L.; Kokot, I.; Sowinski, D.; Wrzosek, M.; Piwowar, A. Associations between basic indicators of inflammation and metabolic disturbances. Postep. Hig. Med. Dosw. 2014, 68, 1374–1382. [Google Scholar] [CrossRef]
  29. Shiny, A.; Bibin, Y.S.; Shanthirani, C.S.; Regin, B.S.; Anjana, R.M.; Balasubramanyam, M.; Jebarani, S.; Mohan, V. Association of neutrophil-lymphocyte ratio with glucose intolerance: An indicator of systemic inflammation in patients with type 2 diabetes. Diabetes Technol. 2014, 16, 524–530. [Google Scholar] [CrossRef]
  30. Fiorentino, T.V.; Hribal, M.L.; Perticone, M.; Andreozzi, F.; Sciacqua, A.; Perticone, F.; Sesti, G. Unfavorable inflammatory profile in adults at risk of type 2 diabetes identified by hemoglobin A1c levels according to the American Diabetes Association criteria. Acta Diabetol. 2015, 52, 349–356. [Google Scholar] [CrossRef]
  31. Sung, K.C.; Ryu, S.; Sung, J.W.; Kim, Y.B.; Won, Y.S.; Cho, D.S.; Kim, S.H.; Liu, A. Inflammation in the Prediction of Type 2 Diabetes and Hypertension in Healthy Adults. Arch. Med. Res. 2017, 48, 535–545. [Google Scholar] [CrossRef]
  32. Das, A.K.; Kalra, S.; Tiwaskar, M.; Bajaj, S.; Seshadri, K.; Chowdhury, S.; Sahay, R.; Indurkar, S.; Unnikrishnan, A.G.; Phadke, U.; et al. Expert Group Consensus Opinion: Role of Anti-inflammatory Agents in the Management of Type-2 Diabetes (T2D). J. Assoc. Physicians India 2019, 67, 65–74. [Google Scholar]
  33. Mahdiani, A.; Kheirandish, M.; Bonakdaran, S. Correlation Between White Blood Cell Count and Insulin Resistance in Type 2 Diabetes. Curr. Diabetes Rev. 2019, 15, 62–66. [Google Scholar] [CrossRef]
  34. Shin, G.; Jang, K.; Kim, M.; Lee, J.H.; Yoo, H.J. Inflammatory Markers and Plasma Fatty Acids in Predicting WBC Level Alterations in Association With Glucose-Related Markers: A Cross-Sectional Study. Front. Immunol. 2020, 11, 629. [Google Scholar] [CrossRef] [Green Version]
  35. Wan, Z.; Song, L.; Hu, L.; Lei, X.; Huang, Y.; Lv, Y.; Yu, S. The role of systemic inflammation in the association between serum 25-hydroxyvitamin D and type 2 diabetes mellitus. Clin. Nutr. 2021, 40, 3661–3667. [Google Scholar] [CrossRef]
  36. Gordillo-Moscoso, A.; Ruiz, E.; Carnero, M.; Reguillo, F.; Rodriguez, E.; Tejerina, T.; Redondo, S. Relationship between serum levels of triglycerides and vascular inflammation, measured as COX-2, in arteries from diabetic patients: A translational study. Lipids Health Dis. 2013, 12, 62. [Google Scholar] [CrossRef] [Green Version]
  37. Lin, H.Y.; Zhang, X.J.; Liu, Y.M.; Geng, L.Y.; Guan, L.Y.; Li, X.H. Comparison of the triglyceride glucose index and blood leukocyte indices as predictors of metabolic syndrome in healthy Chinese population. Sci. Rep. 2021, 11, 10036. [Google Scholar] [CrossRef]
  38. Welty, F.K. How do elevated triglycerides and low HDL-cholesterol affect inflammation and atherothrombosis? Curr. Cardiol. Rep. 2013, 15, 400. [Google Scholar] [CrossRef] [Green Version]
  39. Vane, J.R.; Botting, R.M. The mechanism of action of aspirin. Thromb. Res. 2003, 110, 255–258. [Google Scholar] [CrossRef]
  40. Brill, A.L.; Wisinski, J.A.; Cadena, M.T.; Thompson, M.F.; Fenske, R.J.; Brar, H.K.; Schaid, M.D.; Pasker, R.L.; Kimple, M.E. Synergy Between Galphaz Deficiency and GLP-1 Analog Treatment in Preserving Functional beta-Cell Mass in Experimental Diabetes. Mol. Endocrinol. 2016, 30, 543–556. [Google Scholar] [CrossRef] [Green Version]
  41. Carboneau, B.A.; Allan, J.A.; Townsend, S.E.; Kimple, M.E.; Breyer, R.M.; Gannon, M. Opposing effects of prostaglandin E2 receptors EP3 and EP4 on mouse and human beta-cell survival and proliferation. Mol. Metab. 2017, 6, 548–559. [Google Scholar] [CrossRef]
  42. Fenske, R.J.; Cadena, M.T.; Harenda, Q.E.; Wienkes, H.N.; Carbajal, K.; Schaid, M.D.; Laundre, E.; Brill, A.L.; Truchan, N.A.; Brar, H.; et al. The Inhibitory G Protein alpha-Subunit, Galphaz, Promotes Type 1 Diabetes-Like Pathophysiology in NOD Mice. Endocrinology 2017, 158, 1645–1658. [Google Scholar] [CrossRef] [PubMed] [Green Version]
  43. Neuman, J.C.; Kimple, M.E. The EP3 Receptor: Exploring a New Target for Type 2 Diabetes Therapeutics. J. Endocrinol. Diabetes Obes. 2013, 1, 1002. [Google Scholar] [PubMed]
  44. Robertson, R.P. The COX-2/PGE2/EP3/Gi/o/cAMP/GSIS Pathway in the Islet: The Beat Goes On. Diabetes 2017, 66, 1464–1466. [Google Scholar] [CrossRef] [PubMed] [Green Version]
  45. Schaid, M.D.; Wisinski, J.A.; Kimple, M.E. The EP3 Receptor/Gz Signaling Axis as a Therapeutic Target for Diabetes and Cardiovascular Disease. AAPS J. 2017, 19, 1276–1283. [Google Scholar] [CrossRef] [PubMed]
  46. Chakarov, S.; Bleriot, C.; Ginhoux, F. Role of adipose tissue macrophages in obesity-related disorders. J. Exp. Med. 2022, 219, e20211948. [Google Scholar] [CrossRef]
  47. Eslick, S.; Williams, E.J.; Berthon, B.S.; Wright, T.; Karihaloo, C.; Gately, M.; Wood, L.G. Weight Loss and Short-Chain Fatty Acids Reduce Systemic Inflammation in Monocytes and Adipose Tissue Macrophages from Obese Subjects. Nutrients 2022, 14, 765. [Google Scholar] [CrossRef]
  48. Johnson, A.R.; Milner, J.J.; Makowski, L. The inflammation highway: Metabolism accelerates inflammatory traffic in obesity. Immunol. Rev. 2012, 249, 218–238. [Google Scholar] [CrossRef] [Green Version]
  49. Singh, A.; Kukreti, R.; Saso, L.; Kukreti, S. Mechanistic Insight into Oxidative Stress-Triggered Signaling Pathways and Type 2 Diabetes. Molecules 2022, 27, 950. [Google Scholar] [CrossRef]
  50. Bosma, K.J.; Andrei, S.R.; Katz, L.S.; Smith, A.A.; Dunn, J.C.; Ricciardi, V.F.; Ramirez, M.A.; Baumel-Alterzon, S.; Pace, W.A.; Carroll, D.T.; et al. Pharmacological blockade of the EP3 prostaglandin E2 receptor in the setting of type 2 diabetes enhances beta-cell proliferation and identity and relieves oxidative damage. Mol. Metab. 2021, 54, 101347. [Google Scholar] [CrossRef]
  51. Bosma, K.J.; Kaiser, C.E.; Kimple, M.E.; Gannon, M. Effects of Arachidonic Acid and Its Metabolites on Functional Beta-Cell Mass. Metabolites 2022, 12, 342. [Google Scholar] [CrossRef]
  52. Harsch, I.A.; Konturek, P.C. The Role of Gut Microbiota in Obesity and Type 2 and Type 1 Diabetes Mellitus: New Insights into “Old” Diseases. Med. Sci. 2018, 6, 32. [Google Scholar] [CrossRef] [Green Version]
  53. Nieuwdorp, M.; Gilijamse, P.W.; Pai, N.; Kaplan, L.M. Role of the microbiome in energy regulation and metabolism. Gastroenterology 2014, 146, 1525–1533. [Google Scholar] [CrossRef]
  54. Sikalidis, A.K.; Maykish, A. The Gut Microbiome and Type 2 Diabetes Mellitus: Discussing a Complex Relationship. Biomedicines 2020, 8, 8. [Google Scholar] [CrossRef] [Green Version]
  55. Baggio, L.L.; Drucker, D.J. Biology of incretins: GLP-1 and GIP. Gastroenterology 2007, 132, 2131–2157. [Google Scholar] [CrossRef]
  56. Yamane, S.; Inagaki, N. Regulation of glucagon-like peptide-1 sensitivity by gut microbiota dysbiosis. J. Diabetes Investig. 2018, 9, 262–264. [Google Scholar] [CrossRef]
  57. Martin, A.M.; Sun, E.W.; Rogers, G.B.; Keating, D.J. The Influence of the Gut Microbiome on Host Metabolism Through the Regulation of Gut Hormone Release. Front. Physiol. 2019, 10, 428. [Google Scholar] [CrossRef] [Green Version]
  58. Amer Diabet, A. 2. Classification and Diagnosis of Diabetes. Diabetes Care 2016, 39, S13–S22. [Google Scholar] [CrossRef] [Green Version]
  59. Owora, A.H. Diagnostic Validity and Clinical Utility of HbA1c Tests for Type 2 Diabetes Mellitus. Curr. Diabetes Rev. 2018, 14, 196–199. [Google Scholar] [CrossRef] [Green Version]
  60. Pfuetzner, A.; Weber, M.M.; Forst, T. A biomarker concept for assessment of insulin resistance, beta-cell function and chronic systemic inflammation in type 2 diabetes mellitus. Clin. Lab. 2008, 54, 485–490. [Google Scholar]
  61. Ahlqvist, E.; Storm, P.; Käräjämäki, A.; Martinell, M.; Dorkhan, M.; Carlsson, A.; Vikman, P.; Prasad, R.B.; Aly, D.M.; Almgren, P.; et al. Novel subgroups of adult-onset diabetes and their association with outcomes: A data-driven cluster analysis of six variables. Lancet Diabetes Endocrinol. 2018, 6, 361–369. [Google Scholar] [CrossRef] [Green Version]
  62. Zhu, Y.; Wancewicz, B.; Schaid, M.; Tiambeng, T.N.; Wenger, K.; Jin, Y.; Heyman, H.; Thompson, C.J.; Barsch, A.; Cox, E.D.; et al. Ultrahigh-Resolution Mass Spectrometry-Based Platform for Plasma Metabolomics Applied to Type 2 Diabetes Research. J. Proteome Res. 2021, 20, 463–473. [Google Scholar] [CrossRef] [PubMed]
  63. Kimple, M.E.; Neuman, J.C.; Linnemann, A.K.; Casey, P.J. Inhibitory G proteins and their receptors: Emerging therapeutic targets for obesity and diabetes. Exp. Mol. Med. 2014, 46, e102. [Google Scholar] [CrossRef] [PubMed] [Green Version]
  64. Neuman, J.C.; Fenske, R.J.; Kimple, M.E. Dietary polyunsaturated fatty acids and their metabolites: Implications for diabetes pathophysiology, prevention, and treatment. Nutr. Healthy Aging 2017, 4, 127–140. [Google Scholar] [CrossRef] [PubMed]
  65. Kimple, M.E.; Nixon, A.B.; Kelly, P.; Bailey, C.L.; Young, K.H.; Fields, T.A.; Casey, P.J. A role for G(z) in pancreatic islet beta-cell biology. J. Biol. Chem. 2005, 280, 31708–31713. [Google Scholar] [CrossRef] [Green Version]
  66. Kimple, M.E.; Moss, J.B.; Brar, H.K.; Rosa, T.C.; Truchan, N.A.; Pasker, R.L.; Newgard, C.B.; Casey, P.J. Deletion of GalphaZ protein protects against diet-induced glucose intolerance via expansion of beta-cell mass. J. Biol. Chem. 2012, 287, 20344–20355. [Google Scholar] [CrossRef] [Green Version]
  67. Schaid, M.D.; Green, C.L.; Peter, D.C.; Gallagher, S.J.; Guthery, E.; Carbajal, K.A.; Harrington, J.M.; Kelly, G.M.; Reuter, A.; Wehner, M.L.; et al. Agonist-independent Galphaz activity negatively regulates beta-cell compensation in a diet-induced obesity model of type 2 diabetes. J. Biol. Chem. 2021, 296, 100056. [Google Scholar] [CrossRef]
  68. Kaul, N.; Ali, S. Genes, Genetics, and Environment in Type 2 Diabetes: Implication in Personalized Medicine. DNA Cell Biol. 2016, 35, 1–12. [Google Scholar] [CrossRef]
Figure 1. Baseline BMI, age, and HbA1c of ND and T2D subjects at enrollment. (A) Body mass index (BMI); (B) age in years; (C) glycated hemoglobin (HbA1c) for non-diabetic group (black circle) and T2D group (red circle). Data are presented as mean ± standard deviation. *, p < 0.05; ****, p < 0.0001. Black.
Metabolites 12 01234 g001
Figure 2. Relationship between T2D diagnosis and markers of inflammation. (A) White blood cell count (WBC); (B) erythrocyte sedimentation rate (ESR); (C) plasma triglycerides for non-diabetic group (black circle) and T2D group (red circle). Data are presented as mean ± standard deviation. **, p < 0.01; ***, p < 0.001; ****, p < 0.0001.
Metabolites 12 01234 g002
Figure 3. Plasma PGEM is elevated in T2D subjects and is a strong predictor of T2D diagnosis. (A) Plasma PGEM levels of ND and T2D subjects at enrollment; (B) plasma PGEM levels of T2D subjects based on daily prophylactic aspirin use; (C) plasma PGEM levels at enrollment of T2D subjects based on daily omega-3/fish oil supplement use. In (AC), data are presented as mean ± standard deviation. ****, p < 0.0001. (D) Predictive probability of plasma PGEM of T2D diagnosis generated by the SAS Probit process.
Metabolites 12 01234 g003
Figure 4. Subjects with high plasma PGEM have worse T2D therapeutic control one-year after enrollment. (A) Plasma PGEM levels of T2D subjects at enrollment below and above the median of 92.96 pg/mL; (B) percent change in HbA1c for the subjects shown in (A). (C) Percent of subjects in “low” and “high” PGEM groups with or without a clinically meaningful reduction in HbA1c of ≥ 0.5% (white and hatched bars, respectively).
Metabolites 12 01234 g004
Table 1. Demographic and clinical parameters of the patient cohort. Unless otherwise indicated, data are presented as mean ± standard deviation. BMI, body mass index; HbA1c, glycated hemoglobin; WBC, white blood cell count; ESR, erythrocyte sedimentation rate; PGEM, PGE2 metabolite.
GroupsND vs. T2DLinear Regression vs. PGEM (T2D Only)
Baseline Demographics
AllNon-DiabeticT2Dp-Valuep-ValueR2
Subjects (n)16735132---
Male (n; %)85; 51%13; 37%72; 55%---
Female (n; %)82; 49%22; 63%60; 45%---
Race/Ethnicity = White/Non-Hispanic (n; %)153; 92%32; 91%121; 92%---
Age (years ± SD; range)54.1 ± 10.5; 29–7347.8 ± 11.5; 29–7055.8 ± 9.6; 29–73<0.00010.840.0003
Baseline Biometric and Laboratory Parameters
BMI (kg/m2 ± SD; range)35.2 ± 8.3; 19.5–61.929.9 ± 6.5; 19.5–50.536.8 ± 7.7; 21.8–61.9<0.00010.790.0005
HbA1c (% ± SD; range)7.6 ± 1.65.4 ± 0.28.2 ± 1.2<0.00010.790.0006
WBC (109/L ± SD)7.2 ± 2.15.5 ± 1.47.7 ± 2.0<0.00010.250.01
ESR, mm/h (mm/h ± SD)14.2 ± 12.57.5 ± 5.416.0 ± 13.20.00030.0350.034
Triglycerides (mg/dL ± SD)179.6 ± 121.3131.2 ± 90.8191.1 ± 125.50.0090.790.007
Plasma PGEM, (pg/mL ± SD)91.0 ± 42.551.6 ± 30.4101.5 ± 39.1<0.0001--
Table 2. Logistic regression analysis of PGEM and other baseline parameters reveals plasma PGEM as the strongest predictor of T2D diagnosis. The SAS Probit procedure was used.
Analysis of Maximum Likelihood Parameter Estimates
ParameterDFEstimateStd. Error95% CIChiSqPr > ChiSq
Intercept1−15.87993.3533−22.4522 to −9.307622.43<0.0001
PGEM10.05930.0141−0.0317 to 0.086917.70<0.0001
Age10.10010.03750.0265 to 0.17377.710.0076
BMI10.07650.0449−0.0166 to 0.17462.900.0886
WBC10.72250.23410.2635 to 1.18149.520.0020
Triglycerides10.00640.0042−0.0019 to 0.01472.250.1332
Sex1−0.91990.6979−2.2878 to 0.44801.740.1875
Aspirin use1−23.689180, 132.4−353,077 to 353,0230.000.9999
Publisher’s Note: MDPI stays neutral with regard to jurisdictional claims in published maps and institutional affiliations.

