Article

Differential Accumulation of Metabolites and Transcripts Related to Flavonoid, Styrylpyrone, and Galactolipid Biosynthesis in Equisetum Species and Tissue Types

Institute of Biological Chemistry and M.J. Murdock Metabolomics Laboratory, Washington State University, Pullman, WA 99164-7411, USA
*
Author to whom correspondence should be addressed.
Current Address: Department of Food Technology, University North, University Center Koprivnica, Trg dr. Žarka Dolinara 1, 48000 Koprivnica, Croatia.
Metabolites 2022, 12(5), 403; https://doi.org/10.3390/metabo12050403
Submission received: 7 April 2022 / Revised: 25 April 2022 / Accepted: 27 April 2022 / Published: 29 April 2022

Abstract

:
Three species of the genus Equisetum (E. arvense, E. hyemale, and E. telmateia) were selected for an analysis of chemical diversity in an ancient land plant lineage. Principal component analysis of metabolomics data obtained with above-ground shoot and below-ground rhizome extracts enabled a separation of all sample types, indicating species- and organ-specific patterns of metabolite accumulation. Follow-up efforts indicated that galactolipids, carotenoids, and flavonoid glycosides contributed positively to the separation of shoot samples, while stryrylpyrone glycosides and phenolic glycosides were the most prominent positive contributors to the separation of rhizome samples. Consistent with metabolite data, genes coding for enzymes of flavonoid and galactolipid biosynthesis were found to be expressed at elevated levels in shoot samples, whereas a putative styrylpyrone synthase gene was expressed preferentially in rhizomes. The current study builds a foundation for future endeavors to further interrogate the organ and tissue specificity of metabolism in the last living genus of a fern family that was prevalent in the forests of the late Paleozoic era.

1. Introduction

Members of the genus Equisetum are often referred to as “living fossils”, partly because they are the only extant representatives of the Equisetidae, a subclass that was once prominent—in terms of abundance, diversity (three orders comprising more than 15 genera), and size (up to 30 m tall)—in late Paleozoic forests [1]. Extant horsetails are generally divided into three lineages, the subgenera Equisetum (seven species), Hippochaete (seven species), and Paramochaete (one species) [2]. Horsetails are characterized by the presence of below-ground rhizomes and above-ground photosynthetic, segmented shoots. Vegetative shoots carry whorls of small leaves (microphylls) that emerge from each junction between segments (node), while unbranched fertile shoots bear a strobilus (spore-containing cone) at their tips (Figure 1A) [3]. Shoots of horsetails are coated with abrasive silicates and have, thus, been used for cleaning metal items and polishing wood crafts (hence, the common name scouring rush for E. hyemale L.). Records for the use of Equisetum in herbal remedies date back several centuries, and cell-based assays have yielded promising results; however, the evidence for clinical efficacy has remained sparse [4].
Several classes of specialized metabolites have been reported to occur in the genus Equisetum. The structurally related alkaloids palustrine, N5-formylpalustrine, and palustridine were identified in early phytochemical studies, during the 1930s to 1950s, as toxic constituents of E. palustre L. [5,6,7]. Studies performed during the early 1970s to mid-1990s focused on the identification and characterization of flavonoid glycosides and caffeic acid conjugates in shoot tissue samples from various Equisetum species [8,9,10,11,12,13,14,15,16,17,18,19,20,21,22]. A red pigment, the ketocarotenoid rhodoxanthin, was isolated from E. arvense L. shoots and characterized in the late 1970s [23]. Sterols and steroids that accumulate in Equisetum species were first reported in the 1980s and 1990s [24,25,26]. During the mid to late 1990s, styrylpyrone glycosides were identified for the first time as metabolites of rhizomes and gametophytes of several Equisetum species [27,28]. More recently, fatty acid esters of sucrose were reported to occur in E. hyemale [29], the coumarin herniarin was isolated from E. debile roxb., the unusual sesquiterpene equisetumone was found in E. palustre, phenolic, lignan, and sesquiterpenoid glycosides were detected in several Equisetum species, the occurrence of the alkaloid equisetumine was established in E. debile, and the major constituents of epicuticular waxes of shoots were described [29,30,31,32,33,34,35,36,37,38,39]. While steady progress is being made with identifying individual novel metabolites of Equisetum, few if any analyses have focused on assessing the chemical diversity across the genus [40].
The biosynthesis of specialized metabolites in Equisetum was first studied in the mid- 1990s. Partially purified protein fractions obtained from shoots were demonstrated to contain activities that catalyze the formation of various phenolic esters with hydroxycinnamoyl-coenzyme A as an acceptor [41]. Styrylpyrone synthase activity, catalyzing the first committed step in styrylpyrone biosynthesis, was first detected in partially purified protein fractions from cultured gametophytes [42,43]. The structure of chalcone synthase from Equisetum, which forms naringenin, the signature precursor of flavonoids, was reported more recently [44].
We have an ongoing interest in furthering our understanding of the metabolic diversity associated with the evolution of early land plant lineages [45,46,47,48]. In this context, we now report on a multi-omic analysis of three Equisetum species, studying metabolite and transcript abundance patterns in both rhizomes and shoots. Our results lay the foundation for continued research to capture the metabolic capabilities in the fern allies.

2. Results and Discussion

2.1. Experimental Design Considerations

Three species of horsetail were selected for a metabolomics experiment: E. hyemale subsp. affine (rough horsetail or scouring rush), which is native to the temperate to artic portions of North America; E. arvense (common horsetail), which is endemic to the arctic and temperate regions of the northern hemisphere; Equisetum telmateia subsp. braunii (Milde) Hauke (giant horsetail), which is native to western North America (Figure 1B). Both below-ground rhizomes and above-ground sterile shoots were collected from greenhouse-grown plants of each species (five biological replicates), freeze-dried, and separately ground to homogenates. Samples were extracted with 80% aqueous methanol and analyzed by nontargeted high-performance liquid chromatography–quadrupole time-of-flight mass spectrometry (HPLC–QTOF-MS). Multivariate statistical analyses were performed to assess patterns of metabolite accumulation across species and tissue types in Equisetum. Next-generation ribonucleic acid sequencing (RNA-Seq) data were obtained with representative samples, which enabled the identification of candidate genes involved in the biosynthesis of the major classes of specialized metabolites in Equisetum. The expression levels of selected genes were then determined by quantitative real-time polymerase chain reaction (qRT-PCR), once again with five biological replicates per sample type (Figure 1B).

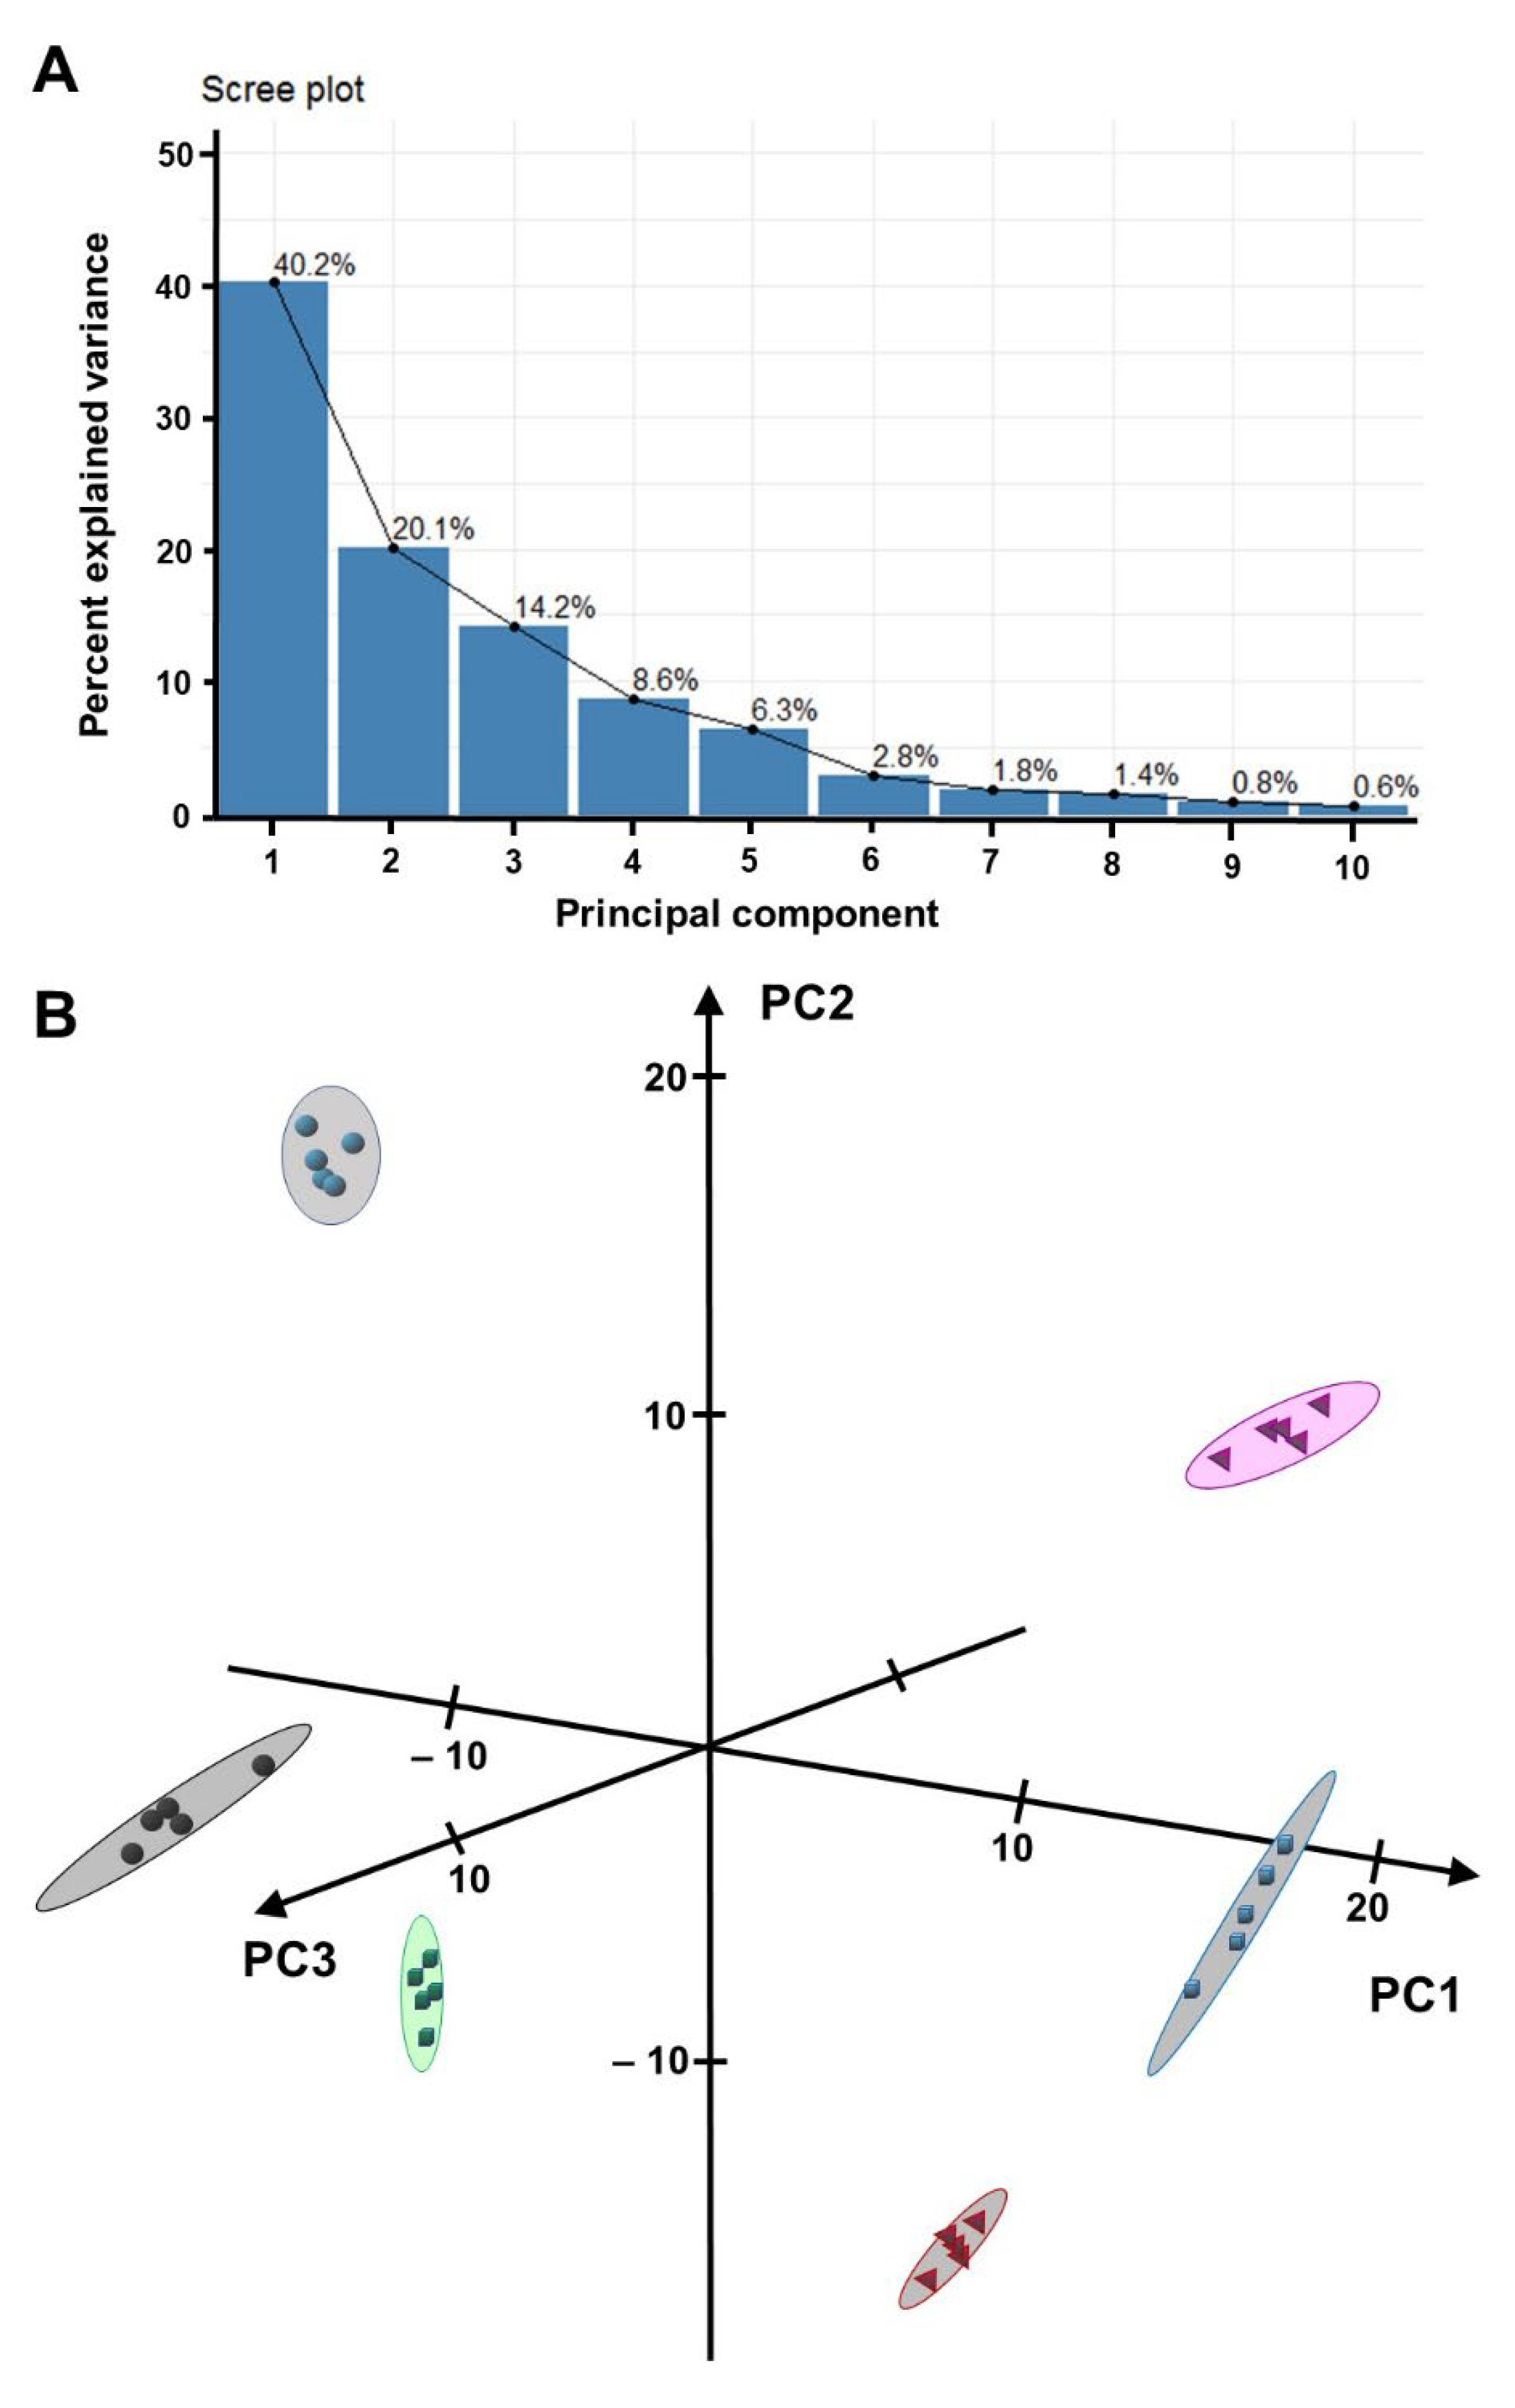
2.2. Sample Differentiation Based on HPLC–QTOF-MS Data

Molecular features (detector signals representing a specific retention time and accurate mass-to-charge ratio) were extracted from HPLC–QTOF-MS raw data; the processed data sets were log-transformed and then subjected to an unsupervised principal component analysis (PCA) (Supplementary Table S1). A full separation of Equisetum samples (tissue types and species), with tight clustering of biological replicates for each sample type, was achieved in the first three principal components (accounting for 74.5% of data variance) (Figure 2A). The first principal component (PC1; explaining 41.2% of variance) placed samples in two well-separated groups, one comprising all rhizome samples the other encompassing all shoot samples (Figure 2B). PC2 (explaining 19.0% of variance) isolated E. telmateia (both rhizome and shoot) and E. hyemale rhizome samples from the remaining samples. E. arvense and E. hyemale shoot samples were separated from the remainder in PC3 (explaining 14.3% of variance) (Figure 2B).
The molecular features contributing the most to sample separation in PCA were then analyzed for patterns of accumulation (focusing on those with high confidence peak annotation). Galactolipids with unsaturated fatty acid side-chains, carotenoids, and flavonoid glycosides were the classes of metabolites that contributed most prominently to the PC1 placement (positive PCA scores) of Equisetum shoot samples (Figure 3A). Our observation that above-ground shoot samples preferentially accumulate monogalactosyldiacylglycerol (MGDG) and digalactosyldiacylglycerol (DGDG) with a high content of polyunsaturated fatty acid side-chains (compared to below-ground rhizomes) is in excellent agreement with a recent report that these bilayer-forming galactolipids are predominantly found in photosynthetic tissues of Equisetum variegatum Schleich. ex. Web. and E. scirpoides Michx. collected in the Russian permafrost zone [49]. The relatively high abundance of carotenoids in photosynthetic tissues of Equisetum, compared to non-photosynthetic rhizomes, is also consistent with the literature [50]. The enrichment of flavonoid glycosides in vegetative shoot samples (compared to rhizomes), as observed in the present study, is likewise in accordance with previous publications [15,27]. Styrylpyrones and styrylpyrone glycosides were the dominant contributors to the positioning of rhizome samples in PC1 (negative PCA scores) in our experiments (Figure 3B). These uncommon polyketides were previously reported to be mostly lacking in sterile shoots of Equisetum, which is again consistent with our findings [27,28,32]. In summary, the present work confirms the tissue specificity of galactolipid, carotenoid, flavonoid glycoside, and styrylpyrone accumulation, but this is the first demonstration of the utility of an untargeted analytical approach to profile multiple metabolite classes for sample differentiation.
The unique positioning of E. telmateia rhizome samples in PC2 (highly positive PCA scores) correlated with the comparatively high abundance of molecular features that could not be associated with structures of known metabolites (Figure 3C). Rhizome samples of E. hyemale had strong negative PCA scores in PC2 due to the contributions of molecular features with also mostly unknown identity (except for a phenolic glycoside) (Figure 3D). E. arvense samples were positioned uniquely in a PCA plot (highly positive PC3 scores) because of the relatively high abundance of certain flavonoid and phenolic glycosides (Figure 3E). Relatively high levels of several flavonoid glycosides and a megastigmane glucoside (derived from carotenoid breakdown) in E. hyemale shoot samples correlated with the strong negative PCA score in PC3 (Figure 3F). Taken together, PCA performed with our untargeted metabolomics data allowed us to differentiate both Equisetum species and tissue types.

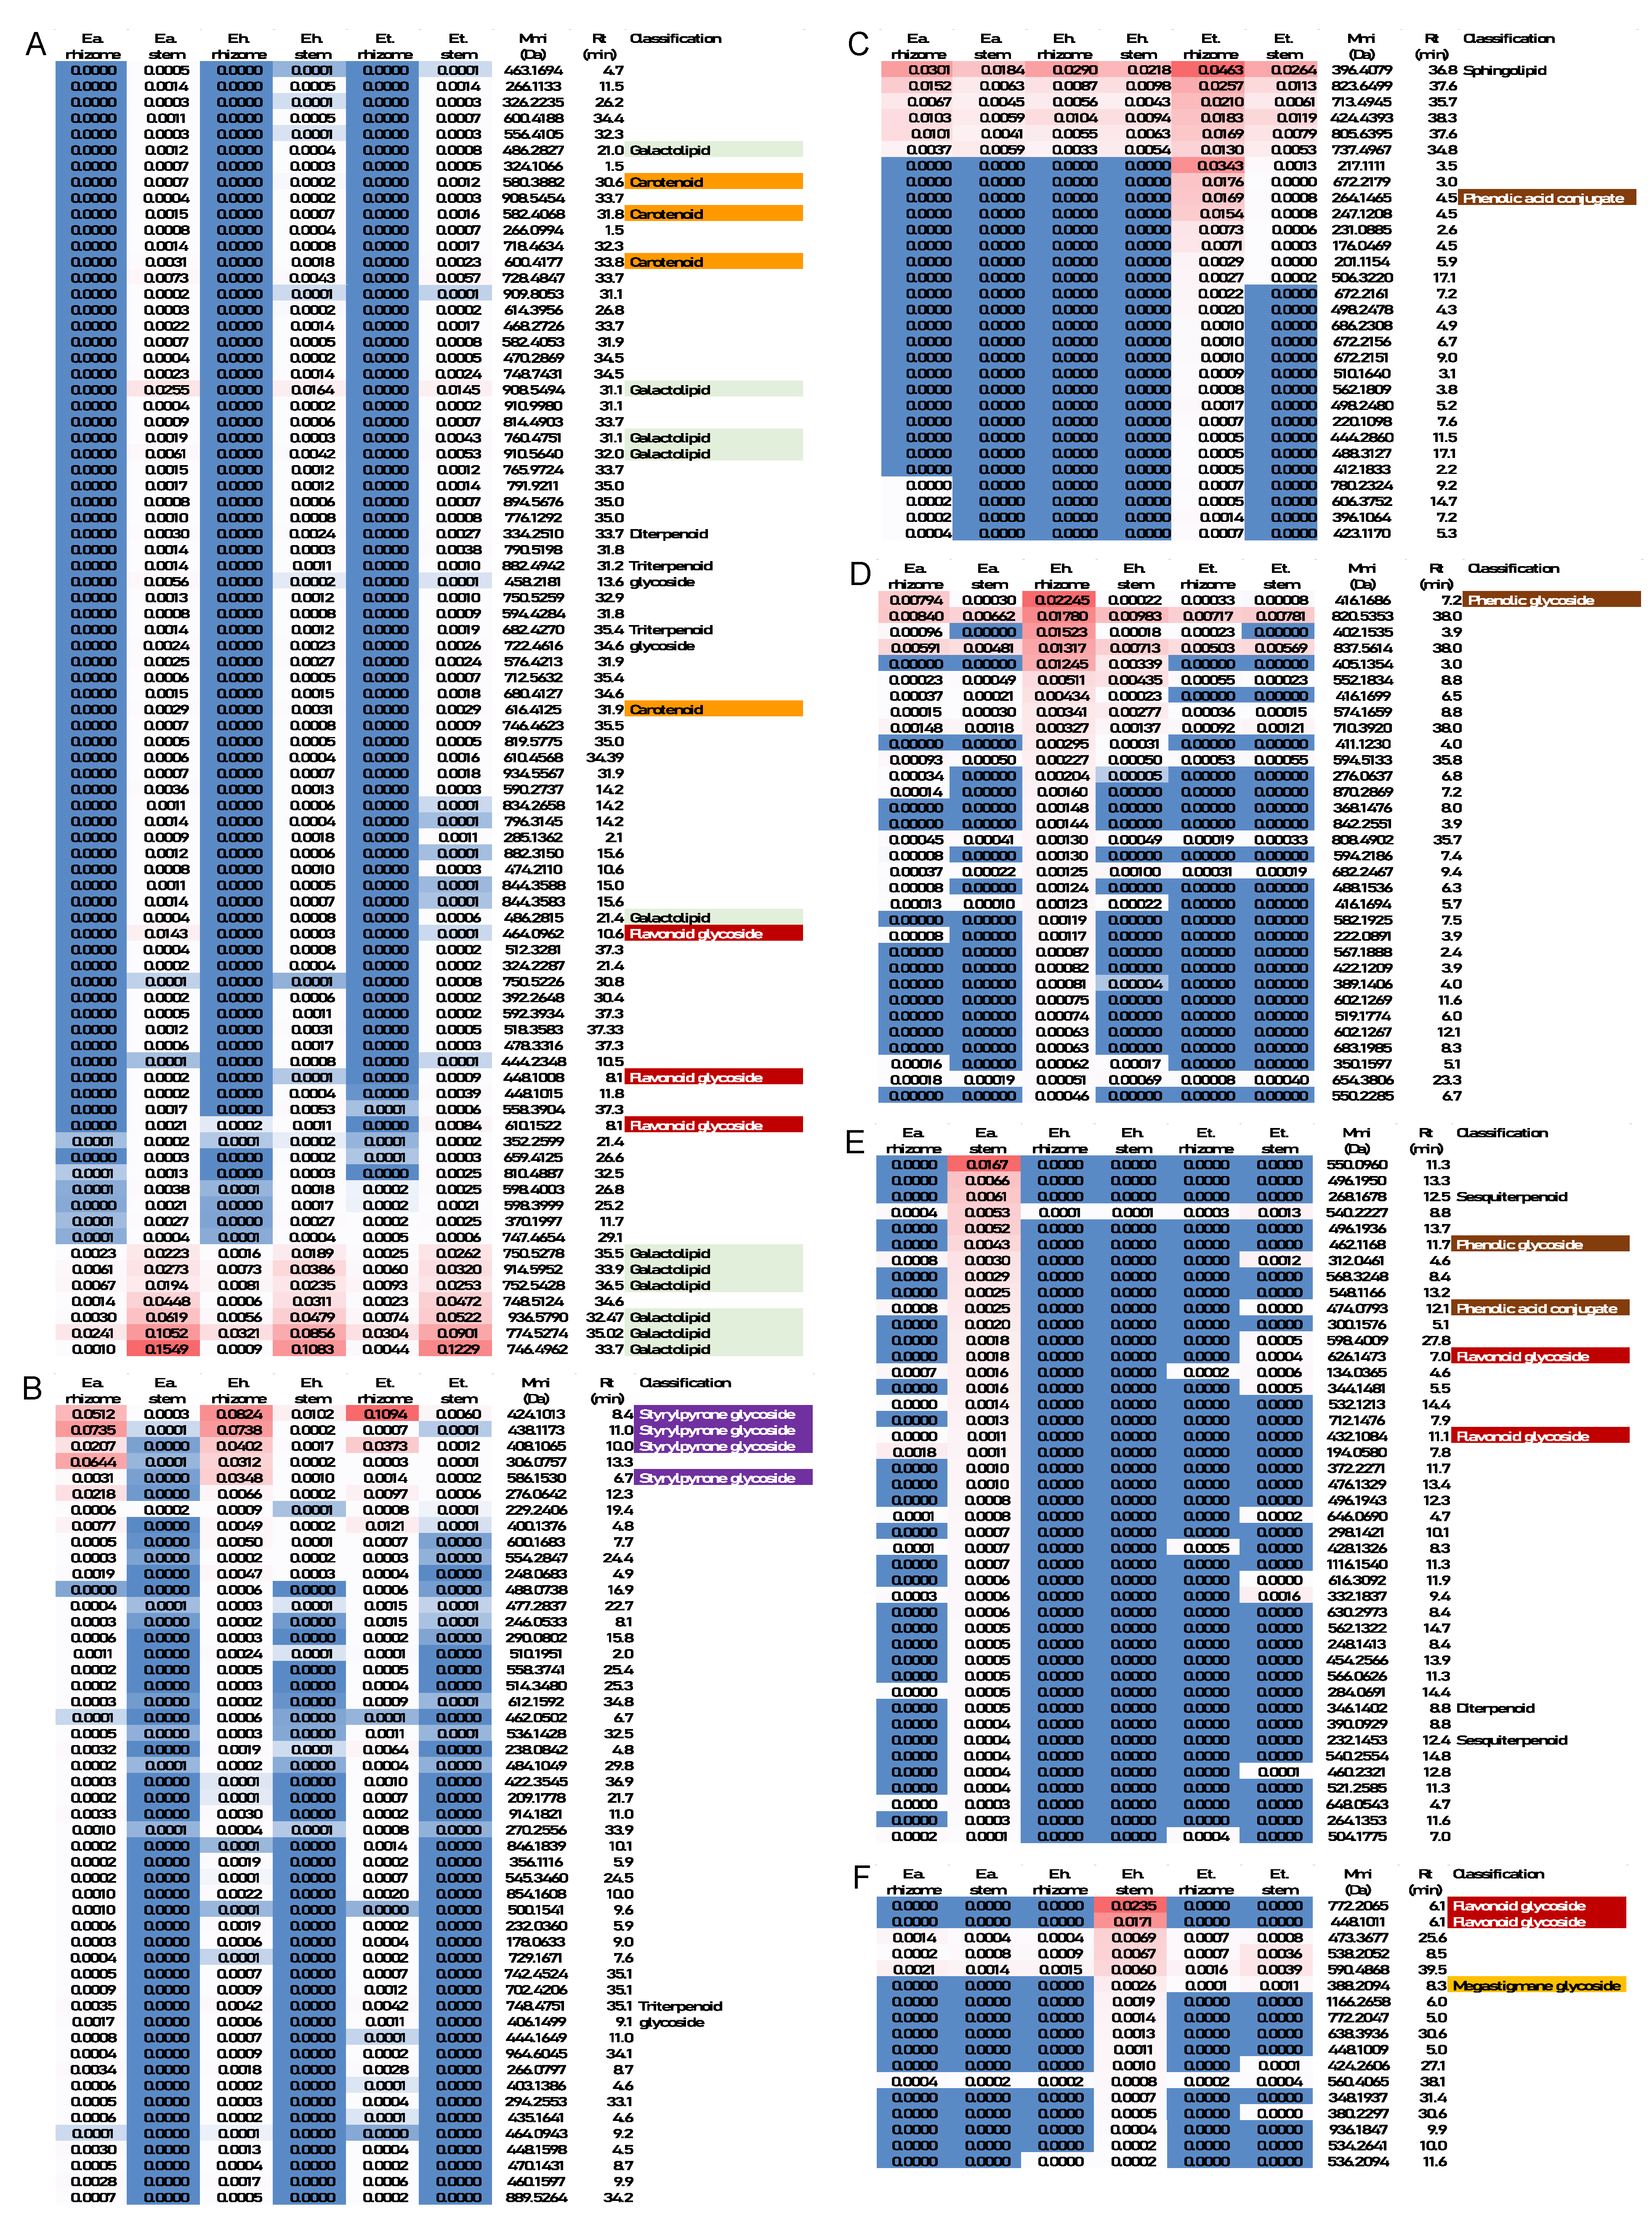
2.3. Annotation of Metabolites That Contribute Substantially to the Separation of Samples by PCA

To ensure that the general conclusions from our PCA were based on strong analytical evidence, we employed a stepwise process to obtain high confidence peak annotations. Briefly, molecular formulas were calculated on the basis of mass-to-charge ratios and isotope patterns of the detected molecular features; these formulas were then used to search against open-source metabolite libraries (KNApSAcK, Metlin, PubChem, Spektraris, and SwissLipids). Hits returned from these searches (level 1) were further evaluated on the basis of published studies on metabolites characterized from Equisetum species (as available through Chemical Abstracts and Google Scholar) (level 2). The previously reported order of elution of relevant metabolites separated under comparable HPLC conditions was taken into account (level 3), and we acquired HPLC–QTOF-MS data with dozens of authentic standards (level 4 for a match of retention time (Rt), exact mass, and relative maxima in ultraviolet/visible absorption spectra (UV/Vis)).
Phenolic acids, phenolic acid conjugates, and phenolic glycosides were among the earliest eluting analytes in our HPLC–QTOF-MS runs. Annotations with the highest confidence (level 4) were obtained for caffeoyl tartaric acid (or caftaric acid) and dicaffeoyltartaric acid (or chicoric acid), both of which were previously described as Equisetum metabolites [13,15,20,51]; in addition, chromatographic and mass spectral characteristics were matched with those of authentic standards (Rt 3.40 min, exact mass 312.0438 Da, UV/Vis 326 nm; Rt 12.15 min, exact mass 474.0793 Da, UV/Vis 328 nm, respectively) (Table 1). One molecular feature in our samples had characteristics consistent with an annotation as cinnamic acid (Rt 1.71 min, exact mass 264.1465 Da, level 2 confidence); although this metabolite is a ubiquitous constituent of plants as intermediate of the phenylpropanoid pathway, it was not previously reported in chemical analyses of Equisetum. To the best of our knowledge, feruloylputrescine (Rt 4.53 min, exact mass 148.0521 Da) and coniferylcinnamate (Rt 10.64 min, exact mass 330.1246 Da), two phenolic acid conjugates putatively identified in our extracts, were not previously described to occur in Equisetum, and the annotation in our study is, thus, tentative (level 1). Two peaks with characteristics in agreement with published phenyl glycosides were detected (level 2 evidence): equisetumoside A or B (Rt 7.24 min, exact mass 416.1686 Da, UV/Vis 279 nm; these metabolites are isobaric and could not be distinguished) and equisetumoside D (Rt 7.79 min, exact mass 414.1533 Da, UV/Vis 280 nm) (Table 1) [33,37].
Flavonoid glycosides also eluted fairly early under our HPLC–QTOF-MS conditions (6–12 min). The highest confidence annotations (level 4; match of characteristics with literature and authentic standards) were achieved for luteolin-5-O-glucoside (Rt 8.06 min, exact mass 448.1008 Da, UV/Vis 242, 342 nm), quercetin-3-O-glucoside (isoquercitrin; Rt 10.60 min, exact mass 464.0962 Da, UV/Vis 256, 354 nm), and kaempferol-3-O-glucoside (astragalin; Rt 11.78 min, exact mass 448.1015 Da, UV/Vis 264, 346 nm) (Table 1) [13,15,51,52]. Additional annotations (level 3) resulted from comparisons of characteristic HPLC parameters with those reported in the literature (kaempferol-3-O-sophoroside-7-O-glucoside (Rt 6.08 min, exact mass 772.2065 Da, UV/Vis 264, 344 nm), quercetin-3,7-di-O-glucoside (Rt 7.05 min, exact mass 626.1473 Da, UV/Vis 254, 348 nm), kaempferol-3,7-di-O-glucoside (Rt 8.06 min, exact mass 610.1522 Da, UV/Vis 264, 346 nm), kaempferol-3-O-rutinoside-7-O-glucoside (Rt 8.20 min, exact mass 756.2103 Da, UV/Vis 264, 346 nm), and kaempferol-3-O-sophoroside (Rt 9.95 min, exact mass 610.1540 Da, UV/Vis 264, 345 nm)) (Table 1) [13,15].
Styrylpyrone glycosides are signature metabolites of the Equisetum gametophyte and rhizomes (eluting at 6–11 min). Hispidin (6-(3,4-dihydroxystyryl)-4-hydroxy-2-pyrone) was the only representative of this class that we were able to purchase from a commercial source. Although we did not find evidence for its occurrence in Equisetum, the datasets acquired with the authentic standard (Rt 10.8 min, exact mass 246.0528 Da, UV/Vis 255, 379 nm) were important as a reference for the chromatographic and spectral properties of members of this class. Thus, on the basis of comparisons with literature reports, we tentatively identified four styrylpyrone glycosides in our samples (evidence level 3): 3-hydroxyhispidin-3,4′-di-O-glucoside (Rt 6.68 min, exact mass 586.1530 Da, UV/Vis nm), equisetumpyrone (Rt 8.39 min, exact mass 424.1013 Da, UV/Vis 253, 372 nm), 3′-deoxyequisetumpyrone (Rt 9.97 min, exact mass 408.1065 Da, UV/Vis 270, 367 nm), and 4′-O-methylequisetumpyrone (Rt 10.97 min, exact mass 438.1084 Da, UV/Vis 252, 370 nm) (Table 1) [27,28,52].
Four peaks with the typical characteristics of carotenoids were detected. Only one of these could be assigned to a structure with high confidence (level 4); an authentic standard of violaxanthin, a carotenoid with ubiquitous presence in plants [53], had the same characteristics as those of a peak in our chromatograms (Rt 33.83 min, exact mass 600.4177 Da, UV/Vis 415, 440, 469 nm) (Table 1). Other peaks with tentative annotation (level 1) as carotenoids (Rt 30.6 min, exact mass 580.3882 Da; Rt 31.75 min, exact mass 582.4068 Da; Rt 31.91 min, exact mass 616.4125 Da) did not match the exact mass values of typical plant carotenoids [53]. Debiloside B, a megastigmane glucoside (derived from carotenoid breakdown), was tentatively identified by comparison with literature data (evidence level 2) (Rt 8.28 min, exact mass 388.2094 Da, UV/Vis spectrum nondescript due to a lack of chromophores) (Table 1) [39].
Galactolipids were among the metabolite classes contributing to the separation of above-ground shoot samples in PCA. Two subclasses with different combinations of unsaturated fatty acids as side-chains were particularly abundant (listed in order of elution and using the shorthand nomenclature for fatty acids adopted by the International Union of Pure and Applied Chemistry): MGDG (34:6, Rt 33.70 min, exact mass 746.4962 Da; 36:6, Rt 35.02 min, exact mass 774.5274 Da; 34:4, Rt 35.46 min, exact mass 750.5278 Da; 36:5, Rt 35.86 min, exact mass 776.5443 Da; 34:3, Rt 36.54 min, exact mass 752.5428 Da; 36:4, Rt 36.72 min, exact mass 778.5575 Da; 36:2, Rt 37.32 min, exact mass 754.5557 Da) and DGDG (34:6, Rt 33.15 min, exact mass 908.5494 Da; 34:5, Rt 31.97 min, exact mass 910.5640 Da; 36:6, Rt 32.47 min, exact mass 936.5790 Da; 36:5, Rt 33.31 min, exact mass 938.5952 Da; 34:3, Rt 33.94 min, exact mass 914.60 Da; 36:4, Rt 34.19 min, exact mass 940.6076 Da; 34:2, Rt 34.77 min, exact mass 916.6117 Da). Except for MGDG-36:2 and DGDG-36:5 (level 1 evidence), authentic standards were available to ensure a level 4 annotation confidence for these lipid species (Table 1) [49].

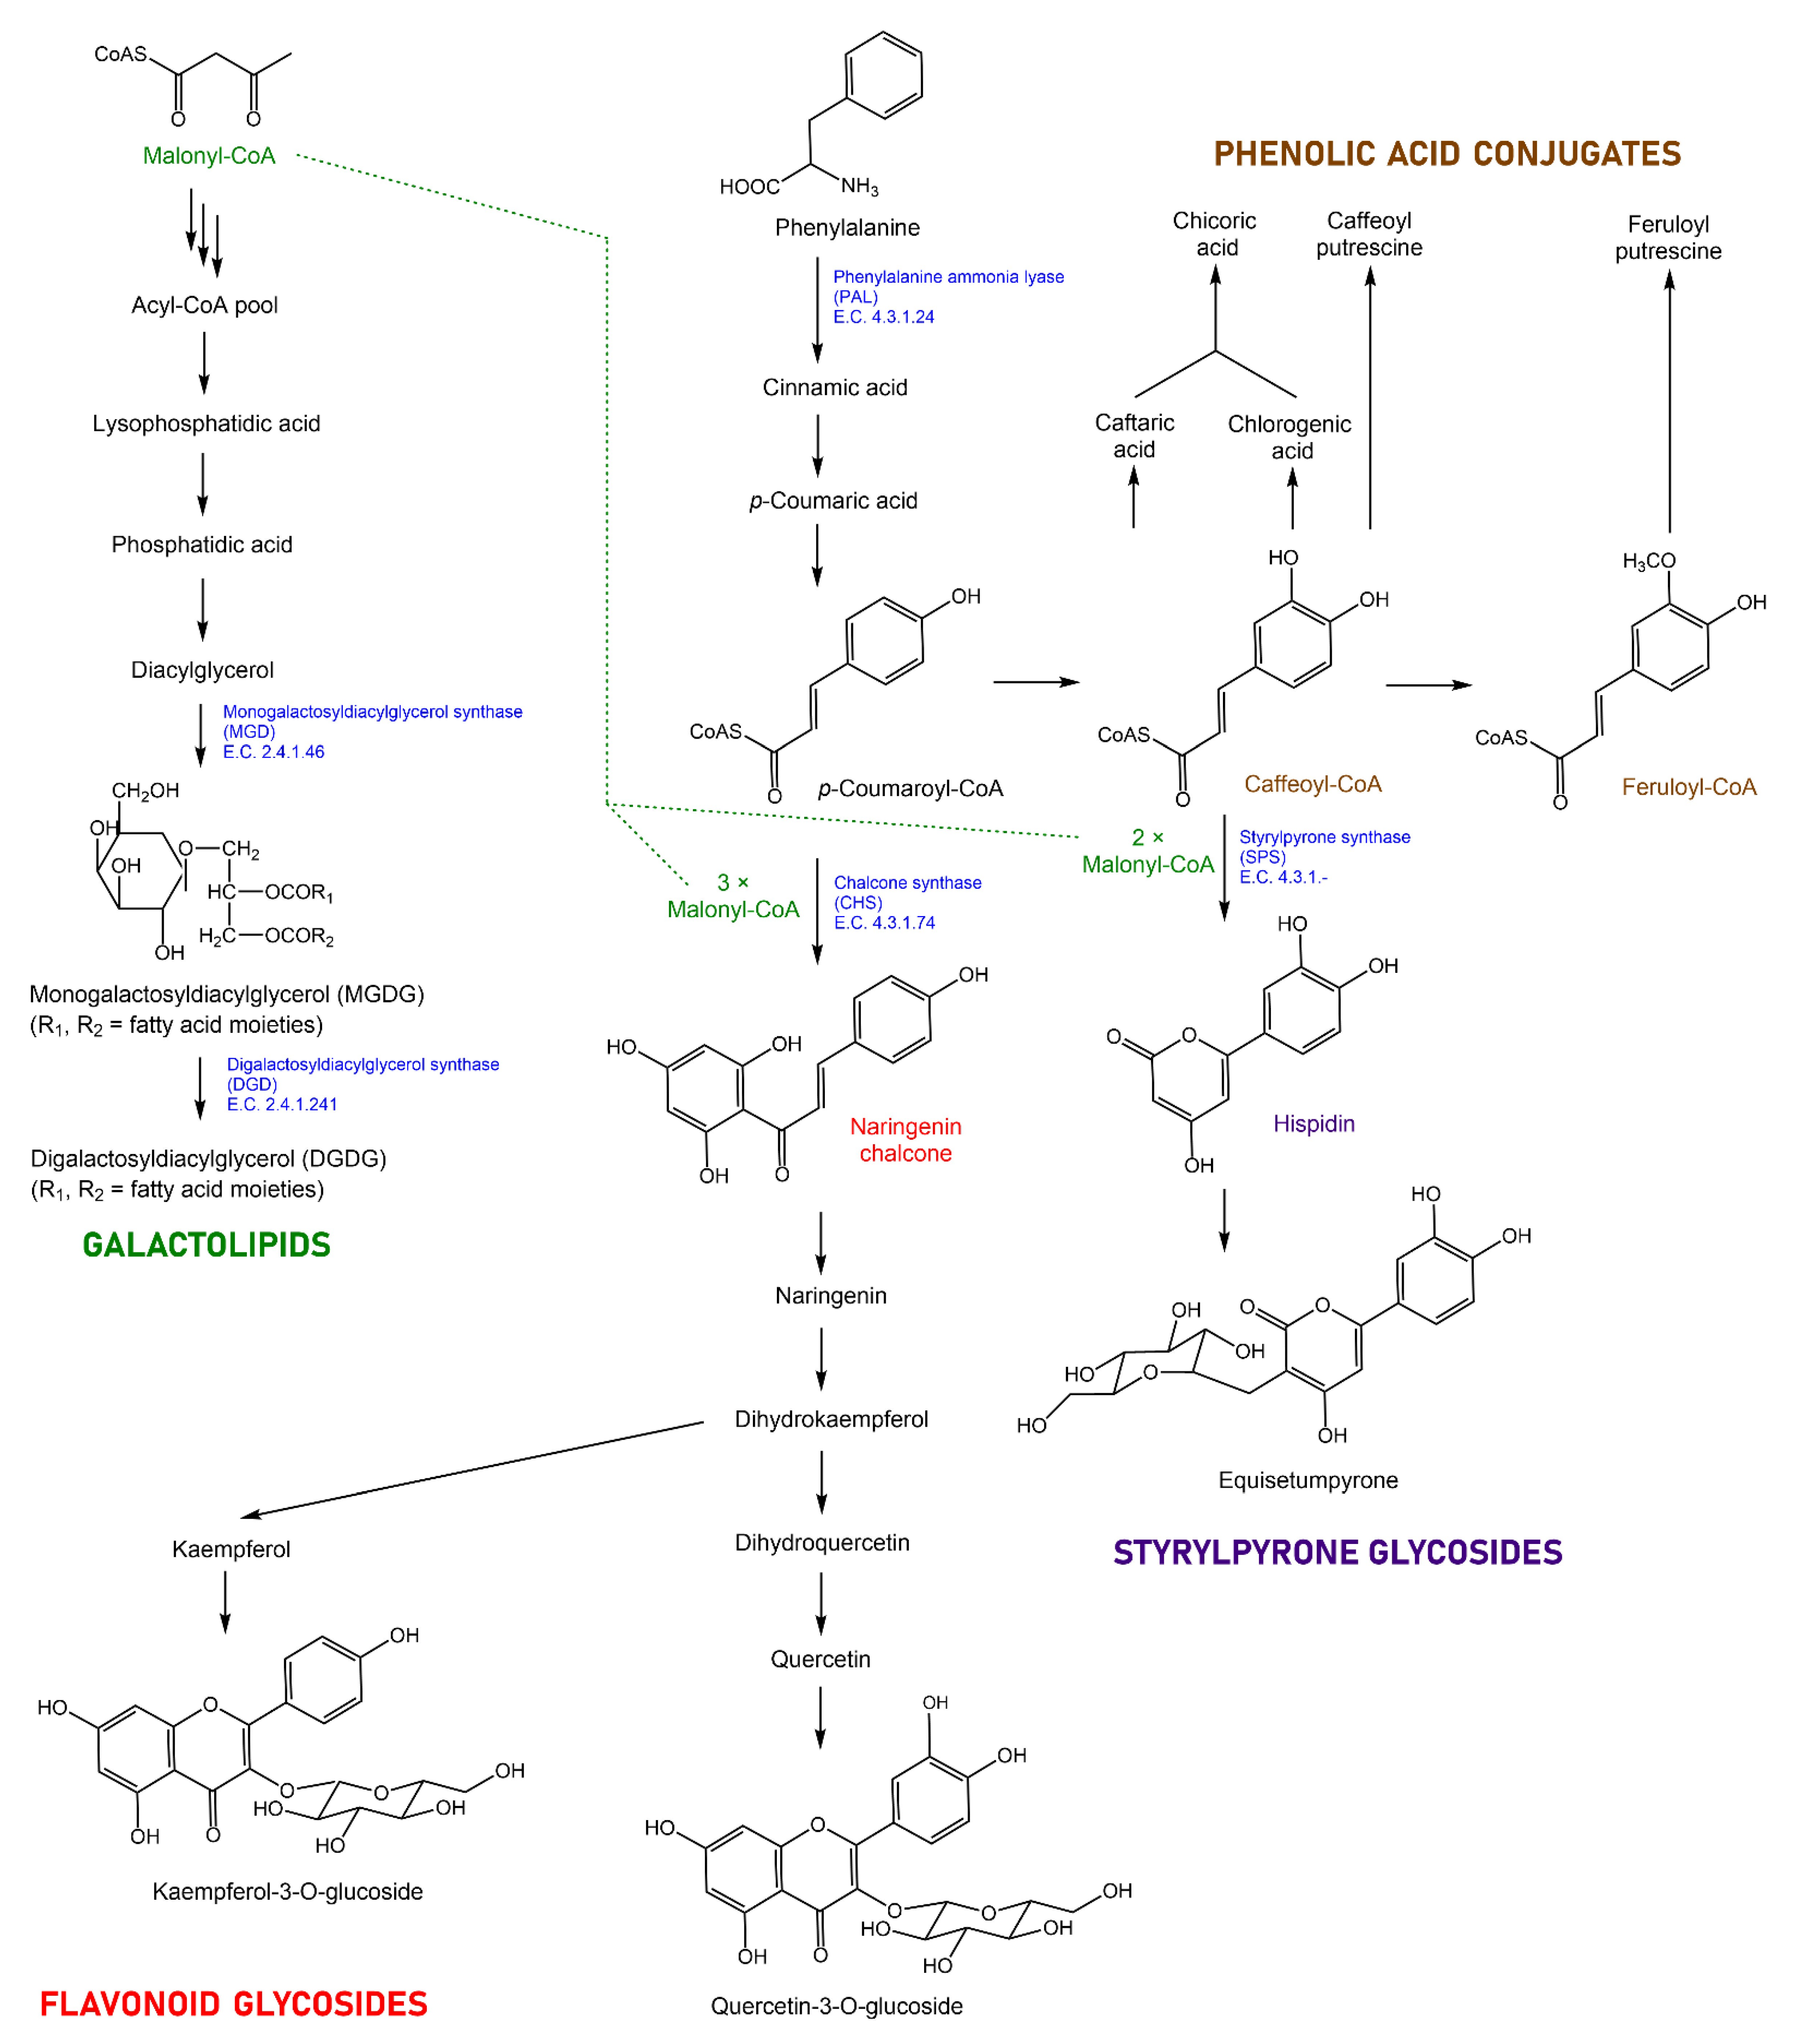
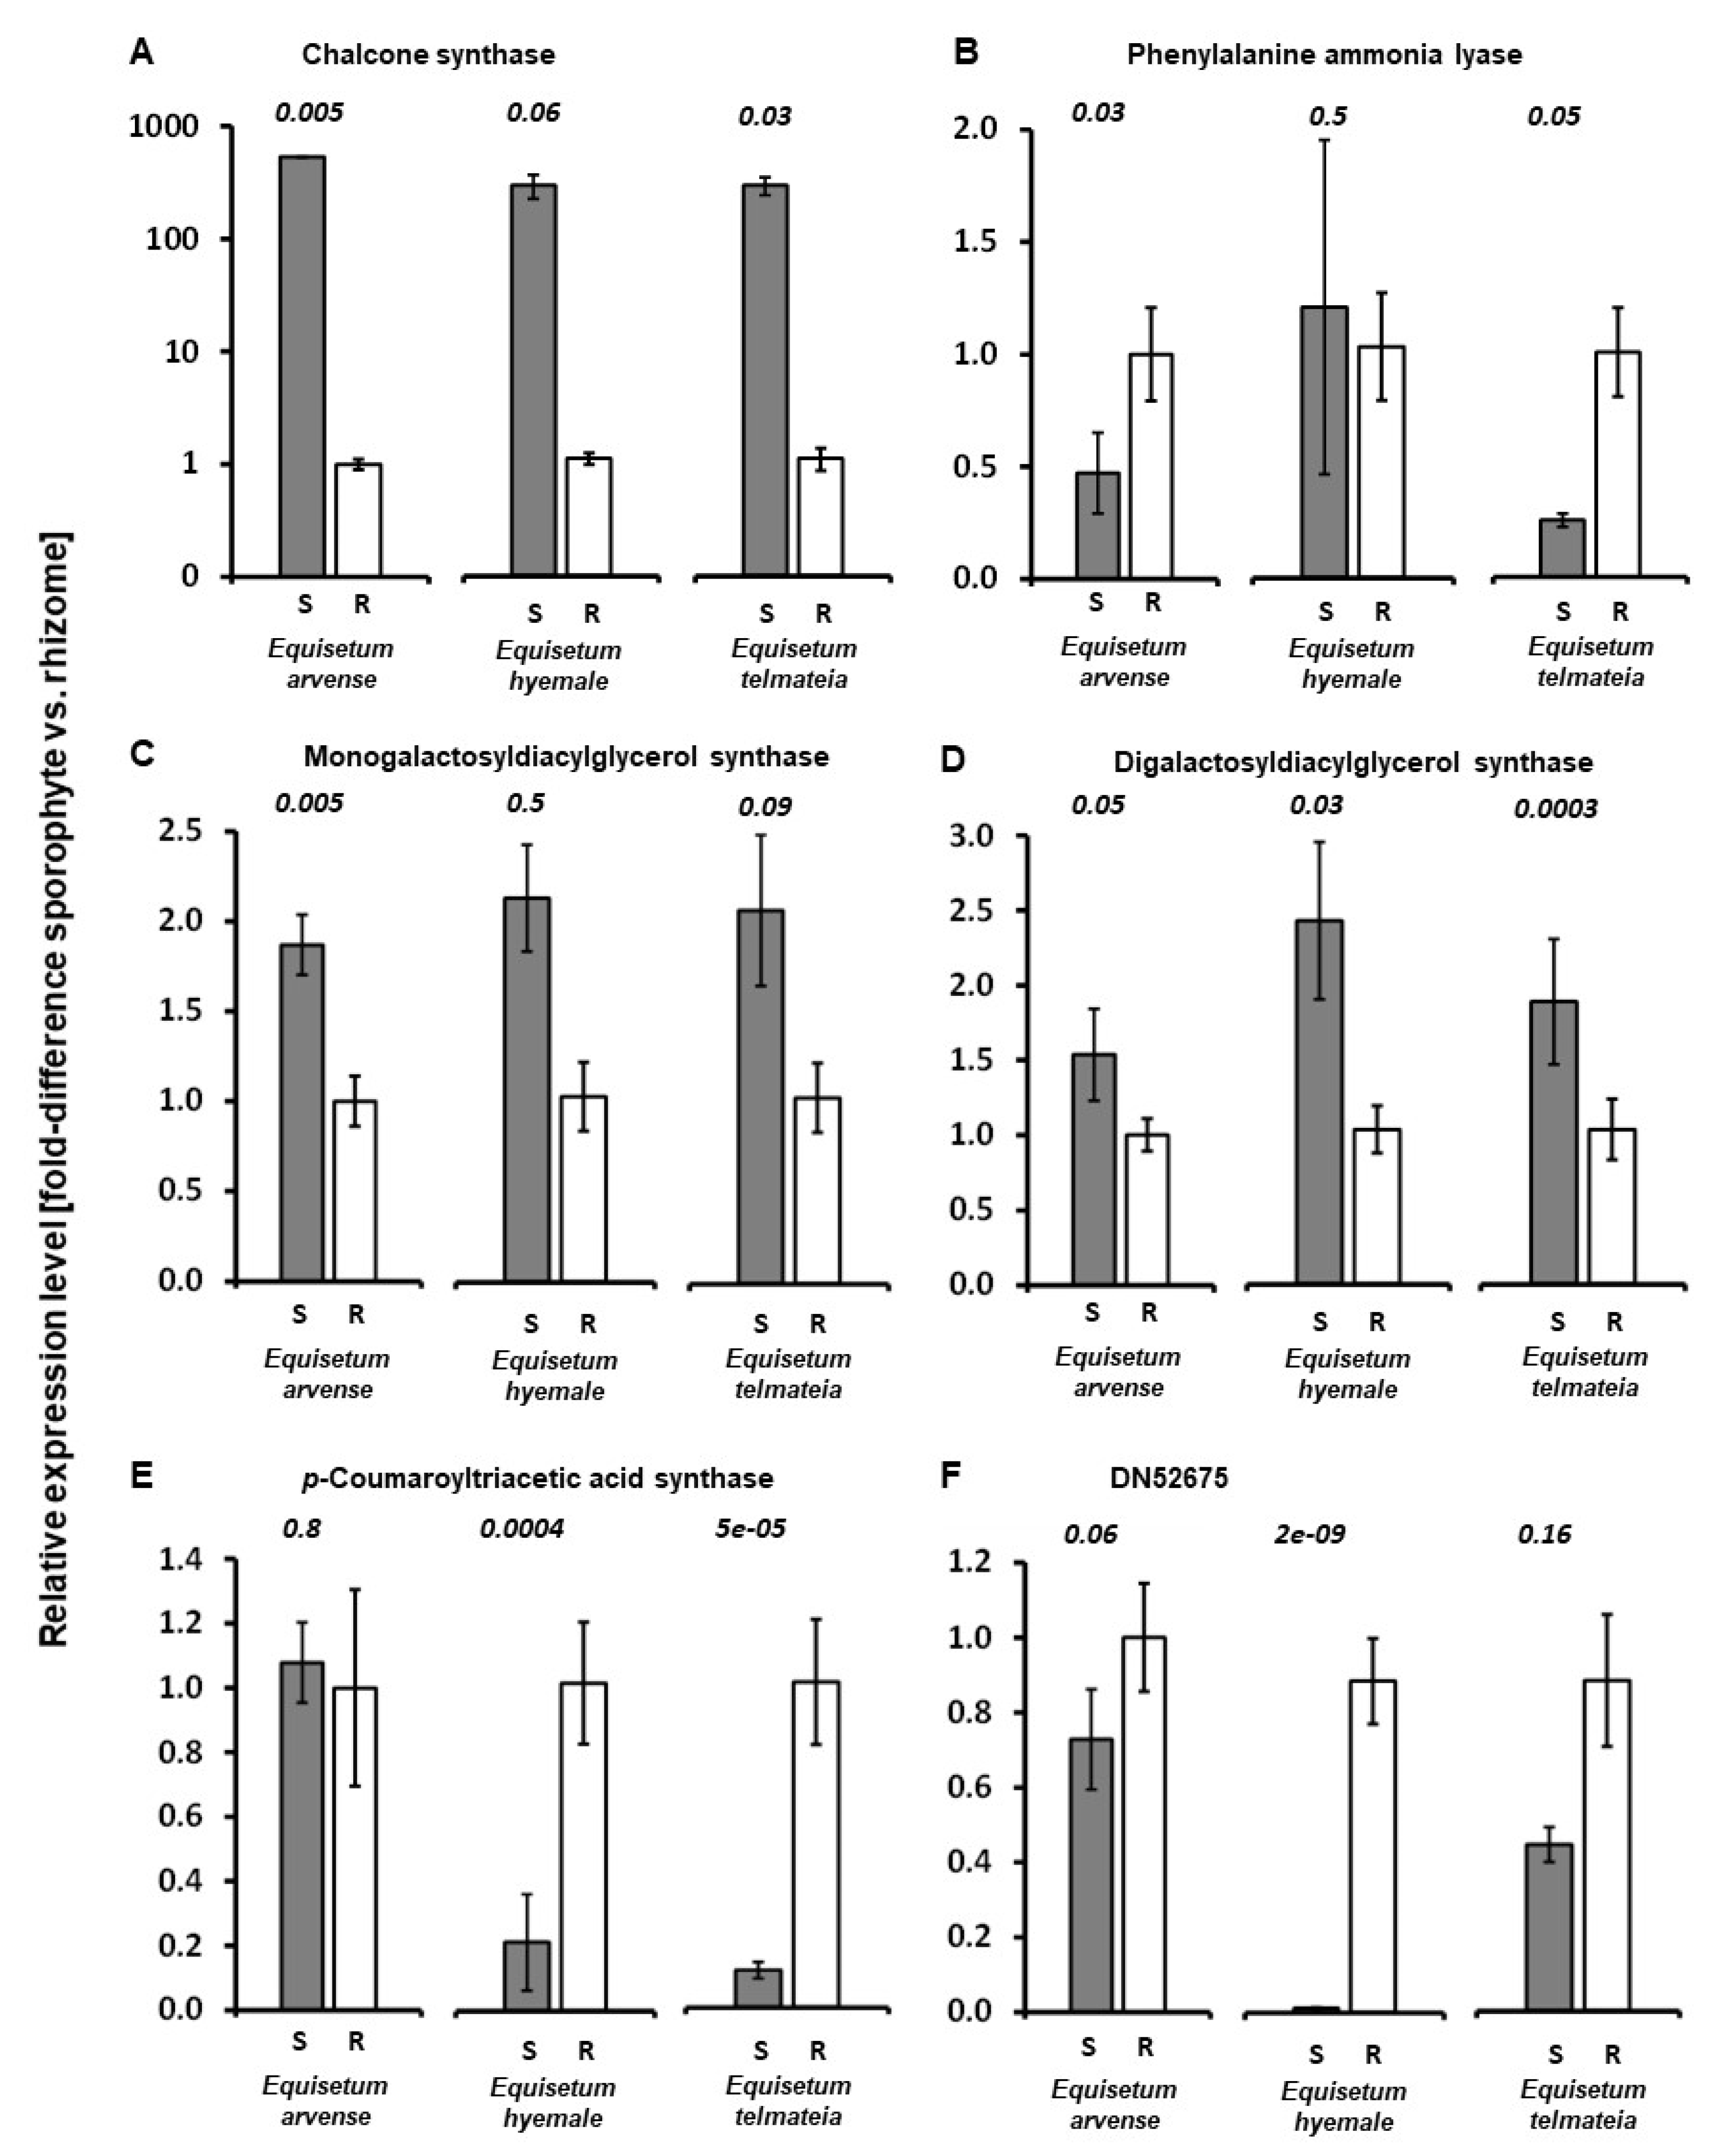
2.4. Expression Patterns of Genes Putatively Involved in the Biosynthesis of Specialized Metabolites in Equisetum

Differences in the accumulation of phenolic acid conjugates, flavonoid glycosides, styrylpyrone glycosides, and galactolipids helped explain the separation of Equisetum samples by PCA. Interestingly, the pathways that lead to these classes of metabolites share common intermediates (Figure 4). It was, thus, of interest to evaluate if differing metabolite profiles were also reflected in gene expression patterns. As a first step to identify candidate genes for follow-up experimentation, we obtained RNA-Seq data with representative samples (E. arvense shoot, E. arvense rhizomes, E. hyemale shoot, E. hyemale rhizomes, E. telmateia shoot, and E. telmateia rhizomes) (Supplementary Table S2). We then used sequences of genes known to be involved in the biosynthesis of the above-mentioned metabolite classes in Equisetum and other species and searched for putative orthologs in our RNA-Seq datasets. We were particularly interested in genes that code for enzymes with functions at metabolic branchpoints, with an emphasis on those that do not occur as part of large gene families. Sequences of Equisetum gene candidates were previously deposited for phenylalanine ammonia lyase (PAL; general phenylpropanoid pathway; National Center for Biotechnology Information (NCBI) accession number AY803283), chalcone synthase (CHS; flavonoid pathway; AB30004), and a polyketide synthase with styrylpyrone synthase activity (annotated as p-coumaroyltriacetic acid synthase or CTAS; FJ443125; Colpitts, 2009) (Supplementary Figure S1). Sequences with high homology to genes coding for monogalactosyldiacylglycerol synthase (MGD; galactolipid pathway) and digalactosyldiacylglycerol synthase (DGD; galactolipid pathway) in other species were also identified. Furthermore, genes encoding enzymes with housekeeping functions (β-actin and glyceraldehyde-3-phosphate dehydrogenase) were tested as references (Supplementary Figure S1). The sequences of reference genes and genes of interest were then employed to design primers for qRT-PCR (Supplementary Table S3).
The transcript for CHS was dramatically more abundant in shoots when compared to rhizomes (530-, 210-, and 104-fold higher in E. arvense, E. hyemale, and E. telmateia samples, respectively) (Figure 5A). These results are consistent with the preferential accumulation of flavonoid glycosides in above-ground tissues. Transcript levels for MGD were also higher in shoots than in rhizomes (1.9-, 2.0-, and 2.0-fold for E. arvense, E. hyemale, and E. telmateia, respectively) (Figure 5B), which agreed with galactolipid accumulation patterns. The same patterns were observed for DGD (1.5-, 2.4-, and 1.8-fold shoot-to-rhizome difference in E. arvense, E. hyemale, and E. telmateia, respectively) (Figure 5C). The PAL transcript was expressed at lower levels in shoots than in rhizomes in E. arvense and E. telmateia (0.5- and 0.3-fold, respectively) (Figure 5D); in contrast, PAL expression was comparable in E. hyemale samples. PAL plays a central role in the general phenylpropanoid pathway [54], major products of which are flavonoid glycosides that accumulate primarily in shoots and styrylpyrone glycosides that are present mainly in rhizomes, but there are many other products derived from this pathway. It will remain to be investigated if the differences in PAL expression observed in above-ground and below-ground organs of E. arvensis and E. telmateia correlate with the concentrations of these metabolites. Our primers targeted the most prominent isoform of PAL expressed in shoots and rhizome samples (based on RNA-Seq data); thus, it would be of interest to investigate isoform-specific expression patterns in the future (beyond the scope of the current study). Comparable transcript abundance across samples was detected for a polyketide synthase gene (CTAS) with high homology to the bonified SPS of kava (Piper methysticum G. Forst) [55] in E. arvense; in contrast, a dramatically lower transcript abundance was observed for this transcript in shoots of E. hyemale and E. telmateia (when compared to rhizome samples) (0.2- and 0.1-fold, respectively) (Figure 5E). Interestingly, a biochemical analysis of CTAS from E. hyemale indicated that the enzyme could produce p-coumaroyltriacetic acid (a linear triketide) or triketide pyrones (cyclized) from p-coumaroyl-CoA, with the outcome of the reaction depending on the assay conditions [56]. It is, thus, unclear if this gene codes for an enzyme involved in styrylpyrone biosynthesis. Our RNA-Seq data revealed the presence of another polyketide synthase gene represented by contig DN52675 in E. telmateia rhizomes (Supplementary Figure S1). qRT-PCR data provided evidence that this transcript was less abundant in shoots compared to rhizomes (0.7-, 0.01-, and 0.5-fold for E. arvense, E. hyemale, and E. telmateia, respectively) (Figure 5F). This pattern of expression would appear to agree with our metabolite data that showed a rhizome-specific accumulation of styrylpyrones. A full functional evaluation of this gene is beyond the scope of this study, but it would certainly be interesting to further investigate the kinetic properties of the encoded enzyme in the context of styrylpyrone biosynthesis.

3. Materials and Methods

3.1. Plant Growth

E. arvense, E. hyemale, and E. telmateia (voucher specimens deposited with the John G. Searle Herbarium of the Field Museum, Chicago, IL, USA) were maintained in a greenhouse under ambient lighting, with supplemental lighting from sodium-vapor lamps (Ethical Statement: Equisetum plants used in this study were kindly provided by the University of California Botanical Garden in Berkeley, CA, USA). The photosynthetically active radiation varied from 15 to 25 mol·m−2·day−1. Temperatures ranged between 22 and 27 °C, and the humidity was set to 70% ± 10%. Five biological replicates (separate plants) were harvested at the same time of day for below-ground rhizomes and above-ground shoots of vegetative shoots. Samples were snap-frozen in liquid nitrogen and freeze-dried (aerial parts for 5 days, rhizomes for 7 days). Lyophilized material was submerged in liquid nitrogen, homogenized using a mortar and pestle, and then stored in separate batches at −80 °C until further processing.

3.2. Tissue Extraction and Analysis by HPLC–QTOF-MS

Frozen tissue homogenate (30 mg per sample) was transferred to a 2 mL reaction tube and extracted with 1 mL of 80% aqueous methanol (containing 10 mg/L anthracene-9-carboxylic acid as internal standard) by vigorous shaking (VX-2500 multi-tube vortexer, VWR Scientific, South Plainfield, NY, USA) for 10 min and subsequent sonication for 20 min (FS30 ultrasonic cleaner, Fisher Scientific, Hampton, NY, USA). Following centrifugation for 10 min at 13,000× g (5415 microfuge, Eppendorf, Enfield, CT, USA), the supernatant was filtered through 0.22 μm polypropylene syringe filter tips, and the flow-through was collected in plastic inserts for 2 mL reaction vials. The conditions used for the separation and detection of metabolites by HPLC–QTOF-MS are the same as reported previously [48].

3.3. HPLC–QTOF-MS Data Processing and Statistical Analyses

Raw datasets were opened in the MassHunter Profinder version B.06.00 (build 6.0.0625.0) software package (Agilent Technologies, Santa Clara, CA, USA), and molecular features were obtained using the batch recursive feature extraction algorithm. Binning and alignment tolerances were set to 10% + 20 s for the retention time, 10 ppm + 2 mDa for the mass accuracy, and 0.0025 m/z + 5.0 ppm for the isotope grouping space tolerance. Additional parameters that were considered for feature extraction were quasi-molecular ions and adducts ([M + H]+, [M + Na]+, [M + K]+, [M + NH4]+), dimers, neutral losses (H2O, H3PO4, C6H10O5 (glucose), C12H20O9 (rutinose), C12H20O10 (sophorose), C6H10O4 (rhamnose), and C5H8O4 (xylose)), absolute peak height ≥2000 counts, and occurrence required in a minimum of four of the five replicates of each sample type. These preprocessing steps generated 848 molecular features, for which data were exported to an Excel spreadsheet. Additional exclusion criteria for molecular features were as follow: relative standard deviation of mass accuracy ≥5.0 ppm; percentage relative standard deviation returned as “NaN” (not a number) or an empty cell; an unacceptably close accurate mass and retention time (±0.010 m/z and ±0.02 min; screened as duplicates); if it was a fragment. This additional filtering returned 544 remaining molecular features. Peak areas of molecular features for each sample were normalized on the basis of the sample weight and the peak area of the internal standard (molecular features without a peak area were filled in with a nominal value of two). Preprocessed datasets were imported into RStudio version 1.4.1717 [57] running R version 4.1.1 [58] and subjected to log10 transformation, autoscaling, and centering. Data dimensionality reduction was performed using unsupervised PCA with the prcomp function in R. The R packages factoextra, ggplot2, and pca3d were employed for visualization and figure generation.
The MassHunter Qualitative Analysis software version B.07.00 Service Pack 1 (build 7.0.7024.29) (Agilent Technologies, Santa Clara, CA, USA) was employed to generate molecular formulas with the “common organic molecule isotope model” setting. Molecular formulas were then used in searches against public databases, including PubChem [59], KNApSAcK [60], and Spektraris [46,61]. Annotations were also evaluated against the available literature on metabolites previously described to occur in horsetail samples. For high confidence annotations, retention time and accurate mass data for molecular features were compared with those of authentic standards. HPLC–QTOF-MS data and meta data for the current study were submitted to the National Metabolomics Data Repository (Project ID PR001223) [62].

3.4. RNA Extraction, RNA-Seq, and Data Processing

Total RNA was extracted using the RNeasy Mini kit (Qiagen, Hilden, Germany) according to the manufacturer’s instructions. To eliminate genomic DNA, RNA (1–2 μg) was treated with DNase I (1 unit of enzyme per μg of RNA) and then processed with the RNeasy MinElute kit (Qiagen, Valencia, CA, USA). The quality of mRNA samples was tested by taking RNA Integrity Number measurements with a 2100 Bioanalyzer (Agilent Technologies, Santa Clara, CA, USA). The TruSeq RNA Sample Preparation kit (Illumina, San Diego, CA, USA) was used to generate mRNA-focused libraries, which were then subjected to transcriptome sequencing with the HiSeq 3000 platform (Illumina, San Diego, CA, USA) to produce 101 bp paired-end reads. After assessing the read quality with FastQ, erroneous kmers, adapter sequences, and low-quality reads were removed, and sequence reads were assembled with Trinity (v 2.6.5) [63,64]. Short reads were uploaded to NCBI’s Short Read Archive (BioProject ID PRJNA340020). Expression levels (expressed as transcripts per kilobase million) were calculated by RSEM (v 1.2.22) and bowtie (v 2.0.0). Annotations were generated using Trinotate (v 3.0.2).

3.5. RNA Extraction, First-Strand cDNA Synthesis, qPCR, and Data Processing

Frozen plant material was homogenized under liquid nitrogen using a mortar and pestle. RNA was extracted with the Nucleo Spin RNA Plant and Fungi kit (Macherey-Nagel, Allentown, PA, USA) according to the manufacturer’s instructions. The quality of the isolated DNase-free RNA was evaluated by gel electrophoresis and UV spectroscopy. First-strand cDNA from each replicate was synthesized using the Maxima H minus reverse transcriptase (Fisher Scientific, Waltham, MA, USA) with equal amounts (1 µg) of RNA for each sample. In a 10 μL quantitative PCR reaction, concentrations were adjusted to 300 nM (primers), 1× iTaq Power SYBR Green PCR Master Mix (Bio-Rad, Hercules, CA, USA), and 10× diluted first-strand cDNA as template (primer sequences provided in Supplementary Table S3). Reactions were performed in a 96-well optical plate at 95 °C for 10 min, followed by 40 cycles of 95 °C for 15 s and 60 °C for 10 min in a CFX Connect RT System (Bio-Rad, Hercules, CA, USA). Fluorescence intensities of three independent measurements (technical replicates) were normalized against the carboxyrhodamine reference dye (ThermoFisher, Waltham, MA, USA). Genes coding for β-actin and glyceraldehyde 3-phosphate dehydrogenase were tested as constitutively expressed endogenous controls, with the former giving the most consistent expression levels across samples (used as reference gene). The RDML-LinRegPCR tool was employed to calculate Cq and qPCR efficiency values from raw data according to the reporting guidelines of the RDML consortium [65,66]. Relative fold-difference levels between shoot and rhizome samples were calculated using a mathematical model that adjusts for qPCR efficiency and crossing point deviation [67]. The p-values were obtained with a two-tiered Student’s t-test (t.test function) in Microsoft Excel (pairwise comparisons of above-ground and below-ground samples).

4. Conclusions

Principal component analysis of metabolomics data obtained with above-ground shoot and below-ground rhizome extracts of three different greenhouse-grown Equisetum species enabled a separation of all sample types. Shoot samples were separated from rhizome samples due to the higher accumulation of galactolipids, carotenoids, and flavonoid glycosides, while rhizome samples were enriched in stryrylpyrone glycosides and phenolic glycosides. Consistent with metabolite profiles, shoot samples had elevated levels of genes coding for enzymes of flavonoid and galactolipid biosynthesis, while a putative styrylpyrone synthase gene was expressed preferentially in rhizomes. We recognize that our data only provide a snapshot of metabolite and gene expression patterns under a specific set of controlled greenhouse conditions; thus, it would be of great interest for future efforts to assess chemical diversity patterns in different Equisetum species across biomes.

Supplementary Materials

The following supporting information can be downloaded at: https://www.mdpi.com/article/10.3390/metabo12050403/s1, Figure S1: Translated peptide sequence alignments for selected transcripts investigated using RT-qPCR; Table S1: Metabolomics data obtained with shoot and rhizome samples of three Equisetum species and outcomes of subsequent Principal Component Analysis; Table S2: Assembled transcriptome data for shoot and rhizome samples of three Equisetum species; Table S3: Sequences of primers used for RT-qPCR.

Author Contributions

Conceptualization, B.M.L.; methodology, A.N.P., I.L. and D.Š.; investigation, A.N.P., I.L. and D.Š.; data curation, A.N.P., I.L. and B.M.L.; writing—original draft preparation, A.N.P. and B.M.L.; writing—review and editing, A.N.P., I.L., D.Š. and B.M.L.; visualization, A.N.P., I.L. and B.M.L.; supervision, B.M.L.; project administration, B.M.L.; funding acquisition, D.Š. and B.M.L. All authors have read and agreed to the published version of the manuscript.

Funding

This work was supported in part by seed funds from the USDA National Institute of Food and Agriculture, Hatch Umbrella project #1015621 (to B.M.L.). D.Š. acknowledges financial support from the European Union’s Seventh Framework Program under grant agreement #291823, Marie Curie FP7-PEOPLE-2011-COFUND NEWFELPRO, project 64.

Institutional Review Board Statement

Not applicable.

Informed Consent Statement

Not applicable.

Data Availability Statement

HPLC–QTOF-MS datasets was uploaded to the NIH Common Fund’s National Metabolomics Data Repository (NMDR) website (Project ID PR001223) [62]. RNA-Seq data are available at NCBI’s Short Read Archive (BioProject ID PRJNA340020). Processed data are included in the figures, tables, and supplementary materials of this manuscript.

Acknowledgments

We would like to thank the Institute of Biological Chemistry’s greenhouse staff, Julie Thayer and Devon Thrasher, for plant maintenance. We would also like to thank Kaylie E. Barton for technical assistance with qPCR assays.

Conflicts of Interest

The authors declare no conflict of interest.

References

  1. Elgorriaga, A.; Escapa, I.H.; Rothwell, G.W.; Tomescu, A.M.; Rubén Cúneo, N. Origin of Equisetum: Evolution of horsetails (Equisetales) within the major euphyllophyte clade Sphenopsida. Am. J. Bot. 2018, 105, 1286–1303. [Google Scholar] [CrossRef] [PubMed]
  2. Clark, J.W.; Puttick, M.N.; Donoghue, P.C. Origin of horsetails and the role of whole-genome duplication in plant macroevolution. Proc. R. Soc. B 2019, 286, 20191662. [Google Scholar] [CrossRef] [PubMed]
  3. Jeffrey, E.C. The Development, Structure, and Affinities of the Genus Equisetum; Kessinger Publishing: Whitefish, MT, USA, 1899; Volume 5, 48p. [Google Scholar]
  4. Carneiro, D.M.; Jardim, T.V.; Araújo, Y.C.L.; Arantes, A.C.; de Sousa, A.C.; Barroso, W.K.S.; Sousa, A.L.L.; da Cunha, L.C.; Cirilo, H.N.C.; Bara, M.T.F. Equisetum arvense: New Evidences Supports Medical use in Daily Clinic. Pharmacogn. Rev. 2019, 13, 51. [Google Scholar] [CrossRef]
  5. Glet, E.; Gutschmidt, J.; Glet, P. Das Alkaloid im Equisetum palustre. Z. Physiol. Chem. 1936, 244, 229–234. [Google Scholar] [CrossRef]
  6. Karrer, P.; Eugster, C. Über ein Alkaloid aus Equisetum palustre. Helv. Chim. Acta 1948, 31, 1062–1066. [Google Scholar] [CrossRef] [PubMed]
  7. Eugster, C.H.; Griot, R.; Karrer, P. Weiteres über die Sumpfschachtelhalmbasen. Helv. Chim. Acta 1953, 36, 1387–1400. [Google Scholar] [CrossRef]
  8. Hauteville, M.; Chopin, J.; Geiger, H.; Schuler, L. Protogenkwanin, a new flavonoid from Equisetum arvense L. Tetrahedron 1981, 37, 377–381. [Google Scholar] [CrossRef]
  9. Kutney, J.P.; Hall, J.E. Constituents from Equisetum telmateia: The structures of equisporoside and equisporol. Phytochemistry 1971, 10, 3287–3289. [Google Scholar] [CrossRef]
  10. Saleh, N.; Majak, W.; Towers, G. Flavonoids of Equisetum species. Phytochemistry 1972, 11, 1095–1099. [Google Scholar] [CrossRef]
  11. Suzuki, K.-I.; Homma, T. Isolation and chemical structure of flavonoids from the horsetails (Equisetum Arvense L.). J. Adv. Sci. 1997, 9, 104–105. [Google Scholar] [CrossRef]
  12. Syrchina, A.; Gorokhova, V.; Tyukavkina, N.; Babkin, V.; Voronkov, M. Flavonoid glycosides of spore-bearing stems of Equisetum arvense. Chem. Nat. Compd. 1980, 16, 245–248. [Google Scholar] [CrossRef]
  13. Veit, M.; Bauer, K.; Beckert, C.; Kast, B.; Geiger, H.; Czygan, F.-C. Phenolic characters of British hybrid taxa in Equisetum subgenus Equisetum. Biochem. Syst. Ecol. 1995, 23, 79–87. [Google Scholar] [CrossRef]
  14. Veit, M.; Bauer, K.; Geiger, H.; Czygan, F.-C. Flavonoids of Equisetum hybrids in the subgenus Equisetum. Planta Med. 1992, 58, 697. [Google Scholar] [CrossRef]
  15. Veit, M.; Beckert, C.; Höhne, C.; Bauer, K.; Geiger, H. Interspecific and intraspecific variation of phenolics in the genus Equisetum subgenus Equisetum. Phytochemistry 1995, 38, 881–891. [Google Scholar] [CrossRef]
  16. Veit, M.; Czygan, F.-C.; Geiger, H. Seasonal and intraspecific variations in flavonoids of Equisetum arvense. Planta Med. 1991, 57, A3–A4. [Google Scholar] [CrossRef]
  17. Veit, M.; Czygan, F.-C.; Geiger, H.; Markham, K. Flavonoids in Equisetum x litorale. Planta Med. 1990, 56, 578–579. [Google Scholar] [CrossRef]
  18. Veit, M.; Czygan, F.-C.; Witte, L.; Markham, K.; Geiger, H. New Kaempferol glycosides from Equisetum species. Z. Für Nat. B 1993, 48, 1398–1400. [Google Scholar] [CrossRef]
  19. Veit, M.; Geiger, H.; Czygan, F.-C.; Markham, K.R. Malonylated flavone 5-O-glucosides in the barren sprouts of Equisetum arvense. Phytochemistry 1990, 29, 2555–2560. [Google Scholar] [CrossRef]
  20. Veit, M.; Strack, D.; Czygan, F.-C.; Wray, V.; Witte, L. Di-E-caffeoyl-meso-tartaric acid in the barren sprouts of Equisetum arvense. Phytochemistry 1991, 30, 527–529. [Google Scholar] [CrossRef]
  21. Veit, M.; Weidner, C.; Strack, D.; Wray, V.; Witte, L.; Czygan, F.-C. The distribution of caffeic acid conjugates in the Equisetaceae and some ferns. Phytochemistry 1992, 31, 3483–3485. [Google Scholar] [CrossRef]
  22. Weidner, C.; Veit, M.; Czygan, F.-C. Accumulation dynamics of caffeic acid conjugates in Equisetum arvense. Planta Med. 1991, 57, A37. [Google Scholar] [CrossRef]
  23. Cyronak, M.J.; Britton, G.; Simpson, K.L. Rhodoxanthin, the red pigment of Equisetum arvense shoots. Phytochemistry 1977, 16, 612–613. [Google Scholar] [CrossRef]
  24. D’Agostino, M.; Dini, A.; Pizza, C.; Senatore, F.; Aquino, R. Sterols from Equisetum arvense. Boll. Della Soc. Ital. Di Biol. Sper. 1984, 60, 2241–2245. [Google Scholar]
  25. Takatsuto, S.; Abe, H.; Gamoh, K. Evidence for Brassinosteroids in Strobilus of Equisetum arvense L. Agr. Biol. Chem. Tokyo 1990, 54, 1057–1059. [Google Scholar] [CrossRef]
  26. Takatsuto, S.; Abe, H. Sterol Composition of the Strobilus of Equisetum arvense L. Biosci. Biotechnol. Biochem. 1992, 56, 834–835. [Google Scholar] [CrossRef] [Green Version]
  27. Veit, M.; Geiger, H.; Kast, B.; Beckert, C.; Horn, C.; Markham, K.R.; Wong, H.; Czygan, F.-C. Styrylpyrone glucosides from Equisetum. Phytochemistry 1995, 39, 915–917. [Google Scholar] [CrossRef]
  28. Veit, M.; Geiger, H.; Wray, V.; Abou-Mandour, A.; Rozdzinski, W.; Witte, L.; Strack, D.; Czygan, F.-C. Equisetumpyrone, a styrylpyrone glucoside in gametophytes from Equisetum arvense. Phytochemistry 1993, 32, 1029–1032. [Google Scholar] [CrossRef]
  29. Cheng, J.T.; He, J.; Li, X.Y.; Wu, X.D.; Shao, L.D.; Dong, L.B.; Deng, X.; Gao, X.; Peng, L.Y.; Cheng, X. Three New Sucrose Fatty Acid Esters from Equisetum hiemale L. Helv. Chim. Acta 2012, 95, 1158–1163. [Google Scholar] [CrossRef]
  30. Ang, A.M.G.; Peteros, N.P.; Uy, M.M. Antioxidant and Toxicity Assay-guided Isolation of Herniarin from Equisetum debile Roxb.(Equisetaceae). Asian J. Biol. Life Sci. 2019, 8, 31. [Google Scholar] [CrossRef] [Green Version]
  31. Brune, T.; Haas, K. Equisetum species show uniform epicuticular wax structures but diverse composition patterns. AoB Plants 2011, 2011, plr009. [Google Scholar] [CrossRef] [Green Version]
  32. Wei, Z.-F.; Chen, Y.-H.; Sung, P.-J.; Wang, G.-H.; Liou, J.-R.; Wang, S.-Y.; Chang, S.-T.; Zu, Y.G.; Chiang, M.Y.; Fu, Y.-J. Equisetumone, a novel 4-5-olide secocaryophyllane sesquiterpene from Equisetum palustre. RSC Adv. 2014, 4, 45749–45752. [Google Scholar] [CrossRef]
  33. Chang, J.; Xuan, L.-J.; Xu, Y.-M. Three new phenolic glycosides from the fertile sprouts of Equisetum arvense. J. Integr. Plant Biol. 2001, 43, 193. [Google Scholar]
  34. Jin, M.; Zhang, C.; Zheng, T.; Yao, D.; Shen, L.; Luo, J.; Jiang, Z.; Ma, J.; Jin, X.-J.; Cui, J. A new phenyl glycoside from the aerial parts of Equisetum hyemale. Nat. Prod. Res. 2014, 28, 1813–1818. [Google Scholar] [CrossRef]
  35. Kanchanapoom, T.; Otsuka, H.; Ruchirawat, S. Megastigmane glucosides from Equisetum debile and E. diffusum. Chem. Pharm. Bull. 2007, 55, 1277–1280. [Google Scholar] [CrossRef] [PubMed] [Green Version]
  36. Tan, J.-M.; Qiu, Y.-H.; Tan, X.-Q.; Tan, C.-H.; Xiao, K. Chemical constituents of Equisetum debile. J. Asian Nat. Prod. Res. 2011, 13, 811–816. [Google Scholar] [CrossRef] [PubMed]
  37. Thai, T.H.; Hung, N.Q.; Van Minh, C.; Cuong, N.X.; Yen, P.H.; Huong, L.M.; Van Kiem, P. Chemical constituents of Equisetum debile and their cytotoxic activity. Nat. Prod. Commun. 2008, 3, 1903–1906. [Google Scholar] [CrossRef] [Green Version]
  38. Wiedenfeld, H.; Cetto, A.A.; Amador, C.P. Flavonol glycosides from Equisetum myriochaetum. Biochem. Syst. Ecol. 2000, 28, 395–397. [Google Scholar] [CrossRef] [Green Version]
  39. Xu, X.H.; Tan, C.H.; Jiang, S.H.; Zhu, D.Y. Debilosides A–C: Three New Megastigmane Glucosides from Equisetum debile. Helv. Chim. Acta 2006, 89, 1422–1426. [Google Scholar] [CrossRef]
  40. Sandhu, N.S.; Kaur, S.; Chopra, D. Equisetum arvense: Pharmacology and phytochemistry-a review. Asian J. Pharm. Clin. Res. 2010, 3, 146–150. [Google Scholar]
  41. Hohlfeld, M.; Veit, M.; Strack, D. Hydroxycinnamoyltransferases involved in the accumulation of caffeic acid esters in gametophytes and shoots of Equisetum arvense. Plant Physiol. 1996, 111, 1153–1159. [Google Scholar] [CrossRef] [Green Version]
  42. Beckert, C.; Horn, C.; Schnitzler, J.-P.; Lehning, A.; Heller, W.; Veit, M. Styrylpyrone biosynthesis in Equisetum arvense. Phytochemistry 1997, 44, 275–283. [Google Scholar] [CrossRef]
  43. Herderich, M.; Beckert, C.; Veit, M. Establishing styrylpyrone synthase activity in cell free extracts obtained from gametophytes of Equisetum arvense L. by high performance liquid chromatography–tandem mass spectrometry. Phytochem. Anal. Int. J. Plant Chem. Biochem. Tech. 1997, 8, 194–197. [Google Scholar] [CrossRef]
  44. Liou, G.; Chiang, Y.-C.; Wang, Y.; Weng, J.-K. Mechanistic basis for the evolution of chalcone synthase catalytic cysteine reactivity in land plants. J. Biol. Chem. 2018, 293, 18601–18612. [Google Scholar] [CrossRef] [PubMed] [Green Version]
  45. Cuthbertson, D.; Piljac-Žegarac, J.; Lange, B.M. Validation of a microscale extraction and high-throughput UHPLC-QTOF-MS analysis method for huperzine A in Huperzia. Biomed. Chromatogr. 2012, 26, 1191–1195. [Google Scholar] [CrossRef] [PubMed] [Green Version]
  46. Cuthbertson, D.J.; Johnson, S.R.; Piljac-Zegarac, J.; Kappel, J.; Schafer, S.; Wust, M.; Ketchum, R.E.; Croteau, R.B.; Marques, J.V.; Davin, L.B.; et al. Accurate mass-time tag library for LC/MS-based metabolite profiling of medicinal plants. Phytochemistry 2013, 91, 187–197. [Google Scholar] [CrossRef] [Green Version]
  47. Lange, B.M. The evolution of plant secretory structures and emergence of terpenoid chemical diversity. Annu. Rev. Plant Biol. 2015, 66, 139–159. [Google Scholar] [CrossRef]
  48. Šamec, D.; Pierz, V.; Srividya, N.; Wüst, M.; Lange, B.M. Assessing chemical diversity in Psilotum nudum (L.) Beauv., a Pantropical whisk fern that has lost many of its fern-like characters. Front. Plant Sci. 2019, 10, 868. [Google Scholar] [CrossRef]
  49. Nokhsorov, V.V.; Dudareva, L.V.; Senik, S.V.; Chirikova, N.K.; Petrov, K.A. Influence of Extremely Low Temperatures of the Pole of Cold on the Lipid and Fatty-Acid Composition of Aerial Parts of the Horsetail Family (Equisetaceae). Plants 2021, 10, 996. [Google Scholar] [CrossRef]
  50. Czeczuga, B. Carotenoid contents in leaves grown under various light intensities. Biochem. Syst. Ecol. 1987, 15, 523–527. [Google Scholar] [CrossRef]
  51. Veit, M.; Abou-Mandour, A.; Czygan, F.-C. Phenolics from gametophytes of Equisetum arvense. Planta Med. 1991, 57, A36. [Google Scholar] [CrossRef]
  52. Francescato, L.N.; Debenedetti, S.L.; Schwanz, T.G.; Bassani, V.L.; Henriques, A.T. Identification of phenolic compounds in Equisetum giganteum by LC–ESI-MS/MS and a new approach to total flavonoid quantification. Talanta 2013, 105, 192–203. [Google Scholar] [CrossRef] [PubMed] [Green Version]
  53. Nisar, N.; Li, L.; Lu, S.; Khin, N.C.; Pogson, B.J. Carotenoid metabolism in plants. Mol. Plant 2015, 8, 68–82. [Google Scholar] [CrossRef] [Green Version]
  54. Barros, J.; Dixon, R.A. Plant phenylalanine/tyrosine ammonia-lyases. Trends Plant Sci. 2020, 25, 66–79. [Google Scholar] [CrossRef] [PubMed]
  55. Pluskal, T.; Torrens-Spence, M.P.; Fallon, T.R.; De Abreu, A.; Shi, C.H.; Weng, J.-K. The biosynthetic origin of psychoactive kavalactones in kava. Nat. Plants 2019, 5, 867–878. [Google Scholar] [CrossRef] [PubMed] [Green Version]
  56. Colpitts, C.C. An Investigation into Plant Type III Polyketide Synthases: A Styrylpyrone Synthase from Equisetum Hyemale and Anther-Specific Chalcone Synthase-Like Enzymes from Physcomitrella Patens and Arabidopsis Thaliana; Faculty of Graduate Studies and Research, University of Regina: Regina, SK, Canada, 2009. [Google Scholar]
  57. RStudio Home Page. Available online: https://www.rstudio.com (accessed on 1 April 2022).
  58. The Comprehensive R Archive Network Home Page. Available online: https://cran.r-project.org/ (accessed on 1 April 2022).
  59. Kim, S.; Chen, J.; Cheng, T.; Gindulyte, A.; He, J.; He, S.; Li, Q.; Shoemaker, B.A.; Thiessen, P.A.; Yu, B. PubChem in 2021: New data content and improved web interfaces. Nucleic Acids Res. 2021, 49, D1388–D1395. [Google Scholar] [CrossRef]
  60. Afendi, F.M.; Okada, T.; Yamazaki, M.; Hirai-Morita, A.; Nakamura, Y.; Nakamura, K.; Ikeda, S.; Takahashi, H.; Altaf-Ul-Amin, M.; Darusman, L.K. KNApSAcK family databases: Integrated metabolite–plant species databases for multifaceted plant research. Plant Cell Physiol. 2012, 53, e1. [Google Scholar] [CrossRef] [Green Version]
  61. Fischedick, J.T.; Johnson, S.R.; Ketchum, R.E.B.; Croteau, R.B.; Lange, B.M. NMR spectroscopic search module for Spektraris, an online resource for plant natural product identification—Taxane diterpenoids from Taxus x media cell suspension cultures as a case study. Phytochemistry 2015, 113, 87–95. [Google Scholar] [CrossRef] [Green Version]
  62. Sud, M.; Fahy, E.; Cotter, D.; Azam, K.; Vadivelu, I.; Burant, C.; Edison, A.; Fiehn, O.; Higashi, R.; Nair, K.S. Metabolomics Workbench: An international repository for metabolomics data and metadata, metabolite standards, protocols, tutorials and training, and analysis tools. Nucleic Acids Res. 2016, 44, D463–D470. Available online: https://www.metabolomicsworkbench.org/ (accessed on 1 April 2022). [CrossRef] [Green Version]
  63. Grabherr, M.G.; Haas, B.J.; Yassour, M.; Levin, J.Z.; Thompson, D.A.; Amit, I.; Adiconis, X.; Fan, L.; Raychowdhury, R.; Zeng, Q.; et al. Full-length transcriptome assembly from RNA-Seq data without a reference genome. Nat. Biotechnol. 2011, 29, 644–652. [Google Scholar] [CrossRef] [Green Version]
  64. Martin, M. Cutadapt removes adapter sequences from high-throughput sequencing reads. EMBnet. J. 2011, 17, 10–12. [Google Scholar] [CrossRef]
  65. Lefever, S.; Hellemans, J.; Pattyn, F.; Przybylski, D.R.; Taylor, C.; Geurts, R.; Untergasser, A.; Vandesompele, J.; consortium, R. RDML: Structured language and reporting guidelines for real-time quantitative PCR data. Nucleic Acids Res. 2009, 37, 2065–2069. [Google Scholar] [CrossRef] [PubMed] [Green Version]
  66. Untergasser, A.; Ruijter, J.M.; Benes, V.; van den Hoff, M.J. Web-based LinRegPCR: Application for the visualization and analysis of (RT)-qPCR amplification and melting data. BMC Bioinform. 2021, 22, 398. [Google Scholar] [CrossRef] [PubMed]
  67. Pfaffl, M.W. A new mathematical model for relative quantification in real-time RT–PCR. Nucleic Acids Res. 2001, 29, e45. [Google Scholar] [CrossRef] [PubMed]
Figure 1. Multi-omics analysis of Equisetum samples. (A) Sketch of a fertile and sterile shoot. (B) Experimental design. Abbreviations: E.a., Equisetum arvense; E.h., Equisetum hyemale; E.t., Equisetum telmateia; HPLC–QTOF-MS, high-performance liquid–quadrupole time-of-flight mass spectrometry; RT-qPCR, quantitative real-time polymerase chain reaction; R, rhizome; RNA-Seq, next-generation ribonucleic acid sequencing; Rpl, replicate; S, shoot.
Metabolites 12 00403 g001
Figure 2. Separation of Equisetum sample groups based on a principal component analysis (PCA) of metabolomics data. (A) Scree plot indicating that the first three principal components (PCs) explain 74% of variance across datasets. (B) Three-dimensional PCA plot visualizing the separation of samples from Equisetum arvense shoots (red pyramids), Equisetum arvense rhizomes (black spheres), Equisetum hyemale shoots blue cubes), Equisetum hyemale rhizomes (green cubes), Equisetum telmateia shoots (magenta pyramids), and Equisetum telmateia rhizomes (teal spheres).
Metabolites 12 00403 g002
Figure 3. Classification of molecular features contributing most strongly to Equisetum sample group separation in PCA, organized by patterns of accumulation: (A) highly positive PC1 scores; (B) strongly negative PC1 scores; (C) highly positive PC2 scores; (D) strongly negative PC2 scores; (E) highly positive PC3 scores; (F) strongly negative PC3 scores. Abbreviations: E.a., Equisetum arvense; E.h., Equisetum hyemale; E.t., Equisetum telmateia; m/z, mass-to-charge ratio; Rt, retention time.
Metabolites 12 00403 g003
Figure 4. Representative structures of the main classes of specialized metabolites detected in Equisetum samples and outline of the relevant biochemical pathways. Enzymes selected for follow-up research (by assessing the expression levels of the corresponding genes) are shown in blue font.
Metabolites 12 00403 g004
Figure 5. RT-qPCR analysis of expression patterns of selected genes (expressed as fold-change of shoot (gray column) versus rhizomes (white column); standard errors shown as bars): (A) chalcone synthase; (B) phenylalanine ammonia lyase; (C) monogalactosyldiacylglycerol synthase; (D) digalactosyldiacylglycerol synthase; (E) p-coumaroyltriacetic acid synthase; (F) transcript corresponding to the sequence of contig DN52675 (obtained during assembly of RNA-Seq data for E. telmateia rhizomes). Abbreviations: S, shoot; R, rhizome. The p-values obtained with a two-tiered Student’s t-test are shown in italics (comparison shoot versus rhizome for each species).
Metabolites 12 00403 g005
Table 1. Annotation of HPLC–QTOF-MS peaks.
Accurate Mass—Time TagMonoisotopic Mass (Measured/Calculated)ΔppmMolecular
Formula
MS (ESI-Positive)
(* Most Abundant)
Tentative AnnotationReferences;
Evidence Level, Standard Source
Phenolic acids, phenolic acid conjugates, and phenolic glycosides
BML-LCMS-19-
1.71–148.0521
148.0521/148.05242.29C9H8O2[M + H]+ 149.0594
[M + NH4]+ 166.0867 *
Cinnamic acid[13,15];
2
BML-LCMS-19-
3.40–312.0438
312.0438/312.04812.98C13H12O9[M + Na]+ 335.0371 *Caffeoyl tartaric acid (caftaric acid)[13,15];
4, Sigma Aldrich 88,656
BML-LCMS-19-
4.53–264.1465
264.1465/264.14741.34C14H20N2O3[M + H]+ 265.1552 *
[M + Na]+ 287.1366
FeruloylputrescineNo reference;
1
BML-LCMS-19-
7.24–416.1686
416.1686/416.16820.62C19H28O10[M + Na]+ 439.1579 *Equisetumoside A or B[33];
(2)
BML-LCMS-19-
7.79–414.1533
414.1533/414.15261.38C19H26O10[M + Na]+ 437.1426 *Equisetumoside D[37];
(2)
BML-LCMS-19-
10.64–310.1246
310.1246/310.12050.55C19H18O4[M + H]+ 311.1281 *ConiferylcinnamateNo reference;
1
BML-LCMS-19-
12.15–474.0793
474.0793/474.07980.60C22H18O12[M + Na]+ 497.0690 *Dicaffeoyltartaric acid (chicoric acid)[13,15,20,51];
(4) Cayman 24,960
Flavonoid glycosides
BML-LCMS-19-
6.08–772.2065
772.2065/772.20620.93C33H40O21[M + H]+ 773.2147 *Kaempferol 3-O-sophoroside-7-O-glucoside[13,15];
3
BML-LCMS-19-
7.05–626.1473
626.1473/626.14831.93C27H30O17[M + H]+ 627.1545 *Quercetin-3,7-di-O-glucoside[13,15];
3
BML-LCMS-19-
8.06–448.1008
448.1008/448.10060.37C21H20O11[M + H]+ 449.1079 *Luteolin-5-O-glucoside[13,15,51,52];
4, Sigma Aldrich 1,370,837
BML-LCMS-19-
8.06–610.1522
610.1522/610.15340.37C27H30O16[M + H]+ 611.1614 *
[M + Na]+ 633.1432
Kaempferol-3,7-O-di-glucoside[13,15];
3
BML-LCMS-18-
8.20–756.2103
756.2103/756.21130.75C33H40O20[M + H]+ 757.2181 *Kaempferol-3-O-rutinoside-7-O-glucoside[13,15];
3
BML-LCMS-19-
9.95–610.1540
610.1540/610.15341.23C27H30O16[M + H]+ 611.1622
[M + Na]+ 633.1438 *
Kaempferol-3-O-sophoroside[13,15];
3
BML-LCMS-19-
10.60–464.0962
464.0962/464.09551.02C21H20O12[M + H]+ 465.1036 *
[M + Na]+ 487.0849
Quercetin 3-glucoside (isoquercitrin)[13,15,51,52];
4, Sigma Aldrich 00140585
BML-LCMS-19-
11.78–448.1015
448.1015/448.10060.01C21H20O11[M + Na]+ 471.0900 *Kaempferol-3-O-glucoside (astragalin)[13,15,51,52];
4, Cayman 25,060
Styrylpyrone glycosides
BML-LCMS-19-
6.68–586.1530
586.1530/586.15340.51C25H30O16[M + H]+ 587.2013 *3-Hydroxyhispidin-3,4’-di-O-glucoside[52];
3
BML-LCMS-19-
8.39–424.1013
424.1013/424.10061.37C19H20O11[M + H]+ 425.1085 *
[M + Na]+ 447.0903
Equisetumpyrone[28,52];
3
BML-LCMS-19-
9.97–408.1065
408.1065/408.10561.31C19H20O10[M + H]+ 409.1136 *
[M + Na]+ 431.0957
3’-Deoxyequisetumpyrone[27];
3
BML-LCMS-19-
10.97–438.1173
438.1173/438.11621.63C20H22O11[M + H]+ 439.1245 *
[M + Na]+ 461.1064
4’-O-Methylequisetumpyrone[27];
3
Carotenoids and apocarotenoids
BML-LC-MS-18-
8.28–388.2094
388.2094/388.20970.72C19H32O8[M + Na]+ 411.1991 *Debiloside B[39];
2
BML-LCMS-19-
30.60–580.3882
580.3882/580.39161.88C40H52O3[M + H]+ 581.3978 *CarotenoidNo reference;
1
BML-LMS-19-
31.75–582.4068
582.4068/582.40730.03C40H54O3[M + H]+ 583.4142 *CarotenoidNo reference;
1
BML-LCMS-19-
31.91–616.4125
616.4125/616.41280.05C40H56O5[M + Na]+ 639.4013 *CarotenoidNo reference;
1
BML-LCMS-19-
33.83–600.4177
600.4177/600.41790.63C40H56O4[M + H]+ 601.4246 *Violaxanthin[53];
4, Sigma Aldrich 52,444
Lipids
BML-LCMS-19-
21.01–486.2827
486.2827/486.28292.55C25H42O9[M + NH4]+ 504.3157 [M + Na]+ 509.2718 *16:3-GlycosylmonoacylglycerolNo reference;
1
BML-LCMS-19-
21.36–486.2815
486.2815/486.28292.83C25H42O9[M + NH4]+ 504.3157
[M + Na]+ 509.2714 *
[M + K]+ 525.2461
16:3-GlycosylmonoacylglycerolNo reference;
1
BML-LCMS-19-
31.15–908.5494
908.5494/908.54970.79C49H80O15[M + NH4]+ 926.6327
[M + Na]+ 931.5382 *
Digalactosyldiacylglycerol (34:6)[49];
4, Avanti 840,524 (mix)
BML-LCMS-19-
31.97–910.5640
910.5640/910.56541.55C49H82O15[M + Na]+ 933.5536 *
[M + K]+ 949.5267
Digalactosyldiacylglycerol (34:5)[49];
4, Avanti 840,524 (mix)
BML-LCMS-19-
32.47–936.5790
936.5790/936.58101.36C51H84O15[M + NH4]+ 954.6140
[M + Na]+ 959.5708 *
Digalactosyldiacylglycerol (36:6)[49];
4, Avanti 840,524 (mix)
BML-LCMS-19-
33.31–938.5952
938.5952/938.59670.15C51H86O15[M + Na]+ 961.5872 *Digalactosyldiacylglycerol (36:5)No reference;
1
BML-LCMS-19-
33.70–746.4962
746.4962/746.49690.03C43H70O10[M + NH4]+ 764.5311 *
[M + Na]+ 769.4859
Monogalactosyldiacylglycerol (34:6)[49];
4, Avanti 840,523 (mix)
BML-LCMS-19-
33.94–914.5952
914.5952/914.59670.71C49H86O15[M + NH4]+ 932.6303
[M + Na]+ 937.5848 *
Digalactosyldiacylglycerol (34:3)[49];
4, Avanti 840,524 (mix)
BML-LCMS-19-
34.19–940.6076
940.6076/940.61230.19C51H88O15[M + Na]+ 963.6026 *Digalactosyldiacylglycerol (36:4)[49];
4, Avanti 840,524 (mix)
BML-LCMS-19-
34.77–916.6117
916.6117/916.61230.94C49H88O15[M + NH4]+ 934.6454
[M + Na]+ 939.6016 *
Digalactosyldiacylglycerol (34:2)[49];
4, Avanti 840,524 (mix)
BML-LC-MS-18-
35.02–774.5274
774.5274/774.52820.34C45H74O10[M + NH4]+ 792.5619 *
[M + Na]+ 797.5171
Monogalactosyldiacylglycerol (36:6)[49];
4, Avanti 840,523 (mix)
BML-LC-MS-18-
35.46–750.5278
750.5278/750.52820.66C43H74O10[M + NH4]+ 768.5588
[M + Na]+ 773.5169 *
Monogalactosyldiacylglycerol (34:4)[49];
4, Avanti 840,523 (mix)
BML-LC-MS-18-
35.86–776.5443
776.5443/776.54380.61C45H76O10[M + Na]+ 799.5325 *Monogalactosyldiacylglycerol (36:5)[49];
4, Avanti 840,523 (mix)
BML-LC-MS-18-
36.54–752.5428
752.5428/752.54381.04C43H76O10[M + NH4]+ 770.5775
[M + Na]+ 775.5325 *
Monogalactosyldiacylglycerol (34:3)[49];
4, Avanti 840,523 (mix)
BML-LC-MS-18-
36.72–778.5575
778.5575/778.55951.13C45H78O10[M + H]+ 779.5910
[M + NH4]+ 796.5930
[M + Na]+ 801.5480 *
Monogalactosyldiacylglycerol (36:4)[49];
4, Avanti 840,523 (mix)
BML-LC-MS-18-
37.32–754.5557
754.5557/754.55951.70C43H78O10[M + NH4]+ 772.5921
[M + Na]+ 777.5483 *
Monogalactosyldiacylglycerol (36:2)No reference;
1
Publisher’s Note: MDPI stays neutral with regard to jurisdictional claims in published maps and institutional affiliations.

