Article

Metabolomic Study of High-Fat Diet-Induced Obese (DIO) and DIO Plus CCl4-Induced NASH Mice and the Effect of Obeticholic Acid

1
Shanghai Institute of Materia Medica, Chinese Academy of Sciences, Shanghai 201203, China
2
State Key Laboratory of Drug Research, Shanghai Institute of Materia Medica, Chinese Academy of Sciences, Shanghai 201203, China
3
University of Chinese Academy of Sciences, Beijing 100049, China
*
Authors to whom correspondence should be addressed.
These authors contributed equally to this work.
Metabolites 2021, 11(6), 374; https://doi.org/10.3390/metabo11060374
Submission received: 8 May 2021 / Revised: 3 June 2021 / Accepted: 4 June 2021 / Published: 10 June 2021
(This article belongs to the Section Endocrinology and Clinical Metabolic Research)

Abstract

:
The pathophysiology of nonalcoholic fatty liver disease (NAFLD) is a complex process involving metabolic and inflammatory changes in livers and other organs, but the pathogenesis is still not well clarified. Two mouse models were established to study metabolic alteration of nonalcoholic fatty liver and nonalcoholic steatohepatitis, respectively. The concentrations of metabolites in serum, liver and intestine content were measured by the AbsoluteIDQ® p180 Kit (Biocrates Life Sciences, Innsbruck, Austria). Multivariate statistical methods, pathway analysis, enrichment analysis and correlation analysis were performed to analyze metabolomic data. The metabolic characteristics of liver, serum and intestine content could be distinctly distinguished from each group, indicating the occurrence of metabolic disturbance. Among them, metabolic alteration of liver and intestine content was more significant. Based on the metabolic data of liver, 19 differential metabolites were discovered between DIO and control, 12 between DIO-CCl4 and DIO, and 47 between DIO-CCl4 and normal. These metabolites were mainly associated with aminoacyl-tRNA biosynthesis, nitrogen metabolism, lipid metabolism, glyoxylate and dicarboxylate metabolism, and amino metabolism. Further study revealed that the intervention of obeticholic acid (OCA) could partly reverse the damage of CCl4. The correlation analysis of metabolite levels and clinical parameters showed that phosphatidylcholines were negatively associated with serum alanine aminotransferase, aspartate aminotransferase, NAFLD activity score, and fibrosis score, while lysophosphatidylcholines, sphingomyelins, amino acids, and acylcarnitines shared the reverse pattern. Our study investigated metabolic alteration among control, NAFLD model, and OCA treatment groups, providing preclinical information to understand the mechanism of NAFLD and amelioration of OCA.

1. Introduction

Nonalcoholic fatty liver disease (NAFLD), characterized by excessive cytoplasmic retention of triglyceride, is one of the most common form of chronic liver disease [1,2]. It encompasses a spectrum of conditions ranging from non-progressive nonalcoholic fatty liver (NAFL) to progressive nonalcoholic steatohepatitis (NASH) and is strongly associated with metabolic syndrome (obesity, type 2 diabetes mellitus, dyslipidaemia and hypertension) [3,4]. However, the mechanisms of the development of simple steatosis (NAFL) and the following transition to steatosis, inflammation, ballooning, and/or fibrosis (NASH) are still not well understood. A previous human study has revealed that the gut epithelial permeability was increased in NAFLD patients, led to a higher exposure of intestine-derived bacterial products such as fatty acids, LPS, bile acids to liver, which would exacerbate the hepatic inflammation and dyslipidaemia [5]. To further understand the metabolic and inflammatory changes of the involved multi-organ in NAFLD pathogenesis, we explore the metabolites in serum, liver and intestine content of control, high-fat diet (HFD)-fed obese (DIO) mice, HFD plus carbon tetrachloride treatment (DIO-CCl4) mice, and performed correlation analysis among metabolites, hepatic histology characterization and other biochemistry makers. Moreover, OCA, a farnesoid X-receptor (FXR) agonist finished with Phase III clinical trials was administered to DIO-CCl4 mice, and correlation analysis among metabolites and the OCA-mediated amelioration in NASH marker was performed. Preclinical information was provided in the present study and might be helpful to understand the mechanism of NAFLD and drug modulation.
Metabolites, as the downstream products of other biomolecules (such as genes, mRNAs and proteins), actively interact with all levels of biomolecules, thus play essential and crucial roles in biological systems [6,7,8,9]. Based on the concentrations and variations of metabolites, systematic metabolic changes caused by internal or external disturbances such as diet, environment, drug and genetic effects could be directly learned [8,10,11]. Moreover, metabolite-driven phenotype modulation has been discovered, such as modulation of neuronal excitability and plasticity by lactate [12], modulation of macrophage activation and regulation of immunity by α-ketoglutarate [13], and taurine-induced myelin basic protein expression [14]. Metabolomics specializes in the analysis of metabolites; hence it is considered as a useful approach to understand the pathogenesis and related mechanisms of NASH.
In addition, a lot of scientists have paid substantial efforts in drug development of NAFLD. Nowadays, several drugs were on clinical trials. Obeticholic acid (OCA), as the first-in-class of FXR ligands, has been approved in May 2016 for the treatment of primary biliary cholangitis (PBC). And the current studies are still ongoing for its potential in the treatment of NASH [15]. However, the mechanisms by which OCA can attenuate metabolically induced inflammation and associated pathways leading to NASH remain not well understood, and the investigation of metabolomics is deficient. Our research anticipated to provide metabolic clues to understand the mechanism of the treatment of OCA.
In this study, we established NAFLD models (DIO group as NAFL-like model and DIO-CCl4 group as NASH-like model) in mice. Then we applied a target metabolomic approach to analyze metabolic alteration of liver, serum and intestine content. The differential metabolites among NAFLD models and control were discovered by multivariate (MVA) statistical methods, and the disturb pathway was also analyzed. In addition, the correlation analysis was also performed to give insight into association between differential metabolites (among NAFLD models and control group) and clinical parameters. Depending on the metabolic results of liver, the correlation with modulated effect of OCA for the treatment of NASH was also investigated.

2. Results

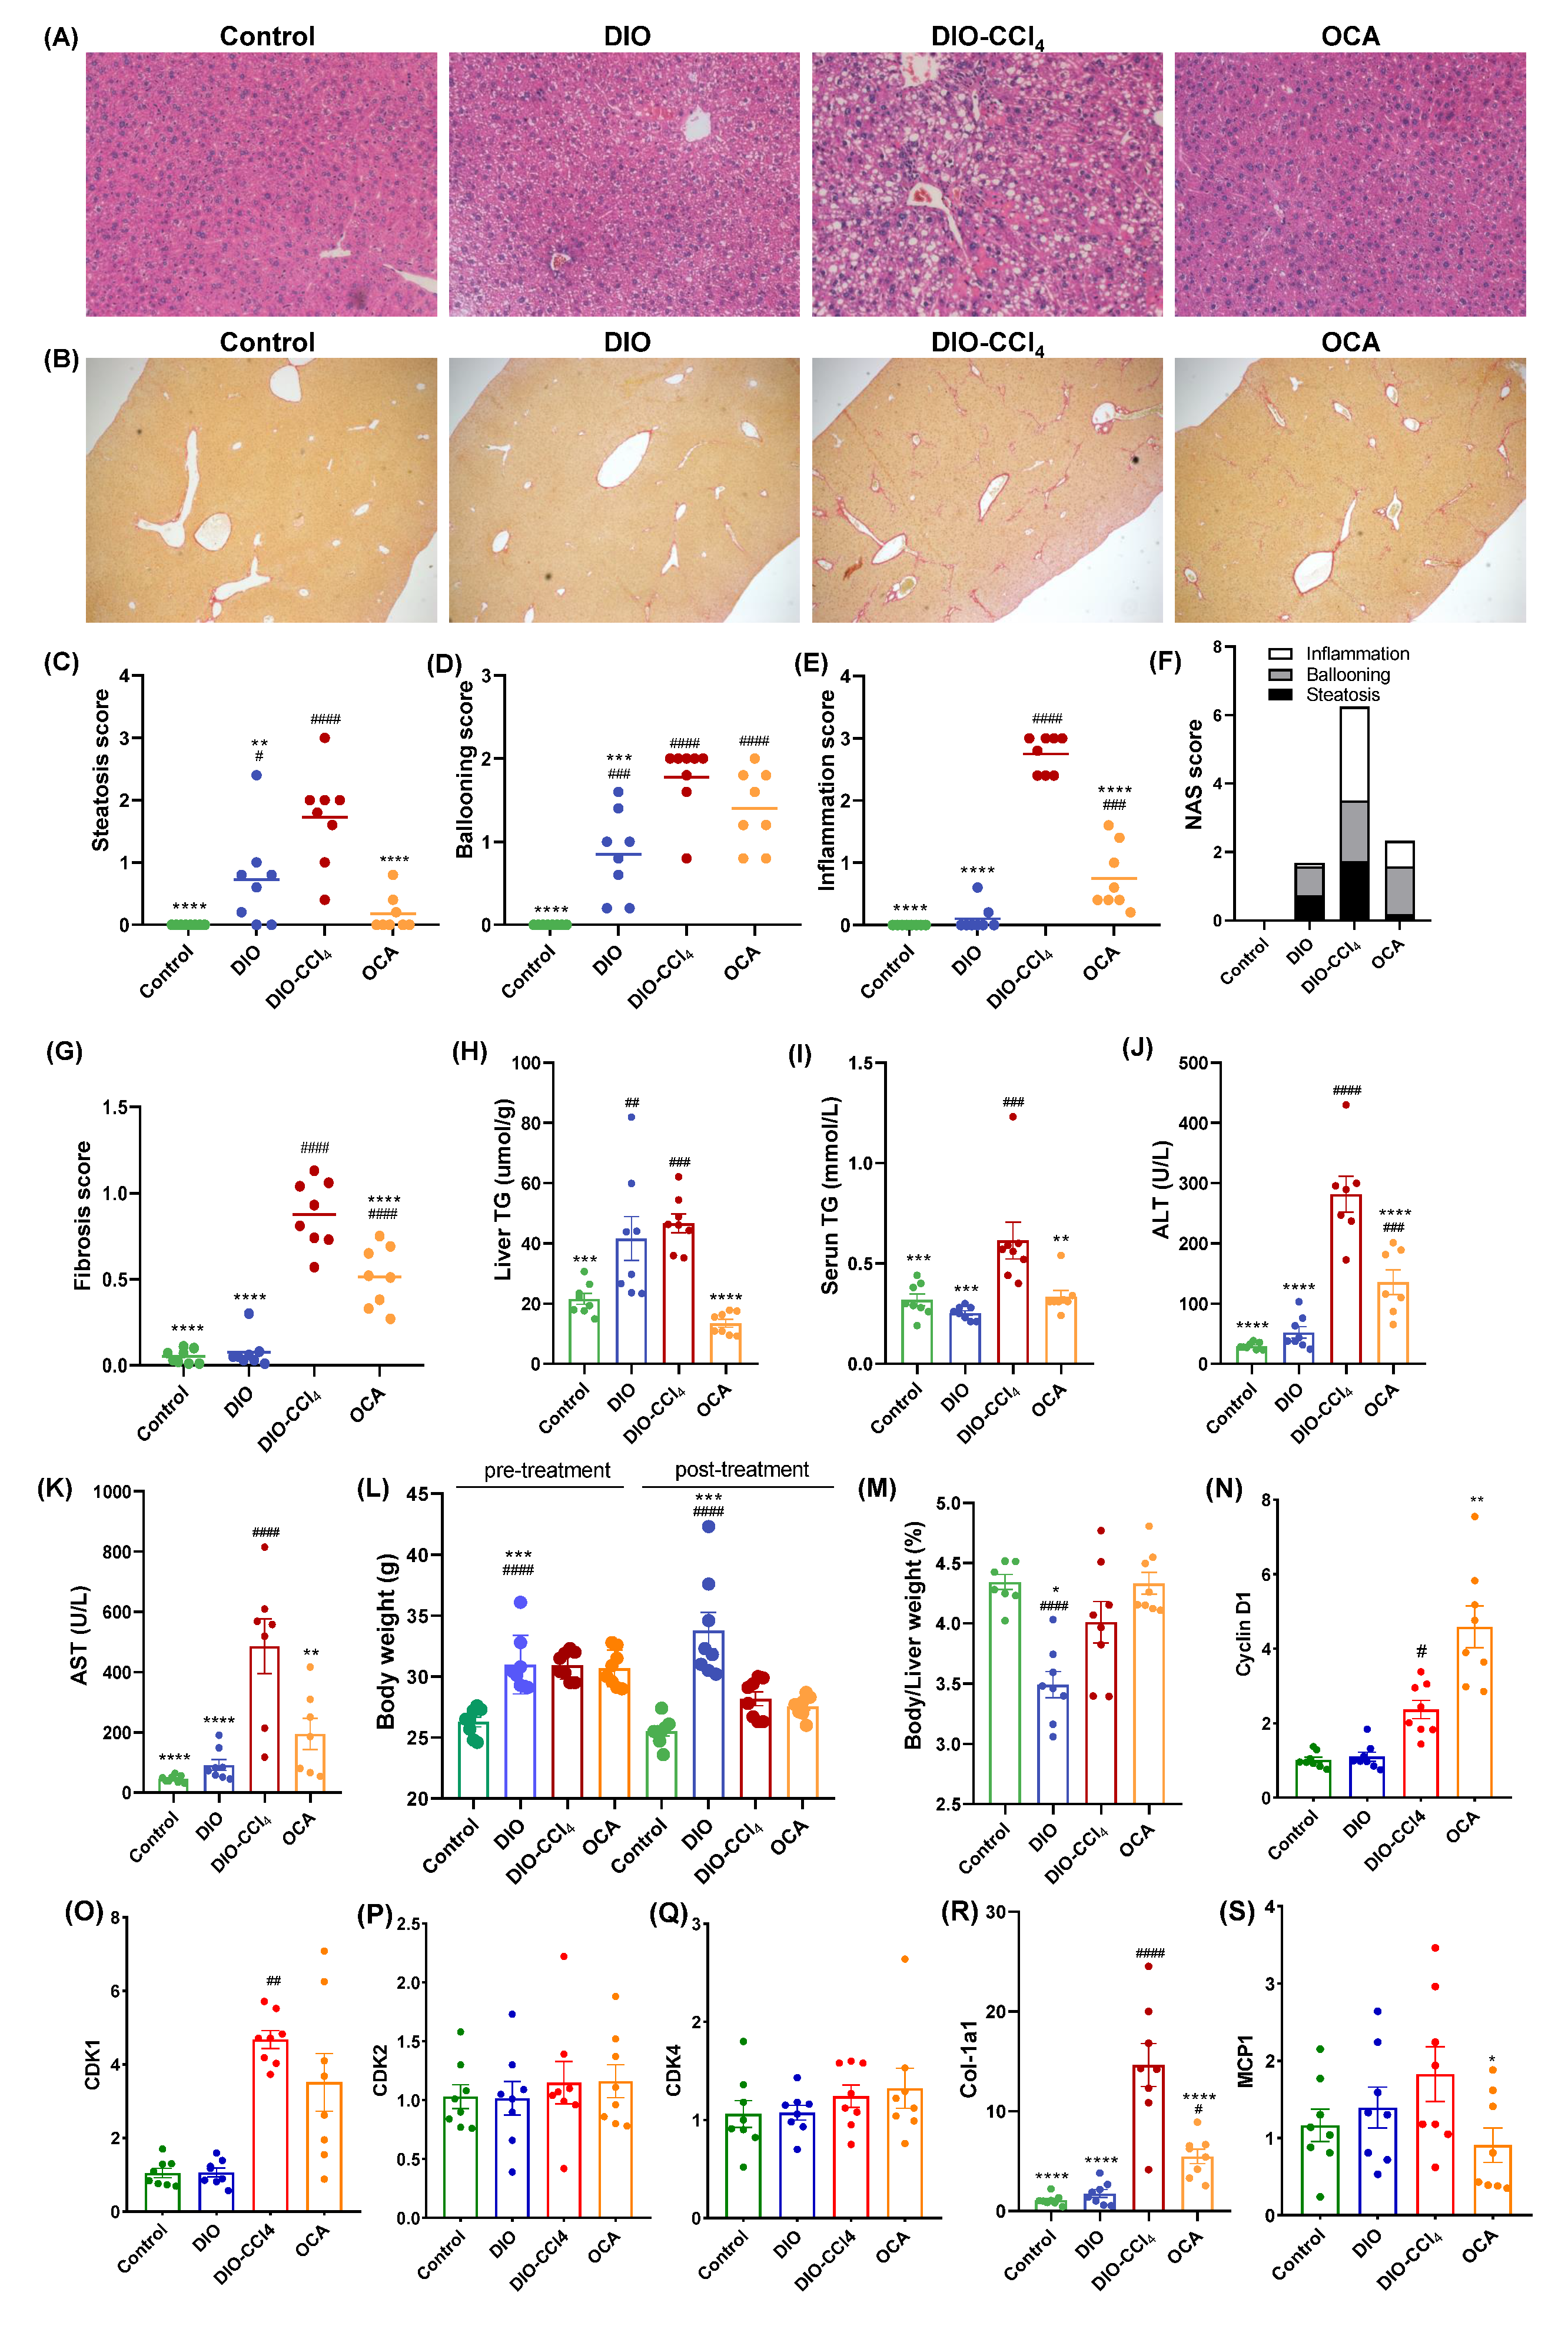
2.1. The Histological Characteristics of NAFLD Models and OCA Group

The high-fat diet (HFD) fed obese mice, exhibiting fatty liver but not steatohepatitis, were established as NAFL-like murine model [16]. In accordance with the literature, HFD-induced obesity supplemented with multiple administration of CCl4 is sufficient to establish a NASH-like murine model that mimics several features of human NASH [16]. As shown in Figure 1A, the results of the histological examination, using H&E staining, revealed that HFD induced steatosis in the livers of DIO group. Consistent with previous reports, co-treatment with CCl4 caused a further hepatocyte ballooning, inflammation, and moderate peri-sinusoidal or peri-portal fibrosis in the livers of DIO-CCl4 group (Figure 1A–G), and significant increases in serum TG, AST, and ALT were observed after CCl4 treatment in DIO mice, when compared with control mice (Figure 1I–K). Accordingly, the hepatic TG level and Col-1a1 expression significantly increased in both DIO and DIO-CCl4 groups compared to the control group (Figure 1H,R). Histological characterization of OCA group was performed, indicating that the treatment of OCA could significantly reduce the steatosis score and liver inflammation score by 89.9% and 72.7%, respectively, compared with vehicle group (Figure 1C,E). Among them, steatosis score showed no significance to that of control group. Treatment with OCA reduced serum ALT by 50.9% and serum AST by 62.9% against the vehicle control (DIO-CCl4). OCA reduced the serum triglycerides l by 45.4% but showed no obvious effect on serum cholesterol. The NAS score was also significantly reduced after OCA treatment, with a 62.8% reduction (Figure 1F), though the ballooning score was almost unchanged. Treatment with OCA reduced serum triglycerides, ALT and AST by 45.4%, 50.9% and 62.9% against the vehicle control (DIO-CCl4), respectively (Figure 1I–K). The liver/body weight ratio (%) of OCA was 8% higher than the DIO-CCl4 group but did not reach statistically significance (Figure 1M). As FXR agonists are known to activate proliferation pathways [17], the impact of OCA on gene expression of cyclin D1, CDK1, CDK2 and CDK4 were investigated. CCl4 treatment caused an increase of cyclin D1 and CDK1 gene expression (Figure 1N,O), while the expression of CDK2 and CDK4 were unaffected (Figure 1P,Q). OCA treatment caused a further increase of cyclin D1. However, the expression of CDK1, CDK2 and CDK4 were unaffected compared to DIO-CCl4 group (Figure 1N–Q). The positive areas of Sirius red staining were reduced by 41.5% after OCA treatment compared with DIO-CCl4 group (Figure 1G), indicating an amelioration in fibrosis. Accordingly, the expression of Col-1a1, a marker of the fibroblast-like phenotype, was increased in DIO-CCl4 group and significantly inhibited by OCA treatment (Figure 1R). Consistent with the lowered inflammation score, the expression of chemokine monocyte chemoattractant protein-1 (MCP-1) in liver was significantly decreased by OCA treatment (Figure 1S).

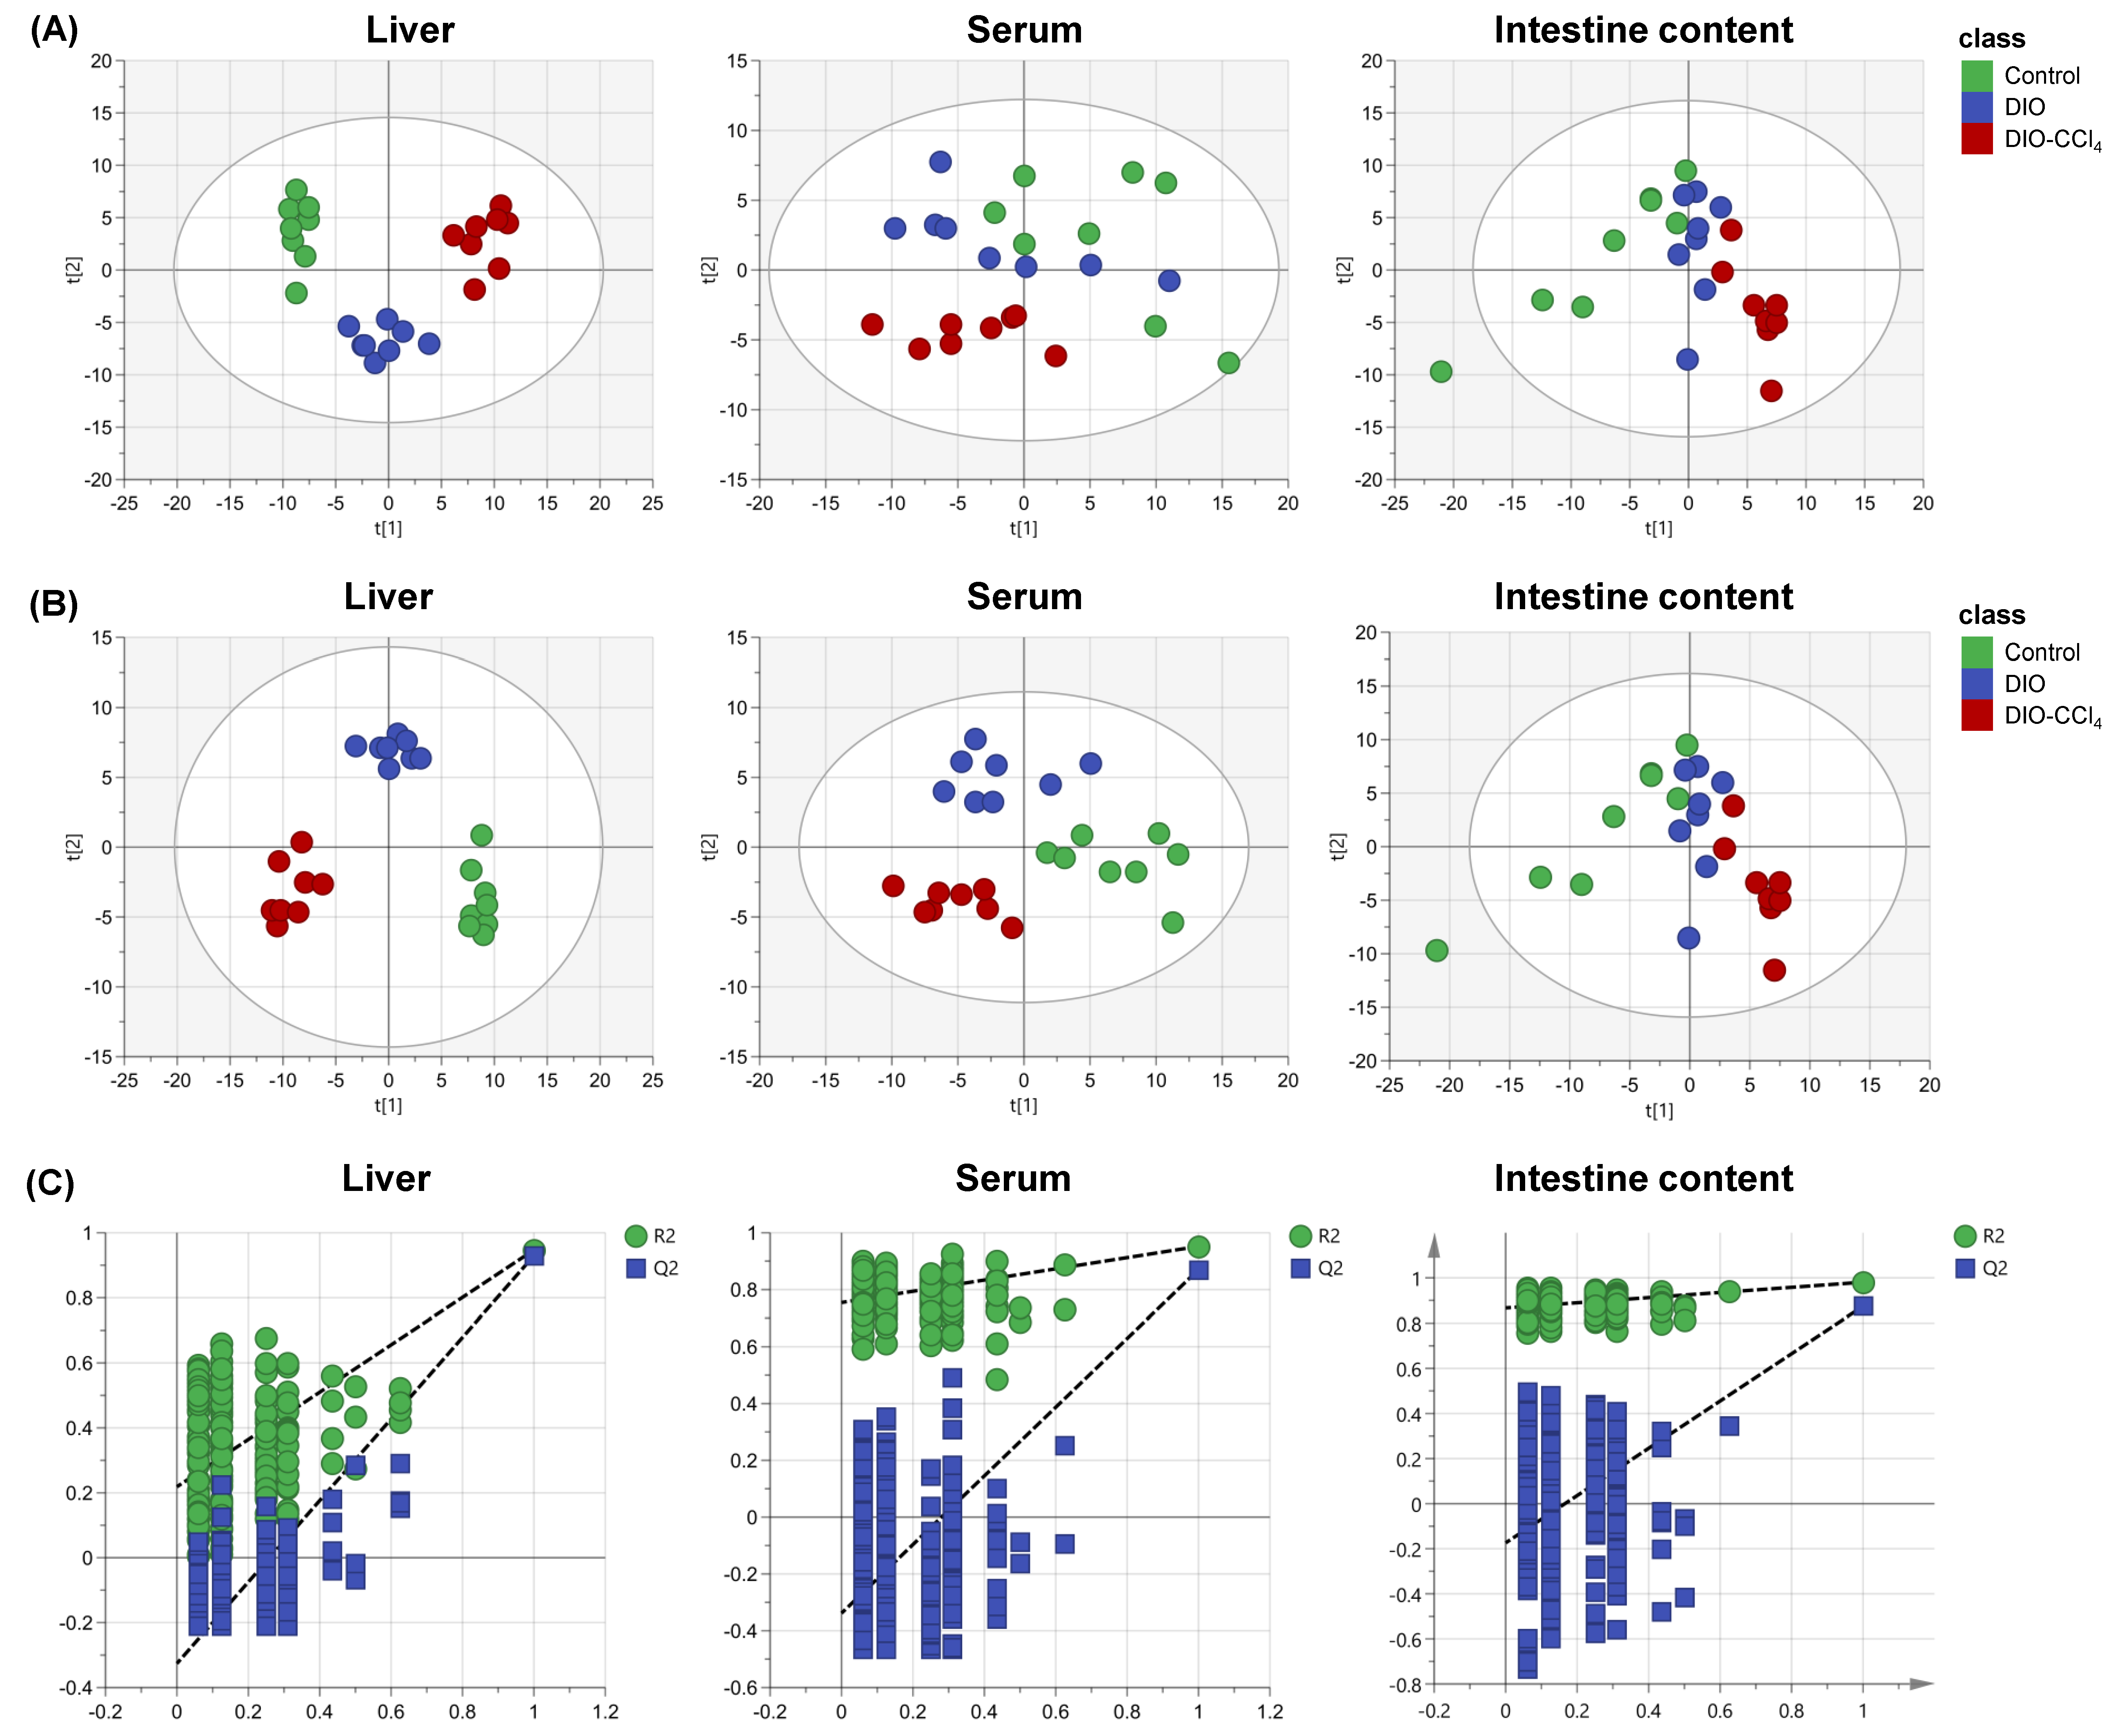
2.2. Metabolic Characteristics of NAFLD Models and Control Group

To obtain the metabolic characteristics of liver, serum and intestine content samples, target metabolomic approach was carried out using the AbsoluteIDQ® p180 Kit (Biocrates Life Sciences, Innsbruck, Austria) which could measure the concentration of 188 metabolites accurately. Multivariate (MVA) statistical analysis was conducted to observe whether the metabolic disturbance was occurred in the NASH models. Firstly, PCA, as a frequent unsupervised model, was established based on the corresponding data (Figure 2A). The results showed that the samples could be well grouped and separated by different groups in liver, serum and intestine content samples. And the aggregation and separation of liver was the best, comparing to serum and intestine content samples. The farthest distance was observed between DIO-CCl4 group and control group in PCA plots, while DIO group was closer to the control. These results further indicated that the disorder in the DIO-CCl4 group might be more significant. And then, a supervised PLS-DA was applied to detect an obvious separation shift among control and NASH model groups (Figure 2B). A clearer discrimination of each group was observed in the PLS-DA score plots. The R2Y and Q2 values indicated good explanation ability and predictive capacity of the model (R2Y intercept of liver, serum and intestine content was 0.925, 0.954 and 0.979, while the Q2 intercept was 0.892, 0.850 and 0.861, respectively). A permutation test with 200 cycles was used for checking whether the model was overfitting (Figure 2C). And the intercepts of R2 and Q2 values suggested that no overfitting was found (R2 intercept of liver, serum and intestine content was 0.219, 0.754 and 0.867, while the Q2 intercept was −0.326, −0.338 and −0.174, respectively). Subsequently, heatmaps of metabolic characteristics of liver, serum and intestine content were carried out to view the data more intuitively (Figure 3A–C). The results of heatmaps were consistent with those of PCA and PLS-DA.

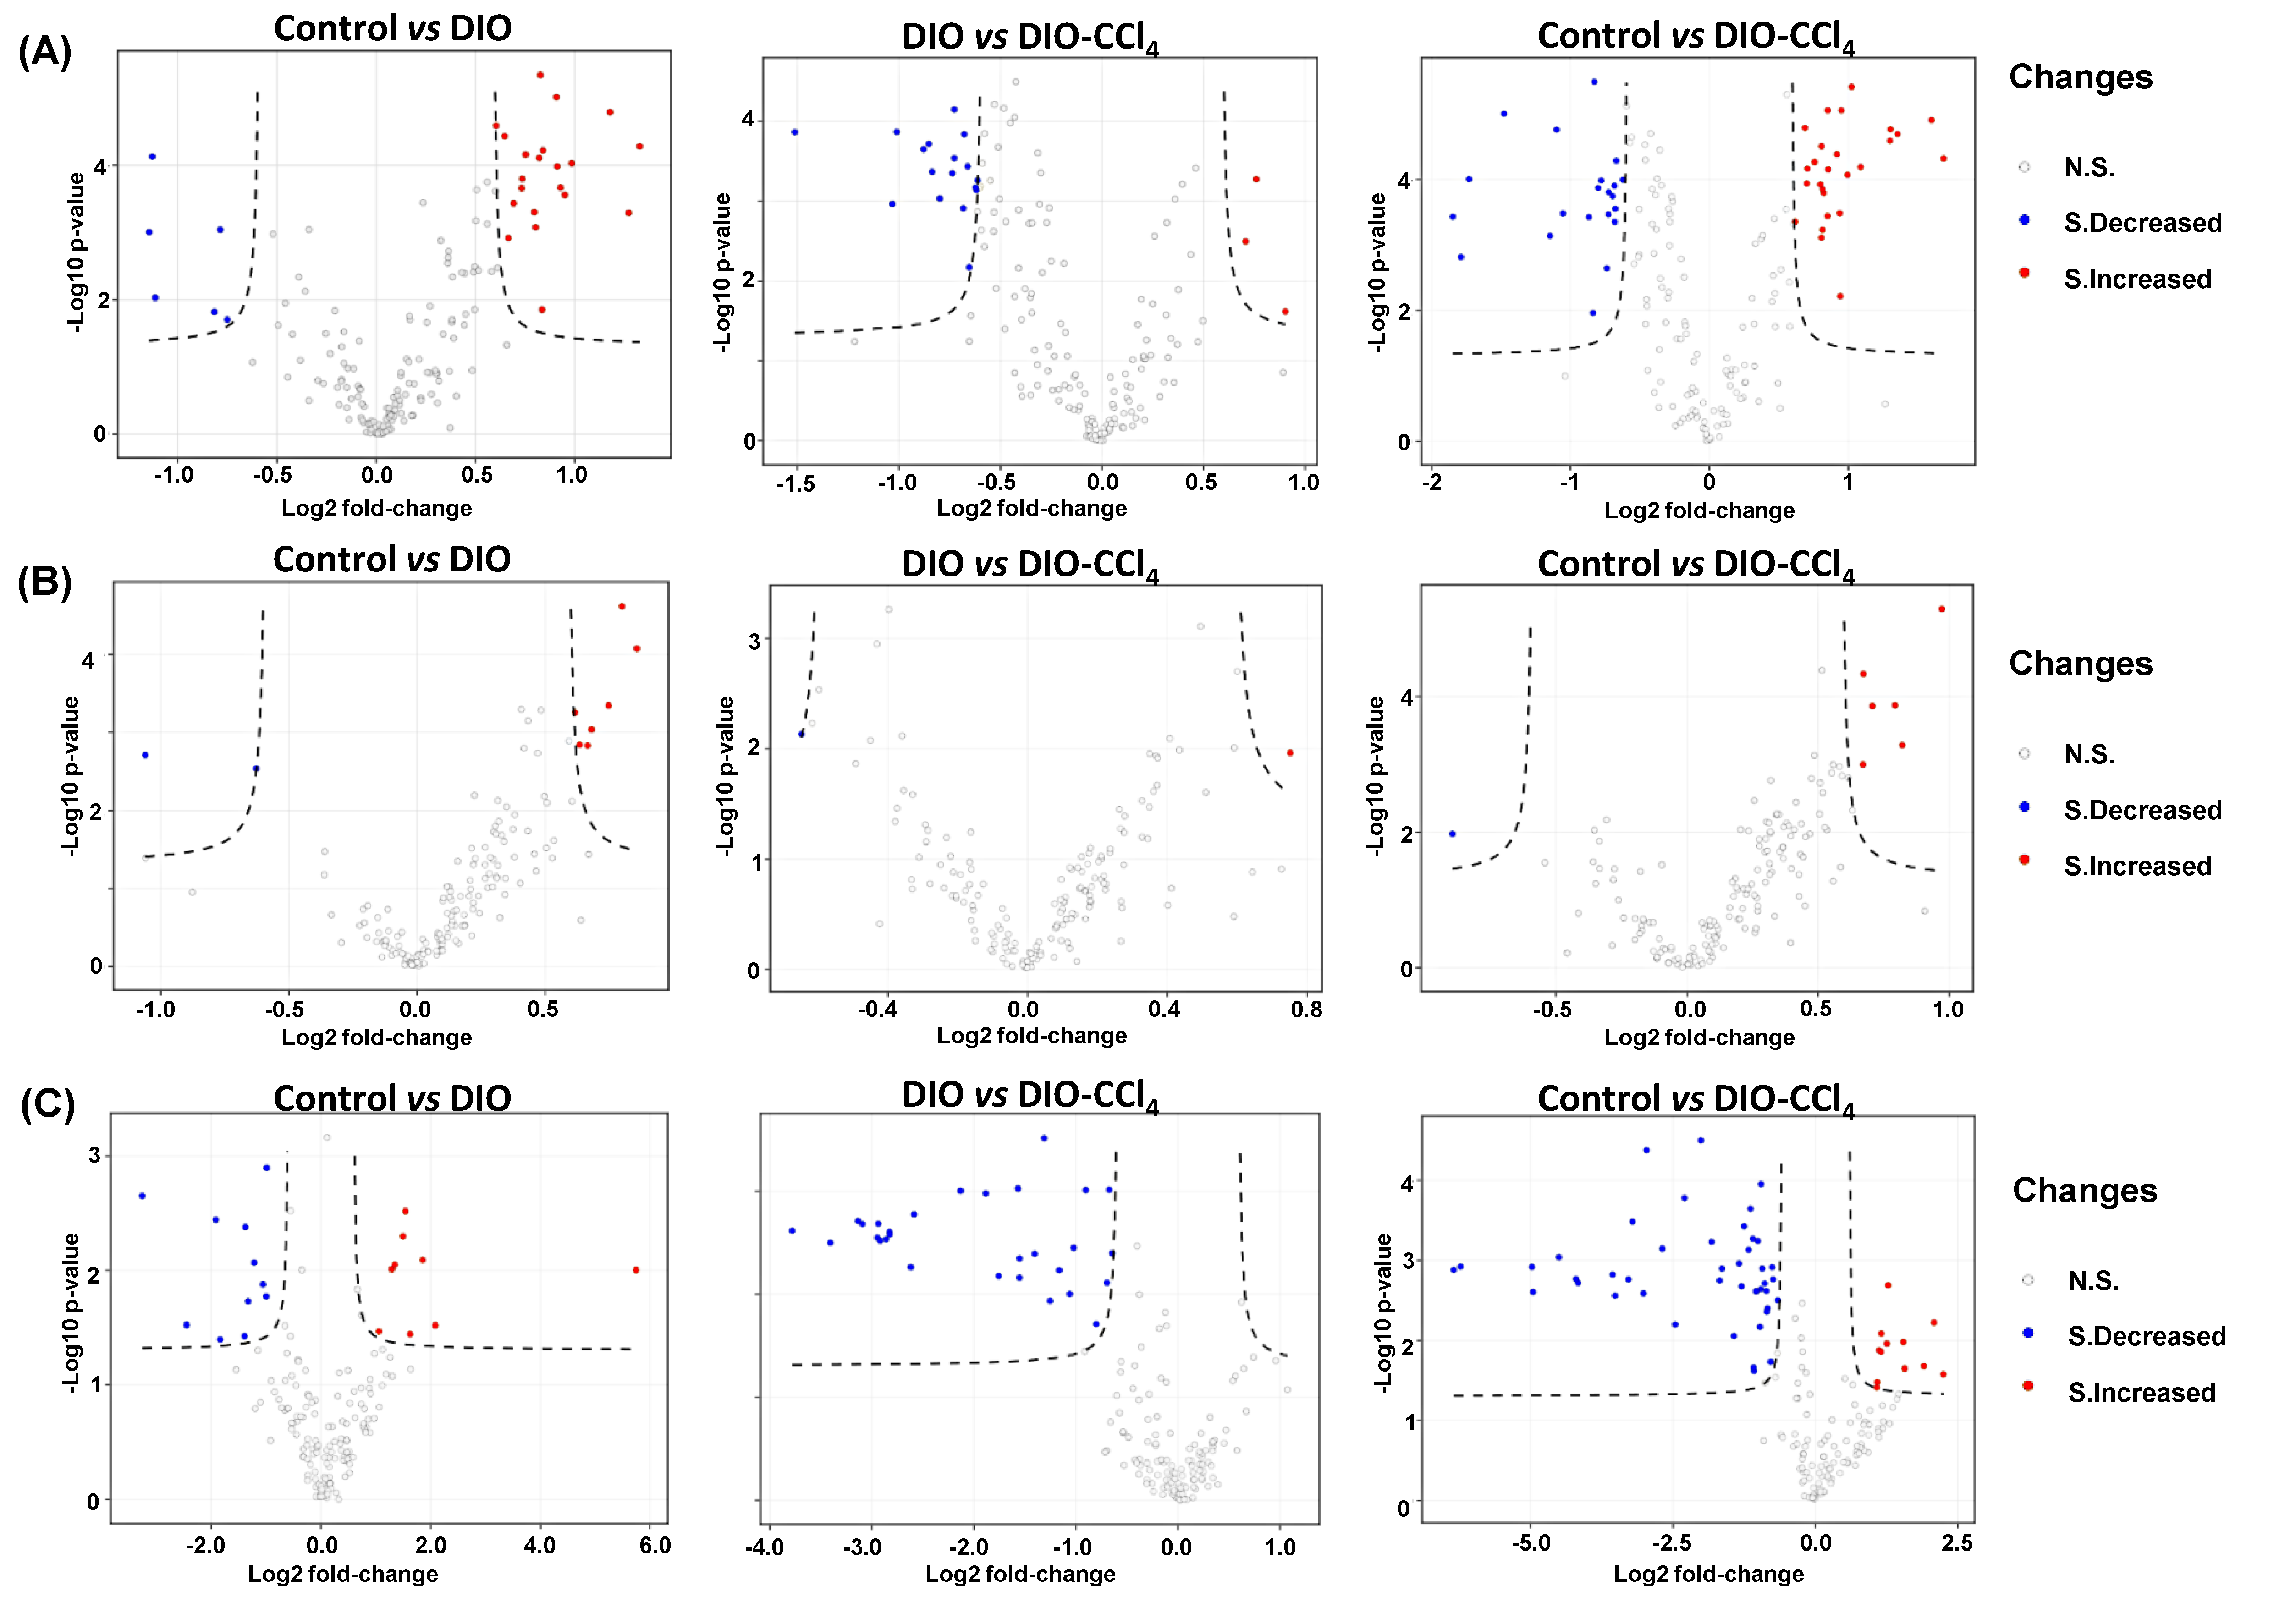
2.3. Metabolic Alteration Between NAFLD Models and Control Group

As illustrated above, the metabolic characteristics of NAFLD model groups could be distinctly distinguished from those of control group. To further discover the disturbed metabolites, a fold change analysis and t-test of the data were performed, visualizing on a volcano plot (Figure 4). False positive rate (FDR) correction was performed to reduce the FDR based on the Benjamini−Hochberg method [18]. Features with a fold change (FC) > 1.6 or FC < 0.6, p < 0.05, and FDR < 0.05 were defined as significantly altered metabolites (Supplementary Tables S2 and S3). A total of 47 metabolites were changed in liver, seven in serum and 56 in intestine content samples. To further analyze the distinction of liver, serum and intestine content samples, Venn analysis was performed (Figure 3D). The results showed that 17 metabolites were shared between liver and intestine content, while only five between liver and serum, and one between serum and intestine content, so the metabolic alteration of liver was more similar to that of intestine than that of serum. Stated thus, we speculated that liver, as the pathological tissue of NAFLD, displayed the most significant alteration of metabolome. Therefore, further analysis was focused on metabolic variation in liver. According to liver data, 19 metabolites were significantly different between DIO and control (Table 1, Table 2 and Table 3). Among them, most were lipids except putrescine. Forty-seven differential metabolites were observed between DIO-CCl4 and control (Table 1, Table 2 and Table 3). Twelve metabolites were significantly different between DIO-CCl4 and DIO (Table 1, Table 2 and Table 3). Two metabolites, that is PC ae C38:2 and SM C18:1, were detected in all three different comparisons.

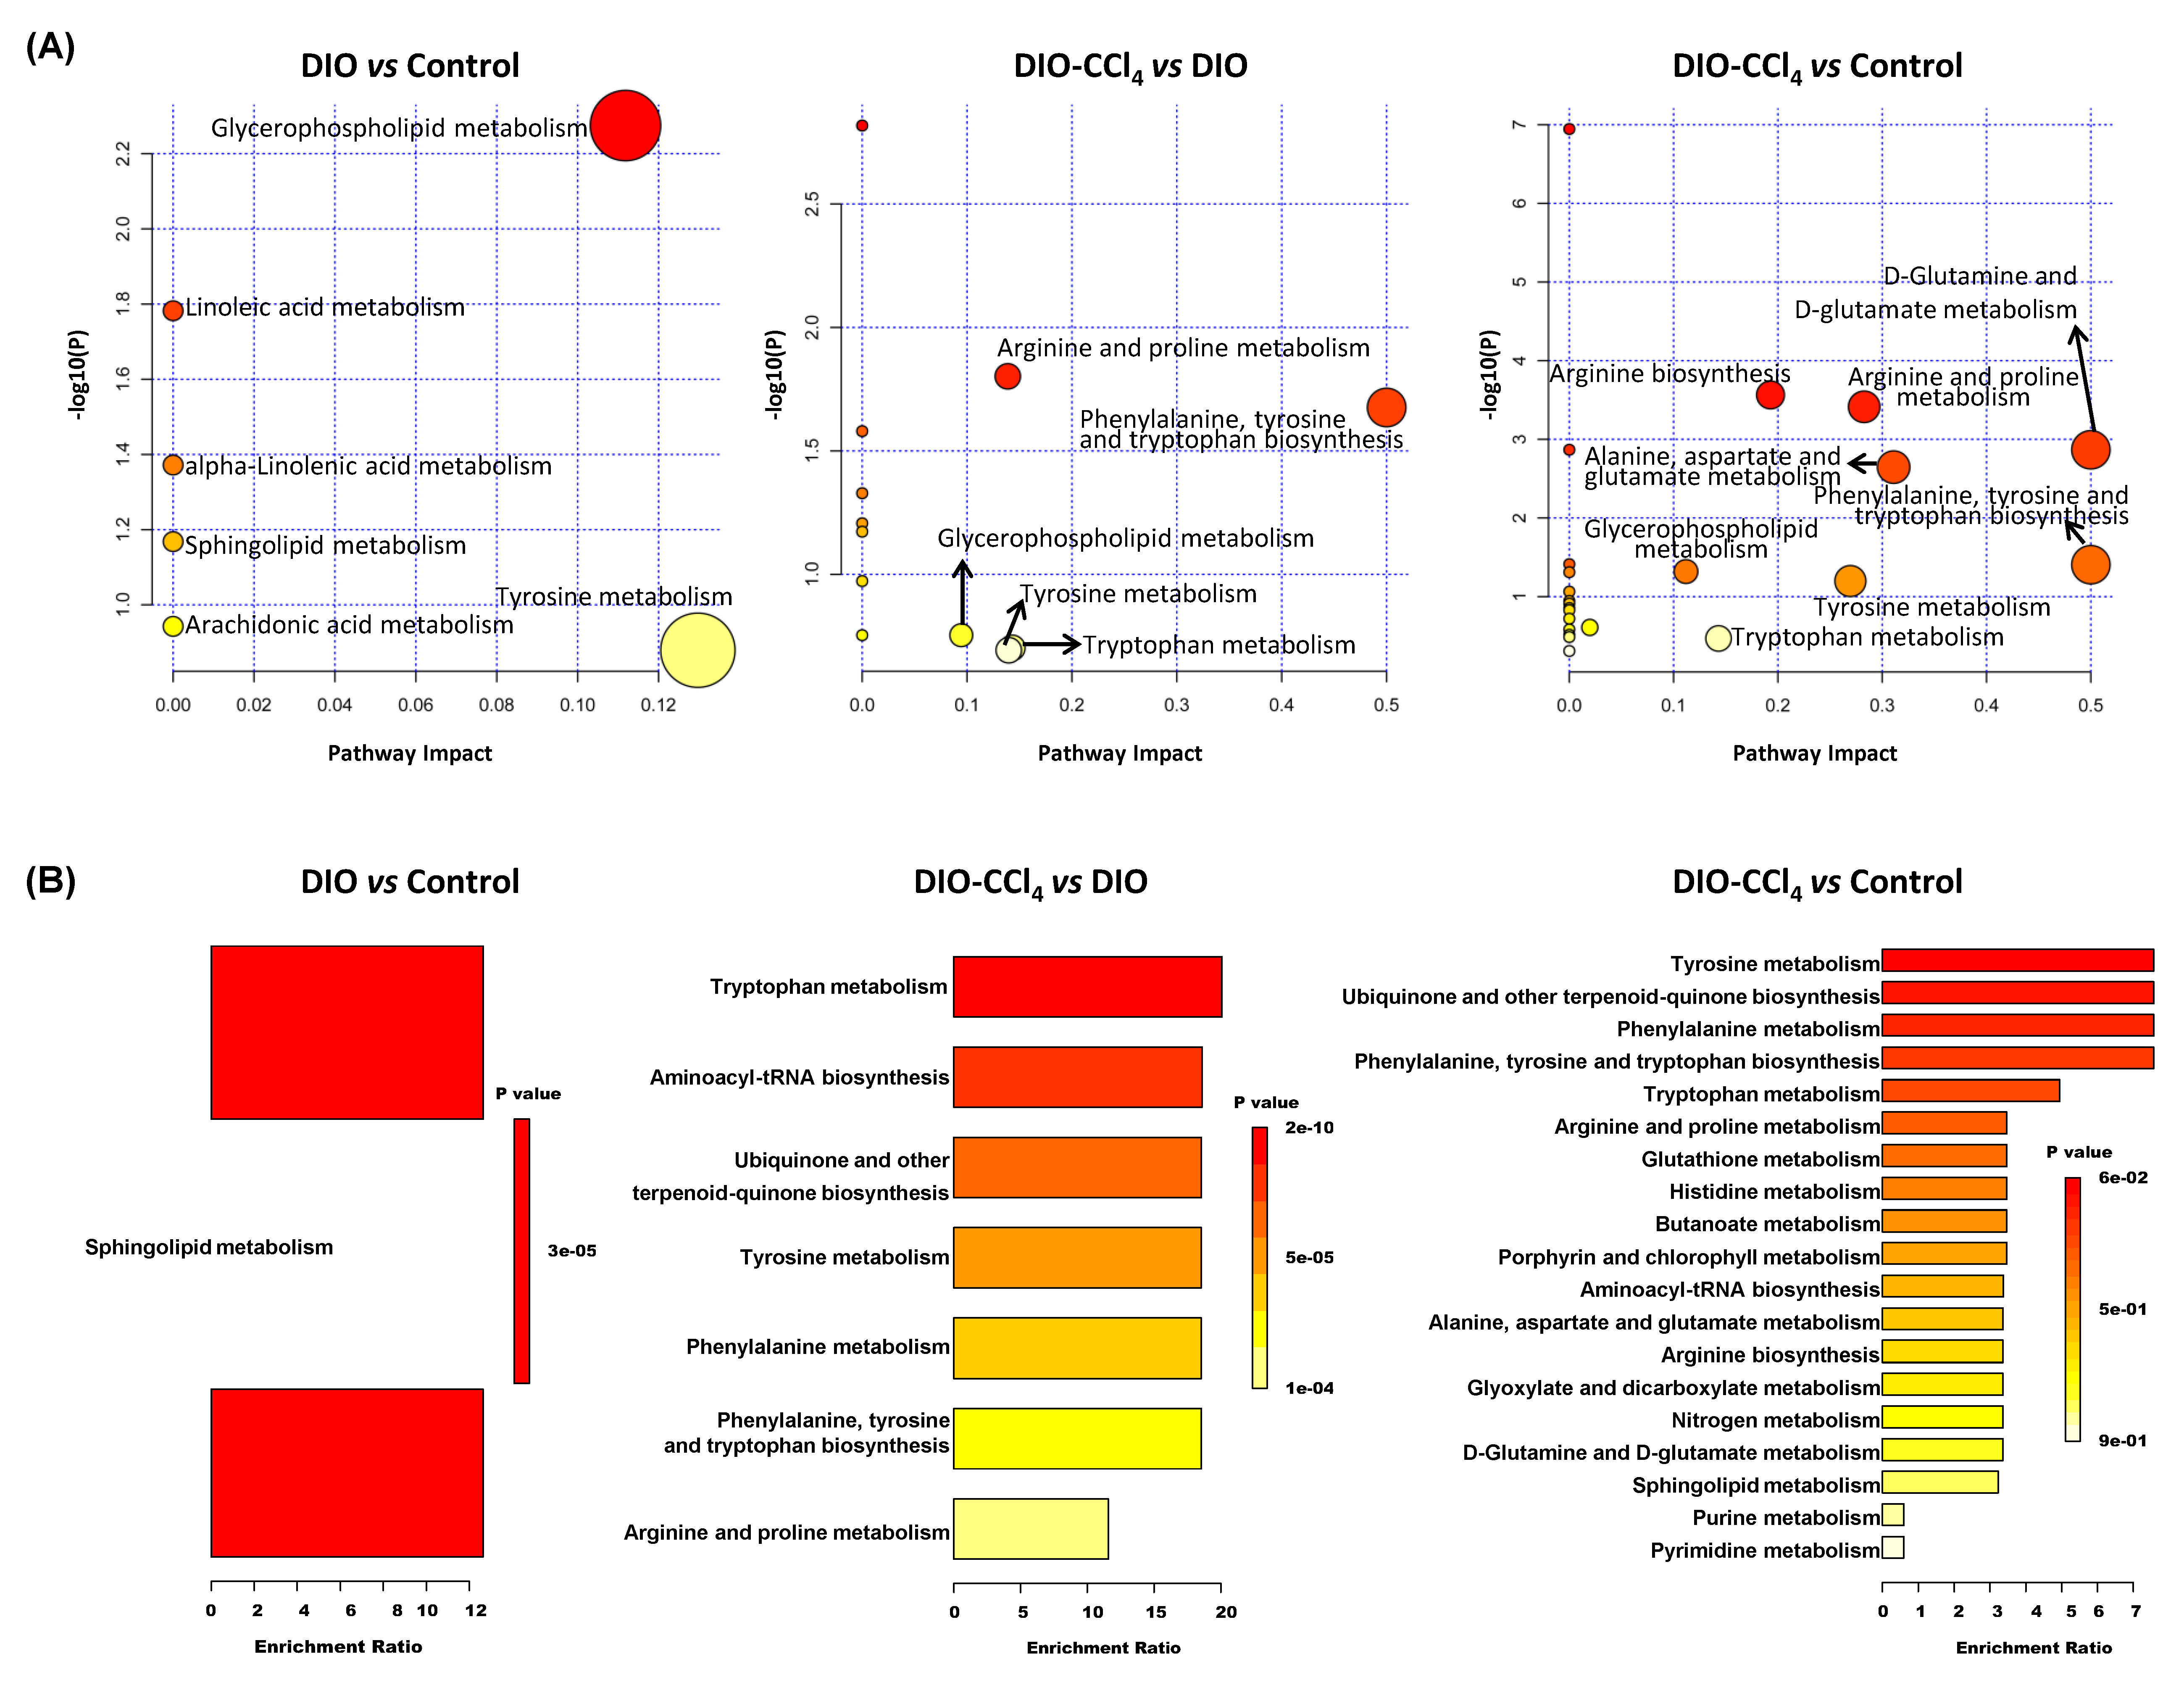
2.4. Metabolic Pathways and Metabolite Enrichment Analysis Distinguished NASH Models

To reveal the metabolic processes of the metabolites, pathway analysis and enrichment analysis were conducted using the MetaboAnalyst 4.0. Pathway analysis showed a total of 23 matched pathways. As depicted in Figure 5A, the lipid metabolism, including glycerophospholipid (GPLs) metabolism, linoleic acid metabolism, and alpha-linolenic acid metabolism, was observed to be disturbed in DIO group compared with control group (p < 0.05). The perturbation of aminoacyl-tRNA biosynthesis, nitrogen metabolism, lipid metabolism (the same as DIO versus control), glyoxylate and dicarboxylate metabolism, and amino metabolism (including arginine biosynthesis, arginine and proline metabolism, D-glutamine and D-glutamate metabolism, alanine, aspartate and glutamate metabolism, phenylalanine, and tyrosine and tryptophan biosynthesis) were also discovered between DIO-CCl4 and control groups (p < 0.05). Five pathways were changed between DIO-CCl4 and DIO, as most belonging to the amino acid (AA) metabolism.
Moreover, metabolite enrichment analysis was conducted using quantitative metabolite data (Figure 5B). Only sphingolipids (SPs) metabolism was changed (DIO vs. control, p < 0.05), while five sets exhibited high significance between DIO-CCl4 and control (p < 0.05), which corresponded to tyrosine metabolism, ubiquinone and other terpenoid-quinone biosynthesis, phenylalanine metabolism, phenylalanine, tyrosine and tryptophan biosynthesis, and tryptophan metabolism. In addition, the disturbed pathways between DIO-CCl4 and DIO were very similar to those between DIO-CCl4 and control, indicating that the disturbance of DIO-CCl4 was mainly correlated to additional treatment of CCl4.

2.5. Correlation Analysis between the Differential Metabolites and NAFLD-Associated Parameters

Correlation analysis was performed to obtain a visualized understanding of the relationship between metabolome and NAFLD-associated parameters (Figure 6, Table S4). Clinical parameters, including body weight (BW), liver/BW ratio, TNF-α and α-SMA, were not associated with the differential metabolites. While ALP, ALB, BUN, serum TG, hepatic TG, Col-1a1 and hallmarks of liver function (such as fibrosis, steatosis, ballooning, inflammation and NAS Score) were significantly correlated to the differential metabolites. Among them, Col-1a1, ALT, AST, hallmarks of liver function, serum TG and hepatic TG shared the same pattern, while ALP and BUN shared the same pattern. Most of the metabolites, except arginine, were correlated to the clinical parameters. The levels of Col-1a1, ALT, AST, hallmarks of liver function were positively associated with the levels of asparagine, proline, tryptophan, tyrosine, t4 OH proline, putrescine, lysoPC a C18:1, several carnitines and sphingomyelins (SM). In contrast, the levels of several phosphtidylcholines (PC) showed the inverse pattern.

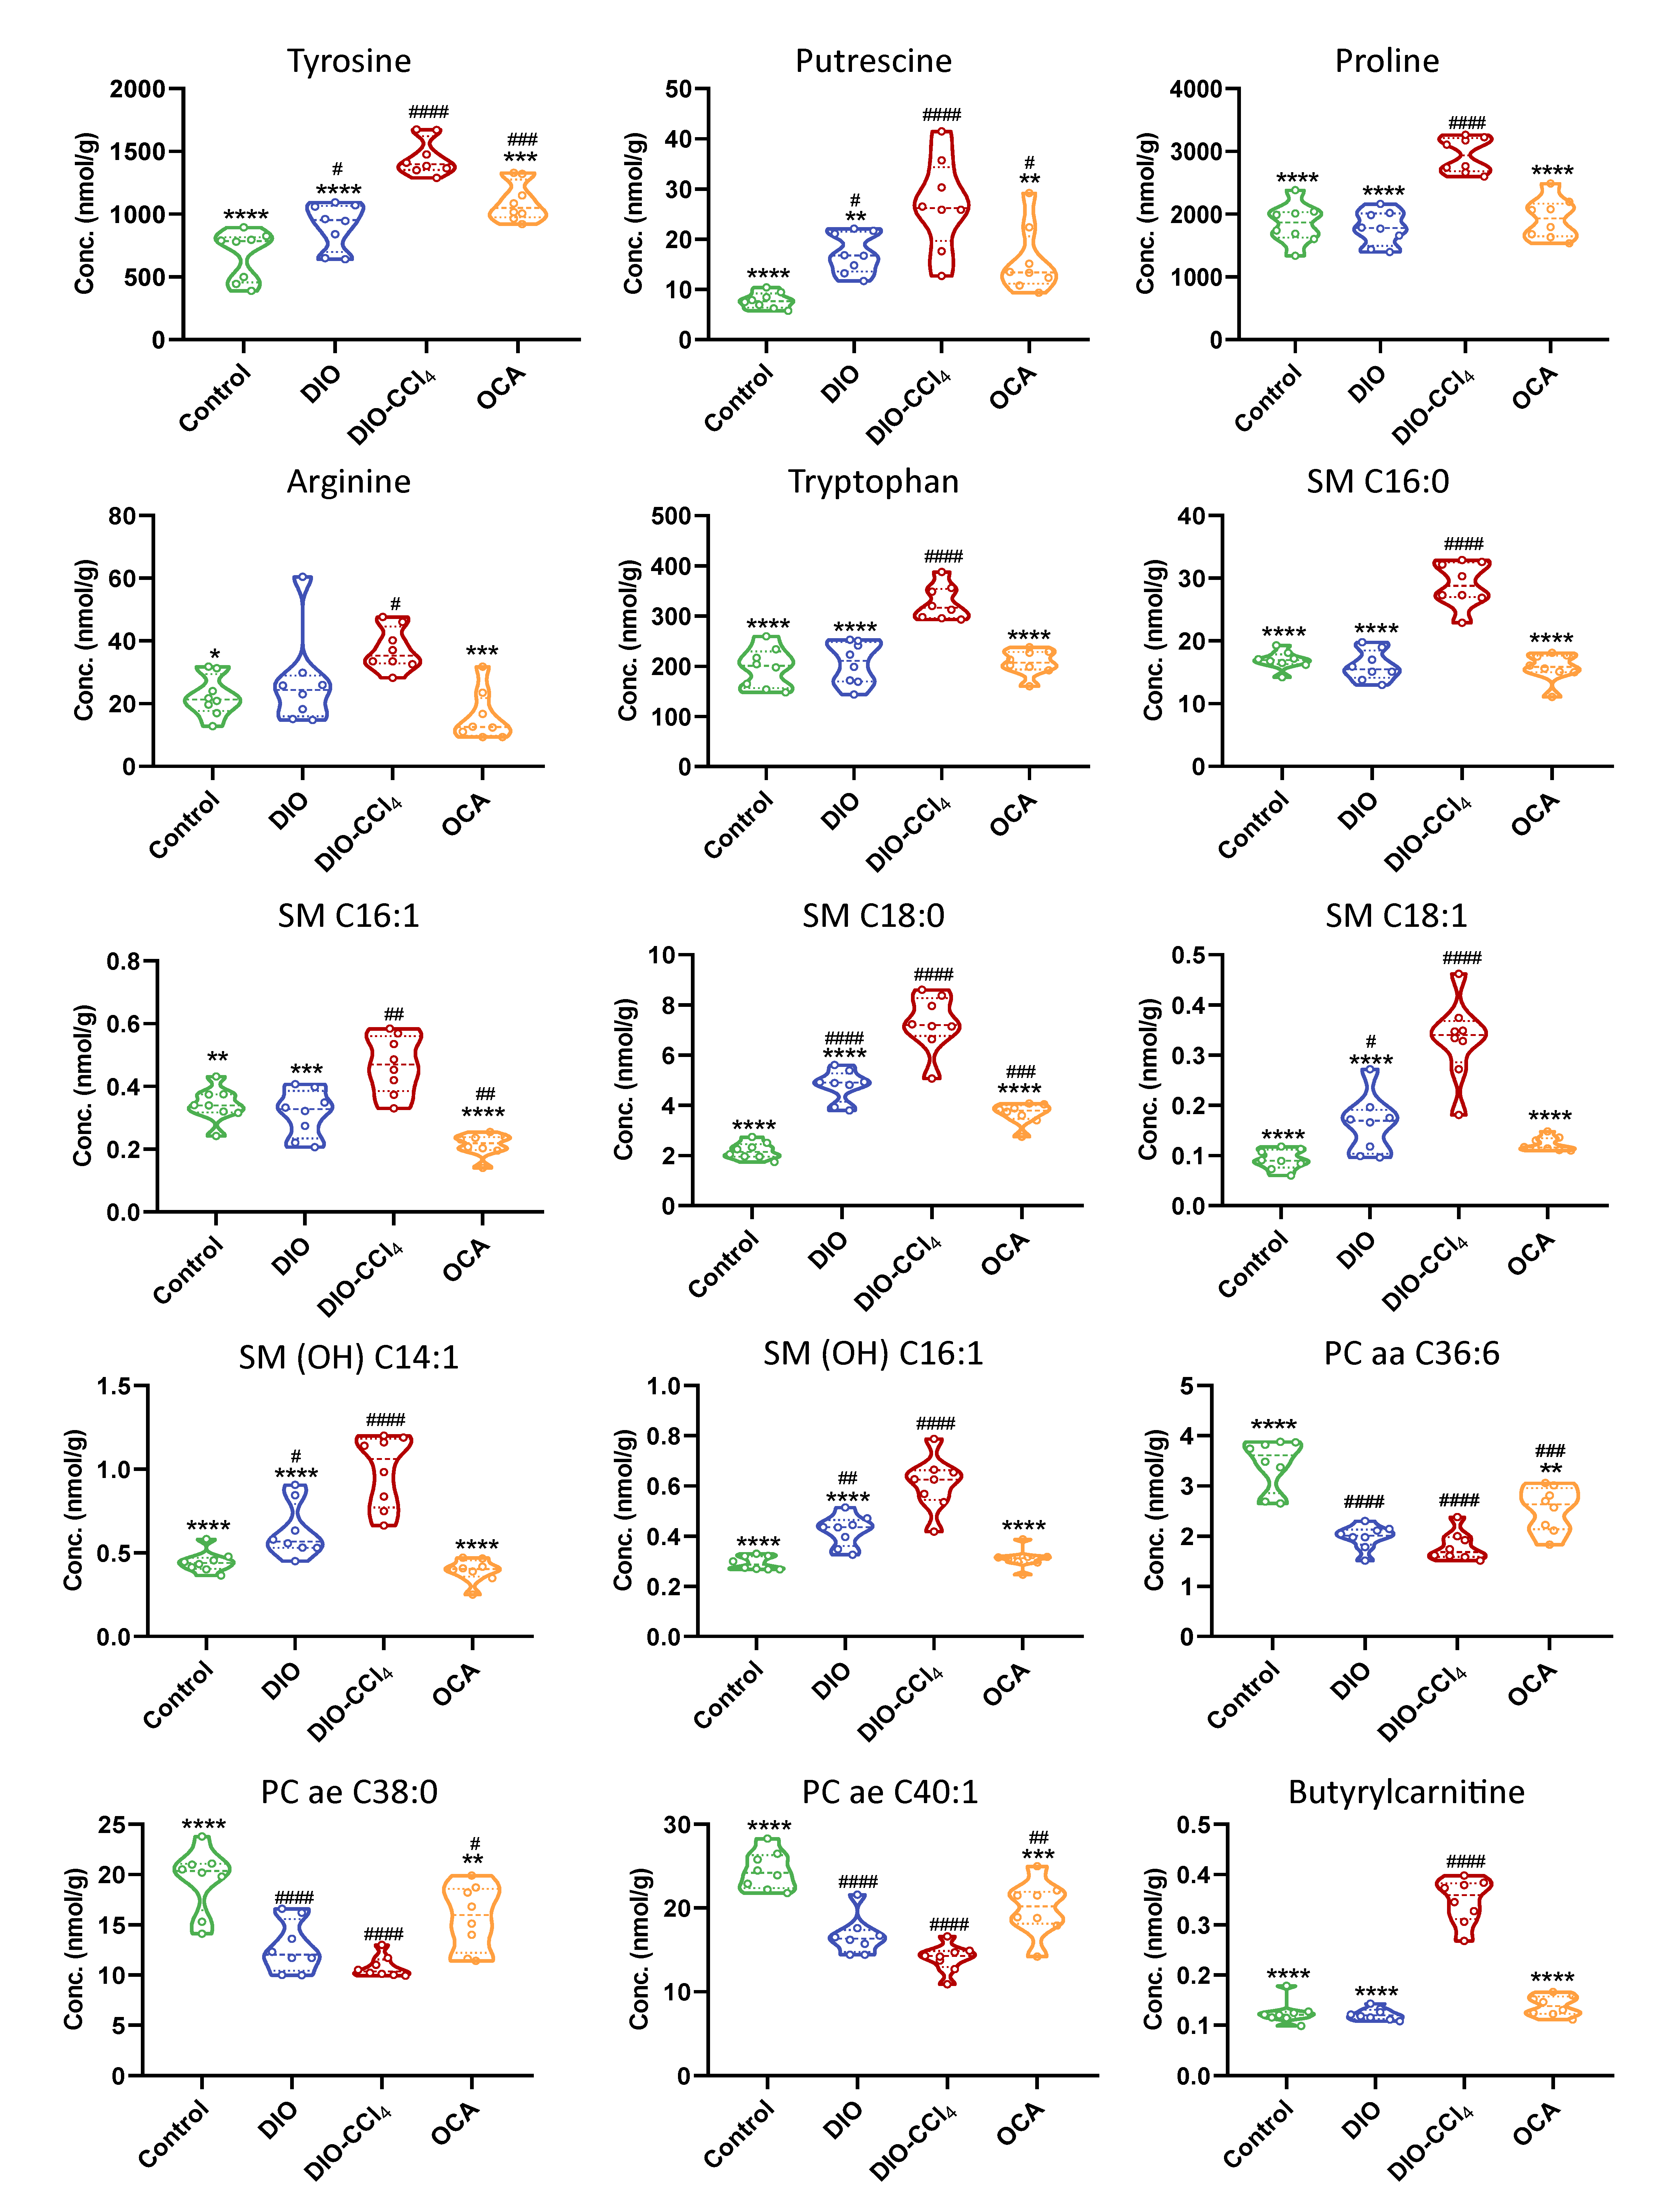
2.6. Amelioration of Obeticholic Acid (OCA) on NASH

Additionally, we studied effect of OCA, which was a drug candidate for the treatment of NASH. We expected that metabolomics analysis could provide some interpretation to support the therapeutic action of OCA. MSA including PLS-DA and heatmap was performed to understand the effect of OCA more clearly. The PLS-DA result showed that OCA group was distinguished from DIO-CCl4 group and grouped with DIO group (Figure 7A). Heatmap indicated the similar result (Figure 7C). These results revealed that OCA might attenuate the injury caused by CCl4. Subsequently, the effect of OCA on metabolites was investigated by measuring the levels of differential metabolites obtained by comparing DIO-CCl4 group with OCA group (Figure 8). The intervention of OCA had increased PC levels (such as PC aa C36:6, PC ae C38:0 and PC ae C38:0), while it decreased the levels of tyrosine, putrescine, proline, tryptophan, arginine, butyrylcarnitine, SM C16:0, SM C16:1, SM C18:0, SM C18:1, SM (OH) C14:1 and SM (OH) C16:1. Among them, the levels of proline, tryptophan, butyrylcarnitine, SM C16:0, SM C18:1, SM (OH) C14:1 and SM (OH) C16:1 in OCA group trended to be similar to control group, indicating that these metabolites might be contributed to the modulated effect of OCA.

3. Discussion

Currently, the prevalence of NAFLD is significantly increasing (from 15% in 2005 to 25% in 2010), while the rate of NASH has almost doubled (59.1% versus 33%) [19,20]. NASH transforms to cirrhosis or HCC more easily than NAFL. However, the mechanism of the transition from NAFL to NASH remains poorly understood. OCA was shown to improve liver histology in patients with NASH in randomized, placebo-controlled clinical trials [21,22]. In present study, we aimed to provide metabolic information which might be helpful to understand mechanism of NAFLD progress and amelioration of OCA on NASH. The results showed that treatment of DIO caused steatosis and ballooning, while inflammation and fibrosis only occurred in co-treatment of DIO and CCl4. The levels of ALT and AST, as markers of hepatocyte injury, significantly increased in DIO-CCl4 group, speculating that hepatocyte injury was mainly caused by CCl4. The PCA and PLS-DA results of control and NAFLD model group showed the obvious separation of each group, suggesting the altered metabolite levels in different conditions. In addition, liver samples showed the best separation, indicating that the greatest metabolic alteration might occur in liver. OCA administration to DIO-CCl4 mice showed significantly decrease in serum ALT, AST and TG as well as the hepatic steatosis, inflammation and fibrosis, which was also observed in previous research [23,24,25]. The PLS-DA plot of four groups showed that the treatment of OCA might ameliorate the injury of CCl4, according to the close distance of DIO and OCA groups.
Volcano plots were performed to investigate differential metabolites, and metabolic profiling here revealed several metabolic pathways and specific metabolites associated with the development of NAFLD (from control to NAFL following to NASH). Comparing with differential metabolites of liver, serum, and intestine content, liver and intestine content showed more differential metabolites than those of serum. The metabolic changes in serum may reflect response of the whole body to disease [26], and the alteration in pathological liver may be weakened in serum during blood circulation. So the differential metabolites of serum were less than that of liver and intestine content. Moreover, liver and intestine content shared more disturbed metabolites, especially 11 acyl-alkyl-GPLs (the PC ae C group) and two SPs (the SM(OH)C and SM C groups). According to previous literatures, the gut and liver are intrinsically connected and mainly relied on each other based on metabolic functioning [27]. Alteration in the gut–liver axis, including increased gut dysbiosis and permeability, are related to NAFLD [28]. Comparing with the metabolite levels of DIO, DIO-CCl4 and control groups, only 19 and 12 differential metabolites were observed between DIO and control, and between DIO and DIO-CCl4, while 47, more than the sum of 19 and 12, between DIO-CCl4 and control. These results showed that the increasing metabolic disturbance occurred during co-treatment of DIO and CCl4.
Pathway and enrichment analysis results suggested that lipid metabolism and AA metabolism were most significantly regulated and associated with NAFLD onset. Among them, SPs metabolism and GPLs metabolism showed significant disturbance comparing with DIO and control group, while AA metabolism enormously altered comparing with DIO and DIO-CCl4 groups. The results indicated that HFD might alter lipid metabolism, while CCl4 might disturb AA metabolism. In recent lipidomics study of NAFLD, NASH and cirrhosis, a total of 48 lipid species were investigated in liver and plasma [29]. Among them, SPs and GPLs were most predictive of a specific disease stage, and we also found that the levels of SPs and GPLs were disturbed during NAFLD process. Detailed analysis of lipid metabolism showed that the concentrations of PC aa C group (diacyl-GPLs) decreased. Similarly, the levels of PC ae C group was also decreased except for PC ae C34:0 and PC ae C38:5, which is consistent with the previous report and the function of these phosphatidylcholines (PCs) [30]. In contrast, lysophosphatidylcholines (LPCs) and sphingomyelin (SM) was detected in up-regulated sets except for SM C24:0. Correlation analysis between differential metabolites and clinical parameters showed that the levels of PCs, except for PC ae C34:0 and PC ae C38:5, were negatively associated with hepatocyte injury index (ALT and AST) and clinical hallmarks of NASH (fibrosis score, steatosis score, ballooning score, inflammation score, and NAS score). PC and phosphatidylethanolamine (PE) are major phospholipids in mammalian membranes. Previous literatures reported that hepatic PC/PE ratio displayed an important clinical significance [31]. Lots of patients with NAFLD and NASH have a lower hepatic PC/PE ratio than that of healthy subjects [32]. In our study, the levels of PE nearly unchanged, while PC significantly decreased. So hepatic PC/PE ratio decreased which was consistent with the literature. A decreased PC/PE ratio could adversely affect membrane integrity, leading to liver injury [30]. In addition, a decreased PC/PE ratio might initiate inflammation, because the flow of ions (such as calcium) and ion radicals varies in membrane potential, and C-reactive protein, as inflammatory response protein, bound more avidly to cell membranes. However, the levels of LPCs and SMs, except for SM C24:0, showed reverse correlated pattern of PCs. Previous work indicated that increasing levels of SMs were observed in liver and serum in HFD-fed mice [33,34], because SM reduction ameliorates both insulin sensitivity and steatosis [34,35]. Relevantly, metabolomic analysis of human serum suggested that SMs might be up-regulated in NASH patients [36].
In addition, AA metabolism was also significantly altered among different groups. These results were not surprising, because liver is the site of protein and AA metabolism. Eight AAs (arginine, asparagine, glutamine, proline, tryptophan, tyrosine, t4 OH proline, putrescine) were up-regulated, with glutamic acid and DOPA being down-regulated. Pathway analysis showed that phenylalanine, tyrosine and tryptophan biosynthesis, D-glutamine and D-glutamate metabolism, and arginine and proline metabolism were significantly disturbed. Recent metabolomics-based studies suggested that AA metabolism plays an important role in NAFLD pathogenesis [37], and aromatic AAs (AAAs, such as tyrosine and phenylalanine) were also found altered with increased severity of liver diseases [38]. Nonessential amino acids (serine, glycine, glutamate, glutamine, aspartate, asparagine, and alanine) and essential amino acids (valine and methionine) were also reported that involved in the appearance of NASH. In addition, acylcarnitines (such as butyrylcarnitine, tiglylcarnitine, glutarylcarnitine, and octanoylcarnitine) were also affected, and were positively associated with hepatocyte injury index and clinical hallmarks of NASH. And alterations of carnitines were reported to result in high mitochondrial lipotoxicity, lipid loads, and altered lipid metabolism [39].
Moreover, the concentrations of differential metabolites in control, DIO, DIO-CCl4 and OCA groups were analyzed to discover whether the treatment of OCA could modulate the altered metabolites. As shown in Figure 8, OCA could attenuate the levels of several SMs, AAs (proline, tryptophan, tyrosine, arginine, and putrescine) and butyrylcarnitine and increase the level of several PCs, while no significant changes were observed in LPCs. AAs could alleviate hepatic steatosis and liver injury associated with NASH by suppressing FAS gene expression and protein levels [40]. PC directly contributes to hepatic TG synthesis and thus may promote the development of steatosis [41]. Combining with the histological and metabolic characteristics, steatosis score and hepatic TG significantly decreased along with the changed level of AAs and PCs, which indicated that OCA might reverse hepatic steatosis throughout AA metabolism, and PC biosynthesis and lipoprotein metabolism. LPC was generated from the hydrolysis of PC by the action of phospholipase A2, and were associated with cell injury and apoptosis in NASH, and could cause membrane toxicity and promote inflammation [42]. OCA could not decrease the level of LPCs, indicating that OCA could not decrease membrane toxicity and cell injury.
In present study, we induced the mice progressed from NAFL to NASH by fedding the mice with high-fat diet (60% fat calories) for 6 weeks and then intraperitoneally injected with CCl4 and continued the high-fat diet for 4 weeks. It is an effective mouse model for initial in vivo proof-of-concept studies on antisteatosis and antifibrotic therapies in a relative short time. However, this model dose not closely mirror the etiology and natural history of NASH, which progressed slowly and might take decades in human. The traditional Western diet—which is high in fat, fructose and cholesterol would promote hepatic insulin resistance, marked steatohepatitis, inflammation and perisinusoidal fibrosis in mice after fed for 26 weeks. Further research might be conducted in the Western diet—induced mice in the future to investigate the correlation among metabolites, histological and metabolic characteristics in the pathogenesis of NASH.

4. Materials and Methods

4.1. Chemicals

Ultrapure water was prepared by a Milli-Q water purification system (Millipore, Molsheim, France). HPLC grade acetonitrile, ethanol, isopropanol and methanol were obtained from Merck (Darmstadt, Germany). Formic acid was purchased from Merck. Ammonium bicarbonate, pyridine and phosphate buffered saline (PBS) were purchased from Sigma-Aldrich (St. Louis, MO, USA). Carbon tetrachloride (CCl4) and CMC-Na were purchased from Aladdin (Shanghai, China).

4.2. Ethics Statement and Animals

C57Bl/6J male mice were acquired from Shanghai Lingchang Laboratory Animal Care Co., Ltd. (Shanghai, China). The mice were housed in a controlled environment (12 h light/dark cycle, 22–24 °C, humidity 50% ± 10%). All animal procedures were approved by the Institutional Animal Care and Utilization Committee (IACUC) (Shanghai, China) of Shanghai Institute of Materia Medica (SIMM), Chinese Academy of Sciences (CAS) (Shanghai, China), with accreditation number of 2017-12-LY-72. Mice were fed ad libitum with a high-fat diet (60 kcal% fat, 20 kcal% protein and 20 kcal% carbohydrate; Cat. D12492i, Research Diet, New Brunswick, NJ, USA) for 10 weeks before and during the experiment. A corresponding group of C57Bl/6J male mice (n = 8) fed with standard diet was set as control group. After 6 weeks, HFD mice were stratified divided into three groups (n = 8) based on their body weights and treated as follows: (i) DIO group, in which mice were orally administrated with vehicle (0.25% CMC-Na) once daily for 4 weeks; (ii) DIO-CCl4 group, in which mice were intraperitoneally injected with CCl4 0.05 mL/kg twice a week and orally administrated with vehicle once daily for 4 weeks; and (iii) OCA group, in which mice were intraperitoneally injected with CCl4 0.05 mL/kg twice a week and orally administered with OCA (30 mg/kg) once daily for 4 weeks. At the end of treatment, animals were anesthetized and sacrificed according to institutional guidelines. From each animal, serum, liver and intestine content were collected.

4.3. Biochemical Analysis, Histology and NAFLD Activity Score and Fibrosis Evaluation

Serum alanine aminotransferase (ALT) and aspartate aminotransferase (AST) were measured using an Infinity Enzymatic Assay Kits (Shino-test Corporation, Tokyo, Japan). Serum triglyceride (TG) and cholesterol (TC) were determined using commercial kits (DongOu Jin Ma Biotech, Wenzhou, China). For histology, the harvested liver tissues from all study groups were fixed in 10% buffered formalin. Then the paraffin embedding, sectioning and HE staining of liver tissue were commissioned to Shanghai Tianhe Biotechnology Co., Ltd. (Shanghai, China). The images were reviewed and analyzed under microscope (Olympus 1X73, Olympus Corporation, Tokyo, Japan) at 200× magnification. The NAFLD activity score (NAS) was calculated from the sum of the individual scores for steatosis, inflammation and ballooning according to the NASH CRN scoring system [43,44]. The formalin-fixed, paraffin-embedded liver sections were stained with Sirius Red (Nanjing SenBeiJia Biological Technology Co., Ltd., Nanjing, China) for assessment of fibrosis, and the complete scan was performed using Nano Zoomer 2.0HT (Hamamatsu Photonics K.K., Hamamatsu, Japan) and Image Pro Plus software (Media Cybernetics, Inc., Rockville, MD, USA) was used to calculate the positive area ratio of Sirius red. Hepatic TG was detected using a heptane-isopropanol-Tween mixture (3:2:0.01 by volume) and measured by a commercial kit and normalized by tissue weight.

4.4. RNA Isolation and Real-Time PCR

Total RNA was extracted from liver tissues using TRIzol reagent (Life Technologies, Carlsbad, CA, USA). cDNA was generated by a Primer Script RT reagent kit (TaKaRa Biotechnology, Dalian, China) and analyzed via quantitative PCR. All of the primer sequences used in this study are included in Table S1. The relative amount of individual mRNA was normalized to β-actin mRNA.

4.5. Metabolomics

The AbsoluteIDQ® p180 Kit (Biocrates Life Sciences, Innsbruck, Austria) was applied to assay a total of 188 metabolites from five analyte groups, including acylcarnitines, amino acids (AA), biogenic amines, glycerophospho- and sphingolipids, and hexose. The workflow was followed to the AbsoluteIDQ® p180 Kit manufacturer instructions. The serum samples were centrifuged at 4 °C for 5 min at 2750× g. After homogenizing the liver and intestine content samples with water (1:5, g/mL), the suspensions were centrifuged at 3220× g for 10 min at 4 °C. A 10-μL of the Biocrates internal standard solution was added into each well of the 96-well extraction plate. And then, 10 μL of serum, liver and intestine content samples, quality control (QC) samples, blank, zero samples (PBS), or calibration standards was accurately pipetted to the appropriate wells. The LC-MS/MS and FIA-MS/MS analysis were performed using an ACQUITY UPLC system (H-Class, Waters, Milford, MA, USA) coupled with a Triple Quad 5500 (AB SCIEX, Concord, Canada) mass spectrometer equipped with an electrospray ionization (ESI) source. Separation chromatographic column was Waters BEH C18 UPLC column (2.1 × 75 mm, 1.7 μm) (Waters, Milford, MA, USA). Multiple reaction monitoring (MRM) transitions for each analyte and internal standard were collected over a scheduled retention time window using tune files and acquisition methods from the AbsoluteIDQ® p180 Kit. The median value of all zero samples on the plate was calculated as an approximation of background noise, i.e., as the limit of detection (LOD). Results from the LC-MS/MS assay together with the FIA assay were imported in to MetIDQ (Biocrates Life Sciences, Innsbruck, Austria) for further data evaluation.

4.6. Statistical Analysis

All values were presented as the mean ± SEM, and analyzed using Student’s t-test and one-way analysis of variance (ANOVA) using GraphPad Prism 8.0 (GraphPad Software, LaJolla, CA). P value less than 0.05 was considered as statistical significance. Principal component analysis (PCA) and partial least squares-discriminant analysis (PLS-DA) with unit variance (UV) scaling was performed by SIMCA 14.1software (Umetrics, Umea, Sweden). The PLS-DA validation was performed by a permutation test with 200 cycles. The correlation analysis was constructed by SPSS 18.0 and visualized using the R package (corrplot). Pathway analysis and enrichment analysis was performed to identify the disturbed pathways. Univariate Analysis, cluster Analysis, enrichment analysis and pathway analysis, were conducted on the MetaboAnalyst website (http://www.metaboanalyst.ca, accessed on 30 May 2021) [45,46] and iMetaShiny Apps (https://shiny.imetalab.ca, accessed on 30 May 2021) [47].

5. Conclusions

In summary, a comprehensive overview of metabolic characteristics and pathway disturbance of NAFLD model groups and control group, along with amelioration of OCA on the treatment of NASH, was provided in this study. Aminoacyl-tRNA biosynthesis, nitrogen metabolism, lipid metabolism, glyoxylate and dicarboxylate metabolism, and amino metabolism were disturbed during progression from control to NAFL and from NAFL to NASH. Additionally, differential metabolites among NAFLD groups and control group were discovered. Among them, metabolic alteration of liver and intestine content was more significant. And several differential metabolites were correlated to some clinical parameters. OCA showed modulated effect according to metabolomics analysis and histological characteristics. To sum up, our research could provide metabolic clues to understand the mechanism of the treatment of OCA.

Supplementary Materials

The following are available online at https://www.mdpi.com/article/10.3390/metabo11060374/s1, Table S1: Primer sequences used for real-time PCR of mouse liver. Table S2: Summary of differential metabolites in serum between different groups. Table S3: Summary of differential metabolites in intestine content between different groups. Table S4: Biochemical parameters of different groups. Table S5: Body weights prior to the onset of treatment (CCl4).

Author Contributions

Conceptualization, S.H., J.L. and Y.L.; methodology, S.H. and J.L.; software, N.Z.; validation, N.Z., and S.H.; formal analysis, N.Z., S.H., Q.Z., Z.Z., H.Q., M.N. and J.L.; investigation, N.Z. and S.H.; resources, J.L., S.H. and Y.L.; data curation, N.Z. and S.H.; writing—original draft preparation, N.Z., J.L. and S.H.; writing—review and editing, N.Z.; visualization, N.Z. and S.H.; supervision, S.H., J.L. and Y.L.; project administration, J.L. and Y.L. All authors have read and agreed to the published version of the manuscript.

Funding

No funding was provided.

Institutional Review Board Statement

The study was conducted according to the guidelines of the Institutional Animal Care and Utilization Committee (IACUC) (Shanghai, China) of Shanghai Institute of Materia Medica (SIMM), Chinese Academy of Sciences (CAS) (Shanghai, China), with protocol code of 2017-12-LY-72 at December 2017.

Informed Consent Statement

Not applicable.

Data Availability Statement

Data used in this study is available on the request from the corresponding author.

Conflicts of Interest

The authors declare no conflict of interest.

References

  1. Anstee, Q.M.; Reeves, H.L.; Kotsiliti, E.; Govaere, O.; Heikenwalder, M. From NASH to HCC: Current concepts and future challenges. Nat. Rev. Gastroenterol. Hepatol. 2019, 16, 411–428. [Google Scholar] [CrossRef] [PubMed]
  2. Banales, J.M.; Inarrairaegui, M.; Arbelaiz, A.; Milkiewicz, P.; Muntane, J.; Munoz-Bellvis, L.; La Casta, A.; Gonzalez, L.M.; Arretxe, E.; Alonso, C.; et al. Serum Metabolites as Diagnostic Biomarkers for Cholangiocarcinoma, Hepatocellular Carcinoma, and Primary Sclerosing Cholangitis. Hepatology 2019, 70, 547–562. [Google Scholar] [CrossRef] [PubMed] [Green Version]
  3. Blond, E.; Disse, E.; Cuerq, C.; Drai, J.; Valette, P.J.; Laville, M.; Thivolet, C.; Simon, C.; Caussy, C. EASL-EASD-EASO clinical practice guidelines for the management of non-alcoholic fatty liver disease in severely obese people: Do they lead to over-referral? Diabetologia 2017, 60, 1218–1222. [Google Scholar] [CrossRef] [PubMed] [Green Version]
  4. Oh, T.G.; Kim, S.M.; Caussy, C.; Fu, T.; Guo, J.; Bassirian, S.; Singh, S.; Madamba, E.V.; Bettencourt, R.; Richards, L.; et al. A Universal Gut-Microbiome-Derived Signature Predicts Cirrhosis. Cell Metab. 2020, 32, 1–11. [Google Scholar] [CrossRef]
  5. Xin, D.; Zong-Shun, L.; Bang-Mao, W.; Lu, Z. Expression of intestinal tight junction proteins in patients with non-alcoholic fatty liver disease. Hepatogastroenterology 2014, 61, 136–140. [Google Scholar]
  6. Johnson, C.H.; Ivanisevic, J.; Siuzdak, G. Metabolomics: Beyond biomarkers and towards mechanisms. Nat. Rev. Mol. Cell Biol. 2016, 17, 451–459. [Google Scholar] [CrossRef] [Green Version]
  7. Rinschen, M.M.; Ivanisevic, J.; Giera, M.; Siuzdak, G. Identification of bioactive metabolites using activity metabolomics. Nat. Rev. Mol. Cell Biol. 2019, 20, 353–367. [Google Scholar] [CrossRef]
  8. Pezzatti, J.; Boccard, J.; Codesido, S.; Gagnebin, Y.; Joshi, A.; Picard, D.; Gonzalez-Ruiz, V.; Rudaz, S. Implementation of liquid chromatography-high resolution mass spectrometry methods for untargeted metabolomic analyses of biological samples: A tutorial. Anal. Chim. Acta 2020, 1105, 28–44. [Google Scholar] [CrossRef]
  9. Sreekumar, A.; Poisson, L.M.; Rajendiran, T.M.; Khan, A.P.; Cao, Q.; Yu, J.; Laxman, B.; Mehra, R.; Lonigro, R.J.; Li, Y.; et al. Metabolomic profiles delineate potential role for sarcosine in prostate cancer progression. Nature 2009, 457, 910–914. [Google Scholar] [CrossRef] [Green Version]
  10. Dunn, W.B.; Broadhurst, D.; Begley, P.; Zelena, E.; Francis-McIntyre, S.; Anderson, N.; Brown, M.; Knowles, J.D.; Halsall, A.; Haselden, J.N.; et al. Procedures for large-scale metabolic profiling of serum and plasma using gas chromatography and liquid chromatography coupled to mass spectrometry. Nat. Protoc. 2011, 6, 1060–1083. [Google Scholar] [CrossRef]
  11. Nicholson, J.K.; Lindon, J.C. Organisms often respond in complex and unpredictable ways to stimuli that cause disease or injury. By measuring and mathematically modelling changes in the levels of products of metabolism found in biological fluids and tissues, metabonomics offers fresh insight into the effects of diet, drugs and disease. Nature 2008, 455, 1054–1056. [Google Scholar]
  12. Magistretti, P.J.; Allaman, I. Lactate in the brain: From metabolic end-product to signalling molecule. Nat. Rev. Neurosci. 2018, 19, 235–249. [Google Scholar] [CrossRef]
  13. Liu, P.-S.; Wang, H.; Li, X.; Chao, T.; Teav, T.; Christen, S.; Di Conza, G.; Cheng, W.-C.; Chou, C.-H.; Vavakova, M.; et al. α-ketoglutarate orchestrates macrophage activation through metabolic and epigenetic reprogramming. Nat. Immunol. 2017, 18, 985–994. [Google Scholar] [CrossRef]
  14. Giera, M.; Branco Dos Santos, F.; Siuzdak, G. Metabolite-Induced Protein Expression Guided by Metabolomics and Systems Biology. Cell Metab. 2018, 27, 270–272. [Google Scholar] [CrossRef] [Green Version]
  15. Hameed, B.; Terrault, N.A.; Gill, R.M.; Loomba, R.; Chalasani, N.; Hoofnagle, J.H.; Van Natta, M.L. Clinical and metabolic effects associated with weight changes and obeticholic acid in non-alcoholic steatohepatitis. Aliment. Pharmacol. Ther. 2018, 47, 645–656. [Google Scholar] [CrossRef]
  16. Kubota, N.; Kado, S.; Kano, M.; Masuoka, N.; Nagata, Y.; Kobayashi, T.; Miyazaki, K.; Ishikawa, F. A high-fat diet and multiple administration of carbon tetrachloride induces liver injury and pathological features associated with non-alcoholic steatohepatitis in mice. Clin. Exp. Pharmcol. Physiol. 2013, 40, 422–430. [Google Scholar] [CrossRef]
  17. Wigger, L.; Casals-Casas, C.; Baruchet, M.; Trang, K.B.; Pradervand, S.; Naldi, A.; Desvergne, B. System analysis of cross-talk between nuclear receptors reveals an opposite regulation of the cell cycle by LXR and FXR in human HepaRG liver cells. PLoS ONE 2019, 14, e0220894. [Google Scholar] [CrossRef] [Green Version]
  18. Jouihan, H.; Will, S.; Guionaud, S.; Boland, M.L.; Oldham, S.; Ravn, P.; Celeste, A.; Trevaskis, J.L. Superior reductions in hepatic steatosis and fibrosis with co-administration of a glucagon-like peptide-1 receptor agonist and obeticholic acid in mice. Mol. Metab. 2017, 6, 1360–1370. [Google Scholar] [CrossRef]
  19. Younossi, Z.; Anstee, Q.M.; Marietti, M.; Hardy, T.; Henry, L.; Eslam, M.; George, J.; Bugianesi, E. Global burden of NAFLD and NASH: Trends, predictions, risk factors and prevention. Nat. Rev. Gastroenterol. Hepatol. 2018, 15, 11–20. [Google Scholar] [CrossRef]
  20. Younossi, Z.M.; Koenig, A.B.; Abdelatif, D.; Fazel, Y.; Henry, L.; Wymer, M. Global epidemiology of nonalcoholic fatty liver disease-Meta-analytic assessment of prevalence, incidence, and outcomes. Hepatology 2016, 64, 73–84. [Google Scholar] [CrossRef] [Green Version]
  21. Siddiqui, M.S.; Van Natta, M.L.; Connelly, M.A.; Vuppalanchi, R.; Neuschwander-Tetri, B.A.; Tonascia, J.; Guy, C.; Loomba, R.; Dasarathy, S.; Wattacheril, J.; et al. Impact of obeticholic acid on the lipoprotein profile in patients with non-alcoholic steatohepatitis. J. Hepatol. 2020, 72, 25–33. [Google Scholar] [CrossRef] [PubMed] [Green Version]
  22. Younossi, Z.M.; Ratziu, V.; Loomba, R.; Rinella, M.; Anstee, Q.M.; Goodman, Z.; Bedossa, P.; Geier, A.; Beckebaum, S.; Newsome, P.N.; et al. Obeticholic acid for the treatment of non-alcoholic steatohepatitis: Interim analysis from a multicentre, randomised, placebo-controlled phase 3 trial. Lancet 2019, 394, 2184–2196. [Google Scholar] [CrossRef] [Green Version]
  23. Mudaliar, S.; Henry, R.R.; Sanyal, A.J.; Morrow, L.; Marschall, H.U.; Kipnes, M.; Adorini, L.; Sciacca, C.I.; Clopton, P.; Castelloe, E.; et al. Efficacy and Safety of the Farnesoid X Receptor Agonist Obeticholic Acid in Patients With Type 2 Diabetes and Nonalcoholic Fatty Liver Disease. Gastroenterology 2013, 145, 574–582.e571. [Google Scholar] [CrossRef] [PubMed]
  24. Forman, B.M.; Goode, E.; Chen, J.; Oro, A.E.; Bradley, D.J.; Perlmann, T.; Noonan, D.J.; Burka, L.T.; Mcmorris, T.; Lamph, W.W.; et al. Identification of a nuclear receptor that is activated by farnesol metabolites. Cell 1995, 81, 687–693. [Google Scholar] [CrossRef] [Green Version]
  25. Neuschwander-Tetri, B.A.; Loomba, R.; Sanyal, A.J.; Lavine, J.E.; Van Natta, M.L.; Abdelmalek, M.F.; Chalasani, N.; Dasarathy, S.; Diehl, A.M.; Hameed, B.; et al. Farnesoid X nuclear receptor ligand obeticholic acid for non-cirrhotic, non-alcoholic steatohepatitis (FLINT): A multicentre, randomised, placebo-controlled trial. Lancet 2015, 385, 956–965. [Google Scholar] [CrossRef] [Green Version]
  26. Lian, S.; Li, W.; Wang, D.; Xu, B.; Guo, X.; Yang, H.; Wang, J. Effects of prenatal cold stress on maternal serum metabolomics in rats. Life Sci. 2020, 246, 117432. [Google Scholar] [CrossRef]
  27. Canfora, E.E.; Meex, R.C.R.; Venema, K.; Blaak, E.E. Gut microbial metabolites in obesity, NAFLD and T2DM. Nat. Rev. Endocrinol. 2019, 15, 261–273. [Google Scholar] [CrossRef]
  28. Brandl, K.; Schnabl, B. Intestinal microbiota and nonalcoholic steatohepatitis. Curr. Opin. Gastroenterol. 2017, 33, 128–133. [Google Scholar] [CrossRef] [Green Version]
  29. Gorden, D.L.; Myers, D.S.; Ivanova, P.T.; Fahy, E.; Maurya, M.R.; Gupta, S.; Min, J.; Spann, N.J.; Mcdonald, J.G.; Kelly, S.L.; et al. Biomarkers of NAFLD progression: A lipidomics approach to an epidemic. J. Lipid Res. 2015, 56, 722–736. [Google Scholar] [CrossRef] [Green Version]
  30. Li, Z.; Agellon, L.B.; Allen, T.M.; Umeda, M.; Jewell, L.; Mason, A.; Vance, D.E. The ratio of phosphatidylcholine to phosphatidylethanolamine influences membrane integrity and steatohepatitis. Cell Metab. 2006, 3, 321–331. [Google Scholar] [CrossRef] [Green Version]
  31. Van Der Veen, J.N.; Kennelly, J.P.; Wan, S.; Vance, J.E.; Vance, D.E.; Jacobs, R.L. The critical role of phosphatidylcholine and phosphatidylethanolamine metabolism in health and disease. Biochim. Biophys. Acta (BBA) Biomembr. 2017, 1859, 1558–1572. [Google Scholar] [CrossRef]
  32. Puri, P.; Baillie, R.A.; Wiest, M.M.; Mirshahi, F.; Choudhury, J.; Cheung, O.; Sargeant, C.; Contos, M.J.; Sanyal, A.J. A lipidomic analysis of nonalcoholic fatty liver disease. Hepatology 2007, 46, 1081–1090. [Google Scholar] [CrossRef]
  33. Chocian, G.; Chabowski, A.; Żendzian-Piotrowska, M.; Harasim, E.; Łukaszuk, B.; Górski, J. High fat diet induces ceramide and sphingomyelin formation in rat’s liver nuclei. Mol. Cell. Biochem. 2010, 340, 125–131. [Google Scholar] [CrossRef]
  34. Chun, L.; Junlin, Z.; Aimin, W.; Niansheng, L.; Benmei, C.; Minxiang, L. Inhibition of ceramide synthesis reverses endothelial dysfunction and atherosclerosis in streptozotocin-induced diabetic rats. Diabetes Res. Clin. Pract. 2011, 93, 77–85. [Google Scholar] [CrossRef]
  35. Watson, L.M.; Coghlan, M.; Hundal, S.H. Modulating serine palmitoyl transferase (SPT) expression and activity unveils a crucial role in lipid-induced insulin resistance in rat skeletal muscle cells. Biochem. J. 2009, 417, 791–801. [Google Scholar] [CrossRef] [Green Version]
  36. Alonso, C.; Fernández-Ramos, D.; Varela-Rey, M.; Martínez-Arranz, I.; Navasa, N.; Van Liempd, S.M.; Lavín Trueba, J.L.; Mayo, R.; Ilisso, C.P.; De Juan, V.G.; et al. Metabolomic Identification of Subtypes of Nonalcoholic Steatohepatitis. Gastroenterology 2017, 152, 1449–1461.e1447. [Google Scholar] [CrossRef] [Green Version]
  37. Rom, O.; Liu, Y.; Liu, Z.; Zhao, Y.; Wu, J.; Ghrayeb, A.; Villacorta, L.; Fan, Y.; Chang, L.; Wang, L.; et al. Glycine-based treatment ameliorates NAFLD by modulating fatty acid oxidation, glutathione synthesis, and the gut microbiome. Sci. Transl. Med. 2020, 12, eaaz2841. [Google Scholar] [CrossRef]
  38. Gaggini, M.; Carli, F.; Rosso, C.; Buzzigoli, E.; Marietti, M.; Della Latta, V.; Ciociaro, D.; Abate, M.L.; Gambino, R.; Cassader, M.; et al. Altered amino acid concentrations in NAFLD: Impact of obesity and insulin resistance. Hepatology 2018, 67, 145–158. [Google Scholar] [CrossRef] [Green Version]
  39. Schooneman, M.G.; Vaz, F.M.; Houten, S.M.; Soeters, M.R. Acylcarnitines: Reflecting or Inflicting Insulin Resistance? Diabetes 2013, 62, 1–8. [Google Scholar] [CrossRef] [Green Version]
  40. Honda, T.; Ishigami, M.; Luo, F.; Lingyun, M.; Ishizu, Y.; Kuzuya, T.; Hayashi, K.; Nakano, I.; Ishikawa, T.; Feng, G.G.; et al. Branched-chain amino acids alleviate hepatic steatosis and liver injury in choline-deficient high-fat diet induced NASH mice. Metabolism 2017, 69, 177–187. [Google Scholar] [CrossRef]
  41. Cole, L.K.; Vance, J.E.; Vance, D.E. Phosphatidylcholine biosynthesis and lipoprotein metabolism. Biochim. Biophys. Acta 2012, 1821, 754–761. [Google Scholar] [CrossRef] [PubMed]
  42. Maricic, I.; Girardi, E.; Zajonc, D.M.; Kumar, V. Recognition of Lysophosphatidylcholine by Type II NKT Cells and Protection from an Inflammatory Liver Disease. J. Immunol. 2014, 193, 4580–4589. [Google Scholar] [CrossRef] [PubMed] [Green Version]
  43. Liang, W.; Menke, A.L.; Driessen, A.; Koek, G.H.; Lindeman, J.H.; Stoop, R.; Havekes, L.M.; Kleemann, R.; van den Hoek, A.M. Establishment of a general NAFLD scoring system for rodent models and comparison to human liver pathology. PLoS ONE 2014, 9, e115922. [Google Scholar] [CrossRef] [PubMed] [Green Version]
  44. Brunt, E.M.; Kleiner, D.E.; Wilson, L.A.; Belt, P.; Neuschwander-Tetri, B.A.; Network, N.C.R. Nonalcoholic Fatty Liver Disease (NAFLD) Activity Score and the Histopathologic Diagnosis in NAFLD: Distinct Clinicopathologic Meanings. Hepatology 2011, 53, 810–820. [Google Scholar] [CrossRef] [Green Version]
  45. Chong, J.; Soufan, O.; Li, C.; Caraus, I.; Li, S.; Bourque, G.; Wishart, D.S.; Xia, J. MetaboAnalyst 4.0: Towards more transparent and integrative metabolomics analysis. Nucleic Acids Res. 2018, 46, W486–W494. [Google Scholar] [CrossRef] [Green Version]
  46. Pang, Z.; Chong, J.; Li, S.; Xia, J. MetaboAnalystR 3.0: Toward an Optimized Workflow for Global Metabolomics. Metabolites 2020, 10, 186. [Google Scholar] [CrossRef]
  47. Li, L.; Chang, L.; Zhang, X.; Ning, Z.; Mayne, J.; Ye, Y.; Stintzi, A.; Liu, J.; Figeys, D. Berberine and its structural analogs have differing effects on functional profiles of individual gut microbiomes. Gut Microbes 2020, 1–14. [Google Scholar] [CrossRef]
Figure 1. OCA attenuates hepatic steatosis, inflammatory responses and fibrosis in DIO-CCl4 mice. (A) Representative Hematoxylin and eosin (HE) staining results (magnification ×200). (B) Representative Sirius red staining results (magnification ×50). (CF) Histological assessment of steatosis score, ballooning score, inflammation score and the NAFLD activity score (NAS). (G) Quantification of Sirius Red-positive area. (H) Liver TG was detected. (IK) The serum TG concentration, ALT and AST was measured. (L) Body weight and (M) liver/body ratio. (NS) Gene expression assessment of cyclin D1, CDK1, CDK2, CDK4, Col-1a1 and MCP-1 in livers. * p < 0.05, ** p < 0.01, *** p < 0.005 and **** p < 0.001 vs. DIO-CCl4 group; # p < 0.05, ## p < 0.01, ### p < 0.005 and #### p < 0.001 vs. Control group.
Metabolites 11 00374 g001
Figure 2. The metabolomic analysis of liver, serum and intestine content. (A) PCA score plots of liver, serum and intestine content. (B) PLS-DA score plots of liver, serum and intestine content. (C) Model validation using a permutation test with 200 cycles of liver, serum and intestine content.
Metabolites 11 00374 g002
Figure 3. The metabolomic analysis of liver, serum and intestine content. Heatmaps of metabolic characteristics of liver (A), serum (B) and intestine content (C). (D) Venn plot of differential metabolites (The number means the shared differential metabolites).
Metabolites 11 00374 g003
Figure 4. Volcano plots of metabolic features of liver (A), serum (B) and intestine content (C).
Metabolites 11 00374 g004
Figure 5. Pathway and enrichment analysis of liver perturbed metabolites. (A) Pathway analysis of the differential metabolites. (B) Enrichment analysis of the differential metabolites.
Metabolites 11 00374 g005
Figure 6. The correlations analysis between disease parameters and liver perturbed metabolites levels.
Metabolites 11 00374 g006
Figure 7. The metabolomic analysis of liver among control, model and OCA treated groups. (A) PLS-DA score plot of liver. (B) Model validation of PLS-DA using a permutation test with 200 cycles. (C) Heatmap of metabolic features of liver.
Metabolites 11 00374 g007
Figure 8. Violin plots of the differential metabolites of liver. * p < 0.05, ** p < 0.01, *** p < 0.005 and **** p < 0.001 vs. the DIO-CCl4 group; # p < 0.05, ## p < 0.01, ### p < 0.005 and #### p < 0.001 vs. the Control group.
Metabolites 11 00374 g008
Table 1. Summary of differential metabolites in liver between different groups (amino acids).
DIO vs. ControlDIO−CCl4 vs. DIODIO−CCl4 vs. Control
MetaboliteLog2 FCp ValueChangeLog2 FCp ValueChangeLog2 FCp ValueChange
arginine0.340.32-0.400.21-0.740.002
asparagine0.200.20-0.530.00-0.730.0003
glutamine0.450.14-0.390.28-0.840.011
glutamic acid−0.440.02-−0.470.06-−0.920.00004
proline−0.060.76-0.730.00010.670.0001
tryptophan0.060.68-0.660.00040.730.0002
tyrosine0.420.03-0.680.00011.100.00002
DOPA−0.660.05−0.280.28-−0.940.006
t4 OH proline0.000.98-0.680.0010.680.0001
putrescine1.140.0010.650.03-1.790.002
“-”: no significantly changed; “↓”: significantly decreased; “↑”: significantly increased.
Table 2. Summary of differential metabolites in liver between different groups (PCs and LPCs).
DIO vs. ControlDIO−CCl4 vs. DIODIO−CCl4 vs. Control
MetaboliteLog2 FCp ValueChangeLog2 FCp ValueChangeLog2 FCp ValueChange
lysoPC a C18:10.270.18-0.430.02-0.700.0002
lysoPC a C20:40.620.09-0.050.87-0.680.0003
PC aa C32:1−0.950.00030.140.16-−0.810.001
PC aa C32:2−0.800.0010.001.00-−0.810.001
PC aa C34:2−0.380.02-−0.330.09-−0.700.0001
PC aa C34:3−0.450.02-−0.370.06-−0.820.0002
PC aa C36:3−0.690.0004−0.120.20-−0.820.0001
PC aa C36:5−1.330.0001−0.360.00-−1.690.00005
PC aa C36:6−0.800.0005−0.140.21-−0.940.0003
PC aa C40:2−0.500.003-−0.200.09-−0.700.0001
PC aa C40:3−0.980.0001−0.320.03-−1.300.00003
PC aa C42:2−0.830.000005−0.030.63-−0.850.00001
PC aa C42:6−0.380.02-−0.710.003−1.090.0001
PC ae C34:00.030.64-0.600.001-0.620.0001
PC ae C34:2−0.910.0001−0.040.75-−0.950.00001
PC ae C34:3−0.510.004-−0.340.05-−0.850.0001
PC ae C36:3−0.820.00010.060.67-−0.760.0001
PC ae C38:0−0.610.003-−0.240.09-−0.850.0004
PC ae C38:2−0.840.0001−0.760.001−1.600.00001
PC ae C38:3−0.670.001−0.130.32-−0.800.0001
PC ae C38:50.070.36-0.800.0010.870.0004
PC ae C40:1−0.560.00-−0.250.02-−0.810.00003
PC ae C40:2−0.910.00001−0.400.001-−1.300.00002
PC ae C40:3−0.650.00004−0.380.01-−1.020.000004
PC ae C42:0−0.730.0002−0.260.003-−0.990.0001
PC ae C42:1−0.730.00020.120.41-−0.620.0004
PC ae C42:4−1.180.00002−0.180.04-−1.350.00002
“-”: no significantly changed; “↓”: significantly decreased; “↑”: significantly increased.
Table 3. Summary of differential metabolites in liver between different groups (SMs and acylcarnitines).
DIO vs. ControlDIO−CCl4 vs. DIODIO−CCl4 vs. Control
MetaboliteLog2 FCp ValueChangeLog2 FCp ValueChangeLog2 FCp ValueChange
SM OH C14:10.490.02-0.650.011.150.001
SM OH C16:10.520.001-0.530.002-1.060.0003
SM C16:0−0.070.52-0.850.00020.780.0001
SM C18:01.130.00010.600.001-1.730.0001
SM C18:10.820.021.030.0011.850.0004
SM C24:0−0.750.00010.060.74-−0.690.00002
Butyrylcarnitine−0.030.76-1.510.00011.480.00001
Tiglylcarnitine−0.050.91-0.880.00020.830.000003
Glutarylcarnitine0.070.63-0.610.001-0.680.0004
Octanoylcarnitine0.460.01-0.340.02-0.800.0001
“-”: no significantly changed; “↓”: significantly decreased; “↑”: significantly increased.
Publisher’s Note: MDPI stays neutral with regard to jurisdictional claims in published maps and institutional affiliations.

