
NMR Methods for Determining Lipid Turnover via Stable Isotope Resolved Metabolomics
by
 , , and
Penghui Lin
1 ,
,
Li Dai
2,
Daniel R. Crooks
2,
Leonard M. Neckers
2,
Richard M. Higashi
1,3,
Teresa W-M. Fan
1,3 and
and
Andrew N. Lane
1,3,* 1
Center for Environmental and Systems Biochemistry, University of Kentucky, 789 S. Limestone St, Lexington, KY 40536, USA
2
Urologic Oncology Branch, Center for Cancer Research, National Cancer Institute, National Institutes of Health, Bethesda, MD 20892, USA
3
Department Toxicology & Cancer Biology, University of Kentucky, 789 S. Limestone St, Lexington, KY 40536, USA
*
Author to whom correspondence should be addressed.
Metabolites 2021, 11(4), 202; https://doi.org/10.3390/metabo11040202
Submission received: 25 January 2021
/
Revised: 23 March 2021
/
Accepted: 26 March 2021
/
Published: 29 March 2021
(This article belongs to the Special Issue Stable Isotope Guided Metabolomics)
Abstract
:Lipids comprise diverse classes of compounds that are important for the structure and properties of membranes, as high-energy fuel sources and as signaling molecules. Therefore, the turnover rates of these varied classes of lipids are fundamental to cellular function. However, their enormous chemical diversity and dynamic range in cells makes detailed analysis very complex. Furthermore, although stable isotope tracers enable the determination of synthesis and degradation of complex lipids, the numbers of distinguishable molecules increase enormously, which exacerbates the problem. Although LC-MS-MS (Liquid Chromatography-Tandem Mass Spectrometry) is the standard for lipidomics, NMR can add value in global lipid analysis and isotopomer distributions of intact lipids. Here, we describe new developments in NMR analysis for assessing global lipid content and isotopic enrichment of mixtures of complex lipids for two cell lines (PC3 and UMUC3) using both 13C6 glucose and 13C5 glutamine tracers.
1. Introduction
Lipids comprise an extremely diverse group of compounds that have a wide range of biological functions from structure (e.g., membranes) to signaling molecules. Even discounting all the many ways in which they form complexes with other molecules, lipids come in an enormous diversity of forms [1,2]. These range from fatty acids as short as acetate (n = 2) to palmitic acid, the end product of fatty acid synthase activity (n = 16), to longer chain fatty acids such as arachidonic acids (n = 24), which are incorporated into complex lipids via esterification to a variety of headgroups (Figure S1, Scheme S1). The natural fatty acids may be saturated or have different numbers of double bonds in different positions, and may have either odd or even chain lengths, and in some cases branched chains. A completely separate and diverse branch of lipids also based on acetate is the steroids, which include cholesterol, and their metabolic products, the bile acids. Complex lipids comprise compounds that contain 1–3 fatty acyl chains linked to a short backbone group such as glycerol, which is further esterified to a wide range of head groups. Even for glycerophospholipids with 6 different headgroups and 20 fatty acids, there are thousands of possible lipids (many of which do not occur naturally) [Figure S1]. A significant number of the lipids are also isomers, further complicating analysis, and which is only partly resolved by tandem MS at a very high resolution [3]. It has been estimated that there are more than 1000 natural lipid species present in a eukaryotic cell [4], and all organisms either synthesize them de novo or acquire them from the diet [5]. In mammals, there are a few essential fatty acids such as linoleic and α-linolenic acid, but there are also many lipids present that are of exogenous origin (e.g., cholesterol, triacylglycerols, and fatty acids), and all may be represented in the analytical platforms [6,7,8]. Furthermore, the range of concentrations of various lipids found in tissues is very large. Much of lipidomics has been concerned with identifying which lipids are present in specific biological systems. Although most of this work has been done by mass spectrometry, there are increasingly extensive databases being made available for heteronuclear NMR [9,10], which complements the LC MS/MS methods commonly used.
Metabolomics is a powerful tool for directly accessing molecular level change in cells. With the help of stable isotope labeling, it is possible to follow the fate of individual atoms from precursors into downstream metabolites. However, assessing stable isotope incorporation into complex lipids, especially at low enrichment, has long been a challenge due to the complexity of lipid structures and the vast number of lipid species [11,12]. Nevertheless, modern mass spectrometers are capable of resolving different isotopologues in stable isotope experiments designed to assess lipid turnover in a wide variety of biological systems including tracer studies in vivo [13,14,15,16,17,18,19]. Furthermore, lipid synthesis involves multiple metabolic pathways: both fatty acids and cholesterol derived from AcCoA (Acetyl Coenzyme A) units but in separately regulated pathways, and the glycerol and headgroup subunits of the glycerolipids, involve other pathways such as glycolysis (for glycerol) and amino acid synthesis or uptake (e.g., serine) (cf. Figure S1). Assessing the relative importance of these different pathways and nutrient sources requires stable isotope tracing [20].
Cancers exhibit enhanced nutrient utilization and metabolic reprogramming [21,22,23,24,25,26,27]. As the metabolism is a complex network of coupled chemical reactions that transfer substructures of molecules, the metabolite substructures must be tracked. Stable isotope resolved metabolomics (SIRM) distinguishes pathways, functions, and even chemically identical metabolites by tracking the provenance of substructures via NMR [28]. Beyond pathways, the metabolic networks can be tracked through multiplexed SIRM (mSIRM) experiments [29] which requires higher instrument performance to accommodate its needs.
NMR-based SIRM measurements provide information about positional labeling due to metabolic activity, and thus about pathway utilization by cells under different conditions [23]. This is accomplished by administering metabolic tracers with stable isotope labels to cell or tissue cultures or whole organisms, including rodents and human subjects. We use both multinuclear NMR and UHR-MS (UltraHigh Resolution Mass Spectrometry) to analyze multi-elemental isotopologues [29,30]. Although stable isotope tracing has been widely used for polar metabolites, it has not been extensively applied to lipidomics, which is almost exclusively studied by mass spectrometry [13,20,31,32,33]. Furthermore, with some exceptions, much of the MS-based lipid tracing has used deuterium, such as the incorporation from heavy water in physiological experiments [19,33]. Although NMR is generally much less sensitive than MS, and the resolution of lipid species is low in NMR, there are global features of lipid mixtures than are more readily accessible by NMR than by MS, especially in the context of 13C metabolic tracing [20,34,35]. There has been increasing interest in using NMR with stable isotope tracing for lipid analysis, in a diverse range of settings [36,37,38,39,40]. The use of a 2H or 13C stable isotope tracer or a combination of both for NMR analysis to study de novo lipogenesis has been reported [40,41]. However, direct 2H or 13C detection have low sensitivity, so it is very time-consuming to acquire high-quality spectra compared with 1H detection. Although direct 13C detection observes non-protiated positions (e.g., carbonyl and quaternary carbons), and generally there is higher resolution, proton detection can be up to 32 times as sensitive as direct 13C detection, where a gated decoupling experiment is used for quantitative analysis, thus requiring either more than an order of magnitude less material or up to three orders of magnitude less time for the same signal-to-noise ratio. Similarly, 2H has poorer resolution and is up to 100 times less sensitive than 1H, though, because of the short T1 value, it may be of comparable sensitivity to 13C [41].
In particular we compare results using TOCSY (Total Correlation Spectroscopy) and 1D 1H{13C}-HSQC (Heteronuclear Single Quantum Coherence spectroscopy) for determining 13C incorporation into different metabolic subunits of complex lipids (glycerol versus fatty acyl chains in glycerolipids, and methyl groups of cholesterol) in an unfractionated mixture. This study utilizes the methyl resonances of phosphatidyl choline (PC) as an internal reference, which has a known natural abundance level of 13C, to normalize other lipid subgroup signals in both 1D proton and 1D HSQC spectra to determine the fractional enrichment. The TOCSY spectra are used for two purposes: (i) signal assignment and (ii) independently determining 13C enrichment, at least for the glycerol subunits.
TRAP-1 (TNF (Tumor Necrosis Factor) Receptor Associated Protein-1) is a mitochondrial chaperone protein of the heat shock family. It has been reported that TRAP-1−/− mice showed a reduced incidence of age-associated pathologies, including obesity, inflammatory tissue degeneration, dysplasia, and spontaneous tumor formation [42]. This was accompanied by a global upregulation of oxidative phosphorylation and glycolysis transcriptomes, causing deregulated mitochondrial respiration, oxidative stress, impaired cell proliferation, and a switch to glycolytic metabolism in vivo. These data identify TRAP-1 as a central regulator of mitochondrial bioenergetics, and this pathway could contribute to metabolic rewiring in tumors [42]. Here we illustrate how high resolution heteronuclear NMR can complement MS and can be used to determine the levels of labeling in different subunits of intact lipids on a global scale, using PC3 (prostate cancer) and UMUC3 (bladder cancer) cells with or without TRAP-1 knockout, grown in the presence of uniformly 13C-labeled ([U-13C])- glucose or [U-13C]-glutamine.
2. Results
2.1. NMR Analysis
High resolution tandem mass spectrometry can provide very detailed information about the particular lipid species present in a complex mixture, and thus about the labeling patterns of metabolic subunits. However, that approach is less suited for addressing questions about lipids in bulk including the major metabolic subunit labeling (e.g., glycerol versus acyl chains) and the relative abundances of classes of complex lipids (e.g., phosphatidylcholines and cholesterol). We have developed a way to quickly estimate the incorporation of 13C into different subunits of complex lipids in bulk by NMR. Using cellular phosphatidylcholine lipids (PCs) as an internal standard, we can quickly assess the 13C incorporation levels into different functional groups of unfractionated lipids. Since mammalian cells do not have the ability for de novo synthesis of choline, all the choline methyl groups inside the cells are at natural abundance (1.07%). The ratio of peak intensities of other species to that of PC methyl peaks in the proton spectrum represents the unlabeled species and that from the HSQC spectrum reflects the labeled species. The relations between these two ratios gives the 13C fractional enrichment of the specific groups. Furthermore, by comparing the intensities of the choline peaks with those of glycerol or cholesterol, the relative amounts of these classes of lipids can be estimated.
2.2. 13C Incorporation from Glucose and Glutamine by 1H NMR
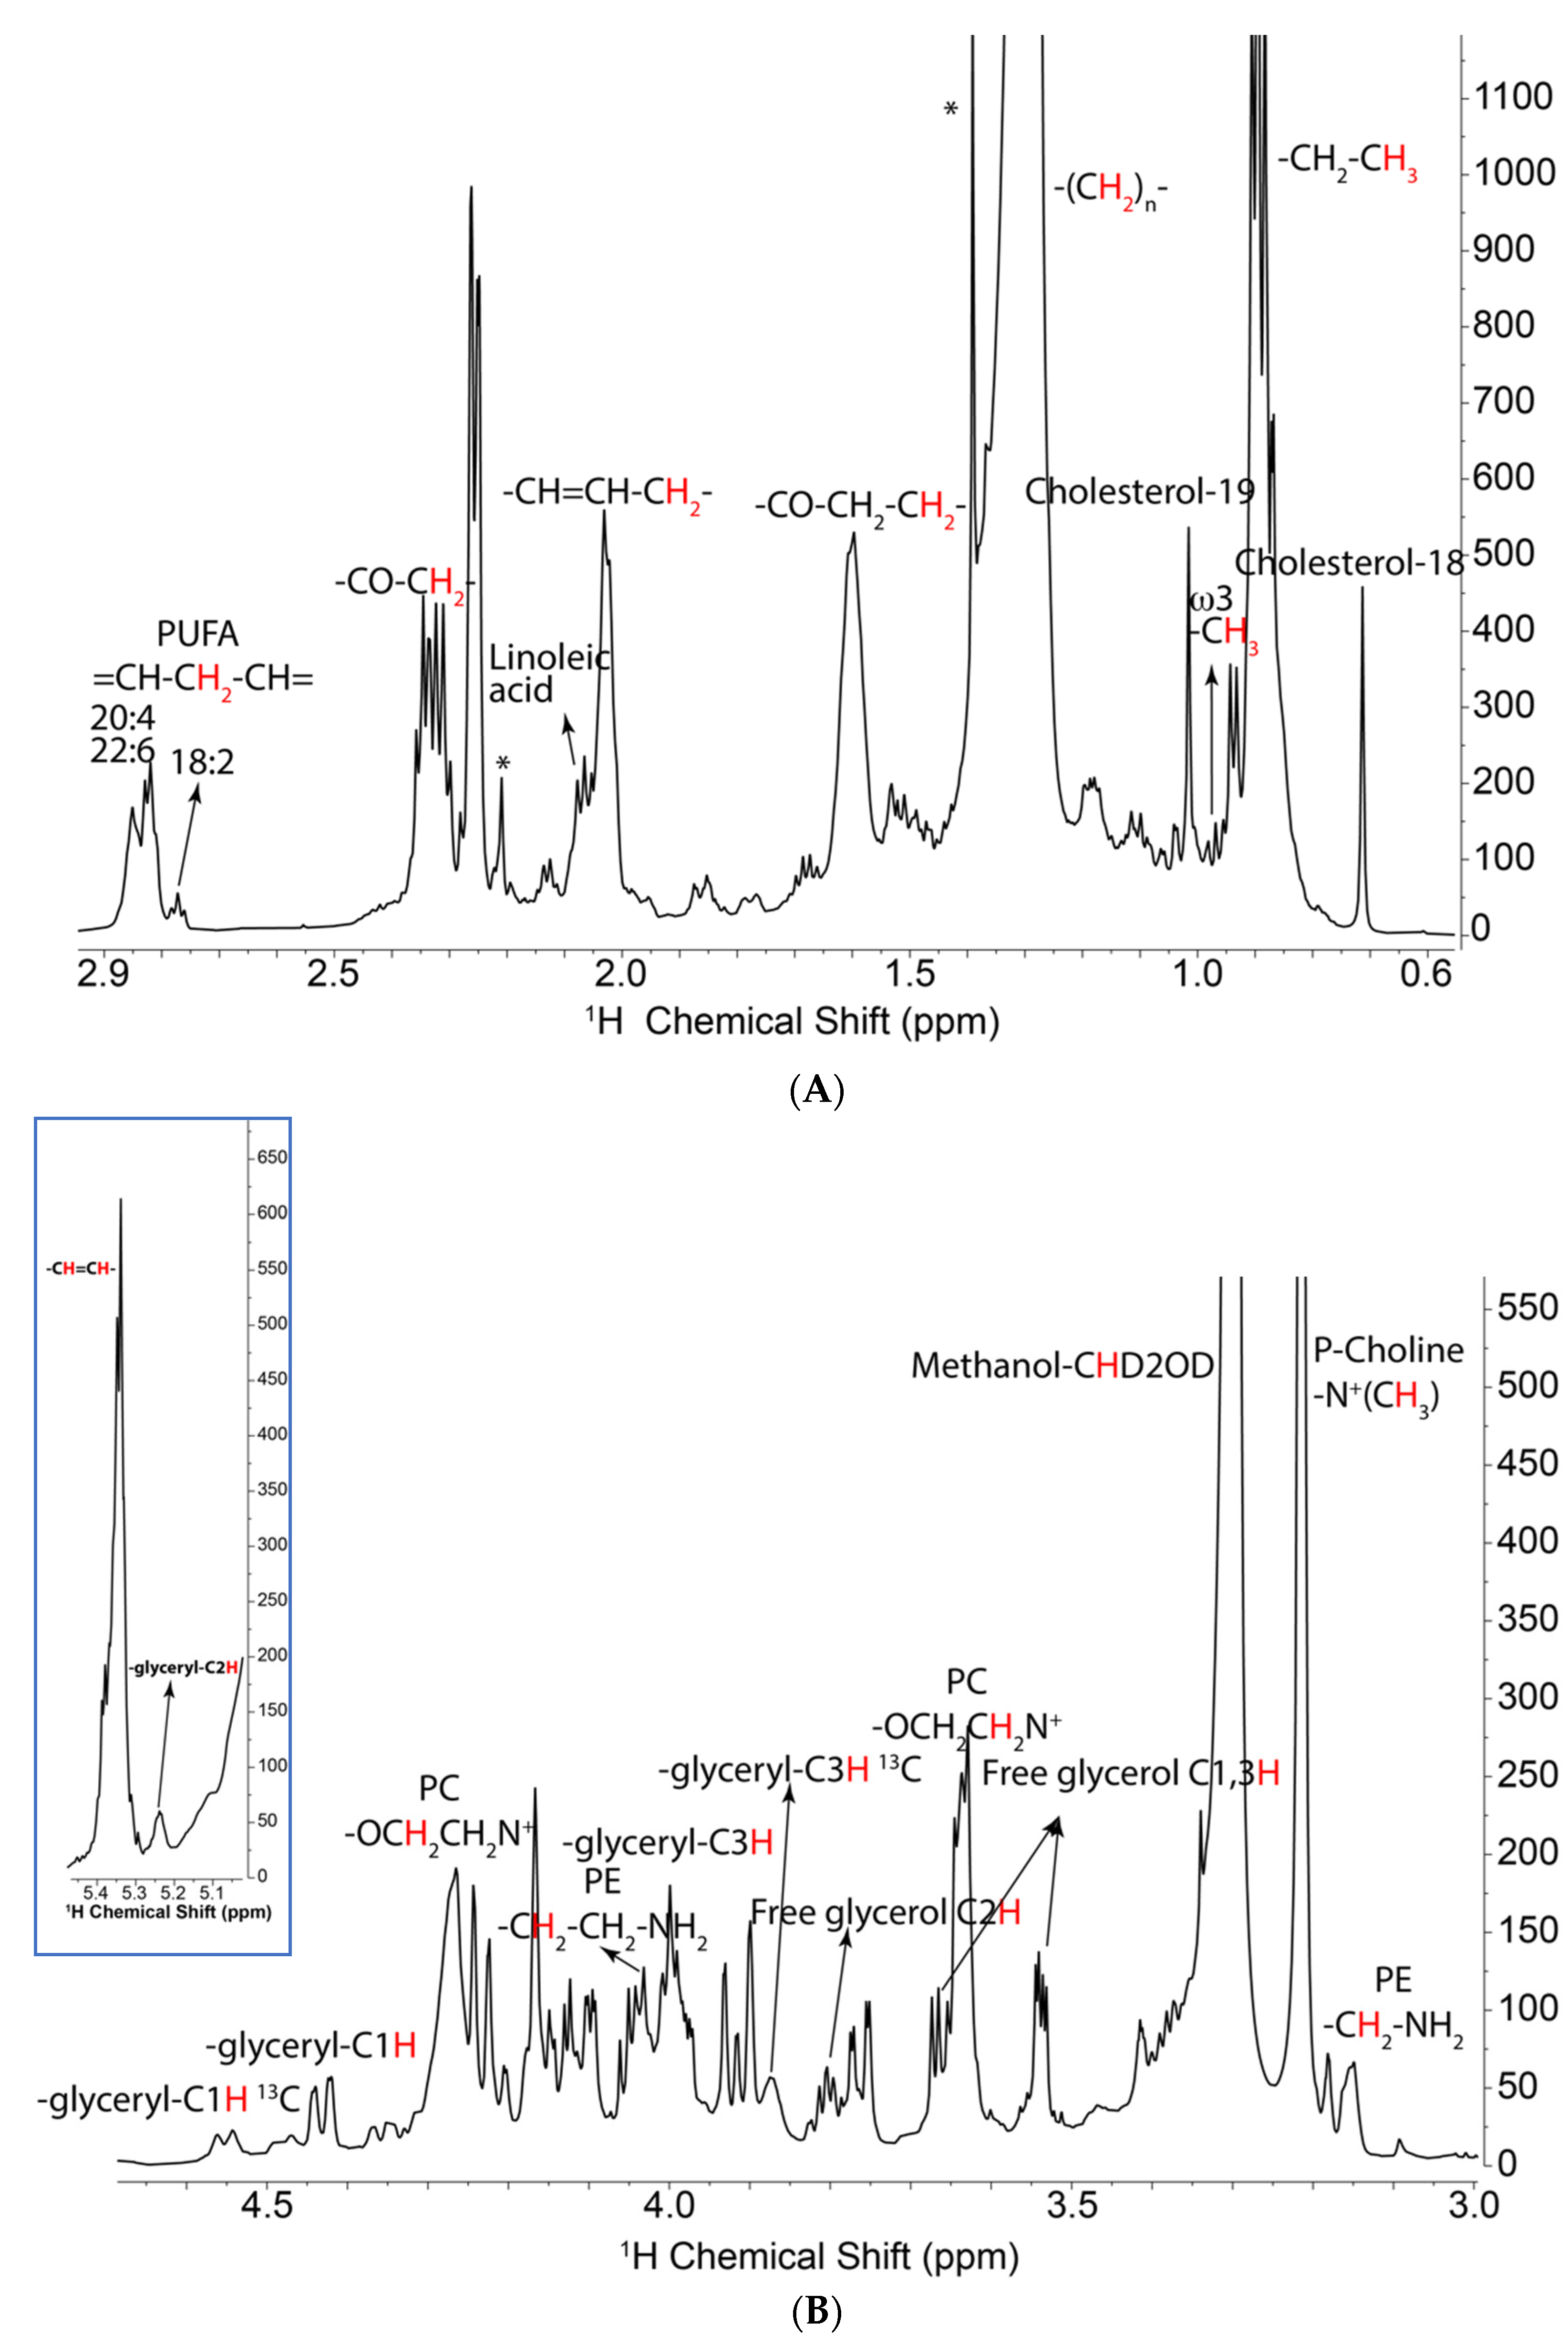
Two different cell lines (PC3 and UMUC3) were treated with either [U-13C]-glucose or [U-13C]-glutamine tracers (U = uniformly labeled). The cellular lipids were extracted and analyzed by 1H NMR for maximal sensitivity. However, due to the overall low fraction of 13C lipids species and severe overlapping with other signals, the 13C satellite peaks of those incorporated species are difficult to quantify. Figure 1 shows a 1D 1H spectrum of PC3 lipids grown in the presence of [U-13C]-glucose. The acyl chains are observed in the region from 0.8 to 3 ppm (Figure 1A), including the terminal methyl groups, the bulk CH2, and the resolved protons attached to C2, C3, and C4. In addition, cholesterol methyl resonances are well resolved at 0.7 and 1 ppm. 13C satellites are difficult to discern in these spectra due to their low intensity as well as overlapping with other signals. The choline and ethanolamine headgroup resonances and those of the glycerol backbone subunit of the phospholipids are between 3 and 5 ppm (Figure 1B). Only one of the glycerol head group C1 carbon satellites is easily observed in the proton spectrum (Figure 1B). The C3 carbon satellite is visible but hard to quantify, as it overlapped surrounding peaks.
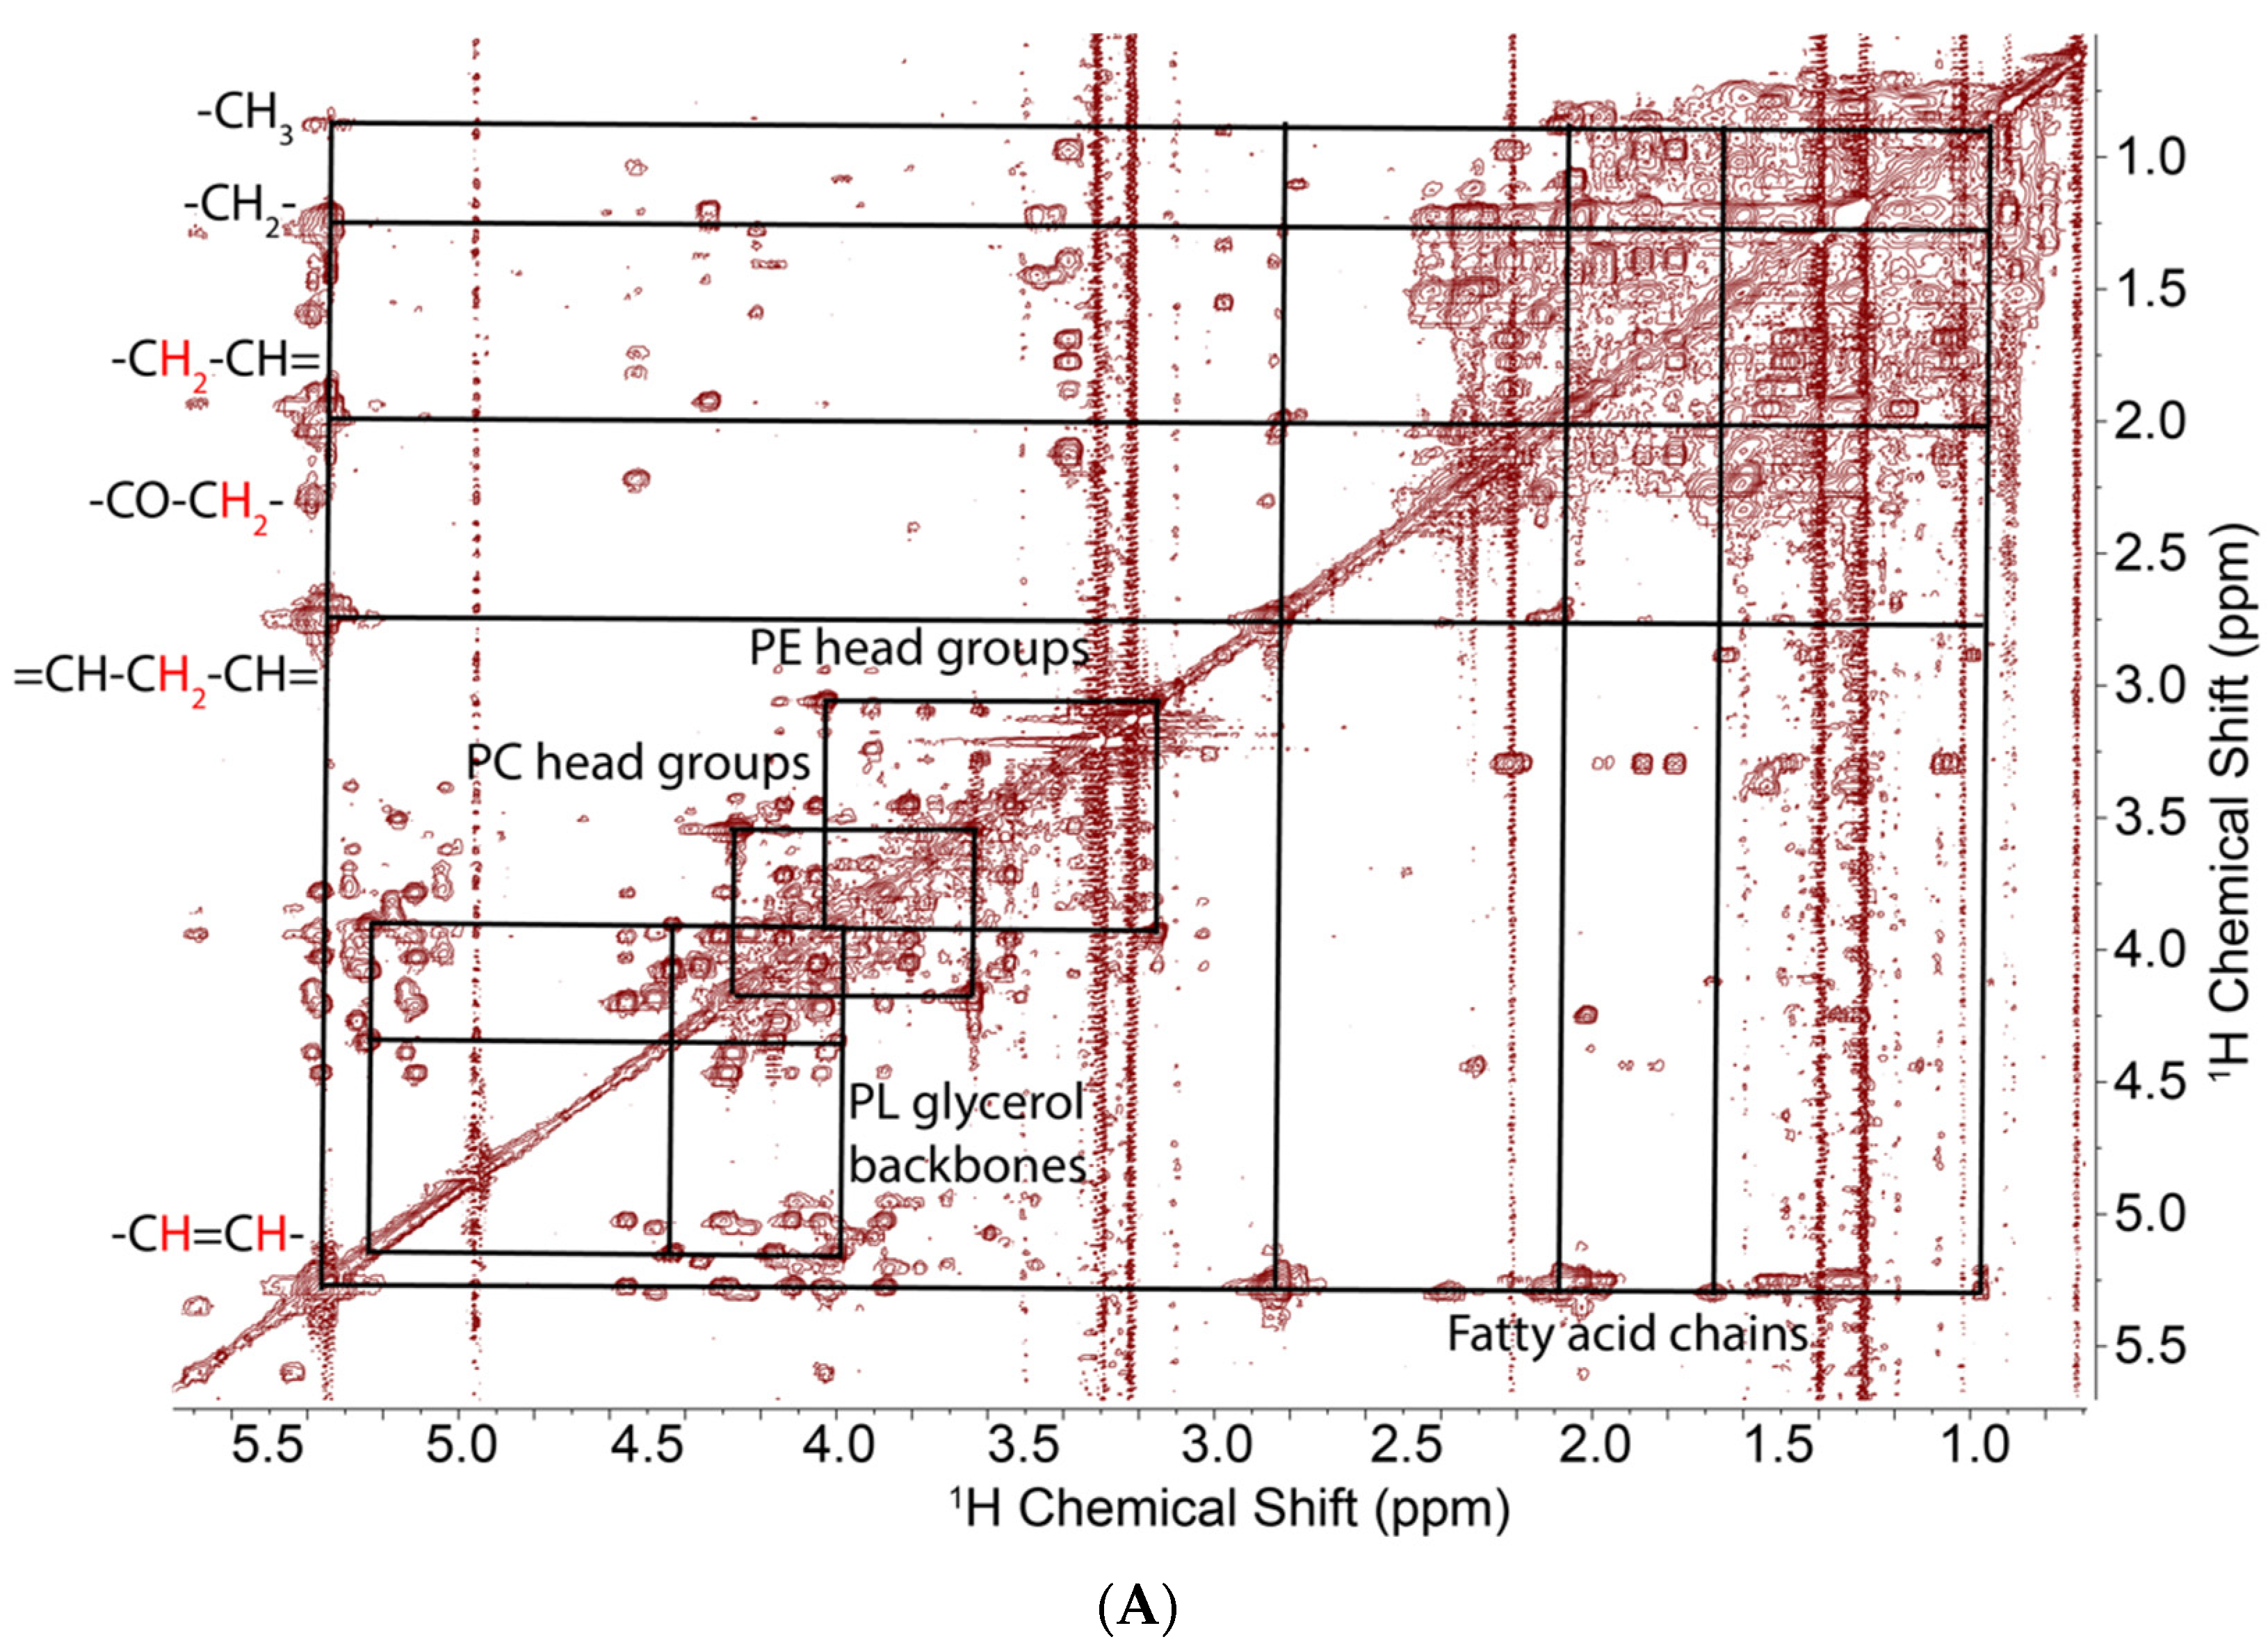
To determine the labeling patterns more clearly, we recorded two dimensional TOCSY and HSQC spectra, which showed clear cross peak patterns and appropriate chemical shifts for all the C1, C2, and C3 positions of the glycerol subunit in glycerolipids [44]. The TOCSY spectra (Figure 2A,B boxes) showed reproducible and substantial 13C labeling in the glycerol subunits (>50%, Table 1) [34,35,45] of extracts of cells grown in the presence of [U-13C]-glucose, which were absent in the extracts of cells grown on unlabeled media or media containing [U-13C]-glutamine. The HSQC spectrum (Figure 2C) confirmed the assignments of the peaks observed in the 1D and TOCSY spectra. The 13C satellites in the TOCSY spectrum can be volume integrated to provide the positional (isotopomer) enrichment in the glycerol subunits. The TOCSY spectra also show some resolution of the acyl chains, most notably at the sites of unsaturation, the terminal methyl group, and at the C2,C3,C4 positions of the acyl chains (Figure 2A). However, in these cells, the labeling of the acyl chains was low, such that the integration of the TOCSY and 1D proton spectra was not reliable if not impossible. We then turned to the assessment of 13C incorporation using 1D 13C{1H}-HSQC spectra, as described in the Methods.
2.3. Determination of 13C Incorporation from Glucose and Glutamine by 1H{13C}-HSQC
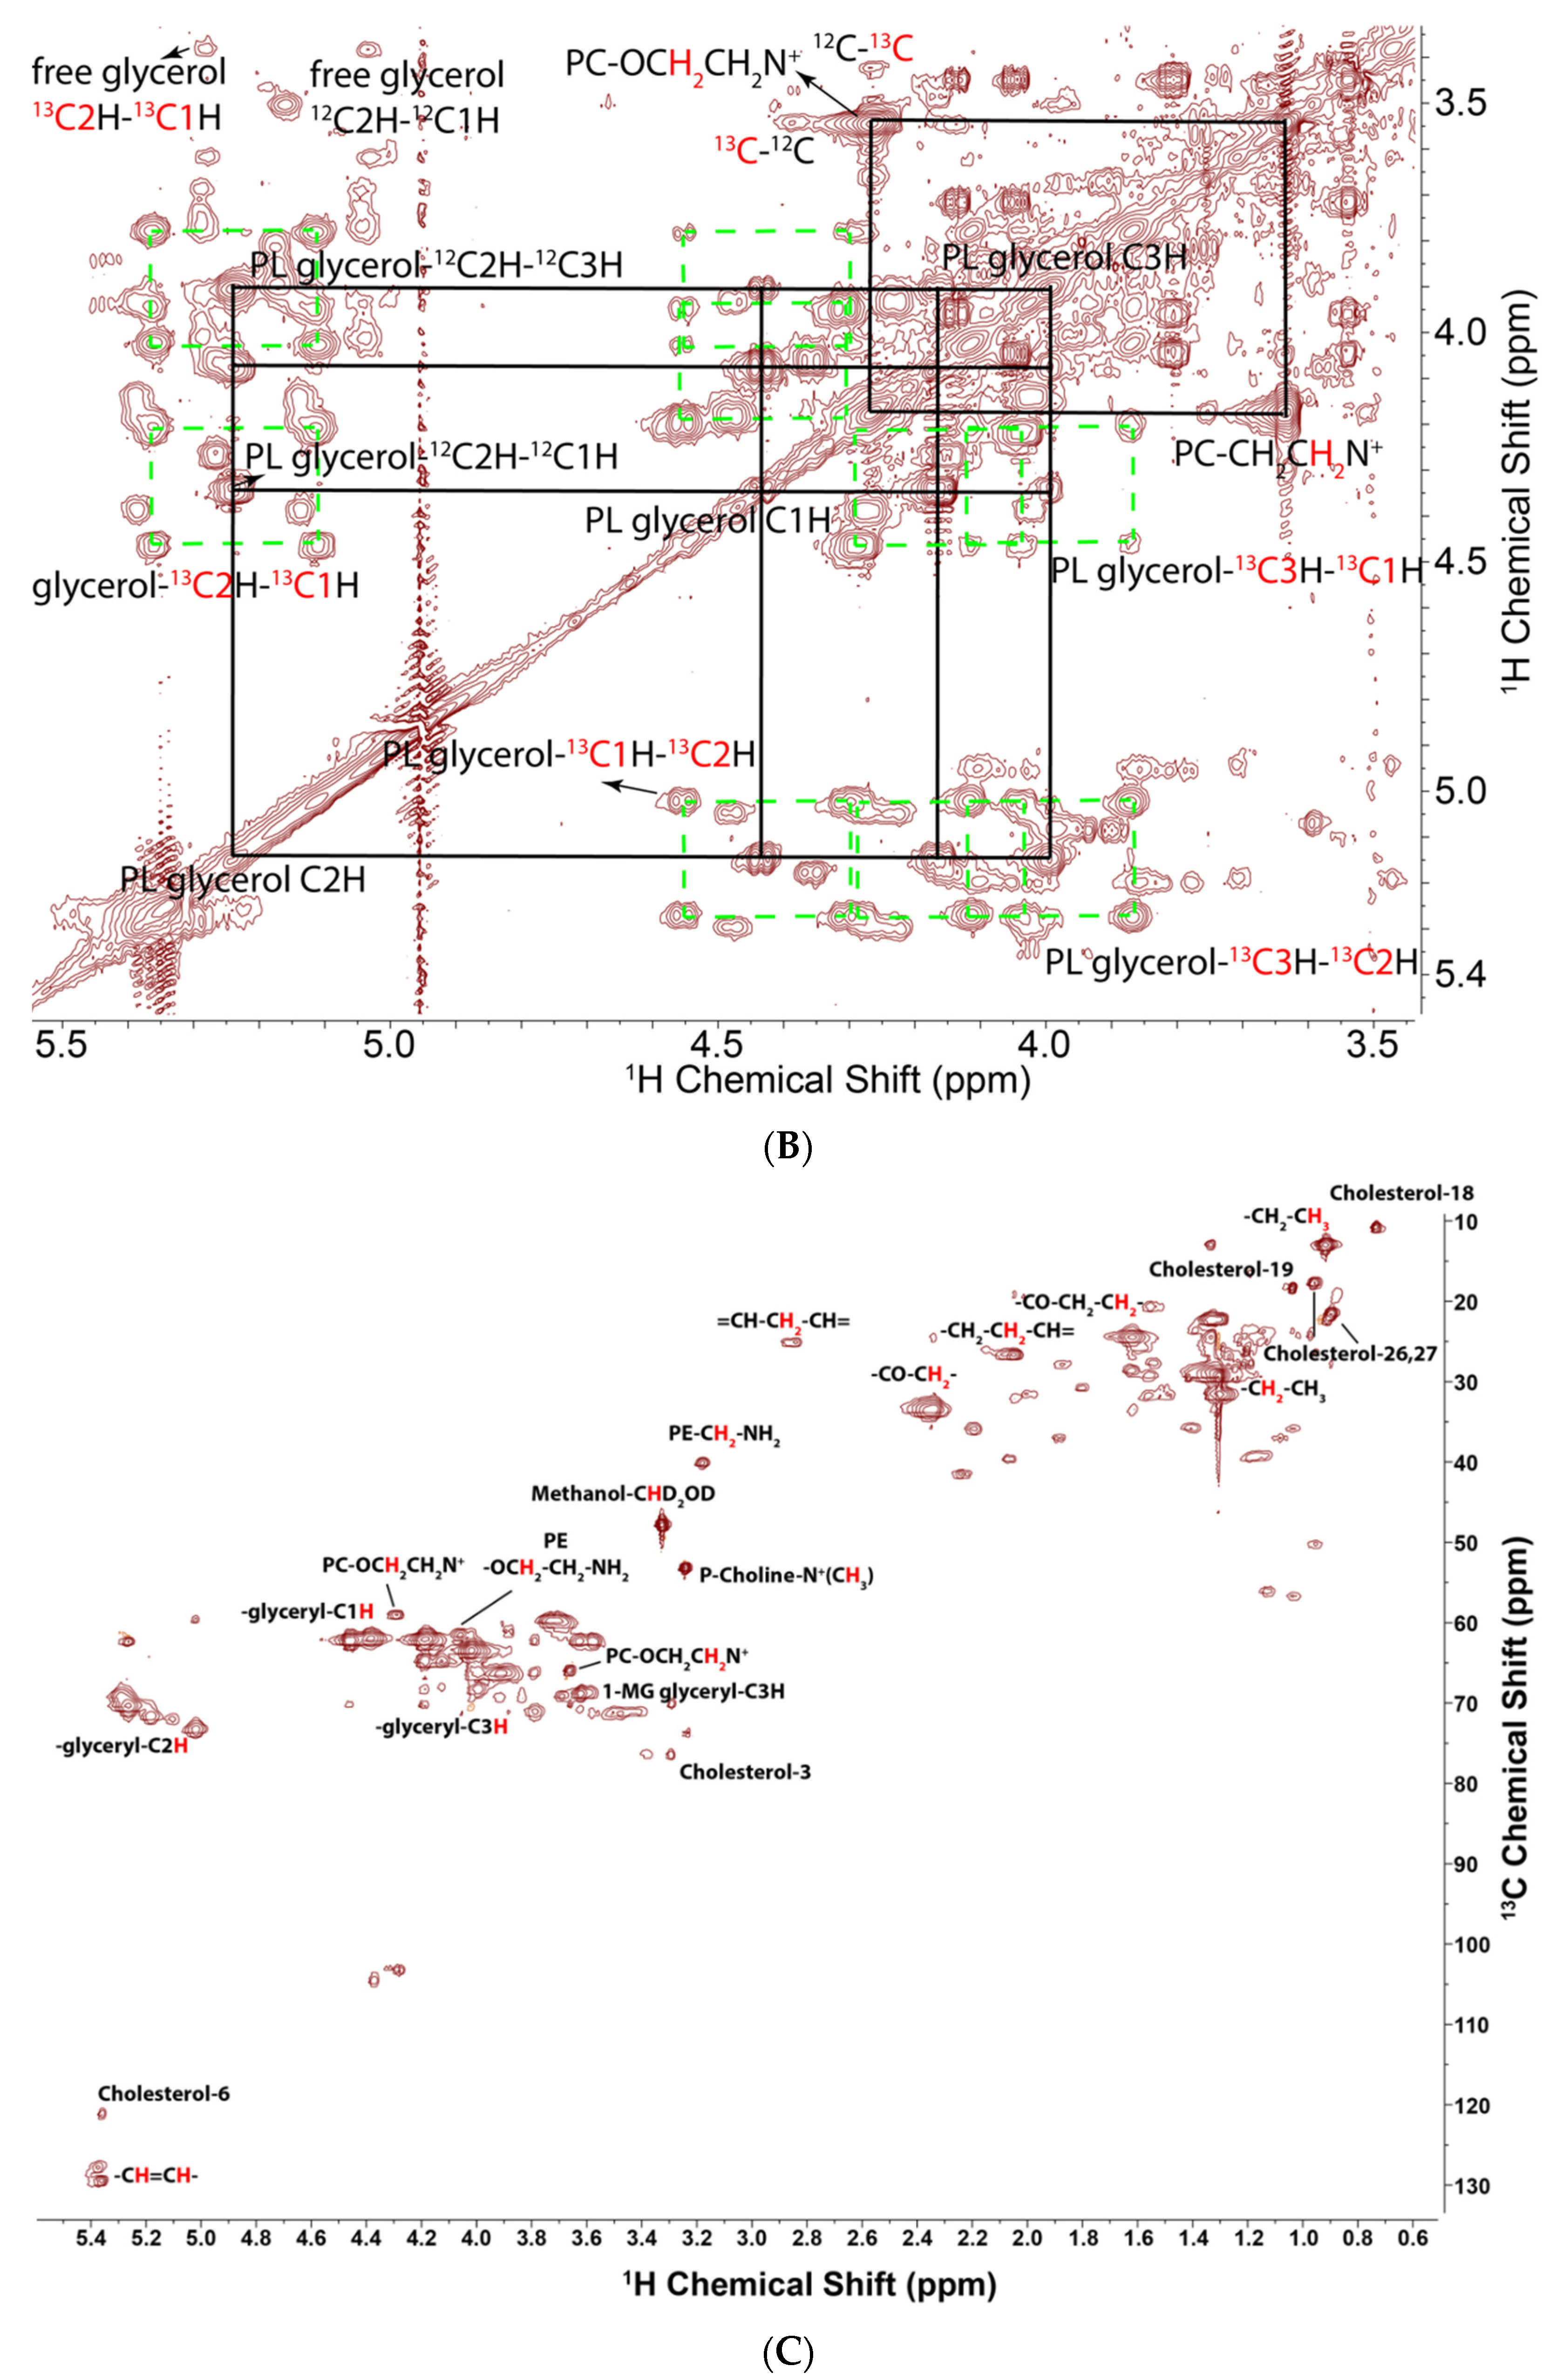
The 1D HSQC spectra of the lipid extracts from PC3 and UMUC3 cells grown in the presence of either [U-13C]-glucose or [U-13C]-glutamine are compared with the same cells grown in the presence of unlabeled glucose in Figure 3 and Figure S3. As Figure 3 shows, the extracts of cells grown on [U-13C]-glucose show much more intense glycerol peaks than either the [U-13C]-Gln or unlabeled samples. Revealingly, the various acyl chain peaks are also more intense in the glucose sample indicating significant 13C incorporation into the fatty acyl chain. The actual 13C incorporation into each position was calculated, as described in the Methods section. From Table 1, it is clear that, in both cell lines grown on 13C-glucose, the glycerol head groups were heavily enriched (over 50%), since they derive from dihydroxyacetone-3-phosphate, which is an intermediate of glycolysis. These agreed very well with the integration from the carbon satellite peaks of these groups from proton spectra as well as 2D TOCSY spectra. We quantified the central unlabeled peaks as well as the 13C satellite peaks from the TOCSY spectrum (cf. Figure 2A) of one WT PC3 sample and found that the glycerol C1 group 13C enrichment was 60.31%, the C2 group enrichment was 51.26%, and the C3 group enrichment was 59.57%, respectively, and these are very close to the figures calculated from 1D HSQC for this particular sample (62.7%, 50.4%, and 66.7%). Furthermore, the natural abundance 13C level averaged over all unlabeled samples and positions was 1.08 ± 0.37% (Table 1), which agrees well with the expected value of 1.07%. This indicates that our method of estimating the fractional enrichment from the 1D HSQC is viable. For comparison, we also recorded a direct observe 13C spectrum of the lipid extract of PC3 cells grown in the presence of [U-13C]-glucose, which required 18 h acquisition for a comparable signal-to-noise ratio to the 1D HSQC (Figure S4).
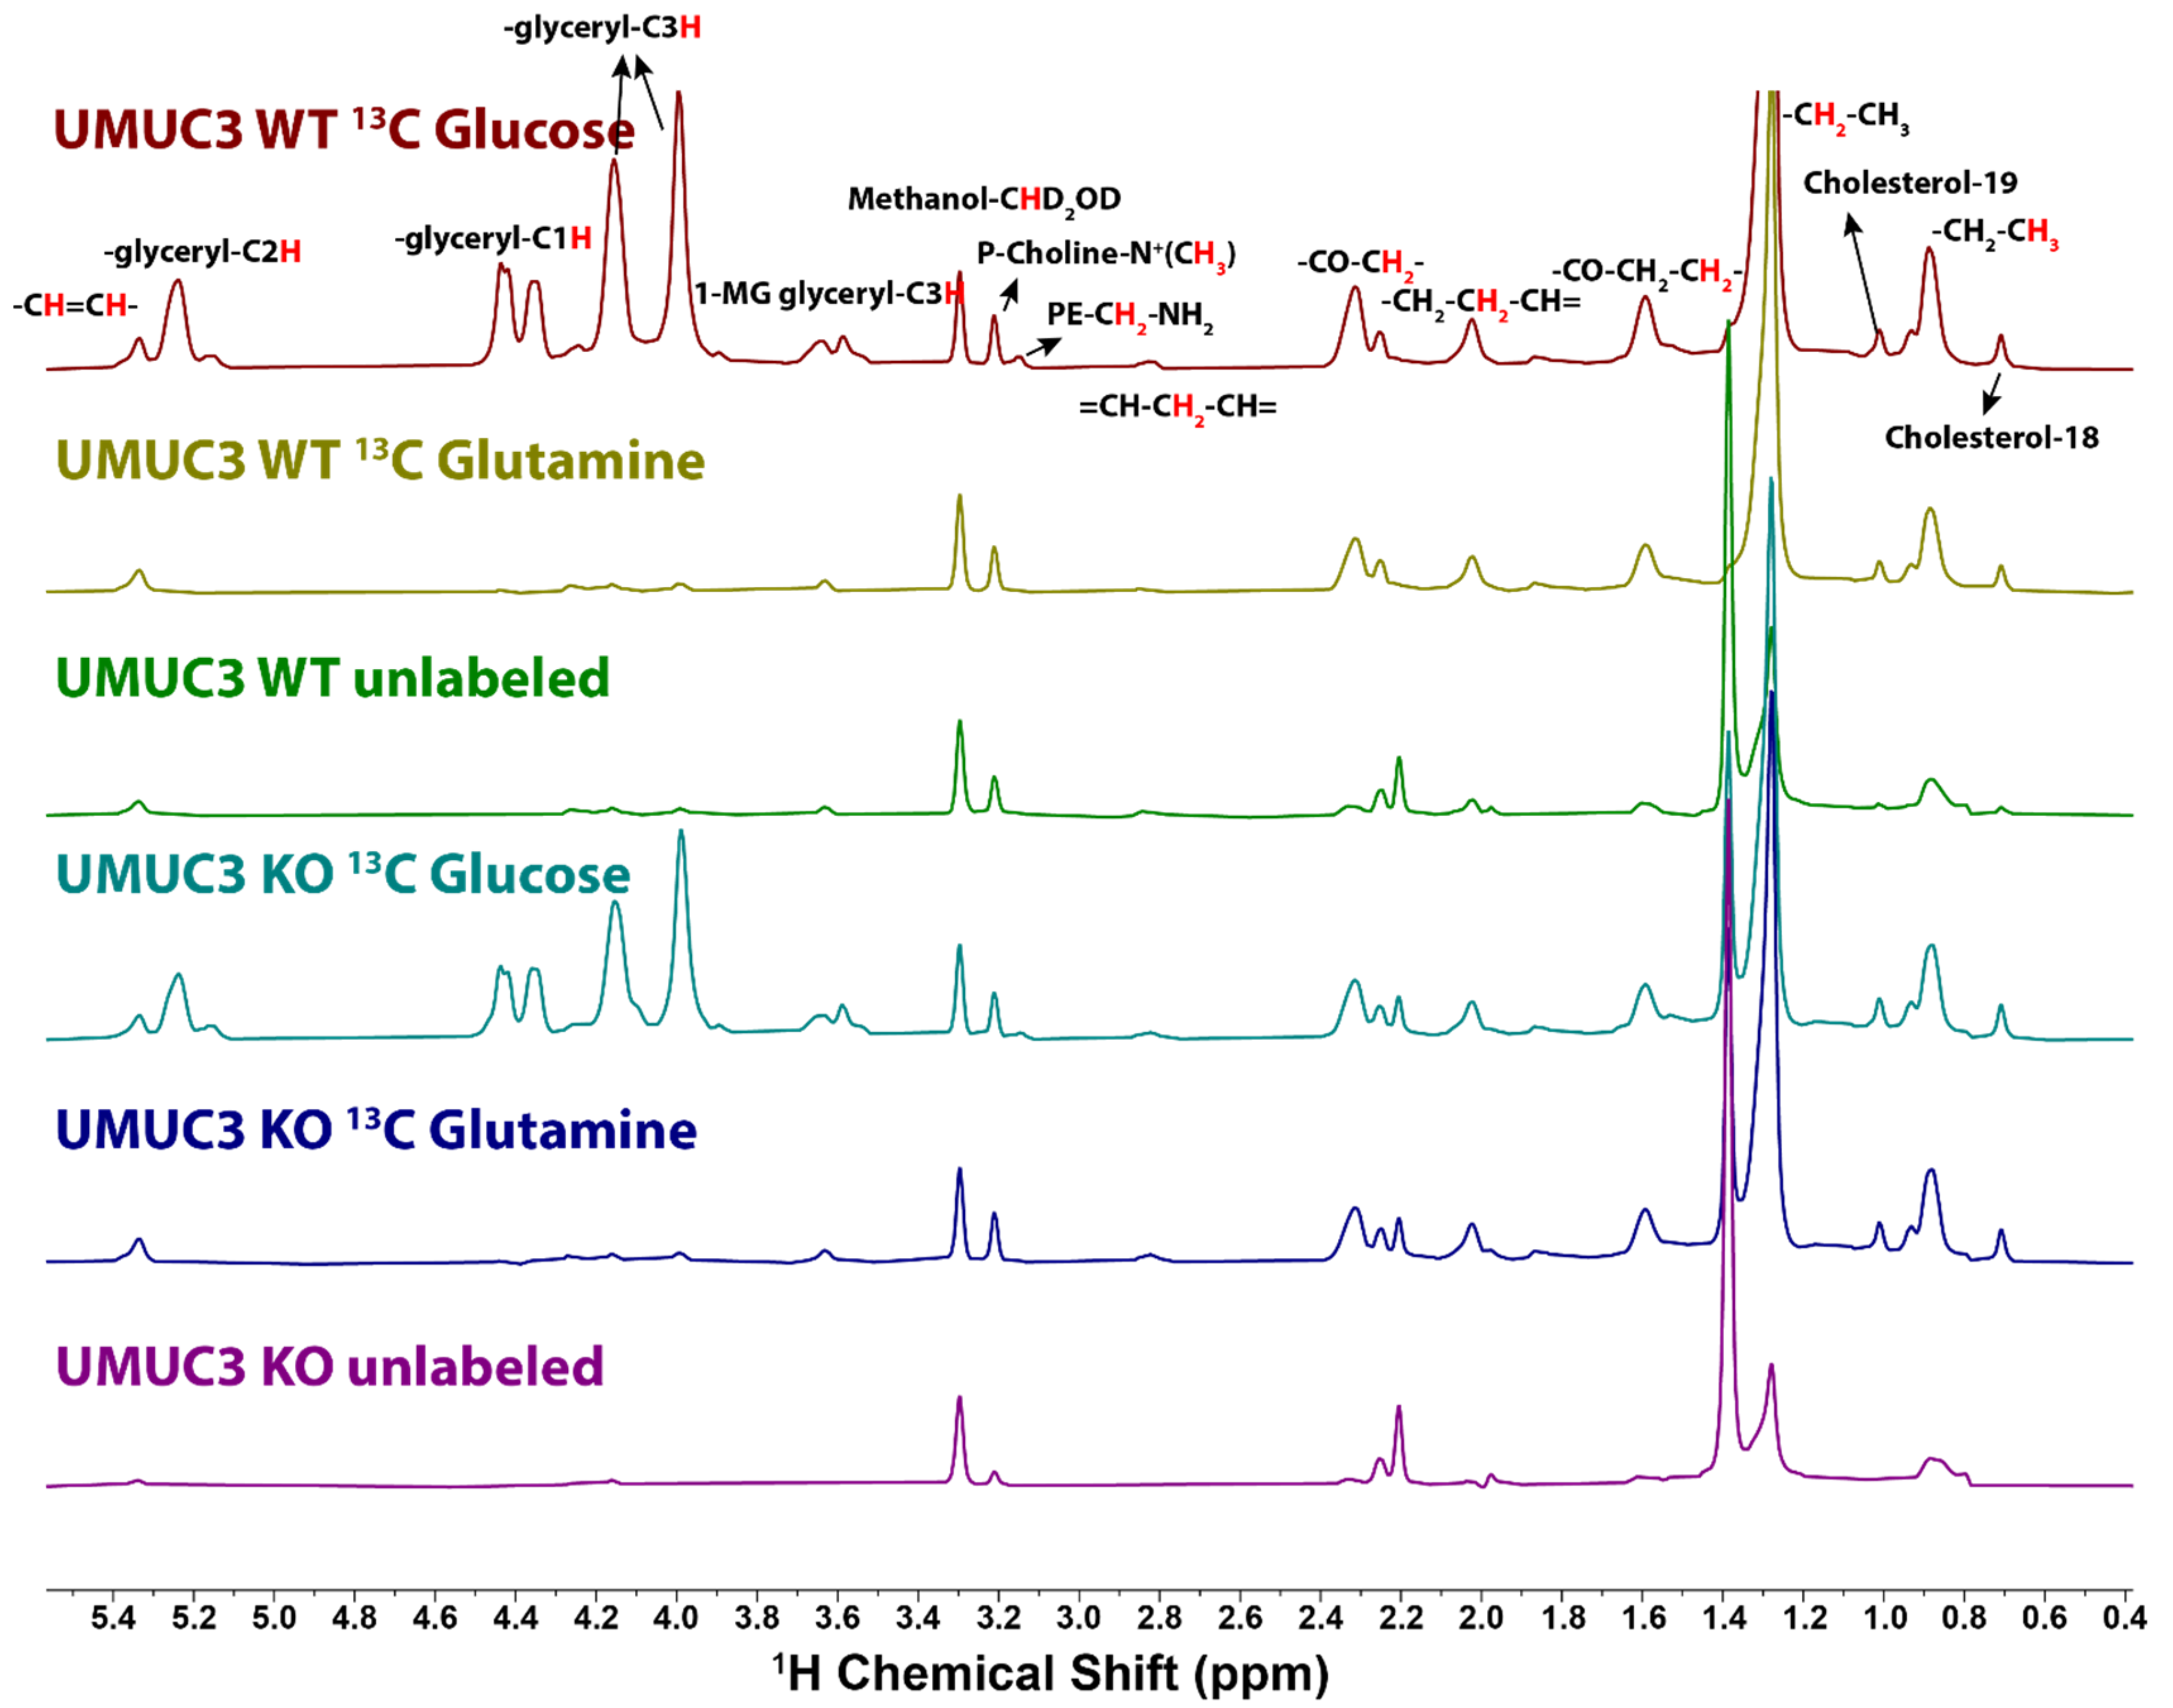
We used the same method to determine the 13C incorporation into UMUC3 cells. At the glycerol-C1 group, we found 59.3 ± 0.9% enrichment from [U-13C]-glucose in the wild type cells and 52.8% ± 1.28% in the UMUC3 knockout cells, and not different from natural abundance for the [U-13C]-Gln samples (Table 1). The 13C labeling of the glycerol carbons was similar to the wt PC3 cells (62.3 ± 1.2%), but slightly lower than in the PC3 KO cells (65.2 ± 0.88%). This indicates a high fraction of the glycerolipid pool turnover using G3P newly synthesized from glucose. In comparison, labeling of the bulk CH2 groups in the lipid fatty acid chains was much lower, around 4–5%. Terminal methyl groups showed around 2–3% labeling, indicating that the ab initio de novo synthesis of fatty acid chains are relatively low in these cells. Meanwhile, the C2 and C3 groups which are next to the carboxylate end of the acyl chains, were more highly labeled (7–9% for C2 and 4–6% for C3) due to extension with newly synthesized [46] AcCoA from glycolysis and PDH activity.
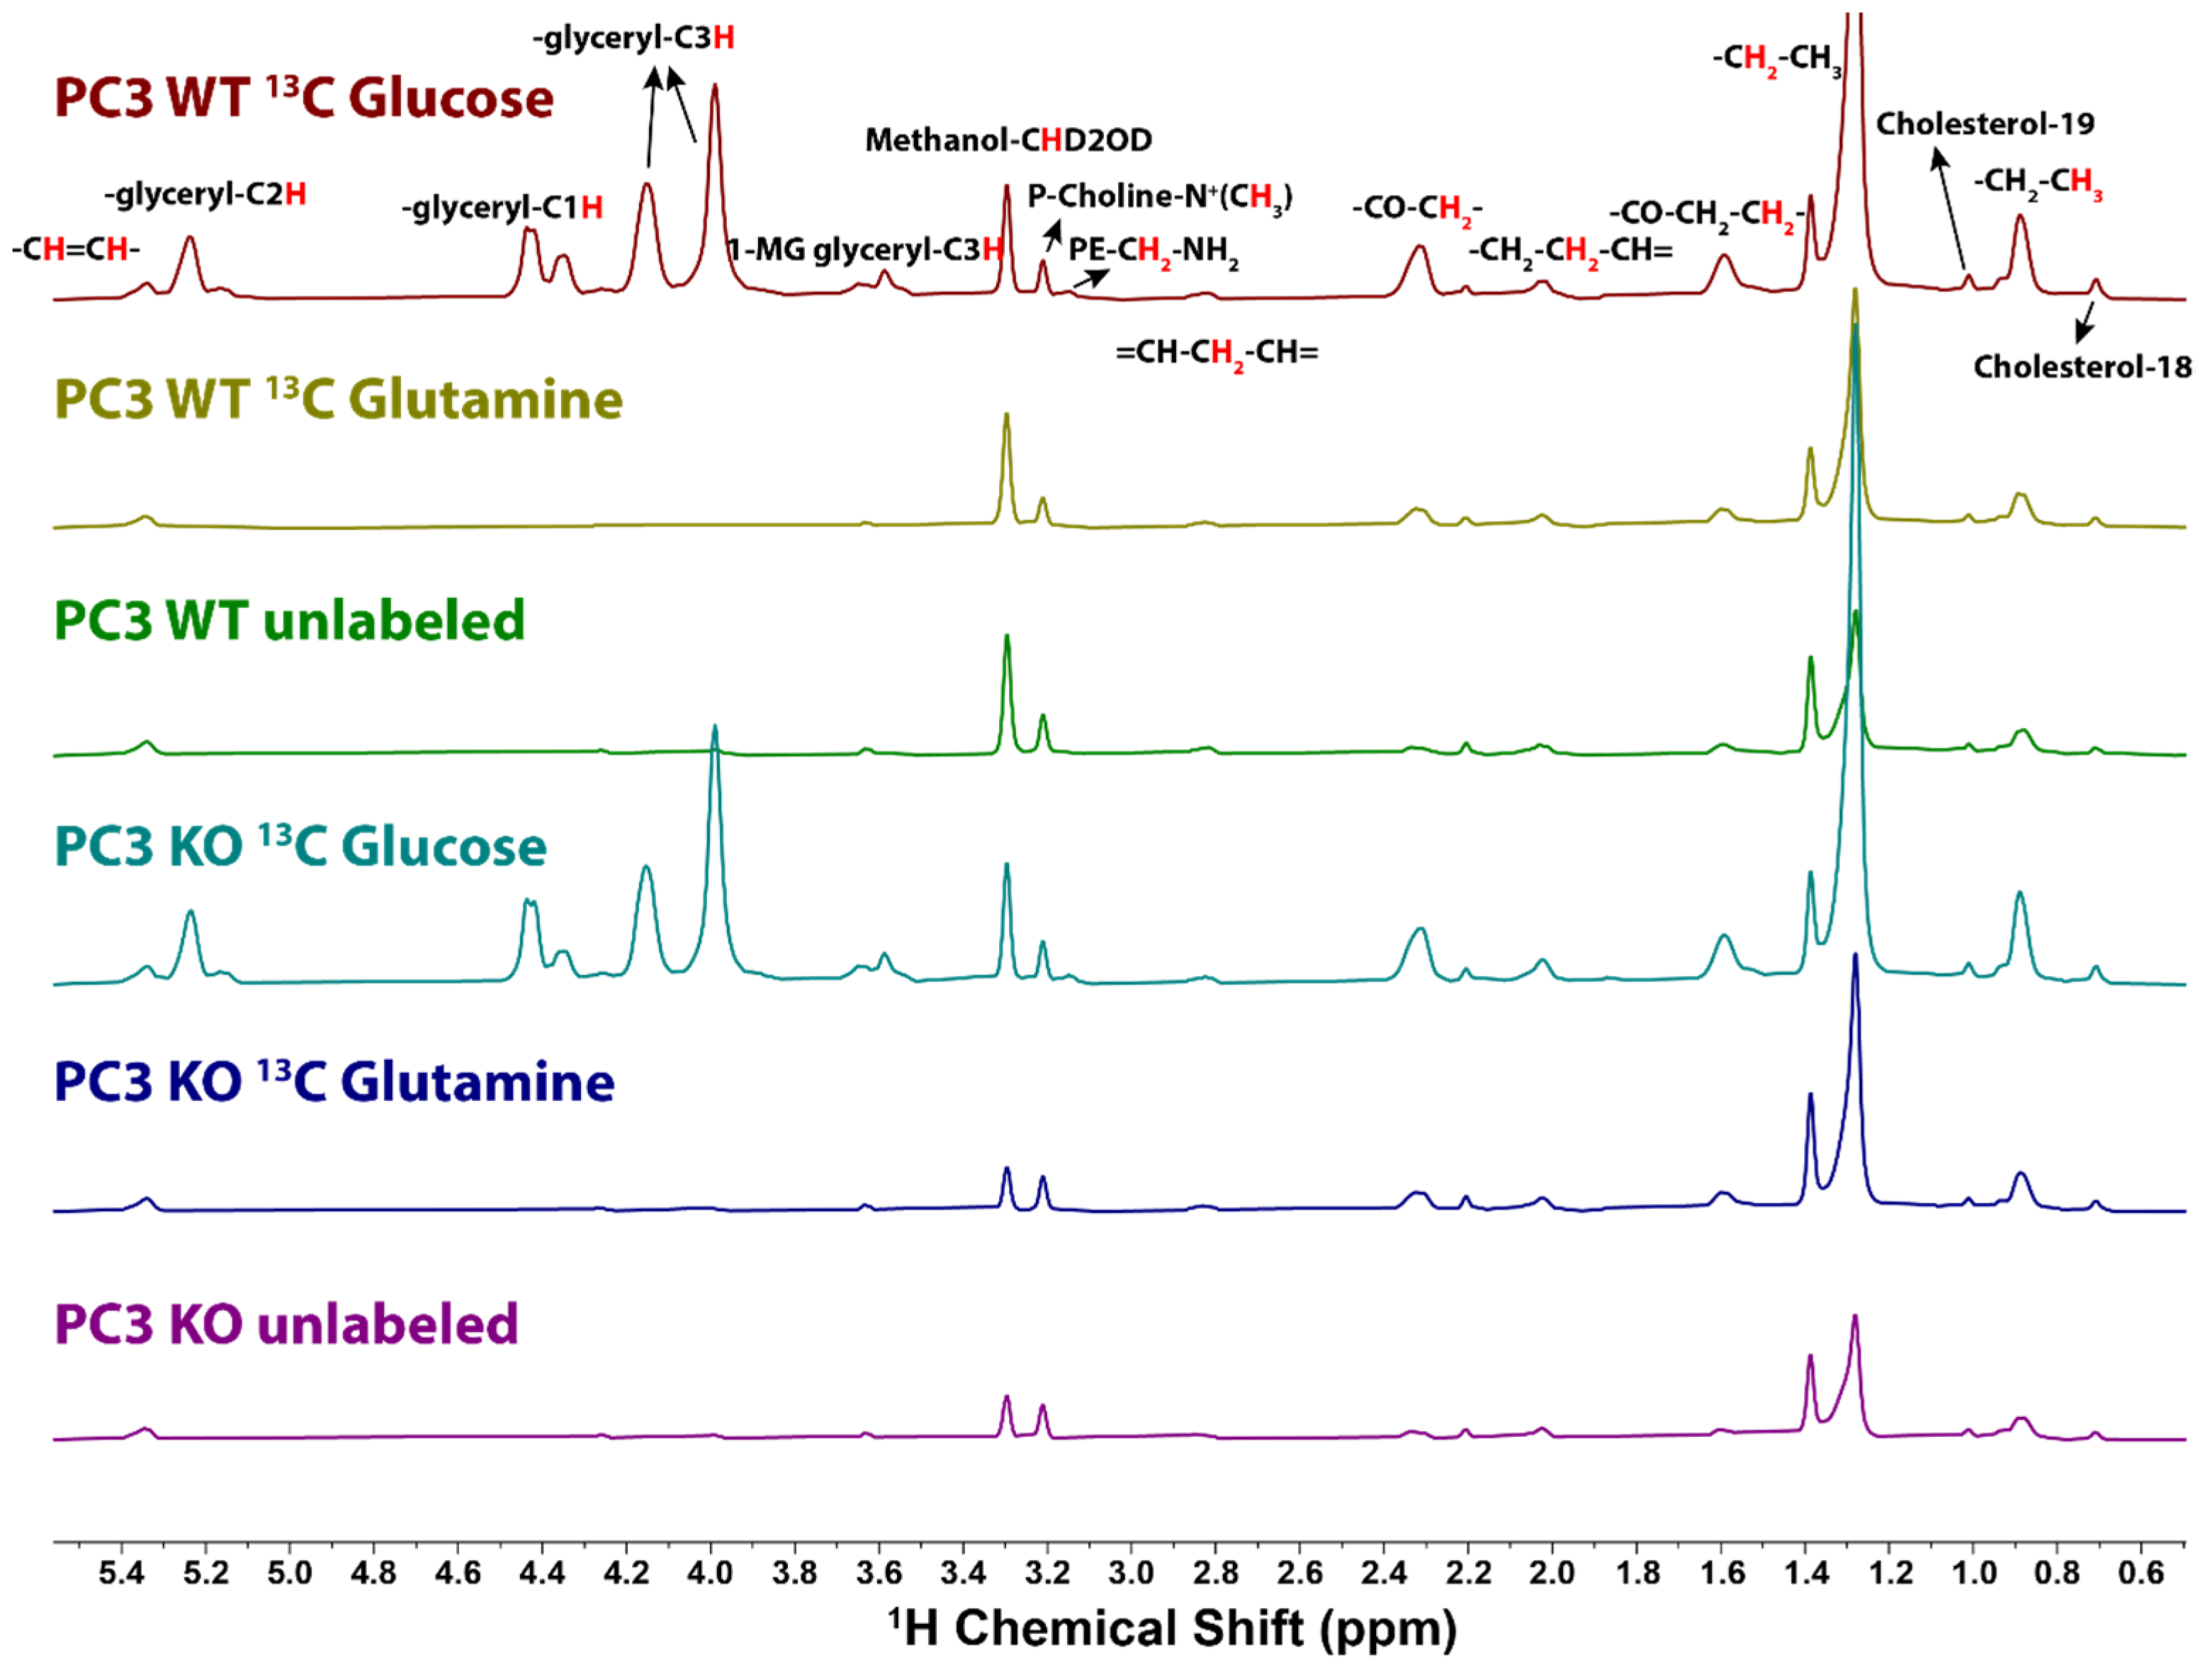
In cells grown in the presence of [U-13C]-Gln and unlabeled glucose the glycerol groups showed no significant labeling (i.e., close to natural abundance) (Figure 4, Table 1), indicating little de novo gluconeogenesis in these cells, as previously observed for breast cancer cells [35]. However, the fatty acid chains were enriched to around 3–4% due to the cytosolic AcCoA generated from citrate that may arise from reductive glutamine metabolism and transported out of the mitochondria [47,48,49] or exchange flux [49].
In [U-13C]-glucose tracer experiments, the glycerol group fractional enrichments were similar in both PC3 and UMUC3 cell lines. In contrast, the bulk CH2 in the PC3 cells were more enriched than that in the UMUC3 cells. Both C2 and C3 of the fatty acids chain were more highly enriched in PC3 cells compared with UMUC cells, indicating a more active fatty acid extension reaction in PC3 cells. In the [U-13C]-glutamine tracer experiments, the labeling in the various fatty acid groups was in general lower in PC3 than in UMUC3, and in both cases was not much above natural abundance.
For the labeled samples, the cholesterol 18 and 19 methyl groups showed 13C enrichments above a natural abundance of 4–5% in the UMUC3 cells, and these were lower (2–3%) in the PC3 cells (Table 1), indicating a higher flux of AcCoA into cholesterol synthesis in UMUC3 cells.
2.4. Estimation of Lipid Distributions from NMR
In addition to measuring the 13C incorporation into different metabolic subunits (e.g., glycerol, acyl chains, and cholesterol), the NMR spectra also provide information about the distribution of classes of lipids. For example, the relative amount of PCs in the total glycerolipid pool could also be estimated from the ratio of the glycerol group to the choline methyl group. Thus, the glycerol resonances represent all glycerol lipids, whereas the choline NMe3+ resonance at 3.21 ppm represents the total PC levels. From the unlabeled samples and the samples grown in the presence of [U-13C]-Gln, we estimate that the PC/total GPL was 55.2% ± 5.6% for WT PC3 and 39.3% ± 6.1% for UMUC3.
Using the resolved methyl resonances of cholesterol at 0.71 and 1.02 ppm in both 1H and HSQC spectra (Figure 2), we determined the ratio of lipid choline to cholesterol in 1D 1H spectra. For the unlabeled samples, we estimated the choline/cholesterol ratio as 1.85 ± 0.24 for UMUC3 WT and 1.65 ± 0.05 for PC3 WT.
The TOCSY spectra (Figure 2B) also show the presence of other headgroups, notably ethanolamine, which is therefore relatively abundant. Comparing the intensity of the methylene peaks from PE (Phosphatidylethanolamine) head groups and PC headgroup peaks showed a PC/PE ratio of 1.2 in the PC3 WT cells. However, we observed no significant intensity from PS in these samples, though such lipids were observed in mass spectra of the samples, indicating that this class of lipids is at low overall abundance.
3. Discussion
NMR has been applied for lipidomics analysis, and with some isolated peaks in the proton spectrum, the quantification of certain types of lipids can be made from a series of equation manipulations in standard mixtures or lipid hydrolysis products [50,51]. However, for crude lipid extracts, due to the complexity of the lipid structure and species, few NMR methods have been applied this type of study, let alone with isotope tracers. Here we report a different perspective to apply NMR for lipidomics studies. Instead of quantifying individual lipid species, we investigated the overall substructure of the lipid functional groups and traced the incorporation of 13C from [U-13C]-glucose or [U-13C]-glutamine.
PC is the most abundant lipid class in mammalian cells [52] and is highest in cells that do not contain significant lipid droplet stores [53]. It may also be impacted in certain cancers [54]. We have used 1D 1H NMR and 2D TOCSY and HSQC to characterize the metabolic labeling of abundant lipid classes in two cancer cell lines. From the TOCSY spectra, we were able to determine the 13C incorporation into the glycerol subunits with a CoV of <5% (at a labeling level of >50%). For lower level incorporation, where the HSQC spectra were used, the estimated CoV were <10% for the acyl chains and 5–7% for the cholesterol methyl groups. For the unlabeled samples, the 13C level at each site should be the natural abundance level, i.e., 1.07%. Table 1 shows that, whereas most peaks are close to the expected value, with an overall CoV of 5–10%, there are a couple of outliers, which likely reflect integrations at low total abundance and/or signal overlap. These values place a lower limit on estimating enrichment of 2–4%.
In both cell lines, the glycerol subunit, which is predominantly PC, was heavily labeled from glucose but not from glutamine. In contrast, the acyl chains and cholesterol were much less extensively labeled, similar to HEK293 cells [34] or MDAMB231 cells [35] but unlike in some other cell lines [20,35,46,55,56]. The high enrichment in the glycerol subunit indicates substantial de novo lipid synthesis using glucose via DHAP/G3P, but relatively little glucose or Gln contributed to the AcCoA pool, as the acyl chains and cholesterol were enriched about one order of magnitude less. As the cells proliferate and make new lipids, either these cells recycle fatty acids (such as from internal lipid stores [34]), take up fatty acids from the medium [57,58], or use carbon sources other than glucose or Gln to generate AcCoA.
In general, PC comprises 40–50% of total phospholipids, while PE comprises around 15–25% in mammalian cells and subcellular organelles [52]. The PC fraction in the PC3 wild type cells was 55.2% ± 5.6% and 53.8 ± 7.3% for KO cell lines, whereas the enrichment was 39.2% ± 6.1% for UMUC3 WT cells and 49.4% ± 15.1% for KO cells.
The cholesterol/GPL ratio was also estimated from the ratios of labeled and unlabeled free cholesterol to phosphatidylcholine. According to our calculations, the total ratios of phosphatidylcholine to free cholesterol was 1.65 ± 0.05 for WT PC3 cells and 1.47 ± 0.08 for KO PC3 cells, whereas these ratios were 1.85 ± 0.24 and 1.62 ± 0.15 for WT and KO UMUC-3 cells, respectively. This compares with the PC/free cholesterol ratio in mouse livers of 2.5–2.7 on a regular diet and 1.0–1.1 on a high cholesterol diet [59].
PC can be generated from the CDP-choline pathway or PE N-methyltransferase (PEMT) pathway, where PE is converted into PC by three methylation reactions. Mouse hepatic PC/PE ratio between 1.5 and 1.8 maintains membrane integrity, while a ratio of <1 leads to membrane destruction [60]. Quantification of cross peaks of head groups of PC and PE from the TOCSY spectrum showed the PC/PE ratio is around 1.2 for PC3 WT cells. We did not observe significant amounts of PS in either 1D or 2D NMR, indicating the low abundance of PS in these two types of cancer cells. We also observed insignificant labeling of the PE head group, suggesting that glucose was not a major source of serine carbon in these cells.
4. Materials and Methods
Wild type PC-3 (prostate cancer) and UMUC3 (bladder cancer) cells were purchased from ATCC (American Type Culture Collection, Manassas, VA, USA), and the TRAP-1 KO version was generated in-house in the laboratory of Dr. L. Neckers. Cells were seeded in 10 cm dishes at 3 million cells per dish, incubated in either a DMEM (Dulbecco’s Modified Eagle’s Medium) medium containing 25 mM [U-13C]-glucose, 2 mM unlabeled Gln (in triplicate), 25 mM unlabeled Glc + 2 mM [U-13C,15N]-Gln and 10% dialyzed FBS (in triplicate), or unlabeled media (single plate), at 37 °C in a 5% CO2 atmosphere, RH > 90% for 24 h (approximately one cell doubling). After incubation, the medium was aspirated, and the cells (6 million per plate) were washed twice with ice cold PBS and then quenched on the plate as previously described [3]. Metabolites were extracted using a modified Folch method [61], and the organic layer was dried in a vacufuge at room temperature and resuspended in 2:1 (v/v) chloroform/methanol + 1 mM Butylated HydoxyToluene (BHT) for storage at −80 °C prior to NMR analysis [3].
NMR analysis: Lipid samples were dried again prior to the NMR experiment and reconstituted in 100% methanol-d4 (CIL, Tewkesbury MA) and loaded into 3 mm matched Shigemi NMR tubes. 1-D proton (PRESAT), TOCSY (zTOCSY) and 1H{13C} HSQC spectra (gHSQCAD) were recorded with adiabatic decoupling at 15 °C on an Agilent (Santa Clara, CA, USA) DD2 14.1 T NMR spectrometer equipped with a 3 mm inverse triple resonance cold probe. Spectra were referenced to the methanol resonance at 3.3 ppm and the phosphatidyl choline NMe3+ resonance at 3.21 ppm. 1D 1H spectra were recorded with an acquisition time of 2 s with continuous weak irradiation of the HOD peak during a relaxation delay of 4 s and 512 transients (52 min). TOCSY spectra were recorded with acquisition times of 1 s in t2 and 70 ms in t1 with an isotropic mixing time of 50 ms at a B1 field strength of 6.6 kHz using DIPSI-2, with 8 transients per t1 increment and 512 complex pairs (4.6 h acquisition). Assignments and isotopomer distributions in 1H NMR were determined as previously described [20,35,36,62]. HSQC spectra were recorded with adiabatic 13C decoupling during a 0.25 s acquisition time, with a relaxation delay of 1.75 s and 1024 transients (34 min acquisition). The 1D 13C gated decoupler experiment was recorded in 18 h using the X-coil of the 3 mm probe as the HSQC, with an acquisition time of 1 s, a relaxation delay of 1 s, and 32,000 transients.
Isotopomer distributions were also determined from 1D 1H{13C}-HSQC by comparing the relative integrals (areas) of peaks with that of the choline N(CH3)3 resonance at 3.21 ppm, which is exclusively natural abundance, with the same ratio in an unlabeled sample. A higher ratio indicates 13C incorporation, and the enrichment is directly proportional to the ratios in the two sample types.
Positional enrichments, F, were calculated from TOCSY and 1D spectra as previously described [63].
where A(13C) is the area of the 13C satellites, and A(12C) is the area of the unlabeled peak.
For low level enrichments, the positional 13C fractions for each lipid group by HSQC, F was determined from the 1D 1H and 1D HSQC spectra using
where A(13CX) HSQC and A(13Cc) HSQC are the areas of peak X and the choline methyl resonances in HSQC spectra, and A(12CX) 1H and A(12Cc) 1H are the areas of peak X and the choline methyl resonances in the 1H PRESAT spectrum.
In the PC/total lipids or PC/cholesterol ratio calculation, we used the glycerol-C3H and cholesterol-18 methyl group peak as representative signals. Since their enrichment levels are different (PC is only natural abundance), both 13C and 12C species contribute to the total ratio but at different weights. Here, x represents either cholesterol or glycerol-C3H, while c represents choline.
The ratio of PC to total lipids or to cholesterol, R, can be described as follows:
Area notations are the same as described above.
5. Conclusions
The methods described here provide both high resolution mapping of complex lipids without chromatographic separation and a direct way of generating an overview of 13C incorporation into bulk lipid molecules, which can be utilized as a standalone approach or to complement targeted mass spectrometry-based lipidomics workflows [45]. Further, with a detection limit as low as 2% with a COV of <10% by HSQC, it provides very valuable metabolic information that other techniques cannot easily generate. HSQC is sufficient to provide both high and low labeling isotopomer quantification. The TOCSY spectra are useful for validating peak assignments, for improved resolution and satellite quantification when 13C incorporation is relatively high (cf. the glycerol subunits in the present study), and for cross-validating HSQC analyses under those conditions. The sensitivity advantage of proton detection over 2H or 13C enables estimation of low (<10%) 13C enrichment or with much smaller quantities of material.
Although we demonstrated the method here using 2D cell culture, we and others have successfully applied the SIRM approach to a variety of different systems, including 3D spheroids, mouse models, and human subjects. Introducing a label via injection or diet is straightforward [35,62,64,65,66], and the extraction procedures for tissues are also well established. From then on, the analysis is the same as for cells. We note also that, with the amount of material used in this study, the necessary 1H and 1D HSQC spectra can be recorded in about 1.3 h per sample using a cryoprobe, implying an approximate throughput of up to 20 samples per day under automation, without destruction of the samples. In contrast, direct observation of 13C using a cryoprobe would have a throughput of 1–2 samples per day.
Supplementary Materials
The following are available online at https://www.mdpi.com/article/10.3390/metabo11040202/s1, Scheme S1: Complex lipid subunits from glucose and glutamine, Figure S1: Common major lipid classes, Figure S2: Comparison of 1D PRESAT spectra of WT or TRAP-1 KO cell extracts; Figure S3: Comparison of 1D 13C HSQC spectra of WT UMUC3 or PC3 cell extracts; Figure S4: Carbon 1D spectrum of the lipid extract from PC3 KO cell line.
Author Contributions
Conceptualization, R.M.H., T.W-M.F., A.N.L. and L.M.N.; methodology, R.M.H. and A.N.L.; formal analysis, P.L. and A.N.L.; investigation, P.L., L.D. and D.R.C.; resources, R.M.H., T.W-M.F., A.N.L. and L.M.N.; writing—original draft preparation, A.N.L.; writing, review and editing, P.L., A.N.L., R.M.H., L.M.N., T.W-M.F. and D.R.C.; supervision, R.M.H., A.N.L., T.W-M.F. and L.M.N. All authors have read and agreed to the published version of the manuscript.
Funding
This work was supported in part by 1R01ES022191-01, P01CA163223-01A1, R21 ES025669-01, P30 CA177558, and 1U24DK097215-01A1, including a supplement from the NCI Center for Cancer Research; Major Opportunity: The Metabolic Basis of Cancer.
Institutional Review Board Statement
Not applicable.
Informed Consent Statement
Not applicable.
Data Availability Statement
Original data are available from the authors on request.
Conflicts of Interest
The authors declare no conflict of interest.
References
- Fahy, E.; Subramaniam, S.; Brown, H.A.; Glass, C.K.; Merrill, A.H., Jr.; Murphy, R.C.; Raetz, C.R.H.; Russell, D.W.; Seyama, Y.; Shaw, W.; et al. A comprehensive classification system for lipids. J. Lipid Res. 2005, 46, 839–861. [Google Scholar] [CrossRef] [Green Version]
- Fahy, E.; Subramaniam, S.; Murphy, R.C.; Nishijima, M.; Raetz, C.R.H.; Shimizu, T.; Spener, F.; van Meer, G.; Wakelam, M.J.O.; Dennis, E.A. Update of the LIPID MAPS comprehensive classification system for lipids. J. Lipid Res. 2009, 50, S9–S14. [Google Scholar] [CrossRef] [Green Version]
- Fan, T.W.M.; Zhang, X.; Wang, C.; Yang, Y.; Kang, W.-Y.; Arnold, S.; Higashi, R.M.; Liu, J.; Lane, A.N. Exosomal lipids for classifying early and late stage non-small cell lung cancer. Anal. Chim. Acta 2018, 1037, 256–264. [Google Scholar] [CrossRef]
- Sud, M.; Fahy, E.; Cotter, D.; Brown, A.; Dennis, E.A.; Glass, C.K.; Merrill, A.H., Jr.; Murphy, R.C.; Raetz, C.R.H.; Russell, D.W.; et al. LMSD: LIPID MAPS structure database. Nucleic Acids Res. 2007, 35, D527–D532. [Google Scholar] [CrossRef] [Green Version]
- German, J.B. Dietary lipids from an evolutionary perspective:sources, structures and functions. Matern. Child Nutr. 2011, 7, 2–16. [Google Scholar] [CrossRef]
- Han, X.L.; Gross, R.W. Shotgun lipidomics: Multidimensional MS analysis of cellular lipidomes. Expert Rev. Proteom. 2005, 2, 253–264. [Google Scholar] [CrossRef] [PubMed]
- Quehenberger, O.; Dennis, E.A. The Human Plasma Lipidome. N. Engl. J. Med. 2011, 365, 1812–1823. [Google Scholar] [CrossRef]
- Torkhovskaya, T.I.; Zakharova, T.S.; Korotkevich, E.I.; Ipatova, O.M.; Markin, S.S. Human Blood Plasma Lipidome: Opportunities and Prospects of Its Analysis in Medical Chemistry. Russ. J. Bioorg. Chem. 2019, 45, 335–346. [Google Scholar] [CrossRef]
- Wang, C.; Timári, I.; Zhang, B.; Li, D.-W.; Leggett, A.; Amer, A.O.; Bruschweiler-Li, L.; Kopec, R.E.; Brüschweiler, R. COLMAR Lipids Web Server and Ultrahigh-Resolution Methods for Two-Dimensional Nuclear Magnetic Resonance- and Mass Spectrometry-Based Lipidomics. J. Proteome Res. 2020, 19, 1674–1683. [Google Scholar] [CrossRef]
- Alexandri, E.; Ahmed, R.; Siddiqui, H.; Choudhary, M.I.; Tsiafoulis, C.G.; Gerothanassis, I.P. High Resolution NMR Spectroscopy as a Structural and Analytical Tool for Unsaturated Lipids in Solution. Molecules 2017, 22, 1663. [Google Scholar] [CrossRef] [PubMed]
- Neumann, E.K.; Comi, T.J.; Rubakhin, S.S.; Sweedler, J.V. Lipid Heterogeneity between Astrocytes and Neurons Revealed by Single-Cell MALDI-MS Combined with Immunocytochemical Classification. Angew. Chem. Int. Ed. 2019, 58, 5910–5914. [Google Scholar] [CrossRef]
- Liebisch, G.; Vizcaíno, J.A.; Köfeler, H.; Trötzmüller, M.; Griffiths, W.J.; Schmitz, G.; Spener, F.; Wakelam, M.J.O. Shorthand notation for lipid structures derived from mass spectrometry. J. Lipid Res. 2013, 54, 1523–1530. [Google Scholar] [CrossRef] [Green Version]
- Triebl, A.; Wenk, M.R. Analytical Considerations of Stable Isotope Labelling in Lipidomics. Biomolecules 2018, 8, 151. [Google Scholar] [CrossRef] [PubMed] [Green Version]
- Ecker, J.; Liebisch, G. Application of stable isotopes to investigate the metabolism of fatty acids, glycerophospholipid and sphingolipid species. Prog. Lipid Res. 2014, 54, 14–31. [Google Scholar] [CrossRef] [PubMed]
- Stuani, L.; Riols, F.; Millard, P.; Sabatier, M.; Batut, A.; Saland, E.; Viars, F.; Tonini, L.; Zaghdoudi, S.; Linares, L.K.; et al. Stable Isotope Labeling Highlights Enhanced Fatty Acid and Lipid Metabolism in Human Acute Myeloid Leukemia. Int. J. Mol. Sci. 2018, 19, 3325. [Google Scholar] [CrossRef] [PubMed] [Green Version]
- Umpleby, A.M. HORMONE MEASUREMENT GUIDELINES Tracing lipid metabolism: The value of stable isotopes. J. Endocrinol. 2015, 226, G1–G10. [Google Scholar] [CrossRef] [PubMed] [Green Version]
- Parks, E.J.; Hellerstein, M.K. Recent advances in liver triacylglycerol and fatty acid metabolism using stable isotope labeling techniques. J. Lipid Res. 2006, 47, 1651–1660. [Google Scholar] [CrossRef] [Green Version]
- Hellerstein, M.K. New stable isotope-mass spectrometric techniques for measuring fluxes through intact metabolic pathways in mammalian systems: Introduction of moving pictures into functional genomics and biochemical phenotyping. Metab. Eng. 2004, 6, 85–100. [Google Scholar] [CrossRef]
- Turner, S.M.; Murphy, E.J.; Neese, R.A.; Antelo, F.; Thomas, T.; Agarwal, A.; Go, C.; Hellerstein, M.K. Measurement of TG synthesis and turnover in vivo by (2HO)-O-2 incorporation into the glycerol moiety and application of MIDA. Am. J. Physiol. Endocrinol. Metab. 2003, 285, E790–E803. [Google Scholar] [CrossRef] [Green Version]
- Lane, A.N.; Fan, T.W.M.; Xie, Z.; Moseley, H.N.B.; Higashi, R.M. Isotopomer analysis of lipid biosynthesis by high resolution mass spectrometry and NMR. Anal. Chim. Acta 2009, 651, 201–208. [Google Scholar] [CrossRef] [Green Version]
- Hanahan, D.; Weinberg, R.A. Hallmarks of Cancer: The Next Generation. Cell 2011, 144, 646–674. [Google Scholar] [CrossRef] [Green Version]
- Boroughs, L.K.; DeBerardinis, R.J. Metabolic pathways promoting cancer cell survival and growth. Nat. Cell Biol. 2015, 17, 351–359. [Google Scholar] [CrossRef] [Green Version]
- Lane, A.N.; Higashi, R.M.; Fan, T.W.M. Metabolic reprogramming in tumors: Contributions of the tumor microenvironment. Genes Dis. 2020, 7, 185–198. [Google Scholar] [CrossRef]
- Dang, C.V.; Hamaker, M.; Sun, P.; Le, A.; Gao, P. Therapeutic targeting of cancer cell metabolism. J. Mol. Med. JMM 2011, 89, 205–212. [Google Scholar] [CrossRef] [PubMed] [Green Version]
- García-Cañaveras, J.C.; Chen, L.; Rabinowitz, J.D. The Tumor Metabolic Microenvironment: Lessons from Lactate. Cancer Res. 2019, 79, 3155–3162. [Google Scholar] [CrossRef] [PubMed] [Green Version]
- Yuneva, M.O.; Fan, T.W.-M.; Allen, T.D.; Higashi, R.M.; Ferraris, D.V.; Tsukamoto, T.; Matés, J.M.; Alonso, F.J.; Wang, C.; Seo, Y.; et al. The Metabolic Profile of Tumors Depends on Both the Responsible Genetic Lesion and Tissue Type. Cell Metab. 2012, 15, 157–170. [Google Scholar] [CrossRef] [PubMed] [Green Version]
- Lu, C.; Thompson, C.B. Metabolic Regulation of Epigenetics. Cell Metab. 2012, 16, 9–17. [Google Scholar] [CrossRef] [PubMed] [Green Version]
- Fan, T.W.M.; Lorkiewicz, P.K.; Sellers, K.; Moseley, H.N.B.; Higashi, R.M.; Lane, A.N. Stable isotope-resolved metabolomics and applications for drug development. Pharmacol. Ther. 2012, 133, 366–391. [Google Scholar] [CrossRef] [Green Version]
- Yang, Y.; Lane, A.N.; Ricketts, C.J.; Carole Sourbier, C.; Wei, M.-H.; Shuch, B.; Pike, L.; Wu, M.; Rouault, T.A.; Boros, L.G.; et al. Metabolic Reprogramming for Producing Energy and Reducing Power in Fumarate Hydratase Null Cells from Hereditary Leiomyomatosis Renal Cell Carcinoma. PLoS ONE 2013, 8, e72179. [Google Scholar] [CrossRef] [PubMed]
- Deng, P.; Higashi, R.M.; Lane, A.N.; Bruntz, R.C.; Sun, R.C.; Ramakrishnam Raju, M.V.; Nantz, M.H.; Qi, Z.; Fan, T.W. Quantitative profiling of carbonyl metabolites directly in crude biological extracts using chemoselective tagging and nanoESI-FTMS. Analyst 2017, 143, 311–322. [Google Scholar] [CrossRef]
- Schlame, M.; Xu, Y.; Erdjument-Bromage, H.; Neubert, T.A.; Ren, M. Lipidome-wide 13 C flux analysis: A novel tool to estimate the turnover of lipids in organisms and cultures. J. Lipid Res. 2020, 61, 95–104. [Google Scholar] [CrossRef]
- Kang, W.Y.; Thompson, P.T.; El-Amouri, S.S.; Fan, T.W.M.; Lane, A.N.; Higashi, R.M. Improved segmented-scan spectral stitching for stable isotope resolved metabolomics (SIRM) by ultra-high-resolution Fourier transform mass spectrometry. Anal. Chim Acta 2019, 1080, 104–115. [Google Scholar] [CrossRef]
- Di Buono, M.; Jones, P.J.; Beaumier, L.; Wykes, L.J. Comparison of deuterium incorporation and mass isotopomer distribution analysis for measurement of human cholesterol biosynthesis. J. Lipid Res. 2000, 41, 1516–1523. [Google Scholar] [CrossRef]
- Crooks, D.R.; Maio, N.; Lane, A.N.; Jarnik, M.; Higashi, R.M.; Haller, R.G.; Yang, Y.; Fan, T.W.; Linehan, W.M.; Rouault, T.A. Acute loss of iron-sulfur clusters results in metabolic reprogramming and generation of lipid droplets in mammalian cells. J. Biol. Chem. 2018, 293, 8297–8311. [Google Scholar] [CrossRef] [Green Version]
- Lane, A.N.; Tan, J.; Wang, Y.; Yan, J.; Higashi, R.M.; Fan, T.W.-M. Probing the metabolic phenotype of breast cancer cells by multiple tracer Stable Isotope Resolved Metabolomics. Metab. Eng. 2017, 43, 125–136. [Google Scholar] [CrossRef] [Green Version]
- Freriksen, A.; Seykens, D.; Scharloo, W.; Heinstra, P.W. Alcohol dehydrogenase controls the flux from ethanol into lipids in Drosophila larvae. A 13C NMR study. J. Biol. Chem. 1991, 266, 21399–21403. [Google Scholar] [PubMed]
- Guo, W.; Choi, J.K.; Kirkland, J.L.; Corkey, B.E.; Hamilton, J.A. Esterification of free fatty acids in adipocytes: A comparison between octanoate and oleate. Biochem. J. 2000, 349, 463–471. [Google Scholar] [CrossRef] [PubMed]
- Bederman, I.R.; Foy, S.; Chandramouli, V.; Alexander, J.C.; Previs, S.F. Triglyceride synthesis in epididymal adipose tissue: Contribution of glucose and non-glucose carbon sources. J. Biol. Chem. 2009, 284, 6101–6108. [Google Scholar] [CrossRef] [PubMed] [Green Version]
- Duarte, J.A.; Carvalho, F.; Pearson, M.; Horton, J.D.; Browning, J.D.; Jones, J.G.; Burgess, S.C. A high-fat diet suppresses de novo lipogenesis and desaturation but not elongation and triglyceride synthesis in mice. J. Lipid Res. 2014, 55, 2541–2553. [Google Scholar] [CrossRef] [PubMed] [Green Version]
- Silva, J.C.P.; Marques, C.; Martins, F.O.; Viegas, I.; Tavares, L.; Macedo, M.P.; Jones, J.G. Determining contributions of exogenous glucose and fructose to de novo fatty acid and glycerol synthesis in liver and adipose tissue. Metab. Eng. 2019, 56, 69–76. [Google Scholar] [CrossRef]
- Aguayo, J.B.; Gamcsik, M.P.; Dick, J.D. High Resolution Deuterium NMR Studies of Bacterial Metabolism. J. Biol. Chem. 1987, 263, 19552–19557. [Google Scholar] [CrossRef]
- Lisanti, S.; Tavecchio, M.; Chae, Y.C.; Liu, Q.; Brice, A.K.; Thakur, M.L.; Languino, L.R.; Altieri, D.C. Deletion of the mitochondrial chaperone TRAP-1 uncovers global reprogramming of metabolic networks. Cell Rep. 2014, 8, 671–677. [Google Scholar] [CrossRef]
- Zhang, H.; Ding, L.; Fang, X.; Shi, Z.; Zhang, Y.; Chen, H.; Yan, X.; Dai, J. Biological responses to perfluorododecanoic acid exposure in rat kidneys as determined by integrated proteomic and metabonomic studies. PLoS ONE 2011, 6, e20862. [Google Scholar] [CrossRef] [Green Version]
- Fan, T.W.M.; Lane, A.N. Assignment Strategies for Nuclear Magnetic Resonances in Metabolomic Research. In Methodologies for Metabolomics: Experimental Strategies and Techniques; Sweedler, J.V., Lutz, N.W., Wevers, R.A., Eds.; Cambridge University Press: Cambridge, UK, 2013; pp. 525–584. [Google Scholar] [CrossRef]
- National Lung Screening Trial Research Team. Reduced Lung-Cancer Mortality with Low-Dose Computed Tomographic Screening. N. Engl. J. Med. 2011, 365, 395–409. [Google Scholar] [CrossRef] [Green Version]
- Yoo, H.; Antoniewicz, M.R.; Stephanopoulos, G.; Kelleher, J.K. Quantifying reductive carboxylation flux of glutamine to lipid in a brown adipocyte cell line. J. Biol. Chem. 2008, 283, 20621–20627. [Google Scholar] [CrossRef] [Green Version]
- Jiang, L.; Shestov, A.A.; Swain, P.; Yang, C.; Parker, S.J.; Wang, Q.A.; Terada, L.S.; Adams, N.D.; McCabe, M.T.; Pietrak, B.; et al. Reductive carboxylation supports redox homeostasis during anchorage-independent growth. Nature 2016, 532, 255–258. [Google Scholar] [CrossRef]
- Grassian, A.R.; Parker, S.J.; Davidson, S.M.; Divakaruni, A.S.; Green, C.R.; Zhang, X.M.; Slocum, K.L.; Pu, M.Y.; Lin, F.; Vickers, C.; et al. IDH1 Mutations Alter Citric Acid Cycle Metabolism and Increase Dependence on Oxidative Mitochondrial Metabolism. Cancer Res. 2014, 74, 3317–3331. [Google Scholar] [CrossRef] [Green Version]
- Fan, J.; Kamphorst, J.J.; Rabinowitz, J.D.; Shlomi, T. Fatty Acid Labeling from Glutamine in Hypoxia Can Be Explained by Isotope Exchange without Net Reductive Isocitrate Dehydrogenase (IDH) Flux. J. Biol. Chem. 2013, 288, 31363–31369. [Google Scholar] [CrossRef] [PubMed] [Green Version]
- Nieva-Echevarría, B.; Goicoechea, E.; Manzanos, M.J.; Guillén, M.D. A method based on 1H NMR spectral data useful to evaluate the hydrolysis level in complex lipid mixtures. Food Res. Int. 2014, 66, 379–387. [Google Scholar] [CrossRef] [Green Version]
- Nieva-Echevarria, B.; Goicoechea, E.; Manzanos, M.J.; Guillen, M.D. Usefulness of (1)H NMR in assessing the extent of lipid digestion. Food Chem 2015, 179, 182–190. [Google Scholar] [CrossRef] [PubMed] [Green Version]
- van der Veen, J.N.; Kennelly, J.P.; Wan, S.; Vance, J.E.; Vance, D.E.; Jacobs, R.L. The critical role of phosphatidylcholine and phosphatidylethanolamine metabolism in health and disease. Biochim. Biophys. Acta (BBA) Biomembr. 2017, 1859, 1558–1572. [Google Scholar] [CrossRef] [PubMed]
- Martin, S.; Parton, R.G. Lipid droplets: A unified view of a dynamic organelle. Nat. Rev. Mol. Cell Biol. 2006, 7, 373–378. [Google Scholar] [CrossRef] [PubMed]
- Szlasa, W.; Zendran, I.; Zalesińska, A.; Tarek, M.; Kulbacka, J. Lipid composition of the cancer cell membrane. J. Bioenerg. Biomembr. 2020, 20, 321–342. [Google Scholar] [CrossRef] [PubMed]
- Mullen, A.R.; Wheaton, W.W.; Jin, E.S.; Chen, P.-H.; Sullivan, L.B.; Cheng, T.; Yang, Y.; Linehan, W.M.; Chandel, N.S.; DeBerardinis, R.J. Reductive carboxylation supports growth in tumour cells with defective mitochondria. Nature 2011, 481, 385–388. [Google Scholar] [CrossRef] [Green Version]
- Metallo, C.M.; Gameiro, P.A.; Bell, E.L.; Mattaini, K.R.; Yang, J.; Hiller, K.; Jewell, C.M.; Johnson, Z.R.; Irvine, D.J.; Guarente, L.; et al. Reductive glutamine metabolism by IDH1 mediates lipogenesis under hypoxia. Nature 2011, 481, 380–384. [Google Scholar] [CrossRef] [Green Version]
- Michalopoulou, E.; Bulusu, V.; Kamphorst, J.J. Metabolic scavenging by cancer cells: When the going gets tough, the tough keep eating. Br. J. Cancer 2016, 115, 635–640. [Google Scholar] [CrossRef]
- Kamphorst, J.J.; Cross, J.R.; Fan, J.; de Stanchina, E.; Mathew, R.; White, E.P.; Thompson, C.B.; Rabinowitz, J.D. Hypoxic and Ras-transformed cells support growth by scavenging unsaturated fatty acids from lysophospholipids. Proc. Natl. Acad. Sci. USA 2013, 110, 8882–8887. [Google Scholar] [CrossRef] [Green Version]
- Kuksis, A.; Roberts, A.; Thompson, J.S.; Myher, J.J.; Geher, K. Plasma phosphatidylcholine/free cholesterol ratio as an indicator for atherosclerosis. Arteriosclerosis 1983, 3, 389–397. [Google Scholar] [CrossRef] [PubMed] [Green Version]
- Li, Z.; Agellon, L.B.; Allen, T.M.; Umeda, M.; Jewell, L.; Mason, A.; Vance, D.E. The ratio of phosphatidylcholine to phosphatidylethanolamine influences membrane integrity and steatohepatitis. Cell Metab. 2006, 3, 321–331. [Google Scholar] [CrossRef] [Green Version]
- Crooks, D.R.; Fan, T.W.-M.; Linehan, W.M. Metabolic Labeling of Cultured Mammalian Cells for Stable Isotope-Resolved Metabolomics: Practical Aspects of Tissue Culture and Sample Extraction. Methods Mol. Biol. 2019, 1928, 1–27. [Google Scholar] [PubMed]
- Sun, R.C.; Fan, T.W.M.; Deng, P.; Higashi, R.M.; Lane, A.N.; Le, A.-T.; Scott, T.L.; Sun, Q.; Warmoes, M.O.; Yang, Y. Noninvasive liquid diet delivery of stable isotopes into mouse models for deep metabolic network tracing. Nat. Commun. 2017, 8, 1646. [Google Scholar] [CrossRef] [PubMed]
- Lane, A.N.; Fan, T.W. Quantification and identification of isotopomer distributions of metabolites in crude cell extracts using 1H TOCSY. Metabolomics 2007, 3, 79–86. [Google Scholar] [CrossRef]
- Sellers, K.; Fox, M.P.; Bousamra, M.; Slone, S.; Higashi, R.M.; Miller, D.M.; Wang, Y.; Yan, J.; Yuneva, M.O.; Deshpande, R.; et al. Pyruvate carboxylase is critical for non-small-cell lung cancer proliferation. J. Clin. Investig. 2015, 125, 687–698. [Google Scholar] [CrossRef] [PubMed] [Green Version]
- Fan, T.W.-M.; Lane, A.N.; Higashi, R.M.; Yan, J. Stable Isotope Resolved Metabolomics of Lung Cancer in a SCID Mouse Model. Metabolomics 2011, 7, 257–269. [Google Scholar] [CrossRef] [Green Version]
- Fan, T.W.M.; Bruntz, R.C.; Yang, Y.; Song, H.; Chernyavskaya, Y.; Deng, P.; Zhang, Y.; Shah, P.P.; Beverly, L.J.; Qi, Z.; et al. De novo synthesis of serine and glycine fuels purine nucleotide biosynthesis in human lung cancer tissues. J. Biol. Chem. 2019, 294, 13464–13477. [Google Scholar] [CrossRef]
Figure 1.
1D NMR spectra of lipids extracted from UMUC3 WT (wild type) cells. Lipids were extracted from cells grown in the presence of [U-13C]-glucose, dried, and redissolved in d4-methanol. NMR spectra were recorded at 15 °C with 1D 1H-NMR collected with 512 transients and an acquisition time of 2 s with 14,368 points using a spectral width of 12 ppm with a relaxation delay of 4.0 s. The data were linear predicted and zero filled to 65,536 data points and well resolved peaks are labeled as shown according to the literature [43] and our in-house standard database. 1H PRESAT spectrum. (A) Upfield region showing acyl chains and cholesterol resonances. The vertical scale is expanded to show the peaks that are small compared with that of the bulk CH2 resonance at 1.32 ppm. (B) Lower: downfield region showing glycerol and headgroup region; inset shows the double bond and glycerol C2 region. Assignments are displayed in the figure. The sharp resonances (asterisks) at 1.4 and 2.2 ppm are from BHT.

Figure 2.
1H TOCSY and 1H{13C}-HSQC spectra of lipids extracted from PC3 cells grown on [U-13C]-glucose. TOCSY spectra were recorded at 15 °C, 14.1 T with acquisition tines of 1 s in t2, 0.04 s in t1 with a DIPSI2 (Decoupling In the Presence of Scalar Interactions) spin lock of 50 ms mixing time, and a B1 field strength of 6.5 kHz. The 2D HSQC spectrum was acquired with 12 ppm in the proton dimension and 200 ppm in the carbon dimension. Acquisition time is 0.25 s in F2 and 8.5 ms in F1. Adiabatic decoupling was applied and a transfer delay of 3.425 ms corresponding to 146 Hz was set for an optimal one bond CH coupling. (A) Full spectrum showing different subgroups of complex lipids. (B) Downfield region expansion showing cross peaks and 13C satellites in the glycerol subunits, and cross peaks of the choline headgroup. Green dashed boxes indicate the doubly labeled adjacent carbons in the glycerol backbones. (C) HSQC spectrum confirming the assignments from the PRESAT and TOCSY spectrum.


Figure 3.
1D 1H{13C}-HSQC spectra of the lipid extracts from WT or KO PC3 cells cultured in [U-13C]-glucose, [U-13C]-glutamine, or no tracer. The spectra were recorded with 13C adiabatic decoupling during the acquisition time of 0.25 s for 1024 scans (34 min acquisition). The spectral width was set at 12 ppm the same as the proton spectrum and recycle delay was set to 1.75 s. A total of 1796 data points were collected and zero filled to 4096 points with a 4 Hz line-broadening exponential. [U-13C]-Glucose tracer samples in both cell types showed 13C incorporation into various functional groups, with glycerol backbones as the most heavily labeled groups. In contrast, [U-13C]-glutamine labeled samples only showed incorporation mainly into bulk acyl-chains as well as C2, C3 positions on the fatty acids, indicating the main contribution of de novo fatty acid synthesis. The 1D HSQC spectra shown are normalized to cell numbers.

Figure 4.
1D HSQC spectra of the lipid extracts from UMUC3 cells grown in the presence of [U-13C]-glucose, [U-13C]-glutamine and unlabeled glucose. UMUC3 cells were grown and extracted, then prepared for NMR as described in the Methods section. The HSQC acquisition parameters were as described in Figure 3.


Table 1.
Summary of fractional 13C level in lipid subgroups from both cell lines (WT: wild type as well as KO: knock out) determined by NMR. Lipid subgroup 13C levels were calculated as described in the text (Equations (1) and (2)) and are presented as % of the total carbon at different position in the lipids (mean ± standard deviation for triplicate labeled samples, only one unlabeled sample in each group).
| Groups | UMUC 3 | PC3 | ||||||||||
|---|---|---|---|---|---|---|---|---|---|---|---|---|
| Glc | Gln | Unlabeled | Glc | Gln | Unlabeled | |||||||
| WT | KO | WT | KO | WT | KO | WT | KO | WT | KO | WT | KO | |
| Acyl CH2 | 2.7 ± 0.43 | 3.0 ± 0.60 | 2.8 ± 0.37 | 3.9 ± 0.39 | 1.73 | 1.28 | 3.8 ± 0.24 | 5.4 ± 0.29 | 1.8 ± 0.20 | 1.45 ± 0.07 | 1.0 | 0.86 |
|
Methyl– CH2–CH3 | 3.1 ± 0.15 | 2.45 ± 0.16 | 2.7 ± 0.33 | 2.3 ± 0.29 | 1.81 | 2.18 | 2.6 ± 0.07 | 3.1 ± 0.07 | 1.5 ± 0.01 | 1.5 ± 0.11 | 0.94 | 1.08 |
|
Acyl CH2–CO | 5.2 ±0.26 | 4.9 ± 0.42 | 3.9 ± 0.21 | 3.7 ± 0.18 | 0.81 | 1.34 | 7.4 ±0.28 | 8.5 ± 0.52 | 3.2 ± 0.03 | 3.1 ±0.07 | 0.94 | 1.08 |
|
Acyl CO–CH2–CH2 | 3.1 ± 0.19 | 2.5 ± 0.05 | 2.3 ± 0.09 | 2.5 ± 0.33 | 1.24 | 0.39 | 3.9 ± 0.14 | 5.5 ± 0.22 | 2.0 ± 0.06 | 2.1 ± 0.20 | 0.95 | 0.91 |
| Glyceryl–C1H | 59.3 ± 0.90 | 52.8 ± 1.28 | nd a | nd | nd | nd | 62.3 ± 1.17 | 65.2 ± 0.88 | nd | nd | 0.80 | nd |
| Glyceryl–C2H | 41. 9 ± 0.55 | 33.4 ± 0.41 | nd | nd | nd | nd | 48.9 ± 1.70 | 53.0 ± 2.93 | nd | nd | 1.45 | nd |
| Glyceryl–C3H | 61.5 ± 6.81 | 50.4 ± 3.22 | 1.84 | 2.17 | 1.84 | 1.1 | 67.1 ± 0.41 | 72.8 ± 1.63 | 2 ± 0.08 | 2.1 ± 0.41 | 1.76 | 1.87 |
|
Acyl =CH– | 1.2 ± 0.11 | 1.3 ± 0.03 | 1.1 ± 0.07 | 0.91 ± 0.07 | 0.88 | 1.04 | 0.90 ± 0.08 | 0.99 ± 0.06 | 0.88 ± 0.04 | 0.97 ± 0.03 | 0.83 | 0.79 |
|
Acyl =CH–CH2–CH= | 0.97 ± 0.18 | 1.11 ± 0.14 | 1.03 ± 0.22 | 1.08 ± 0.14 | 0.97 | 0.89 | 0.77 ± 0.05 | 0.94 ± 0.11 | 0.78 ± 0.04 | 0.85 ± 0.05 | 0.89 | 0.70 |
|
Acyl CH2–CH2–CH= | 2.2 ± 0.07 | 1.5 ± 0.03 | 1.8 ± 0.15 | 1.5 ± 0.06 | 0.74 | 0.45 | 1.8 ± 0.54 | 2.0 ± 0.06 | 0.96 ± 0.04 | 1.10 ± 0.06 | 0.93 | 0.90 |
| Chol–18 | 5.5 ± 0.33 | 4.6 ± 0.04 | 4.4 ± 0.69 | 4.0 ± 0.36 | 1.46 | nd | 3.6 ± 0.08 | 3.2 ± 0.23 | 2.1 ± 0.10 | 1.9 ± 0.09 | 1.54 | 1.38 |
| Chol–19 | 3.8 ± 0.24 | 3.6 ± 0.11 | 2.6 ± 0.14 | 3.3 ± 0.15 | 0.68 | nd | 2.7 ± 0.04 | 2.1 ± 0.07 | 1.7 ± 0.08 | 1.4 ± 0.16 | 0.85 | 1.36 |
a not determined.
Publisher’s Note: MDPI stays neutral with regard to jurisdictional claims in published maps and institutional affiliations. |
© 2021 by the authors. Licensee MDPI, Basel, Switzerland. This article is an open access article distributed under the terms and conditions of the Creative Commons Attribution (CC BY) license (http://creativecommons.org/licenses/by/4.0/).
Share and Cite
MDPI and ACS Style
Lin, P.; Dai, L.; Crooks, D.R.; Neckers, L.M.; Higashi, R.M.; Fan, T.W.-M.; Lane, A.N. NMR Methods for Determining Lipid Turnover via Stable Isotope Resolved Metabolomics. Metabolites 2021, 11, 202. https://doi.org/10.3390/metabo11040202
AMA Style
Lin P, Dai L, Crooks DR, Neckers LM, Higashi RM, Fan TW-M, Lane AN. NMR Methods for Determining Lipid Turnover via Stable Isotope Resolved Metabolomics. Metabolites. 2021; 11(4):202. https://doi.org/10.3390/metabo11040202
Chicago/Turabian StyleLin, Penghui, Li Dai, Daniel R. Crooks, Leonard M. Neckers, Richard M. Higashi, Teresa W-M. Fan, and Andrew N. Lane. 2021. "NMR Methods for Determining Lipid Turnover via Stable Isotope Resolved Metabolomics" Metabolites 11, no. 4: 202. https://doi.org/10.3390/metabo11040202
Note that from the first issue of 2016, this journal uses article numbers instead of page numbers. See further details here.