A Novel Energy-Critical Multiaxial Fatigue Life Prediction for Low Cycle Fatigue under Mixed-Mode Loading

1
School of Mechanical and Electrical Engineering, University of Electronic Science and Technology of China, Chengdu 611731, China
2
The State Key Laboratory of Mechanical Transmissions, Chongqing University, Chongqing 400044, China
3
Center for System Reliability and Safety, University of Electronic Science and Technology of China, Chengdu 611731, China
*
Author to whom correspondence should be addressed.
Metals 2018, 8(12), 1066; https://doi.org/10.3390/met8121066
Submission received: 19 November 2018
/
Revised: 11 December 2018
/
Accepted: 12 December 2018
/
Published: 14 December 2018
Abstract
:Fatigue failure evolution is a process of damage accumulation under continued stresses and forces. The mechanical component is always subjected to various loadings and the lifespan is mainly governed by fatigue. The low cycle fatigue (LCF) is a key failure mode of many components. In order to estimate the LCF life under multiaxial loadings in practical design, a modified model is proposed, based on the Fatemi-Socie (FS) and Smith-Watson-Topper (SWT) models, which considers the effects of shear and tensile behaviours. Then a novel judgment criterion is presented to distinguish the mixed-mode loadings and the procedures to employ the proposed model are also presented. Furthermore, two types of materials (TC4 and GH4169) and comparisons with the FS, Wang-Brown (WB) and redefined SWT (Re-SWT) models are employed to verify the accuracy and effectiveness of the proposed model, which has shown more reasonable predictions than the other models.
1. Introduction
It is known that the relationship between fatigue life and the characteristics of structures is very difficult to describe accurately in engineering applications due to load variations. Fatigue life prediction plays an important role in fatigue failure analysis. According to the failure data of structural components in engineering, low cycle fatigue (LCF) is one of the most important failures. The structural components should have good performance characteristics under different working conditions, if one of them is broken, the mechanical system will fail, resulting in great economic loss, therefore, the mechanical system and the structural components should maintain high reliability and safety [1,2,3,4,5,6,7,8,9,10,11,12,13,14,15,16]. Uniaxial fatigue life prediction methods may not be suitable for the conditions which suffer multiaxial loadings in service, so that multiaxial fatigue methods are employed to estimate the fatigue life. In general, the failure modes can be divided into shear-type failure and tension-type failure and depend on the dominant loadings which leads to failure but many methods have been proposed based on the shear-type failures [17,18,19,20,21,22,23,24]. Chen et al. [22] and Liu [23] proposed two models to estimate the fatigue life under mixed-mode loadings, respectively but they did not give the criterion to identify whether the dominant failure is caused by shear or tensile loading. Furthermore, these models may also lead to overestimated or conservative predictions.
In this paper, we attempt to propose a novel energy-critical multiaxial fatigue life prediction model to estimate the LCF life, which is suitable for mixed-mode loadings. Some multiaxial fatigue models are introduced in Section 2. Section 3 gives the procedures to establish the new model and a judgment criterion to identify the mixed-mode loadings is also presented. Experimental validation with TC4 and GH4169, model comparisons with some traditional methods are presented in Section 4. In Section 5, some conclusions are drawn based on the analysis.
2. Multiaxial Fatigue Life Prediction Methods
In general, the multiaxial fatigue methods can be divided into equivalent stress or strain criteria, the critical plane theory and the energy-based method [10,16,17,18,19]. The equivalent stress or strain criteria cannot consider effects between stress and strain during the process of deformation and cannot reflect the interactions of loading paths. The energy-based method needs an accurate constitutive model to reflect the material behaviour and it is not precise when the cyclic plastic strain energy is small. On the contrary, the critical plane method has shown acceptable predictions of fatigue lives under various loading conditions but it needs additional efforts to get the fatigue data as preparatory work to determine more material properties of the multiaxial fatigue life estimation than that of the uniaxial fatigue life estimation [16].
Kandil et al. [25] proposed a formulation under biaxial loadings, which considered the maximum shear strain range as the main factor leading to failure and the normal strain on the same critical plane as the secondary damage parameter, given as
where and are the elastic and plastic Poisson’s ratio, respectively; is the maximum shear strain range; is the normal strain range on the maximum shear strain plane; is the fatigue strength coefficient; is fatigue ductility coefficient; b is fatigue strength exponent, c is fatigue ductility exponent, E is the Young’s modulus, Nf is the number of cycles to failure, s is a material parameter that can be obtained from Equation (2) in which and are the shear fatigue strength coefficient and exponent, respectively, and are shear fatigue ductility coefficient and exponent, respectively and G is the shear modulus given by .
In the consideration of the mean normal stress effect, Wang and Brown [26] modified Equation (1) based on the Morrow model [16], which was defined as (WB model)
Fatemi and Socie [27] considered different viewpoints on fatigue and used the stress to replace the secondary fatigue parameter term in Equation (1) and then proposed a model involving tensile and torsional loading conditions as (FS model)
where σy is the yield strength, k is the material constant which can be obtained with uniaxial experimental data, given as [16]
In addition, Smith et al. [28] also proposed a model considering the mean stress effect for uniaxial loading conditions which could also be used in in-phase and out-of-phase multiaxial loading conditions and the failure occurred on the maximum normal strain range plane (MNSRP). It involved normal strain range and maximum normal stress , given as (SWT model)
In general, the WB, FS and SWT models have already gained a certain acceptance for fatigue life estimation but more uniaxial properties and test data are required to guarantee the accuracy of the above-mentioned models. Moreover, potential research on fatigue analysis theory and tools will recognize and describe the failure mechanism [29].
3. Proposed Model
The FS model is one of the most widely used models in multiaxial fatigue life prediction, because it can adjust in-phase and out-of-phase loading conditions. However, the value of k changes with the loading cycles and the FS model may lead to over estimations of tension-type failure. The SWT model works very well in the fatigue life predictions of tension-type failure. Therefore, a modification of the FS and SWT models is investigated for fatigue life under mixed-mode loading, which can evaluate the tension-type or shear-type failure.
Applying the SWT theory to the shear-type failure, we obtain
The modification of the FS and SWT models is given as
By adding an additional term in Equation (7), which is similar to the term of the FS model and represents the attributions of tensile behaviours for the shear-type failures on the MSSRP (all the strains and stresses on the MSSRP are added with a subscript A), as shown in Equation (8). Similarly, adding the additional term in Equation (6) to represent the attributions of shear behaviours for the tension-type failures on the MNSRP (all the strains and stresses on the MNSRP are added with a subscript B), as shown in Equation (9).
To identify the failure which was caused by the shear or tensile behaviours, a novel judgment criterion is presented to determine the dominate mode, which leads to failure. A ratio is employed to compare the values of and and it is given as
It is suggested that is used as the critical value to determine the modes in this paper (the critical value of different materials is determined by the actual situation), if , the failure is dominated by the shear-type failure, otherwise, if , it was dominated by the tension-type failure. For some special cases, when (no matter or not), the failure is regarded as the shear-type failure.
Based on this, the proposed model is defined as
Applying the novel judgment criterion to the SWT model, the redefined SWT (Re-SWT) model is given as
The proposed model in the form of both maximum shear/normal stresses and strains considers the material properties without any uncertain material constants and it can be seen as a combination of the FS and SWT models, which maintains the benefits of the FS and SWT models and does not need additional efforts to estimate the value of k. or can be seen as the main cause of failure, the or is the correction factor which allows the effects of the mean normal/shear stress and additional hardening to be considered and accelerates the failing process.
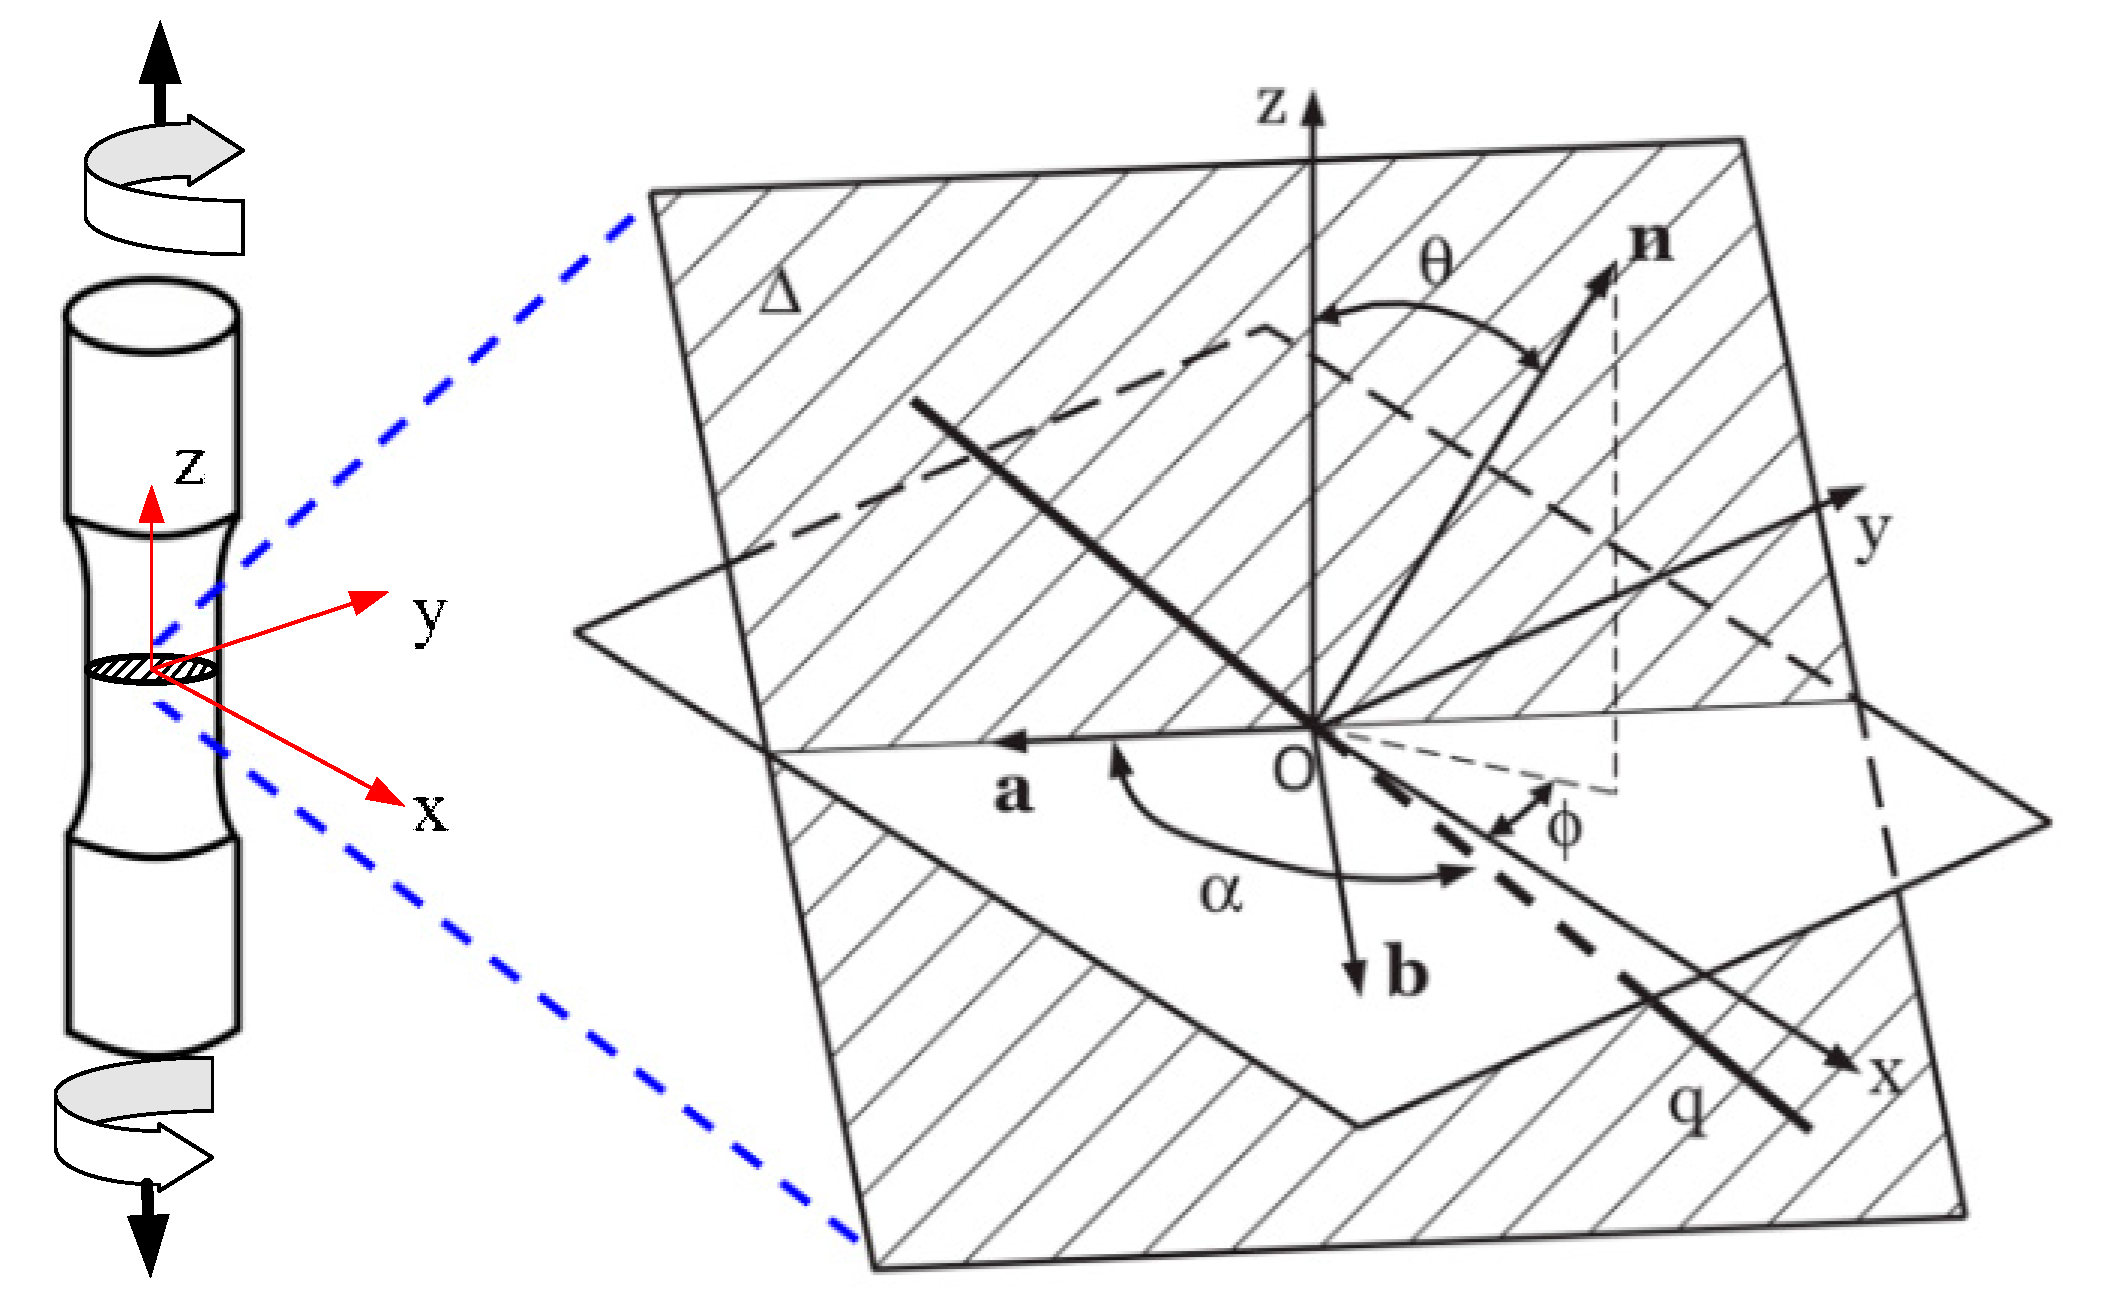
Applying the above-mentioned models to estimate the fatigue life for materials, the most important thing is to locate the critical plane, as shown in Figure 1.
Note from Figure 1, the stress-strain responses of loading history for a reference point on local coordinate system Oxyz can be defined as [30,31]
where , denotes a certain point of all the loading histories; , , , denote the normal stress, normal strain, shear stress and shear strain components, respectively. The new reference system Oanb is determined by the angles and which can be transformed by the Oxyz, the transformation matrix is given as
The stress-strain responses under the new reference system can be given as
By changing the angles , we can calculate the maximum damage parameters and estimate the fatigue life according to different methods. The procedures of employing the above-mentioned models can be outlined as follows:
(1) Collecting the stress-strain responses under a certain loading cycle and calculating the stresses and strains of the critical area at the first candidate plane by Equation (13).
(2) Determining the candidate critical plane by changing the angles with every 1°, then the new candidate critical can be located as and calculating the damage parameters with every candidate critical plane based on Equation (15), that is
① for FS model and WB model, the critical plane is the MSSRP, the shear strain range acting on the ith candidate material plane can be determined by
where p is the number of subdivisions in one loading cycle, which means that one cycle is divided into p subdivisions; then comparing shear strain range on every candidate critical plane, the critical plane can be selected and the maximum shear strain range is
② for SWT model, the critical plane is the MNSRP, the normal strain range acting on the ith candidate material plane can be determined by
then comparing strain range on every candidate critical plane, the critical plane can be selected and the maximum strain range is
③ for proposed model and Re-SWT model, in order to determine dominant failure (tension-type or shear-type failure), the steps ① and ② are both required; to distinguish the critical plane in the proposed model and the Re-SWT model, the MSSRP is named as , the MNSRP is named as .
(3) When the critical plane is located, the other fatigue parameters on the critical plane can be calculated, Such as the normal strain range and the maximum normal stress on the MSSRP also should be known for the FS model and the fatigue life can be determined by the different models.
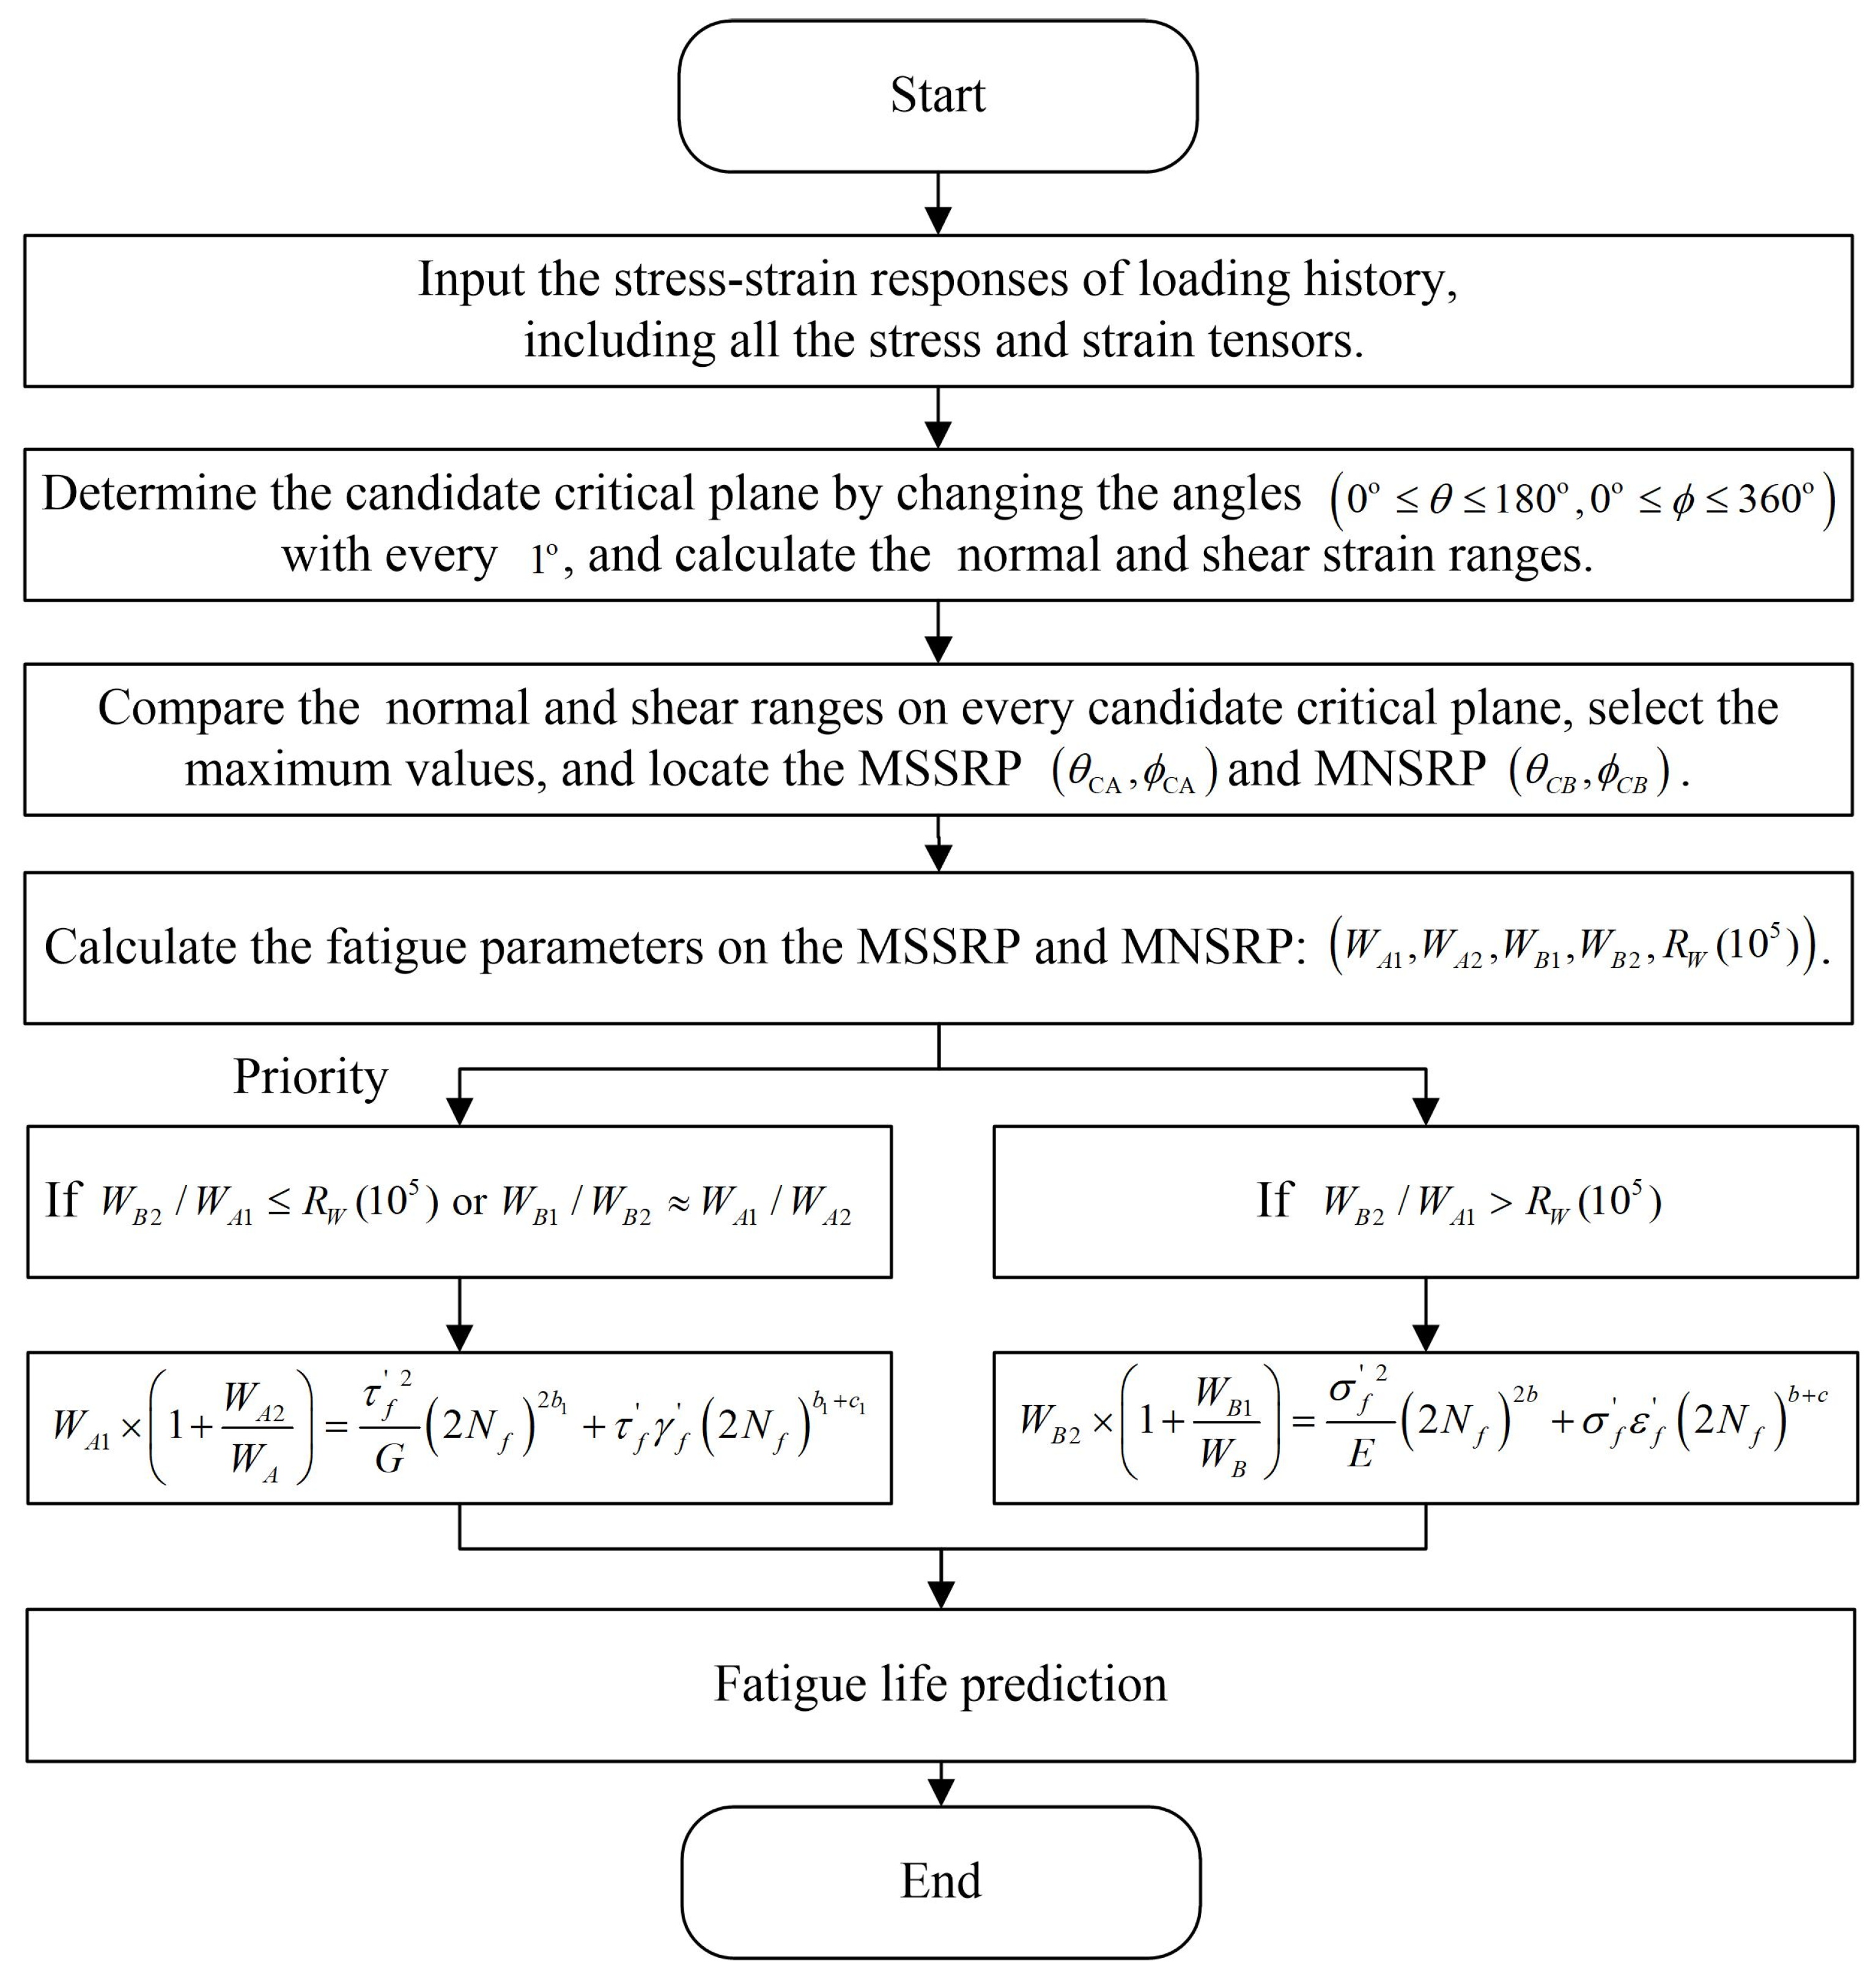
Static equilibrium can be applied to determine the stress-strain responses of the planes which give the angles and tubular specimen axis based on the Equations (13)–(15). The procedures to employ the proposed model are given in Figure 2.
4. Experimental Validation and Discussion
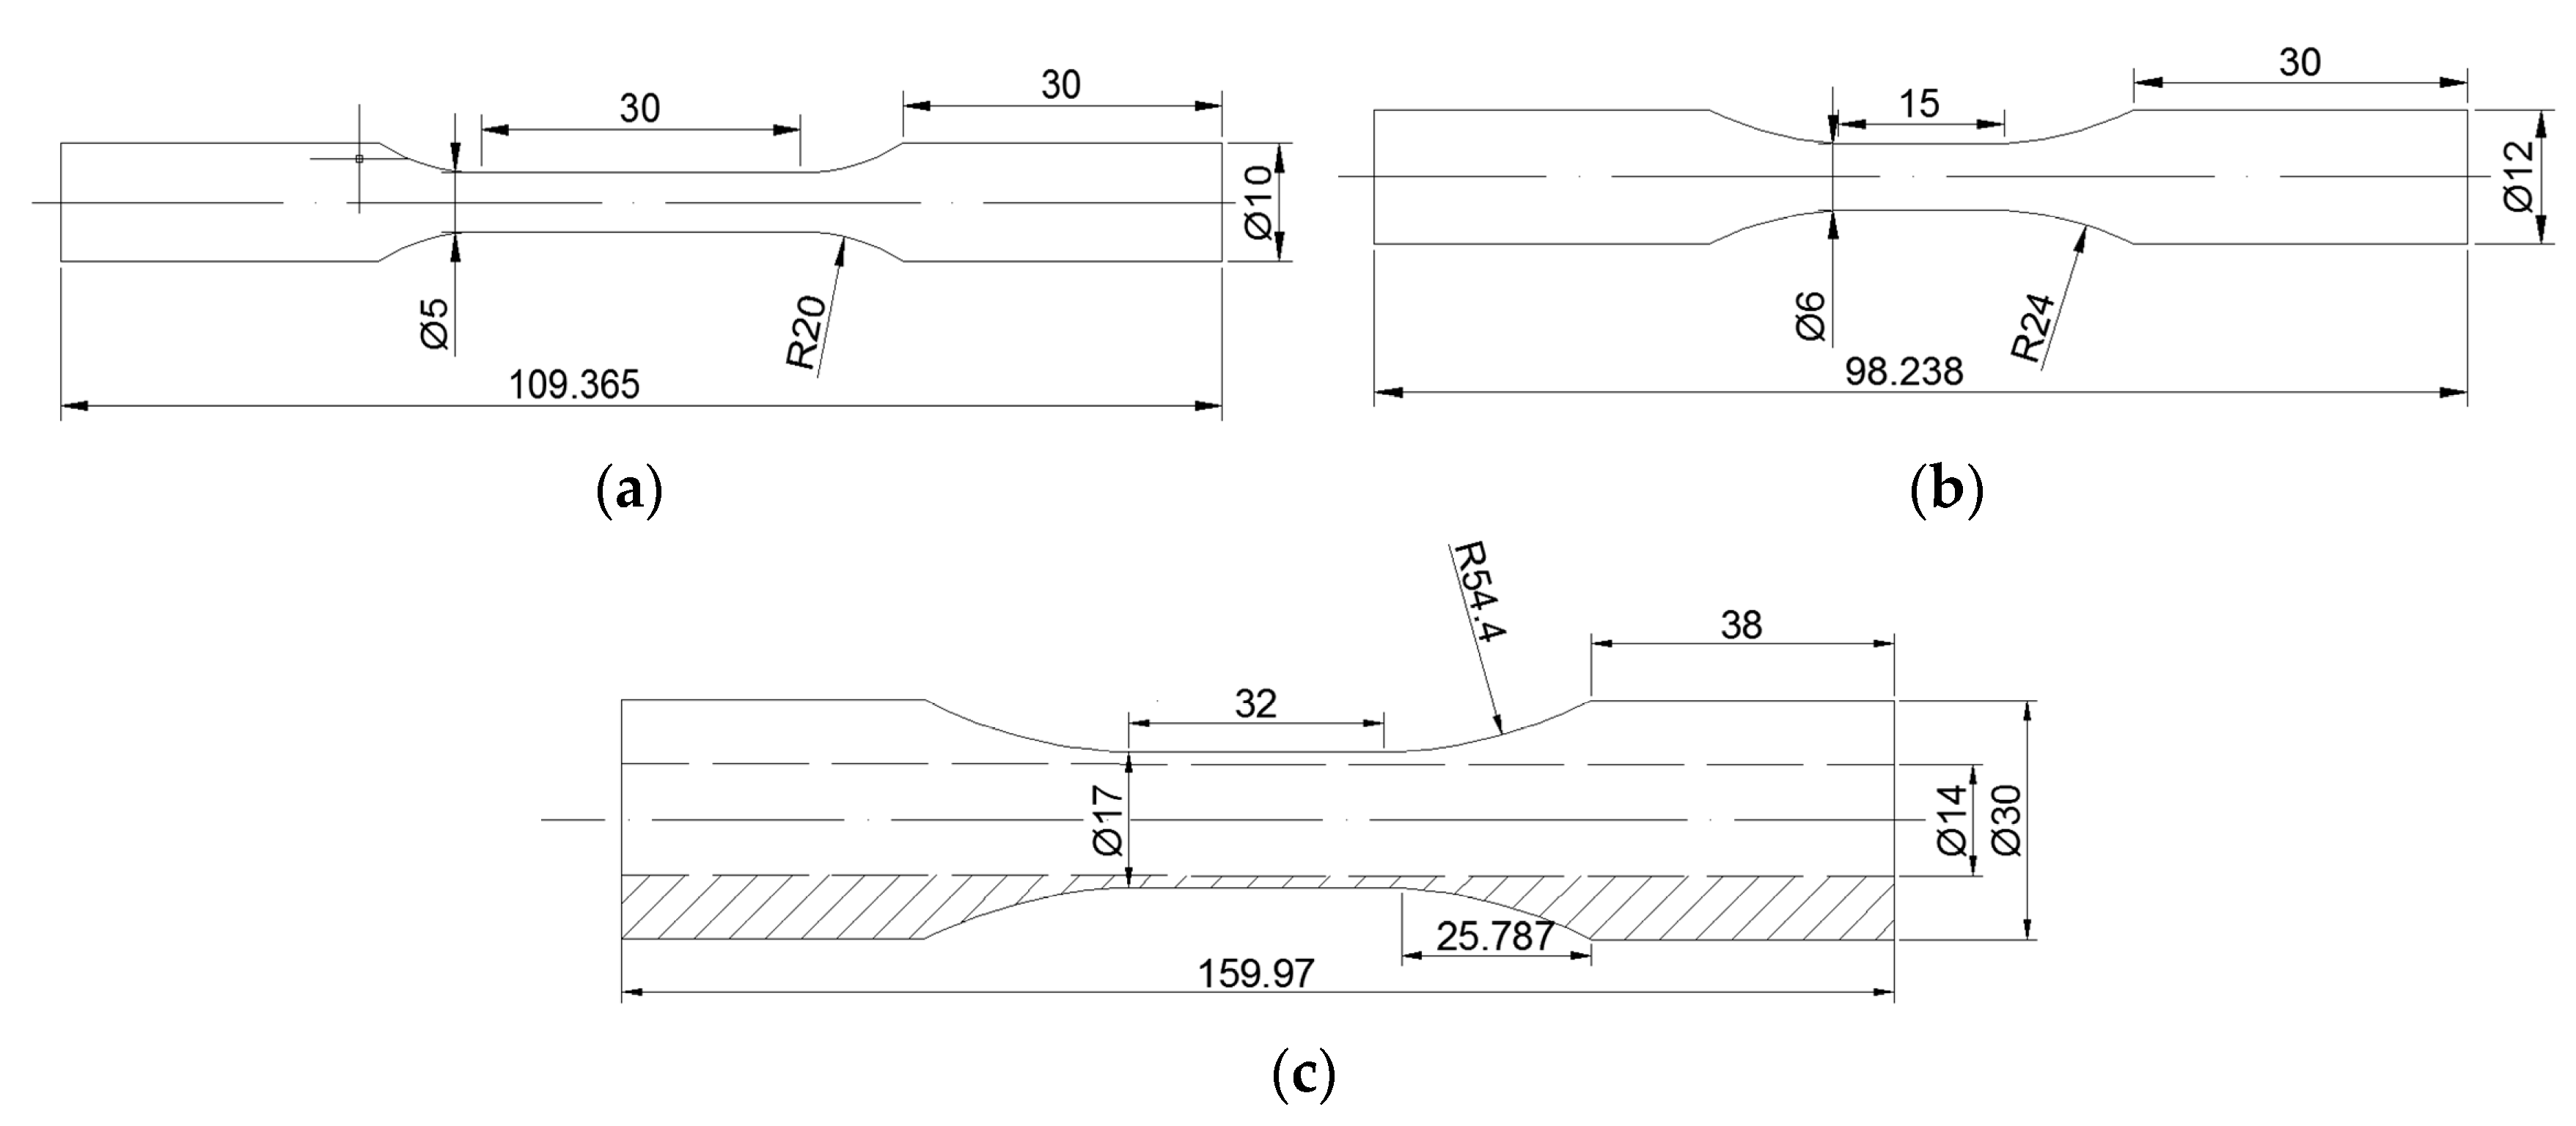
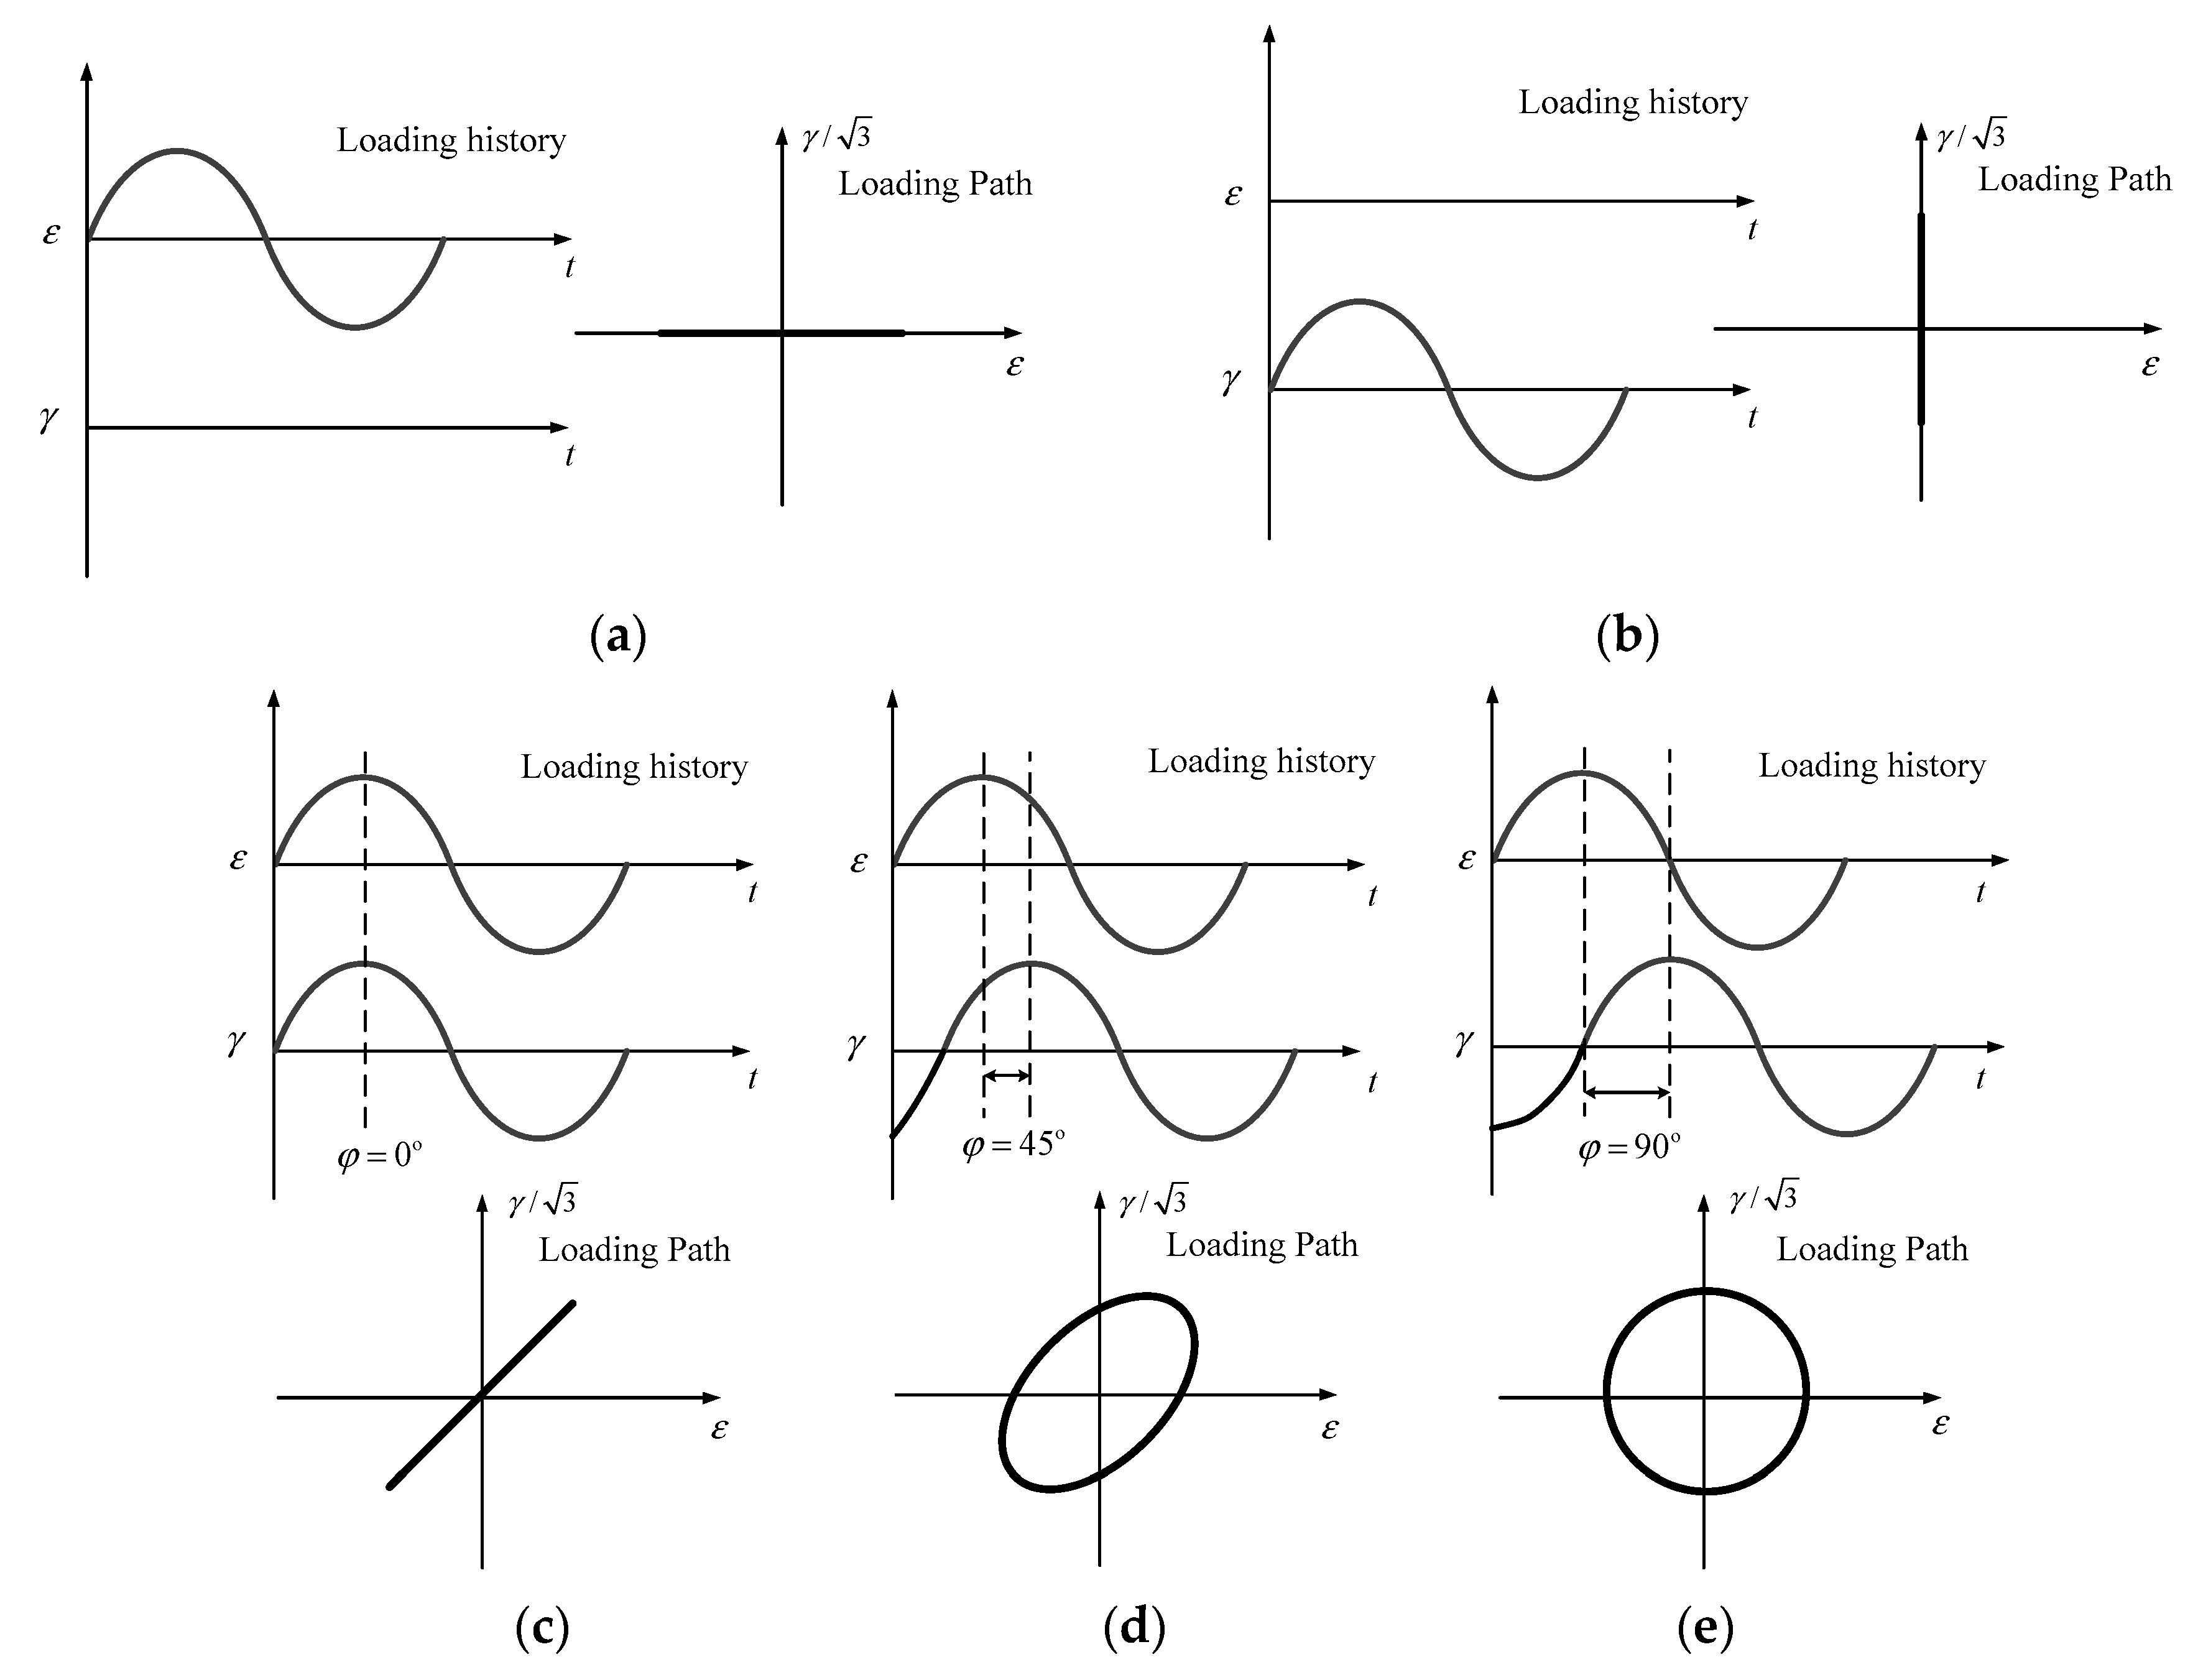
In an effort to verify the proposed model, comparisons with the FS, WB and Re-SWT models were conducted and the experiments were carried out under various loadings. In this paper, the GH4169 and TC4 alloys are employed and conducted on a servo-hydraulic MTS Model 809 axial-torsion testing system based on ASTM E2207 standard, the experimental condition and the specimens are described as [31,32,33]: for GH4169 and TC4 at room temperature, solid specimens were used for monotonic and axial tests, respectively, as shown in Figure 3a,b. Tubular specimens were used for pure torsional and multiaxial (in-phase, 45° and 90° out-of-phase) fatigue tests, as shown in Figure 3c. Fully reversed sinusoidal waveforms for GH4169 and TC4 and not fully reversed waveform for TC4 with frequency of 0.5–1.0 Hz were applied to all the tests. The loading history and loading path under symmetric loadings for the fatigue tests are shown in Figure 4. The material properties of GH4169 and TC4 at room temperature are shown in Table 1. The experimental data for GH4169 under symmetric loadings are shown in Table 2 and for TC4 under symmetric and asymmetric loadings are shown in Table 3 and Table 4, respectively. In order to give a better view of the scatter with the experimental data, an equivalent strain-life curve (equivalent strain ) is employed, as shown in Figure 5, note that there are 34 specimens for GH4169 and 56 specimens for TC4. More details can be found in Ref. [31,32,33].
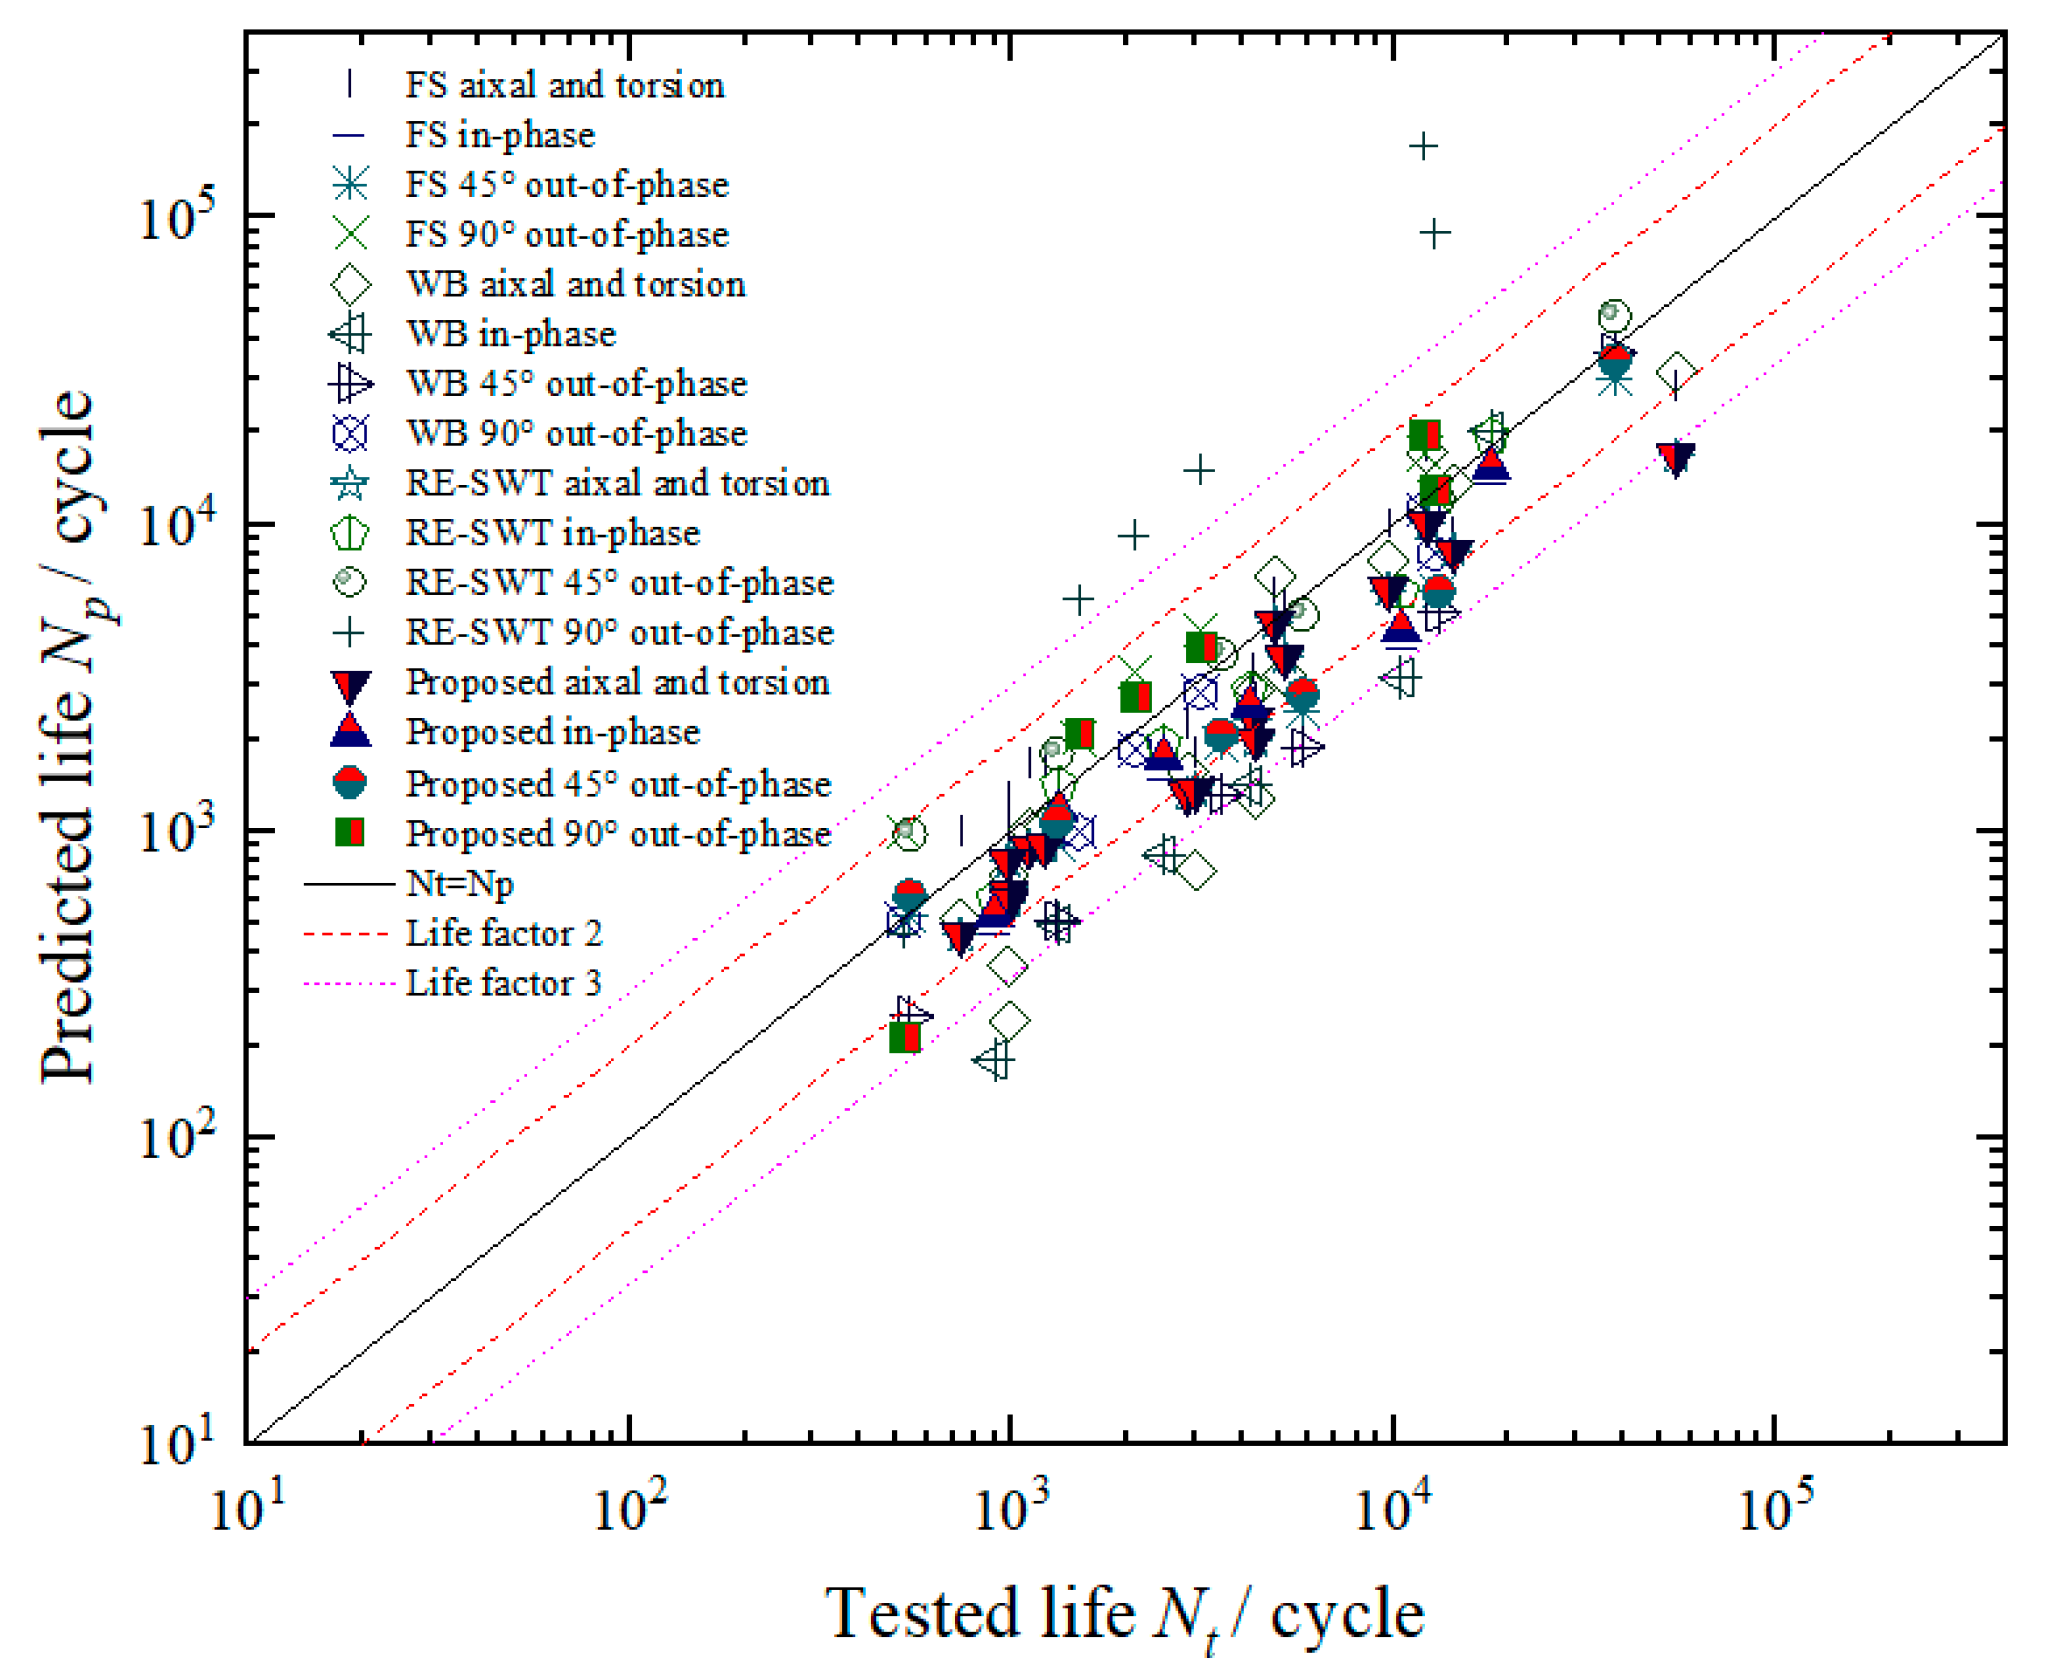
Assuming that the material constants k and s of the FS and WB models were estimated by Equations (2) and (5) when life cycles , the fatigue life predictions of GH4169 and TC4 based on the Re-SWT, WB, FS and proposed models compared with experimental data are shown in Figure 6 and Figure 7, respectively.
Note from Figure 6 for GH4169, a good agreement for the proposed model and FS model can be observed where almost all the predicted results are within the ±3 scatter band; the WB model shows more conservative predictions under torsional, in-phase and 45° out-of-phase loadings, which gives acceptable results under axial and 90° out-of-phase loadings; the Re-SWT model shows a large scatter of predicted results under 90° out-of-phase loadings and gives good predictions for the other loadings. Note from Figure 7a for TC4, the predicted results of FS and proposed models are better than those of Re-SWT and WB models, otherwise, the Re-SWT model provides overestimated predictions under 45° and 90° out-of-phase loadings. From Figure 7b for TC4, the predicted results of proposed model show the smallest scatter than those of the other three models, most of them are within ±3 scatter band, only one of the predictions is without ±3 scatter band. Note from Figure 7 for TC4, the performances of the FS, WB and proposed models are quite similar under symmetric and in-phase asymmetric loadings, while the predicted lives of the FS and WB models show much higher scatter than that provided by the proposed model.
In fact, 90° out-of-phase loading path can lead to the most significant hardening than the other loading paths, which may significantly lead to the variations of fatigue life and hardening or softening effect of the other loading paths is not as significant as the 90° out-of-phase loading path. The effect of mean normal/shear stress and hardening/softening can be regarded as tensile or shear behaviour according to the actual situation. When estimating the fatigue lives under symmetric loadings and in-phase asymmetric loadings, the WB, FS and proposed models can account for both shear and tensile behaviours but Re-SWT considers only one of the behaviours and ignores another one, so it has shown the poorest performance in 90° out-of-phase loading path. When estimating the fatigue lives under 90° out-of-phase asymmetric loadings, only the proposed model can provide reasonable estimations compared with the FS and WB models, it is because that the proposed model involves almost all the stress-strain responses of the critical plane and the FS and WB models involve only shear strain and normal stress/strain.
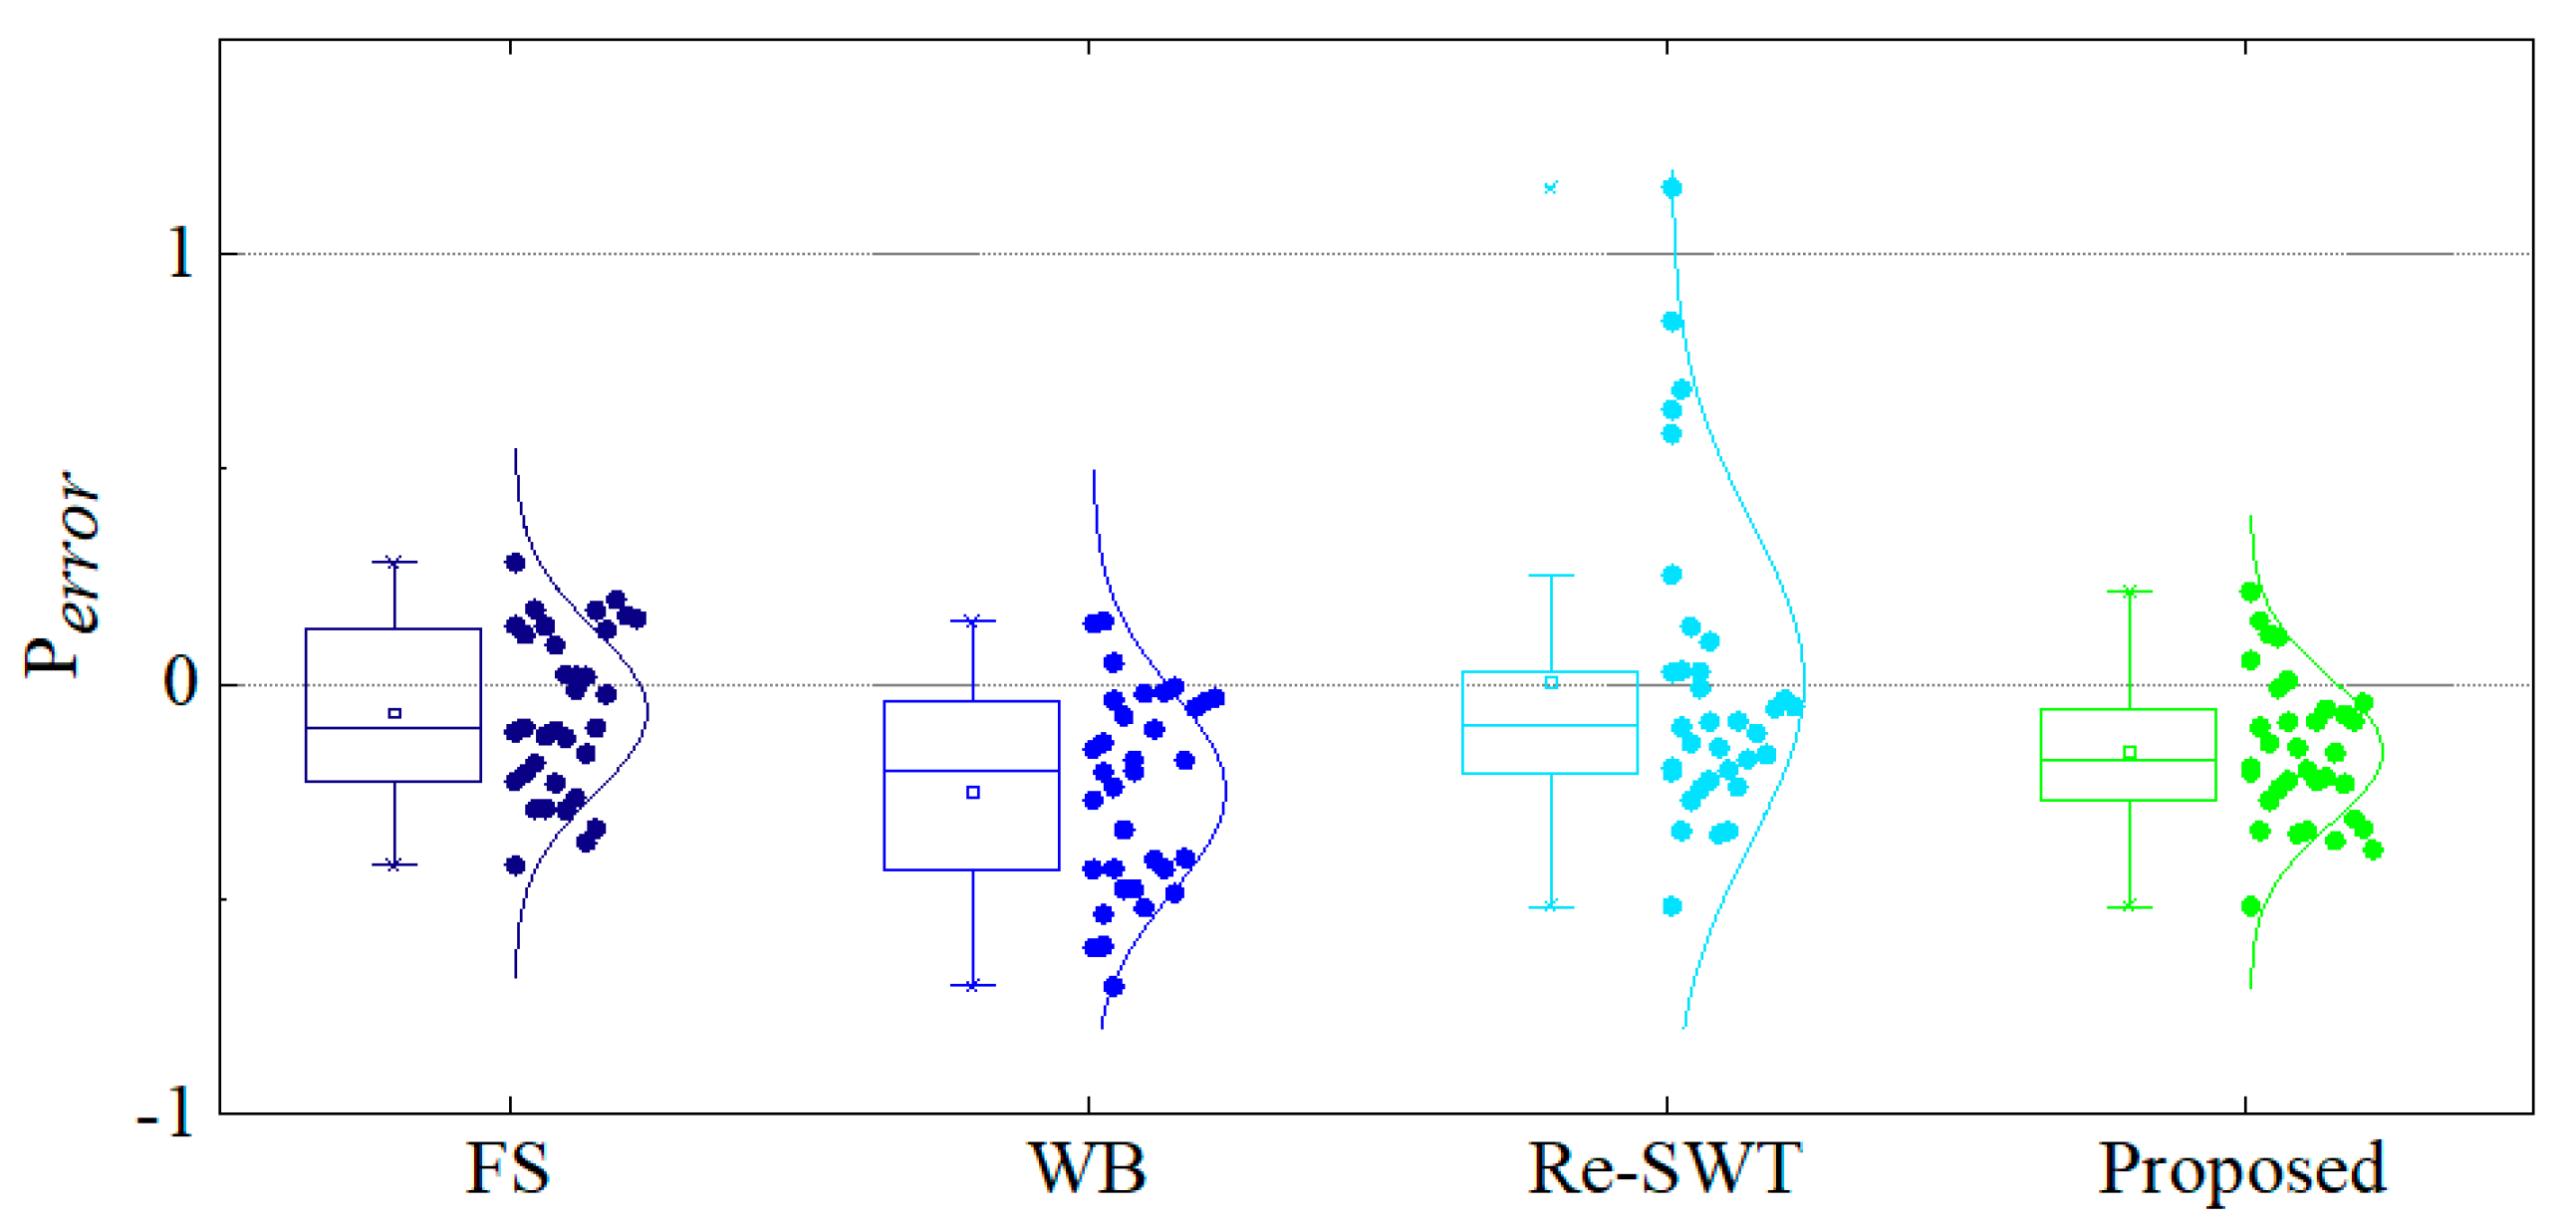
To obtain the estimation errors, the estimation deviation between the logarithmic predicted and experimental lives, as shown in Equation (20), is utilized to describe the accuracy of above models. The estimation errors are illustrated in Figure 8 and Figure 9.
Note from Figure 8 and Figure 9 that the FS and proposed models show acceptable predictions of GH4169 and TC4 under symmetric loadings; the WB model works well in predicting the lifecycles of TC4 under symmetric loadings and shows conservative predictions for GH4169 under the same working condition; the predicted results of the Re-SWT model shows a larger scatter than that of the other three model for both GH4169 and TC4. Moreover, the FS, WB and Re-SWT models are not suitable to predict the multiaxial fatigue lives of TC4 based on the analysis of different loading paths, which show very large scatters. The proposed model shows the best prediction accuracy of TC4 compared with the other models under symmetric and asymmetric loadings. The estimation errors of GH4169 are lower than those of TC4 at the same loading paths, which may result from the material properties and scatter of tests. In total, the proposed model can provide accurate and reasonable predictions for uniaxial and multiaxial loading paths.
5. Conclusions
In this paper, a novel energy-critical plane model is presented where two types of experimental data for GH4169 and TC4 at room temperature with different loading paths were used for model validation. Model comparisons have also been conducted with the FS, WB and Re-SWT models. Some conclusions are drawn as follows:
(1) Based on the SWT and FS models, a modified model is established to estimate the multiaxial fatigue life with no additional material parameters, which is suitable for symmetric and asymmetric loadings under in-phase and out-of-phase conditions and the procedures to employ the proposed model is also presented.
(2) The FS model only takes the mean normal stress into account and it does not consider tension-type failures, which may lead to overestimated or conservative predictions. However, the proposed model can consider the effects of shear and tensile behaviours.
(3) For TC4 and GH4169, the FS and proposed models can provide accurate predictions under symmetric loadings and the proposed model also works well under asymmetric loadings. But, the predictions of the Re-SWT and WB models show much larger scatters than those of the FS and proposed models. In other words, the proposed model can give more accurate predictions under symmetric and asymmetric loadings than the other three models.
Author Contributions
Data curation, J.Z. and H.L.; Formal analysis, J.Z.; Funding acquisition, H.-Z.H.; Investigation, H.L.; Methodology, J.Z.; Project administration, H.-Z.H.; Supervision, H.-Z.H.; Validation, J.Z. and H.L.; Writing—original draft, J.Z.; Writing—review & editing, H.-Z.H.
Funding
This research was funded by The State Key Laboratory of Mechanical Transmissions, Chongqing University, grant number SKLMT-KFKT-201601, and was funded by National Natural Science Foundation of China, grant number 51875089.
Acknowledgments
The authors would like to express special thanks to Guoliang Huang at University of Missouri for his considerable help. The authors also appreciate the reviewers for their constructive comments.
Conflicts of Interest
The authors declare no conflict of interest.
Nomenclature
| Elastic Poisson’s ratio | |
| Plastic Poisson’s ratio | |
| , | Maximum shear stress on the corresponding critical plane |
| Shear stress amplitude | |
| Mean shear stress | |
| Shear stress on the corresponding critical plane | |
| Maximum normal stress on the corresponding critical plane | |
| Normal stress on the corresponding critical plane | |
| Normal stress amplitude | |
| Mean normal stress | |
| Maximum shear strain range on the corresponding critical plane | |
| Shear strain range on the corresponding critical plane | |
| Shear strain amplitude | |
| Mean shear strain | |
| Normal strain range on the corresponding critical plane | |
| Normal strain amplitude | |
| Mean normal strain | |
| Maximum normal strain range on the corresponding critical plane | |
| Fatigue strength coefficient | |
| Fatigue ductility coefficient | |
| b | Fatigue strength exponent |
| c | Fatigue ductility exponent |
| Shear fatigue strength coefficient | |
| Shear fatigue strength exponent | |
| Shear fatigue ductility coefficient | |
| Shear fatigue ductility exponent | |
| E | Young’s modulus |
| G | Shear modulus |
| Number of cycles to failure | |
| Predicted life cycles | |
| Experimental life cycles | |
| s, k | Material parameter |
| Mean normal stress | |
| Yield strength | |
| Cyclic strength coefficient | |
| Cyclic strain hardening exponent | |
| LCF | Low Cycle Fatigue |
| FS | Fatemi-Socie |
| SWT | Smith-Watson-Topper |
| Re-SWT | Redefined SWT |
| WB | Wang-Brown |
| MSSRP | Maximum shear strain range plane |
| MNSRP | Maximum normal strain range plane |
References
- Tao, C.; Zhong, P.; Li, R.Z. Failure Analysis and Prevention for Rotor in Aero-Engine; National Defence Industry Press: Beijing, China, 2000. [Google Scholar]
- Barella, S.; Boniardi, M.; Cincera, S.; Pellin, P.; Degive, X.; Gijbels, S. Failure analysis of a third stage gas turbine blade. Eng. Fail. Anal. 2011, 18, 386–393. [Google Scholar] [CrossRef]
- Zhou, J.; Huang, H.Z.; Peng, Z. Fatigue life prediction of turbine blades based on a modified equivalent strain model. J. Mech. Sci. Technol. 2017, 31, 4203–4213. [Google Scholar] [CrossRef]
- Mi, J.; Li, Y.F.; Peng, W.; Huang, H.Z. Reliability analysis of complex multi-state system with common cause failure based on evidential networks. Reliab. Eng. Syst. Saf. 2018, 174, 71–81. [Google Scholar] [CrossRef]
- Mi, J.; Li, Y.F.; Yang, Y.J.; Peng, W.; Huang, H.Z. Reliability assessment of complex electromechanical systems under epistemic uncertainty. Reliab. Eng. Syst. Saf. 2016, 152, 1–15. [Google Scholar] [CrossRef]
- Hou, J.; Wicks, B.J.; Antoniou, R.A. An investigation of fatigue failures of turbine blades in a gas turbine engine by mechanical analysis. Eng. Fail. Anal. 2002, 9, 201–211. [Google Scholar] [CrossRef]
- Jørgensen, J.B.; Sørensen, B.F.; Kildegaard, C. Tunneling cracks in full scale wind turbine blade joints. Eng. Fract. Mech. 2018, 189, 361–376. [Google Scholar] [CrossRef]
- Maktouf, W.; Ammar, K.; Naceur, I.B.; Saï, K. Multiaxial high-cycle fatigue criteria and life prediction: Application to gas turbine blade. Int. J. Fatigue 2016, 92, 25–35. [Google Scholar] [CrossRef]
- Žužek, B.; Burja, J. Investigation of nickel alloy fan blade failure in a flue gas desulfurization unit. Eng. Fail. Anal. 2017, 82, 855–861. [Google Scholar] [CrossRef]
- Li, H.; Huang, H.Z.; Li, Y.F.; Zhou, J.; Mi, J. Physics of failure-based reliability prediction of turbine blades using multi-source information fusion. Appl. Soft Comput. 2018, 72, 624–635. [Google Scholar] [CrossRef]
- Gao, J.; An, Z.; Kou, H. Fatigue life prediction of wind turbine rotor blade composites considering the combined effects of stress amplitude and mean stress. Proc. Inst. Mech. Eng. O J. Ris. Reliab. 2018. [Google Scholar] [CrossRef]
- Li, X.Y.; Li, Y.F.; Huang, H.Z.; Zio, E. Reliability assessment of phased-mission systems under random shocks. Reliab. Eng. Syst. Saf. 2018, 180, 352–361. [Google Scholar] [CrossRef]
- Yang, L.; Liu, Q.X.; Zhou, Y.C.; Mao, W.G.; Lu, C. Finite element simulation on thermal fatigue of a turbine blade with thermal barrier coatings. J. Mater. Sci. Technol. 2014, 30, 371–380. [Google Scholar] [CrossRef]
- Li, X.Y.; Huang, H.Z.; Li, Y.F. Reliability analysis of phased mission system with non-exponential and partially repairable components. Reliab. Eng. Syst. Saf. 2018, 175, 119–127. [Google Scholar] [CrossRef]
- Huang, H.Z.; Huang, C.G.; Peng, Z.; Li, Y.F.; Yin, H. Fatigue life prediction of fan blade using nominal stress method and cumulative fatigue damage theory. Int. J. Turbo Jet Eng. 2017. [Google Scholar] [CrossRef]
- Socie, D.F.; Marquis, G.B. Multiaxial Fatigue; Society of Automotive Engineers, Inc.: Warrendale, PA, USA, 2000. [Google Scholar]
- Ince, A.; Glinka, G. A generalized fatigue damage parameter for multiaxial fatigue life prediction under proportional and non-proportional loadings. Int. J. Fatigue 2014, 62, 34–41. [Google Scholar] [CrossRef]
- Sun, G.Q.; Shang, D.G.; Bao, M. Multiaxial fatigue damage parameter and life prediction under low cycle loading for GH4169 alloy and other structural materials. Int. J. Fatigue 2010, 32, 1108–1115. [Google Scholar] [CrossRef]
- Wu, Z.R.; Li, X.; Fang, L.; Song, Y.D. Multiaxial fatigue life prediction based on nonlinear continuum damage mechanics and critical plane method. J. Mater. Eng. Perform. 2018, 27, 3144–3152. [Google Scholar] [CrossRef]
- Chen, H.; Shang, D.G.; Tian, Y.J.; Liu, J.Z. Fatigue life prediction under variable amplitude axial–torsion loading using maximum damage parameter range method. Int. J. Pres. Ves. Pip. 2013, 111, 253–261. [Google Scholar] [CrossRef]
- Bolchoun, A.; Baumgartner, J.; Kaufmann, H. A new method for fatigue life evaluation under out-of-phase variable amplitude loadings and its application to thin-walled magnesium welds. Int. J. Fatigue 2017, 101, 159–168. [Google Scholar] [CrossRef]
- Chen, X.; Xu, S.; Huang, D. A critical plane-strain energy density criterion for multiaxial low-cycle fatigue life under non-proportional loading. Fatigue Fract. Eng. Mater. Struct. 1999, 22, 679–686. [Google Scholar] [CrossRef]
- Liu, K.C. A method based on virtual strain-energy parameters for multiaxial fatigue life prediction. In Advances in Multiaxial Fatigue; ASTM International: West Conshohocken, PA, USA, 1993. [Google Scholar]
- Susmel, L.; Meneghetti, G.; Atzori, B. A simple and efficient reformulation of the classical Manson–Coffin curve to predict lifetime under multiaxial fatigue loading—Part I: Plain materials. J. Eng. Mater. Technol. 2009, 131, 021009. [Google Scholar] [CrossRef]
- Kandil, F.A.; Brown, M.W.; Miller, K.J. Biaxial low-cycle fatigue failure of 316 stainless steel at elevated temperatures. In Mechanical Behaviour and Nuclear Applications of Stainless Steel at Elevated Temperatures; Metals Society: London, UK, 1982. [Google Scholar]
- Wang, C.H.; Brown, M.W. Multiaxial random load fatigue: Life prediction techniques and experiments. In Multiaxial Fatigue and Design; ESIS 21; Mechanical Engineering Publications: London, UK, 1996. [Google Scholar]
- Fatemi, A.; Socie, D.F. A critical plane approach to multiaxial fatigue damage including out-of-phase loading. Fatigue Fract. Eng. Mater. Struct. 1988, 11, 149–165. [Google Scholar] [CrossRef]
- Smith, K.N.; Watson, P.; Topper, T.H. A stress-strain function for the fatigue of metals. J. Mater. 1970, 5, 767–778. [Google Scholar]
- Zhang, X.; Gao, H.; Huang, H.Z.; Li, Y.F.; Mi, J. Dynamic reliability modeling for system analysis under complex load. Reliab. Eng. Syst. Saf. 2018, 180, 345–351. [Google Scholar] [CrossRef]
- Li, J.; Qiu, Y.Y.; Li, C.W.; Zhang, Z.P. Prediction of fatigue life under multiaxial loading by using a critical plane-based model. Arch. Appl. Mech. 2018. [Google Scholar] [CrossRef]
- Wu, Z.R. Research on Multi-Axial Fatigue Life Prediction Method for Titanium Alloy. Ph.D. Thesis, Nanjing University of Aeronautics and Astronautics, Nanjing, China, 2014. [Google Scholar]
- Wu, Z.R.; Li, X.; Fang, L.; Song, Y.D. Evaluation of multiaxial fatigue life prediction criteria for Ni-based superalloy GH4169. Proc. Inst. Mech. Eng. C J. Mech. Eng. Sci. 2018, 232, 1823–1837. [Google Scholar] [CrossRef]
- Wu, Z.R.; Hu, X.T.; Song, Y.D. Multiaxial fatigue life prediction for titanium alloy TC4 under proportional and nonproportional loading. Int. J. Fatigue 2014, 59, 170–175. [Google Scholar] [CrossRef]
- Muñiz Calvente, M. The Generalized Local Model: A Methodology for Probabilistic Assessment of Fracture under Different Failure Criteria. Ph.D. Thesis, University of Oviedo, Oviedo, Spain, 2017. [Google Scholar]
- Castillo, E.; Fernández-Canteli, A. A Unified Statistical Methodology for Modeling Fatigue Damage; Springer Science & Business Media: Berlin, Germany, 2009. [Google Scholar]
Figure 1.
The definition of critical plane.

Figure 2.
The procedures to employ the proposed model.

Figure 3.
Specimens for fatigue tests (unit: mm): (a) Solid specimen for monotonic tests. (b) Solid specimen for axial tests; (c) Tubular specimen for torsional and multiaxial tests.
Figure 3.
Specimens for fatigue tests (unit: mm): (a) Solid specimen for monotonic tests. (b) Solid specimen for axial tests; (c) Tubular specimen for torsional and multiaxial tests.

Figure 4.
The loading history and loading path under symmetric loadings for the fatigue tests: (a) Pure axial loading; (b) Pure torsional loading; (c) In-phase loading; (d) 45° out-of-phase loading; (e) 90° out-of-phase loading.
Figure 4.
The loading history and loading path under symmetric loadings for the fatigue tests: (a) Pure axial loading; (b) Pure torsional loading; (c) In-phase loading; (d) 45° out-of-phase loading; (e) 90° out-of-phase loading.

Figure 5.
Correlation between the tested life and equivalent strain.

Figure 6.
Fatigue life comparison of GH4169 under symmetric loadings.

Figure 7.
Fatigue life comparison of TC4 under symmetric and asymmetric loadings: (a) TC4 under symmetric loading; (b) TC4 under asymmetric loadings.
Figure 7.
Fatigue life comparison of TC4 under symmetric and asymmetric loadings: (a) TC4 under symmetric loading; (b) TC4 under asymmetric loadings.

Figure 8.
Estimation errors of GH4169 under symmetric loadings.

Figure 9.
Estimation errors of TC4 under symmetric and asymmetric loadings: (a) TC4 under symmetric loading; (b) TC4 under asymmetric loadings.
Figure 9.
Estimation errors of TC4 under symmetric and asymmetric loadings: (a) TC4 under symmetric loading; (b) TC4 under asymmetric loadings.


Table 1.
The material properties of GH4169 and TC4 at room temperature.
| Monotonic Properties | ||||||
| GH4169 | 198.5 | 67 | 1083.1 | 0.48 | 1579.7 | 0.06 |
| TC4 | 108.4 | 43.2 | 942.5 | 0.25 | 1054 | 0.0195 |
| Uniaxial properties | b | c | ||||
| GH4169 | 1815.5 | −0.06 | 0.45 | −0.63 | 1892.3 | 0.078 |
| TC4 | 1116.9 | −0.049 | 0.579 | −0.679 | 1031 | 0.0478 |
| Torsional properties | b1 | c1 | ||||
| GH4169 | 1091.6 | −0.07 | 4.46 | −0.77 | 1047.1 | 0.099 |
| TC4 | 716.9 | −0.06 | 2.24 | −0.8 | 446.7 | 0.016 |
Table 2.
The experimental data for GH4169 under symmetric loadings.
(°)> | (cycle) | (°) | (cycle) | ||||||||
|---|---|---|---|---|---|---|---|---|---|---|---|
| / | 1.116 | / | 1220.4 | / | 735 | 0 | 0.77 | 1.175 | 857.1 | 463.3 | 1331 |
| / | 1.006 | / | 1230.8 | / | 982 | 0 | 0.703 | 1.017 | 794.6 | 422.6 | 2503 |
| / | 0.907 | / | 1204.5 | / | 1110 | 0 | 0.612 | 0.88 | 788.6 | 404 | 4200 |
| / | 0.905 | / | 1201.3 | / | 1220 | 0 | 0.476 | 0.732 | 779.4 | 436.3 | 10,456 |
| / | 0.811 | / | 1157.8 | / | 2892 | 0 | 0.342 | 0.622 | 666.9 | 418.6 | 18,027 |
| / | 0.707 | / | 1135.5 | / | 4316 | 45 | 1.066 | 1.4151 | 1086.6 | 559 | 542 |
| / | 0.611 | / | 1096.6 | / | 4882 | 45 | 0.807 | 1.126 | 996.6 | 494 | 1315 |
| / | 0.558 | / | 1055.2 | / | 14,345 | 45 | 0.521 | 0.965 | 796.3 | 519.2 | 3530 |
| / | / | 2.466 | / | 685.5 | 984 | 45 | 0.513 | 0.865 | 837.8 | 487.7 | 5764 |
| / | / | 2.108 | / | 682.9 | 978 | 45 | 0.423 | 0.714 | 790.3 | 454.9 | 13,086 |
| / | / | 1.656 | / | 646.3 | 3026 | 45 | 0.338 | 0.613 | 683.2 | 433.4 | 37,904 |
| / | / | 1.421 | / | 635.2 | 4359 | 90 | 1.069 | 1.3081 | 1199.5 | 659.3 | 520 |
| / | / | 1.145 | / | 581.7 | 5184 | 90 | 0.712 | 1.0231 | 1062.5 | 602 | 1496 |
| / | / | 0.984 | / | 595 | 9689 | 90 | 0.568 | 0.888 | 968.8 | 540.8 | 2102 |
| / | / | 0.877 | / | 559.2 | 12,256 | 90 | 0.492 | 0.827 | 951.1 | 554.7 | 3119 |
| / | / | 0.817 | / | 539.1 | 54,920 | 90 | 0.393 | 0.649 | 787.1 | 473.3 | 12,008 |
| 0 | 1.221 | 1.598 | 937.7 | 478 | 901 | 90 | 0.406 | 0.686 | 822.1 | 502.8 | 12,829 |
Table 3.
The experimental data for TC4 under symmetric loadings.
(°) | (%) | (cycle) | (°) | (%) | (cycle) | ||||||
|---|---|---|---|---|---|---|---|---|---|---|---|
| / | 0.55 | / | 610.2 | / | 60,048 | / | / | 1.302 | / | 431.2 | 2691 |
| / | 0.6 | / | 655.2 | / | 25,069 | / | / | 1.645 | / | 417.8 | 951 |
| / | 0.7 | / | 728.6 | / | 8457 | / | / | 1.942 | / | 413.5 | 459 |
| / | 0.8 | / | 738.9 | / | 4135 | / | / | 2.309 | / | 404.5 | 345 |
| / | 0.8 | / | 766.4 | / | 2544 | 0 | 0.345 | 0.648 | 388.8 | 278.5 | 47,195 |
| / | 0.9 | / | 772.5 | / | 1708 | 0 | 0.427 | 0.710 | 466.4 | 296.0 | 20,611 |
| / | 0.9 | / | 746.7 | / | 1730 | 0 | 0.576 | 0.938 | 490.6 | 282.8 | 4141 |
| / | 1.1 | / | 755.2 | / | 1007 | 0 | 0.687 | 1.111 | 532.1 | 312.7 | 1795 |
| / | 1.1 | / | 746.7 | / | 822 | 0 | 0.863 | 1.371 | 538.8 | 299.4 | 868 |
| / | 1.3 | / | 782.2 | / | 510 | 0 | 1.391 | 2.038 | 530.5 | 261.0 | 351 |
| / | 1.3 | / | 787.6 | / | 529 | 45 | 0.391 | 0.643 | 435.6 | 276.9 | 20,953 |
| / | 1.5 | / | 815.8 | / | 339 | 45 | 0.418 | 0.702 | 472.0 | 303.2 | 9478 |
| / | 1.7 | / | 819.2 | / | 221 | 45 | 0.496 | 0.831 | 545.2 | 342.6 | 4898 |
| / | 2.0 | / | 856.5 | / | 124 | 45 | 0.620 | 1.043 | 592.0 | 340.9 | 1563 |
| / | 2.0 | / | 861.6 | / | 134 | 45 | 0.772 | 1.255 | 629.0 | 341.3 | 683 |
| / | 2.3 | / | 869.3 | / | 89 | 45 | 1.224 | 1.756 | 679.8 | 353.8 | 185 |
| / | 2.3 | / | 861.7 | / | 127 | 90 | 0.349 | 0.639 | 392.8 | 279.6 | 45,138 |
| / | / | 0.798 | / | 345.6 | 69,269 | 90 | 0.418 | 0.704 | 475.7 | 307.8 | 37,273 |
| / | / | 0.833 | / | 359.8 | 51,146 | 90 | 0.499 | 0.821 | 562.6 | 356.4 | 11,152 |
| / | / | 0.848 | / | 374.6 | 37,449 | 90 | 0.556 | 0.934 | 623.6 | 401.2 | 2332 |
| / | / | 0.889 | / | 390.3 | 17,887 | 90 | 0.632 | 1.079 | 703.2 | 427.7 | 1017 |
| / | / | 1.038 | / | 398.1 | 7218 | 90 | 1.229 | 1.700 | 678.6 | 382.3 | 233 |
Table 4.
The experimental data for TC4 under asymmetric loadings.
(°) | (cycle) | ||||||||
|---|---|---|---|---|---|---|---|---|---|
| 0 | 0.382 | 0.714 | 0 | 1.17 | 395.4 | 288 | 0 | 138.1 | 19,750 |
| 0 | 0.556 | 0.889 | 0 | 1.495 | 503.1 | 301.9 | 0 | 106.9 | 5126 |
| 90 | 0.417 | 0.704 | 0 | 1.213 | 470.2 | 301.6 | 0 | 118.5 | 62,435 |
| 90 | 0.485 | 0.828 | 0 | 1.409 | 542.0 | 342.7 | 0 | 112.3 | 4772 |
| 0 | 0.438 | 0.719 | 0.754 | 0 | 444.1 | 285.7 | 268.9 | 0 | 5225 |
| 0 | 0.565 | 0.911 | 1.042 | 0 | 485.9 | 299.0 | 175.2 | 0 | 4422 |
| 90 | 0.420 | 0.698 | 0.428 | 0 | 458.3 | 299.3 | 25 8.4 | 0 | 6878 |
| 90 | 0.502 | 0.822 | 0.974 | 0 | 532.3 | 343.3 | 249.9 | 0 | 2394 |
| 0 | 0.466 | 0.726 | 0.978 | 1.386 | 443.5 | 273.8 | 128.2 | 41.4 | 8867 |
| 0 | 0.614 | 0.916 | 1.016 | 1.697 | 497.4 | 284.8 | 169.5 | 41.7 | 4364 |
| 90 | 0.423 | 0.705 | 0.826 | 1.253 | 456.9 | 293.0 | 242.8 | 108.0 | 5357 |
| 90 | 0.510 | 0.825 | 1.019 | 1.521 | 548.2 | 340.6 | 179.0 | 77.1 | 6035 |
© 2018 by the authors. Licensee MDPI, Basel, Switzerland. This article is an open access article distributed under the terms and conditions of the Creative Commons Attribution (CC BY) license (http://creativecommons.org/licenses/by/4.0/).
Share and Cite
MDPI and ACS Style
Zhou, J.; Huang, H.-Z.; Li, H. A Novel Energy-Critical Multiaxial Fatigue Life Prediction for Low Cycle Fatigue under Mixed-Mode Loading. Metals 2018, 8, 1066. https://doi.org/10.3390/met8121066
AMA Style
Zhou J, Huang H-Z, Li H. A Novel Energy-Critical Multiaxial Fatigue Life Prediction for Low Cycle Fatigue under Mixed-Mode Loading. Metals. 2018; 8(12):1066. https://doi.org/10.3390/met8121066
Chicago/Turabian StyleZhou, Jie, Hong-Zhong Huang, and He Li. 2018. "A Novel Energy-Critical Multiaxial Fatigue Life Prediction for Low Cycle Fatigue under Mixed-Mode Loading" Metals 8, no. 12: 1066. https://doi.org/10.3390/met8121066
Note that from the first issue of 2016, this journal uses article numbers instead of page numbers. See further details here.