Homogenization and Growth Behavior of Second-Phase Particles in a Deformed Zr–Sn–Nb–Fe–Cu–Si–O Alloy
by
 and
and
Liang-Yu Chen
1,2,*, 
Peng Sang
1,
Lina Zhang
1,2,
Dongpo Song
1,
Yan-Qiu Chu
1,
Linjiang Chai
3,* and
Lai-Chang Zhang
2,* 1
School of Science, Jiangsu University of Science and Technology, Zhenjiang 212003, China
2
School of Engineering, Edith Cowan University, 270 Joondalup Drive, Joondalup, Perth, WA 6027, Australia
3
College of Materials Science and Engineering, Chongqing University of Technology, Chongqing 400054, China
*
Authors to whom correspondence should be addressed.
Metals 2018, 8(10), 759; https://doi.org/10.3390/met8100759
Submission received: 31 August 2018
/
Revised: 23 September 2018
/
Accepted: 24 September 2018
/
Published: 25 September 2018
Abstract
:Homogeneous distribution of fine second-phase particles (SPPs) fabricated by cycles of deformation and annealing in zirconium alloys is a critical consideration for the corrosion resistance of fuel claddings. Different deformation degrees of zirconium alloys would result in distinctive microstructures, leading to a distinct growth of SPPs during subsequent annealing. Unfortunately, the homogenization and growth behavior of SPPs in deformed zirconium alloys have not been well studied. In this work, a β-quenched Zr–Sn–Nb–Fe–Cu–Si–O alloy was rolled and annealed at 580 °C or 680 °C. The morphologies, distributions, and sizes of SPPs resulting from the different processing procedures were investigated. A linear distribution of SPPs is found in the β-quenched sample. Afterward, SPPs grow and are randomly distributed during heat treatment as the deformation degree or annealing time (or temperature) increases. The homogenization and growth of SPPs are attributed to the Ostwald ripening mechanism that is governed by lattice diffusion and short-circuit diffusion. The sample with a higher deformation degree is speculated to have a larger number of defects that provide more shortcuts for the mass transfer of SPPs, thereby facilitating a homogeneous distribution of fine SPPs during annealing.
1. Introduction
Zirconium (Zr) alloys have low neutron absorption cross sections and high waterside corrosion resistance [1,2,3,4,5]. Yang et al. [6] pointed out that Zr alloys have adequate workability, and hence Zr alloys are extensively used in various types of nuclear reactors as fuel claddings. During the development of the Zr alloys, Sn, Fe, Nb, Cr, Cu, and some other elements have been used as alloying elements in alloy design [7]. In order to protect the capability of the low neutron absorption cross section of Zr, the total content of the alloying elements is always no more than 5%. Chen et al. and Yang et al. [8,9,10] reported that the alloying elements, except Sn, have a very limited solid solubility in α-Zr; therefore, the alloyed elements are prone to forming second-phase particles (SPPs) in the Zr alloys. So far, several types of SPPs have been reported. Granovsky et al. [11] investigated some zirconium alloys with the chemical compositions of 41–97 at. % Zr, 0.9–32 at. % Nb, and 0.6–38 at. % Fe and found the C15-type face-centered cubic (FCC) precipitates and C14-type hexagonal close-packed (HCP) precipitates, thereby pointing out that the structures of the precipitates basically depend on the chemical compositions of the zirconium alloys. Yang et al. [12] identified β-Nb particles with a body-centered cubic (BCC) structure in a Zr–1.2Nb alloy. Toffolon et al. [13] concluded that the SPPs with these three prominent structures are commonly found in the commercial Zr alloys; the structures of the SPPs are determined by the chemical compositions of the Zr alloys. Regardless of the structure of the SPPs, the corrosion resistance and general mechanical behavior of the Zr alloys are significantly influenced by the morphologies, distributions, and sizes of the SPPs [2,14].
Among the properties of the Zr alloys, corrosion resistance has been considered as one of the most important properties that limit the performance and safety of nuclear reactors [15,16,17]. When the Zr alloys are applied to a working environment (such as in an aqueous solution at high temperature and high pressure in pressurized water reactors), the Zr matrix reacts with H2O to form a protective oxide film against the ingression of oxidizing species. During this process, the SPPs embedded in the matrix are incorporated into the oxide film formed on the surface of Zr alloys. Chen et al. [14] found that the SPPs could trigger the cracks in the oxide film due to the different corrosion rates between the SPPs and their surrounding matrix, thereby degrading the corrosion resistance of the Zr alloys. Such a phenomenon was also observed by Proff et al. [18], and they pointed out that the sizes of cracks induced by SPPs are proportional to the dimensions of the SPPs. Meanwhile, the oxidation of SPPs maintains the induced local stress fields in the oxide film, which sustains the tetragonal zirconia and postpones the formation of cracks [19]. However, Huang et al. [20] specified that the propagation of cracks in the oxide film coincided with the stringer direction of SPPs if the SPPs were linearly distributed, leading to a detrimental effect on the corrosion resistance of Zr alloys. Therefore, ensuring a homogeneous distribution of fine SPPs is a critical consideration in the design of zirconium alloy fuel claddings. Normally, when a new kind of Zr alloy fuel cladding is designed and fabricated, an out-of-pile corrosion test is usually used to preliminarily evaluate its corrosion resistance.
Generally, the homogenization of SPPs can be conducted by repeating the deformation and annealing of Zr alloys during fabrication. In industry, commercial Zr alloy fuel claddings are manufactured by several cycles of deformation (hot extrusion or cold pilgering) and heat treatment after β-quenching [21]. In order to give a comparative study of the manufacturing methods, many researchers [22,23,24,25] used hot rolling and cold rolling instead of hot extrusion and cold pilgering to fabricate Zr alloy sheets with the same thickness for fuel claddings in the laboratory condition. They found that the alloying elements are present as a supersaturated solid solution in the Zr matrix after β-quenching and that linearly distributed SPPs are found after hot rolling. Similar to the manufacturing method in industry, the homogenization of SPPs could be obtained after several cycles of rolling and annealing. However, such a method has a high cost and the excessive annealing processing in this method accelerates the coarsening of SPPs, which plays a detrimental role in the corrosion resistance of the Zr alloy fuel claddings. Meanwhile, Gros et al. [26] proposed that the average size of SPPs for a certain Zr alloy could be compared by a cumulative annealing parameter which normalizes the annealing time and temperature after β-quenching in manufacturing. This means that the longer the annealing time and/or the higher the temperature employed, the larger the SPPs formed in the Zr matrix. Nevertheless, Lifshitz and Slyozov [27] mentioned that the growth of precipitates is a diffusion-controlled process. Hence, the defects (such as grain boundaries and dislocations) play a role in the shortcuts for the mass transfer of precipitates. As a result, the different deformation degrees of Zr alloys before annealing may result in distinct growth behavior of SPPs due to the distinctive number of defects in the Zr matrix. Therefore, a good understanding of the mechanism for the homogenization and growth behavior of SPPs is of significance to further optimize the corrosion performance of Zr alloys. Unfortunately, to date, studies on the homogenization and growth behavior of SPPs in deformed Zr alloys are extremely rare [22,28].
As such, this work aims to investigate the homogenization and growth behavior of SPPs in a deformed Zr–Sn–Nb–Fe–Cu–Si–O alloy. The experimental alloy was hot- or cold-deformed, followed by annealing at 580 °C or 680 °C for different amounts of time. The morphologies, distributions, and sizes of SPPs associated with different processing procedures were thus characterized in detail. The underlying mechanism for the homogenization and growth behavior of SPPs was discussed. To further confirm the corrosion resistance of the samples with inhomogeneously and homogeneously distributed SPPs, an isothermal static autoclave test was carried out.
2. Materials and Methods
2.1. Material Preparation
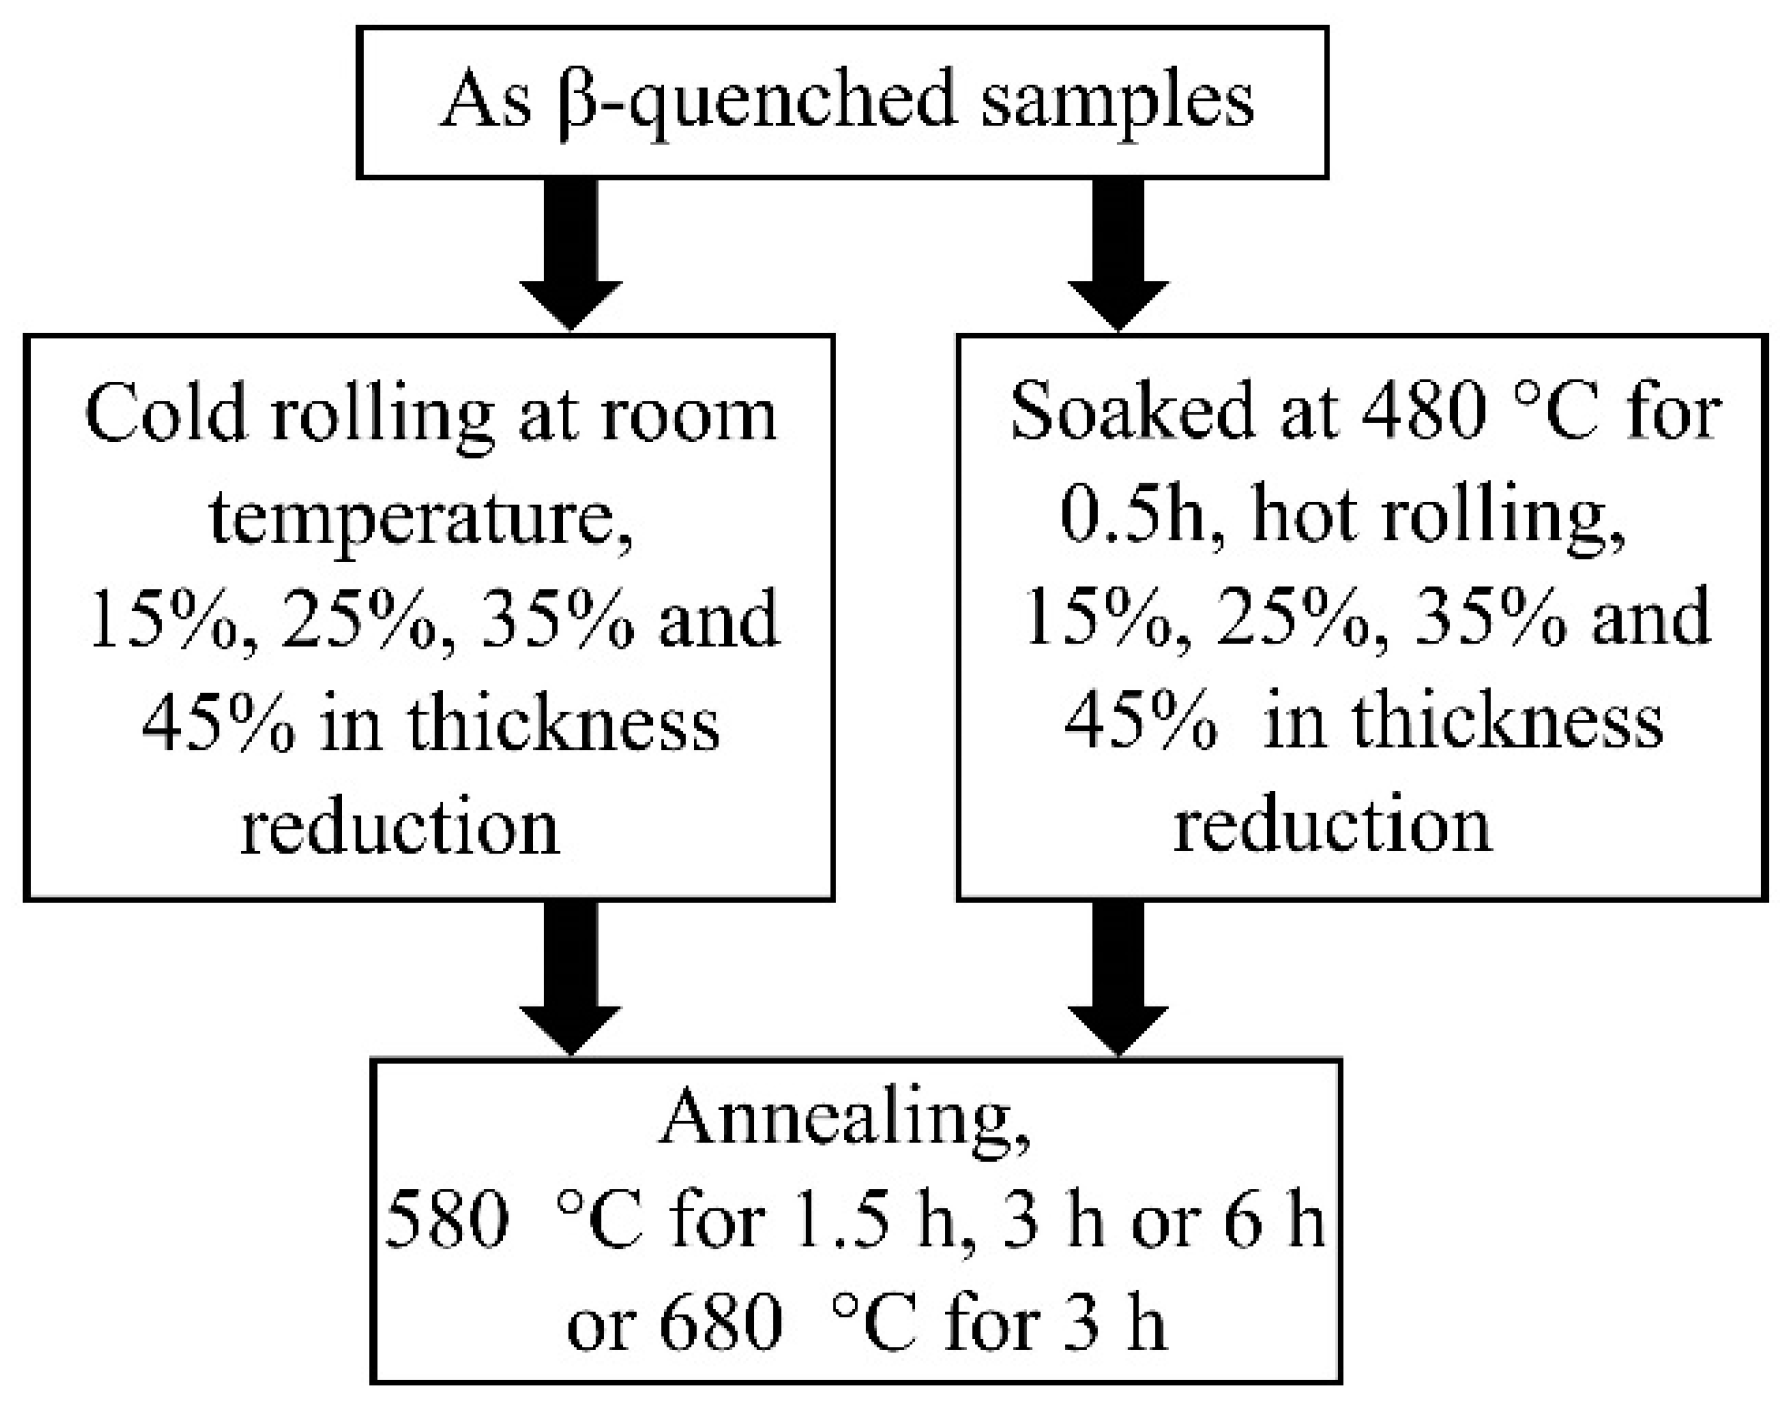
A Zr–Sn–Nb–Fe–Cu–Si–O alloy was prepared by vacuum arc remelting three times to obtain chemical homogeneity, containing 0.65% Sn, 0.25% Fe, 0.38% Nb, 0.05% Cu, 0.03% Si, 0.01% O, and with Zr as the balance (in wt. %). The arc-melted buttons were 90 mm in thickness and 130 mm in diameter. The prepared disk-shape ingots were forged to 10 mm in thickness at 1000 °C and β-quenched. Afterward, the β-quenched sample was cold-rolled or hot-rolled with the reductions in thicknesses of 15%, 25%, 35%, and 45%, respectively. Cold rolling was carried out at room temperature, whereas hot rolling was conducted on the samples which were soaked at 480 °C for 0.5 h. Then, all the samples were annealed at 580 °C for 1.5 h, 3 h, or 6 h, or 680 °C for 3 h, respectively. As the melting point temperature (Tm) of pure Zr is 1855 °C (2128 K), 480 °C (753 K) and 580 °C (853 K) are about 0.35 Tm and 0.4 Tm of Zr, which fall into the recovery temperature and recrystallization temperature ranges of Zr, respectively. As such, the samples with different deformation degrees and annealing conditions can be elaborated with the aim to investigate the homogenization and growth behavior of SPPs in the deformed experimental alloy during annealing. Figure 1 illustrates the sequences of the deformations and heat treatments in detail. Herein, all samples were labeled corresponding to their processing procedures. For example, the HR15 sample was denoted for the sample after being hot-rolled with the reduction in thickness of 15%, and the CR15-580-3 stood for the sample which was cold-rolled with the reduction in thickness of 15% and subsequently annealed at 580 °C for 3 h, and so on.
2.2. Characterizations
The microstructures of the processed alloy samples were characterized by optical microscopy (OM) and scanning electron microscopy (SEM) by an Axio Imager A1m optical microscope (Zeiss, Berlin, Germany) and a FEI Quanta 250 field emission gun scanning electron microscope (FEI, Hillsboro, TX, USA), respectively. The samples used for microstructure characterization were ground and polished, using the standard metallographic procedure. Afterward, the samples were etched using a solution containing 5% HF, 45% HNO3, and 50% pure water (in vol. %). All reagents mentioned in this work are produced Sinopharm Chemical Reagent Co., Ltd. (Beijing, China). All examined planes were in the rolling direction (RD)–transverse direction (TD) planes. At least five SEM images with a magnification of 50,000× were used to analyze the SPPs, and the statistical information of the SPPs was processed by the software of Image-Pro Plus 5.0 (Media Cybernetics, Rockville, MD, USA). As the SPPs are often not in a spherical shape, the sizes of the SPPs reported in this work were calculated in terms of the circle-equivalent diameter. Transmission electron microscopy (TEM) was carried out by a JEOL-2100F transmission electron microscope (JEOL, Tokyo, Japan) equipped with an energy dispersive X-ray spectroscopy (EDS) detector at a 200 V acceleration voltage. The TEM specimens were prepared using twin-jet polishing with a mixed solution of 10% HClO4 and 90% C2H5OH after being mechanically thinned to about 70 μm at a voltage of 20 V and a temperature of −30 °C.
2.3. Corrosion Tests
The samples used for corrosion tests were machined to 20 × 25 × 1 mm in size and ground with SiC paper of up to 4000 grit, and then pickled using a mixed solution composed of 30% H2O, 30% HNO3, 30% H2SO4, and 10% HF (in vol. %) for about 20 s at room temperature. The corrosion tests were carried out with an isothermal static autoclave in 0.01 M LiOH aqueous solution under a saturation pressure and high temperature of 18.6 MPa and 360 °C. The corrosion resistance of the samples was estimated in accordance with their weight gain per unit surface area as a function of the exposure days. The samples before and after being corroded were weighed using an analytical balance (Cubis, MSE224S-0CE-DU, Goettingen, Germany) with an accuracy of 0.01 mg.
3. Results and Discussion
3.1. Microstructure of the β-Quenched Sample
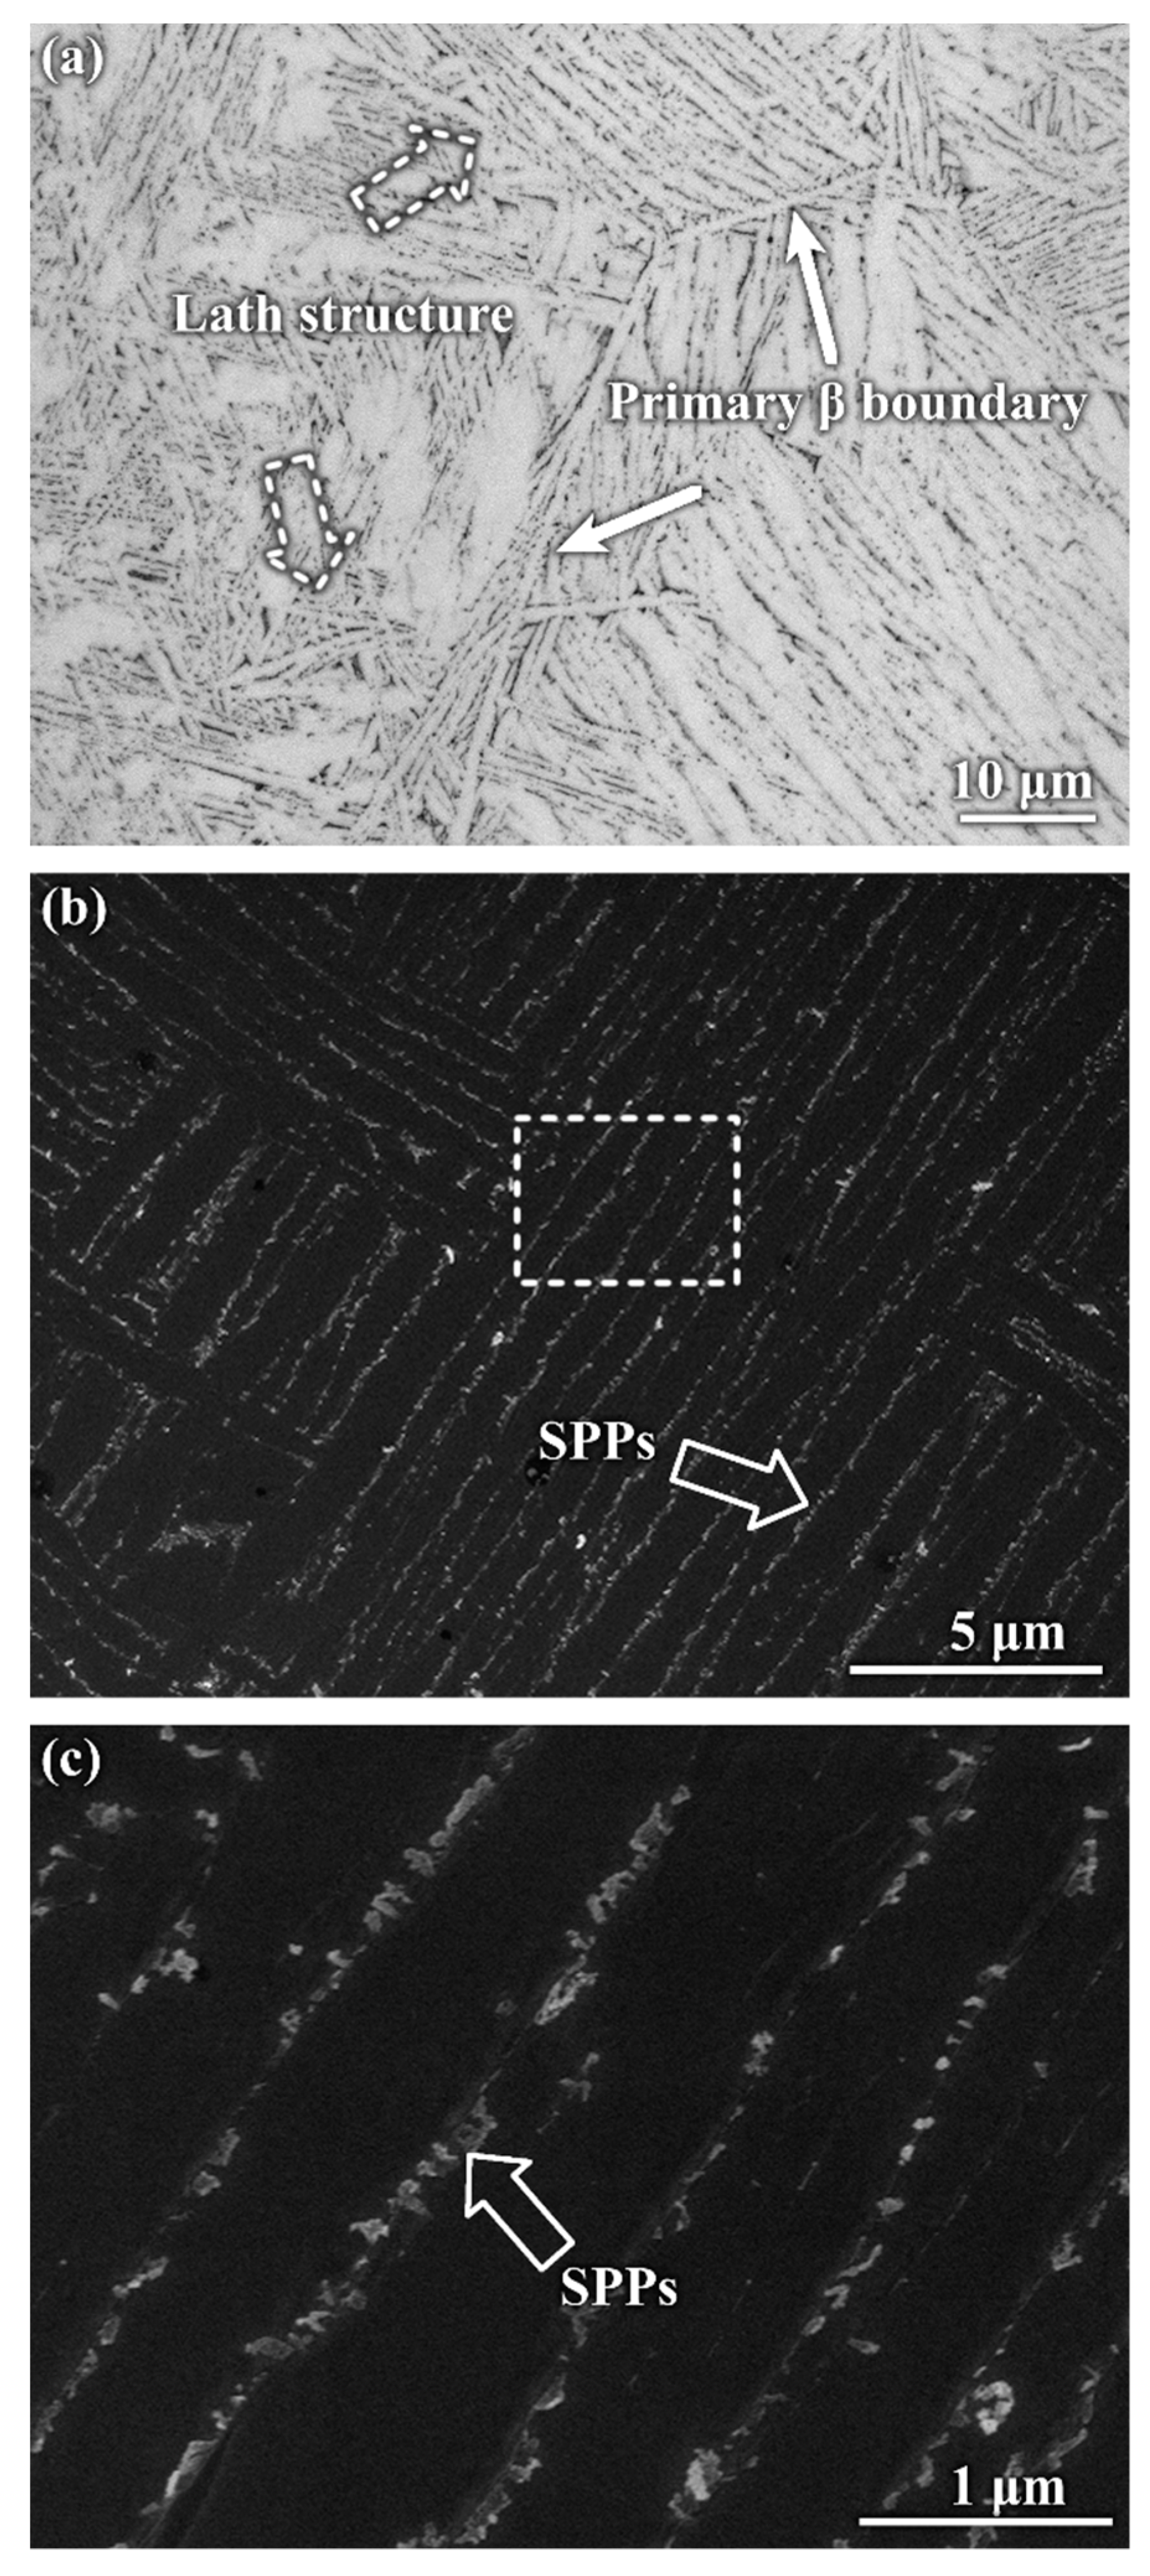
Figure 2 shows the microstructure of the experimental alloy after β-quenching. Lath structures are easily formed in the alloys which transformed from the body-centered cubic (BCC) structural β phase to the hexagonal close-packed (HCP) α phase [4,29,30,31,32]. In this work, the experimental alloy was quenched from 1050 °C (in the β-phase region), undergoing a transformation from the β to α phase. Therefore, a large number of lath structures are present within the primary β grains (Figure 2a). Figure 2b is the SEM image of the β-quenched sample at a relatively higher magnification, specifying that SPPs (as indicated by hollow arrows) are continuously and linearly distributed along the lath boundaries. The SPPs are prone to nucleating at the locations of defects (such as grain boundaries and dislocations) in the Zr alloys [22,25]. Since β-Zr has a considerably larger solid solubility for many alloying elements than α-Zr, the alloying elements dissolve into the Zr matrix when the alloy is aged at a β-phase region [33]. After quenching from the β-phase region, a transformation of β-Zr → α-Zr takes place and the alloying elements would be oversaturated in the α-Zr matrix. However, Herb et al. [34] pointed out that the SPPs would still precipitate in the Zr-1.5Sn-0.22Fe-0.11Cr-0.13O-0.01Si alloy after β-quenching, which is similar to the result observed in this work. This phenomenon may be related to the practical insolubility of Si in α-Zr, leading to an earlier precipitation of SPPs in the Zr alloys. In order to investigate the morphologies of SPPs in the β-quenched sample, a magnified image of the dashed rectangle in Figure 2b is presented. Chai et al. [35] indicated that SPPs in fully recrystallized Zr alloys often have a spherical shape. However, in this work, the SPPs have irregular shapes in the β-quenched sample. As well as in the other alloy systems [36,37,38,39], the irregular-shaped nanoclusters are formed earlier via the precipitation of alloying elements’ solid solution in alloys before forming spherical precipitates. Spheroidization of SPPs often takes place after heat treatment. Therefore, it is reasonable to observe such a morphology of SPPs in the β-quenched sample.
3.2. Microstructures of the Rolled Samples
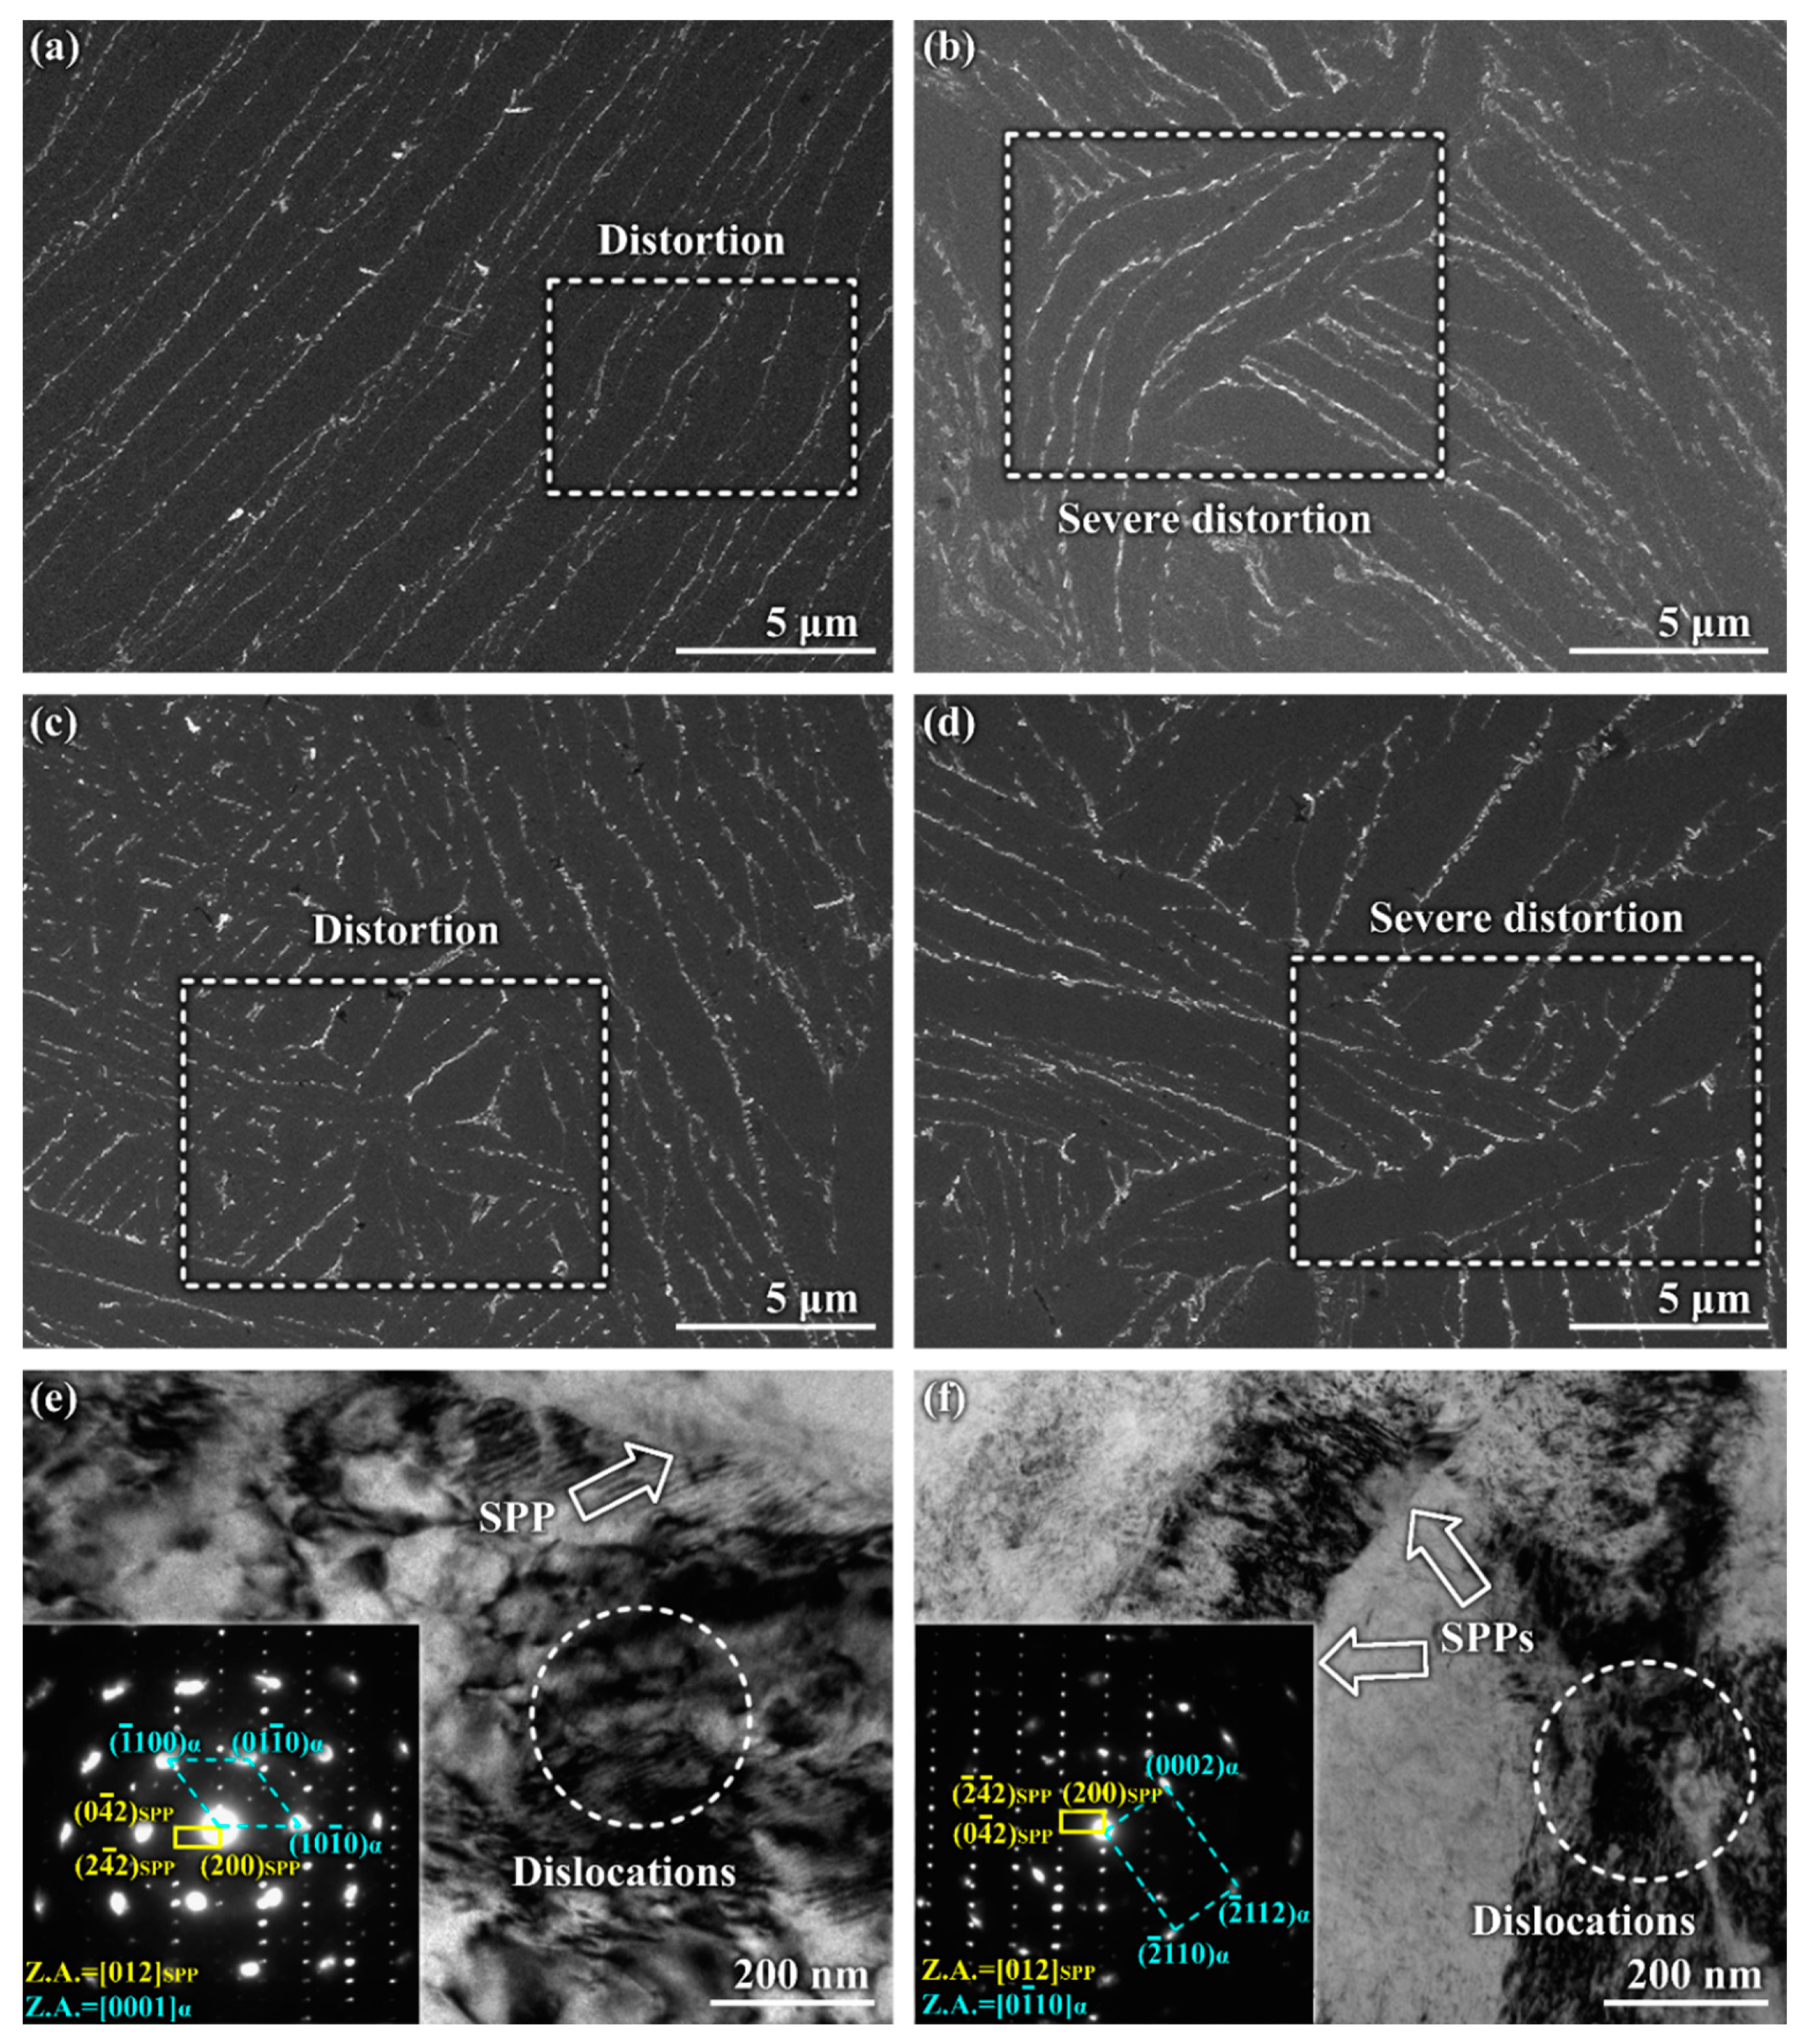
Figure 3 shows the SEM and TEM microstructures of the rolled samples. Although the SPPs are still linearly distributed in the CR15 sample, mildly distorted alignments of SPPs are observed in some places, as indicated by a dashed rectangle in Figure 3a, from which it is extrapolated that cold rolling gives rise to the deformation of the Zr matrix as well as the variation in the distribution of SPPs. With increasing the deformation degree of cold rolling, this phenomenon becomes more evident. The distribution of SPPs is severely distorted in the CR45 sample, as indicated by a dashed rectangle in Figure 3b. Similar scenarios are observed for the HR15 and HR45 samples (Figure 3c,d). Therefore, severe deformation could impair the linear distribution of SPPs in the Zr matrix. However, the distribution of SPPs is still not uniform no matter what rolling method is adopted. Figure 3e,f are TEM images for the CR45 and HR45 samples. The insets in Figure 3e,f are the corresponding selected area electron diffraction (SAED) patterns for the SPPs (indicated by the white arrows) and the surrounding Zr matrix. The SPPs in both samples are located at the lath boundaries and identified as C15-type face-centered cubic (FCC)-structured particles. Furthermore, a large number of dislocations are presented in the CR45 sample, which is ascribed to the severe deformation induced by cold rolling. By contrast, the dislocation density is much smaller in the HR45 sample than that in the CR45 sample. It is worth noting that the hot rolling was carried out at 480 °C and the temperature of the HR45 sample would increase during deformation. Jiang et al. [40] suggested that Zr has a very low thermal conductivity and the temperature of Zr would increase during deformation. As the aging temperature is 480 °C for the hot-rolled samples, it is therefore deduced that the temperature of the hot-rolled sample should be higher than 480 °C. Chen et al. [22] proposed that the temperature rise is over 100 °C when the Zr alloy sheet is rolled with a 40% reduction in thickness. In this work, the reduction in thickness ranges from 15–45%. As mentioned above, 480 °C is the highest recovery temperature for Zr. Therefore, dynamic recovery/recrystallization would take place in the hot-rolled samples during hot rolling. During recovery or recrystallization, it has been proposed that the rearrangement of dislocations associated with a decrease in dislocation density occurs [41]. Therefore, as observed in Figure 3f, the number of dislocations in the HR45 sample is much less than that in the CR45 sample. Therefore, one can speculate that the hot-rolled and cold-rolled samples have distinctive dislocation densities, even if they undergo the same reductions in thicknesses.
3.3. Distribution and Growth Behavior of Second-Phase Particles after Heat Treatment
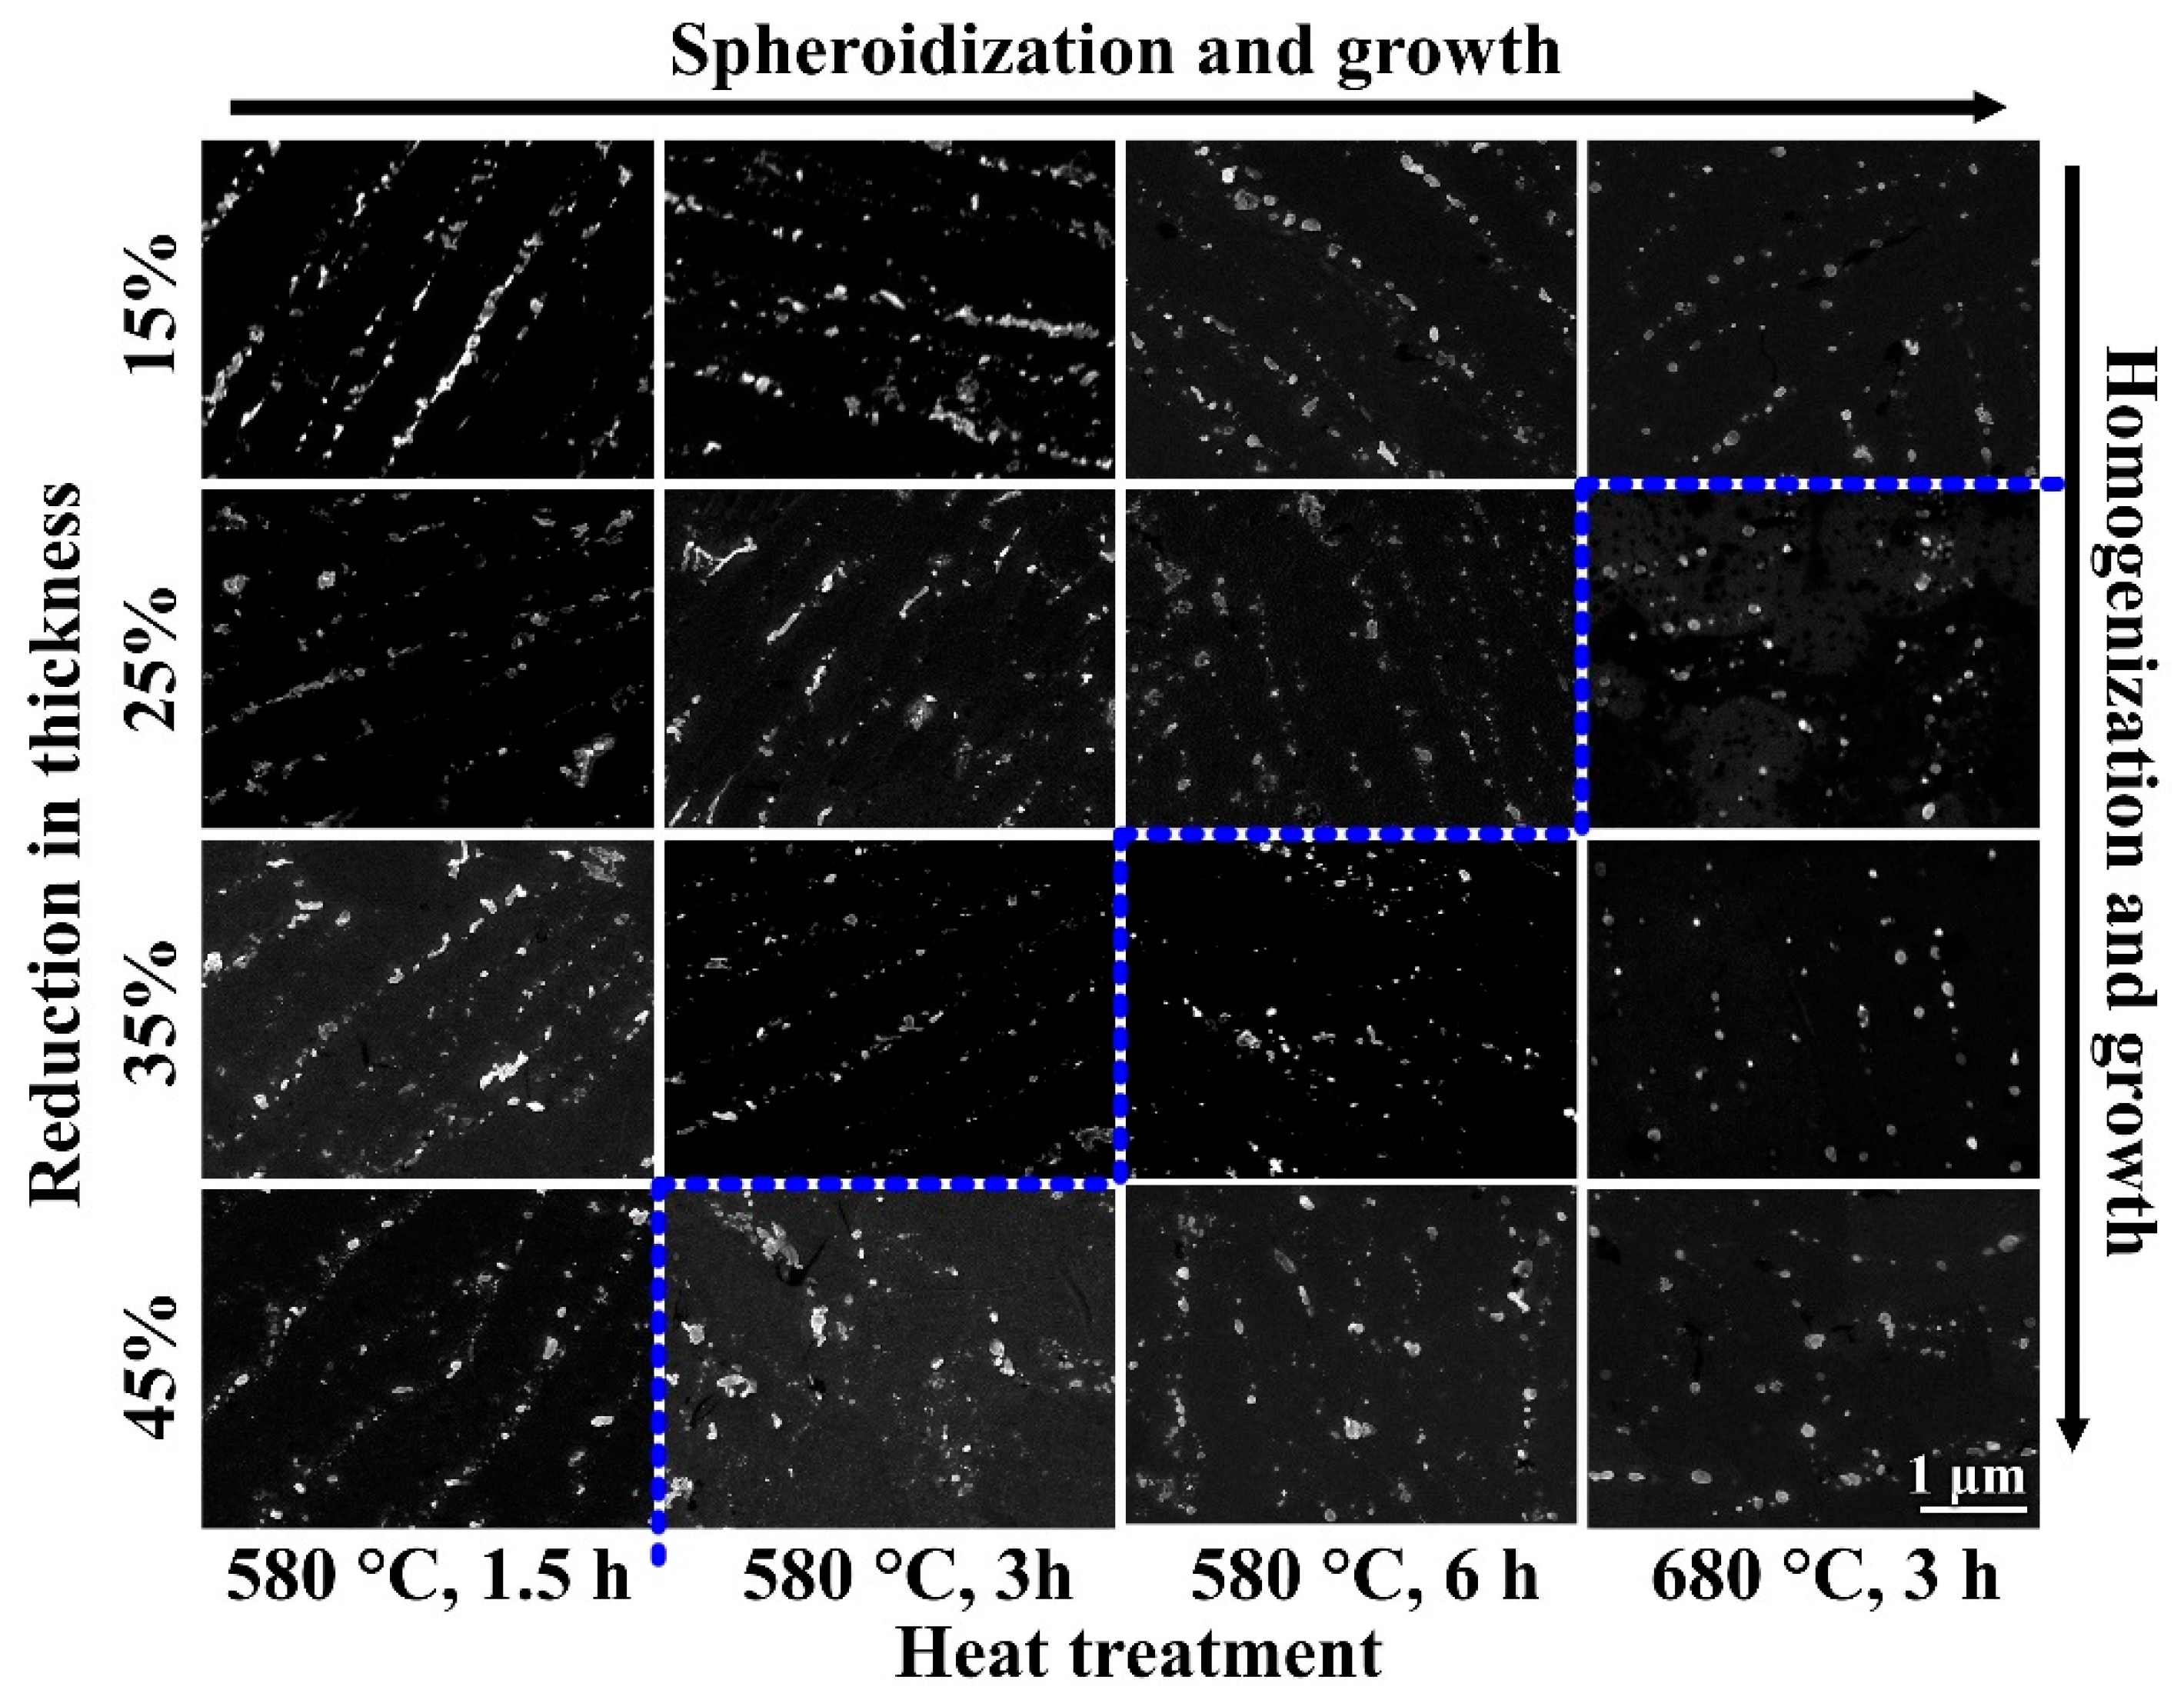
Figure 4 shows the distributions of SPPs in the cold-rolled and annealed samples. Generally, as the deformation degree or annealing time (or temperature) increases from the upper left to the lower right part, the SPPs are remarkably coarsened, spherized, and randomly distributed. The linear and random distributions of SPPs are essentially separated by a blue dashed line. It is noted that the SPPs distribute linearly when all the cold-rolled samples are annealed at 580 °C for 1.5 h. Increasing the annealing time to 3 h at 580 °C, a weakly homogeneous distribution of SPPs is firstly presented in the CR45-580-3 sample. With increasing the annealing time or temperature, the distribution of SPPs becomes more and more random (Figure 4). Correspondingly, a linear distribution of SPPs is observed in the CR15 sample even when heat-treated at 680 °C for 3 h. In comparison, randomly distributed SPPs are presented in the CR25-680-3 sample. Therefore, it seems that increasing the deformation degree or the annealing time (or temperature) facilitates the homogenization of SPPs. Meanwhile, as aforementioned, most SPPs have irregular shapes after being β-quenched or rolled. With the increase in annealing temperature or time, both the spheroidization and growth of SPPs take place. Kahlweit et al. [42] elucidated that the spheroidization of SPPs is attributed to the decrease in the surface energy of the matrix/precipitate interface. As seen in Figure 4, the spheroidization increases the space between SPPs and facilitates their homogenization. Hence, such results suggest that the homogenization of SPPs is closely related to the deformation degree and annealing time (or temperature).
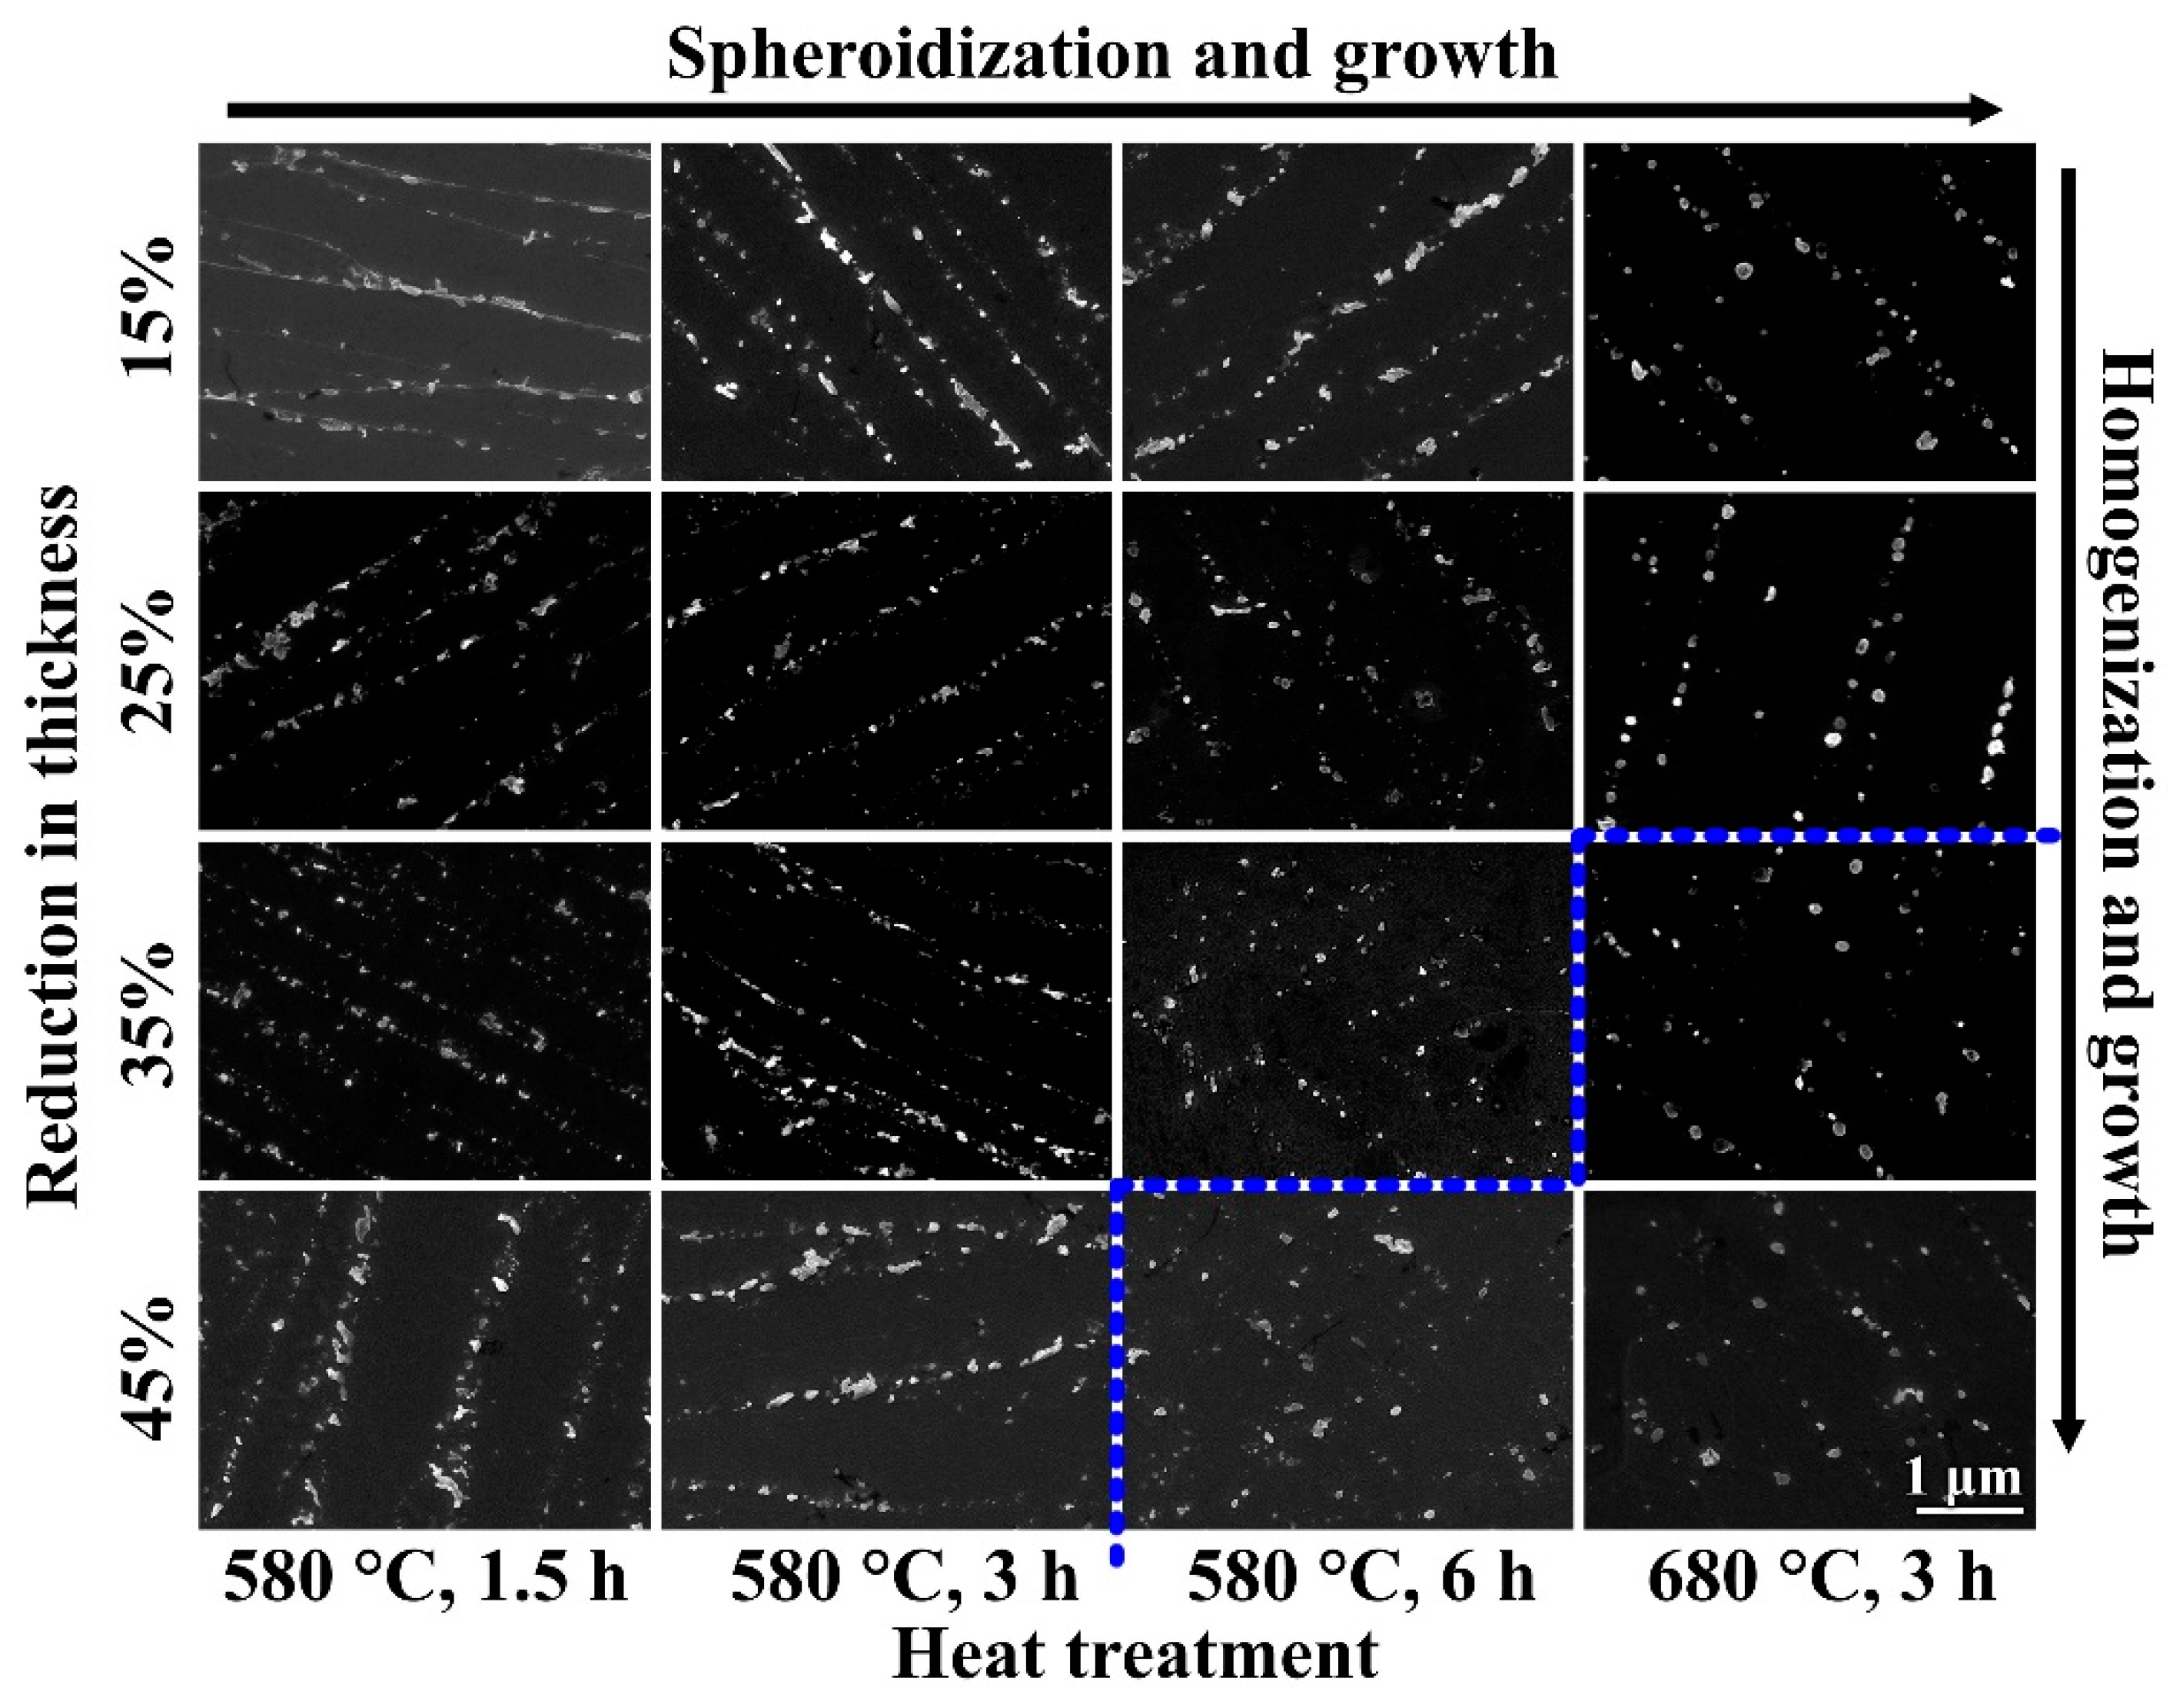
As shown in Figure 5, a similar trend is also evident in the hot-rolled–annealed samples, suggesting a general evolution profile for the homogenization of SPPs during heat treatment. Compared with the cold-rolled–annealed samples, the emergence of the homogeneous distributions of SPPs in the hot-rolled–annealed samples is postponed (Figure 4 and Figure 5). For example, although the HR25-680-3 and the CR25-680-3 samples undergo an identical deformation degree and annealing conditions, the HR25-680-3 sample reveals a linear distribution of SPPs, but the homogeneous distribution of SPPs is found in the CR25-680-3 sample. Correspondingly, the HR45-580-3 and CR45-580-3 samples display a similar situation. Considering that the heat treatment provides the driving force for the homogenization of SPPs, a higher driving force is needed for the hot-rolled samples than that for the cold-rolled counterparts.
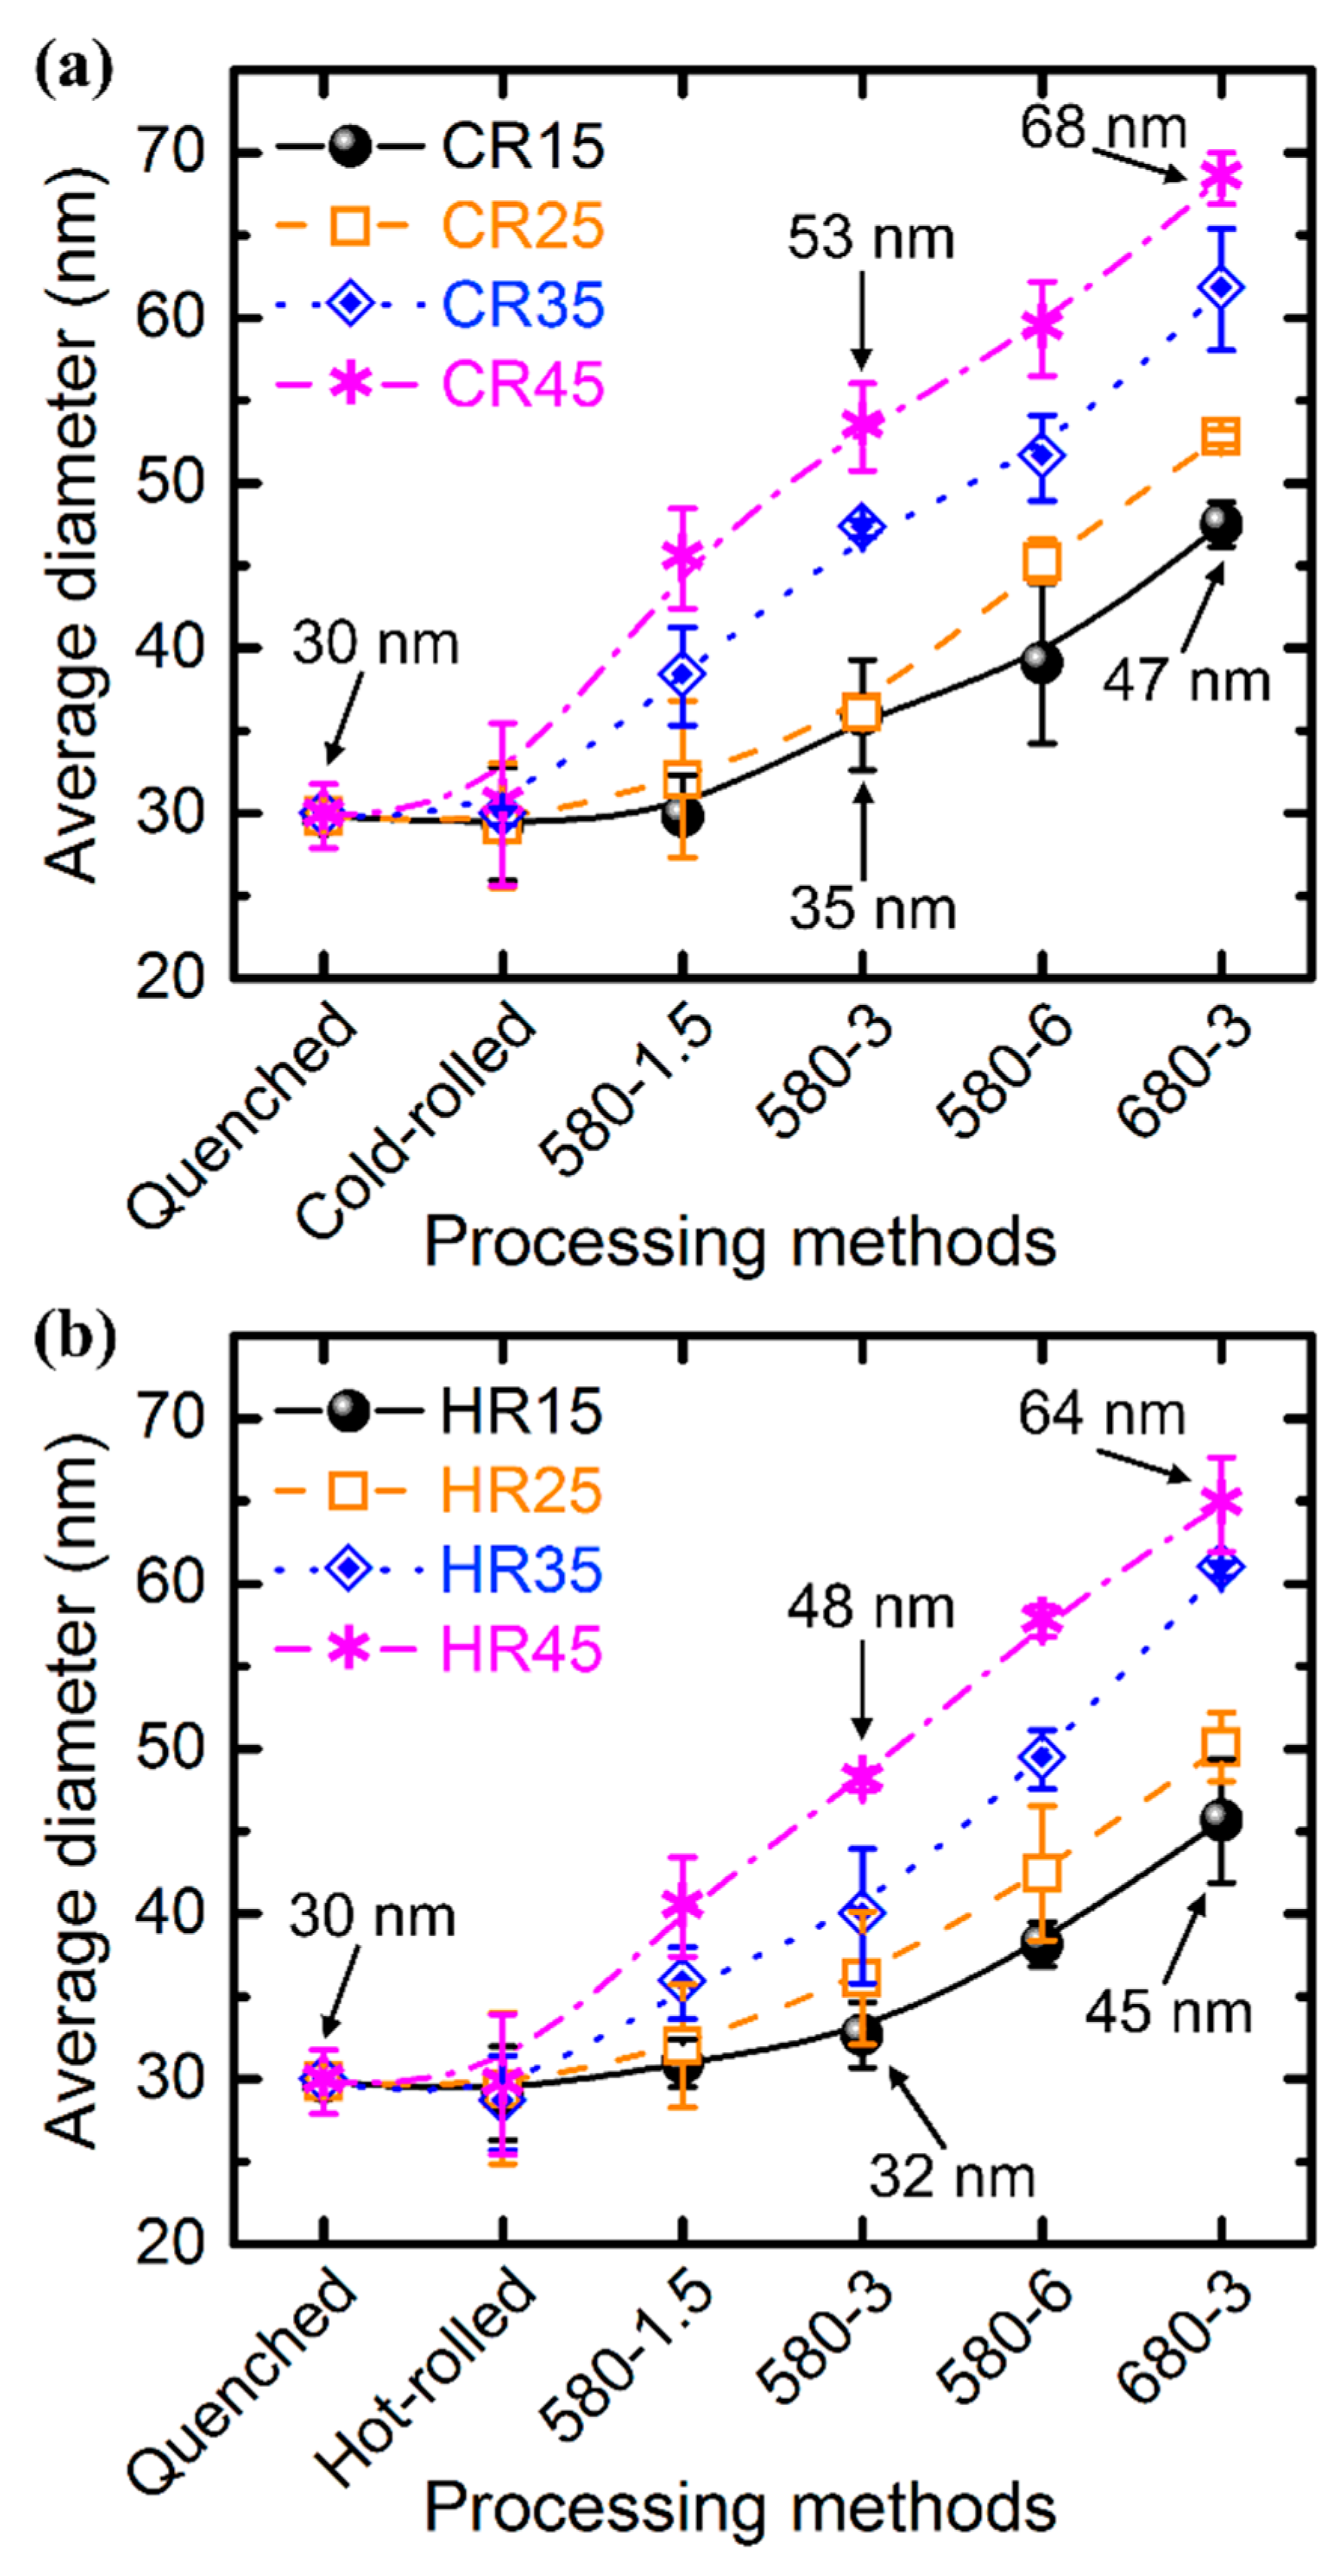
The variations of the average diameters of SPPs in the samples after β-quenching, rolling, and annealing are plotted in Figure 6. Since the quenched sample is used as the starting material, the initial sizes of SPPs in all the samples are the same. The average diameter of SPPs in the quenched sample is about 30 nm. The cold-rolled and hot-rolled samples have nearly the same average sizes of SPPs as the quenched sample, suggesting that the SPPs can hardly grow during the deformation process adopted in this work. After heat treatment, the SPPs grow in all the samples. The cold-rolled and hot-rolled samples represent an identical trend. Three main features could be extracted from Figure 6. Firstly, take an example from the cold-rolled samples. The average diameters of SPPs are 68 nm and 53 nm in CR45-680-3 and CR45-580-3, respectively (Figure 6a), indicating that the growth of SPPs is sensitive to the temperature. Similar results have been reported by Luan et al. and Yang et al. [28,43]. Zhang et al. [44] concluded that the high temperature promotes the diffusion of elements in the alloys. Therefore, it is concluded that the higher annealing temperature enhances the growth rate of SPPs. Secondly, when the rolled samples have the same annealing conditions, the SPPs in the samples with a larger deformation degree grow faster than those in the counterparts with a smaller deformation degree. This indicates that the growth of SPPs depends not only on the annealing temperature, but also on the deformation degree. Finally, the average diameter of SPPs in CR45-680-3 is 68 nm, which is slightly larger than that in HR45-680-3 (64 nm). The same results are also found in other samples, specifying that SPPs in the cold-rolled samples grow a bit faster than those in the hot-rolled samples. These results are in good agreement with the morphologies and distributions of SPPs shown in Figure 4 and Figure 5. It confirms again that the growth of SPPs is related to the deformation degree and annealing time (or temperature).
3.4. Mechanism for the Homogenization and Growth Behavior of Second-Phase Particles
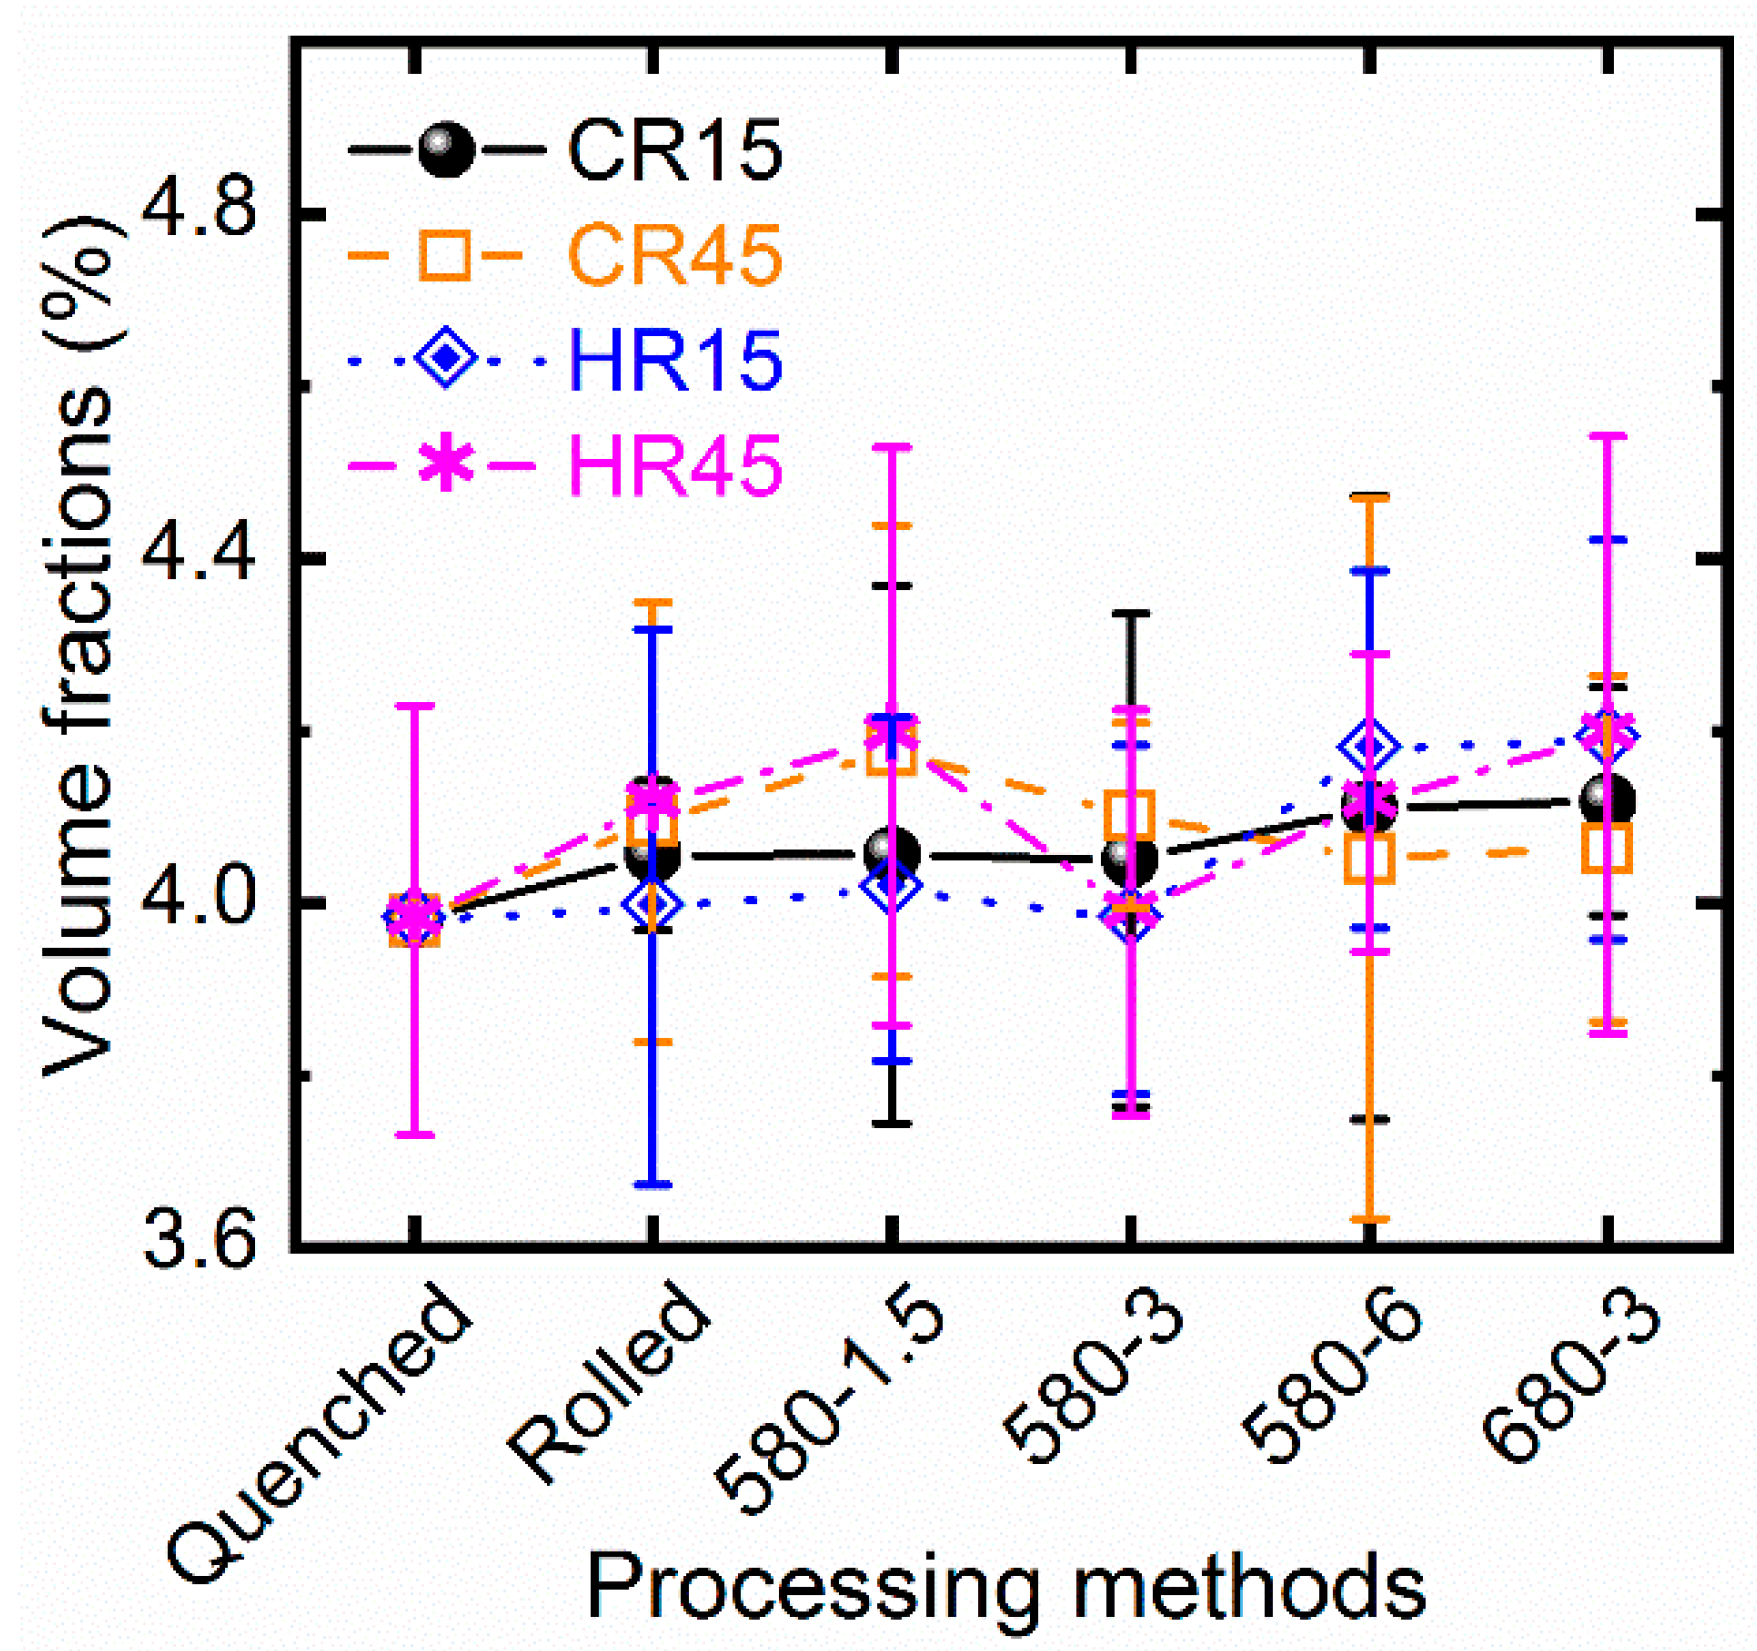
For a given system, Marqusee and Ross [45] mentioned that the growth of SPPs is closely associated with their volume fractions; the growth rate of SPPs would be greater in the sample with the higher volume fraction of SPPs. Therefore, the volume fractions of SPPs in the CR15, CR45, HR15, and HR45 samples after β-quenching, rolling, and annealing were investigated and are shown in Figure 7. It could be found that the volume fraction of SPPs in the β-quenched sample is about 4.0%. After cold rolling or hot rolling, the volume fractions of SPPs range from 4.0–4.1% in the rolled samples. Afterward, no matter what annealing conditions are adopted, the volume fractions of SPPs vary in a small range of 3.9–4.2% in the annealed samples, which is not distinct from the scenario in the β-quenched and rolled samples. Considering the inevitable statistical error, this result demonstrates that the volume fractions of SPPs are almost constant in this work. Hence, the influence of the volume fractions of SPPs on the homogenization and growth of SPPs is neglected in the following discussion.
Although the morphologies of SPPs are not significantly different after cold rolling or hot rolling (Figure 3), distinct evolution profiles for the homogenization of SPPs are observed in the annealed samples (Figure 4 and Figure 5). In such a two-phase system, the homogenization and growth of the precipitates are governed by the Ostwald ripening mechanism [28], which describes that the growth of the precipitates is at the expense of the smaller ones and the substance of precipitates is transported through the matrix. Therefore, the growth rates of SPPs were determined by the volume fraction of SPPs and the diffusion rates of the substance of SPPs in the Zr matrix. Since the volume fractions of SPPs are almost constant in various samples (Figure 7), only the diffusion rate of the substance of SPPs would be considered in this work. The classical Lifshitz–Slyozov–Wagner (LSW) model is suggested for the growth kinetics of SPPs during annealing [46]. It can be expressed as:
where is the average diameter of SPPs in the matrix before annealing, is the average diameter of SPPs after annealing, t is the annealing time, and k is the coarsening rate constant, which is a function of the annealing temperature and the diffusion coefficient of SPPs in the matrix. Here, k is:
where C is the equilibrium concentration of the alloying elements in the matrix, V is the molar volume of the SPPs, Γ is the surface energy of the matrix/precipitate interface, R is the ideal gas constant, T is the absolute temperature, and D is the normalized diffusion coefficient of SPPs in the matrix. Based on the results obtained in this work, the volume fractions of SPPs are almost constant in various samples, and hence the equilibrium concentration of the alloying elements in the matrix and the molar volume of SPPs are invariable. For a specific two-phase system, Γ is a constant. Therefore, the value of k depends on D and T. In an alloy system, Carman et al. [47] pointed out that the diffusion coefficient D is temperature-dependent and Sun et al. [48] denoted D as:
where D0 is the diffusion factor and Q is the diffusion activation energy for the mass transfer of SPPs. However, it is well known that the rate of lattice diffusion is much lower than that of short-circuit diffusion [49,50]. Both grain (or subgrain) boundaries and dislocations can be regarded as the shortcuts for the solute in the matrix. Therefore, the calculation of an effective diffusion coefficient of the substance of precipitates in the matrix should take both the lattice diffusion and short-circuit diffusion into account. For this reason, Panicaud et al. [51] gave a universal method to evaluate the effective diffusion coefficient:
where De stands for the effective diffusion coefficient, Ds is the short-circuit diffusion coefficient, Dl indicates the lattice diffusion coefficient, and γ is the corresponding volume fraction of the shortcuts in the matrix. Both Ds and Dl are also temperature-dependent. Therefore, Equation (4) could be rewritten as:
where D0,s and D0,l denote the diffusion factors of short-circuit diffusion and lattice diffusion, respectively; and Qs and Ql stand for the diffusion activation energy of the short-circuit diffusion and the lattice diffusion for the mass transfer of SPPs, respectively. These four parameters are constant for a given two-phase system. Hence, the effective diffusion coefficient De seems to be closely related to the volume fraction of the shortcuts γ in the matrix. It is well known that the short-circuit diffusion coefficient Ds is much higher than the lattice diffusion coefficient Dl in a specific matrix. As such, it is reasonable to speculate that a higher γ results in a higher effective diffusion coefficient De.
In this work, all the samples were annealed after rolling. Severe deformation refines the grain of the matrix and induces a large number of defects [52,53,54]. Such a conclusion implies that the rolling process substantially increases the diffusion paths for SPPs in the Zr matrix in this work. Qualitatively, the value of γ for the sample with a higher deformation degree is much higher than that for the sample with a lower deformation degree. As a result, according to Equation (5), the De of the sample with a higher deformation degree should be prominently greater than that of the sample with a lower deformation degree at a fixed temperature (i.e., 580 °C), leading to the distinct coarsening rate constants between the different samples (Equation (1)). Therefore, as seen in Figure 6, for the identical rolling methods, the SPPs in the sample with a higher deformation degree grow faster than the SPPs in the sample with a lower deformation degree. Similarly, the diffusion coefficient also increases with increasing the annealing temperature in terms of Equation (5). The average diameters of SPPs in the samples annealed at 680 °C for 3 h are greater than those annealed at 580 °C for 3 h. Therefore, the growth behavior of SPPs is closely associated with the volume fraction of the shortcuts (such as grain boundaries and dislocations) and the annealing temperature, from which it could be considered that the shortcuts and heat treatment provide the diffusion paths and driving force for the mass transfer of SPPs, respectively.
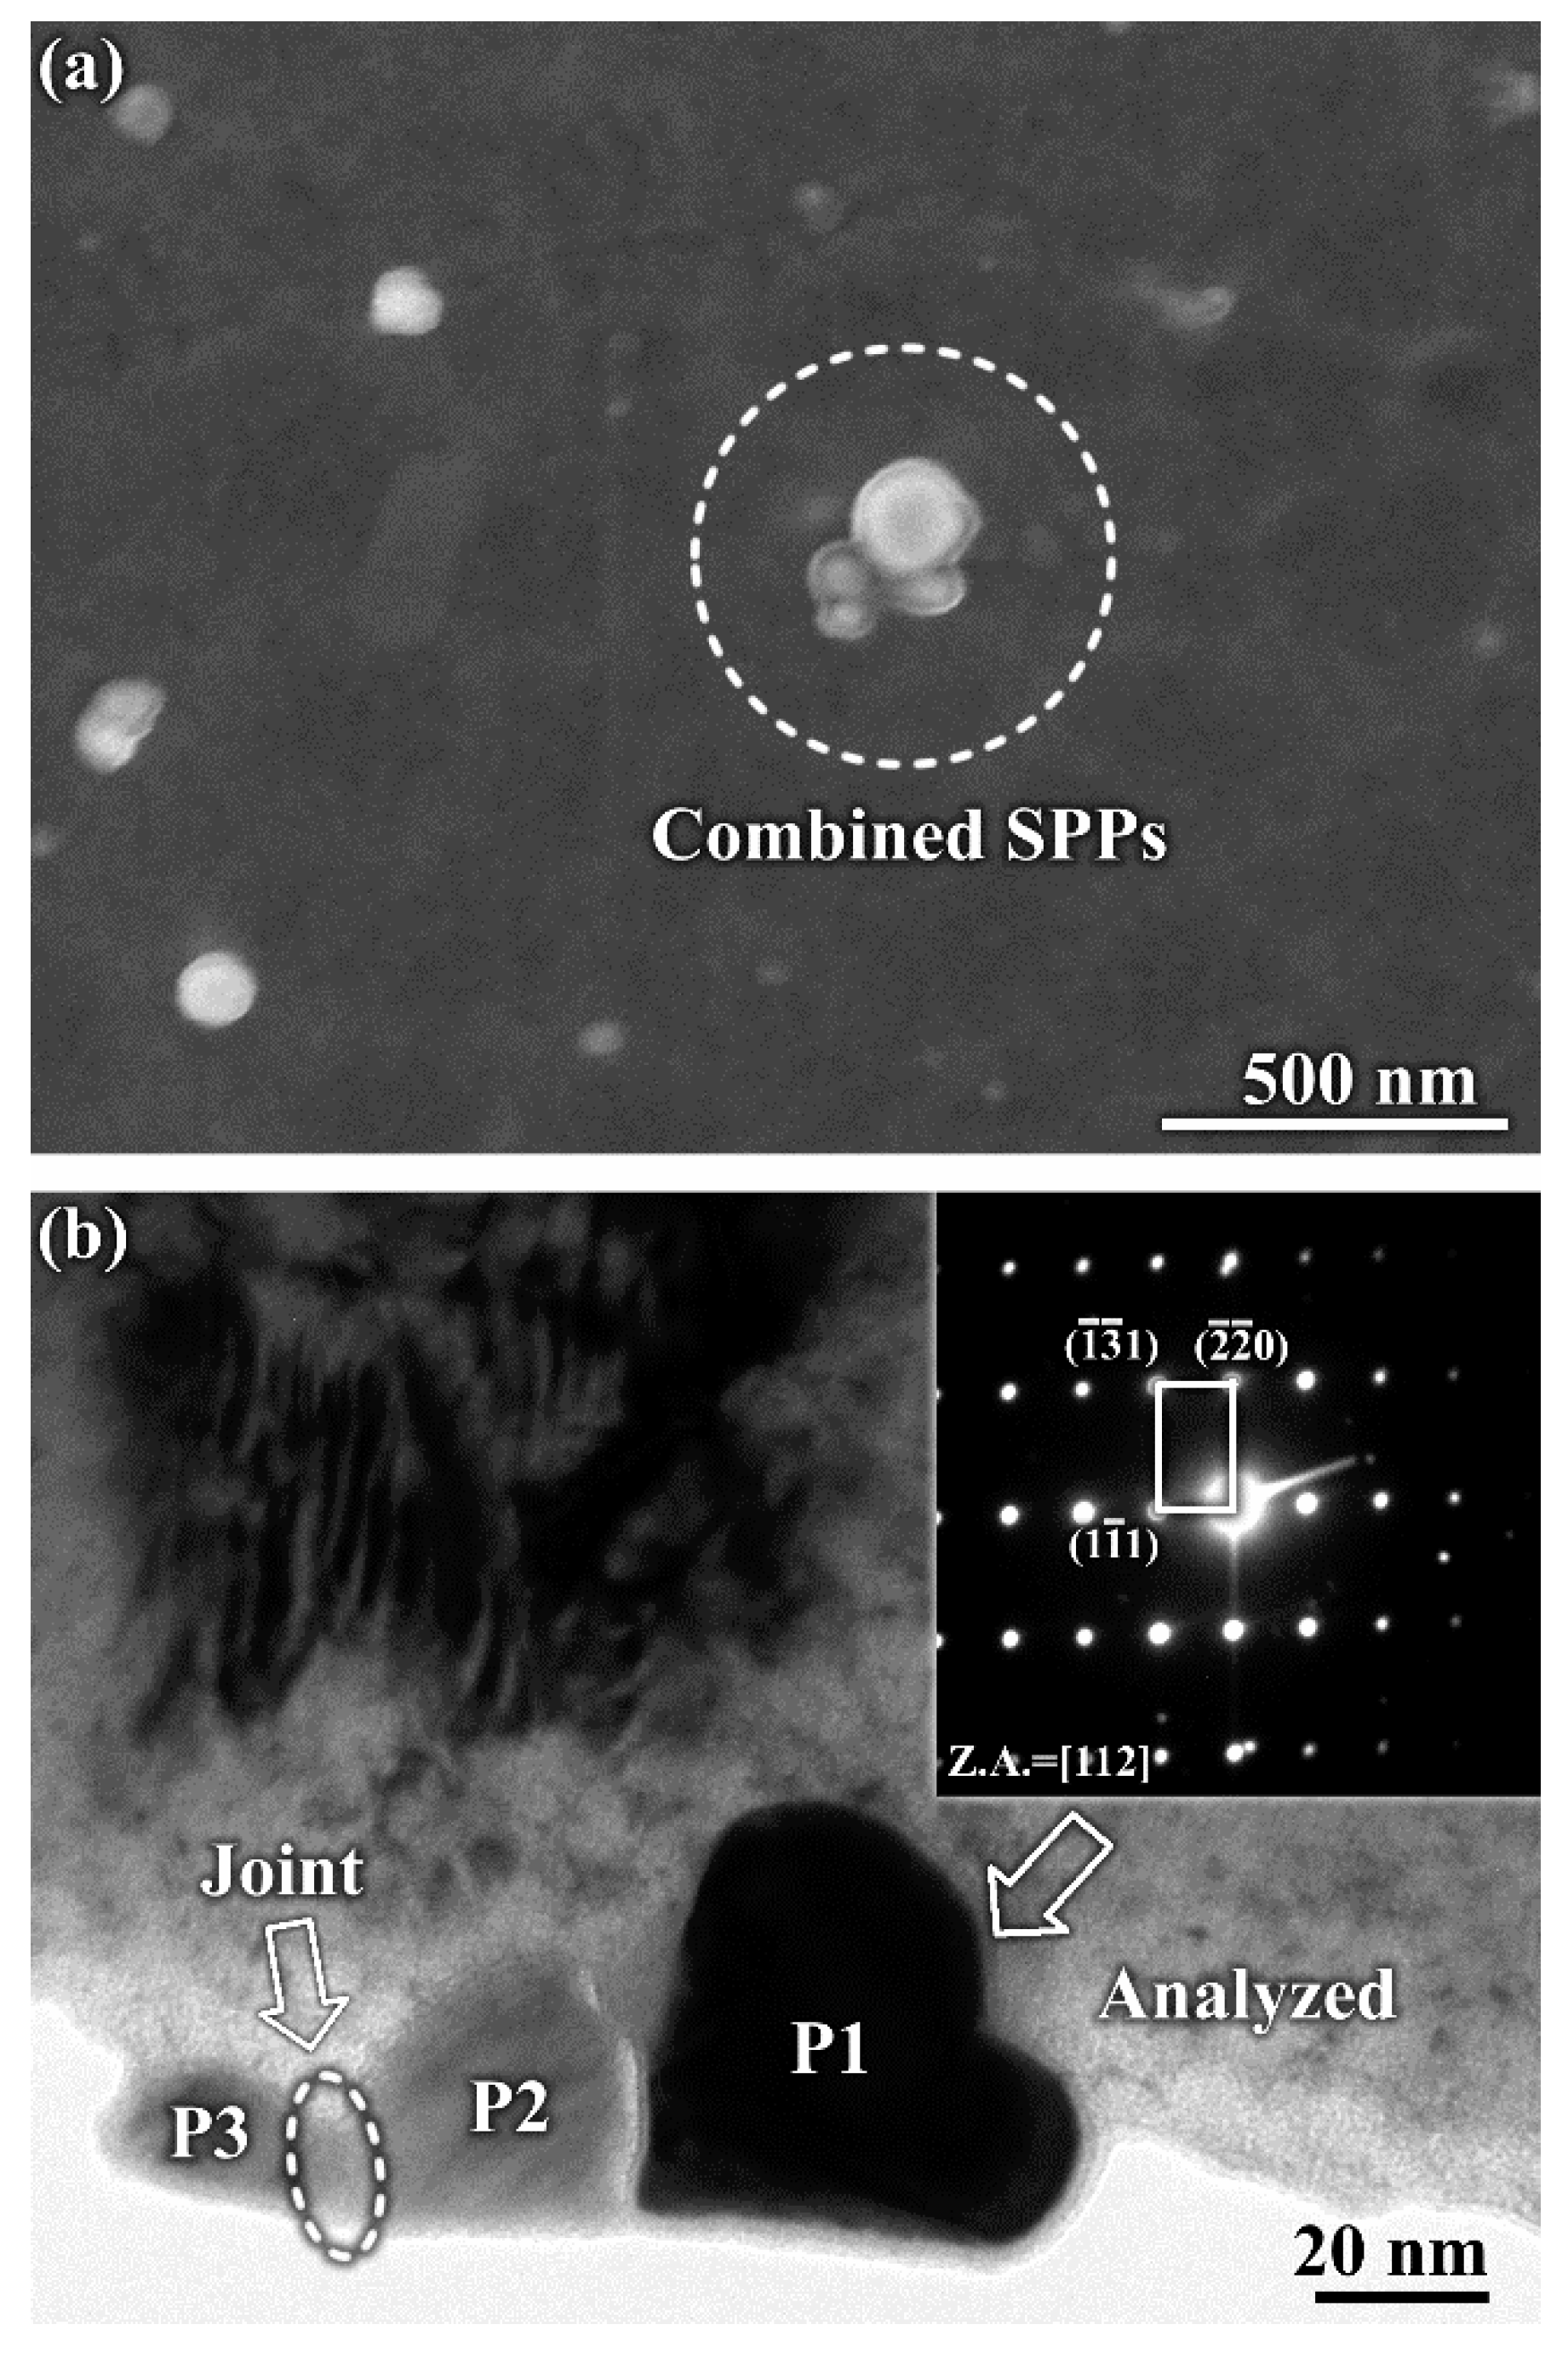
Furthermore, such characteristics also have an important effect on the homogenization of SPPs in the Zr matrix. As shown in Figure 4 and Figure 5, spheroidization of SPPs takes place in all rolled samples during heat treatment, which is attributed to the Ostwald ripening mechanism and the decrease in the surface energy of the matrix/precipitate interface. The LSW model has suggested that the growth of SPPs is diffusion-controlled and the adjacent SPPs are prone to aggregate and grow to form new bigger ones. Therefore, as shown in the SPPs observed in the CR15 and HR15 samples (Figure 4 and Figure 5), the continuously distributed SPPs become discrete with increasing the annealing time or temperature. Taking the CR15 sample as an example, it undergoes 15% reduction in thickness by rolling, and hence only a small number of defects are induced in the CR15 sample. As such, lath boundaries are dominant for the mass transfer of SPPs. Therefore, although the SPPs are discretely distributed and in a spherical shape in the CR15-680-3 sample, a weakly linear distribution of SPPs is still represented. A similar scenario is observed in the HR15 sample. By contrast, it is known that a considerable number of defects are induced in the CR45 or HR45 samples due to a higher deformation degree, providing various diffusion paths for the migration of the substance of SPPs. On the other hand, the deformation in a higher degree significantly alters the distribution of SPPs both in the hot-rolled and cold-rolled samples (Figure 3). Therefore, it is inferred that some adjacent SPPs may aggregate and form new ones of bigger size due to possessing the same chemical composition and structure. Before this new SPP becomes a spherical one, a circular arc polygonized shape is anticipated. As seen from the Figure 8a, four SPPs combining into a large flower-like shaped one is observed in the CR45-580-3 sample, which coincides with the results as suggested above. Figure 8b shows a heart-like shaped SPP (P1) with an FCC structure. It is speculated that this SPP (P1) was formed by the combination of several other ones. By EDS investigation, the composition of the SPP P1 is 30 at. % Zr, 23 at. %, 5 at. % Cu, 4 at. % Si, and 38 at. % Fe, confirming that P1 is (Zr,Nb,Si)2Fe. Meanwhile, the SPPs P2 and P3 start to be connected; their joint is indicated by a dashed ellipse. This evidence elucidates that the deformation with a higher degree not only facilitates the growth of SPPs, but also promotes the homogenization of SPPs in the Zr matrix. Therefore, combining the results observed in this work (Figure 4 and Figure 5), under the same annealing conditions, the samples with a higher deformation degree could facilitate the formation of homogenously distributed SPPs.
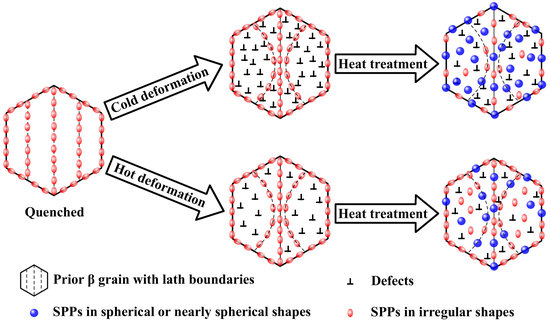
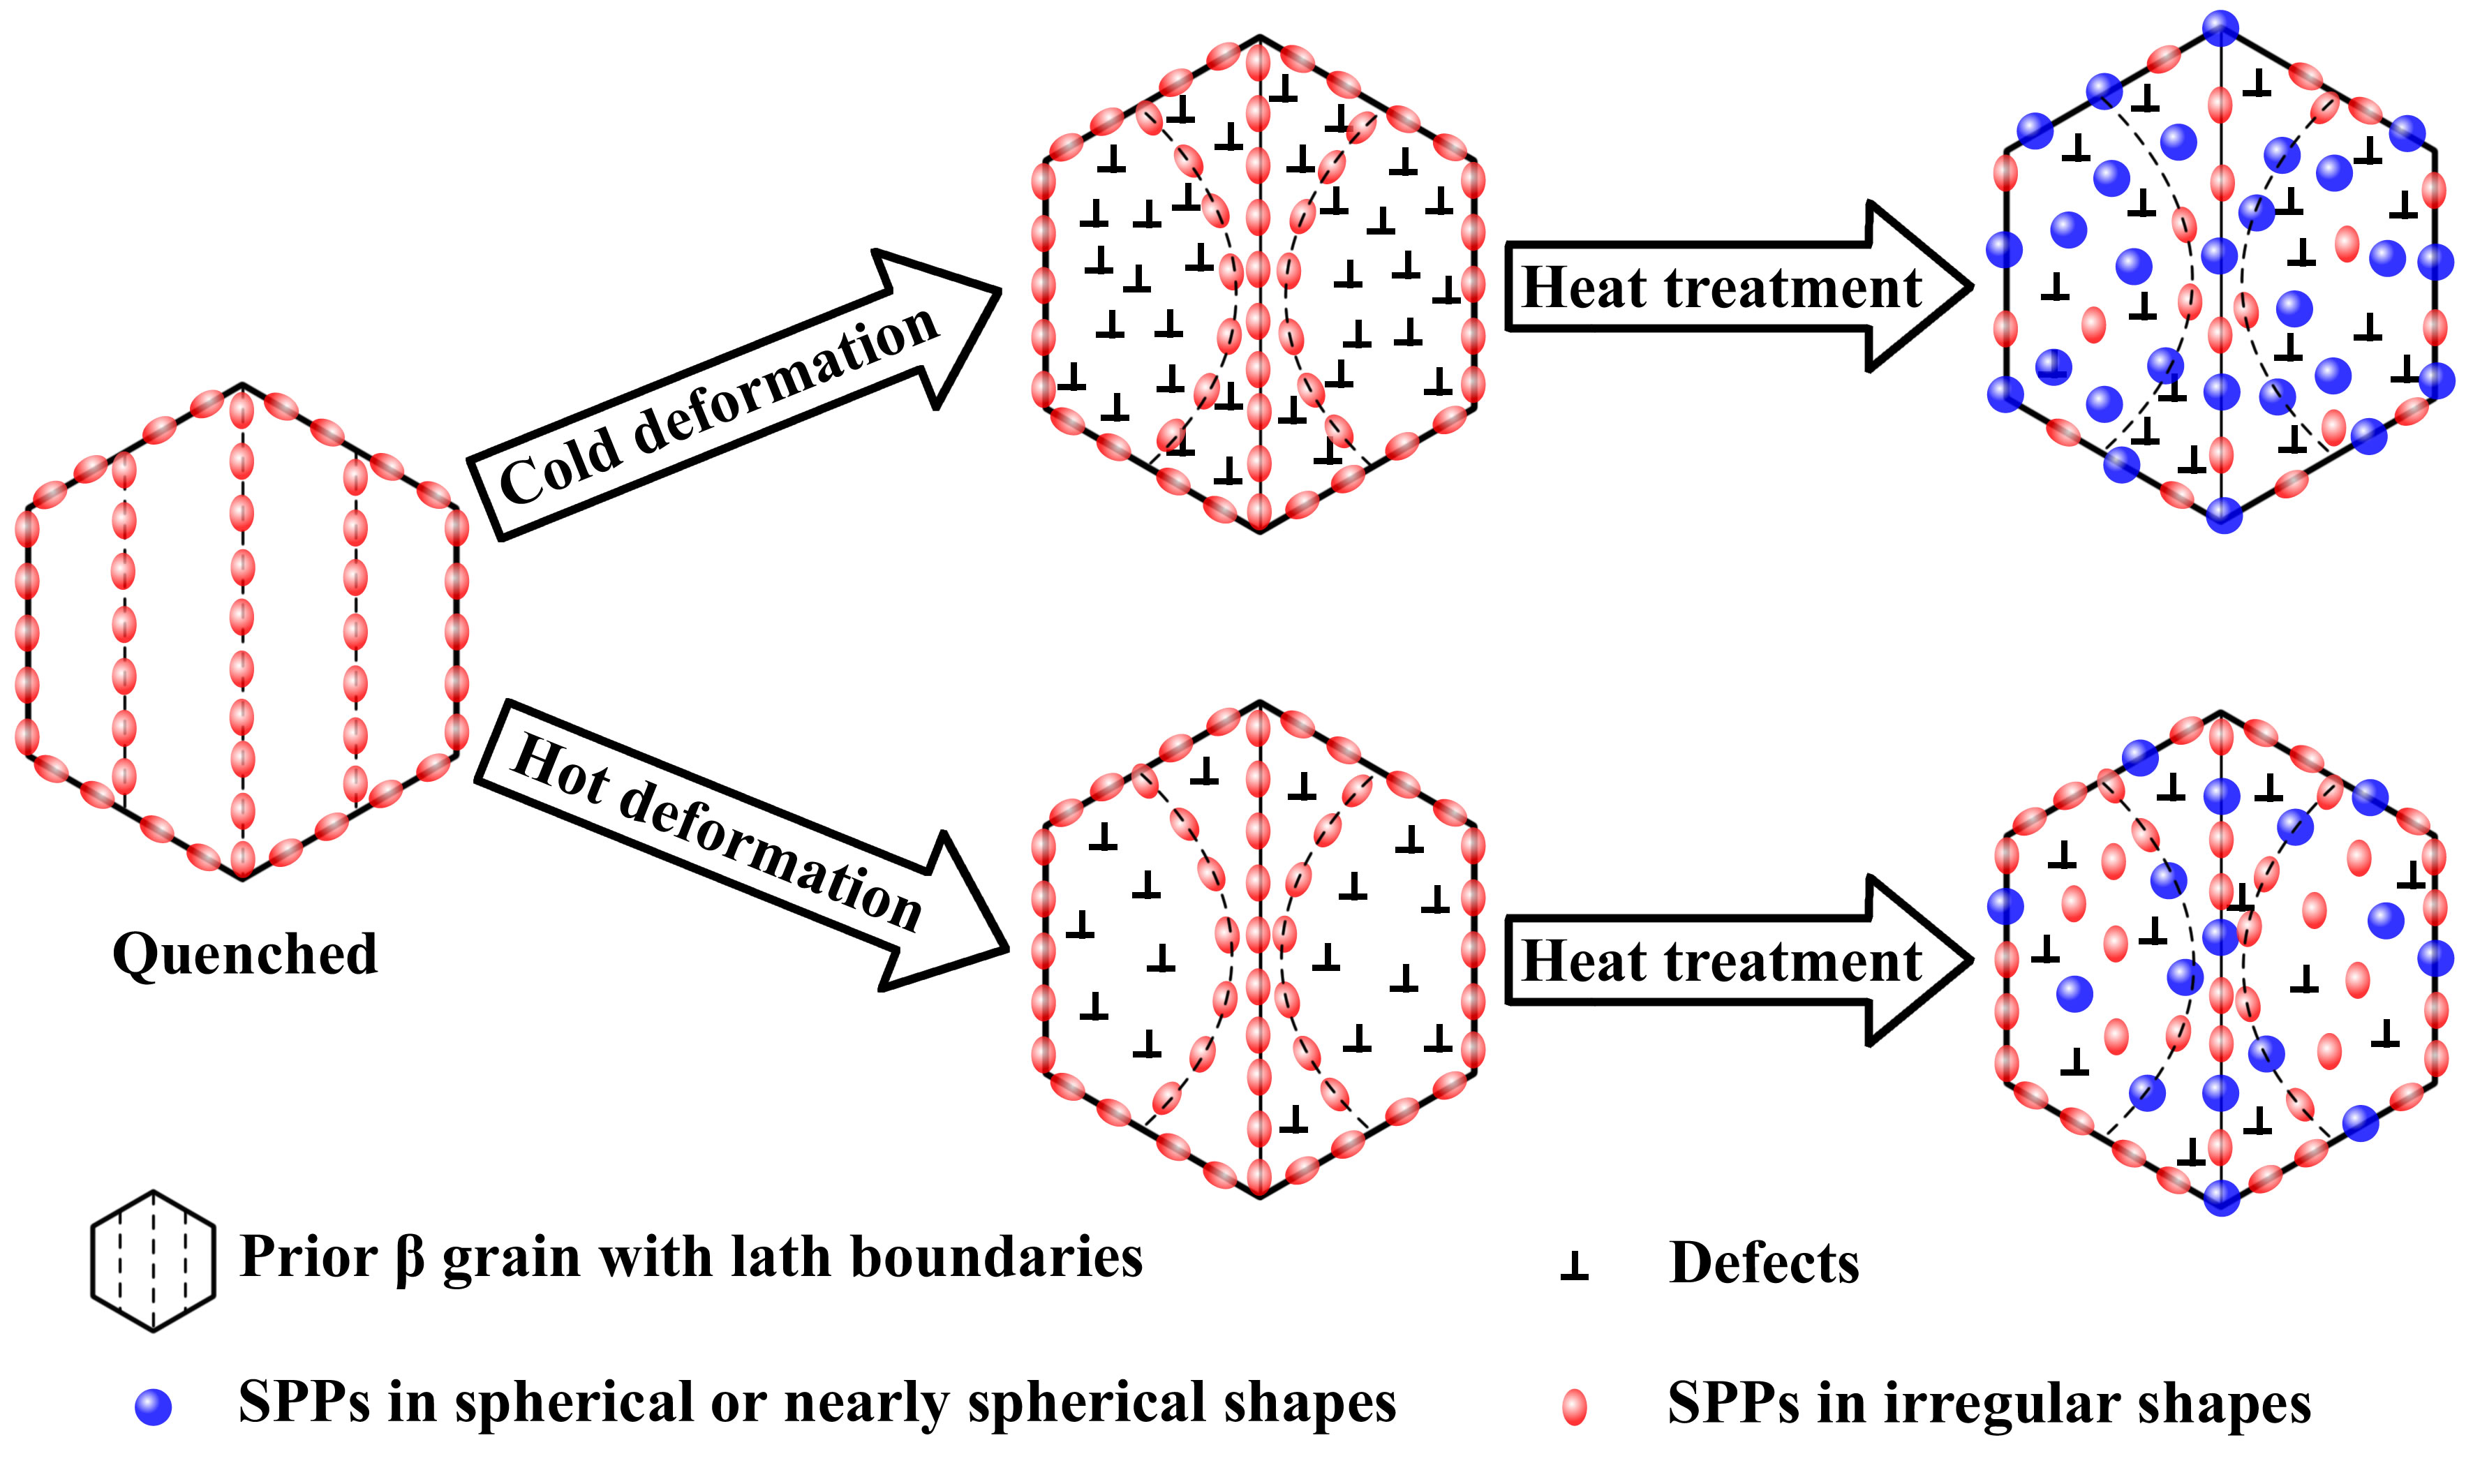
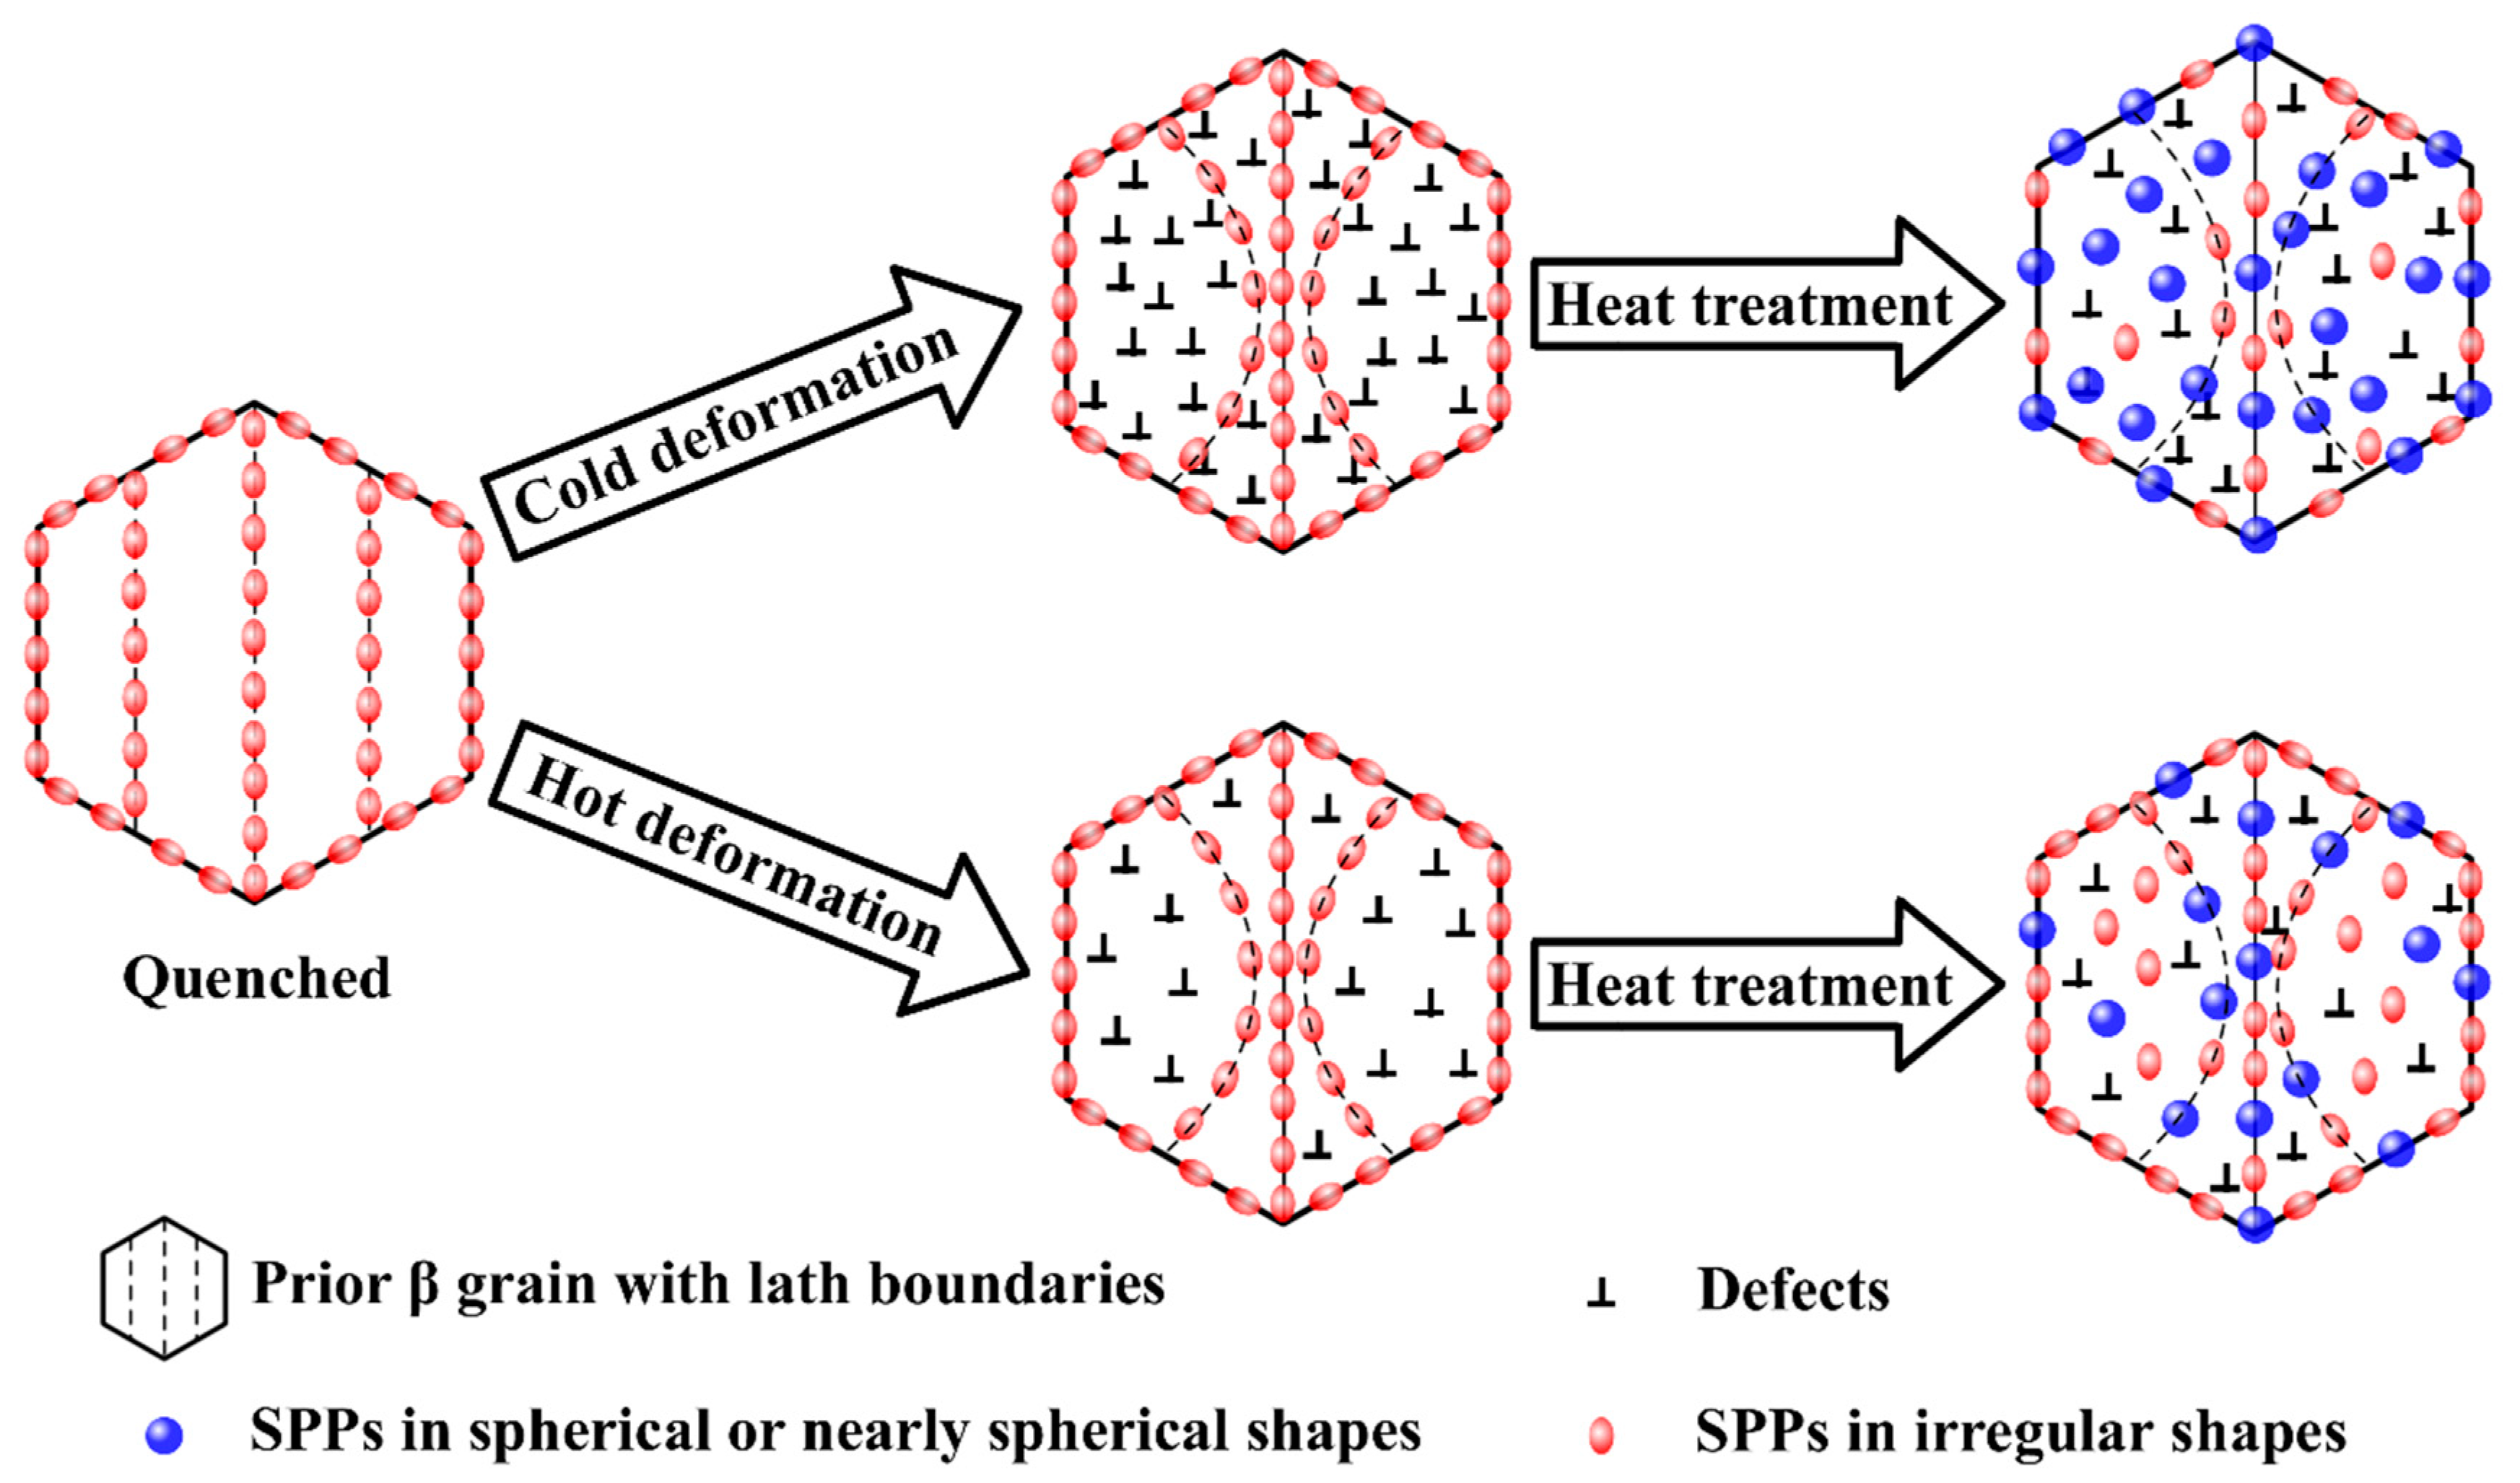
Another interesting phenomenon is that the cold-rolled samples could obtain the homogeneously distributed SPPs more easily than the hot-rolled samples under the same deformation degree and annealing conditions (Figure 4 and Figure 5). As revealed by Figure 3e, f, the HR45 sample possesses fewer dislocations than the CR45 sample caused during rolling. Chen et al. [22] reported that the decrease in the dislocation density results from the occurrence of dynamic recovery/recrystallization in the hot-rolled sample. Therefore, such different SPPs distributions between the hot-rolled and cold-rolled samples with the same deformation degree and annealing conditions should be also attributed to the distinct number of defects in their matrices. The reduction of the number of defects in the Zr matrix substantially decreases the mass transfer of SPPs during the subsequent annealing (Equation (5)). Based on these results, a qualitative schematic interpretation is given in Figure 9 to explain the evolution of SPPs in the Zr matrix during deformation and annealing. The SPPs with irregular shapes are linearly distributed along the prior β-grain boundaries and lath boundaries after β-quenching (Figure 2). After rolling, the distribution of SPPs is distorted to some extent. The degree of distortion in the distribution of SPPs is in proportion to the deformation degree (Figure 3a–d). In the meantime, the Zr matrix is also deformed and the defects are induced in the matrix. Due to dynamic recovery/recrystallization, the defects in the hot-rolled samples are fewer than those in the cold-rolled samples under the same deformation degree (Figure 3e,f). These induced defects provide shortcuts for the mass transfer of SPPs. When the rolled samples are annealed, the heat treatments provide the driving force for the homogenization of SPPs. Therefore, according to Equation (5), the samples with more defects would have a larger effective diffusion coefficient, resulting in a faster mass transfer in the Zr matrix. In such a case, the SPPs in the cold-rolled samples are more prone to grow and be homogenized than those in the hot-rolled samples under the same deformation degree and annealing conditions, which agrees with the results obtained in this work (Figure 4, Figure 5 and Figure 6). Proff et al. [55] suggested that the refined and homogeneously distributed SPPs in the matrix could improve the corrosion resistance of the Zr alloys. Therefore, the autoclave test was carried out for some samples to examine their corrosion resistance.
3.5. Corrosion Resistance
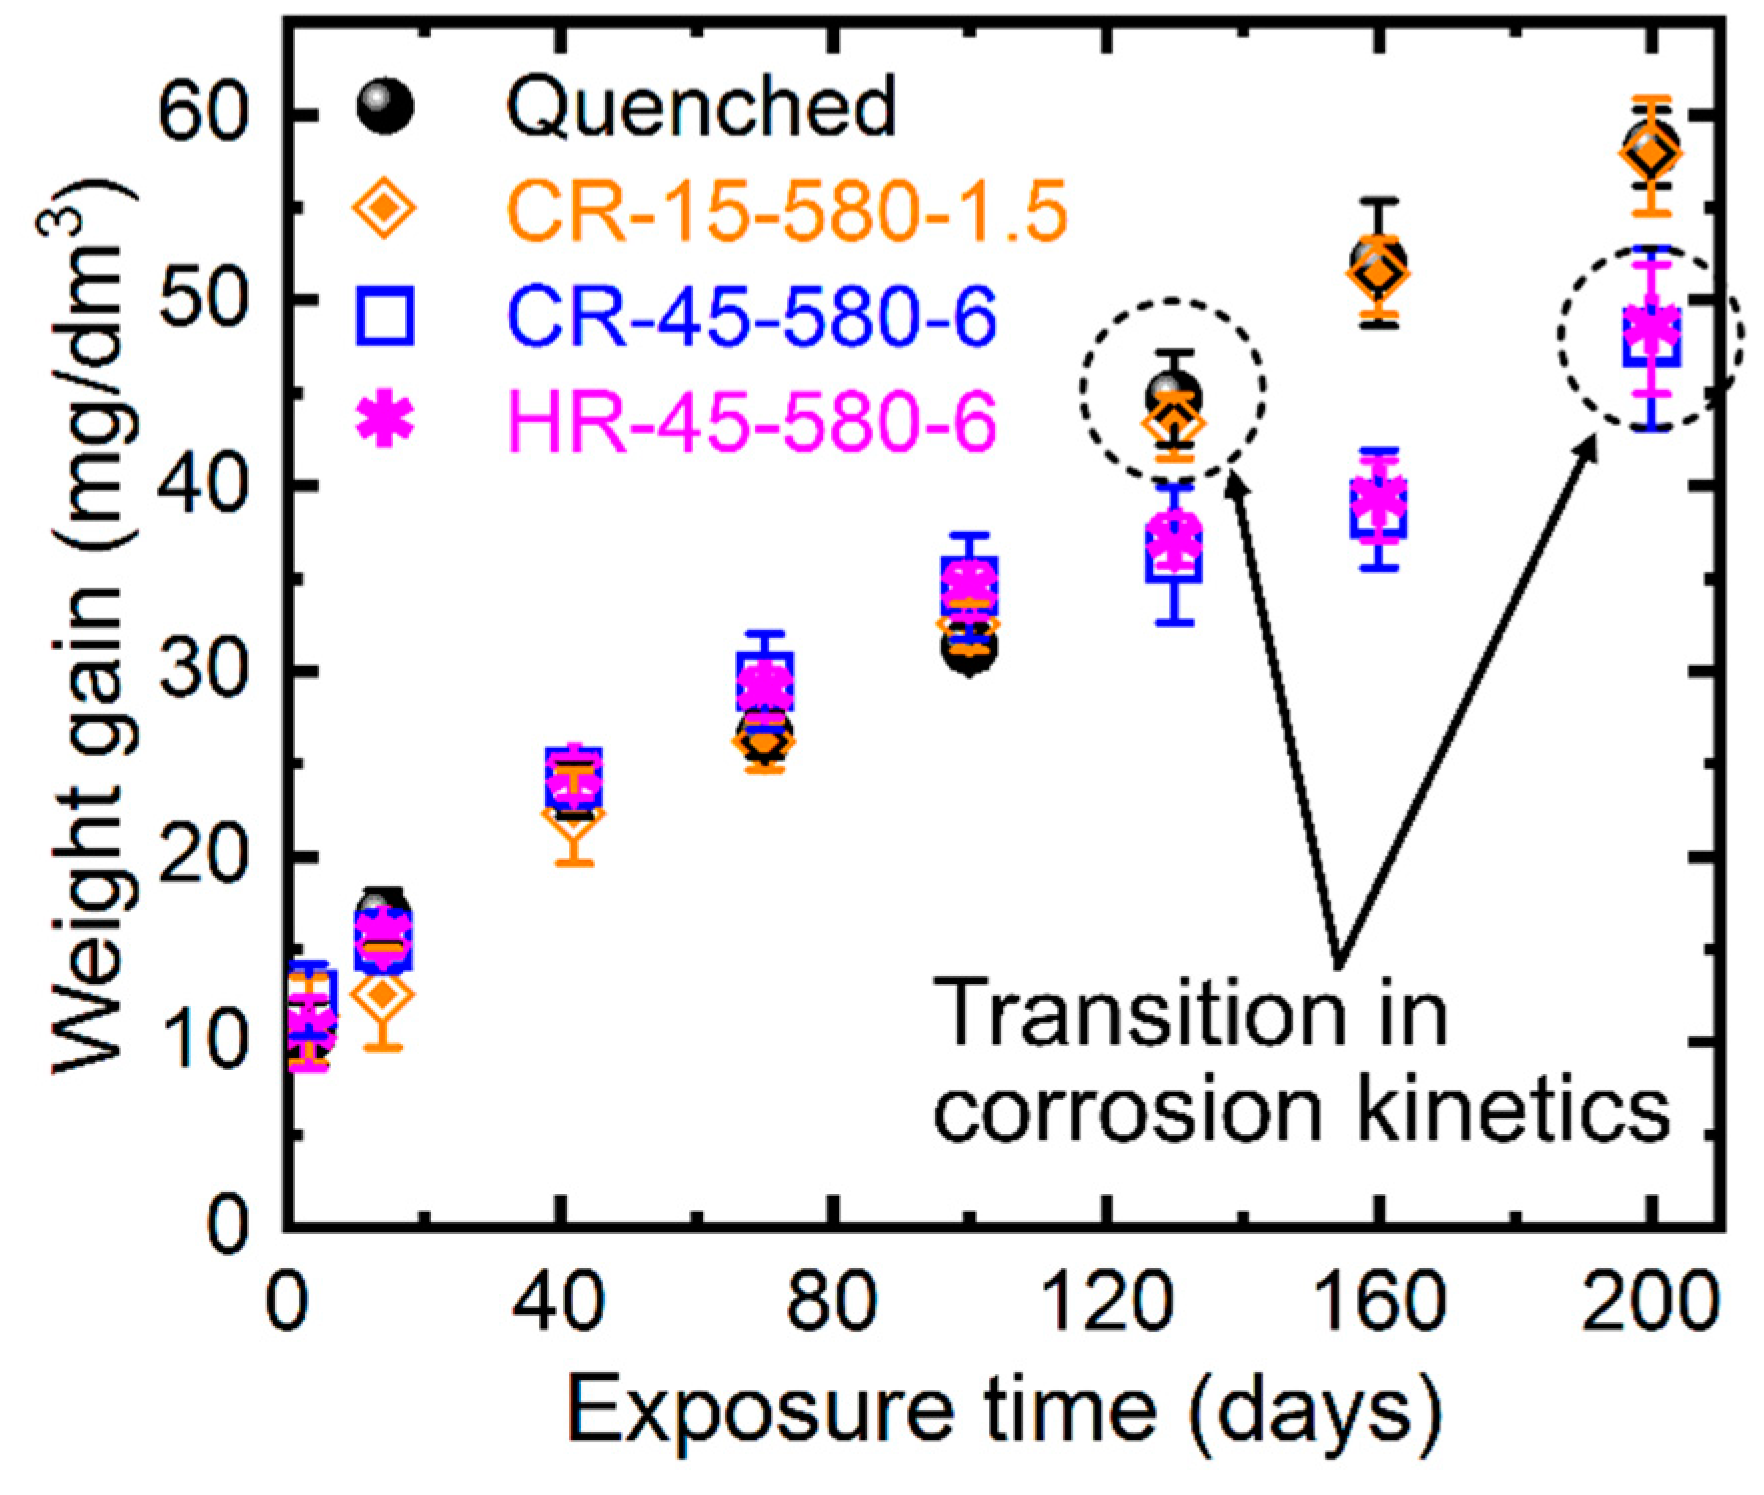
The quenched CR15-580-1.5, CR45-580-6, and HR45-580-6 samples were selected for corrosion testing in 0.01 M LiOH aqueous solution at 360 °C/18.6 MPa. As mentioned above, the SPPs in the quenched and CR15-580-1.5 samples are in the linear distributions, while the SPPs in the CR45-580-6 and HR45-580-6 samples are uniformly distributed. The weight gain of all tested samples as a function of exposure days is shown in Figure 10. Apparently, all samples have a similar weight gain before the 100-day exposure. However, a relatively rapid rise in weight gain is observed in the quenched and CR15-580-1.5 samples after the 100-day exposure, specifying the occurrence of the transition in corrosion kinetics. By comparison, the transition in corrosion kinetics for the CR45-580-6 and HR45-580-6 samples takes place after the 160-day exposure. Under the same testing conditions, a higher corrosion resistance of the Zr alloy is always related to a longer pretransition period in the case of no significant difference in weight gain before the first transition [2,14]. This illustrates that the CR45-580-6 and HR45-580-6 samples possess better corrosion resistance than the quenched and CR15-580-1.5 samples in this work. This result confirms a detrimental effect of inhomogeneously distributed SPPs on the corrosion resistance of the Zr alloys. Therefore, obtaining homogeneously distributed SPPs in the Zr matrix is rather important for improving the corrosion resistance of the Zr alloys.
5. Conclusions
In the present work, distinctive degrees of deformations by cold or hot rolling were introduced into a quenched Zr–Sn–Nb–Fe–Cu–Si–O alloy, followed by annealing at 580 °C or 680 °C for different amounts of time. The morphologies, distributions, and sizes of second-phase particles (SPPs) in the samples associated with the different processing procedures were investigated. The corresponding corrosion resistance of the samples in 0.01 M LiOH aqueous solution at 360 °C/18.6 MPa with inhomogeneously and homogeneously distributed SPPs were also compared. The following results have been obtained:
- (1)
- A linear distribution of SPPs is presented in the quenched sample. After rolling, the distributions of SPPs in the samples are distorted to some extent, according to the deformation degree. The SPPs both in rolled samples are coarsened, spherized, and homogeneously distributed during annealing; the average diameters of the SPPs increase with increasing the deformation degree and annealing time (or temperature). Furthermore, compared with the cold-rolled–annealed samples, the emergences of the homogeneous distributions of the SPPs in the hot-rolled–annealed samples are postponed.
- (2)
- The homogenization and growth of SPPs are attributed to the Ostwald ripening mechanism. Due to the invariable volume fractions of SPPs in quenched, rolled, and annealed samples, the growth rates of SPPs are primarily governed by the diffusion rates of the substance of SPPs in the Zr matrix. Since the effective diffusion coefficient consists of the lattice diffusion and short-circuit diffusion, the sample with a higher deformation degree is speculated to have more defects in the Zr matrix, which provides more shortcuts for the mass transfer of SPPs. As a result, SPPs in the sample with a higher deformation degree grow and homogenize more easily compared with those in the sample with a lower deformation degree.
- (3)
- All the selected samples had a similar weight gain before the 100-day exposure. However, the samples with inhomogeneously distributed SPPs had a post-transition phenomenon after the 100-day exposure, whereas the transitions in corrosion kinetics of the samples with homogeneously distributed SPPs took place after the 160-day exposure. Therefore, it confirms a detrimental effect of inhomogeneously distributed SPPs on the corrosion resistance of the Zr alloys.
Author Contributions
Conceptualization, L.-Y.C., L.-C.Z., and L.C.; Methodology, L.-Y.C.; Software, L.Z., D.S., and Y.-Q.C.; Validation, L.-Y.C. and L.-C.Z.; Formal Analysis, L.-Y.C. and P.S.; Investigation, L.-Y.C. and P.S.; Resources, L.C.; Data Curation, L.-C.Z.; Writing—Original Draft Preparation, L.-Y.C.; Writing—Review & Editing, L.-C.Z. and L.C.; Visualization, L.-C.Z.; Supervision, L.-C.Z.; Project Administration, L.Y.C. and L.-C.Z.; Funding Acquisition, L.-Y.C. and L.-C.Z.
Funding
This research was funded by the National Natural Science Foundation of China (51601075), the China Postdoctoral Science Foundation Funded Project (2017M611751), the Fundamental and Cutting-Edge Research Plan of Chongqing (Grant No. cstc2018jcyjAX0299), and the Jiangsu University of Science and Technology Overseas Research & Training Program for University Prominent Young & Middle-aged Teachers.
Conflicts of Interest
The authors declare no conflict of interest. The funders had no role in the design of the study; in the collection, analyses, or interpretation of data; in the writing of the manuscript; or in the decision to publish the results.
References
- Chai, L.; Wang, T.; Ren, Y.; Song, B.; Guo, N.; Chen, L. Microstructural and Textural Differences Induced by Water and Furnace Cooling in Commercially Pure Zr Annealed in the α + β Region. Met. Mater. Int. 2018, 24, 673–680. [Google Scholar] [CrossRef]
- Chen, L.Y.; Shen, P.; Zhang, L.; Lu, S.; Chai, L.; Yang, Z.; Zhang, L.C. Corrosion behavior of non-equilibrium Zr-Sn-Nb-Fe-Cu-O alloys in high-temperature 0.01 M LiOH aqueous solution and degradation of the surface oxide films. Corros. Sci. 2018, 136, 221–230. [Google Scholar] [CrossRef]
- Chai, L.; Wu, H.; Wang, S.; Chen, K.; Wang, T.; Xia, J. Characterization of microstructure and hardness of a Zr-2.5Nb alloy surface-treated by pulsed laser. Mater. Chem. Phys. 2017, 198, 303–309. [Google Scholar] [CrossRef]
- Chai, L.J.; Wang, S.Y.; Wu, H.; Guo, N.; Pan, H.C.; Chen, L.Y.; Murty, K.L.; Song, B. α→β Transformation characteristics revealed by pulsed laser-induced non-equilibrium microstructures in duplex-phase Zr alloy. Sci. China Technol. Sci. 2017, 60, 1255–1262. [Google Scholar] [CrossRef]
- Zhang, M.; Li, Y.N.; Zhang, F.C.; Wang, X.B.; Chen, L.Y.; Yang, Z.N. Effect of annealing treatment on the microstructure and mechanical properties of a duplex Zr-2.5 Nb alloy. Mater. Sci. Eng. A 2017, 706, 236–241. [Google Scholar] [CrossRef]
- Yang, Z.N.; Zhang, F.C.; Qu, L.; Yan, Z.G.; Xiao, Y.Y.; Liu, R.P.; Zhang, X.Y. Formation of duplex microstructure in Zr-2.3Nb alloy and its plastic behaviour at various strain rates. Int. J. Plast. 2014, 54, 163–177. [Google Scholar] [CrossRef]
- Tao, B.; Qiu, R.; Zhao, Y.; Liu, Y.; Tan, X.; Luan, B.; Liu, Q. Effects of alloying elements (Sn, Cr and Cu) on second phase particles in Zr-Sn-Nb-Fe-(Cr, Cu) alloys. J. Alloys Compd. 2018, 748, 745–757. [Google Scholar] [CrossRef]
- Chen, L.; Li, J.; Zhang, Y.; Zhang, L.C.; Lu, W.; Wang, L.; Zhang, L.; Zhang, D. Zr-Sn-Nb-Fe-Si-O alloy for fuel cladding candidate: Processing, microstructure, corrosion resistance and tensile behavior. Corros. Sci. 2015, 100, 332–340. [Google Scholar] [CrossRef]
- Yang, H.; Shen, J.; Matsukawa, Y.; Satoh, Y.; Kano, S.; Zhao, Z.; Li, Y.; Li, F.; Abe, H. Effects of alloying elements (Sn, Nb, Cr, and Mo) on the microstructure and mechanical properties of zirconium alloys. J. Nucl. Sci. Technol. 2015, 52, 1162–1173. [Google Scholar] [CrossRef]
- Chen, L.; Zeng, Q.; Li, J.; Lu, J.; Zhang, Y.; Zhang, L.-C.; Qin, X.; Lu, W.; Zhang, L.; Wang, L.; et al. Effect of microstructure on corrosion behavior of a Zr–Sn–Nb–Fe–Cu–O alloy. Mater. Des. 2016, 92, 888–896. [Google Scholar] [CrossRef] [Green Version]
- Granovsky, M.S.; Canay, M.; Lena, E.; Arias, D. Experimental investigation of the Zr corner of the ternary Zr–Nb–Fe phase diagram. J. Nucl. Mater. 2002, 302, 1–8. [Google Scholar] [CrossRef]
- Yang, H.L.; Shen, J.J.; Kano, S.; Matsukawa, Y.; Li, Y.F.; Satoh, Y.; Matsunaga, T.; Abe, H. Effects of Mo addition on precipitation in Zr-1.2Nb alloys. Mater. Lett. 2015, 158, 88–91. [Google Scholar] [CrossRef]
- Toffolon-Masclet, C.; Guilbert, T.; Brachet, J.C. Study of secondary intermetallic phase precipitation/dissolution in Zr alloys by high temperature-high sensitivity calorimetry. J. Nucl. Mater. 2008, 372, 367–378. [Google Scholar] [CrossRef]
- Chen, L.; Li, J.; Zhang, Y.; Zhang, L.C.; Lu, W.; Zhang, L.; Wang, L.; Zhang, D. Effects of alloyed Si on the autoclave corrosion performance and periodic corrosion kinetics in Zr-Sn-Nb-Fe-O alloys. Corros. Sci. 2015, 100, 651–662. [Google Scholar] [CrossRef]
- Kudiiarov, N.V.; Larionov, V.V.; Tyurin, I.Y. Mechanical Property Testing of Hydrogenated Zirconium Irradiated with Electrons. Metals 2018, 8, 207. [Google Scholar] [CrossRef]
- Obrosov, A.; Sutygina, N.A.; Manakhov, A.; Bolz, S.; Weiß, S.; Kashkarov, B.E. Oxidation Behavior of Zr–1Nb Corroded in Air at 400 °C after Plasma Immersion Titanium Implantation. Metals 2018, 8, 27. [Google Scholar] [CrossRef]
- Priamushko, T.; Mikhaylov, A.; Babikhina, M.; Kudiiarov, V.; Laptev, R. Glow Discharge Optical Emission Spectrometer Calibration Using Hydrogenated Zr-2.5Nb Alloy Standard Samples. Metals 2018, 8, 372. [Google Scholar] [CrossRef]
- Proff, C.; Abolhassani, S.; Lemaignan, C. Oxidation behaviour of zirconium alloys and their precipitates—A mechanistic study. J. Nucl. Mater. 2013, 432, 222–238. [Google Scholar] [CrossRef]
- Kim, H.G.; Park, J.Y.; Jeong, Y.H. Ex-reactor corrosion and oxide characteristics of Zr-Nb-Fe alloys with the Nb/Fe ratio. J. Nucl. Mater. 2005, 345, 1–10. [Google Scholar] [CrossRef]
- Huang, J.; Yao, M.Y.; Gao, C.Y.; Liang, X.; Peng, J.C.; Zhang, J.L.; Zhou, B.X. The influence of second phase particles on the crack formation in oxide films formed on zirconium alloys. Corros. Sci. 2015, 99, 172–177. [Google Scholar] [CrossRef]
- Abe, H.; Iwamoto, T.; Yamamoto, Y.; Nishida, S.; Komatsu, R. Dimensional accuracy of tubes in cold pilgering. J. Mater. Process. Technol. 2016, 231, 277–287. [Google Scholar] [CrossRef]
- Chen, L.; Li, J.; Zhang, Y.; Lu, W.; Zhang, L.C.; Wang, L.; Zhang, D. Effect of low-temperature pre-deformation on precipitation behavior and microstructure of a Zr-Sn-Nb-Fe-Cu-O alloy during fabrication. J. Nucl. Sci. Technol. 2016, 53, 496–507. [Google Scholar] [CrossRef]
- Zhang, M.; Zhang, F.; Yang, Z.; Li, Y.; Qu, L.; Zhen, H. Effect of cooling process on the formation of duplex microstructure in Zr–2.3Nb alloy. J. Alloys Compd. 2015, 651, 316–321. [Google Scholar] [CrossRef]
- Yang, H.L.; Matsukawa, Y.; Kano, S.; Duan, Z.G.; Murakami, K.; Abe, H. Investigation on microstructural evolution and hardening mechanism in dilute Zr-Nb binary alloys. J. Nucl. Mater. 2016, 481, 117–124. [Google Scholar] [CrossRef]
- Chai, L.; Luan, B.; Murty, K.L.; Liu, Q. Effect of predeformation on microstructural evolution of a Zr alloy during 550-700 °C aging after β-quenching. Acta Mater. 2013, 61, 3099–3109. [Google Scholar] [CrossRef]
- Gros, J.P.; Wadier, J.F. Precipitate growth kinetics in Zircaloy-4. J. Nucl. Mater. 1990, 172, 85–96. [Google Scholar] [CrossRef]
- Liu, Y.; Kathan, K.; Saad, W.; Prud, R.K. Ostwald ripening of β-carotene nanoparticles. Phys. Rev. Lett. 2007, 98, 8–11. [Google Scholar] [CrossRef] [PubMed]
- Luan, B.F.; Chai, L.J.; Chen, J.W.; Zhang, M.; Liu, Q. Growth behavior study of second phase particles in a Zr-Sn-Nb-Fe-Cr-Cu alloy. J. Nucl. Mater. 2012, 423, 127–131. [Google Scholar] [CrossRef]
- Zhang, L.C.; Attar, H. Selective Laser Melting of Titanium Alloys and Titanium Matrix Composites for Biomedical Applications: A Review. Adv. Eng. Mater. 2016, 18, 463–475. [Google Scholar] [CrossRef]
- Calin, M.; Zhang, L.C.; Eckert, J. Tailoring of microstructure and mechanical properties of a Ti-based bulk metallic glass-forming alloy. Scr. Mater. 2007, 57, 1101–1104. [Google Scholar] [CrossRef]
- Chai, L.; Chen, K.; Zhi, Y.; Murty, K.L.; Chen, L.Y.; Yang, Z. Nanotwins induced by pulsed laser and their hardening effect in a Zr alloy. J. Alloys Compd. 2018, 748, 163–170. [Google Scholar] [CrossRef]
- Liu, L.H.; Yang, C.; Wang, F.; Qu, S.G.; Li, X.Q.; Zhang, W.W.; Li, Y.Y.; Zhang, L.C. Ultrafine grained Ti-based composites with ultrahigh strength and ductility achieved by equiaxing microstructure. Mater. Des. 2015, 79, 1–5. [Google Scholar] [CrossRef]
- Lumley, S.C.; Murphy, S.T.; Burr, P.A.; Grimes, R.W.; Chard-Tuckey, P.R.; Wenman, M.R. The stability of alloying additions in Zirconium. J. Nucl. Mater. 2013, 437, 122–129. [Google Scholar] [CrossRef]
- Herb, B.; Ruhrmann, H.; Konig, A. In-process investigation of precipitate growth in zirconium alloys. In Zirconium in the Nuclear Industry: Twelfth International Symposium; ASTM International: West Conshohocken, PA, USA, 2000; pp. 482–504. [Google Scholar]
- Chai, L.J.; Luan, B.F.; Gao, S.S.; Chen, J.W.; Liu, Q. Study of precipitate evolution and recrystallization of β-quenched Zr-Sn-Nb-Fe-Cr-Cu alloy during aging. J. Nucl. Mater. 2012, 427, 274–281. [Google Scholar] [CrossRef]
- Zhang, L.C.; Shen, Z.Q.; Xu, J. Mechanically milling-induced amorphization in Sn-containing Ti-based multicomponent alloy systems. Mater. Sci. Eng. A 2005, 394, 204–209. [Google Scholar] [CrossRef]
- Yu, P.; Zhang, L.C.; Zhang, W.Y.; Das, J.; Kim, K.B.; Eckert, J. Interfacial reaction during the fabrication of Ni60Nb40 metallic glass particles-reinforced Al based MMCs. Mater. Sci. Eng. A 2007, 444, 206–213. [Google Scholar] [CrossRef]
- Zhang, L.C.; Xu, J.; Ma, E. Mechanically Alloyed Amorphous Ti50(Cu0.45Ni0.55)44–xAlxSi4B2 Alloys with Supercooled Liquid Region. J. Mater. Res. 2002, 17, 1743–1749. [Google Scholar] [CrossRef]
- Zhang, L.C.; Kim, K.B.; Yu, P.; Zhang, W.Y.; Kunz, U.; Eckert, J. Amorphization in mechanically alloyed (Ti, Zr, Nb)-(Cu, Ni)-Al equiatomic alloys. J. Alloys Compd. 2007, 428, 157–163. [Google Scholar] [CrossRef]
- Jiang, L.; Pérez-Prado, M.T.; Gruber, P.A.; Arzt, E.; Ruano, O.A.; Kassner, M.E. Texture, microstructure and mechanical properties of equiaxed ultrafine-grained Zr fabricated by accumulative roll bonding. Acta Mater. 2008, 56, 1228–1242. [Google Scholar] [CrossRef]
- Zhu, K.Y.; Chaubet, D.; Bacroix, B.; Brisset, F. A study of recovery and primary recrystallization mechanisms in a Zr-2Hf alloy. Acta Mater. 2005, 53, 5131–5140. [Google Scholar] [CrossRef]
- Kahlweit, M. Ostwald ripening of precipitates. Adv. Colloid Interface Sci. 1975, 5, 1–35. [Google Scholar] [CrossRef]
- Yang, H.L.; Kano, S.; Matsukawa, Y.; Li, Y.F.; Shen, J.J.; Li, F.; Zhao, Z.S.; Satoh, Y.; Abe, H. Effect of molybdenum on microstructures in Zr-1.2Nb alloys after β-quenching and subsequently 873 K annealing. Mater. Des. 2016, 104, 355–364. [Google Scholar] [CrossRef]
- Zhang, L.C.; Liu, Y.; Li, S.; Hao, Y. Additive Manufacturing of Titanium Alloys by Electron Beam Melting: A Review. Adv. Eng. Mater. 2018, 20, 1700842. [Google Scholar] [CrossRef]
- Marqusee, J.A.; Ross, J. Theory of Ostwald ripening: Competitive growth and its dependence on volume fraction. J. Chem. Phys. 1984, 80, 536–543. [Google Scholar] [CrossRef]
- Lifshitz, I.M.; Slyozov, V.V. The kinetics of precipitation from supersaturated solid solutions. J. Phys. Chem. Solids 1961, 19, 35–50. [Google Scholar] [CrossRef]
- Carman, A.; Zhang, L.C.; Ivasishin, O.M.; Savvakin, D.G.; Matviychuk, M.V.; Pereloma, E.V. Role of alloying elements in microstructure evolution and alloying elements behaviour during sintering of a near-β titanium alloy. Mater. Sci. Eng. A 2011, 528, 1686–1693. [Google Scholar] [CrossRef]
- Sun, C.Y.; Cong, Y.P.; Zhang, Q.D.; Fu, M.W.; Li, L. Element diffusion model with variable coefficient in bimetallic bonding process. J. Mater. Process. Technol. 2018, 253, 99–108. [Google Scholar] [CrossRef]
- Qin, P.; Liu, Y.; Sercombe, T.B.; Li, Y.; Zhang, C.; Cao, C.; Sun, H.; Zhang, L.C. Improved Corrosion Resistance on Selective Laser Melting Produced Ti-5Cu Alloy after Heat Treatment. ACS Biomater. Sci. Eng. 2018, 4, 2633–2642. [Google Scholar] [CrossRef]
- Qin, X.; Guo, X.; Lu, J.; Chen, L.; Qin, J.; Lu, W. Erosion-wear and intergranular corrosion resistance properties of AISI 304L austenitic stainless steel after low-temperature plasma nitriding. J. Alloys Compd. 2017, 698, 1094–1101. [Google Scholar] [CrossRef]
- Panicaud, B.; Grosseau-Poussard, J.L.; Retraint, D.; Guérain, M.; Li, L. On the mechanical effects of a nanocrystallisation treatment for ZrO2 oxide films growing on a zirconium alloy. Corros. Sci. 2013, 68, 263–274. [Google Scholar] [CrossRef]
- Zhang, L.C.; Lu, H.B.; Mickel, C.; Eckert, J. Ductile ultrafine-grained Ti-based alloys with high yield strength. Appl. Phys. Lett. 2007, 91, 051906. [Google Scholar] [CrossRef] [Green Version]
- Yang, Y.; Li, G.P.; Wang, H.; Wu, S.Q.; Zhang, L.C.; Li, Y.L.; Yang, K. Formation of zigzag-shaped {1 1 2}<1 1 1> β mechanical twins in Ti-24.5 Nb-0.7 Ta-2 Zr-1.4 O alloy. Scr. Mater. 2012, 66, 211–214. [Google Scholar] [CrossRef]
- Wang, L.; Xie, L.; Lv, Y.; Zhang, L.C.; Chen, L.; Meng, Q.; Qu, J.; Zhang, D.; Lu, W. Microstructure evolution and superelastic behavior in Ti-35Nb-2Ta-3Zr alloy processed by friction stir processing. Acta Mater. 2017, 131, 499–510. [Google Scholar] [CrossRef]
- Proff, C.; Abolhassani, S.; Lemaignan, C. Oxidation behaviour of binary zirconium alloys and their precipitates. J. Nucl. Mater. 2013, 432, 1–22. [Google Scholar] [CrossRef]
Figure 1.
Processing flow of the experimental Zr alloy.

Figure 2.
Microstructure of the experimental Zr alloy after β-quenching: (a) an optical image, (b) a SEM image, and (c) a magnified image of the dashed rectangle in (b). SPPs: second-phase particles.
Figure 2.
Microstructure of the experimental Zr alloy after β-quenching: (a) an optical image, (b) a SEM image, and (c) a magnified image of the dashed rectangle in (b). SPPs: second-phase particles.

Figure 3.
Microstructures of the β-quenched sample after rolling: SEM images of (a) CR15, (b) CR45, (c) HR15, and (d) HR45; TEM images of (e) CR45 and (f) HR45. The insets in (e,f) are the corresponding selected area electron diffraction patterns (SADPs) for the SPP and the Zr matrix. SPPs: second-phase particles. The dashed rectangles indicate the distorted distribution of the SPPs. The dashed cycles mean the dislocations in the samples. The yellow boxes are the SADPs for the SPPs and the blue dashed line boxes illustrate the SADPs for the Zr matrix.

Figure 4.
Morphologies and distributions of SPPs in cold-rolled and annealed samples. The blue dashed line basically indicates the transition from a linear to a homogeneous distribution of SPPs. All the images have the same scale bar.
Figure 4.
Morphologies and distributions of SPPs in cold-rolled and annealed samples. The blue dashed line basically indicates the transition from a linear to a homogeneous distribution of SPPs. All the images have the same scale bar.

Figure 5.
Morphologies and distributions of SPPs in hot-rolled and annealed samples. The blue dashed line basically indicates the transition from a linear to a homogeneous distribution of SPPs. All the images have the same scale bar.
Figure 5.
Morphologies and distributions of SPPs in hot-rolled and annealed samples. The blue dashed line basically indicates the transition from a linear to a homogeneous distribution of SPPs. All the images have the same scale bar.

Figure 6.
Variations in the average diameters of SPPs in the (a) cold-rolled and (b) hot-rolled samples after β-quenching, rolling, and annealing. Error bars represent the first standard deviations of the average diameter of SPPs obtained from at least five SEM images. CR indicates the cold rolling and HR means the hot rolling. 580-1.5 and so on represent the annealing conditions for the corresponding samples. For example, 580-1.5 illustrate the sample is annealed at 580 °C for 1.5 h.

Figure 7.
Volume fractions of SPPs in the selected samples after β-quenching, rolling, and annealing. Error bars represent the first standard deviations of the average diameter of SPPs obtained from at least five SEM images.
Figure 7.
Volume fractions of SPPs in the selected samples after β-quenching, rolling, and annealing. Error bars represent the first standard deviations of the average diameter of SPPs obtained from at least five SEM images.

Figure 8.
Morphologies of some SPPs in the CR45-580-3 sample: (a) four SPPs combining into a large flower-like shaped one is observed by SEM observation, and (b) a heart-like shaped SPP (P1) with FCC structure and two connected SPPs (P2 and P3) are observed by TEM observation. The inset in (b) is the selected area electronic diffraction for the heart-like shaped SPP. SPP indicates the second-phase particles. FCC structure means the face-centered cubic structure.

Figure 9.
Schematic interpretation of the mechanism for the homogenization and growth behavior of second-phase particles in the deformed Zr alloys. The number of SPPs and defects are only a schematic, not a quantitative representation.
Figure 9.
Schematic interpretation of the mechanism for the homogenization and growth behavior of second-phase particles in the deformed Zr alloys. The number of SPPs and defects are only a schematic, not a quantitative representation.

Figure 10.
Weight gain of the selected samples as a function of exposure time.

© 2018 by the authors. Licensee MDPI, Basel, Switzerland. This article is an open access article distributed under the terms and conditions of the Creative Commons Attribution (CC BY) license (http://creativecommons.org/licenses/by/4.0/).
Share and Cite
MDPI and ACS Style
Chen, L.-Y.; Sang, P.; Zhang, L.; Song, D.; Chu, Y.-Q.; Chai, L.; Zhang, L.-C. Homogenization and Growth Behavior of Second-Phase Particles in a Deformed Zr–Sn–Nb–Fe–Cu–Si–O Alloy. Metals 2018, 8, 759. https://doi.org/10.3390/met8100759
AMA Style
Chen L-Y, Sang P, Zhang L, Song D, Chu Y-Q, Chai L, Zhang L-C. Homogenization and Growth Behavior of Second-Phase Particles in a Deformed Zr–Sn–Nb–Fe–Cu–Si–O Alloy. Metals. 2018; 8(10):759. https://doi.org/10.3390/met8100759
Chicago/Turabian StyleChen, Liang-Yu, Peng Sang, Lina Zhang, Dongpo Song, Yan-Qiu Chu, Linjiang Chai, and Lai-Chang Zhang. 2018. "Homogenization and Growth Behavior of Second-Phase Particles in a Deformed Zr–Sn–Nb–Fe–Cu–Si–O Alloy" Metals 8, no. 10: 759. https://doi.org/10.3390/met8100759
Note that from the first issue of 2016, this journal uses article numbers instead of page numbers. See further details here.