The Effect of Nd on Mechanical Properties and Corrosion Performance of Biodegradable Mg-5%Zn Alloy


1
Department of Materials Engineering, Ben-Gurion University of the Negev, Beer-Sheva 8410501, Israel
2
Department of Mechanical Engineering, Shamoon College of Engineering, Beer-Sheva 8410501, Israel
3
Biomedical Engineering Department, Michigan Technological University, Houghton, MI 49931, USA
*
Author to whom correspondence should be addressed.
Metals 2018, 8(6), 438; https://doi.org/10.3390/met8060438
Submission received: 7 May 2018
/
Revised: 1 June 2018
/
Accepted: 1 June 2018
/
Published: 9 June 2018
Abstract
:Mg based implants are limited by their poor strength, ductility, and corrosion performance in physiological environments, drawbacks further compounded by their premature loss of mechanical integrity and evolution of harmful hydrogen gas. Neodymium additions to magnesium have been shown to improve mechanical properties through precipitation and solid solution hardening. Therefore, the present study incorporated Nd additions (up to 3%) into a promising Mg-5%Zn-0.13%Y-0.35%Zr alloy to improve mechanical properties and corrosion resistance. The microstructure evaluation of a series of alloys was performed using optical microscopy, scanning electron microscopy (SEM), and X-ray diffraction analysis. The mechanical properties were examined in terms of hardness and tensile strength. Corrosion behavior was evaluated by immersion testing, impedance spectroscopy analysis, potentiodynamic polarization and stress corrosion examination using slow strain rate testing (SSRT), all in PBS solution. The results indicate optimal strength, ductility and corrosion performance with a 2% Nd addition. This was explained in terms of secondary phase formation of a W-phase (Mg3(Nd,Y)2Zn3) and T-phase (Mg4(Nd,Y)Zn2).
1. Introduction
Mg alloys are considered as potential structural materials for biodegradable implants mainly due to their excellent in vivo biocompatibility and degradation capabilities [1,2]. However, their unsatisfactory mechanical properties and accelerated corrosion rates in physiological environments predispose towards premature loss of mechanical integrity as well as gas embolism due to the harmful corrosion-linked formation of hydrogen gas [3,4]. A related challenge for Mg alloys is their susceptibility to stress corrosion during service due to a hydrogen embrittlement mechanism [5] that is known to progress predominantly by cleavage [6,7,8].
Current efforts to counteract the inherent disadvantageous properties of magnesium alloys are largely focused on alloying and improved processing conditions. Various Mg systems have been developed over the past several decades, including Mg-Zn, Mg-Al-Zn, and Mg-Nd-Y-Zr, among others [9,10,11,12,13]. The Mg-Zn base alloys in particular have attracted great attention as zinc is one of the most abundant nutritional elements in the human body [14,15,16]. According to the Mg-Zn binary phase diagram [17], zinc has a high solubility in α-Mg matrix, generating solid solution strengthening and increasing the corrosion potential of the α-Mg phase. Moreover, zinc is known as a grain refining element for Mg, reducing deleterious galvanic effects associated with the presence of metallic impurities such as Fe, Cu and Ni. These attributes are enhanced with further addition of zinc above its maximum room temperature solubility in the α-Mg phase, due to the formation of a eutectic microstructure.
Recent studies have highlighted the attractive mechanical properties and corrosion resistance imparted by zinc inclusions in the Mg-5%Zn base alloy. In order to amplify the favorable mechanical and electrochemical properties of this base alloy, several alloying elements have been introduced and examined, including rare earth elements [18,19,20,21,22,23]. However, the effect of Nd additions on mechanical properties, corrosion behavior and stress corrosion remain poorly understood. The aims of the present study were to investigate the effect of Nd additions (up to 3%) to the Mg-5%Zn-0.13%Y-0.35%Zr alloy, in terms of mechanical properties and corrosion performance in a simulated physiological solution.
2. Experimental
The innovative Mg base system examined here has the following chemical composition: Mg-5Zn-0.35Zr-0.13Y with Nd content varying between 0–3 wt %. The chemical compositions of the obtained alloys were determined by mass spectrometry (BAIRD, Bedford, MA, USA) as shown in Table 1. The alloys were prepared by gravity casting using high purity alloying elements (grade—99.9%) and Mg-20% Nd as a master alloy. The Mg-Nd master alloy was cast in a high frequency induction furnace under argon atmosphere and the melt was poured into a mold held at room temperature [24]. The base alloy (Mg-Zn-Y-Zr) was prepared by melting magnesium and alloying elements in a resistance furnace at 770 °C using a carbon steel crucible and a protective atmosphere of CO2+HFC134. The relevant amount of the Mg-20%Nd master alloy was then added at a lower temperature of 750 °C. This alloying process was followed by intensive stirring, for up to 20 min, to ensure complete dissolution of all components. After complete mixing and intermediate chemical composition analysis, the melt was held for 30 min to allow natural settling of heavy substances such as iron and magnesium oxides. The casting process was terminated by pouring the molten metal into a steel mold to obtain 16 kg ingots. In order to ensure homogeneity, ingots were heat-treated at 320 °C for 8 h under a protective gas atmosphere of Air/CO2+SF6 followed by water quenching. The homogenized alloys were then machined to obtain cylindrical bars having a 50 mm diameter and 60 mm length. The cylindrical bars were subsequently extruded at 400 °C using an extrusion ratio of 8:1, to obtain the rectangular bars of 15 mm × 15 mm that were used for all experimentation.
The microstructure of the tested alloys was evaluated by optical microscopy (Epiphot Nikon, NY, USA) and by a scanning electron microscope (SEM, JEOL JSM-5600, Peabody, MA, USA) equipped with an energy dispersive spectrometer (EDS) detector (Thermo Fisher Scientific, Seoul, Korea), with a resolution of 129 eV and 1 μm penetration depth. The average grain size was quantified by a linear intercept metallography method. Phase identification and lattice parameters were evaluated by X-ray diffraction analysis using a diffractometer (RIGAKU-2100H, New-Isenburg, Germany) with Cu-Kα, 40 kV/30 mA and a scanning rate of 2°/min.
The mechanical properties of the alloys were evaluated by tensile tests using a Cromat C-76 set-up under a strain rate of 2.5 × 10⁻⁴ s−1 and by hardness testing (HV measurements). The gauge length and diameter of tensile samples were 25.4 mm and 3.81 mm, respectively. Fractography analysis was carried out with a scanning electron microscope.
The environmental performance was examined by an immersion test according to ASTM (American Society for Testing and Materials) G31-72 standard and by electrochemical analysis including potentiodynamic polarization and impedance spectroscopy, according to ASTM G5-94 and G 106-89 standards, respectively. The samples for the immersion tests (11 mm in diameter and 5 mm length) were ground with 4000 grit paper and ultrasonically cleaned with alcohol. Samples were immersed in phosphate-buffered saline (PBS) at 37 °C for 10 days. A surface area to solution volume ratio of 1 cm2: 700 mL was used and the solution was renewed every 24 h to simulate the natural buffering effect found in vivo. The corrosion rates of the tested specimens were calculated according to the evolved hydrogen gas volume [25]. The hydrogen gas obtained during the dissolution reaction of the tested alloys was collected in a burette located above the corroded samples, and measured every 24 h before renewing the immersion solution. The chemical composition of PBS solution includes 0.01 M phosphate buffer, 0.0027 M Potassium Chloride and 0.137 M Sodium Chloride in 200 mL deionized water.
The electrochemical measurements, also performed in PBS solution, employed a three-electrode cell with a saturated calomel reference electrode, a platinum counter electrode and the tested sample (with an exposed area of 1 cm2) as a working electrode. Prior to measurements, the tested samples were ground with 4000 grit paper and ultrasonically cleaned with alcohol. The electrochemical impedance spectroscopy (EIS) analysis with a sinusoidal signal of 10 mV amplitude was applied in the frequency range of 10 kHz to 1 mHz. Following the EIS measurements, potentiodynamic polarization tests with a scanning rate of 0.5 mV/sec were conducted. The corrosion rates, corrosion potential (Ecorr) and the corrosion current density (Icorr) were calculated by Tafel extrapolation. All the electrochemical analyses were obtained using an SP-200 Biologic potentiostat and EC-Lab v. 10.18 software. The stress corrosion behavior of the tested alloys was examined using slow strain rate testing (SSRT) in PBS solution, according to ASTM G129-00 standard. The diameter and length of the SSRT test specimens were 3.80 mm and 25.4 mm, respectively, with an applied strain rate of 2.5 × 10⁻⁷ s−1.
3. Results
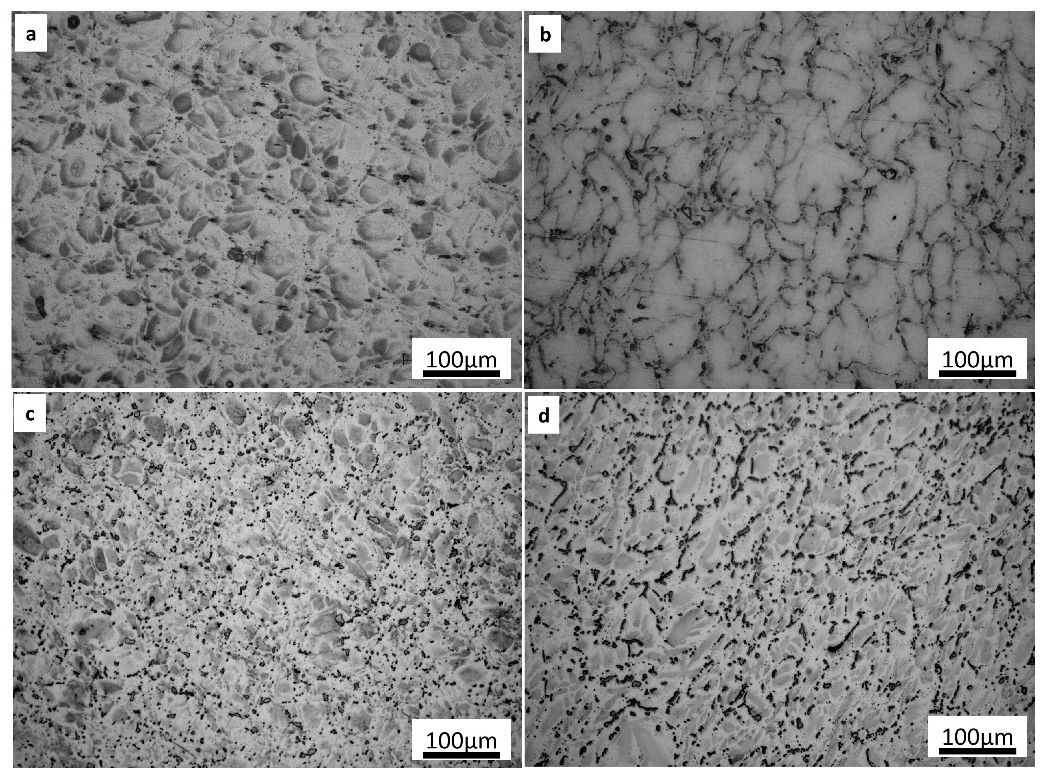
The typical microstructure of the tested alloys with different amounts of Nd as obtained by optical microscopy is shown in Figure 1. The matrix microstructure of the base Mg-5%Zn alloy was mainly composed of a single-phase with an average grain size of 34 ± 3.0 µm. Discontinuous fine residual undissolved secondary phases were present at grain boundaries, due to the heat treatment. Additions of 1–3 wt % Nd to the base alloy resulted in an increase in the volume fraction of secondary phases at the grain boundaries. However, the average grain size was independent of Nd concentration.
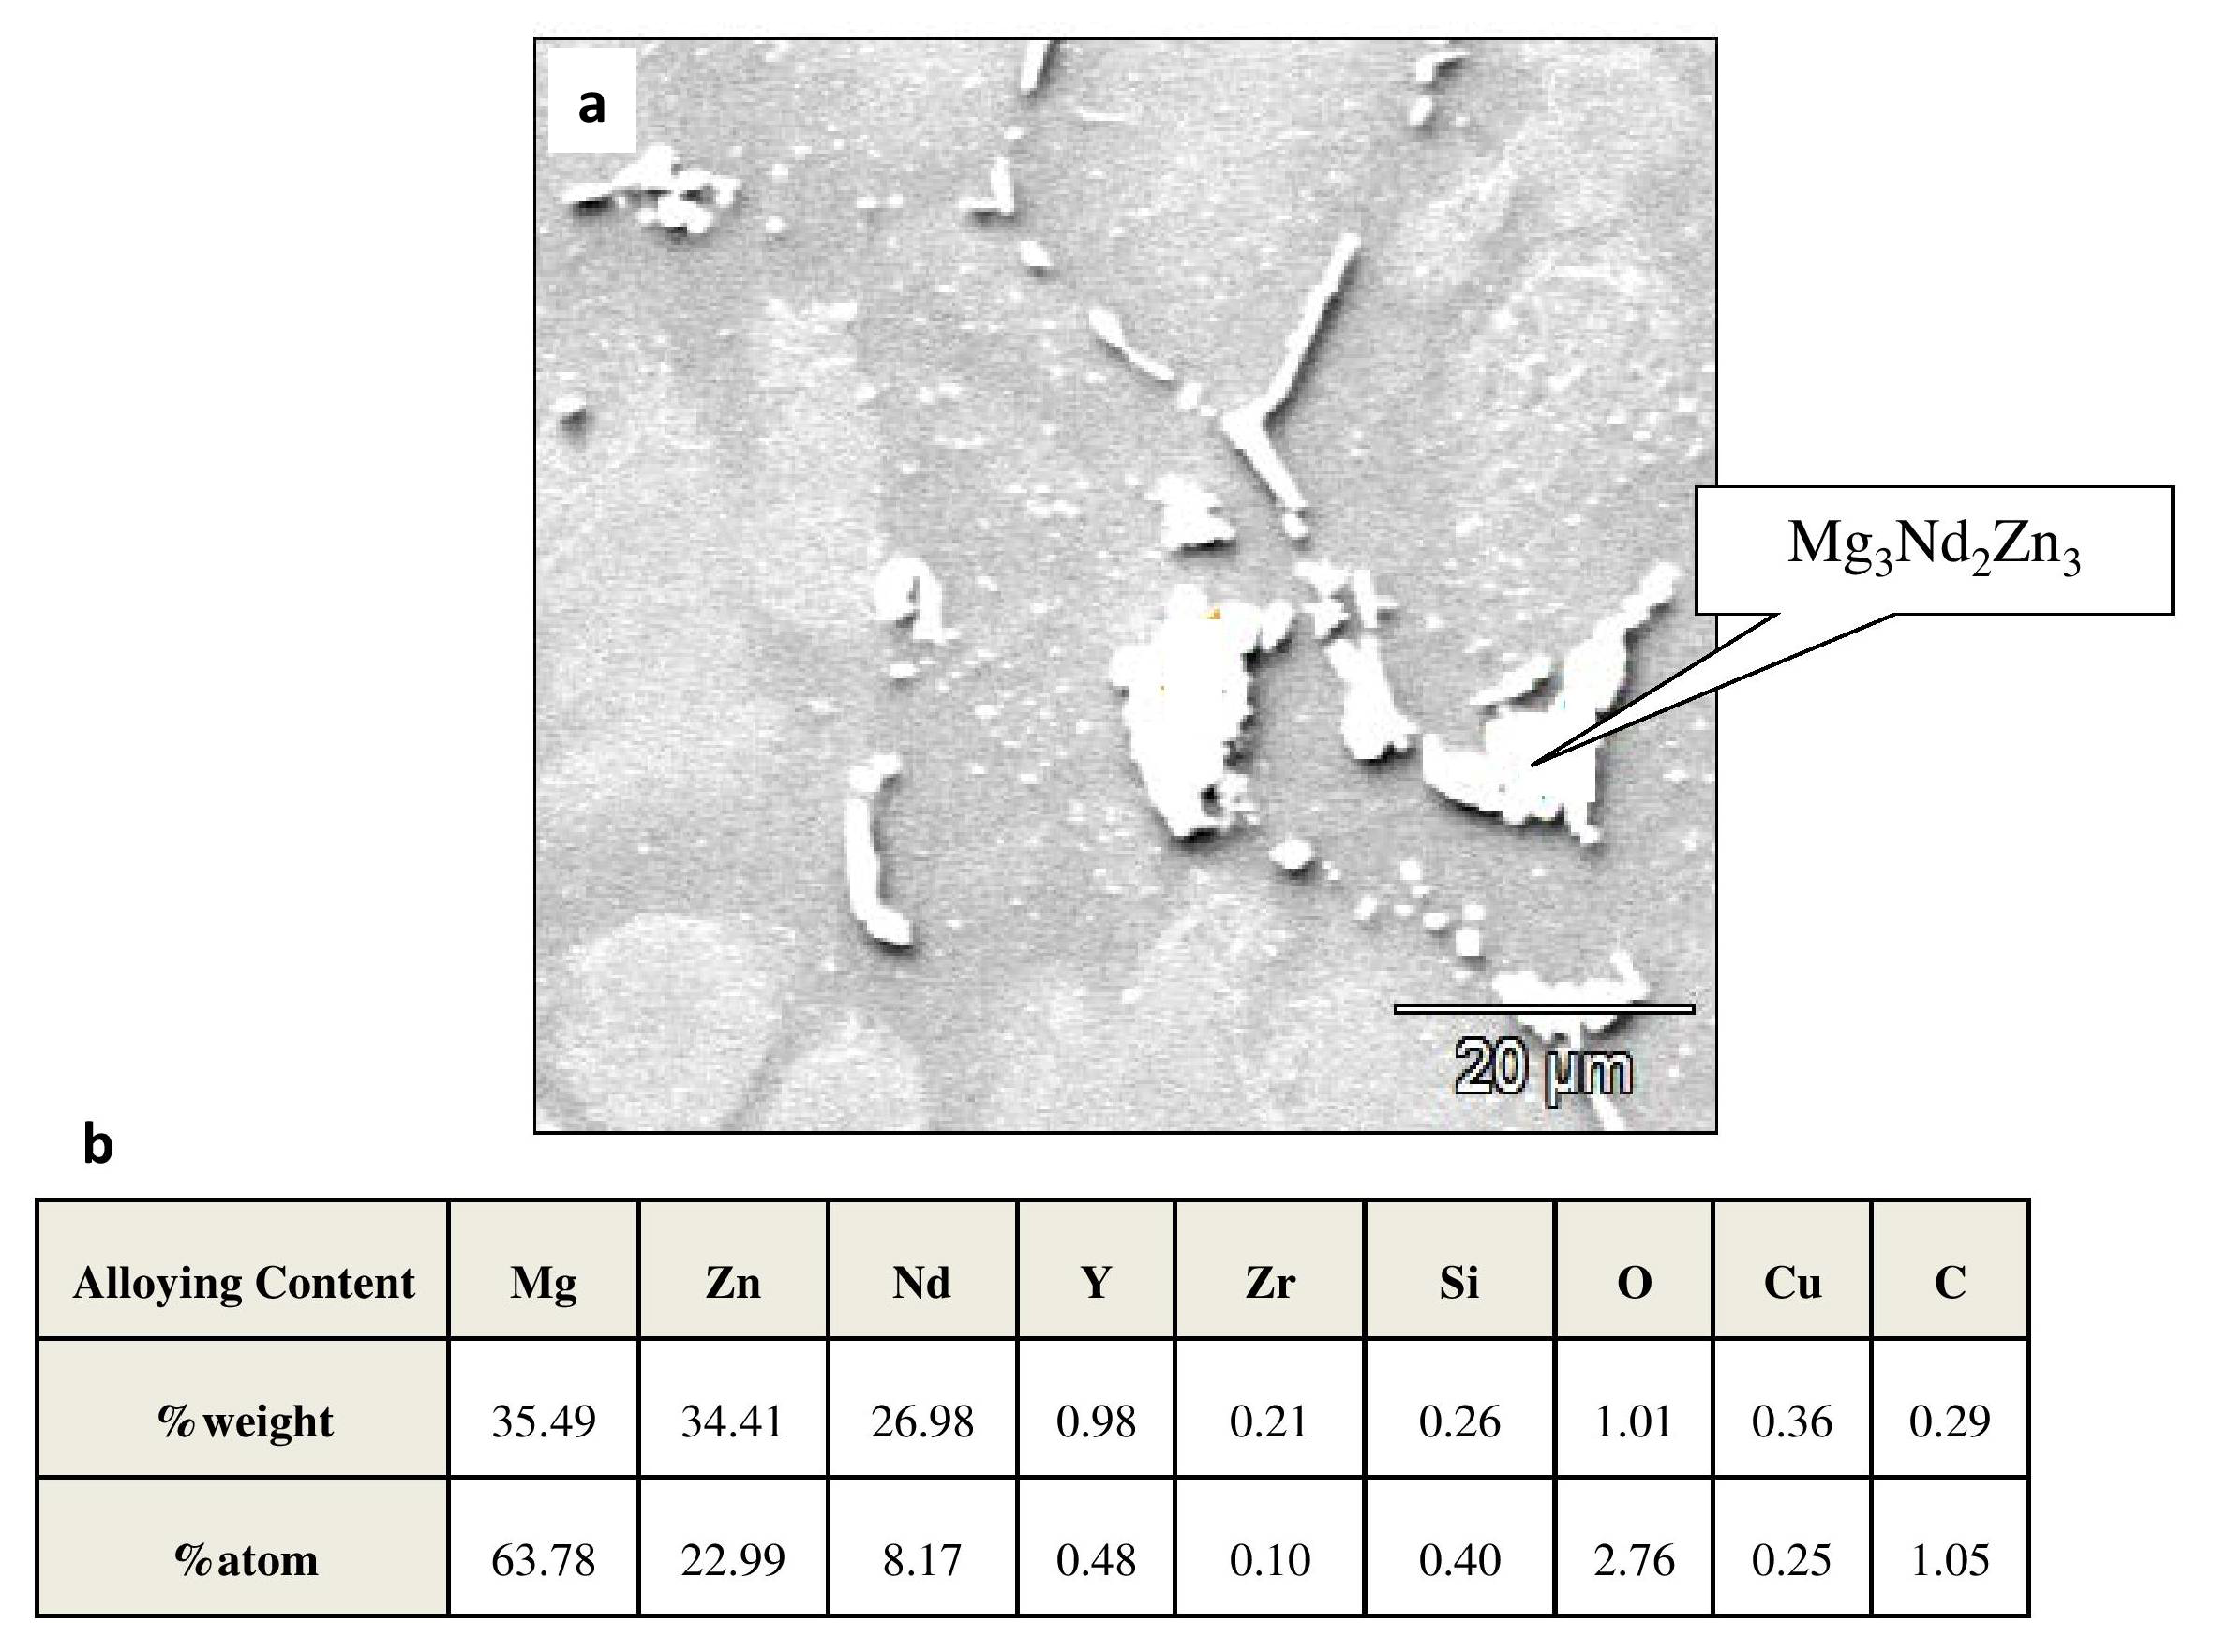
The microstructures of all the tested alloys as obtained by scanning electron microscopy (SEM) are shown in Figure 2. The α-Mg matrix dominated in the base alloy (Figure 2a), while Nd additions (Figure 2b–d) generated precipitations around the α-Mg grains. The grain boundary precipitates were identified as ternary phases in the form of Mg-Zn-Nd with a varied stoichiometry dependent upon the Nd concentration. Figure 3a,b shows magnified microstructures and a corresponding EDS analysis of the Mg-5%Zn-3%Nd alloy at a grain boundary, respectively. Based on the EDS analysis, the intermetallic compound generated at the grain boundaries was probably Mg3Nd2Zn3.
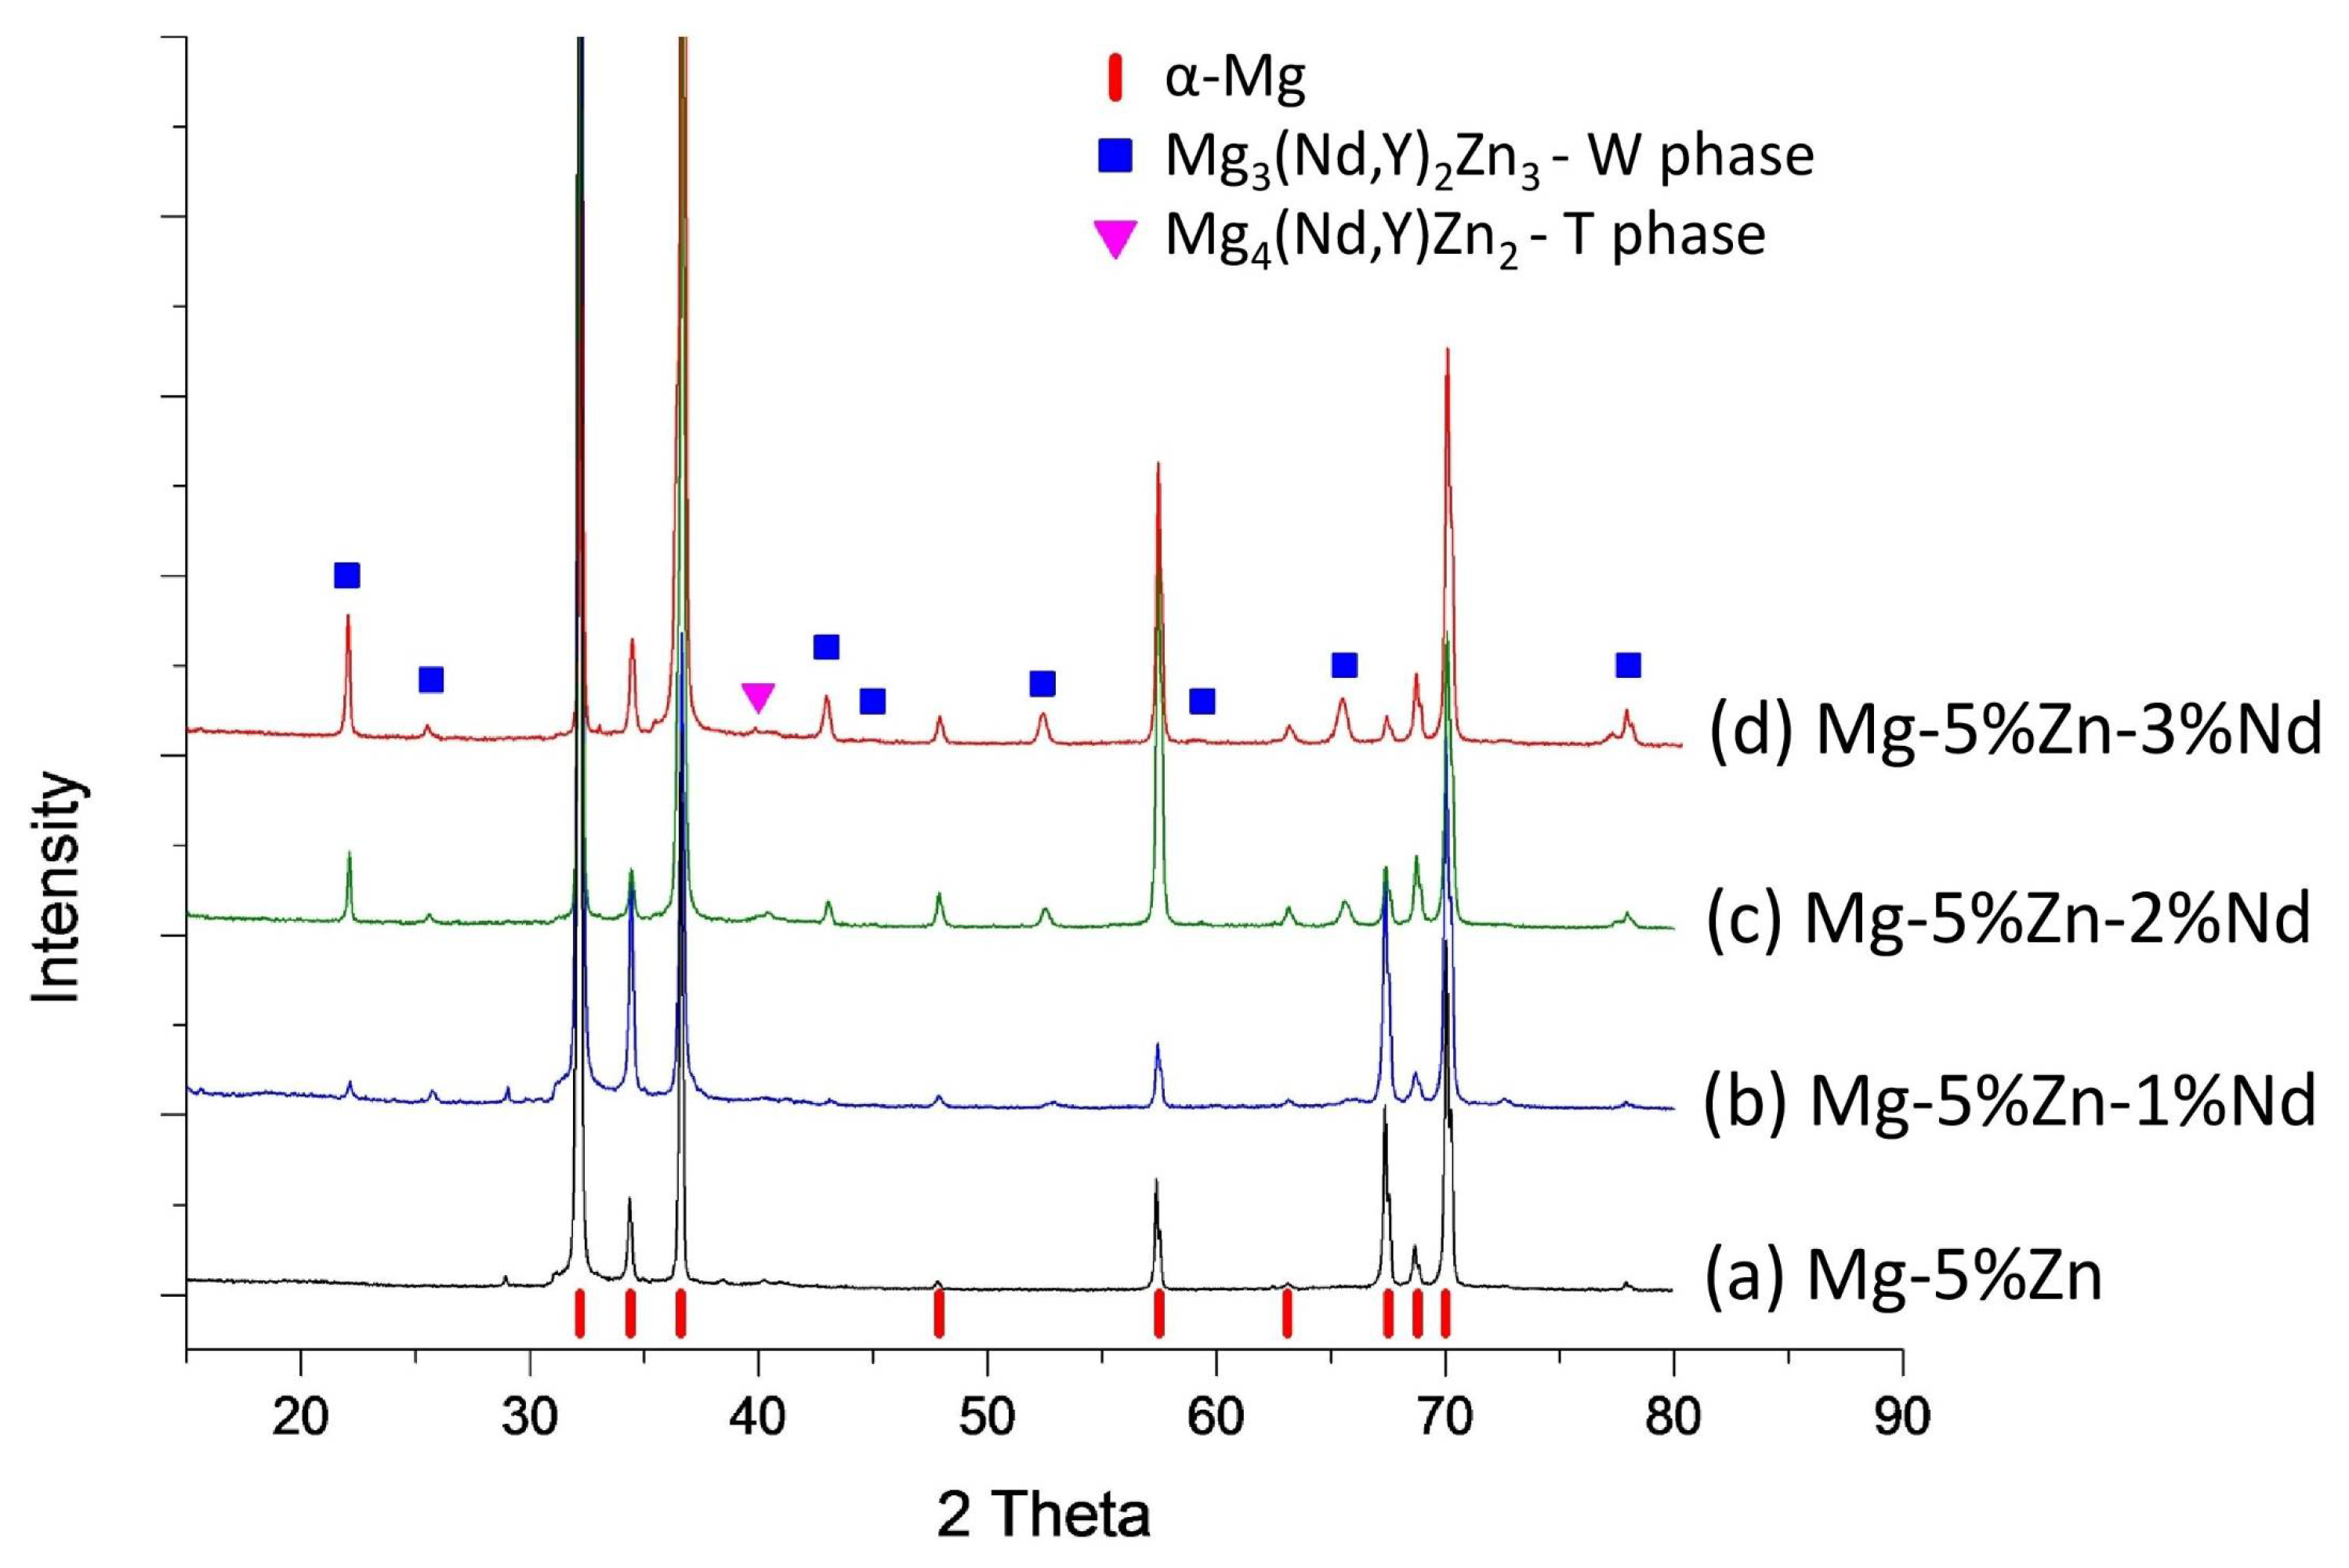
The X-ray diffraction (XRD) analyses of the tested alloys are shown in Figure 4. The only diffraction peaks identified in the Mg-5%Zn base alloy corresponds to the α-Mg matrix phase. Additions of 1 wt % and 2 wt % Nd produced a ternary phase, Mg3(Nd,Y)2Zn3, which was also identified by the EDS analysis. This phase has a similar diffraction pattern as the W-phase, discovered by others during investigations of the Mg-Zn-Y system [26,27,28]. This phase was found to possess a partially ordered AlMnCu2-type Face-Centered Cubic (FCC) structure, a lattice parameter of 6.848 Å and a space group of Fm-3m. However, the diffraction pattern related to Mg3(Nd,Y)2Zn3 exhibited a slight deviation towards lower diffraction angles, while the peak intensities were gradually intensified with the increased Nd content. The addition of 3%wt Nd to the base alloy resulted in a second ternary phase, Mg4(Nd,Y)Zn2, which was identified as T-phase, according to Yang et al. [29]. The T-phase is a c-centered orthorhombic structure with lattice parameters of a = 0.96 nm, b = 1.12 nm and c = 0.94 nm [30,31,32]. The varied lattice parameters of W-phase and the volume fraction of the intermetallic compounds (W and T-phases) of the tested alloys are summarized in Table 2. The volume fraction of the secondary phase was obtained by Rietveld method (Powder Cell for Windows, version 2.4). The crystal data for Mg3Y2Zn3 phase, (W phase), lattice parameter and atomic position were obtained from Pearson’s Crystal Data. The presence of Nd (instead of Y) in the tested alloys was taken into consideration during the data processing. The obtained results indicate that an increase of up to 3 wt % Nd content enlarged the lattice parameter from 6.931 Å to 6.986 Å and increased the volume fraction of intermetallic compounds (2–5.5%).
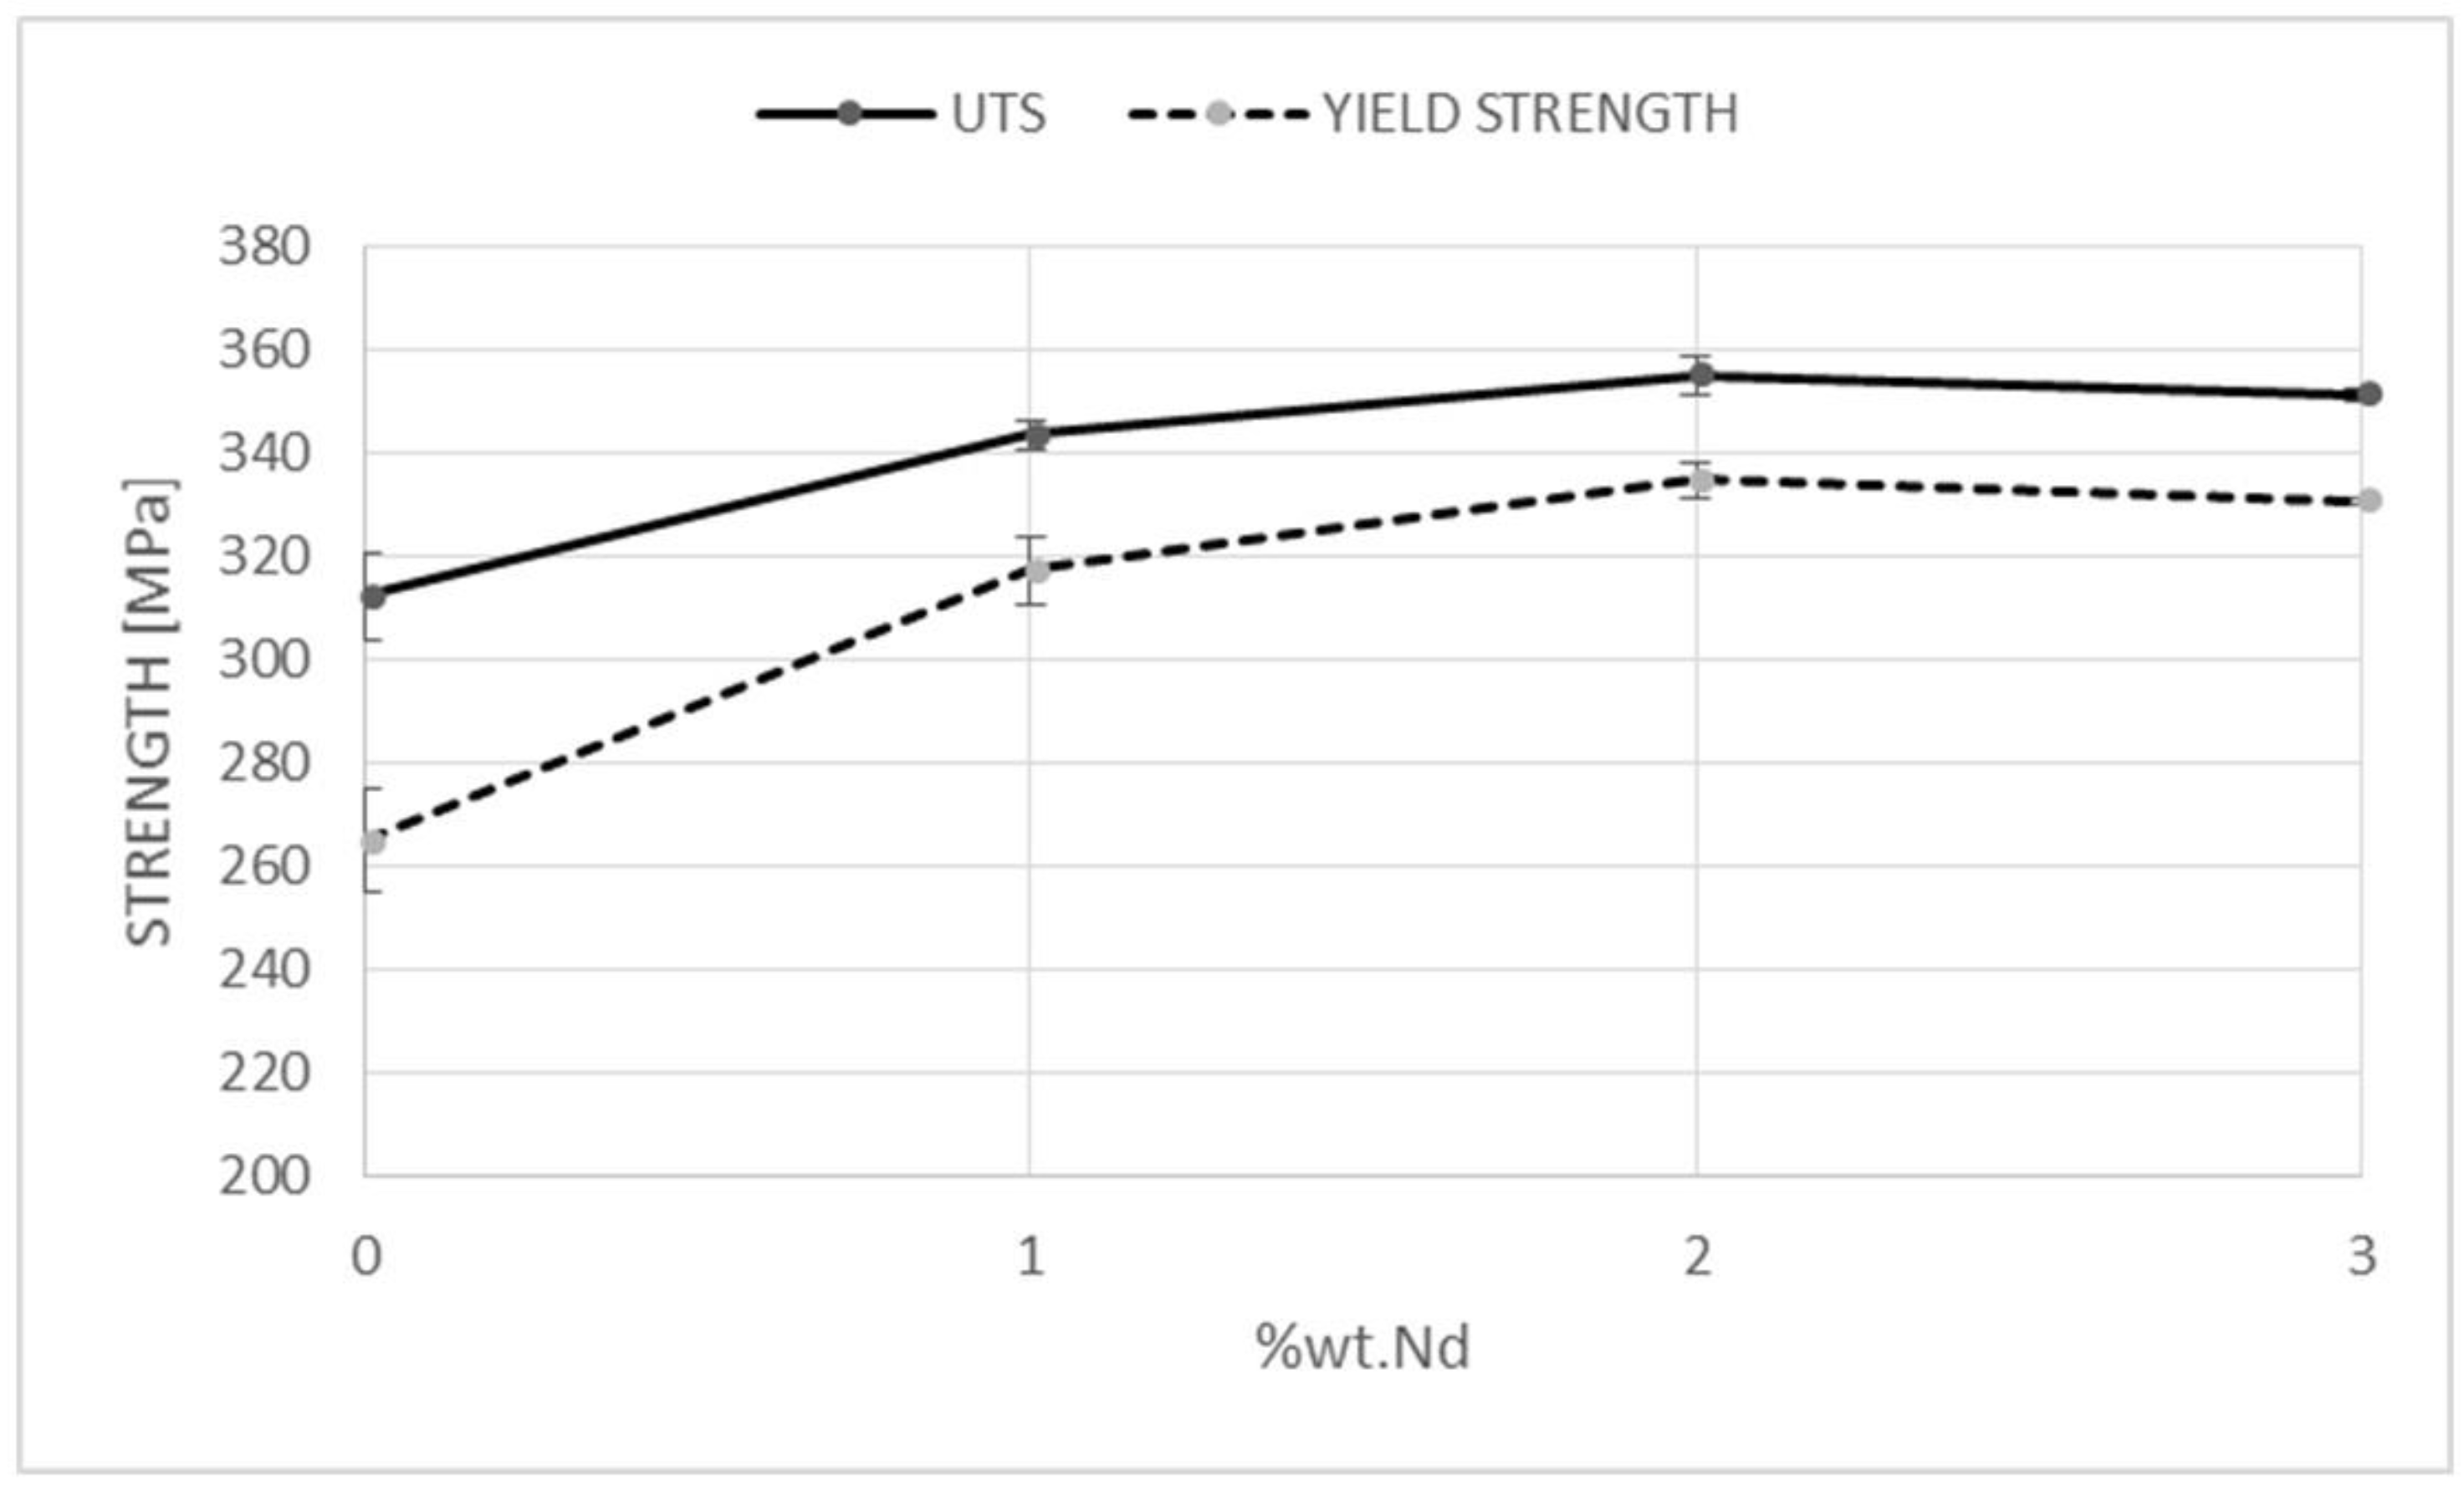
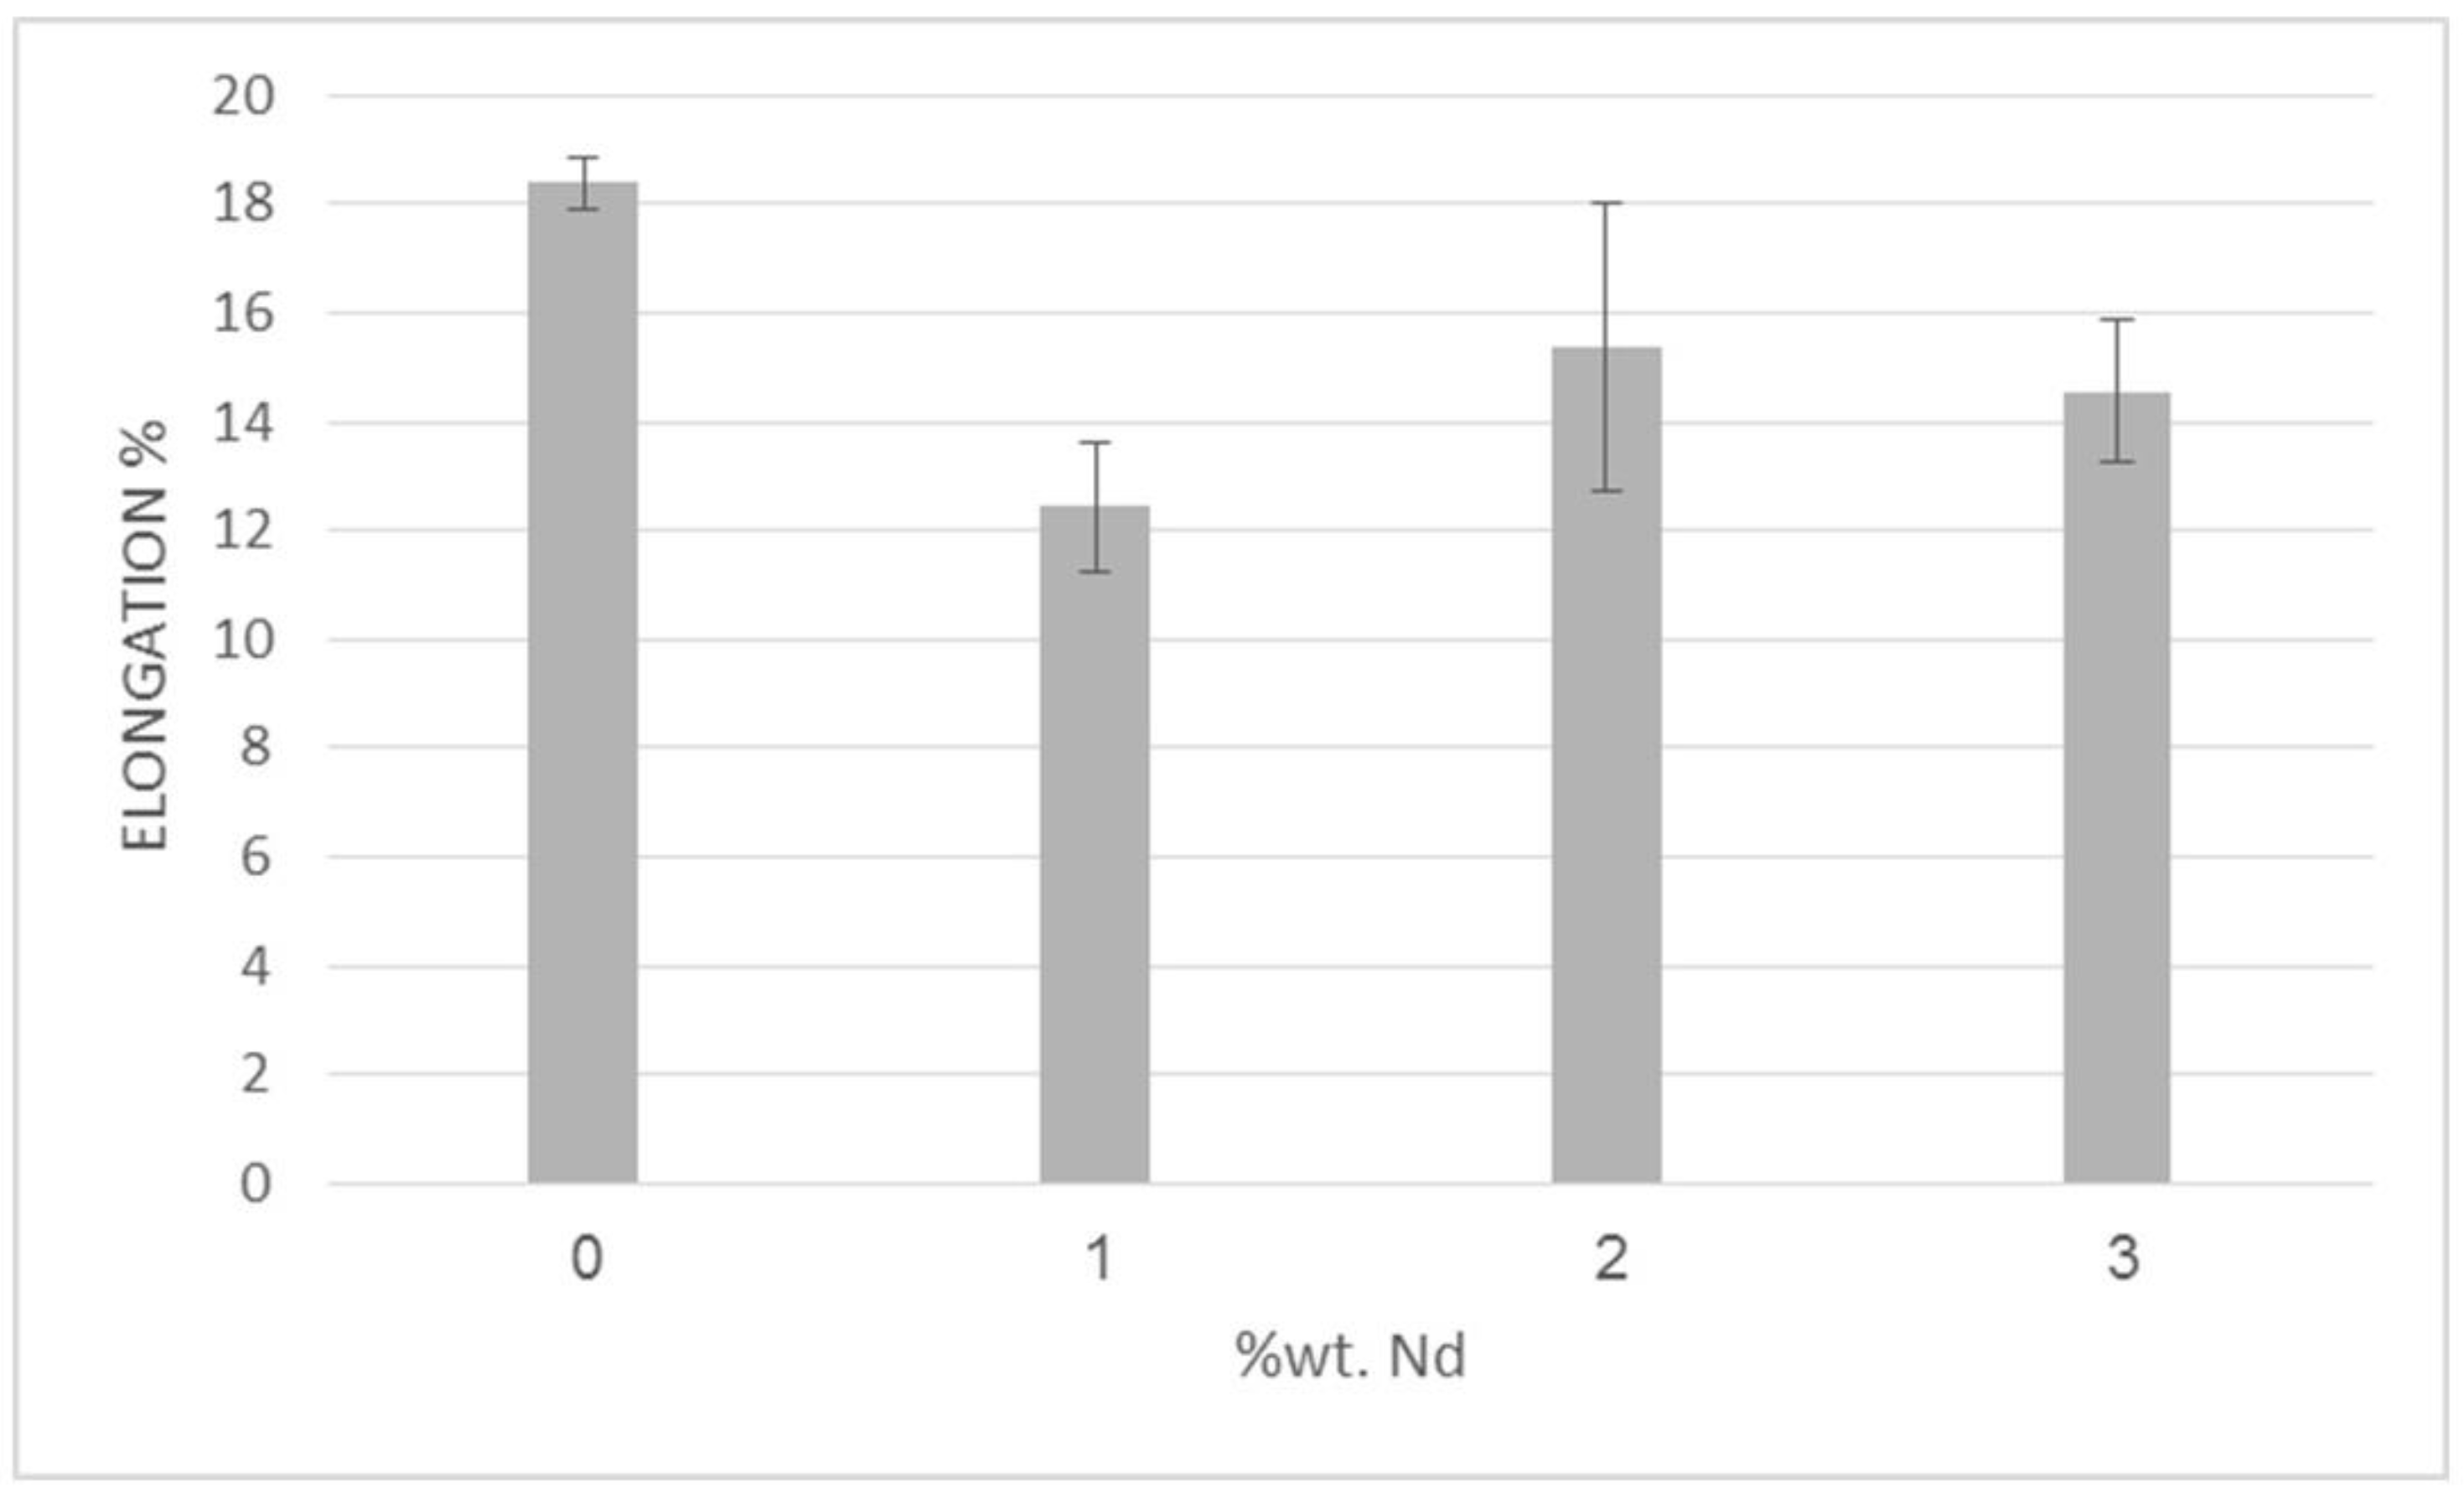
The mechanical properties in terms of hardness measurements, yield strength (YS), ultimate tensile strength (UTS) and elongation as a function of Nd content are shown in Table 3, Figure 5 and Figure 6, respectively. In general, hardness was associated with tensile strength. Figure 5 shows that the addition of up to 2%wt Nd increases the YS and UTS, while further addition of up to 3%wt Nd does not have a significant effect, as indicated by the plateau shown above 2%wt Nd. However, an interesting phenomenon related to the ductility behavior of the tested alloys is shown in Figure 6. Whereas the increase in strength of the Mg-5%Zn-1%Nd alloy relative to the base alloy corresponded with a reduction in elongation, as expected, to the minimum value of 12%, elongation increased to 16% when the Nd content reached 2%wt, while this alloy exhibited the highest UTS (360 MPa) and YS (340 MPa). Elongation was reduced in the Mg-5%Zn-3%Nd alloy even though the strength of the 2 and 3%wt Nd alloys was similar.
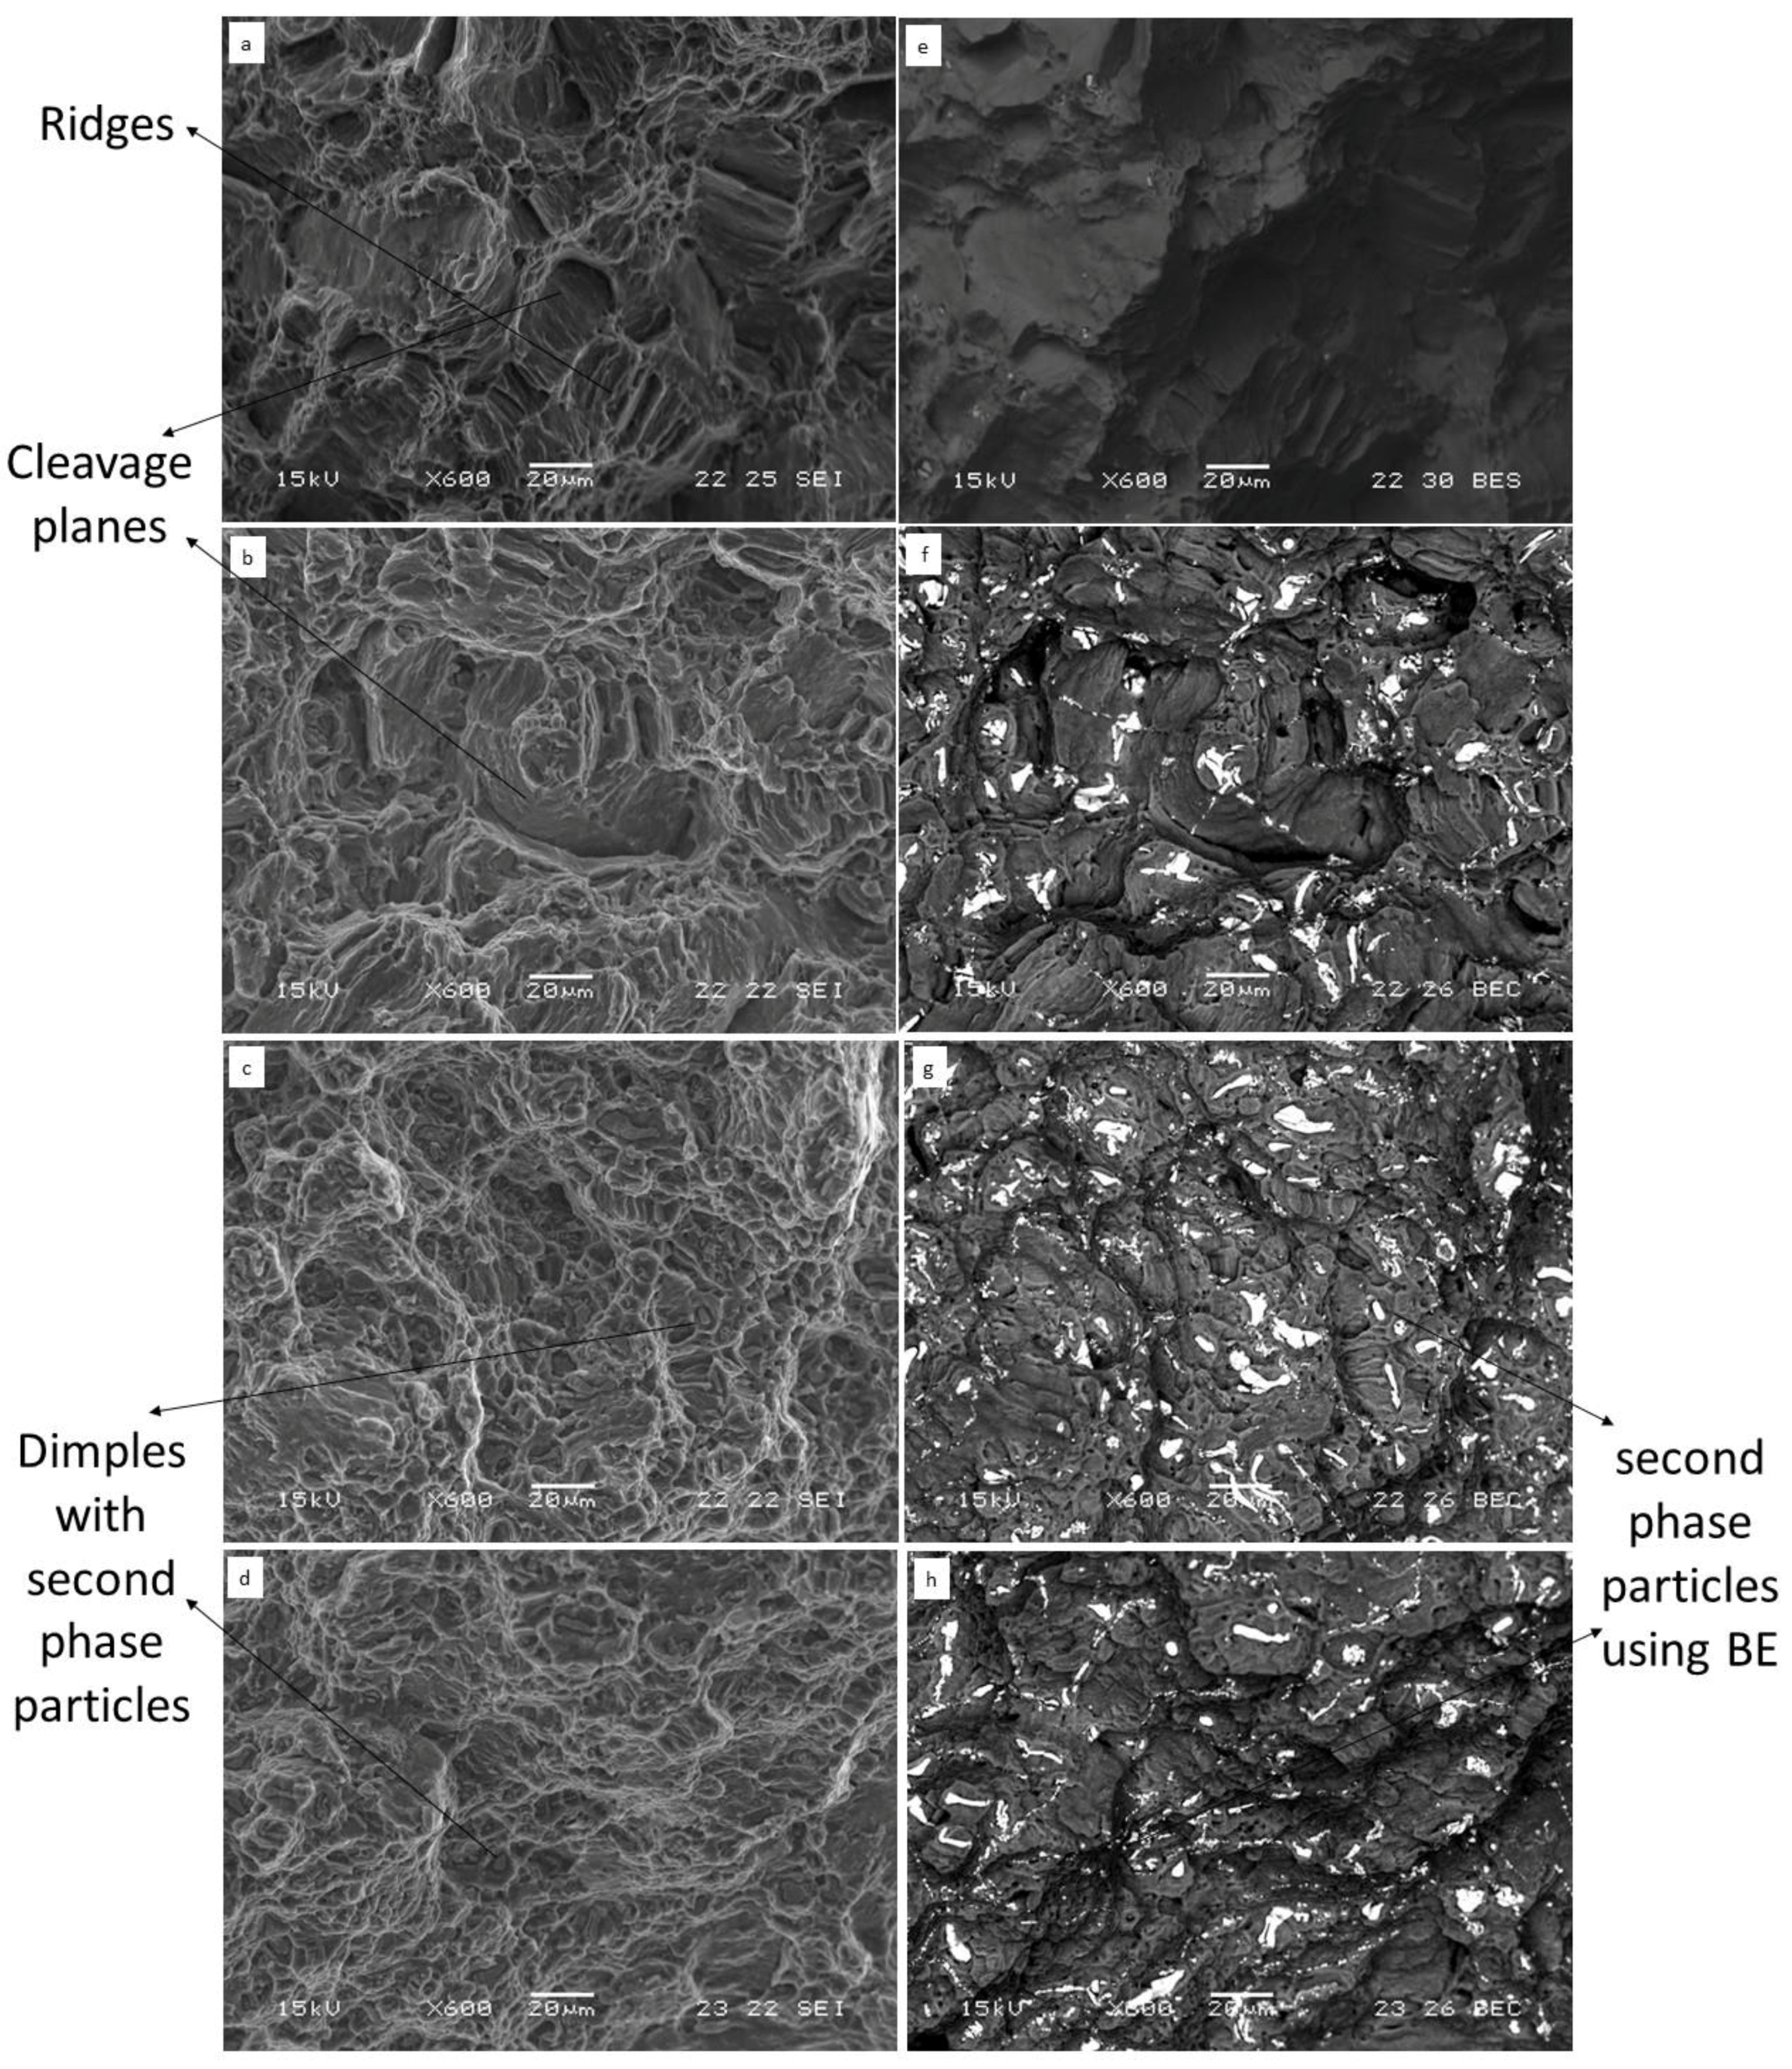
The fracture surfaces of the tensile samples were analyzed in order to corroborate the mechanical properties. Figure 7 shows fracture surface SEM images of all the tested alloys. The fracture surface of the base alloy, shown in Figure 7a,b, revealed cleavage planes covered with shallow dimples and several well-developed dimples. The addition of 1%wt Nd to the base alloy enhanced the brittle features in the fracture surface, as the dimple islands contained more superficial dimples with particles at their bottom, as shown in Figure 7c. The backscattered electron image of this alloy, shown in Figure 7d, revealed particles composed of heavier elements, namely Nd-containing intermetallic compounds that probably relate to W-phase. When the Nd content was raised to 2%wt, the number of dimples was dramatically increased and most of the dimples contained particles of the secondary phase. For this alloy, cleavage planes were scarcely detectable, as shown in Figure 7e,f. The fracture surface images of the 3% Nd alloy, shown in Figure 7g,h, revealed smaller and fewer dimples as compared to Mg-5%Zn-2%Nd alloy, which is an indication of a relative reduction in ductility.
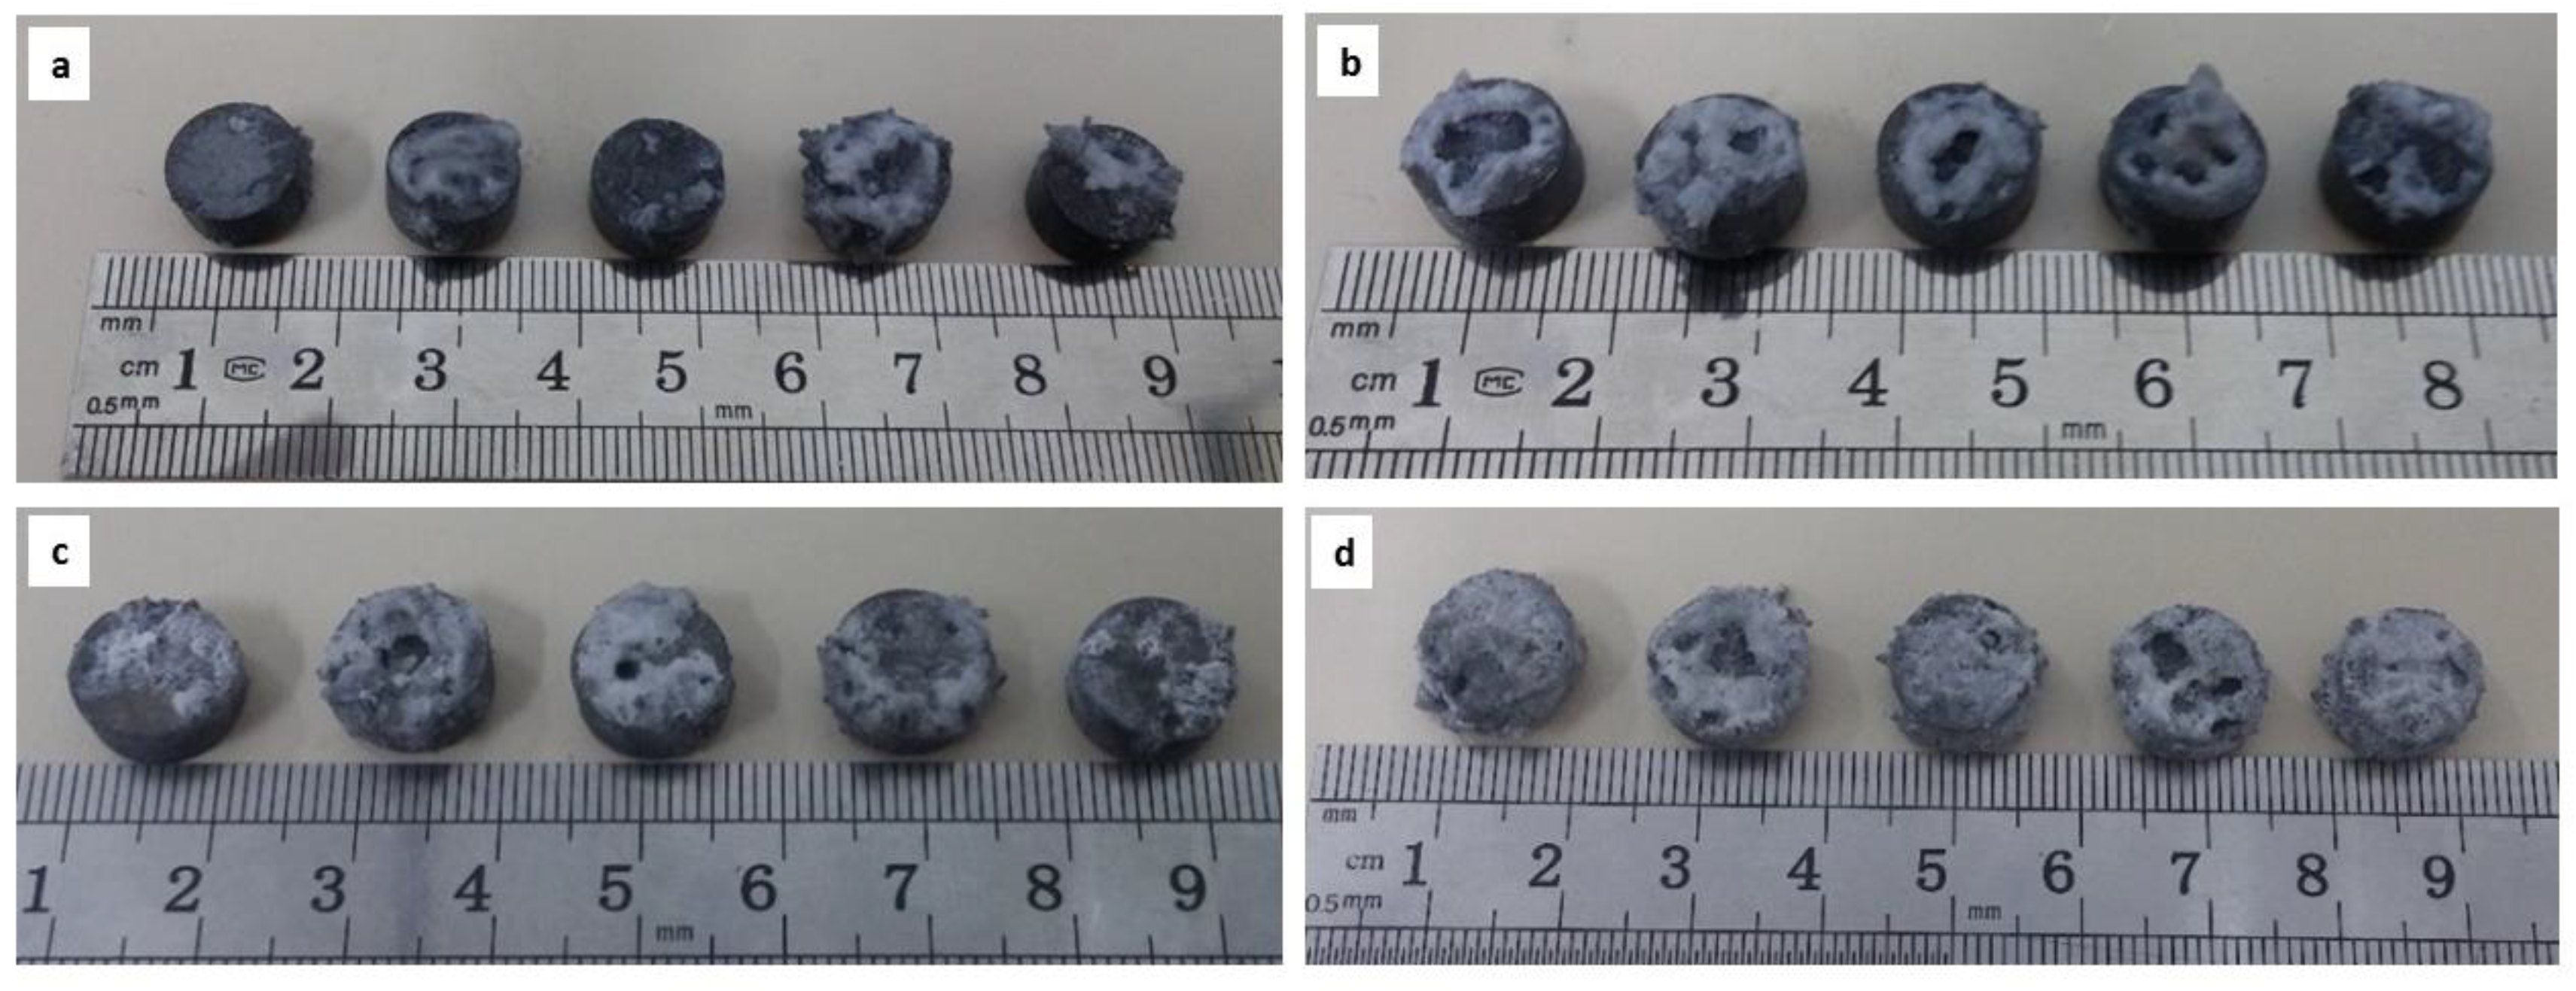
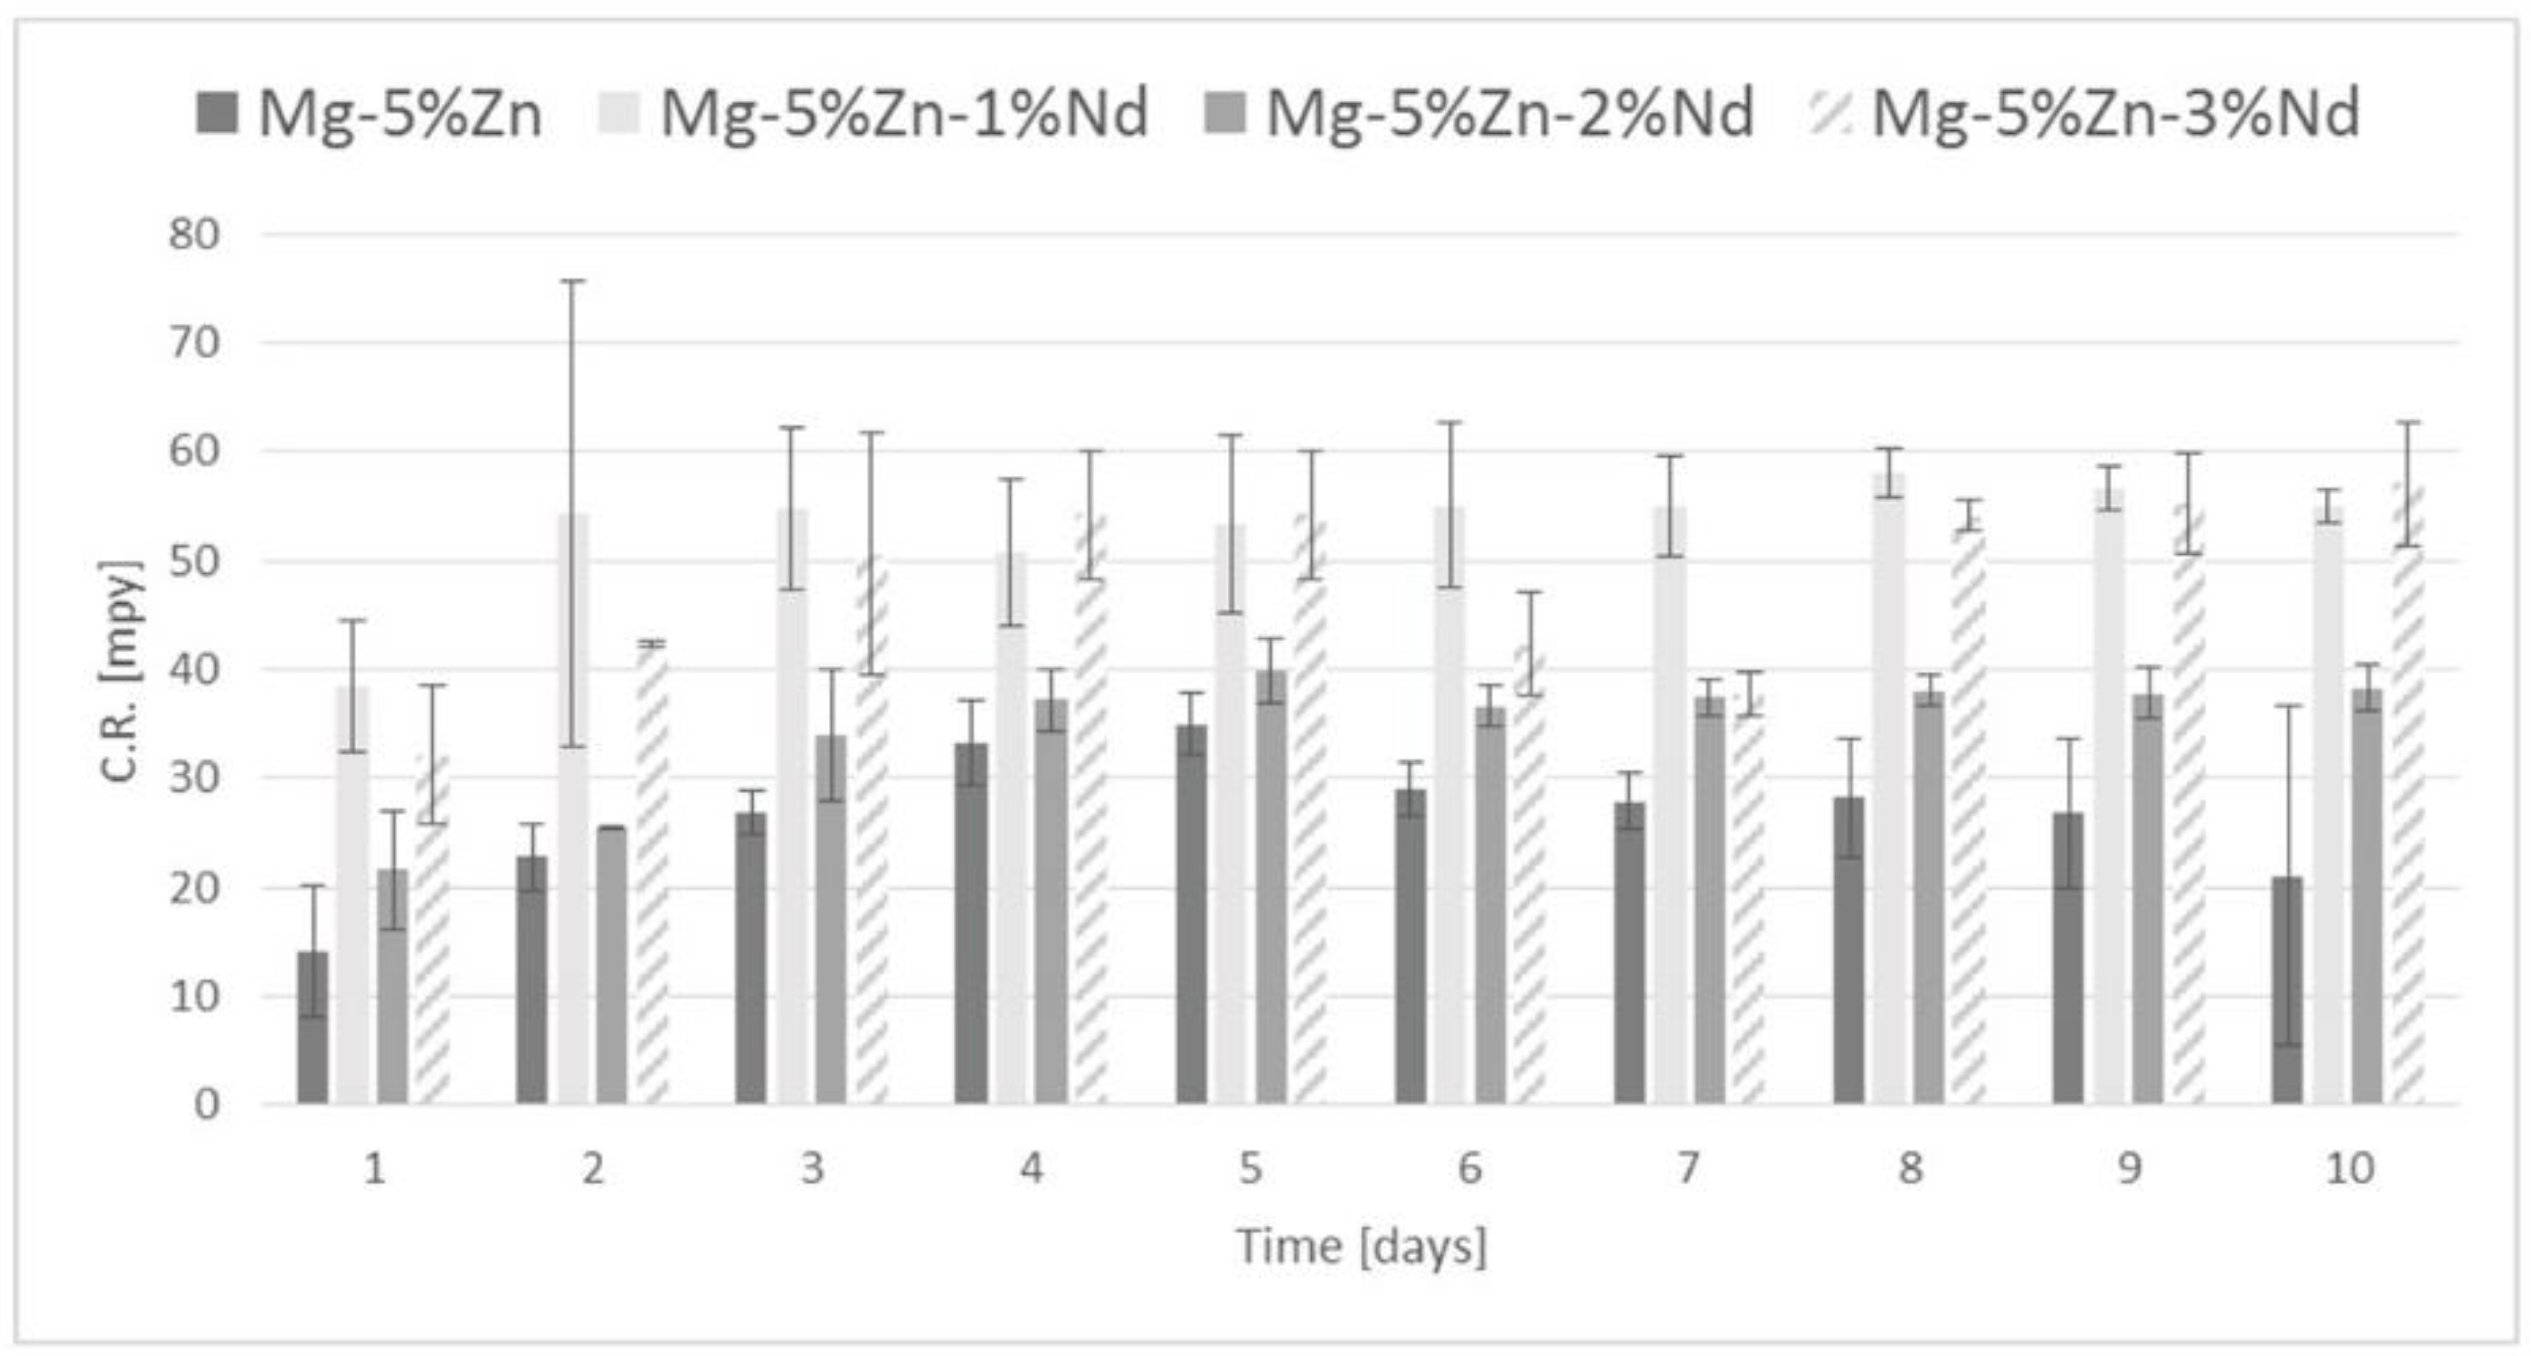
The corrosion performance of the tested alloys was visually examined after immersion in PBS solution (phosphate-buffered saline) at 37 °C for 10 days, as shown in Figure 8. A general corrosion attack is apparent at the surface of all specimens. This qualitative result is supported by the corrosion rate measurements based upon the amount of evolved hydrogen gas as a function of immersion time, as shown in Figure 9. The calculated corrosion resistance of all the tested alloys was similar and within the range of 20–60 mpy, which can be considered as suitable for biodegradable applications.
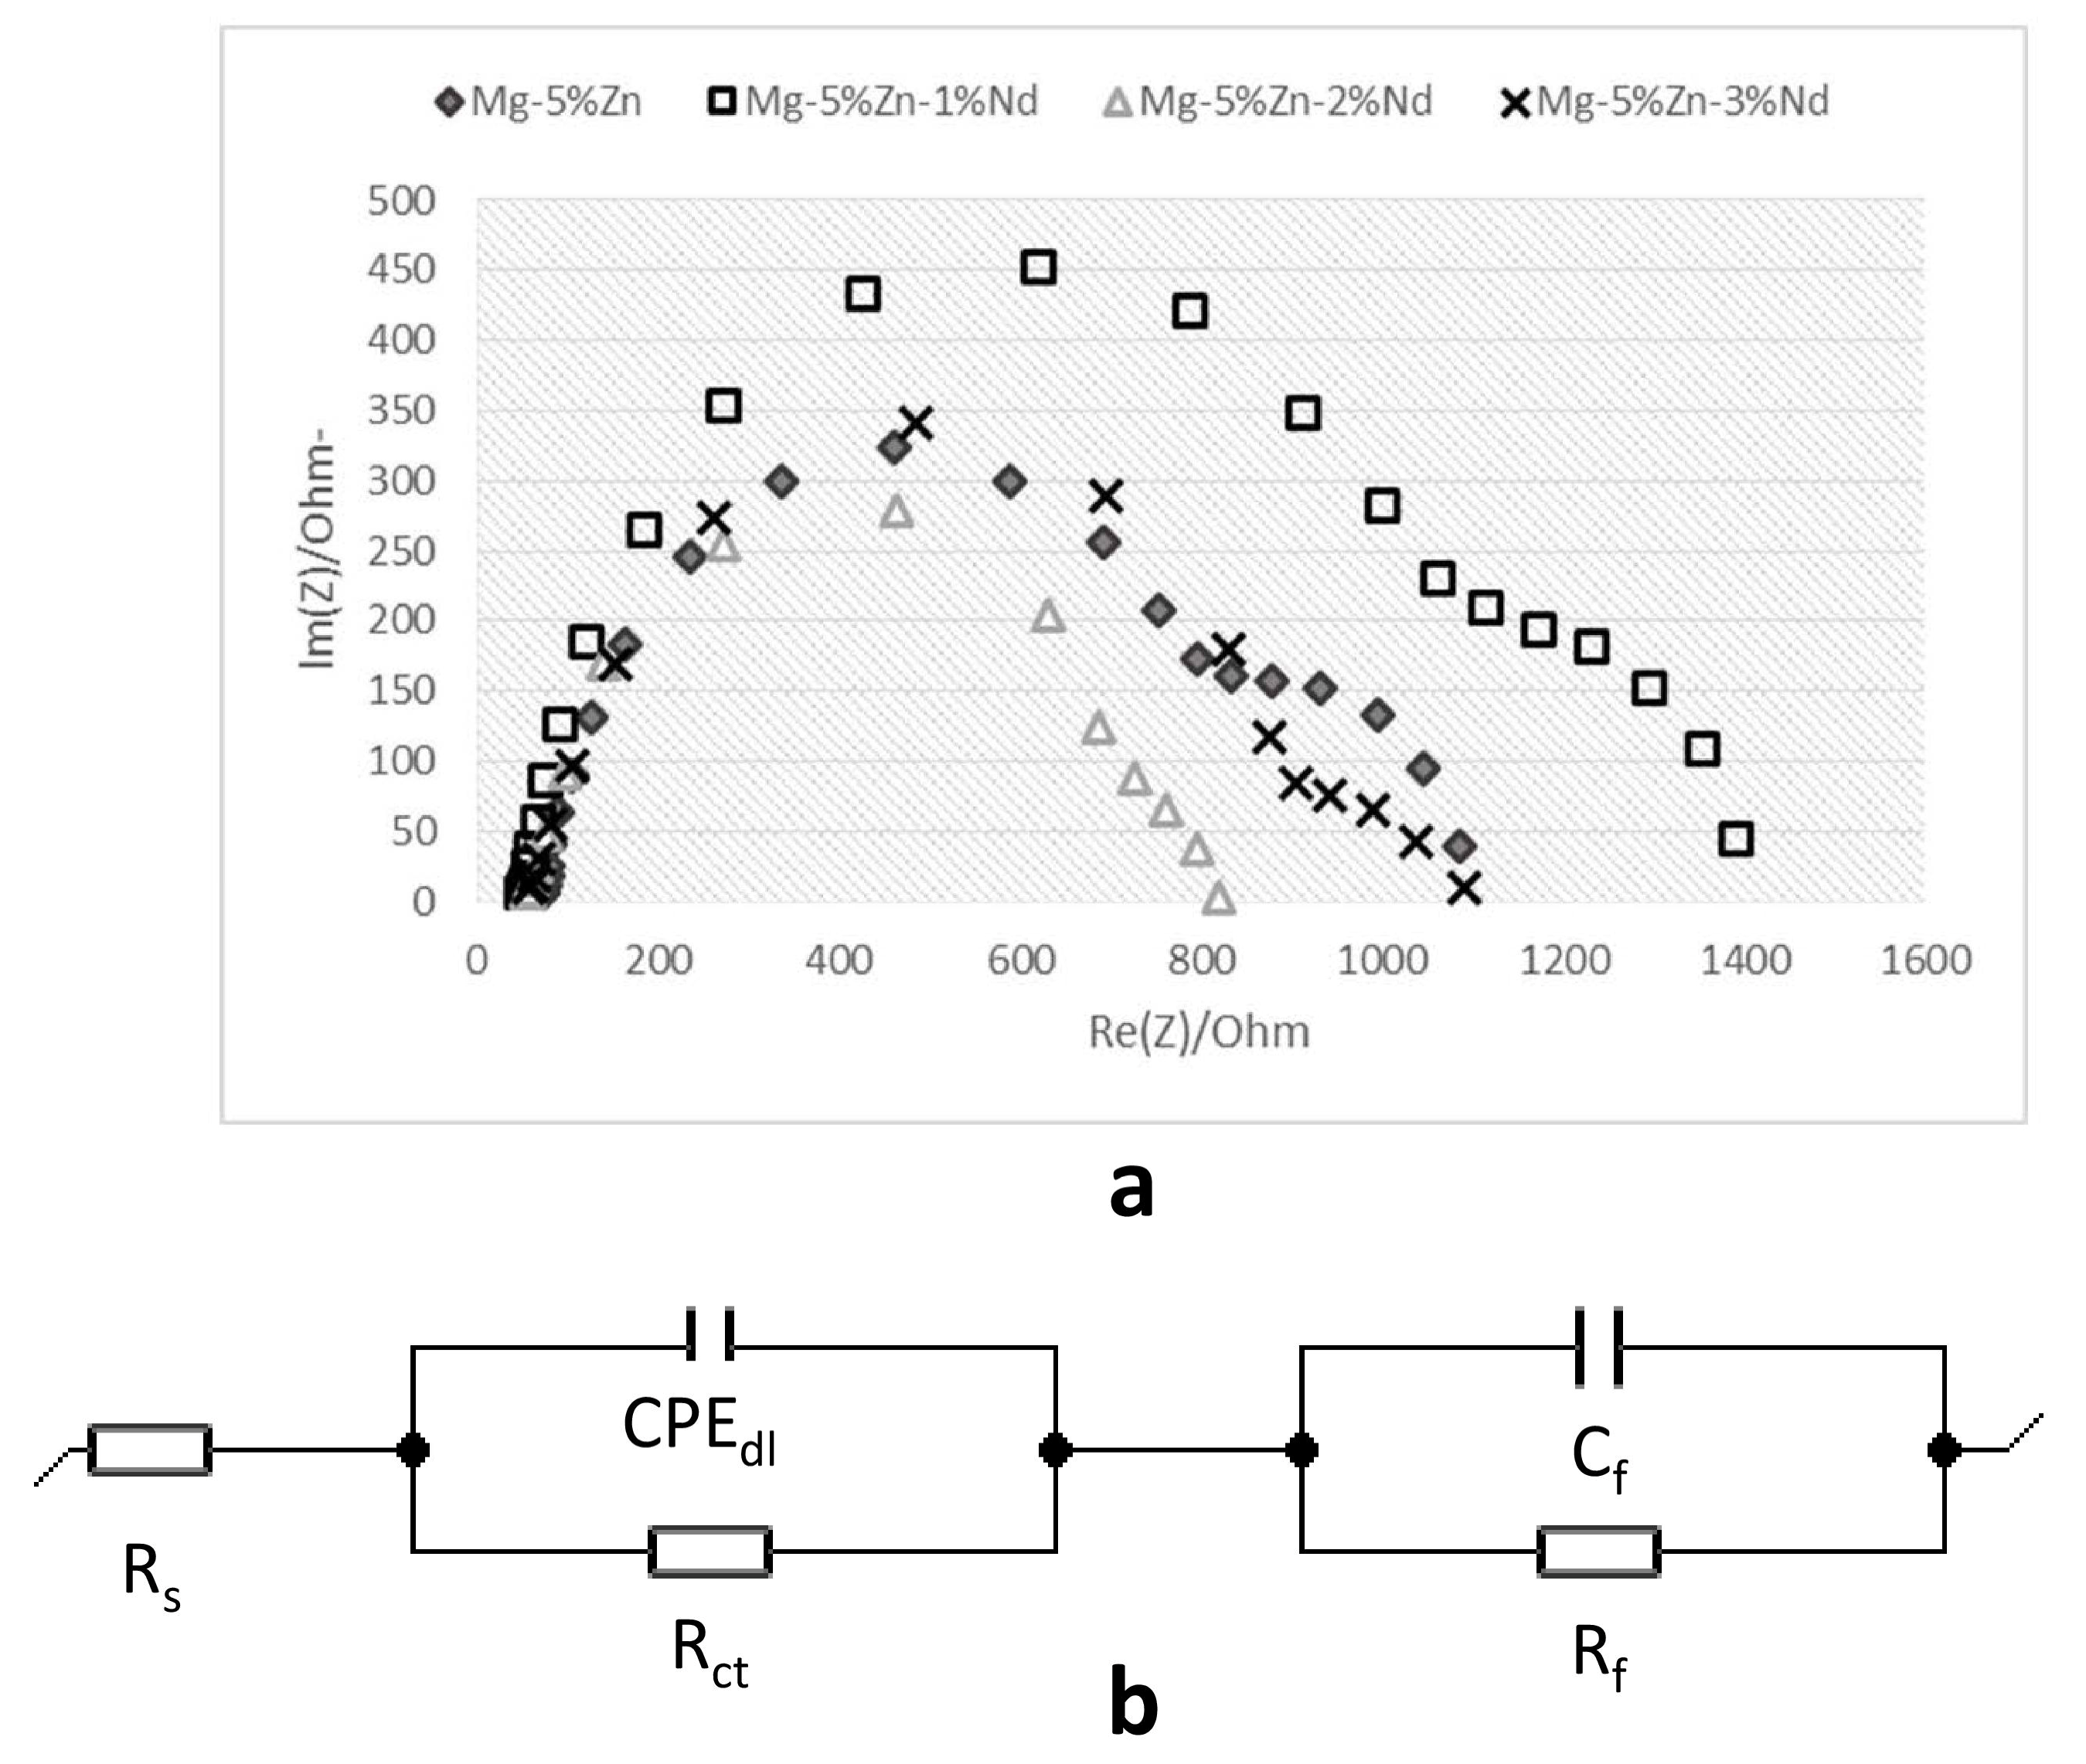
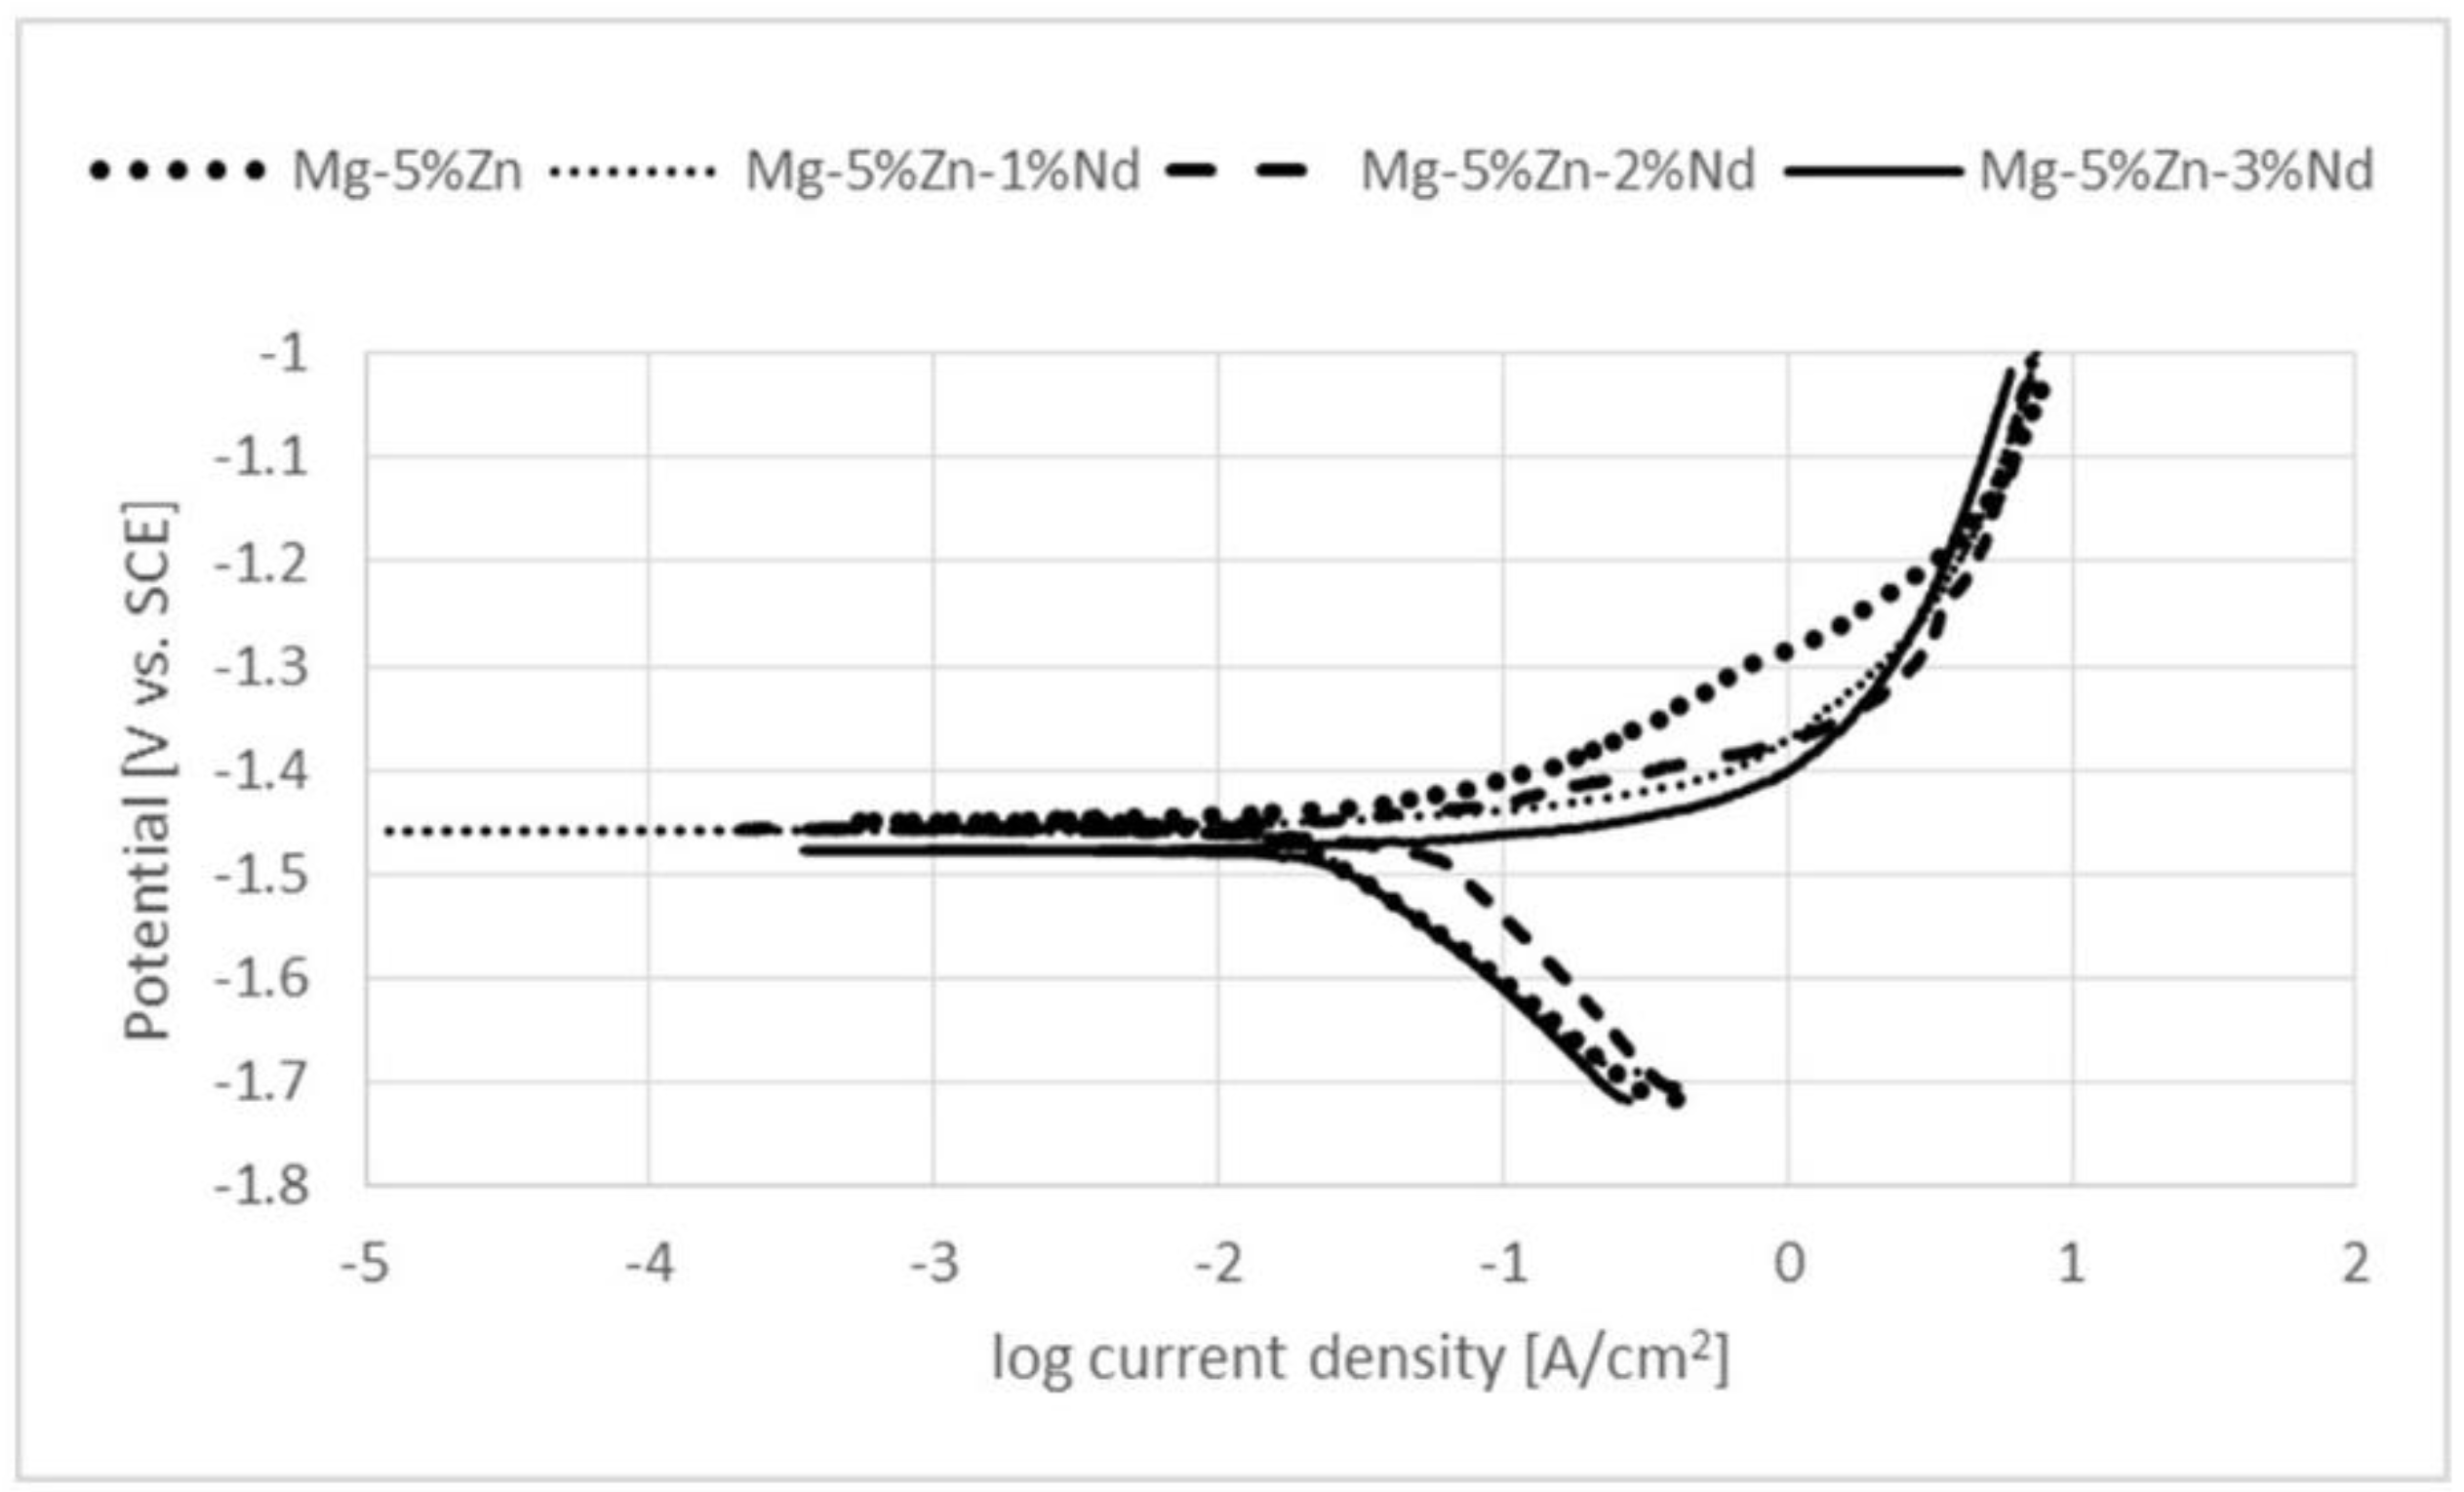
Electrochemical impedance spectra (EIS) of all the tested alloys along with the related equivalent circuit are shown in Figure 10a,b, respectively. The Nyquist plots of all the alloys exhibited similar EIS spectra, which were characterized by two loops: a capacitive loop in the high frequency region (HF) and a capacitive loop in the medium frequency region (MF), as labeled. The high frequency capacitive loop represents the dissolution of Mg and the electric double layer capacitance, Cdl, at the interface between the electrolyte solution and the substrate [33]. The medium frequency capacitive loop represents the surface film generated during the dissolution of Mg. The EIS spectra can be further analyzed based on the equivalent circuit [15] as indicated in Figure 10b where Rs represents the corrosive solution resistance. The electrode reaction process correlated to the high frequency capacitive loop is represented by Rct, the charge transfer resistance and by CPEdl. The CPE, constant phase element, is related to Cdl and was used due to the homogeneity limitations of the system. The Rf and Cf elements, shown in Figure 10b, represent the resistance and capacity of the corrosion product layer generated on the surface of Mg-Zn alloys with additions of Nd, respectively. The resemblance between the radius and shape of the loops is indicative of the similar corrosion mechanisms and corrosion resistance for all the tested alloys [34]. The corrosion resistance of the examined alloys was further evaluated using potentiodynamic polarization test in the PBS solution, as shown in Figure 11. According to Tafel extrapolation, the obtained corrosion potential (Ecorr) of Mg-5%Zn, Mg-5%Zn-1%Nd, Mg-5%Zn-2%Nd and Mg-5%Zn-3%Nd alloys were: −1.44 V, −1.46 V, −1.45 V, −1.48 V, respectively. This data along with the corrosion current density (Icorr) and the corrosion rates obtained by Tafel extrapolation, listed in Table 4, demonstrates a similar corrosion resistance for all the tested alloys. This indicates a negligible effect of Nd additions on the corrosion resistance, which is in agreement with the corrosion assessment obtained by the immersion test and EIS analysis.
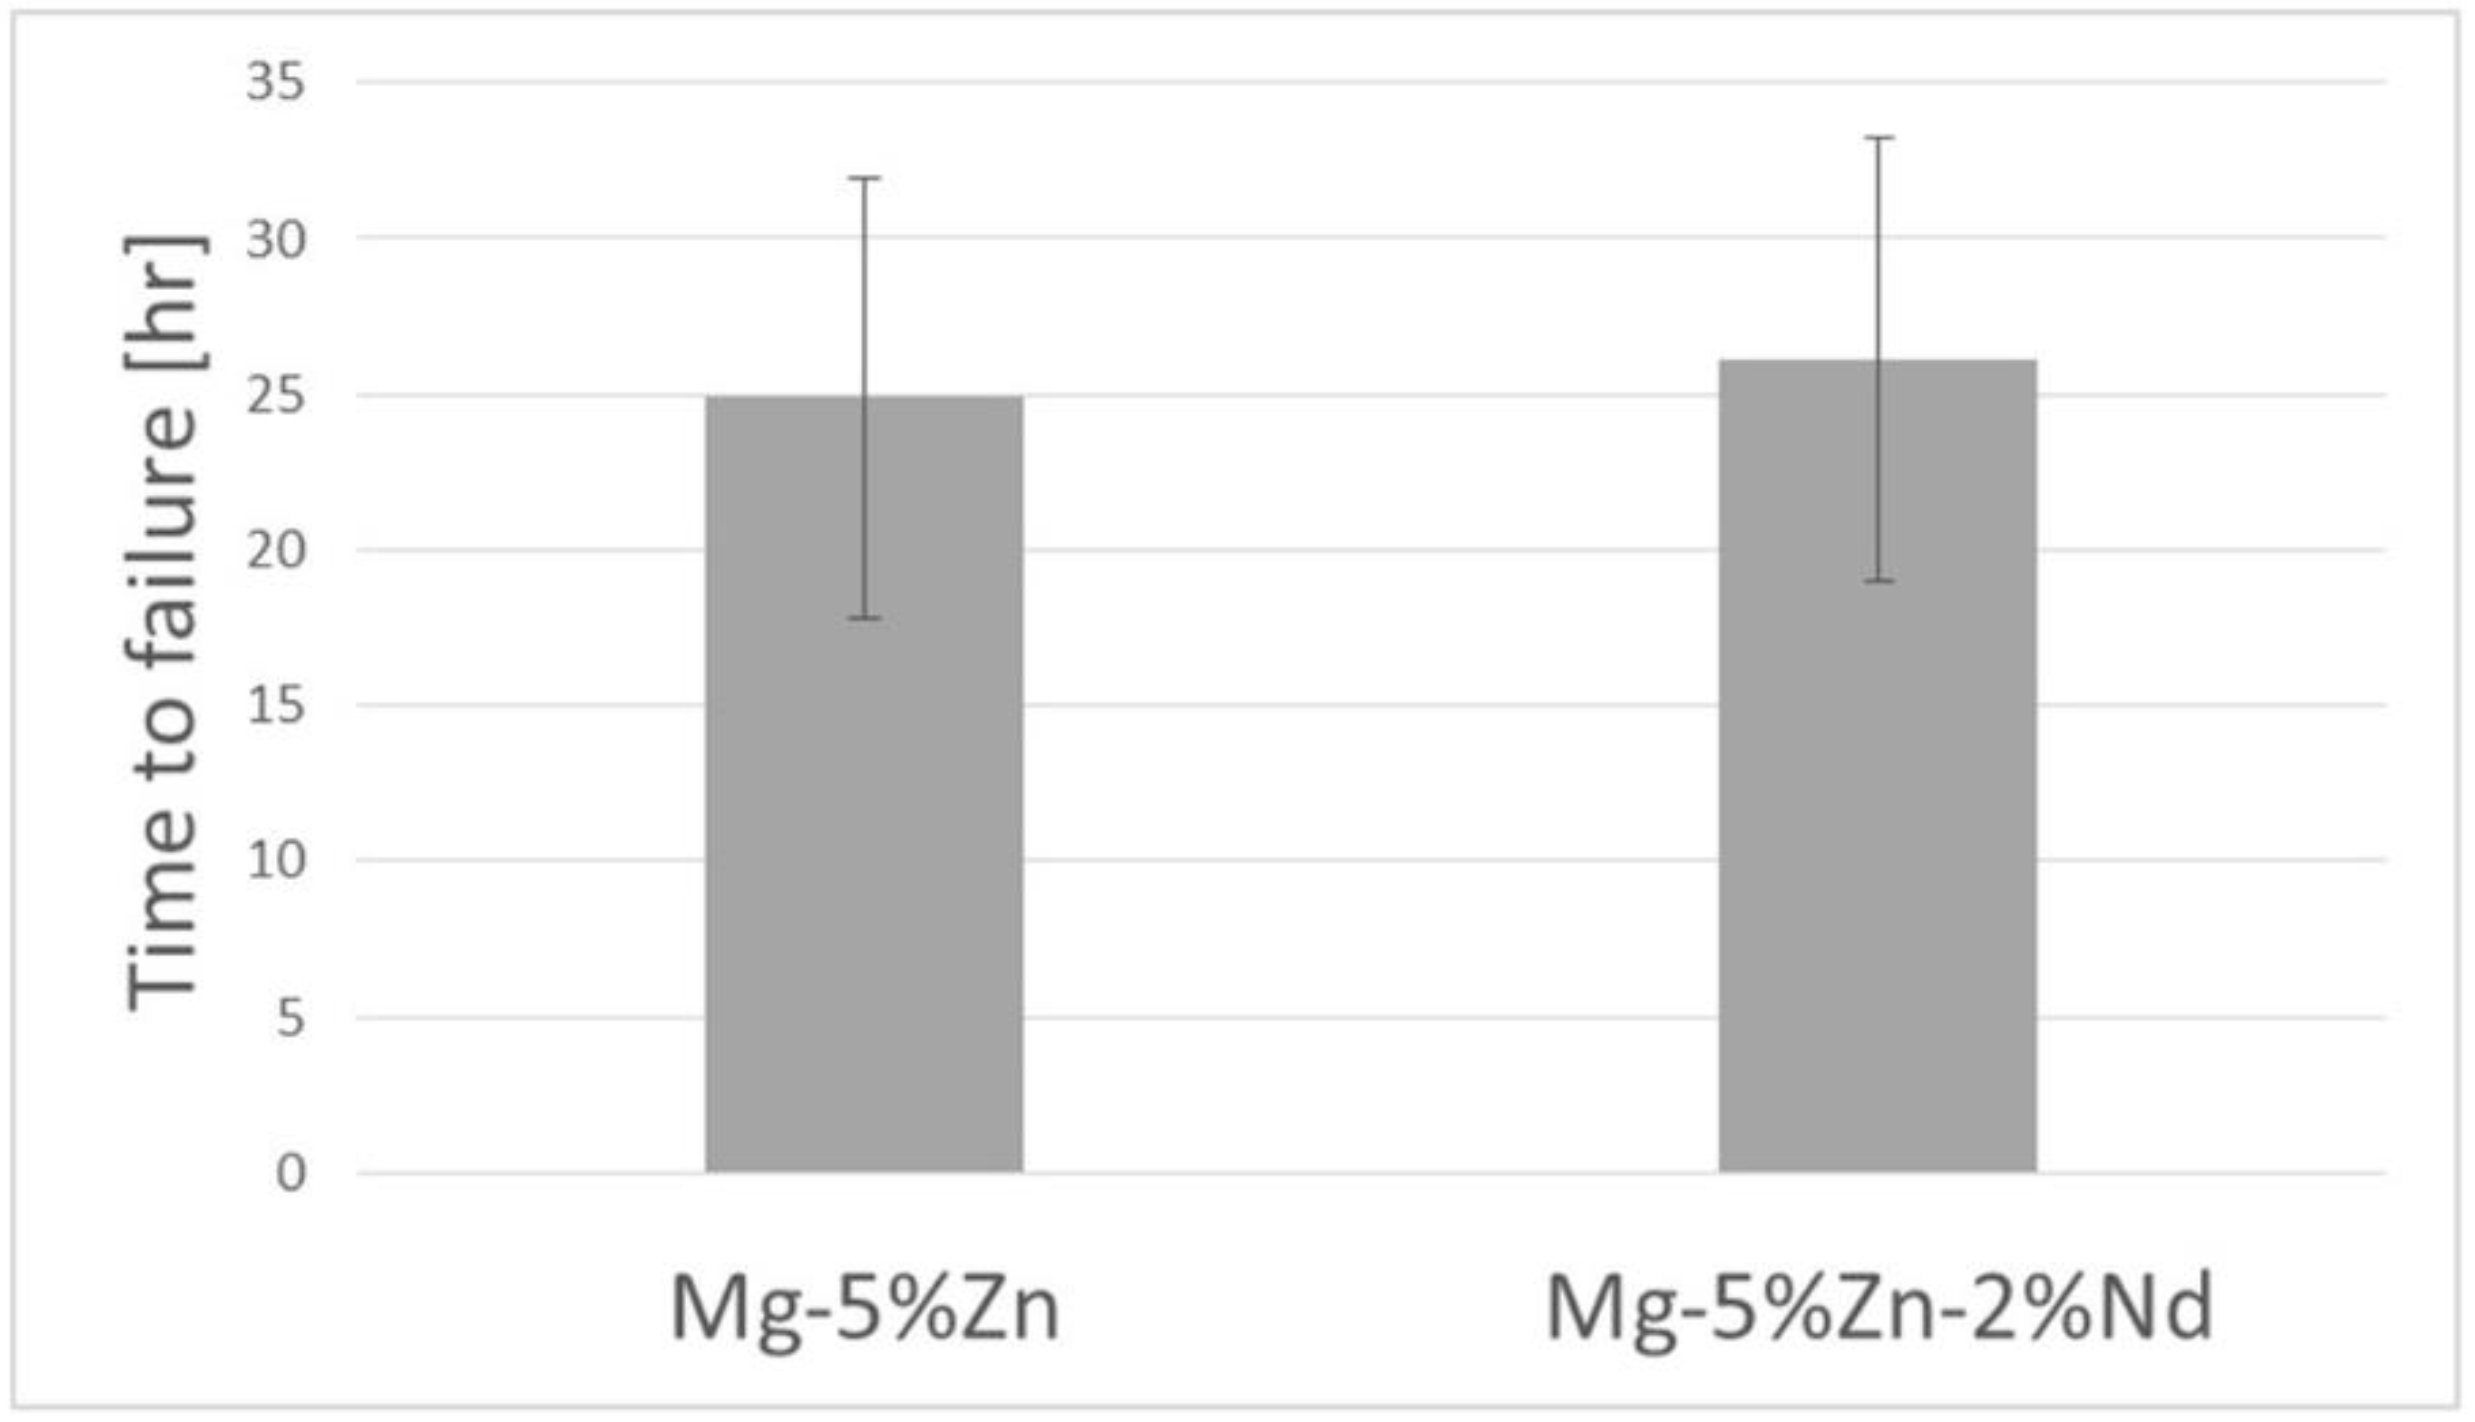
An additional concern relating to Mg base alloys used as structural materials for implants in biomedical applications is the presence of mechanical loading in combination with a corrosive environment. Stress corrosion can lead to premature device failure, even when the implant is operating below the yield stress. Hence, in order to more comprehensively evaluate the effect of Nd additions to the base alloy, it was necessary to examine the stress corrosion behavior by SSRT testing using a relatively low strain rate of 2.5 × 10⁻⁷ s−1. A comparison between the base alloy and the optimal alloy with 2%wt Nd is shown in Figure 12, in terms of time to failure. The stress corrosion behavior of the base alloy was similar to the 2%wt Nd alloy. This result confirms a lack of deteriorating corrosion effects from the addition of Nd, which is also in line with the expectations of Rokhlin et al. [23].
4. Discussion
In this study, we demonstrate the effect of Nd additions on the mechanical properties and corrosion performance of a novel base alloy, Mg-5%Zn-0.13%Y-0.35%Zr, following a homogenizing treatment and extrusion process. We found that the base alloy with 2%wt Nd yields the optimal combination of strength (YS = 340 MPa, UTS = 360 MPa) and ductility (16% elongation). This can be explained by the different microstructure introduced into the various alloys.
The presence of a single α-Mg phase in the Mg-5%Zn alloy, as demonstrated by SEM and XRD analysis, suggests that Zn mainly exits as a soluble element in the α-Mg solid solution phase. When 1%Nd is added, the W-phase forms at the grain boundaries, which increases the strength of the alloy. Additions of 2–3%wt Nd further increase the strength, which may be related to differences in size and morphology of the W and T-phase. Based on XRD results, the lattice parameter of the W-phase was gradually increased relative to the value previously reported for the Mg-Zn-Y material system [30,31,32]. This may be due to a substitution of Y with Nd in the W-phase, which introduces the larger Nd atomic radius. These results are in accordance with a previous microstructural investigation of the Mg-Zn-Nd material system [31].
The relationship between the strength behavior of Mg-Zn-Nd alloys, the volume fraction and arrangement of secondary phases was made apparent by the fractography analysis. We believe that the fracture of these Mg alloys demonstrates a competition between two distinct mechanisms: brittle cleavage and ductile dimples rupture. The fracture of the base alloy exhibits mainly brittle cleavage fracture with minor dimples rupture, which indicates its limited potential for plastic deformation. The precipitated particles have the common effect of increasing the yield and tensile strength as well as increasing material embrittlement due to nucleation along grain boundaries. However, small and round particles may enhance ductility of the material by initiating dimples that grow by plastic deformation. This potential is revealed by the addition of 1%wt Nd to the base alloy. Notably, the addition of 2%wt Nd to the base alloy significantly reduces the cleavage planes while enhancing dimple rupture, as observed by SEM fractography in Figure 7e,f. Thus, high values of strength (YS and UTS) are obtained due to a strengthening effect that concurrently improves elongation. This effect may be due to a “particle induced plasticity”. An increase of Nd content to 3%wt stimulates denser and smaller dimples covering the fracture surface, as observed in Figure 7g,h. The growth and expansion of the dimples are limited due to their large density. Thus, the measured values of UTS and YS were retained while the ductility was slightly decreased compared to the 2%wt Nd alloy.
The additions of up to 3%wt Nd does not have any significant effect on corrosion performance in terms of immersion test, EIS analysis, potentiodynamic polarization measurements and SSRT examination. This indicates that Nd is less effective as a corrosion protective through precipitation in W and T phases compared to its effect through a dissolved element in α-Mg solid solution [35,36].
However, the addition of Nd exerts a substantial effect on strength, increasing the YS by ~24% and the UTS by 12%. This beneficial effect increases the specific strength (strength/density) of the base alloy and hence reduces the amount of material required to produce a structural implant. Reducing the Mg implant’s weight will consequently reduce the amount of hydrogen formation, which is considered as a significant drawback for Mg to serve as an implant material.
5. Conclusions
The specific strength of the Mg-5%Zn-0.13%Y-0.35%Zr alloy was significantly improved by additions of up to 3%wt Nd with minor effect on corrosion performance in a simulated physiological environment. The optimal results, in terms of UTS, YS, elongation and corrosion resistance was obtained by the 2%wt Nd addition to the base alloy. This was mainly attributed to optimal concentration of W-phase (Mg3(Nd,Y)2Zn3) at grain boundaries and to the prevention of T-phase (Mg4(Nd,Y)Zn2) formation, which occurs at higher concentrations of Nd. Therefore, it is believed that the Mg-5Zn-2Nd-0.13Y-0.35Zr alloy has increased potential to serve as a biodegradable implant for biomedical applications.
Author Contributions
L.E. and O.H. conceived and performed the experiments, analysed the data. L.E. and E.A. wrote the paper. J.G. finished the revision and editing.
Conflicts of Interest
The authors declare no conflict of interest.
References
- Gu, X.N.; Zheng, Y.F. A review on magnesium alloys as biodegradable materials. Front. Mater. Sci. China 2010, 4, 111–115. [Google Scholar] [CrossRef]
- Staiger, M.P.; Pietak, A.M.; Huadmai, J.; Dias, G. Magnesium and its alloys as orthopedic biomaterials—A review. Biomaterials 2006, 27, 1728–1734. [Google Scholar] [CrossRef] [PubMed]
- Aghion, E.; Levy, G. The effect of Ca on the in vitro corrosion performance of biodegradable Mg-Nd-Y-Zr alloy. J. Mater. Sci. 2010, 45, 3096–3101. [Google Scholar] [CrossRef]
- Aghion, E.; Levy, G.; Ovadia, S. In vivo behavior of biodegradable Mg-Nd-Y-Zr-Ca alloy. J. Mater. Sci. Mater. Med. 2012, 23, 805–812. [Google Scholar] [CrossRef] [PubMed]
- Arnon, A.; Aghion, E. Stress Corrosion Cracking of Nano/Sub-micron E906 Magnesium Alloy. Adv. Eng. Mater. 2008, 8, 742–745. [Google Scholar] [CrossRef]
- Winzer, N.; Aterns, A.; Song, G.; Ghali, E.; Dietzel, W.; Kainer, K.U.; Hort, N.; Blawert, C. A critical review of stress corrosion cracking (SCC) of magnesium alloys. Adv. Eng. Mater. 2005, 7, 659–693. [Google Scholar] [CrossRef]
- Aterns, A.; Winzer, N.; Dietzel, W. Stress corrosion cracking of magnesium alloys. Adv. Eng. Mater. 2011, 13, 11–18. [Google Scholar] [CrossRef]
- Bursle, A.J.; Pugh, E.N. On the Mechanisms of Trans-Granular Stress Corrosion Cracking, Mechanisms of Environments Sensitive Cracking of Materials; Swann, P.R., Ford, F.P., Westwood, A.R.C., Eds.; Materials Society: London, UK, 1977; pp. 471–481. [Google Scholar]
- Xin, Y.; Liu, C.; Zhang, X.; Tang, G.; Tian, X.; Chu, P.K. Corrosion behavior of biomedical AZ91 magnesium alloy in simulated body fluids. J. Mater. Res. 2007, 22, 2004–2011. [Google Scholar] [CrossRef]
- Dong-song, Y.; Er-lin, Z.; Song-yan, Z. Effect of Zn on mechanical property and corrosion property of extruded Mg-Zn-Mn alloy. Trans. Nonferr. Met. Soc. China 2008, 18, 763–768. [Google Scholar]
- Aghion, E.; Yered, T.; Perez, Y.; Gueta, Y. The prospects of carrying and releasing drugs via biodegradable magnesium foam. Adv. Eng. Mater. 2010, 12, B374–B379. [Google Scholar] [CrossRef]
- Bronfin, B.; Aghion, E.; Von Buch, F.; Schumann, S.; Katsir, M. Die casting Magnesium alloys for elevated temperature applications. In Proceedings of the TMS Annual Meeting Magnesium Technology, New Orleans, LA, USA, 11–15 February 2001; pp. 127–130. [Google Scholar]
- Aghion, E.; Gueta, Y.; Moscovitch, N.; Bronfin, B. Effect of yttrium additions on the properties of grain-refined Mg-3%Nd alloy. J. Mater. Sci. 2008, 43, 4870–4875. [Google Scholar] [CrossRef]
- Guillory, R.; Bowen, P.; Hopkins, S.; Shearier, E.; Earley, E.; Gillette, A.; Aghion, E.; Bocks, M.; Drelich, J.; Goldman, J. Corrosion characteristics dictate the long-term inflammatory profile of degradable zinc arterial implants. ACS Biomater. Sci. Eng. 2016, 2, 2355–2364. [Google Scholar] [CrossRef]
- Shuhua, C.; Ting, L.; Nianfeng, L.; Fangfang, F. Effects of Zn on Microstructure, Mechanical Properties and Corrosion Behavior of Mg-Zn Alloys. Mater. Sci. Eng. C 2012, 32, 2570–2577. [Google Scholar]
- Koc, E.; Kannan, M.B.; Unal, M.; Candan, E. Influence of Zinc on the microstructure, mechanical properties and in-vitro corrosion behavior of magnesium-zinc binary alloys. J. Alloys Compd. 2015, 648, 291–296. [Google Scholar] [CrossRef]
- Mezbahul-Islam, M.; Omar-Mostafa, A.; Medraj, M. Essential magnesium alloys binary phase diagrams and their thermochemical data. J. Mater. 2014, 2014, 704283. [Google Scholar] [CrossRef]
- Yingwei, S.; En-Hou, H.; Dayong, S.; Chang, D.; Bong, S.Y. The Effect of Zn Concentration on the Corrosion Behavior of Mg-xZn Alloys. Corros. Sci. 2012, 65, 322–330. [Google Scholar]
- Ben-Hamu, G.; Eliezer, D.; Kaya, A.; Na, Y.G.; Shin, K.S. Microstructure and corrosion behavior of Mg-Zn-Ag alloys. Mater. Sci. Eng. A 2006, 435–436, 579–587. [Google Scholar] [CrossRef]
- Song, Y.W.; Shan, D.Y.; Chen, R.S.; Han, E.H. Effect of second phases on the corrosion behavior of wrought Mg-Zn-Y-Zr alloy. Corros. Sci. 2010, 52, 1830–1837. [Google Scholar] [CrossRef]
- Ben-Hamu, G.; Eliezer, D.; Shin, K.S. The role of Mg2Si on the corrosion behavior of wrought Mg-Zn-Mn alloy. Intermetallics 2008, 16, 860–867. [Google Scholar] [CrossRef]
- Ben-Hamu, G.; Eliezer, D.; Shin, K.S. The role of Si and Ca on new wrought Mg-Zn-Mn alloy. Mater. Sci. Eng. A 2007, 447, 35–43. [Google Scholar] [CrossRef]
- Rokhlin, L.L. Magnesium Alloys Containing Rare Earth Metals; Taylor and Francis: London, UK, 2003. [Google Scholar]
- Anyanwu, I.A.; Kamado, S.; Kojima, Y. Aging characteristics and high temperature tensile properties of Mg-Gd-Y-Zr alloys. Mater. Trans. 2001, 42, 1206–1211. [Google Scholar] [CrossRef]
- Hakimi, O.; Aghion, E.; Goldman, J. Improved stress corrosion cracking resistance of a novel biodegradable EW62 magnesium alloys by rapid solidification, in simulated electrolytes. Mater. Sci. Eng. C 2015, 51, 226–232. [Google Scholar] [CrossRef] [PubMed]
- Feng, H.; Yang, Y.; Chang, H. Influence of W phase on mechanical properties and damping capacity of Mg-Zn-Y-Nd-Zr alloys. Mater. Sci. Eng. A 2014, 609, 7–15. [Google Scholar] [CrossRef]
- Padezhnova, E.M.; Mel’nik, E.V.; Dobatkina, T.V. Study of phase equilibriums in magnesium-zinc-yttrium system. Russ. Metall. Eng. Trans. 1979, 1, 179. [Google Scholar]
- Padezhnova, E.M.; Mel’nik, E.V.; Miliyevskiy, R.A.; Dobatkina, T.V.; Kinzhibalo, V.V. Magnesium-zinc-yttrium system. Russ. Metall. Eng. Trans. 1982, 4, 185. [Google Scholar]
- Yang, J.; Wang, J.; Wang, L.; Wu, Y.; Wang, L.; Zhang, H. Microstructure and mechanical properties of Mg–4.5Zn–xNd (x = 0, 1 and 2, wt %) alloys. Mater. Sci. Eng. A 2008, 479, 339–344. [Google Scholar] [CrossRef]
- Qiang, L.; Qudong, W.; Haitao, Z.; Xiaoqing, Z.; Ya, Z.; Wenjiang, D. High Strength Exdruded Mg-5Zn-2Nd-1.5Y-0.6Zr-0.4Ca Alloy Produced by Electromagnetic Casting. Mater. Lett. 2005, 59, 2549–2554. [Google Scholar]
- Qiang, L.; Qudong, W.; Yingxin, W.; Xiaoqing, Z.; Wenjiang, D. Effect of Nd and Y addition on Microstructure and Mechanical Properties of as-cast Mg-Zn-Zr Alloys. J. Alloys Compd. 2007, 427, 115–123. [Google Scholar]
- Wang, J.; Liu, R.; Dong, X.; Yang, Y. Microstructure and Mechanical Properties of Mg-Zn-Y-Nd-Zr Alloys. J. Rare Earths 2013, 31, 616–621. [Google Scholar] [CrossRef]
- Song, G.; Atrens, A.; St John, D.; Wu, X.; Nairn, J. The anodic dissolution of magnesium in chloride and sulphate solutions. Corros. Sci. 1997, 39, 1981–2004. [Google Scholar] [CrossRef]
- Nakatsugawa, I.; Kamado, S.; Kojima, Y.; Ninomiya, R.; Kubota, K. Corrosion of magnesium alloys containing rare earth elements. Corros. Rev. 1998, 16, 139. [Google Scholar] [CrossRef]
- Zhang, E.; He, W.; Du, H.; Yang, K. Microstructure, mechanical properties and corrosion properties of Mg-Zn-Y alloys with low Zn content. Mater. Sci. Eng. A 2008, 488, 102–111. [Google Scholar] [CrossRef]
- Pierce, F.S.; Poon, S.J.; Guo, Q. Electron localization in metallic quasicrystals. Science 1993, 261, 737–739. [Google Scholar] [CrossRef] [PubMed]
Figure 1.
Typical microstructure obtained by optical microscopy of (a) Mg-5%Zn; (b) Mg-5%Zn-1%Nd; (c) Mg-5%Zn-2%Nd; (d) Mg-5%Zn-3%Nd.
Figure 1.
Typical microstructure obtained by optical microscopy of (a) Mg-5%Zn; (b) Mg-5%Zn-1%Nd; (c) Mg-5%Zn-2%Nd; (d) Mg-5%Zn-3%Nd.

Figure 2.
Typical microstructure obtained by scanning electron microscopy (SEM-BSE images) of (a) Mg-5%Zn; (b) Mg-5%Zn-1%Nd; (c) Mg-5%Zn-2%Nd; (d) Mg-5%Zn-3%Nd.
Figure 2.
Typical microstructure obtained by scanning electron microscopy (SEM-BSE images) of (a) Mg-5%Zn; (b) Mg-5%Zn-1%Nd; (c) Mg-5%Zn-2%Nd; (d) Mg-5%Zn-3%Nd.

Figure 3.
Microstructure magnification of Mg-5%Zn-3%Nd alloy (a) Close up view of precipitant at grain boundary (SE images) (b) Corresponding EDS analysis of the shown precipitant.
Figure 3.
Microstructure magnification of Mg-5%Zn-3%Nd alloy (a) Close up view of precipitant at grain boundary (SE images) (b) Corresponding EDS analysis of the shown precipitant.

Figure 4.
X-ray diffraction analysis of (a) Mg-5%Zn (b) Mg-5%Zn-1%Nd; (c) Mg-5%Zn-2%Nd (d) Mg-5%Zn-3%Nd.
Figure 4.
X-ray diffraction analysis of (a) Mg-5%Zn (b) Mg-5%Zn-1%Nd; (c) Mg-5%Zn-2%Nd (d) Mg-5%Zn-3%Nd.

Figure 5.
Ultimate tensile strength (UTS) and Yield strength (YS) of tested alloys vs. Nd content.

Figure 6.
Tensile elongation of tested Alloys vs. Nd content.

Figure 7.
Fractography analysis of tested alloys obtained by scanning electron microscopy (SEM) (a) Mg-5%Zn—SE image; (b) Mg-5%Zn-1%Nd—SE image; (c) Mg-5%Zn-2%Nd—SE image; (d) Mg-5%Zn-3%Nd—SE image; (e) Mg-5%Zn—BSE image; (f) Mg-5%Zn-1%Nd—BSE image; (g) Mg-5%Zn-2%Nd—BSE image; (h) Mg-5%Zn-3%Nd—BSE image.

Figure 8.
Visual images obtained after immersion tests in PBS solution at 37 °C for 10 days (a) Mg-5%Zn; (b) Mg-5%Zn-1%Nd; (c) Mg-5%Zn-2%Nd; (d) Mg-5%Zn-3%Nd.
Figure 8.
Visual images obtained after immersion tests in PBS solution at 37 °C for 10 days (a) Mg-5%Zn; (b) Mg-5%Zn-1%Nd; (c) Mg-5%Zn-2%Nd; (d) Mg-5%Zn-3%Nd.

Figure 9.
Corrosion rate measurements calculated from hydrogen evolution obtained during immersion tests in PBS solution at 37 °C.
Figure 9.
Corrosion rate measurements calculated from hydrogen evolution obtained during immersion tests in PBS solution at 37 °C.

Figure 10.
Electrochemical impedance spectra (EIS) analysis of all the tested alloys, (a) Nyquist plots obtained after immersion in PBS solution for up to 1 h; (b) Related equivalent circuit.
Figure 10.
Electrochemical impedance spectra (EIS) analysis of all the tested alloys, (a) Nyquist plots obtained after immersion in PBS solution for up to 1 h; (b) Related equivalent circuit.

Figure 11.
Potentiodynamic polarization curves in PBS solution of all the tested Alloys.

Figure 12.
Time to failure of Mg-5%Zn and Mg-5%Zn-2%Nd in PBS solution at a strain rate of 2.5 × 10⁻⁷ s−1.
Figure 12.
Time to failure of Mg-5%Zn and Mg-5%Zn-2%Nd in PBS solution at a strain rate of 2.5 × 10⁻⁷ s−1.


Table 1.
Chemical composition of the tested alloys (in wt %).
| Alloy Compositions | Zn | Nd | Zr | Y | Fe | Si | Ni | Cu | Mg |
|---|---|---|---|---|---|---|---|---|---|
| Mg-5%Zn | 5.1 | 0.0 | 0.38 | 0.15 | 0.005 | 0.01 | 0.001 | 0.001 | Bal. |
| Mg-5%Zn-1%Nd | 5.0 | 1.2 | 0.36 | 0.14 | 0.008 | 0.01 | 0.001 | 0.001 | Bal. |
| Mg-5%Zn-2%Nd | 5.1 | 2.1 | 0.33 | 0.12 | 0.006 | 0.01 | 0.001 | 0.001 | Bal. |
| Mg-5%Zn-3%Nd | 5.2 | 3.2 | 0.35 | 0.12 | 0.006 | 0.01 | 0.001 | 0.001 | Bal. |
Table 2.
Phase type, lattice parameter of W-phase and volume fraction of secondary phases as related to alloy composition.
Table 2.
Phase type, lattice parameter of W-phase and volume fraction of secondary phases as related to alloy composition.
| Parameter Alloy | Phase Type | Lattice Parameter W-Phase [Å] | % Volume Fraction of Secondary Phase |
|---|---|---|---|
| Mg-5%Zn | α-Mg | - | - |
| Mg-5%Zn-1%Nd | α-Mg+W | 6.931 | 2 |
| Mg-5%Zn-2%Nd | α-Mg+W | 6.97 | 3.5 |
| Mg-5%Zn-3%Nd | α-Mg+W+T | 6.986 | 5.5 |
Table 3.
Hardness measurements of all the tested alloys.
| Alloy | Hardness (HV) |
|---|---|
| Mg-5%Zn | 86.6 ± 1.0 |
| Mg-5%Zn-1%Nd | 96 ± 1.0 |
| Mg-5%Zn-2%Nd | 97 ± 1.0 |
| Mg-5%Zn-3%Nd | 84 ± 1.0 |
Table 4.
Corrosion rate of tested alloys as obtained by Tafel extrapolation from potentiodynamic polarization curves.
Table 4.
Corrosion rate of tested alloys as obtained by Tafel extrapolation from potentiodynamic polarization curves.
| Parameter Alloy | Ecorr (V) | Icorr (µA) | C.R (mpy) |
|---|---|---|---|
| Mg-5%Zn | −1.44 | 17.6 | 17.34 |
| Mg-5%Zn-1%Nd | −1.46 | 25.88 | 25.29 |
| Mg-5%Zn-2%Nd | −1.45 | 21.98 | 21.65 |
| Mg-5%Zn-3%Nd | −1.48 | 29.93 | 29.48 |
© 2018 by the authors. Licensee MDPI, Basel, Switzerland. This article is an open access article distributed under the terms and conditions of the Creative Commons Attribution (CC BY) license (http://creativecommons.org/licenses/by/4.0/).
Share and Cite
MDPI and ACS Style
Elkaiam, L.; Hakimi, O.; Goldman, J.; Aghion, E. The Effect of Nd on Mechanical Properties and Corrosion Performance of Biodegradable Mg-5%Zn Alloy. Metals 2018, 8, 438. https://doi.org/10.3390/met8060438
AMA Style
Elkaiam L, Hakimi O, Goldman J, Aghion E. The Effect of Nd on Mechanical Properties and Corrosion Performance of Biodegradable Mg-5%Zn Alloy. Metals. 2018; 8(6):438. https://doi.org/10.3390/met8060438
Chicago/Turabian StyleElkaiam, Lilach, Orly Hakimi, Jeremy Goldman, and Eli Aghion. 2018. "The Effect of Nd on Mechanical Properties and Corrosion Performance of Biodegradable Mg-5%Zn Alloy" Metals 8, no. 6: 438. https://doi.org/10.3390/met8060438
Note that from the first issue of 2016, this journal uses article numbers instead of page numbers. See further details here.