
Study on the Fluid Flow in a Semi-Open-Stream-Poured Beam Blank Continuous Casting Mold with Submerged Refractory Funnels by Multiphase Modeling

Abstract
:
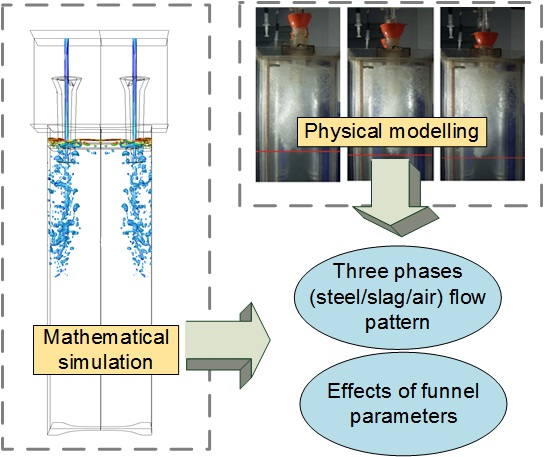
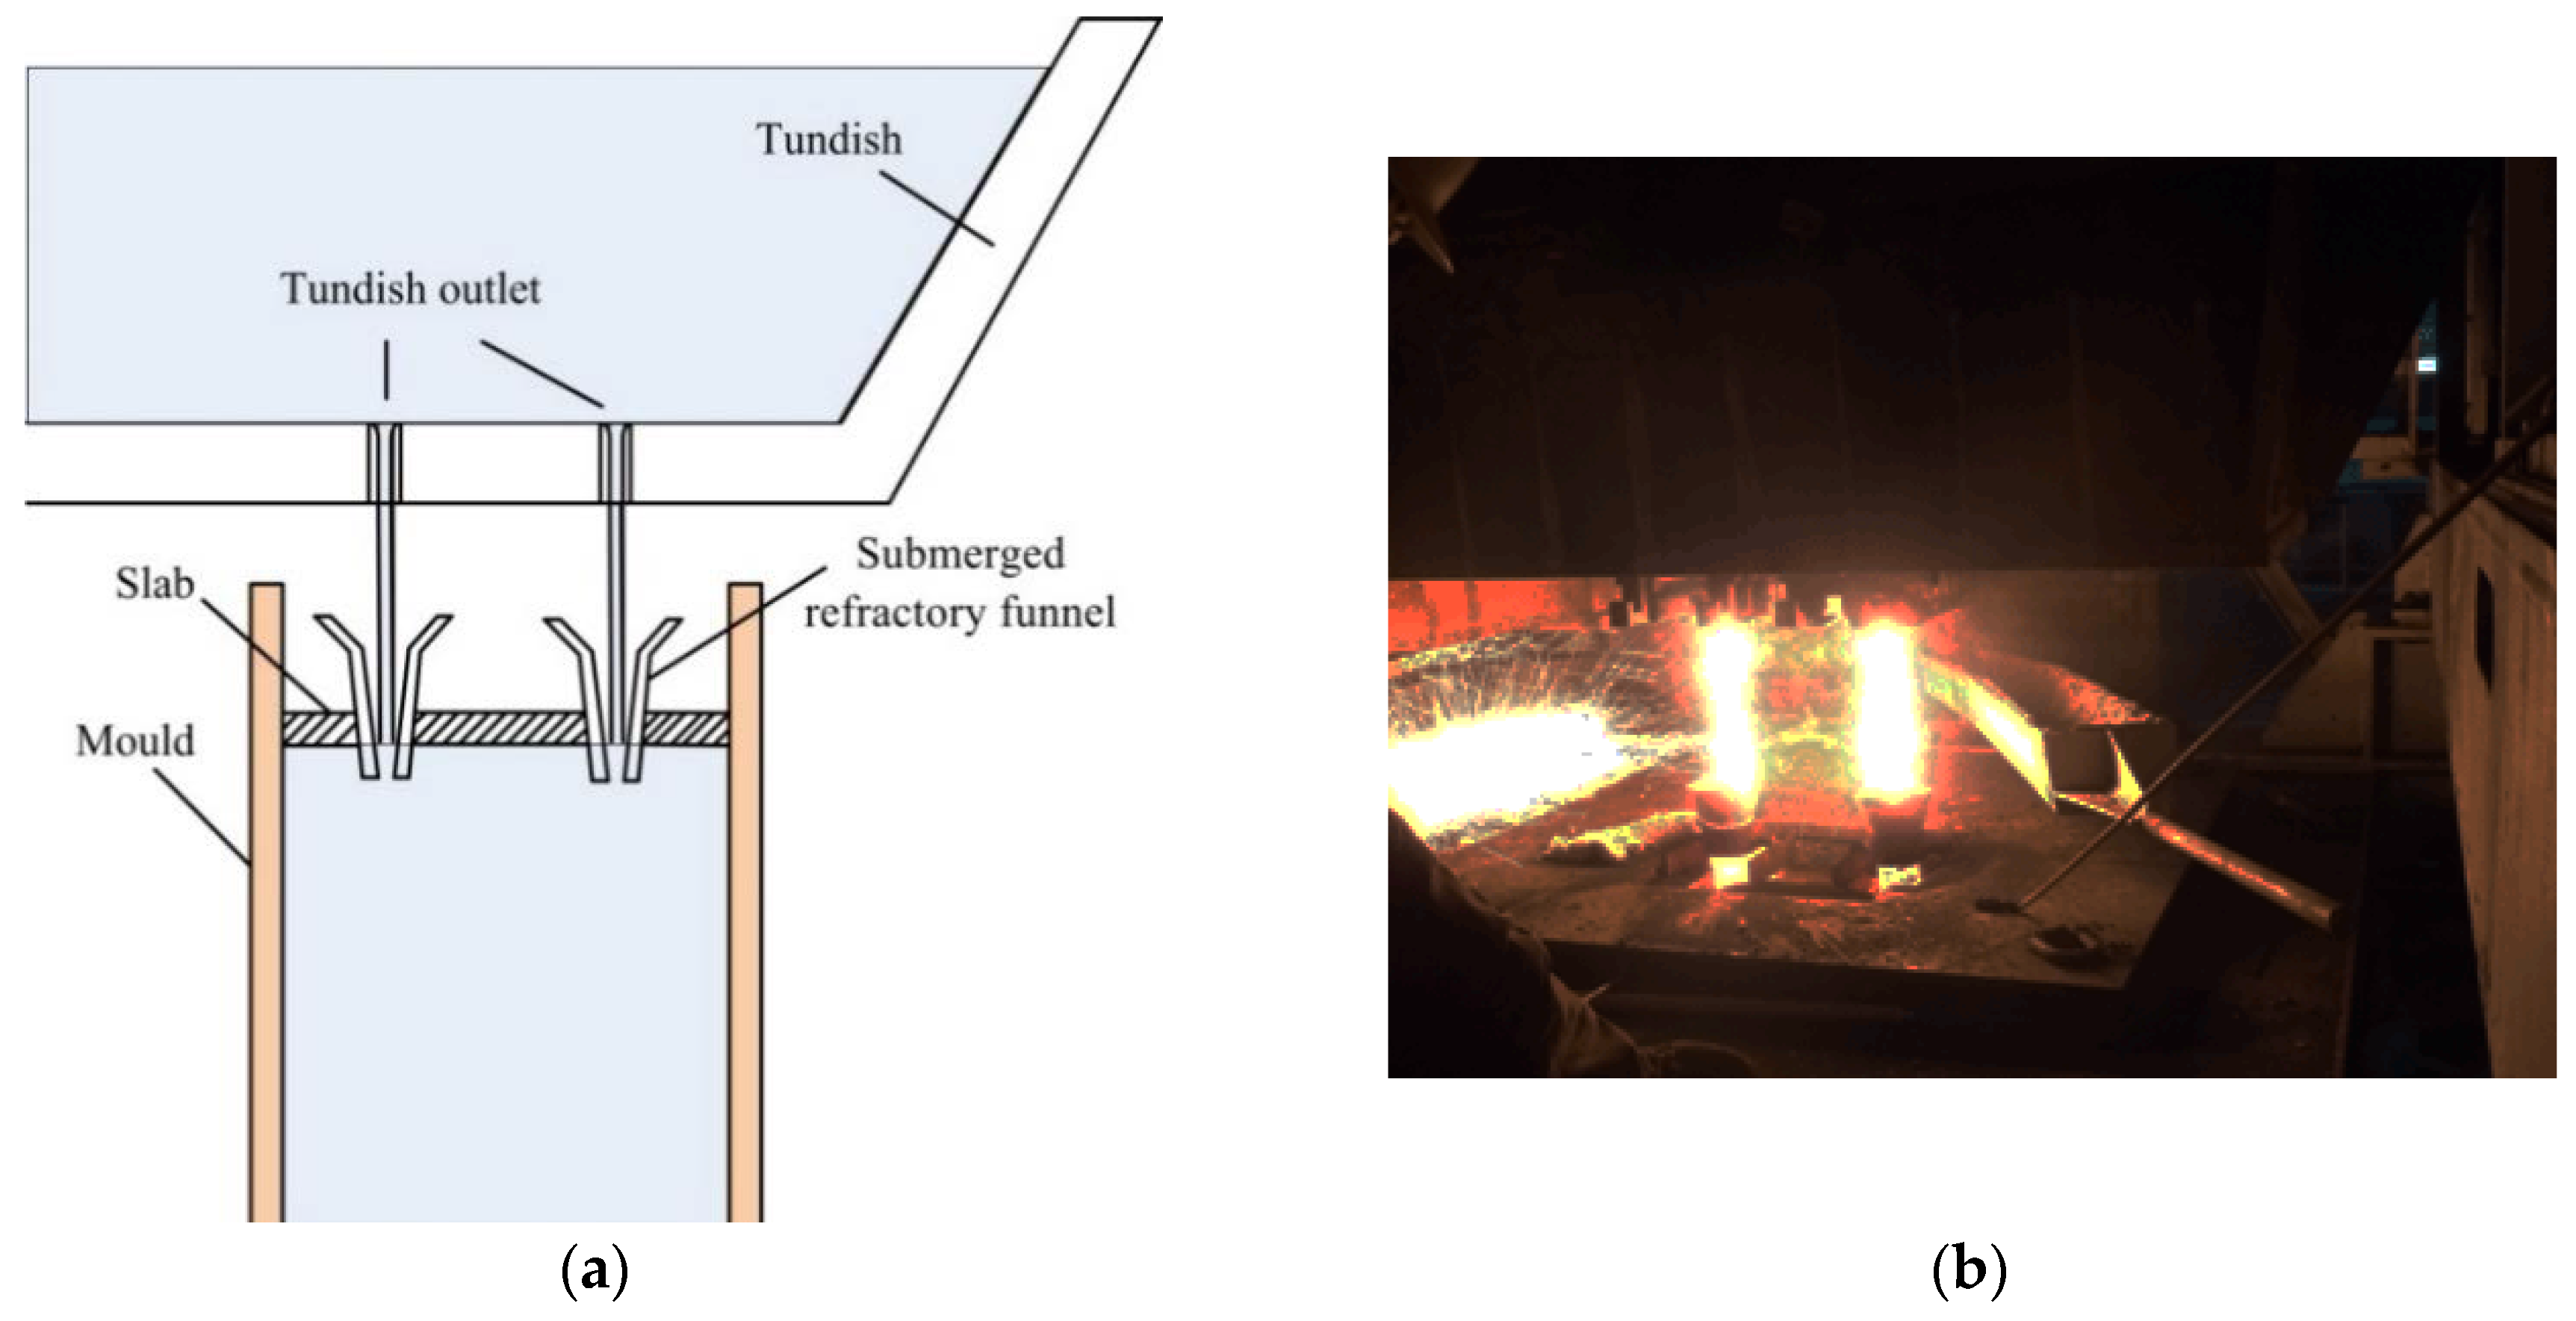
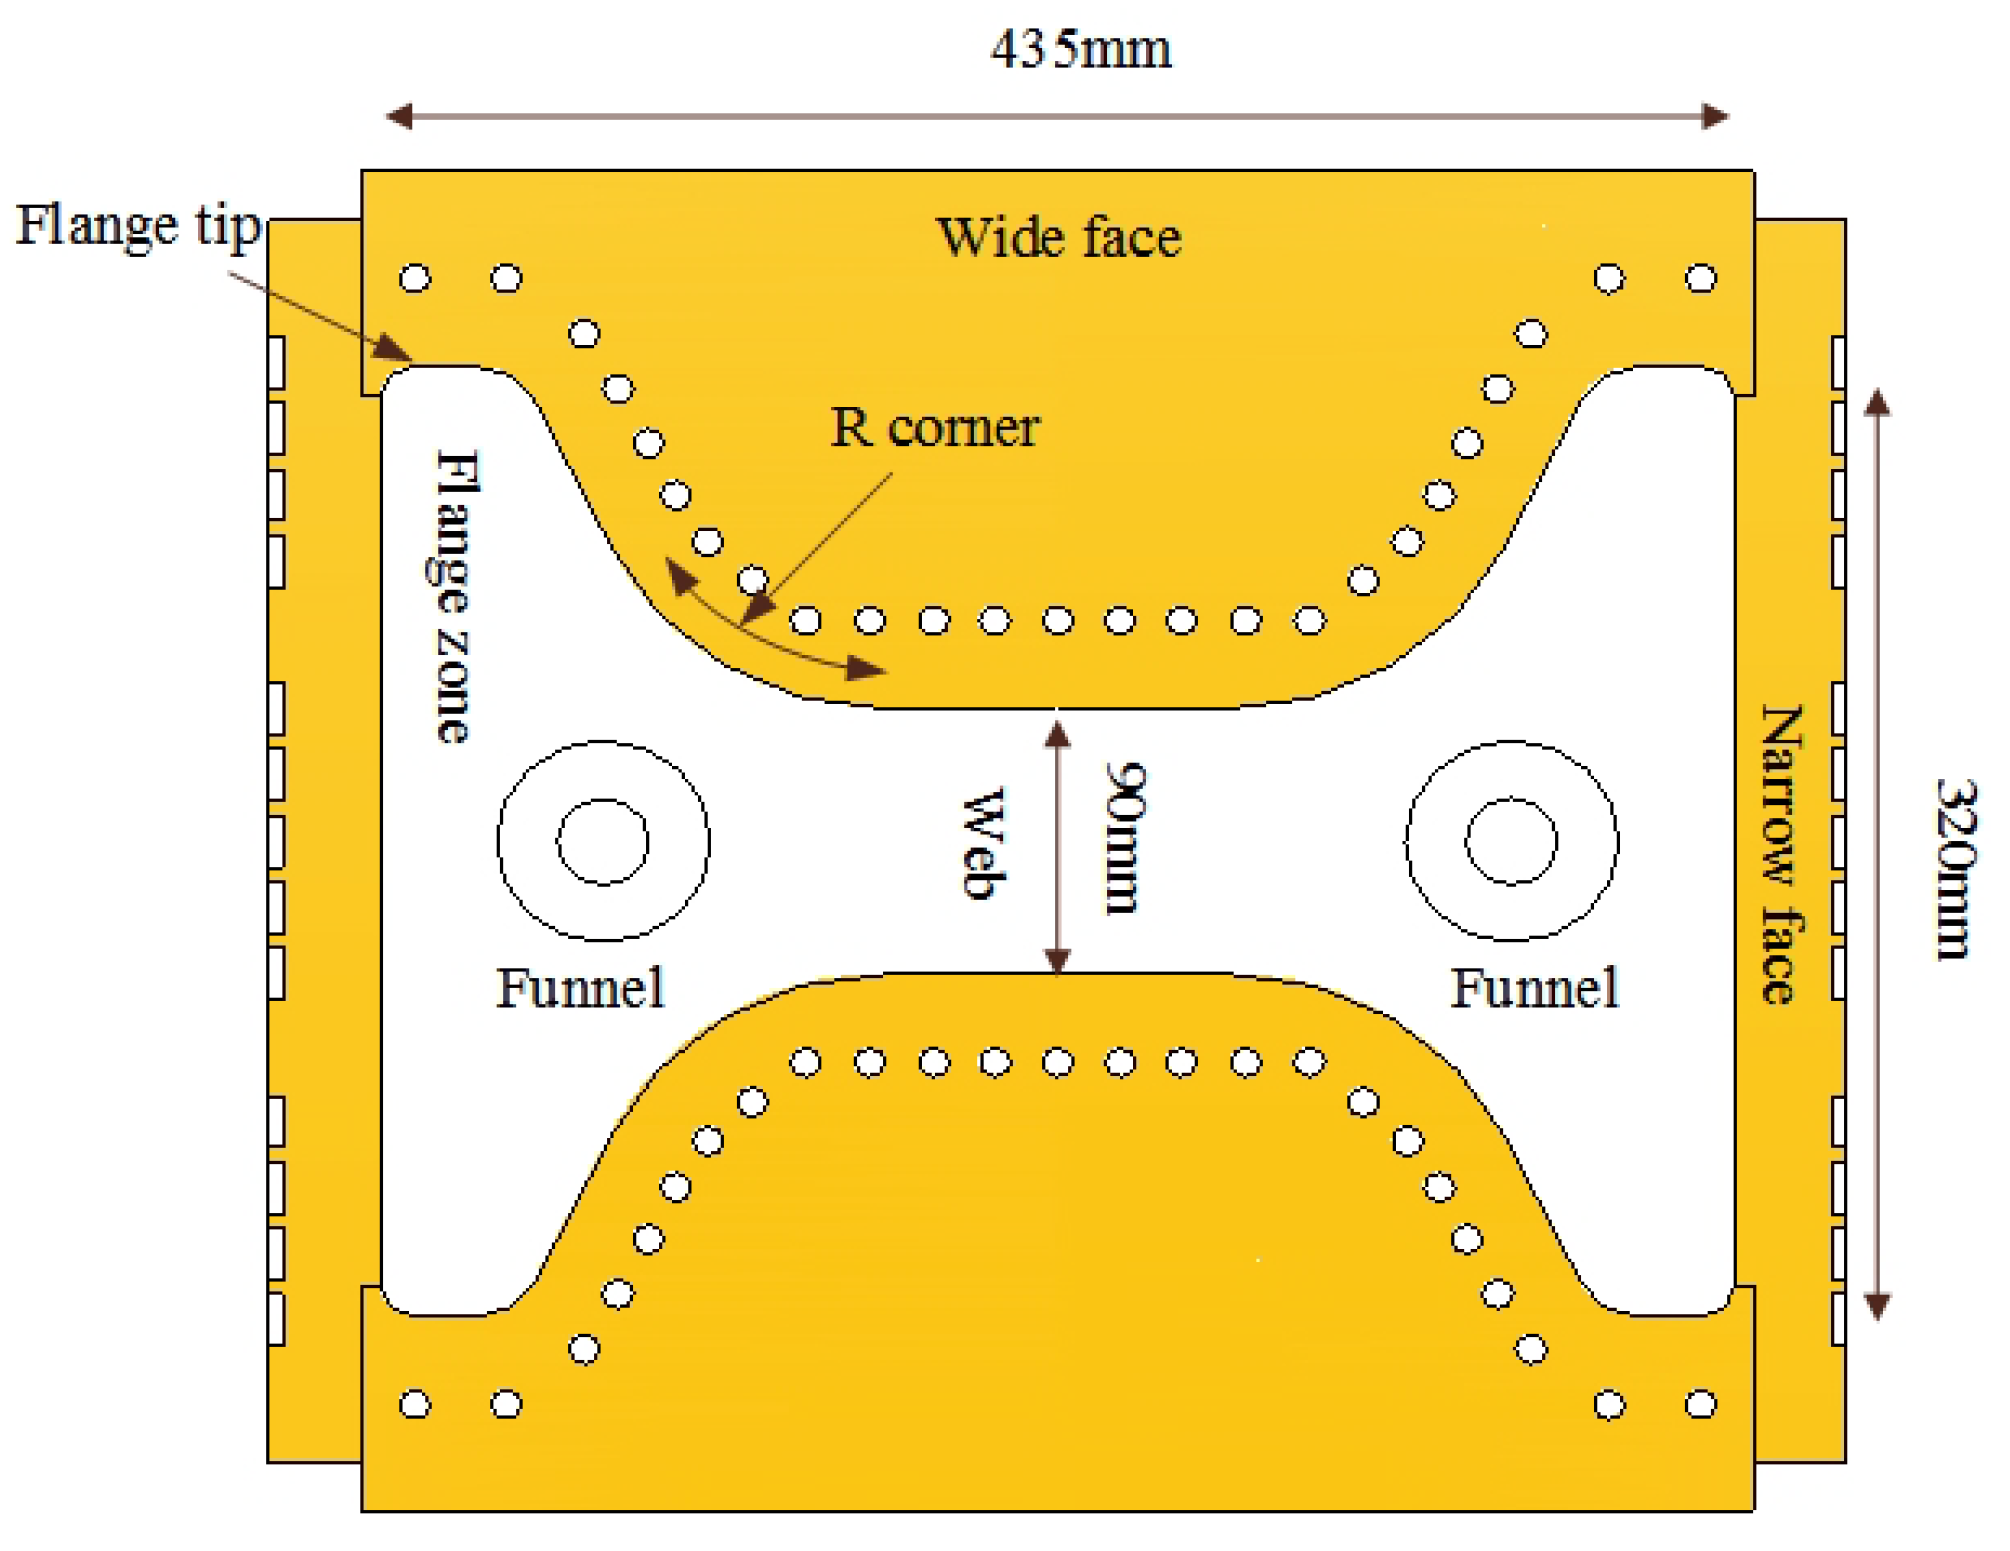
1. Introduction
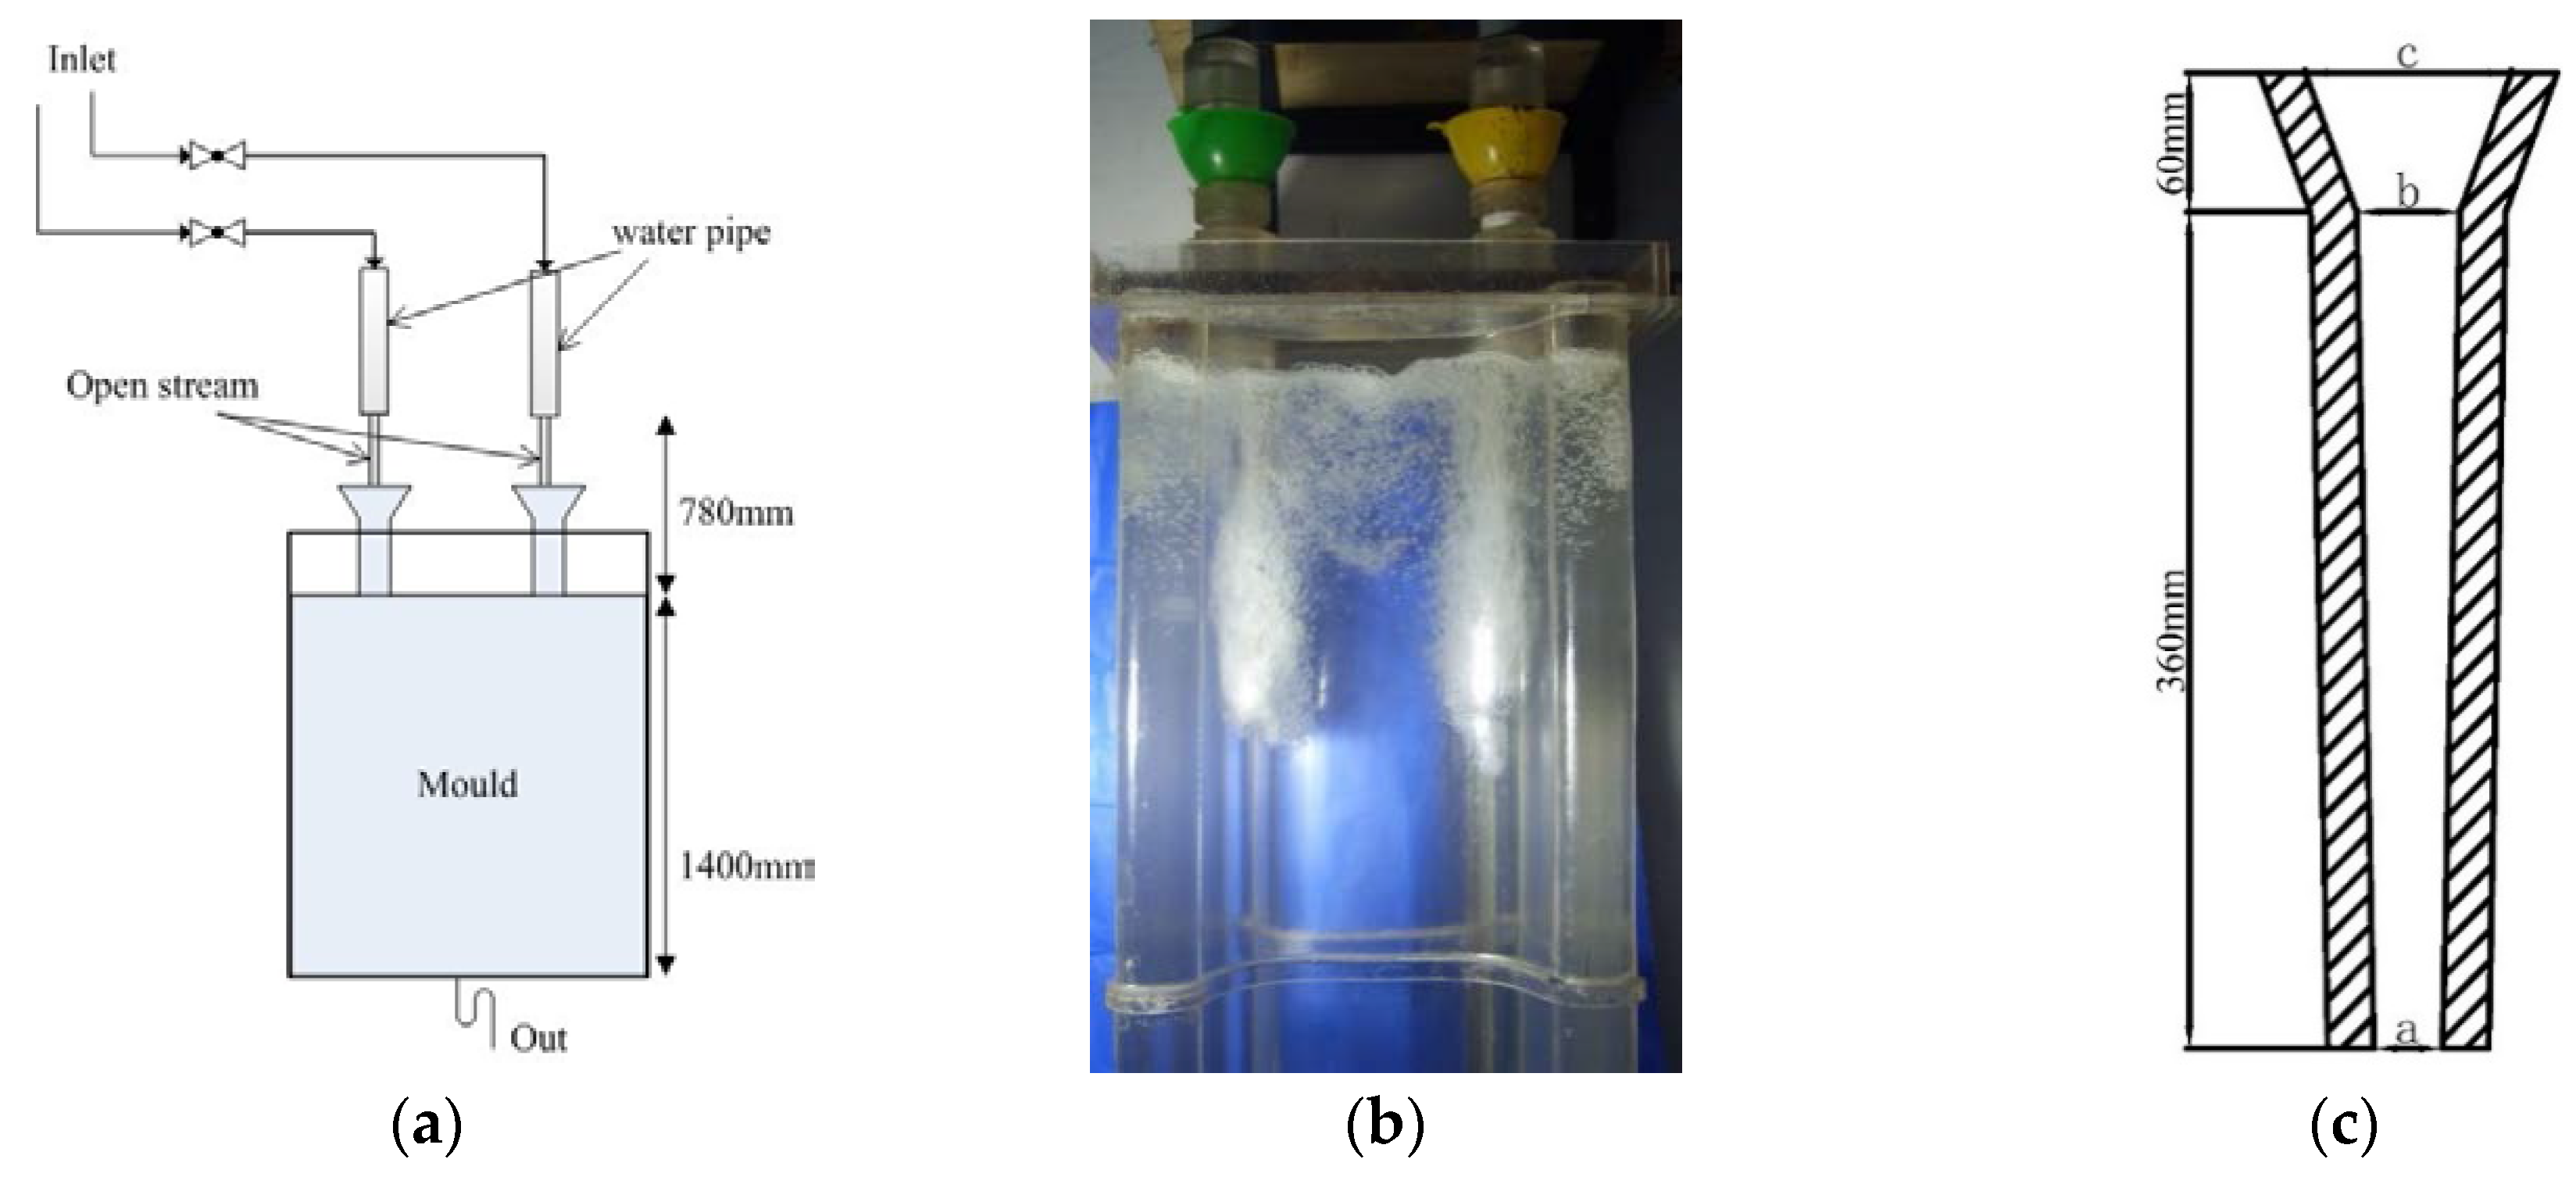
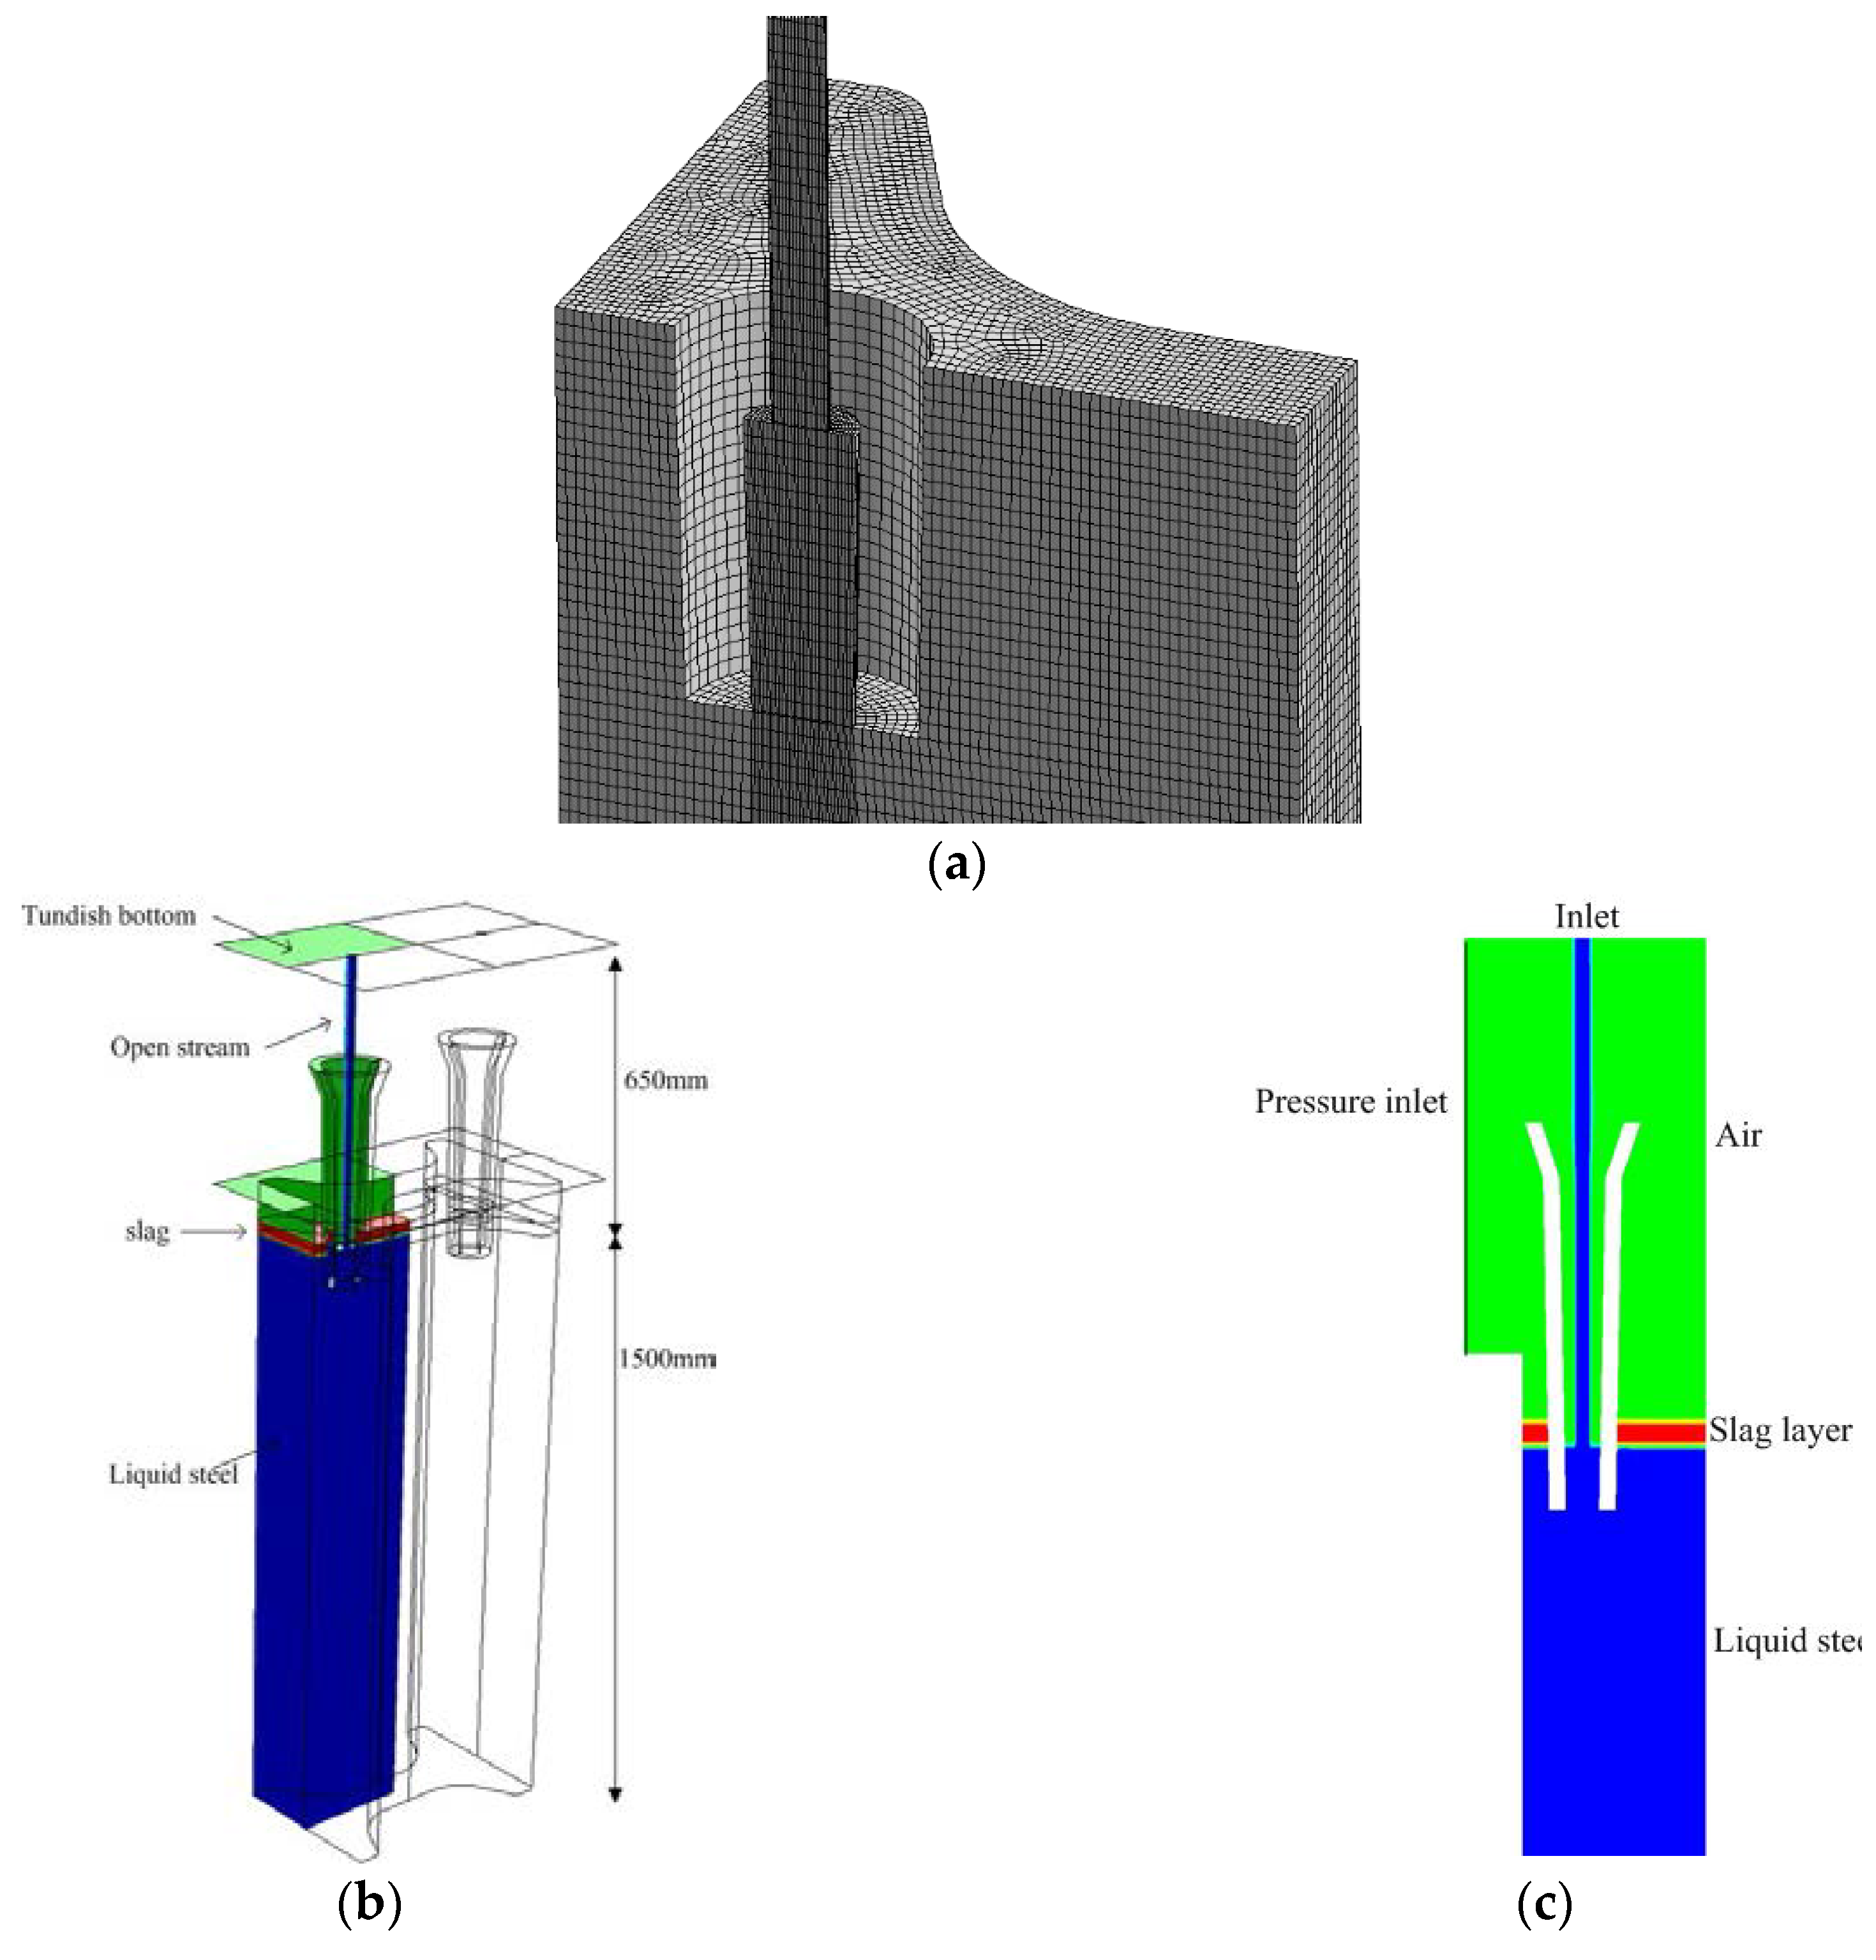
2. Physical Modeling
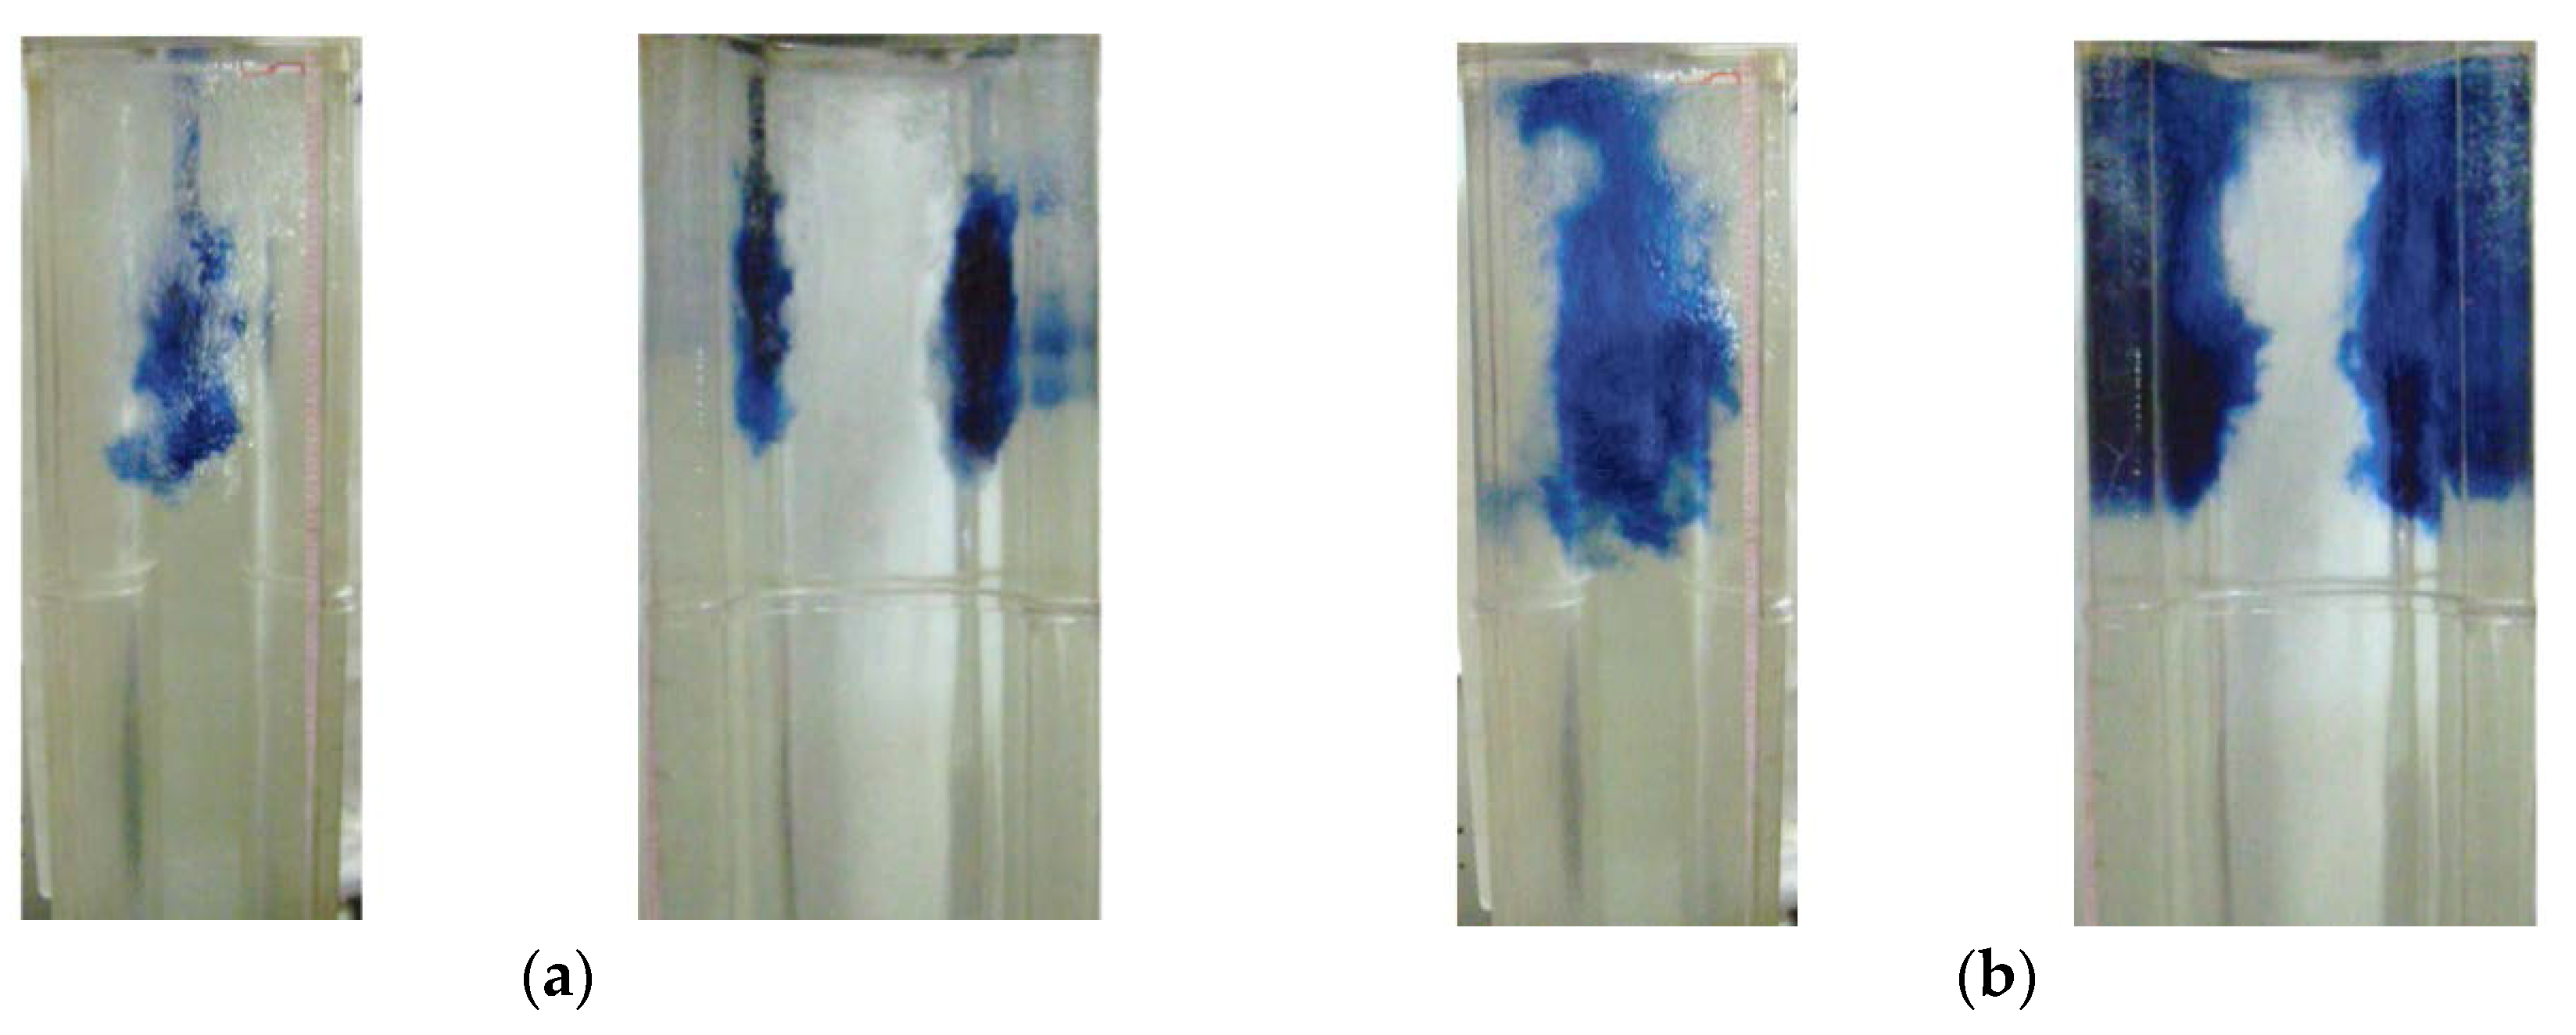
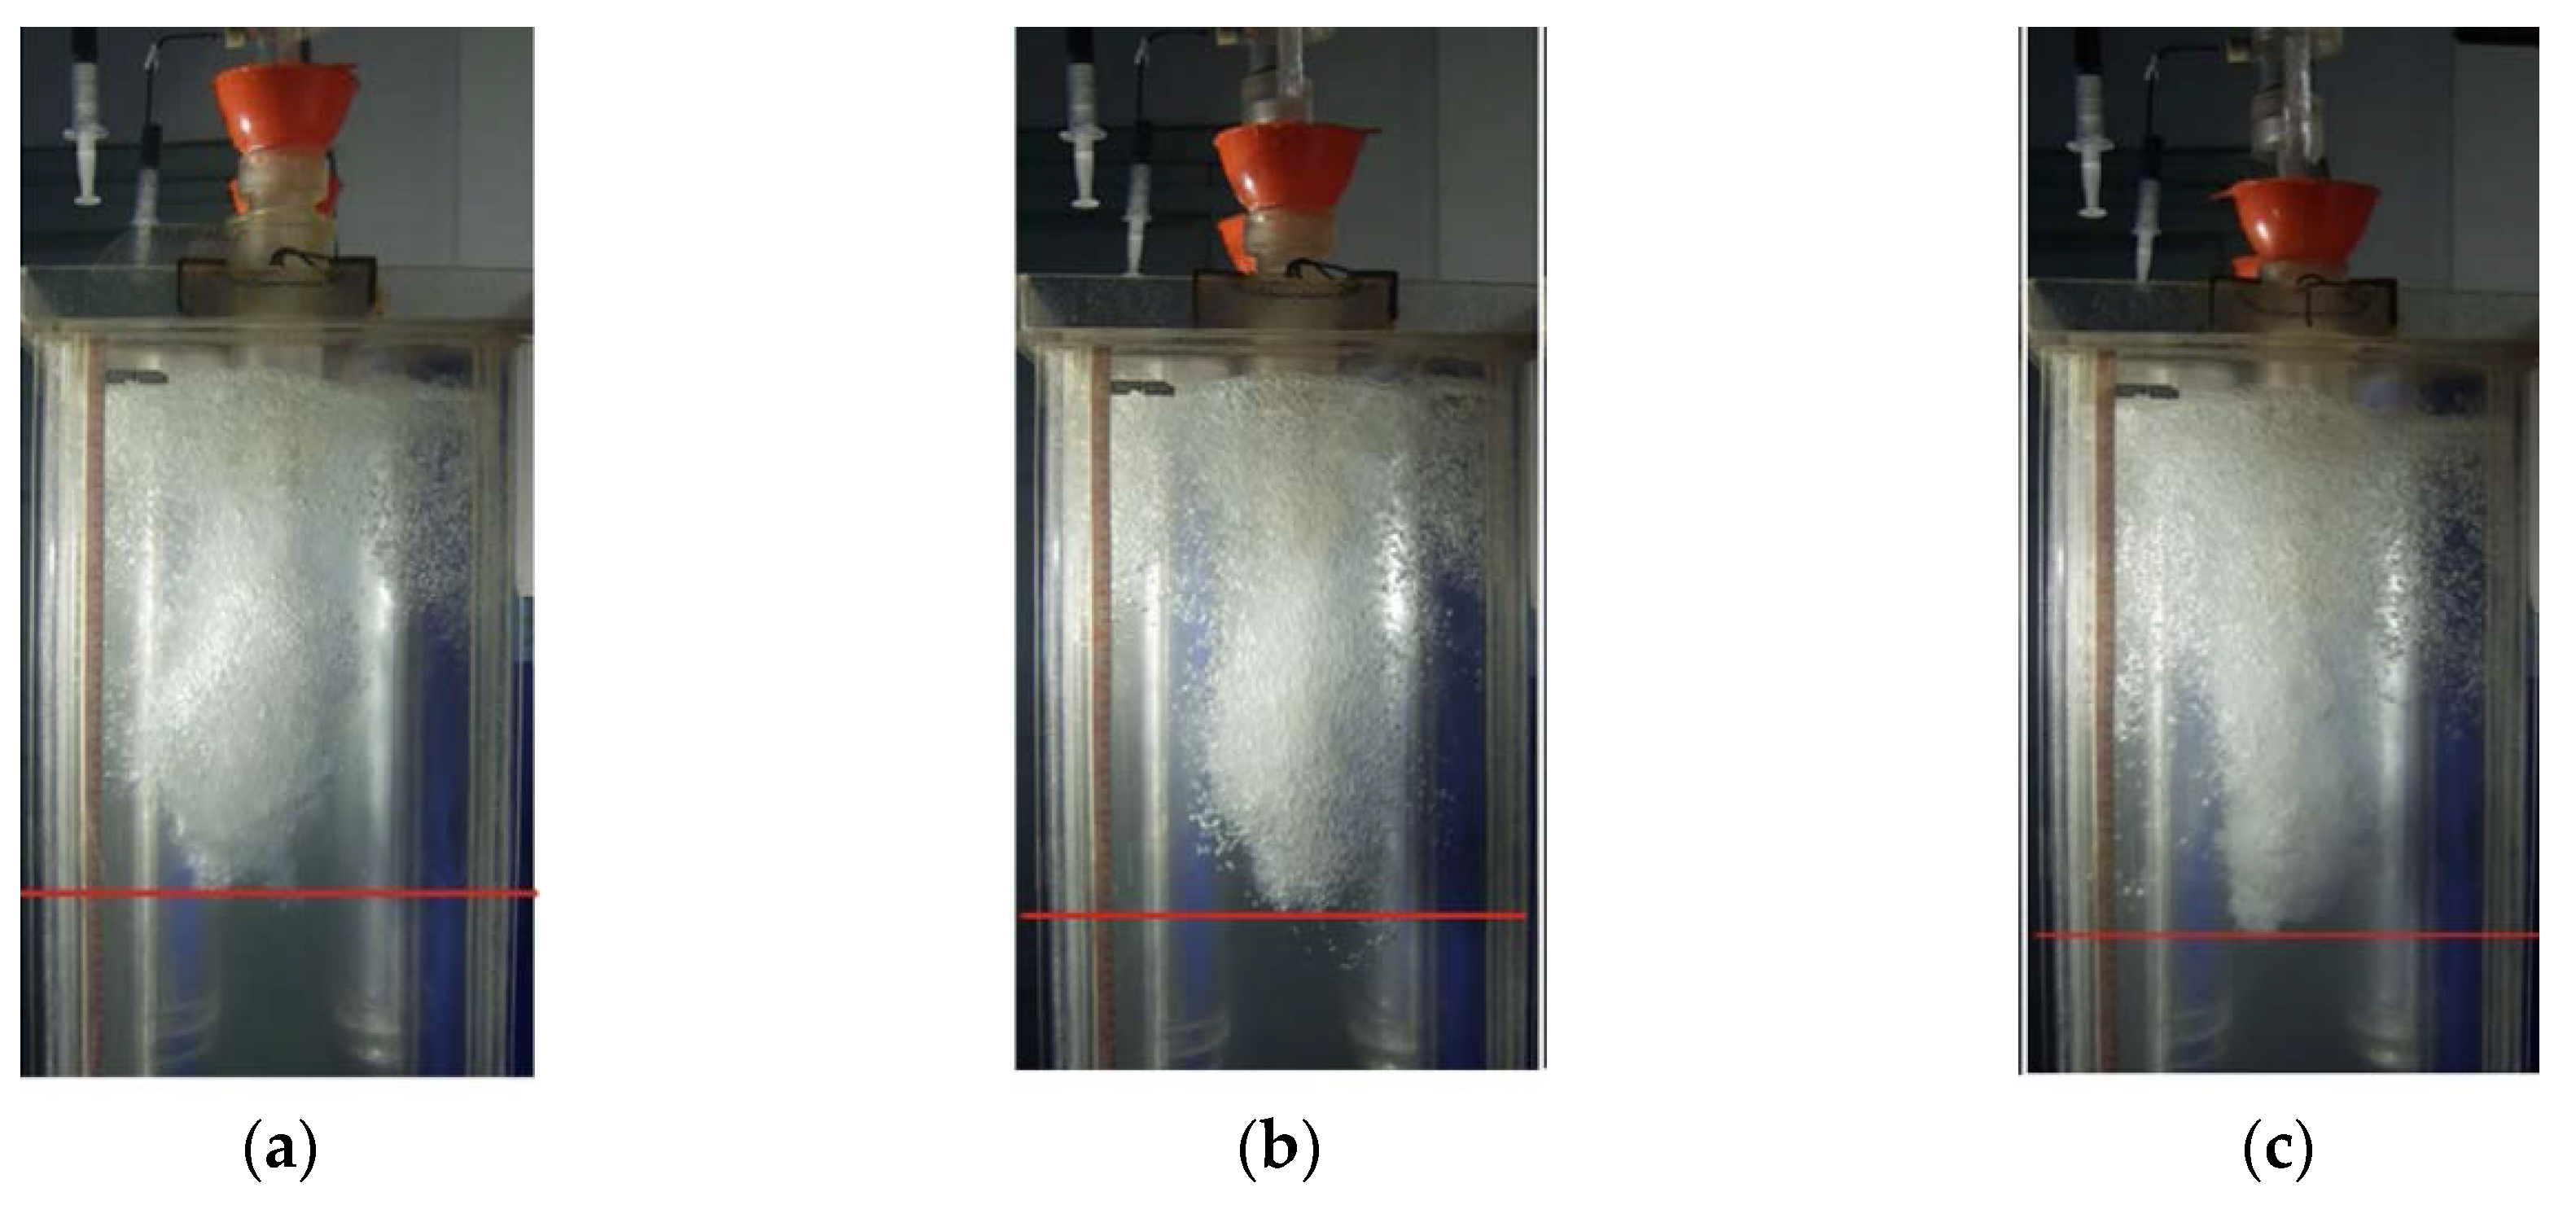
2.1. Experimental Apparatus
2.2. Similarity Conversion Between Water Model and Actual Mold
3. Numerical Modeling
3.1. Fundamental Equations
3.2. Turbulence Model
3.3. Multiphase Model
3.4. Model Implementation
3.5. Modeling Conditions
4. Results and Discussion
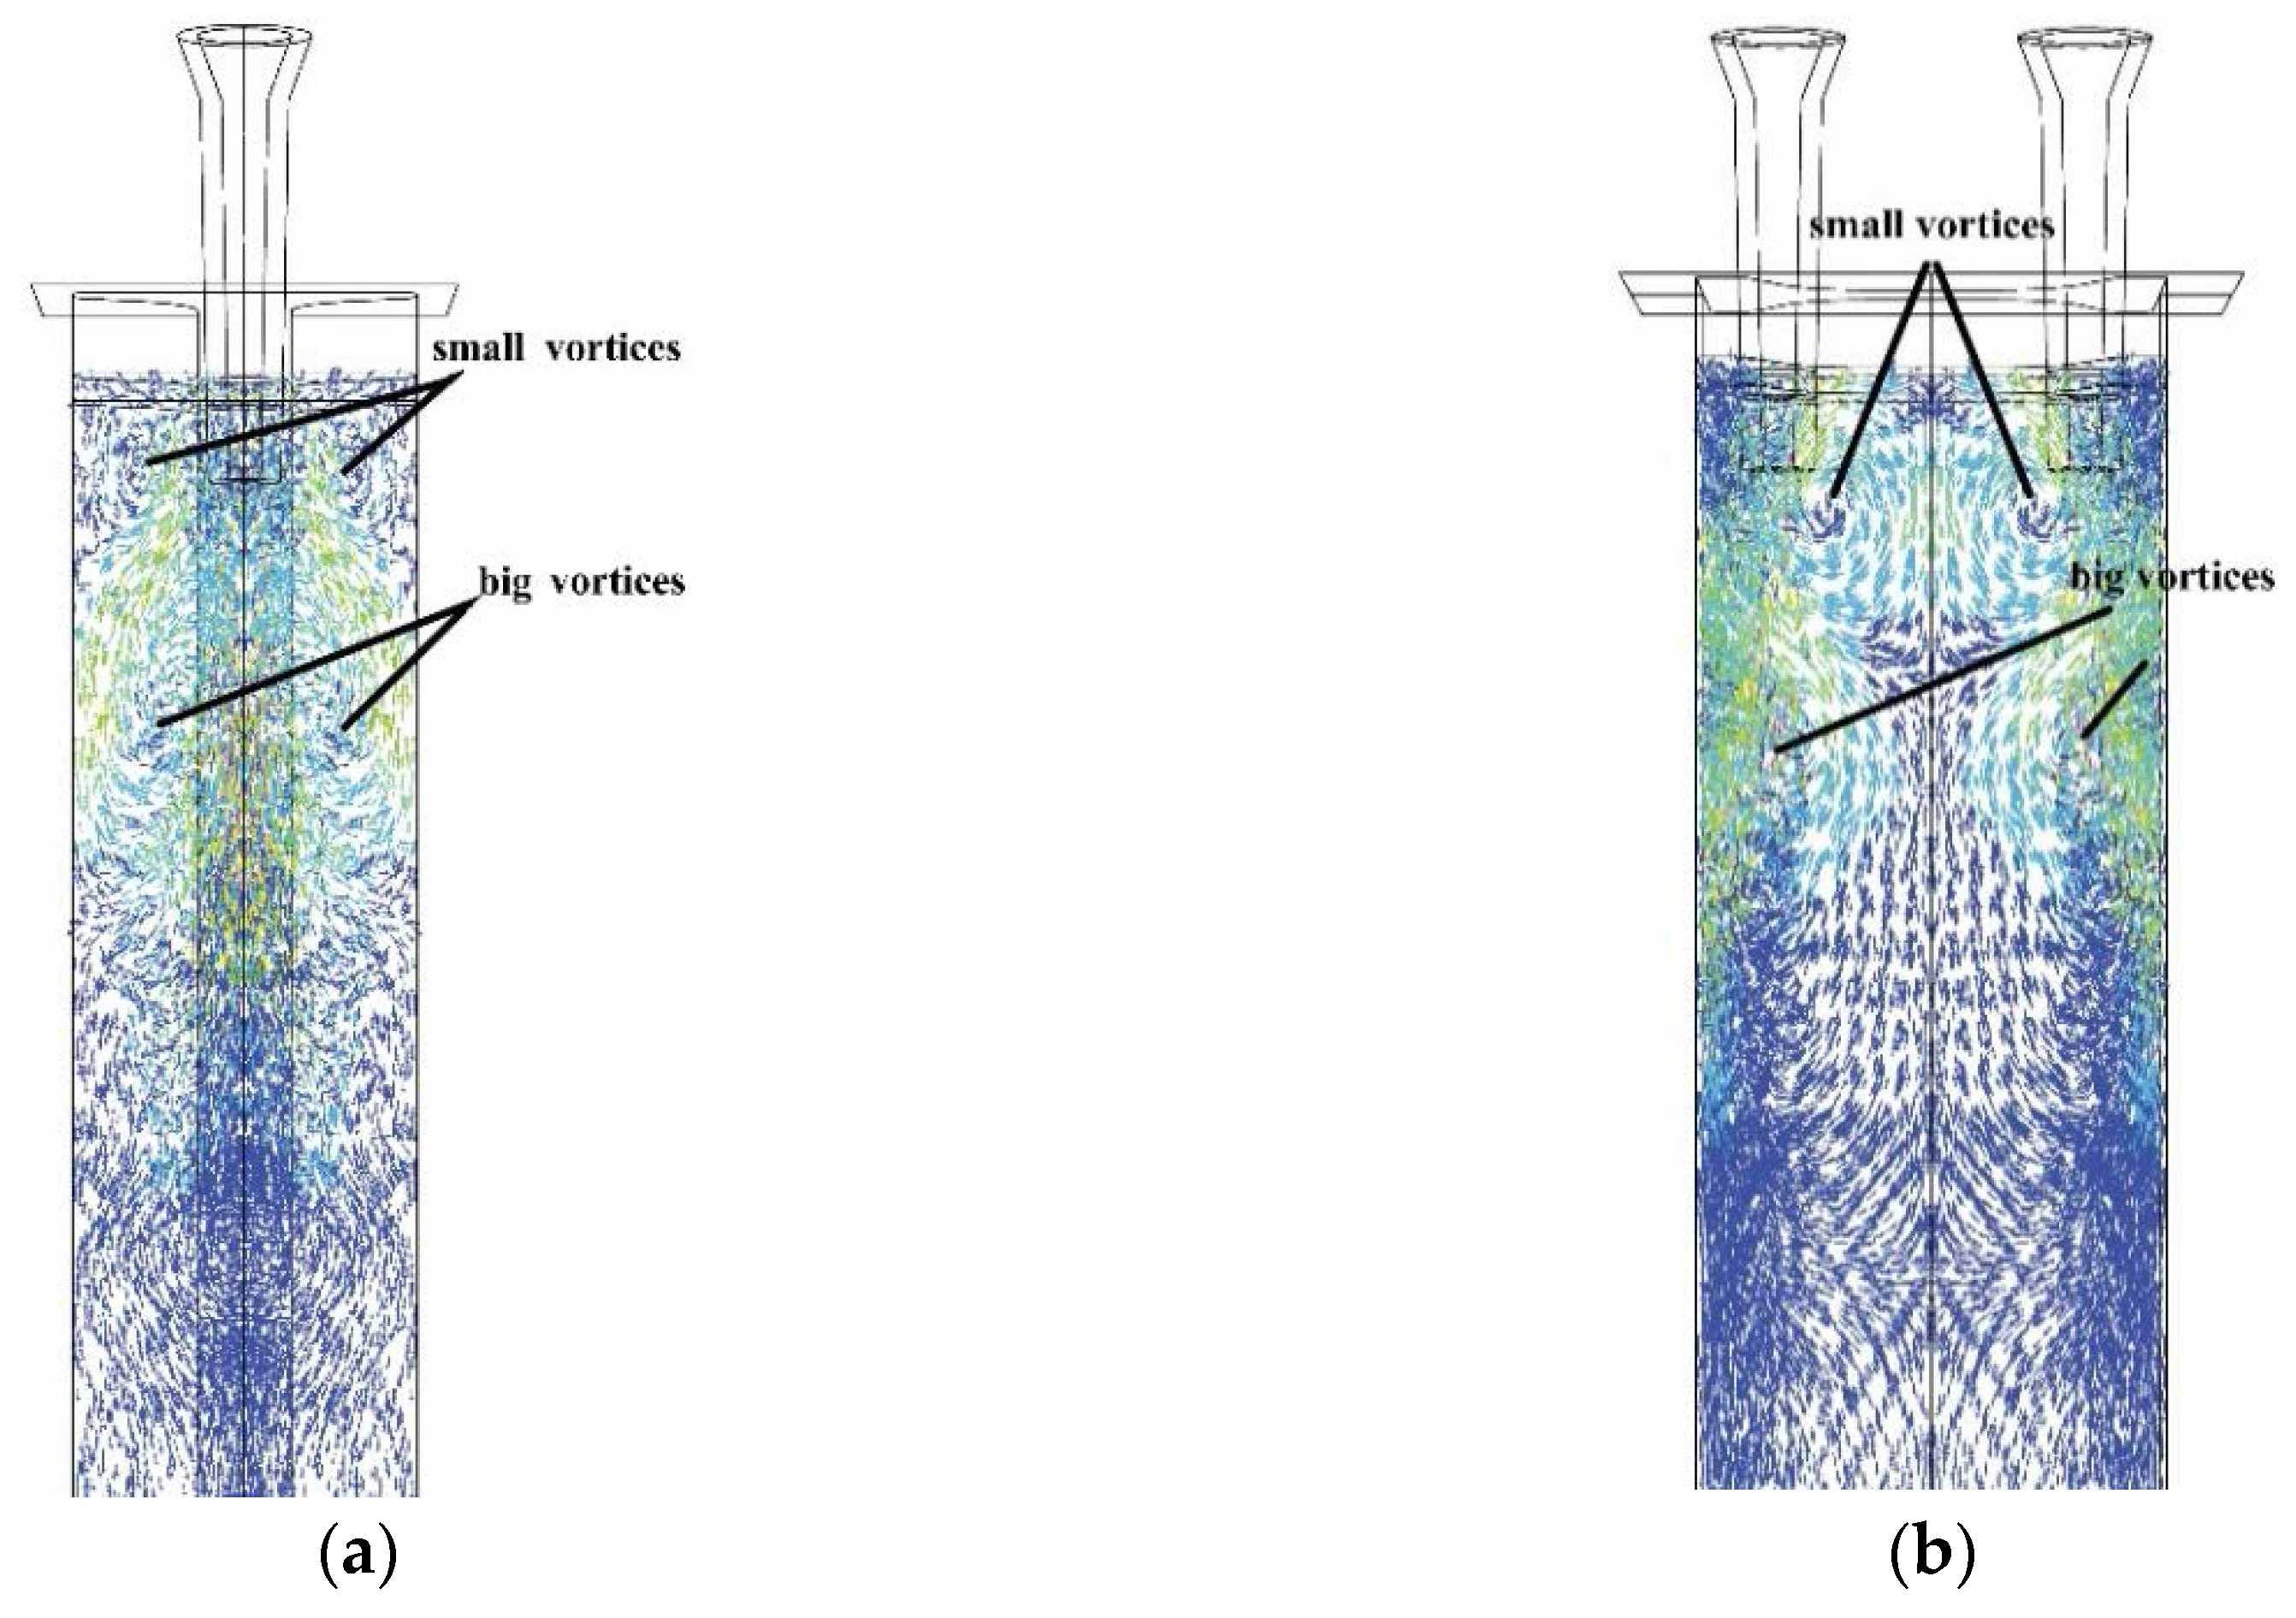
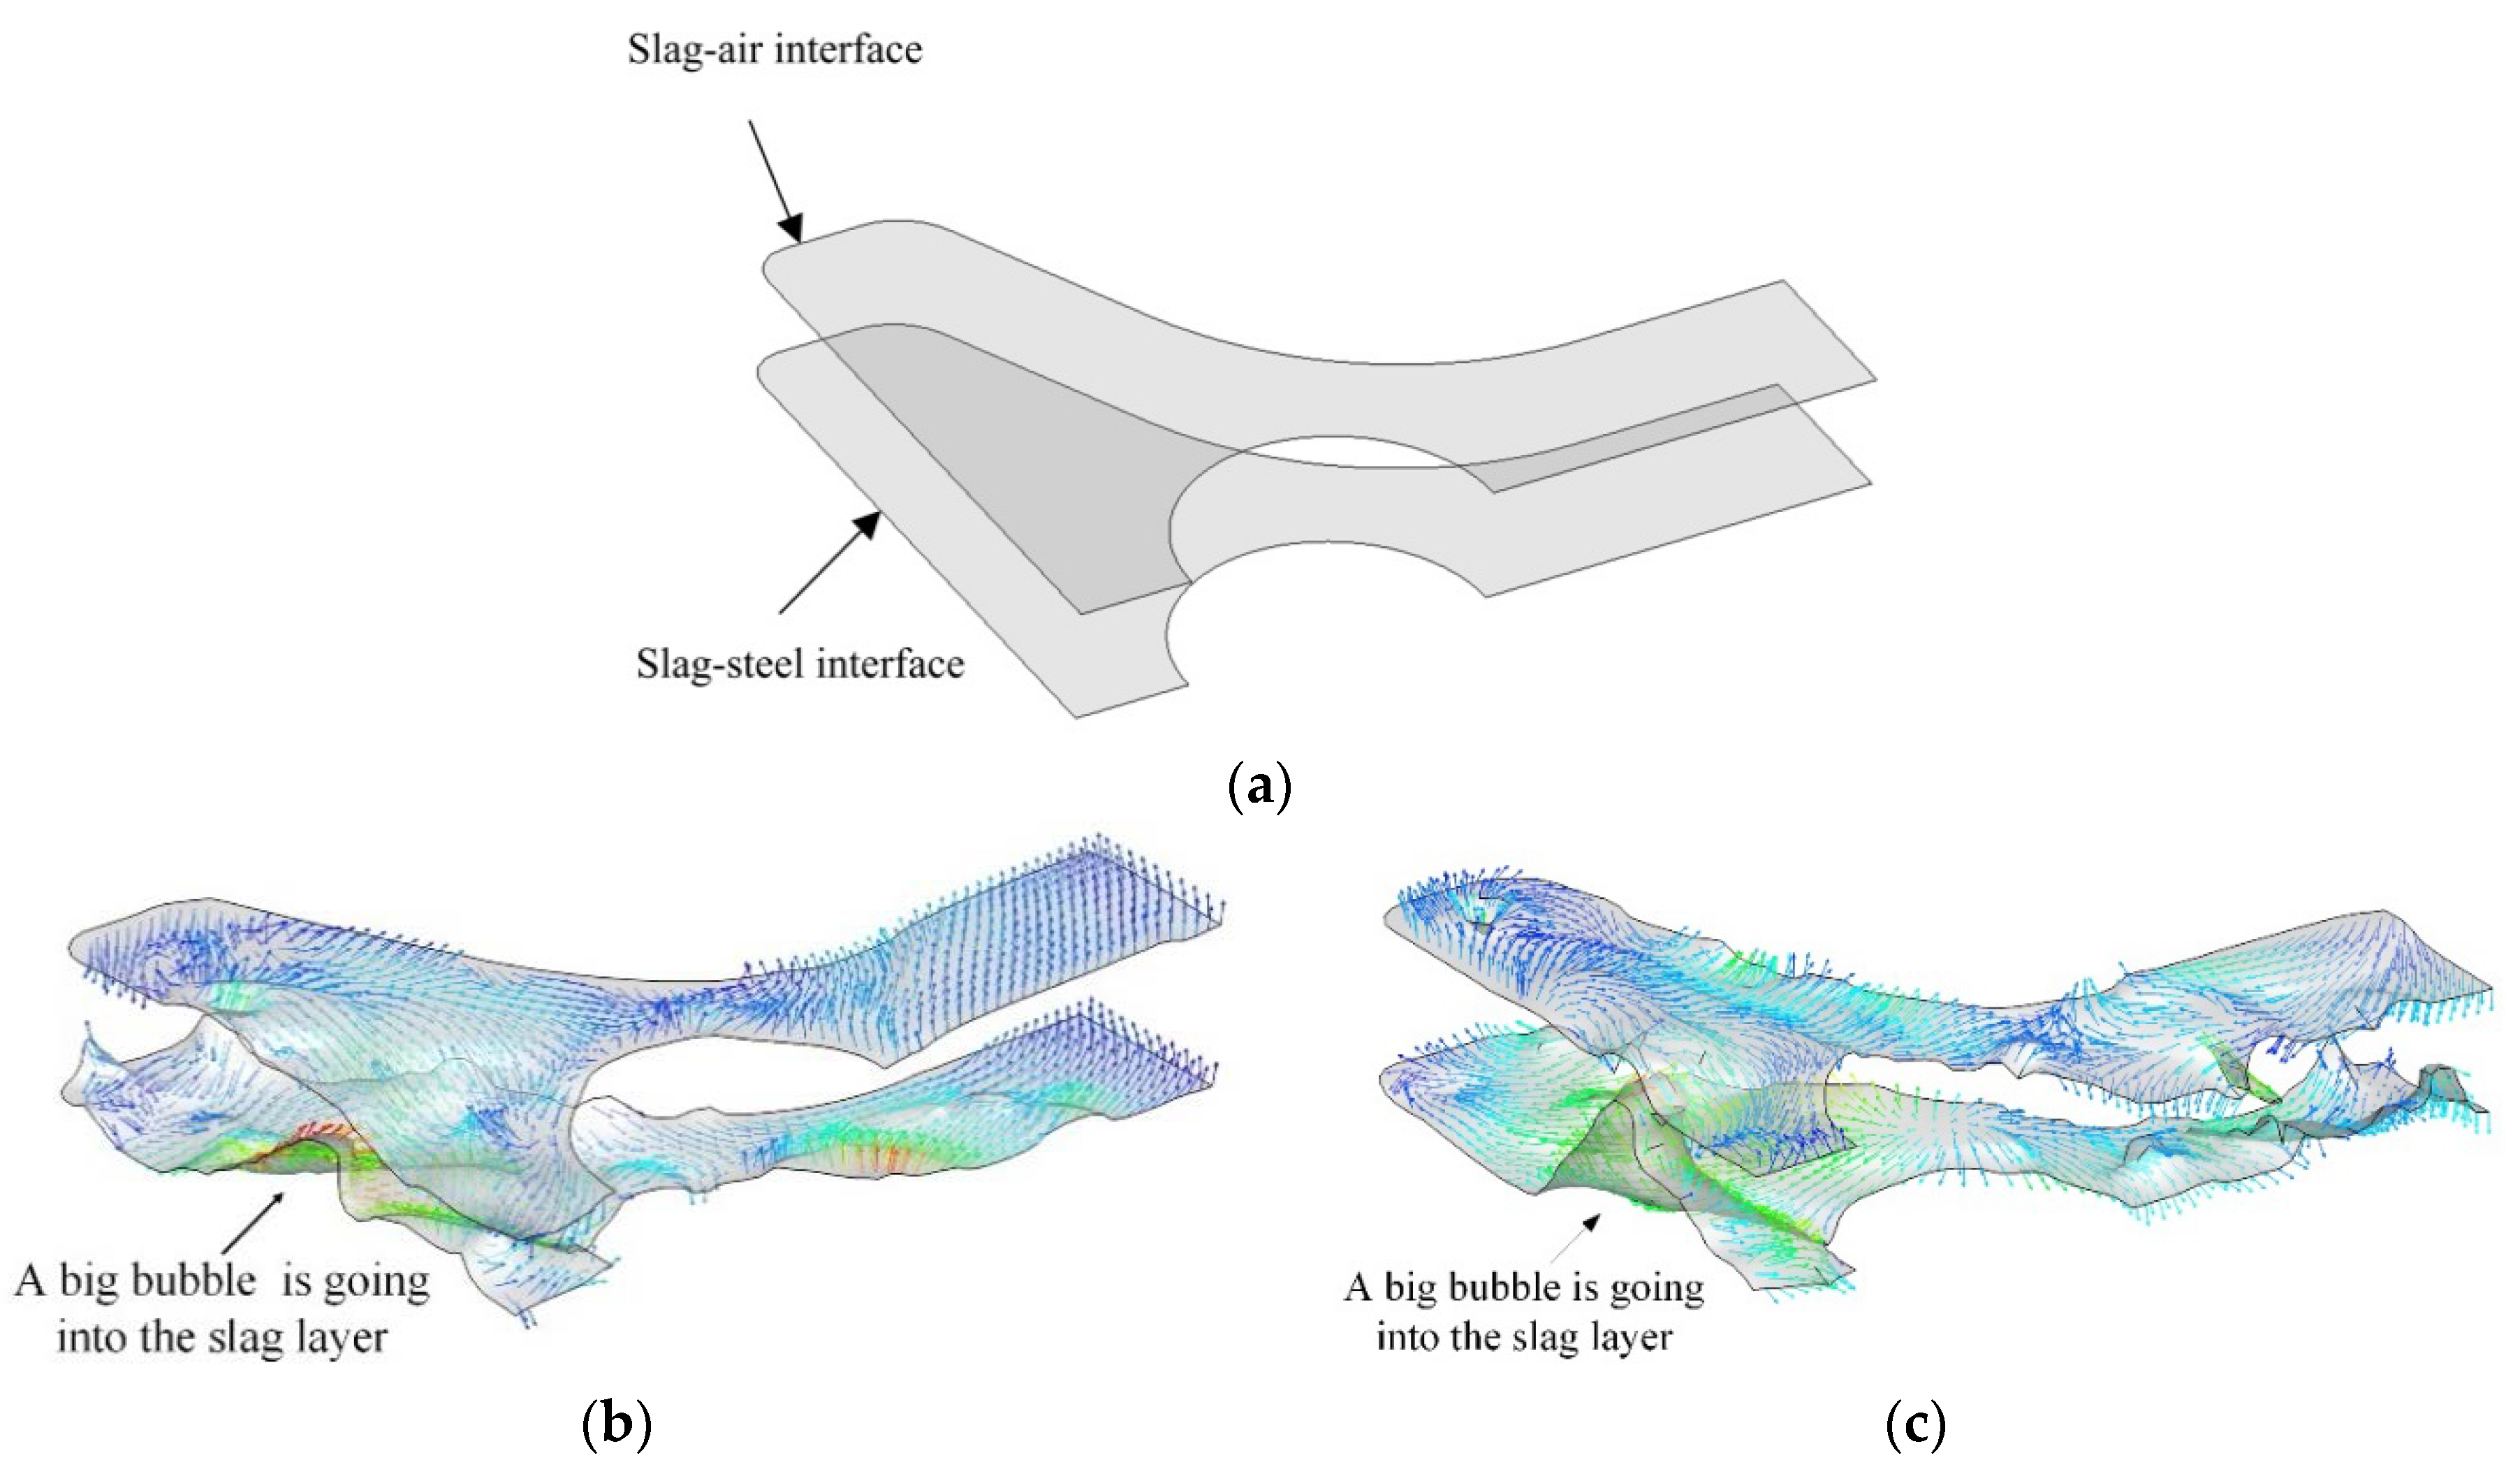
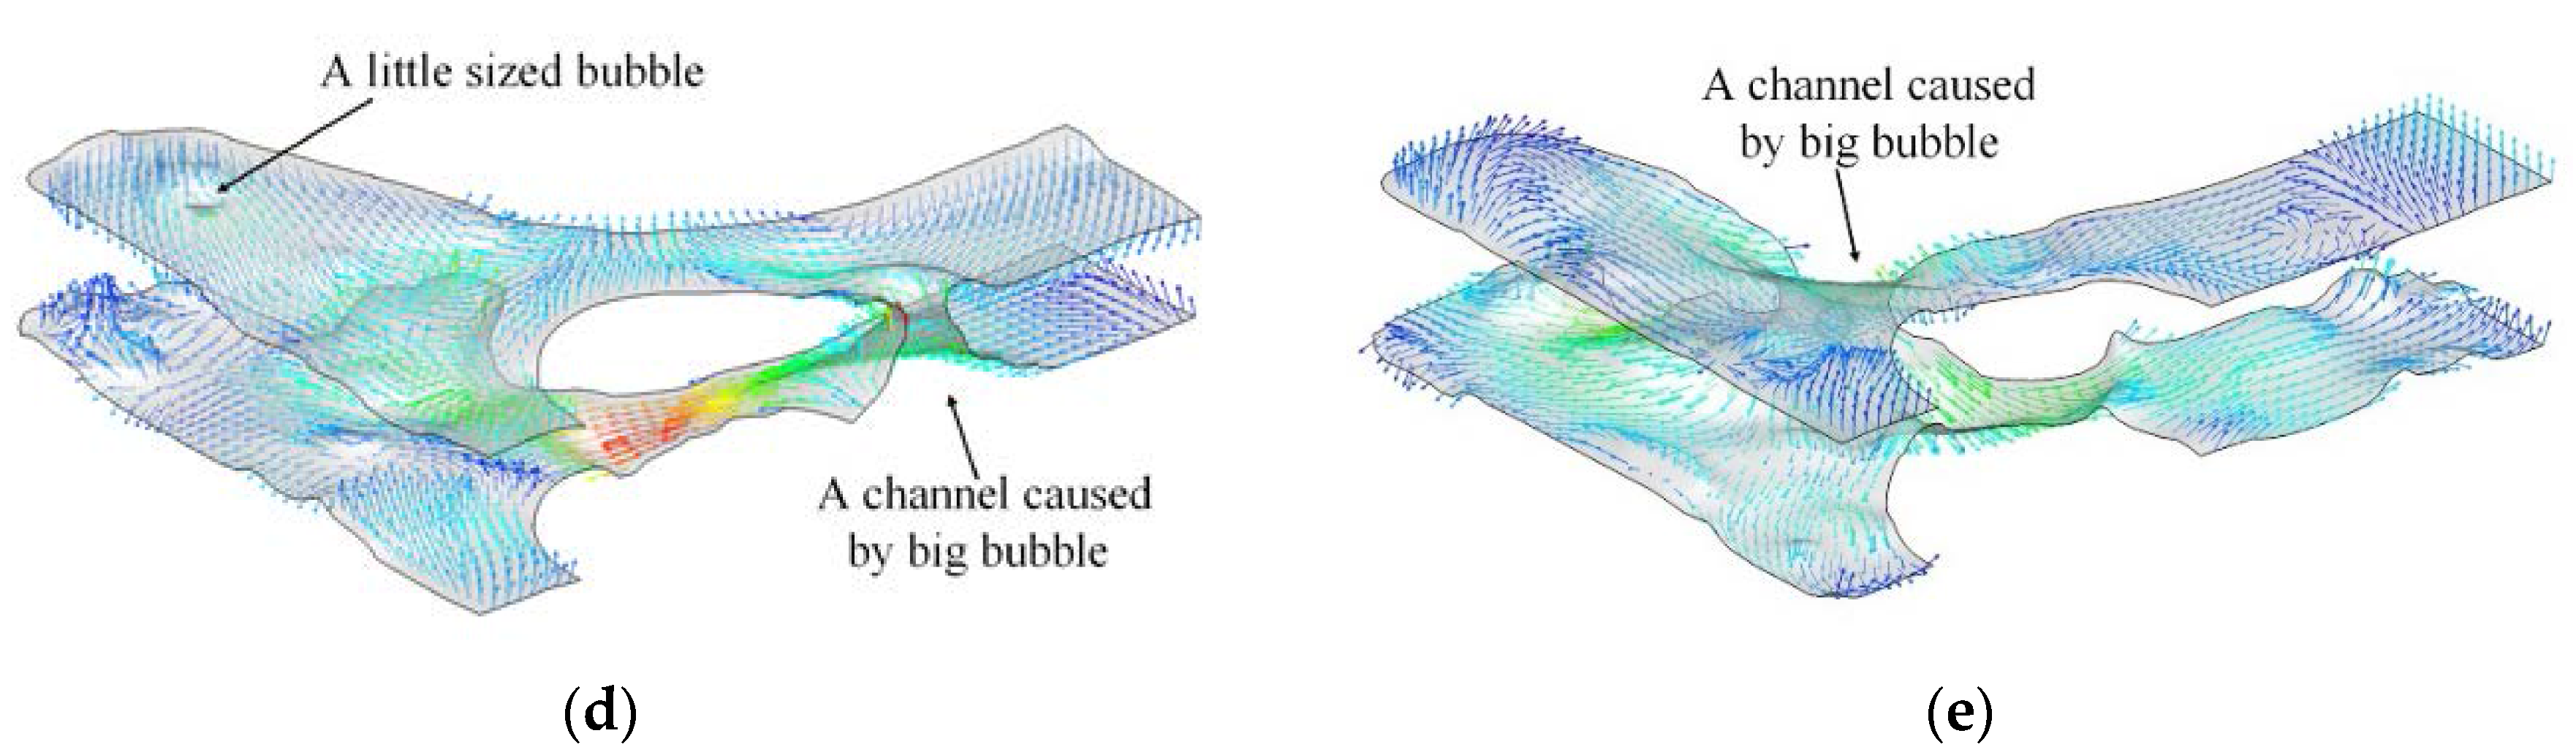
4.1. Flow Field in Molten Steel Region
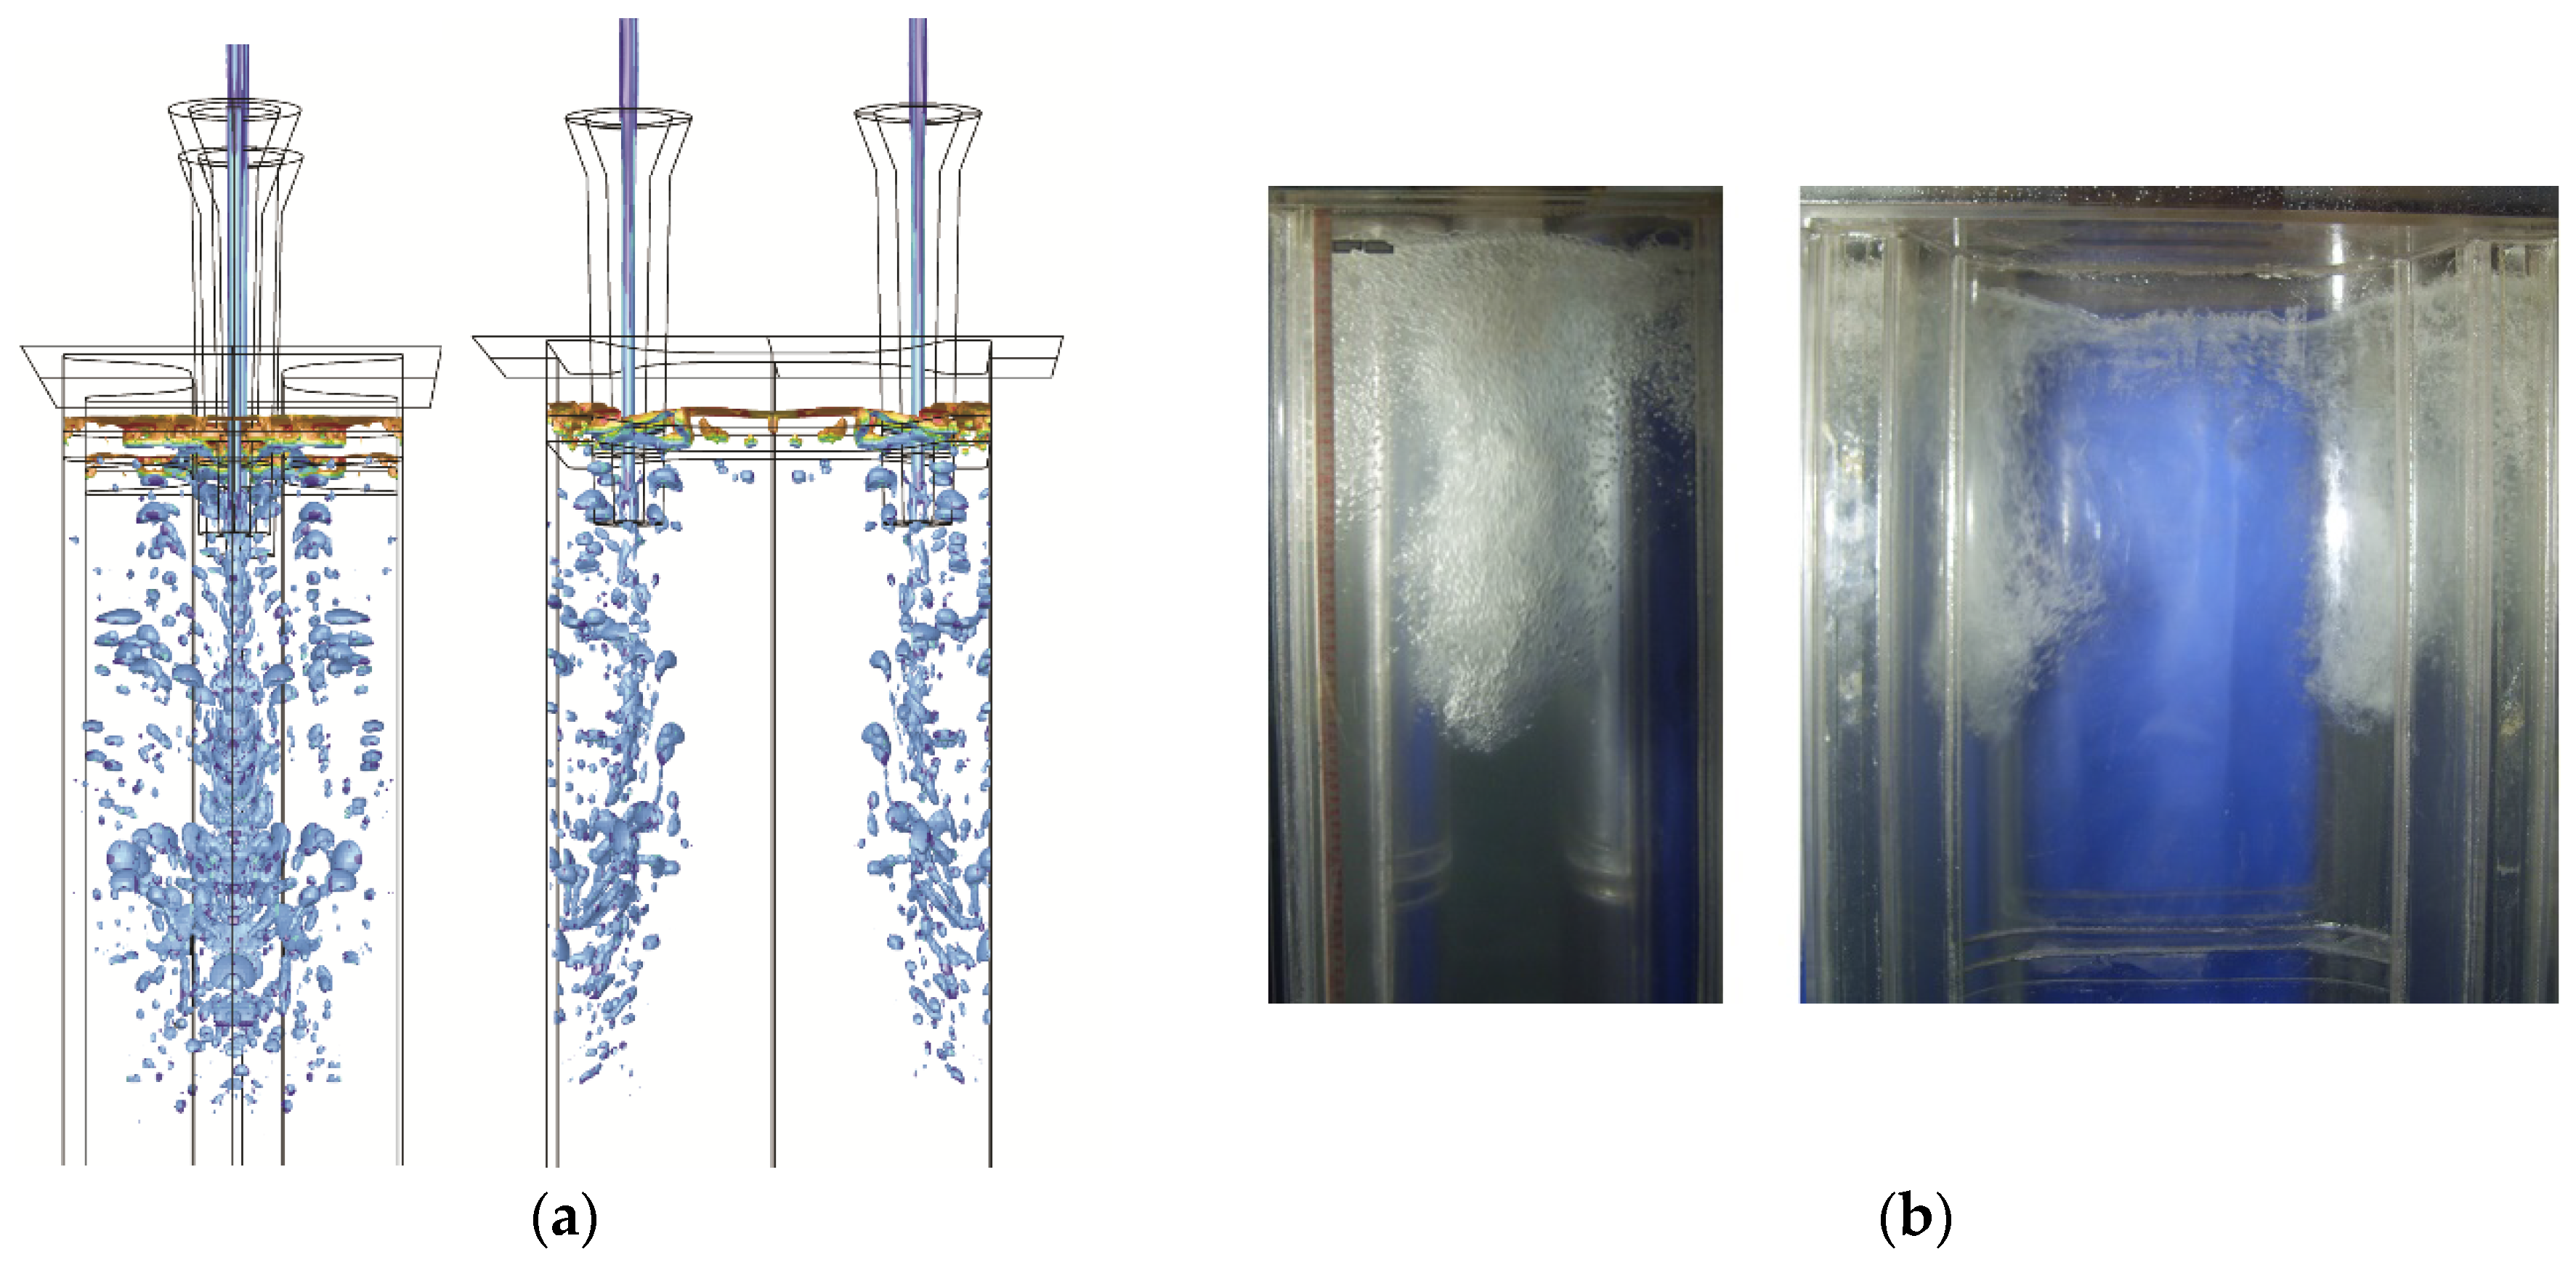
4.2. Distribution and Morphology of Bubbles
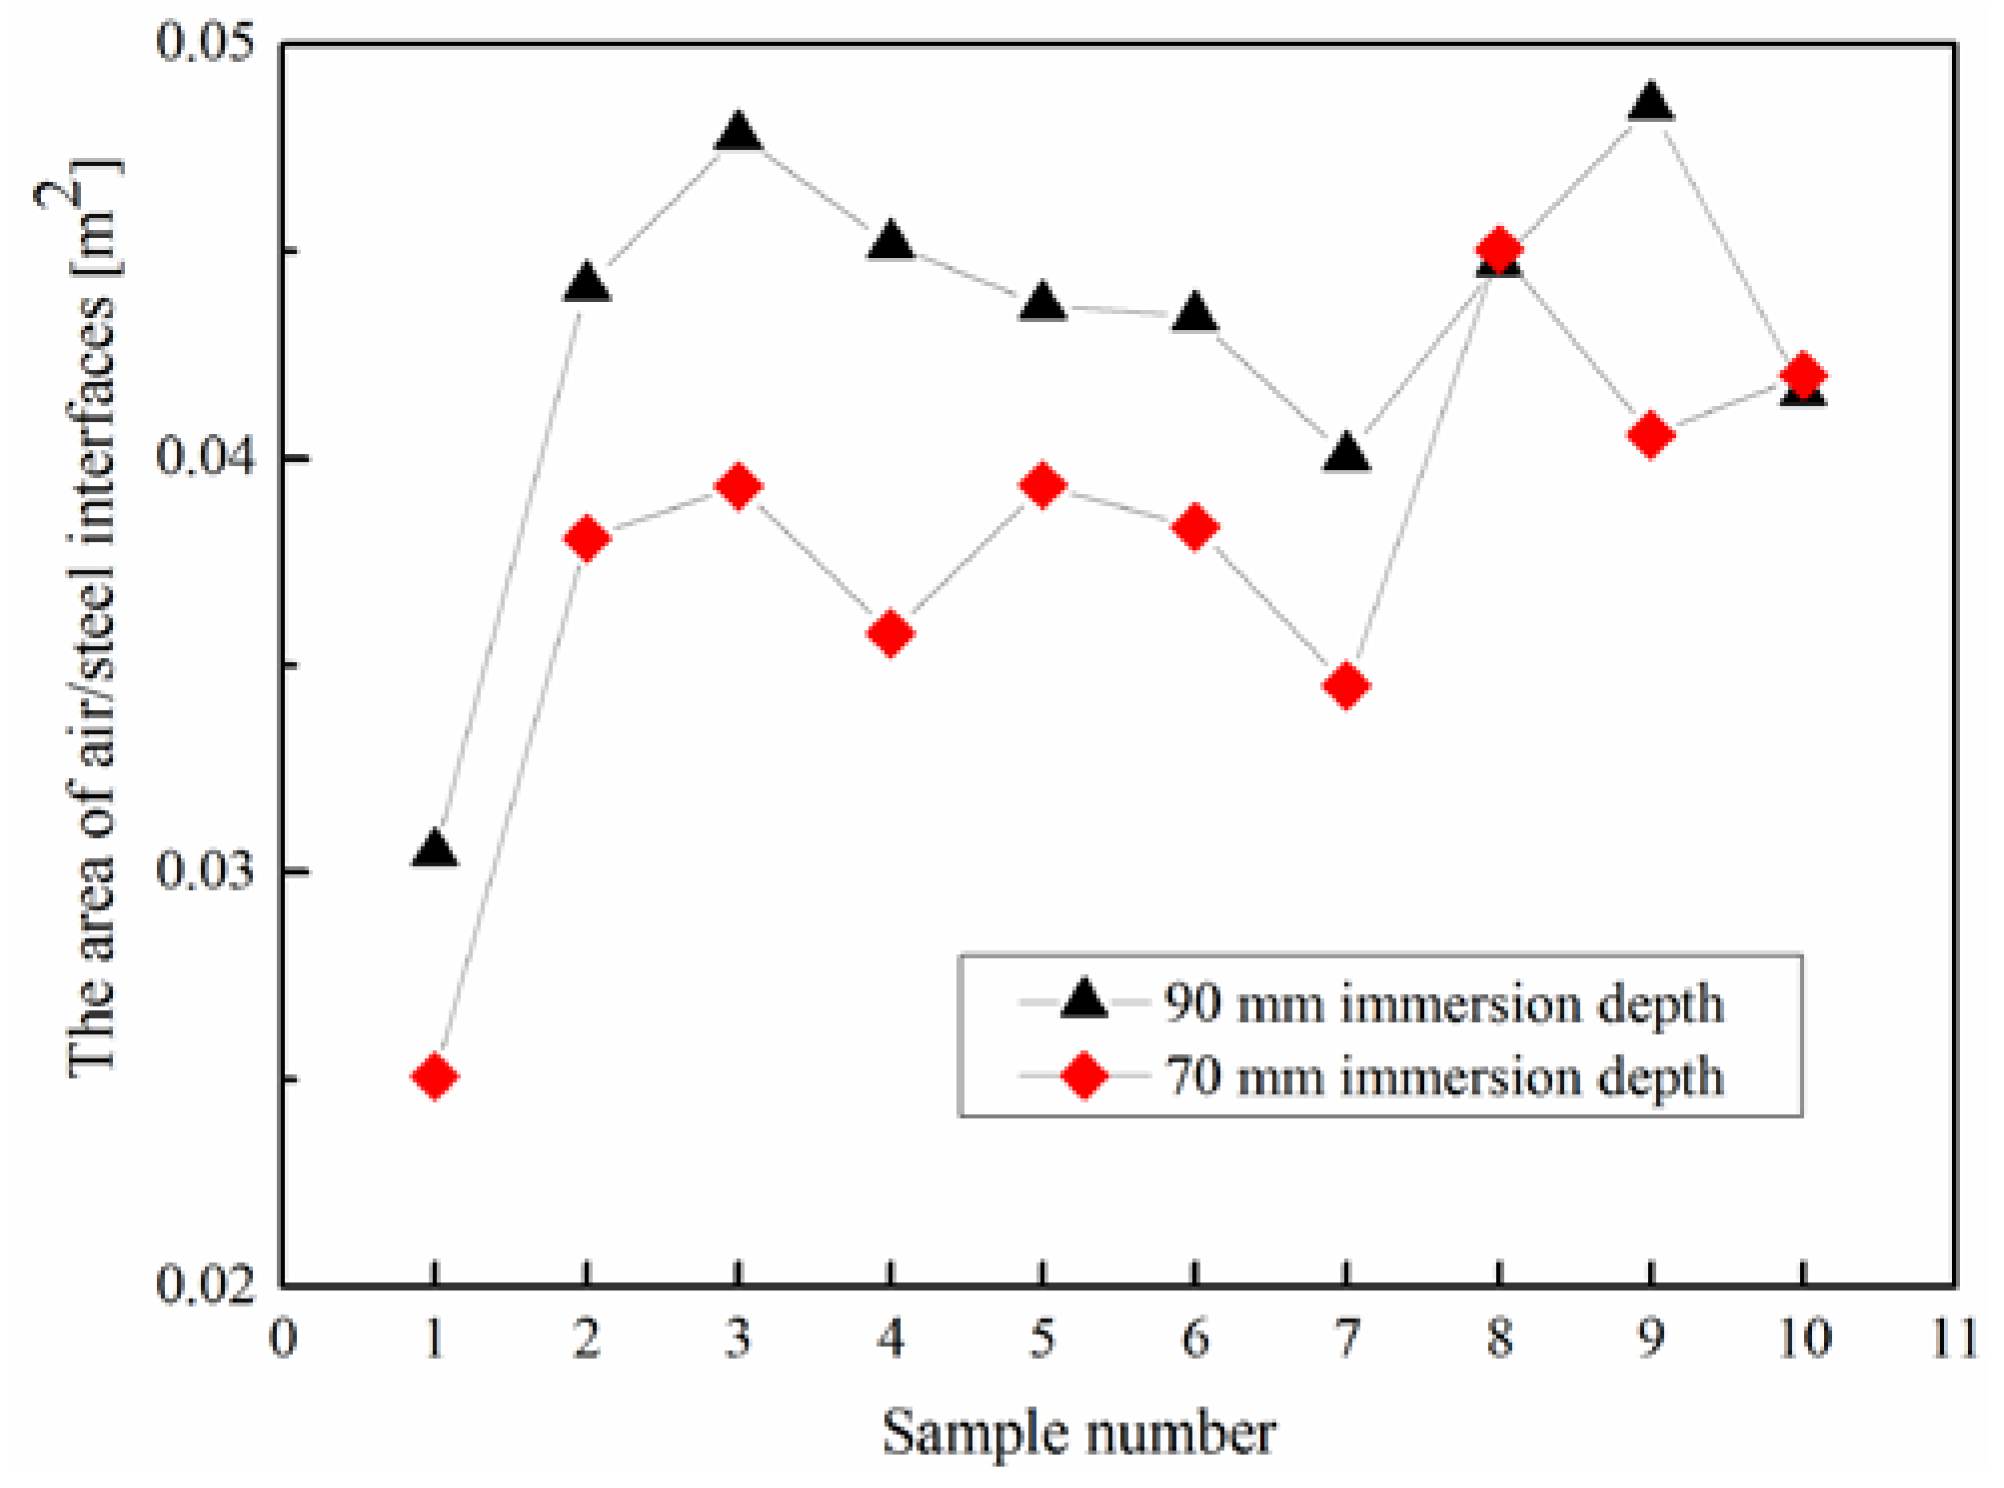
4.3. Effect of Funnel Immersion Depth
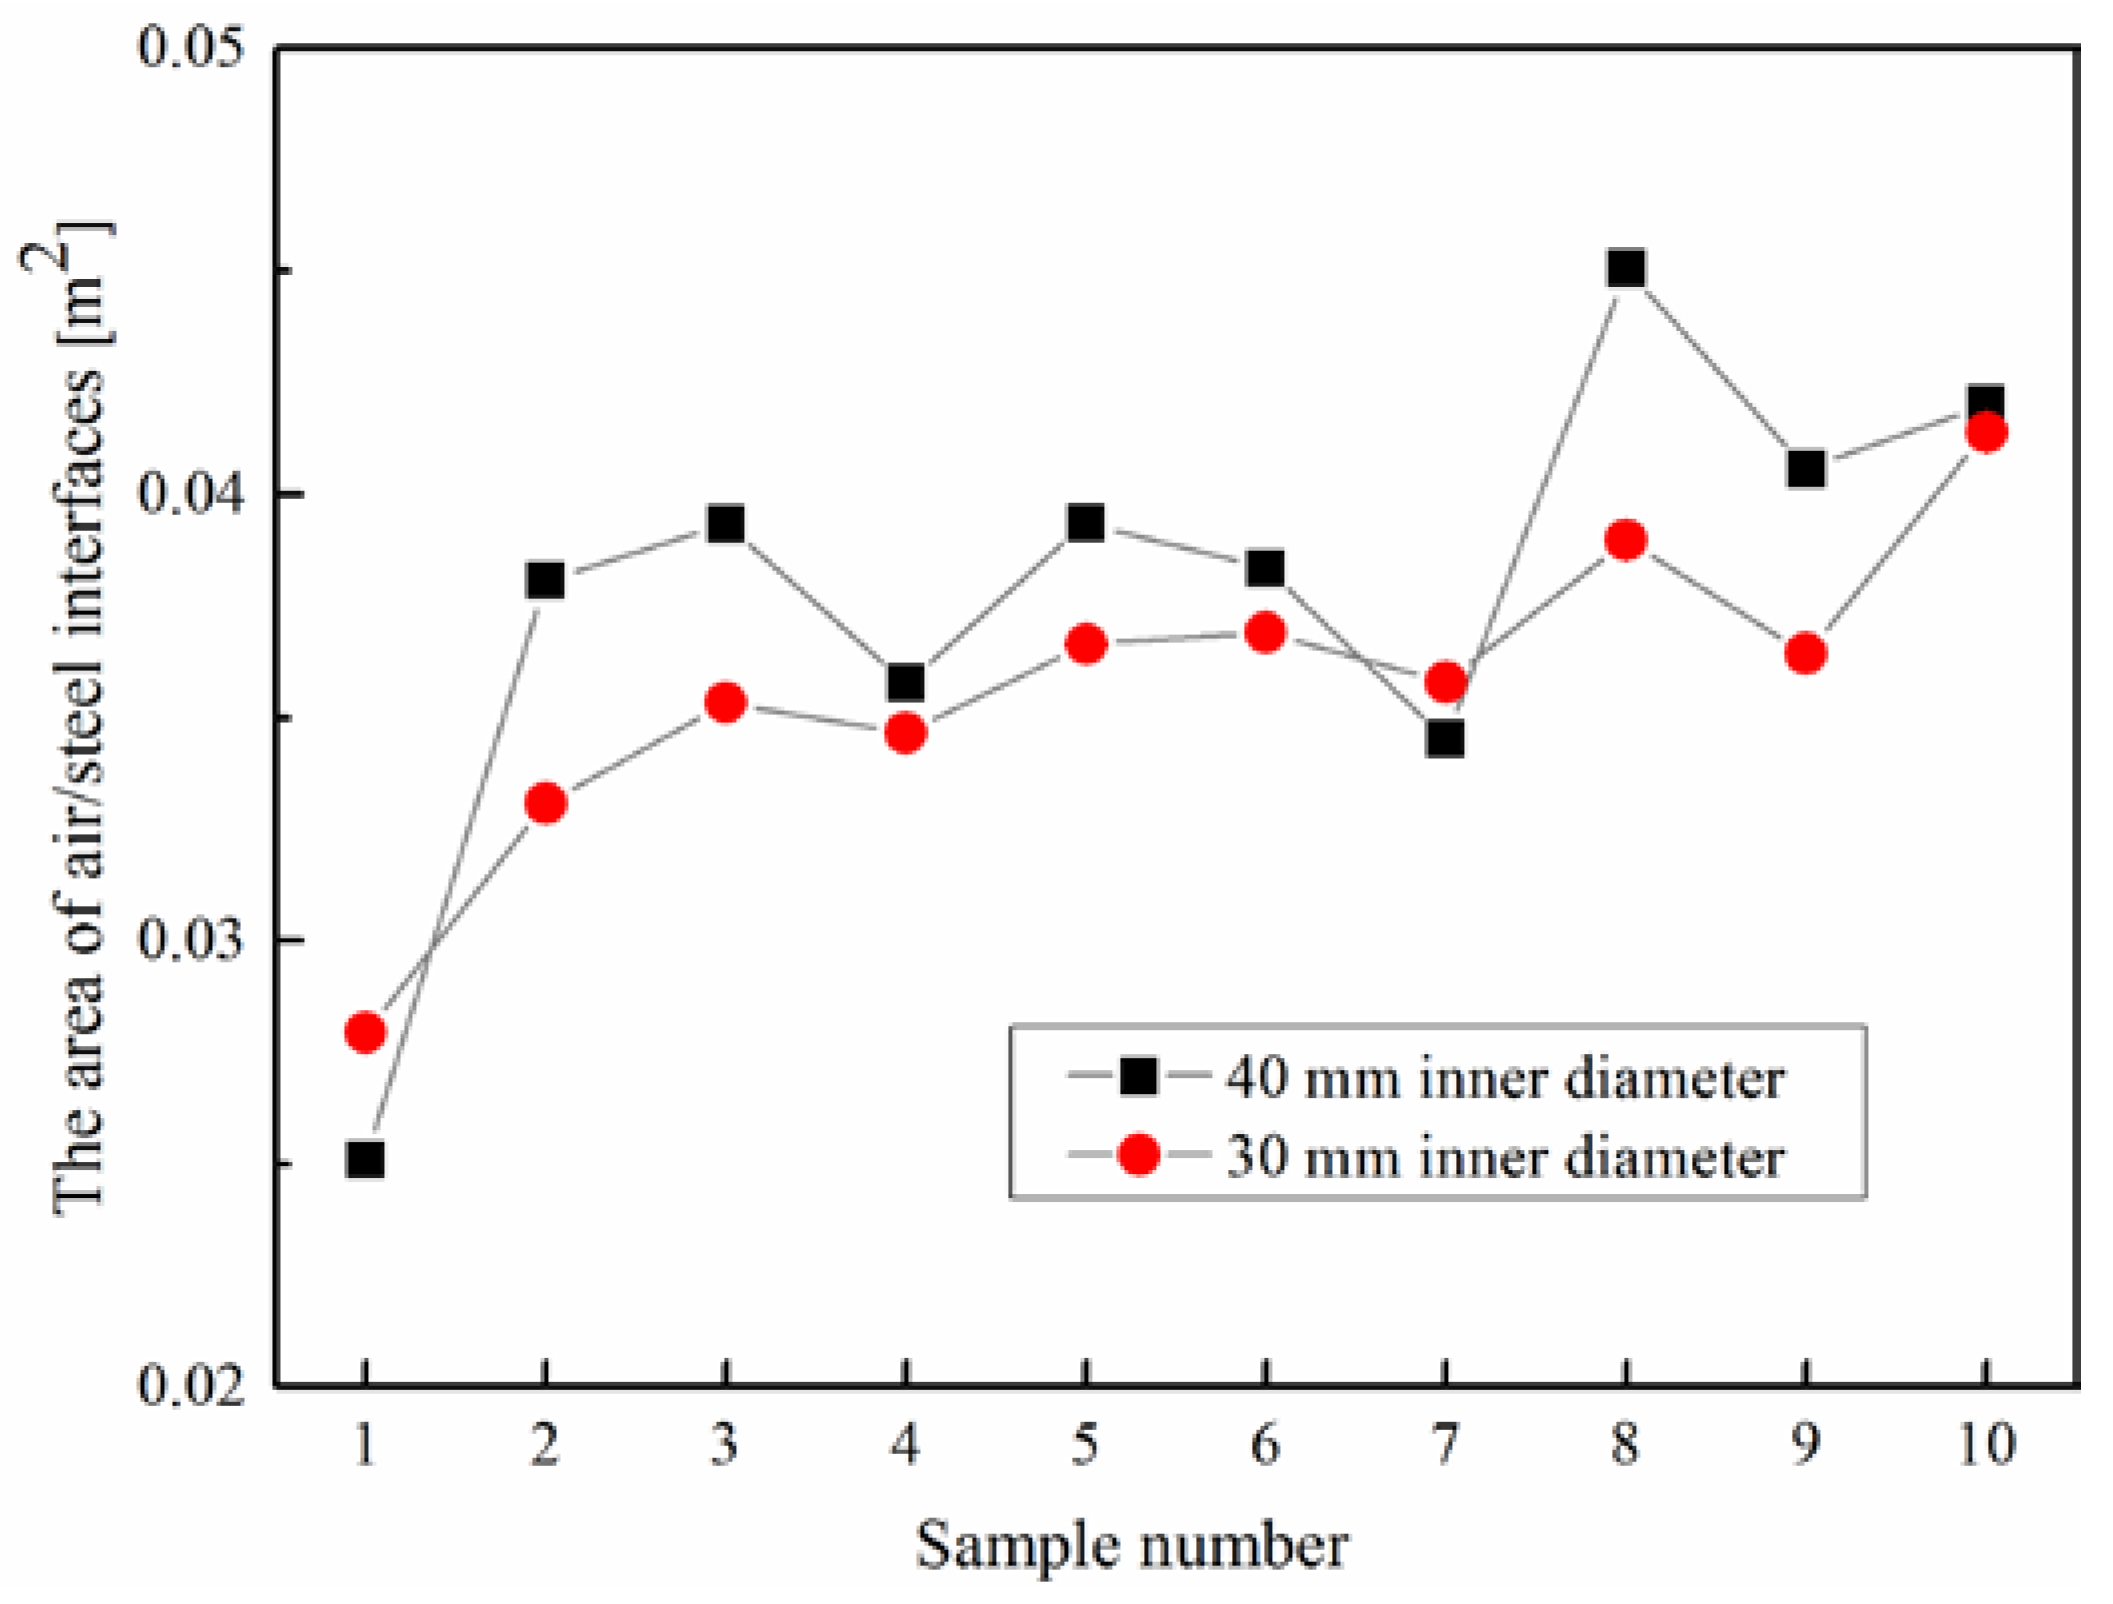
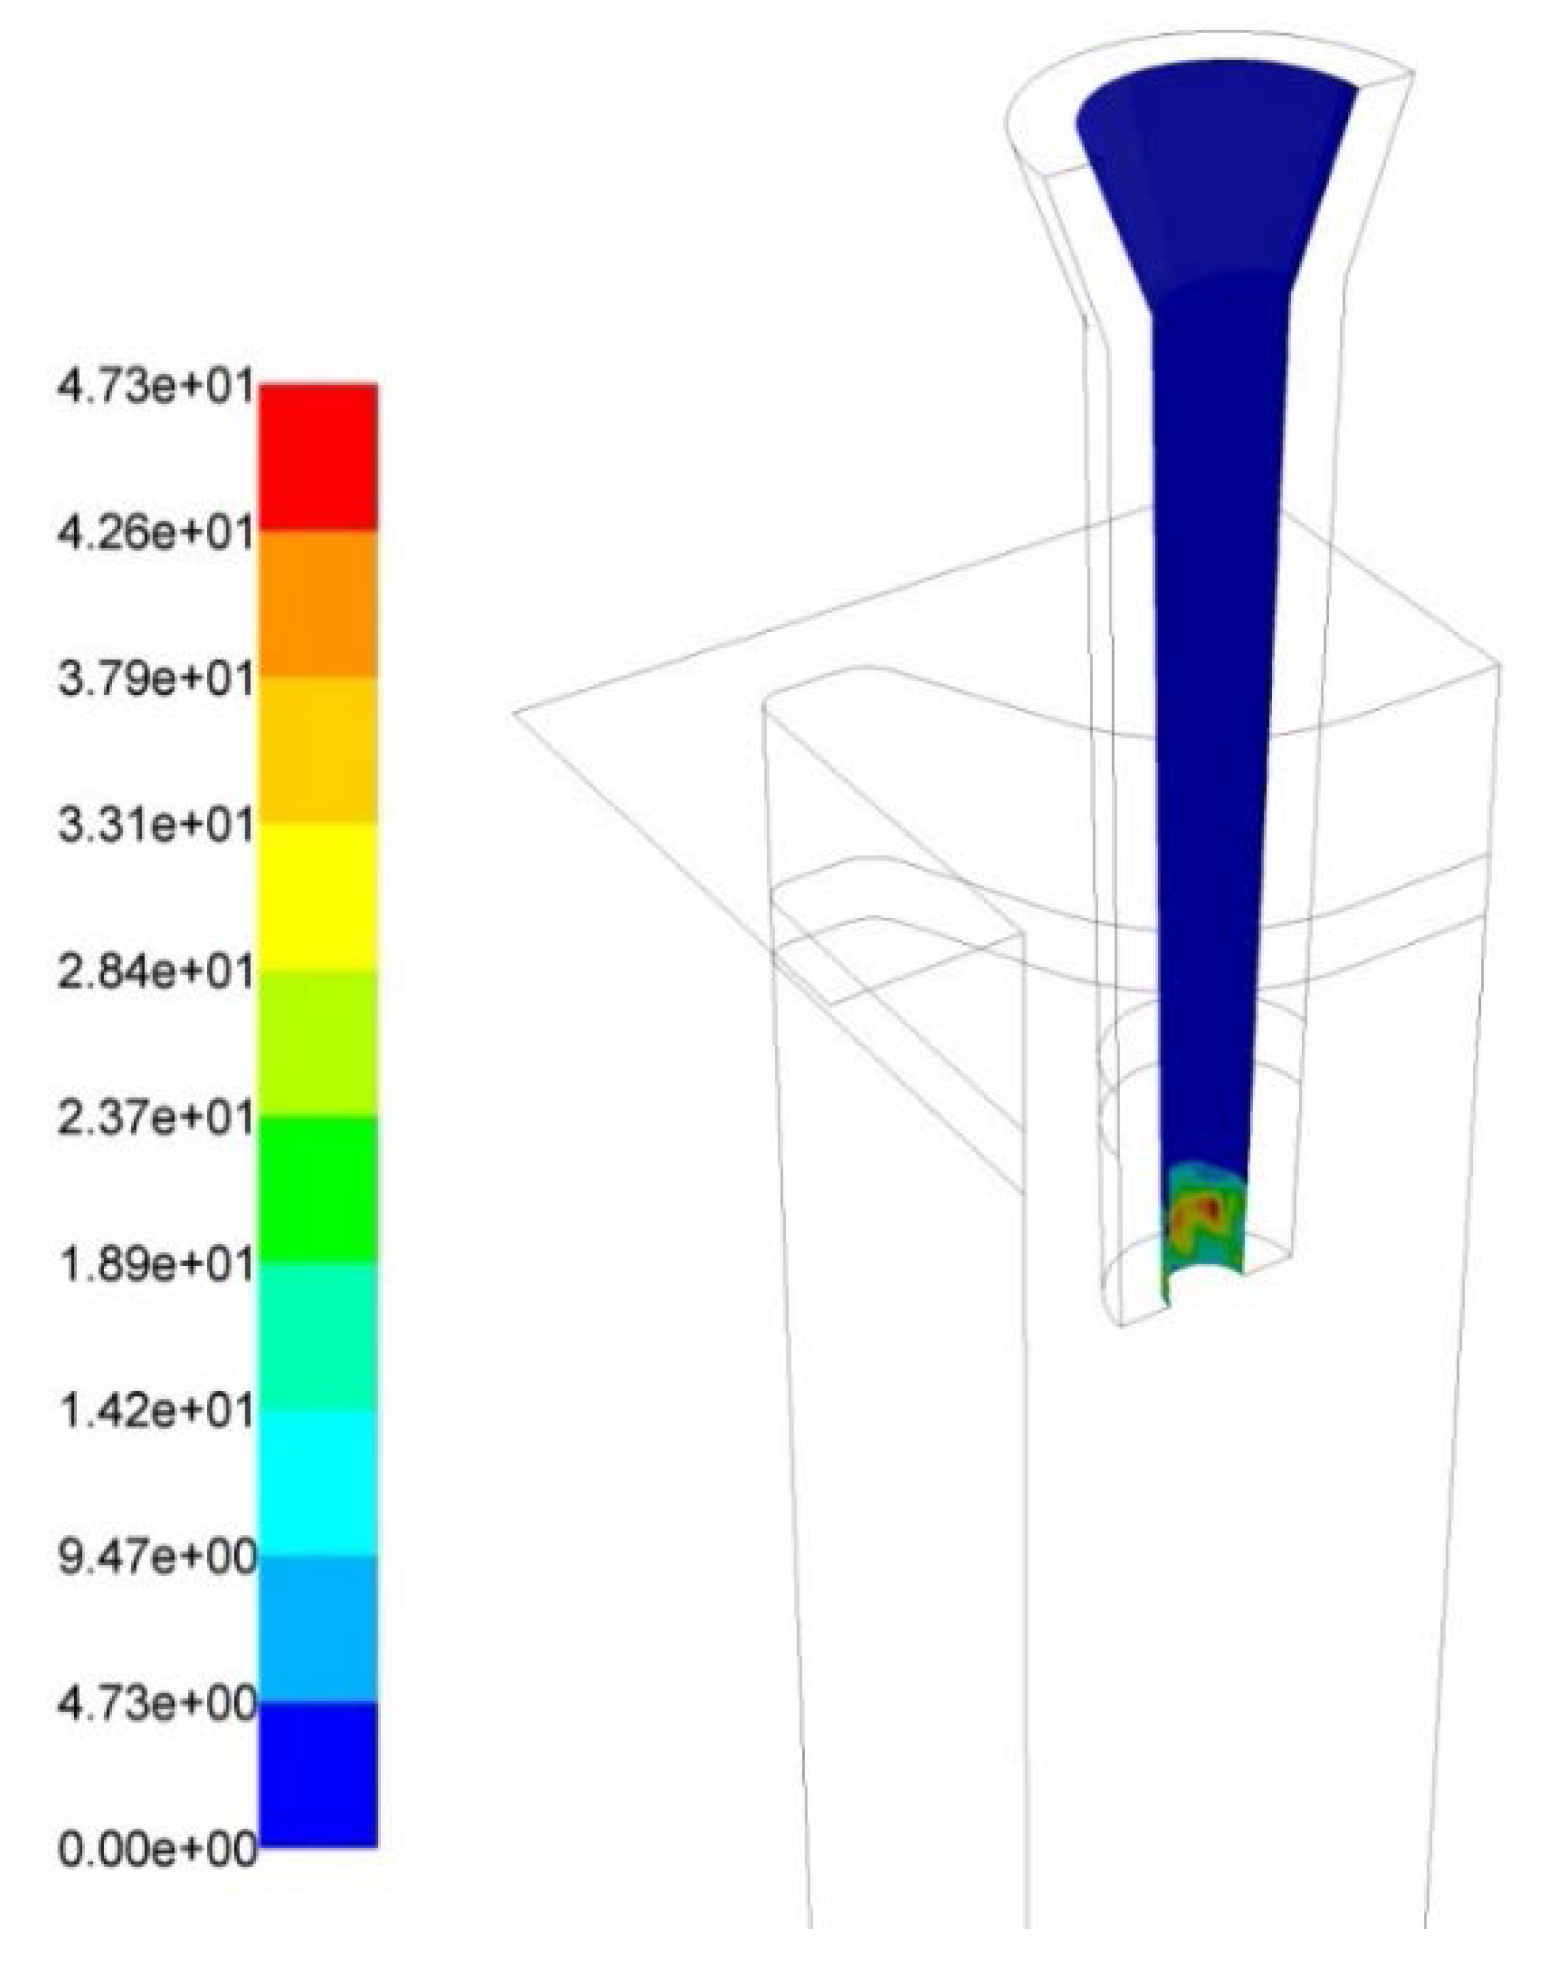
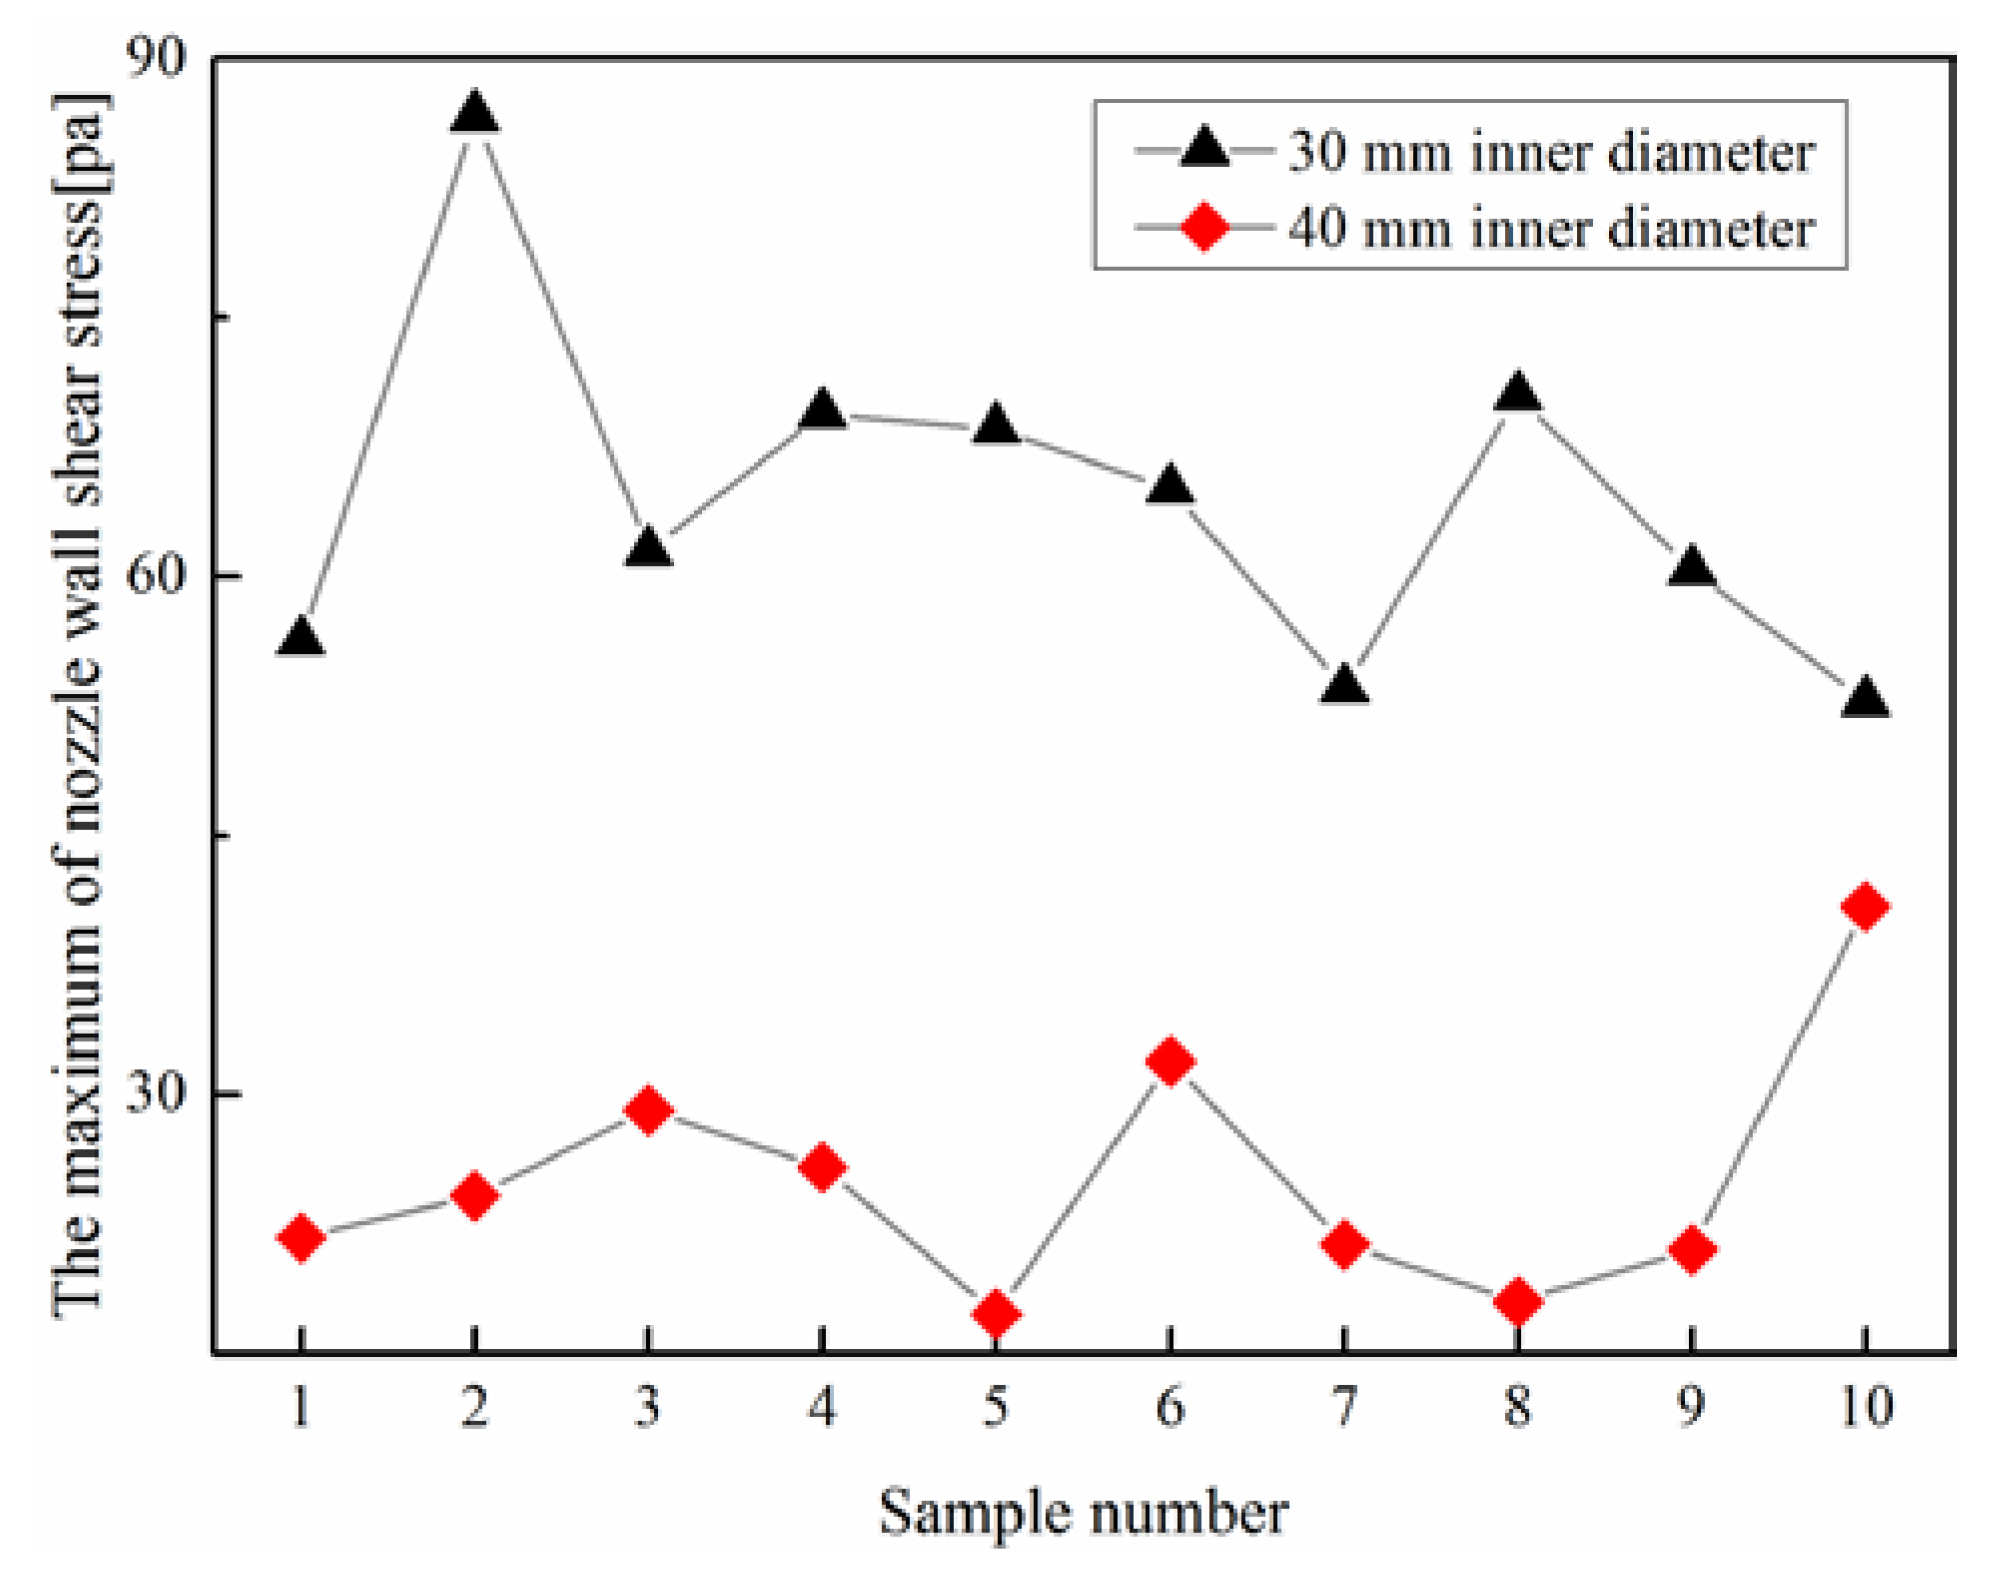
4.4. Effect of Funnel Inner Diameters on Possibility of Re-Oxidation and Refractor Erosion
5. Conclusions
Acknowledgments
Author Contributions
Conflicts of Interest
References
- Ludlow, V.; Normanton, A.; Anderson, A.; Thiele, M.; Ciriza, J.; Laraudogoitia, J.; van der Knoop, W. Strategy to minimise central segregation in high carbon steel grades during billet casting. Ironmak. Steelmak. 2005, 32, 68–74. [Google Scholar] [CrossRef]
- Machado-Lopez, M.M.; Ramos-Banderas, J.A.; Torres-Alonso, E.; Barreto, J.J.; Garcia-Hernandez, S. Multiphase modelling of liquid steel transfer from tundish to curved billet mould by open stream and equipped with SEN. Ironmak. Steelmak. 2013, 40, 326–334. [Google Scholar] [CrossRef]
- Pinheiro, C.; Samarasekera, I.; Brimacombe, J.; Howes, B.; Gussias, O. Mould heat transfer and continuously cast billet quality with mould flux lubrication Part 2 quality issues. Ironmak. Steelmak. 2000, 27, 144–159. [Google Scholar] [CrossRef]
- Foundation, A.S.; Cramb, A.W. The Making, Shaping and Treating of Steel: Casting Volume; AISE Steel Foundation: Warrendale, PA, USA, 2003. [Google Scholar]
- Hibbeler, L.C.; Xu, K.; Thomas, B.G.; Koric, S.; Spangler, C. Thermomechanical modeling of beam blank casting. Iron Steel Technol. 2009, 6, 60–74. [Google Scholar]
- Su, S.; Sun, W.; Pan, G. High Efficient Energy-Saving Construction Steel: Hot-Rolled h-Beam; Metallurgical Industry Press: Beijing, China, 2009; p. 508. (In Chinese) [Google Scholar]
- Lee, J.E.; Yeo, T.J.; Oh, K.H.; Yoon, J.K.; Yoon, U.S. Prediction of cracks in continuously cast steel beam blank through fully coupled analysis of fluid flow, heat transfer, and deformation behavior of a solidifying shell. Metall. Mater. Trans. A 2000, 31, 225–237. [Google Scholar] [CrossRef]
- Chen, W.; Zhang, Y.-Z.; Zhu, L.-G. Three-dimensional FEM study of fluid flow in mould for beam blank continuous casting: Influence of straight through conduit type SEN. Ironmak. Steelmak. 2012, 39, 551–559. [Google Scholar] [CrossRef]
- Seok, Y.J.; Yoon, J.K. The effect of casting conditions on the formation of longitudinal surface crack in the beam blank caster. Met. Mater. Int. 2002, 8, 543–550. [Google Scholar]
- Du, Y.P.; Yang, J.W.; Shi, R. Effect of submerged entry nozzle (SEN) parameters and shape on 3-D fluid flow in mould for beam blank continuous casting. Acta Metall. Sini. 2004, 17, 705–712. [Google Scholar]
- De Santis, M.; Cristallini, A.; Rinaldi, M.; Sgro, A. Modelling-based innovative feeding strategy for beam blanks mould casting aimed at as-cast surface quality improvement. ISIJ Int. 2014, 54, 496–503. [Google Scholar] [CrossRef]
- Minchaca, J.I.; Castillejos, A.H.; Acosta, F.A. Size and velocity characteristics of droplets generated by thin steel slab continuous casting secondary cooling air-mist nozzles. Metall. Mater. Trans. B 2011, 42, 500–515. [Google Scholar] [CrossRef]
- De Leon, M.; Castillejos, A.H. Physical and mathematical modeling of thin steel slab continuous casting secondary cooling zone air-mist impingement. Metall. Mater. Trans. B 2015, 46, 2028–2048. [Google Scholar] [CrossRef]
- Chaudhary, R.; Rietow, B.T.; Thomas, B.G. Differences between physical water models and steel continuous casters: A theoretical evaluation. In Proceedings of the Materials Science & Technology 2009 Conference and Exhibition (MST9), Pittsburgh, PA, USA, 25–29 October 2009.
- Ashrafizadeh, S.; Motaee, E.; Hoshyargar, V. Emulsification of heavy crude oil in water by natural surfactants. J. Pet. Sci. Eng. 2012, 86, 137–143. [Google Scholar] [CrossRef]
- Christov, N.C.; Ganchev, D.N.; Vassileva, N.D.; Denkov, N.D.; Danov, K.D.; Kralchevsky, P.A. Capillary mechanisms in membrane emulsification: Oil-in-water emulsions stabilized by tween 20 and milk proteins. Colloid Surf. A 2002, 209, 83–104. [Google Scholar] [CrossRef]
- Xie, H.; Yapa, P.D.; Nakata, K. Modeling emulsification after an oil spill in the sea. J. Mar. Syst. 2007, 68, 489–506. [Google Scholar] [CrossRef]
- Chen, J.; Tao, S.; Sun, T. Research of air entrainment quantity of steel flow. Chem. Metall. 1985, 4, 132–138. (In Chinese) [Google Scholar]
- Zhang, L.; Chen, D.; Liu, Q.; Zhang, M.; Xie, X.; Luo, D. Optimizing of flow control devices in a single strand continuous casting tundish. Adv. Mater. Res. 2011, 284, 1209–1215. [Google Scholar] [CrossRef]
- Launder, B.E.; Spalding, D.B. Lectures in Mathematical Models of Turbulence; Academic Press: Cambridge, MA, USA, 1972. [Google Scholar]
- Ha, M.Y.; Lee, H.G.; Seong, S.H. Numerical simulation of three-dimensional flow, heat transfer, and solidification of steel in continuous casting mold with electromagnetic brake. J. Mater. Process. Technol. 2003, 133, 322–339. [Google Scholar] [CrossRef]
- Lai, K.; Salcudean, M.; Tanaka, S.; Guthrie, R. Mathematical modeling of flows in large tundish systems in steelmaking. Metall. Trans. B 1986, 17, 449–459. [Google Scholar] [CrossRef]
- Shamsi, M.; Ajmani, S. Analysis of mould, spray and radiation zones of continuous billet caster by three-dimensional mathematical model based on a turbulent fluid flow. Steel Res. Int. 2010, 81, 132–141. [Google Scholar] [CrossRef]
- Laux, H.; Johansen, S.T. A CFD analysis of the air entrainment rate due to a plunging steel jet combining mathematical models for dispersed and separated multiphase flows. In Proceedings of the Symposium on Fluid Flow Phenomena in Metals Processing at TMS Annual Meeting, San Diego, CA, USA, 28 February–4 March 1999.
- Zenit, R.; Magnaudet, J. Path instability of rising spheroidal air bubbles: A shape-controlled process. Phys. Fluids 2008, 20, 061702. [Google Scholar] [CrossRef]
- Veldhuis, C.; Biesheuvel, A.; van Wijngaarden, L. Shape oscillations on bubbles rising in clean and in tap water. Phys. Fluids 2008, 20, 040705. [Google Scholar] [CrossRef]
- Tomiyama, A.; Celata, G.P.; Hosokawa, S.; Yoshida, S. Terminal velocity of single bubbles in surface tension force dominant regime. Int. J. Multiph. Flow 2002, 28, 1497–1519. [Google Scholar] [CrossRef]
- Szekely, J. Fluid Flow Phenomena in Metals Processing; Academic Press, Inc.: New York, NY, USA, 1979. [Google Scholar]
- Hahn, I.; Neuschutz, D. Ejection of steel and slag droplets from gas stirred steel melts. Ironmak. Steelmak. 2002, 29, 219–223. [Google Scholar] [CrossRef]
- Liu, L.; Yan, H.J.; Zhao, G.J. Experimental studies on the shape and motion of air bubbles in viscous liquids. Exp. Therm. Fluid Sci. 2015, 62, 109–121. [Google Scholar] [CrossRef]
- Zhang, L.F.; Yang, S.B.; Cai, K.K.; Li, J.Y.; Wan, X.G.; Thomas, B.G. Investigation of fluid flow and steel cleanliness in the continuous casting strand. Metall. Mater. Trans. B 2007, 38, 63–83. [Google Scholar] [CrossRef]
- Sambasivam, R. Clogging resistant submerged entry nozzle design through mathematical modelling. Ironmak. Steelmak. 2006, 33, 439–453. [Google Scholar] [CrossRef]


| Group | Formula | Nomenclature | Meaning |
|---|---|---|---|
| Reynolds number | L characteristic length μ fluid viscosity σ surface tension u fluid velocity ρ fluid density | Inertial force/viscous force | |
| Froude number | Inertial force/gravitational force | ||
| Weber number | Inertial force/surface tension force |
| Items/Unit | Prototype | Water Model |
|---|---|---|
| Density/kg·m−3 | 7038 | 998.2 |
| Viscosity/m2·s−1 | 8.7 × 10⁻⁷ | 10.1 × 10⁻⁷ |
| Flow rate/m3·h−1 | 5.894 | 6.190 |
| Items/Unit | Values | Items/Unit | Values |
|---|---|---|---|
| Density of steel/kg·m−3 | 7080 | Steel/air Interfacial tension/N·m−1 | 1.8 |
| Density of slag/kg·m−3 | 2800 | Steel/slag Interfacial tension/N·m−1 | 1.2 |
| Density of air/kg·m−3 | 1.225 | Slag/air Interfacial tension/N·m−1 | 0.2 |
| Viscosity of steel/Pa·s | 0.0062 | Casting speed/m·min−1 | 1.3 |
| Viscosity of slag/Pa·s | 0.2 | Layer slag thickness/mm | 25 |
| Viscosity of air/Pa·s | 0.000001 | Funnel immersion depth/mm | 70, 90, 110 |
© 2016 by the authors; licensee MDPI, Basel, Switzerland. This article is an open access article distributed under the terms and conditions of the Creative Commons Attribution (CC-BY) license (http://creativecommons.org/licenses/by/4.0/).
Share and Cite
Zhang, L.; Chen, D.; Long, M.; Chen, H.; Huang, Y.; Dong, Z. Study on the Fluid Flow in a Semi-Open-Stream-Poured Beam Blank Continuous Casting Mold with Submerged Refractory Funnels by Multiphase Modeling. Metals 2016, 6, 104. https://doi.org/10.3390/met6050104
Zhang L, Chen D, Long M, Chen H, Huang Y, Dong Z. Study on the Fluid Flow in a Semi-Open-Stream-Poured Beam Blank Continuous Casting Mold with Submerged Refractory Funnels by Multiphase Modeling. Metals. 2016; 6(5):104. https://doi.org/10.3390/met6050104
Chicago/Turabian StyleZhang, Leilei, Dengfu Chen, Mujun Long, Huabiao Chen, Yunwei Huang, and Zhihua Dong. 2016. "Study on the Fluid Flow in a Semi-Open-Stream-Poured Beam Blank Continuous Casting Mold with Submerged Refractory Funnels by Multiphase Modeling" Metals 6, no. 5: 104. https://doi.org/10.3390/met6050104